Embed Size (px)
Citation preview

cH2AX Responses in Human Buccal Cells
Exposed to Ionizing Radiation
Mohammad Sabbir Siddiqui,1,2 Maxime Francois,1 Michael F. Fenech,1 Wayne R. Leifert1*
� AbstractDNA double strand breaks are induced by ionizing radiation (IR), leading to the phos-phorylation of the core histone protein H2AX (termed cH2AX). The understanding ofthe cH2AX responses in irradiated human buccal cells is still very limited. We used vis-ual scoring and laser scanning cytometry (LSC) methods to investigate cH2AX signal-ing following exposure of human buccal cells (from six individuals) to ionizingradiation at 0–4 Gy. The frequency of nuclei containing 15–30 cH2AX foci was signifi-cantly elevated 30 min post-IR exposure (by visual scoring). Concomitantly, there wasa significant decrease in the frequency of cells without foci following exposure to IR.IR-induced cH2AX signal as determined by laser scanning cytometry (which includedcH2AX integral and MaxPixel value) increased significantly in all individual’s 2N nuclei30 min post-IR and was similar for all three nuclear shapes identified. Individuals withthe lowest baseline cH2AX integral (i.e., in nonirradiated cells) showed the greatest foldstimulation of cH2AX and significant dose-responses to IR doses of 1, 2, and 4 Gy. In 5out of 6 individuals, the frequency of visually scored cH2AX in nuclei showed a strongcorrelation (up to r 5 0.999) with LSC scored cH2AX integrals. The cH2AX responseand subsequent decline varied between individuals but remained elevated above base-line levels 24 h post IR exposure. cH2AX response in irradiated human buccal cells haspotential to be used as an index of baseline DNA damage in population studies. Thevariable response to IR exposure between individuals should be taken into considera-tion when using the cH2AX assay for radiation biodosimetry. VC 2014 International Society
for Advancement of Cytometry
� Key termscH2AX; buccal cells; ionizing radiation
INTRODUCTION
DNA Double strand breaks (DSBs) are one of the most biologically significant
DNA damage lesions that leads to chromosome breakage and/or rearrangement,
mutagenesis, and loss or gain of genetic information (1,2). DSBs are directly gener-
ated by exogenous agents such as ionizing radiation (IR) (3,4), antitumor drugs
(bleomycin, mitoxantrone, etoposide) (5,6) or by endogenously generated reactive
oxygen species (7). Mammalian cells respond to DSBs by activating a multitude of
proteins involved in signaling and DNA repair pathways. Although the majority of
lesions are efficiently repaired, the very nature of DSBs poses such a threat to cell sur-
vival that DNA damage checkpoint proteins may be activated to initiate cellular divi-
sion arrest. This provides time for DNA repair to proceed before mitosis is
completed or in the case of overwhelming damage, apoptosis ensues (8). Therefore,
DSBs in chromosomal DNA may lead to reduced integrity of the genome but also
impaired health and survival of mammalian cells (1,2).
The histone proteins are intricate components of the nucleosome complex and
are essential for genome integrity in terms of normal regulation of gene expression,
genome maintenance, and replication (9–11). Induction of DNA DSBs in live mam-
1CSIRO Food & Nutrition Flagship,Nutrigenomics & DNA Damage, Ade-laide, South Australia, 5000, Australia
2University of Adelaide, School of Agricul-ture, Food & Wine, Urrbrae,South Australia, 5064, Australia
Received 30 July 2014; Revised 15October 2014; Accepted 27 November2014
Grant sponsor: Australian PostgraduateAward (APA)
Correspondence to: Dr Wayne R. Leifert,CSIRO Food & Nutrition Flagship, Ade-laide, South Australia, 5000, Australia.E-mail: [email protected]
Published online 00 Month 2014 in WileyOnline Library (wileyonlinelibrary.com)
DOI: 10.1002/cyto.a.22607
VC 2014 International Society forAdvancement of Cytometry
Cytometry Part A � 00A: 00�00, 2014
Original Article

malian cells triggers the phosphorylation of Ser139 in the SQ
motif near the C-terminal of H2AX, which results in the phos-
phorylated form of H2AX, termed cH2AX (12,13). The phos-
phorylation of H2AX histone proteins which are located in
the vicinity of the DSBs (14,15) is known as one of the earliest
responses to DNA DSBs in cells. Therefore, cH2AX quantifi-
cation may prove to be a sensitive biomarker of DNA DSBs in
human cells.
Studies of the kinetics of phosphorylation and dephos-
phorylation of H2AX after exposure of cells to IR have shown
induction of maximal amounts of cH2AX in cells in a few
minutes after exposure to IR (14,16–18). Subsequently, the
cH2AX signals decline over a period of hours. However,
radiation-induced cH2AX signals have been observed to per-
sist after 70 days post IR exposure to skin cells (19). Our pre-
vious study using Queensland fruit fly (Bactrocera tryoni)
demonstrated that IR exposure leads to persistent cH2AvB sig-
nals (a variant of cH2AX) that could be measured during the
adult stage of the life cycle when the IR exposure was con-
ducted at the pupal stage (20). Therefore, it is plausible that
persistent cH2AX may represent prior DNA damage due to
misrepaired DSBs, unrepaired DSBs in specific sequences such
as telomeric DNA, S-phase cells or apoptotic cells (21).
Human buccal mucosa has considerable potential as an
easily accessible source of cells to determine endogenous- or
exogenous-induced DNA damage (22,23) and has been used
successfully to measure IR-induced cH2AX signals (24,25). In
one recent study, a sub-population of 50–100 buccal cells were
scored from microscope images by semi-automation for the
presence of cH2AX foci (24). Another study measured the
absorbance of diffuse cH2AX staining in nuclei from individ-
uals exposed to a low dose of ionizing radiation by examining
only 25–30 cells from each individual (25). However, our pre-
vious studies have demonstrated that there are multiple sub-
populations of buccal cell types present (26–28) and therefore
in both of those earlier studies (24,25), it was likely that insuf-
ficient cells were scored to give an accurate representation of
the entire sample population’s cH2AX response. Moreover,
different nuclear shapes have been used as criteria to identify
nuclear abnormalities in buccal cells (29). The aim of this
study was to determine whether LSC could be used to mea-
sure multiple parameters (area, integral, MaxPixel) of cH2AX
signals as well as the ploidy and nuclear shapes in thousands
of cells. Use of the proposed LSC cH2AX method can over-
come limitations of visual scoring methods by increasing scor-
ing speed, increasing cell number measured, eliminating
variation due to differences between scorers and scorer
fatigue, and enabling the possibility of higher statistical power
and high content analysis of multiple nuclear parameters.
MATERIALS AND METHODS
Chemicals and Reagents
Roswell Park Memorial Institute (RPMI)21640, Fetal
Bovine Serum (FBS), sodium pyruvate, L-glutamine/penicil-
lin/streptomycin mix and all other chemicals were purchased
from Sigma-Aldrich (Castle Hill, NSW, Australia) unless oth-
erwise stated. Mouse monoclonal antibody anti-cH2AX
(clone JBW301) was obtained from Millipore (Kilsyth, VIC,
Australia). Dulbecco’s Phosphate Buffered Saline (DPBS) and
secondary antibody Alexa Fluor 488 Goat anti-mouse were
purchased from Life Technologies (Mulgrave, VIC, Australia).
Participants
Buccal cells were collected from six healthy individuals
(three females and three males) aged from 25 to 44 years. Par-
ticipants were healthy nonsmokers, not taking vitamin supple-
ments and were informed of the purpose of the study.
Approval for this study was obtained from the CSIRO Human
Research Ethics Committee.
Buccal Cell Collection
Prior to buccal cell collection, each participant was first
required to rinse their mouth twice with water. Small flat
headed toothbrushes were rotated 20 times against the inner
part of the cheeks in a circular motion. Both cheeks were
sampled using separate toothbrushes. Heads of the brushes
were transferred into 20 ml conical screw cap tubes (one tube
per participant) each containing 15 ml of fresh prewarmed
complete medium (RPMI with 10% FBS, 2 mM L-Glutamine,
1 mM sodium pyruvate, 100 U penicillin and 100 mg/ml strep-
tomycin) and vigorously agitated to dislodge the cells. Cells
were centrifuged at 1000g for 10 min before discarding and
replacing supernatant with fresh DPBS. This washing proce-
dure was carried out twice. The cells were then resuspended in
10 ml of fresh prewarmed (37�C) complete medium. Cell con-
centration was assessed using a haemocytometer and diluted
with complete medium to reach a final concentration of
50,000 cells/ml. The cell suspension was then divided into
four 10-ml aliquots in 20-ml conical screw cap tubes.
Buccal Cell Irradiation
Cell aliquots were exposed to 0, 1, 2, or 4 Gy ionizing
radiation (IR) using a 137Cs-c IBL 437 irradiator 5 Gy/min at
25�C (Shering CIS bio international) and immediately incu-
bated for 30 min at 37�C in complete medium using a porta-
ble tissue incubator. For kinetics experiments, post-irradiated
cells (4 Gy) and nonirradiated cells (0 Gy) were incubated at
37�C in complete medium for 30 min, 3 h, or 24 h. Following
incubation, cells were centrifuged at 1,000g for 10 min and
supernatant was discarded. Cells were then resuspended in
10 ml of 4% formaldehyde in DPBS for 15 min at room tem-
perature. Following fixation cells were centrifuged at 1,000g
for 10 min and supernatant was removed before washing cells
in 10 ml of buccal cell buffer (10 mM Tris, 0.1 M ethylenedia-
minetetraacetic, 20 mM NaCl, pH 7.0). The washing proce-
dure was carried out twice, and cells were then
cytocentrifuged for 5 min at 600 rpm onto microscopic slides
to a final number of 5,000 cells per cytospot using a Shandon
CytospinVR 4 (Thermo Scientific, USA). Slides were washed
once with distilled water and air-dried for 15 min at room
temperature.
Staining of Buccal Cells
A circle was drawn around each cytospot using a hydro-
phobic PAP pen (Dako, Australia) and air-dried for 10 min.
Original Article
2 cH2AX Response to Ionizing Radiation in Buccal Cells
Slides were rinsed in DBPS for 15 min, incubated in chilled
70% ethanol for 20 min and washed in DPBS for 15 min. Buc-
cal cell cytospots were then treated with 150 ll of prewarmed
(37�C) pepsin solution (containing 750 U/ml of porcine gas-
tric mucosa pepsin) in 0.01 M HCl and then covered with par-
afilm for 30 min at 37�C in a humidified box. The slides were
then washed twice with DPBS for 5 min. Buccal cells were
then permeabilized with 1% Triton X-100 for 15 min at room
temperature and subsequently quenched of any trace of form-
aldehyde by dipping slides into 0.1 M glycine in DPBS twice
for 2 min. Slides were then rinsed three times in DPBS and a
blocking step was performed by incubating cells in 10% goat
serum for 1 h at room temperature before being washed once
with DPBS. The anti-cH2AX antibody was added to each
cytospot at a dilution of 1:100 in DPBS containing 10% goat
serum and covered with parafilm overnight at 4�C in a
humidified box. Slides were washed three times in DPBS for 5
min and a secondary antibody Alexa Fluor 488 Goat anti-
mouse was added to each cytospot at a dilution of 1:500 in
DPBS containing 10% FBS and covered with parafilm for 1 h
at room temperature. Slides were washed three times in DPBS
for 5 min and nuclei were counterstained with 4,6-diamidino-
2-phenylindole (DAPI) at a concentration of 1 mg/ml for 10
min at room temperature. The excess DAPI was removed by
rinsing the slides with a solution containing 300 mM NaCl
and 34 mM sodium citrate. Slides were then mounted with
coverslips and DPBS:glycerol (1:1) medium. The edges of cov-
erslips were sealed with nail polish to prevent drying prior to
performing LSC and visual scoring.
Visual Scoring of cH2AX Foci
Visual scoring of cH2AX foci was performed immediately
after the staining procedure was applied using a fluorescence
microscope (ZEISS Metasystems, Althusheim, Germany)
under a 63x oil objective. DAPI (nuclei) and Alexa Fluor 488
(cH2AX) fluorescence was viewed using a blue and green filter,
respectively. A minimum of 375 cells per cytospot were scored
for cH2AX foci. Since we observed three distinct shapes of
nuclei (which may represent different stages of postmitotic dif-
ferentiation), they were classified into three groups based upon
their morphological features i.e., round nuclei, long nuclei,
and oval nuclei. cH2AX appeared as discrete foci or as diffuse
staining within nuclei (see Fig. 1), therefore we categorized
cH2AX scores for each nucleus as follows; no foci, 1–14 foci
per nucleus, 15–30 foci per nucleus and diffuse foci (either
>30 foci or diffuse nuclear staining of cH2AX i.e., wide-spread
and uniform presence of cH2AX signal within the nucleus).
Laser Scanning Cytometry Measurements of cH2AX
Laser scanning cytometry (LSC) measurements were car-
ried out with an iCyteVR Automated Imaging Cytometer
(Thorlabs, Sterling Virginia, USA) with full autofocus func-
tion as well as 405 nm and 488 nm lasers for excitation of
DAPI and Alexa Fluor 488, respectively. Fluorescence from
DAPI (blue) and Alexa Fluor 488 (green) was collected with a
photomultiplier tube. Samples were scanned in separate
passes (consecutively) to prevent spectral overlap. The nuclei
and cH2AX events were contoured using empirically deter-
mined thresholds to exclude the scoring of false positives (e.g.,
small fluorescent debris). The frequency (%) of nuclei con-
taining cH2AX signal was recorded as well as multiple param-
eters within each nucleus; including the total cH2AX integral
(a function of cH2AX intensity and size) and the MaxPixel
value (the value of the most intense cH2AX signal/pixel within
nuclei). These parameters were generated using the iCyteVR 3.4
software and subsequently transferred into excel for further
statistical analyses. Nuclei were also classified into round,
long, or oval shapes (Fig. 2) by utilizing the iCyte software
parameters which included area, circularity, perimeter and
diameter as described in detail of figure legend (Fig. 2). Addi-
tionally, all nuclei were separated according to their ploidy
status (DNA content) as follows; <2N, 2N, and >2N, where
2N was defined as the mean integral signal of the population
of nuclei 6 1 standard deviation. For 2N nuclei, the peak of
the nuclei count coincided with the mean DAPI integral.
Statistical Analyses
GraphPad Prism 6.01 (GraphPad Prism, San Diego, CA)
was used to analyse data. For visual scoring comparison of the
frequency of DNA damaged cells at IR doses 1, 2, and 4 Gy
were compared with control (0 Gy) using one-way ANOVA
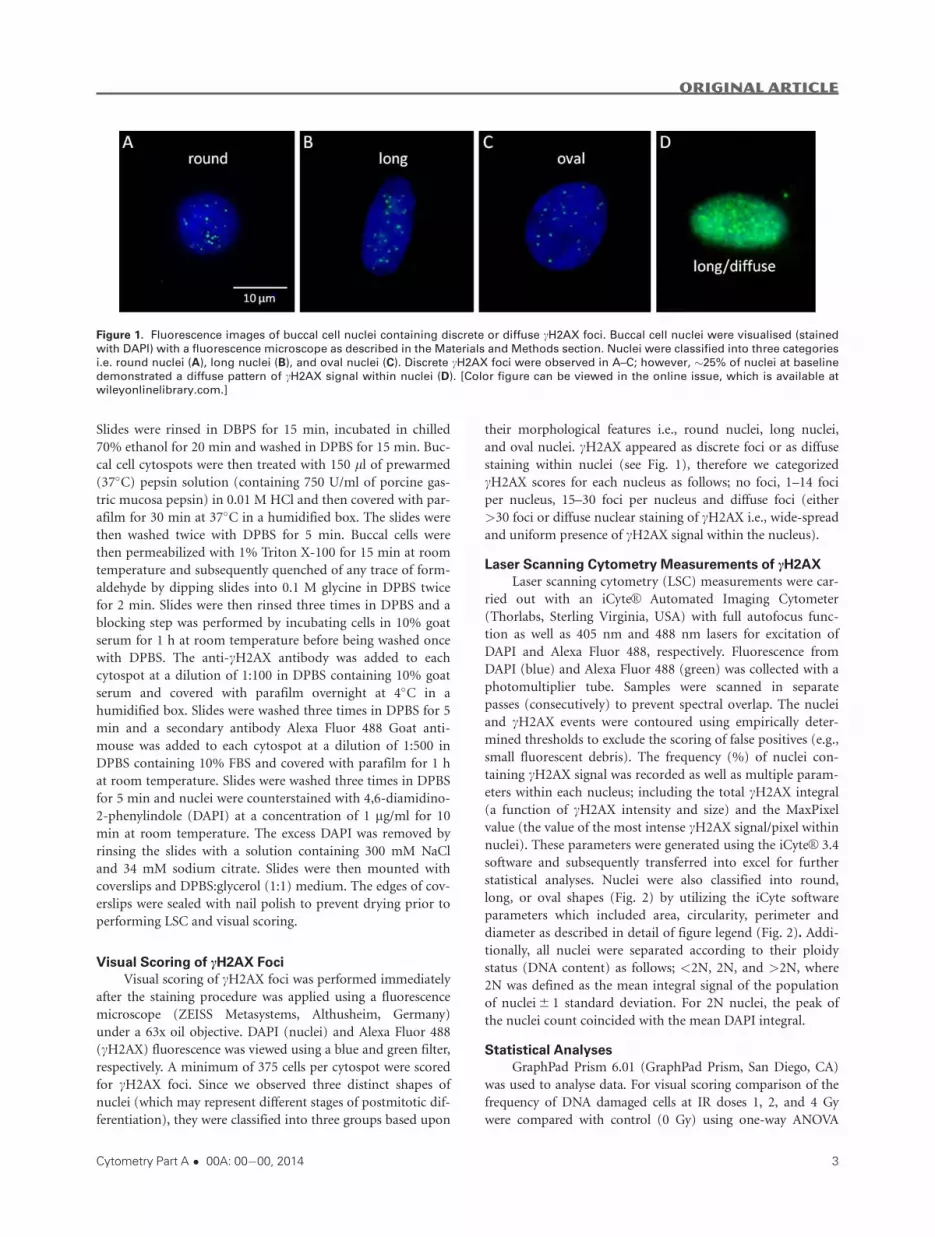
Figure 1. Fluorescence images of buccal cell nuclei containing discrete or diffuse cH2AX foci. Buccal cell nuclei were visualised (stained
with DAPI) with a fluorescence microscope as described in the Materials and Methods section. Nuclei were classified into three categories
i.e. round nuclei (A), long nuclei (B), and oval nuclei (C). Discrete cH2AX foci were observed in A–C; however, �25% of nuclei at baseline
demonstrated a diffuse pattern of cH2AX signal within nuclei (D). [Color figure can be viewed in the online issue, which is available at
wileyonlinelibrary.com.]
Original Article
Cytometry Part A � 00A: 00�00, 2014 3

followed by Dunnett’s multiple comparison test. For LSC analy-
ses, yH2AX data were checked for normality using D’Agostino
and Pearson omnibus normality test. Comparison of the fre-
quency of DNA damaged cells at IR doses 1, 2, and 4 Gy were
compared with control (0 Gy) using the Kruskal-Wallis test fol-
lowed by the Dunn’s multiple comparisons test. Correlation
coefficients were obtained using the Pearson correlation coeffi-
cient (r). Data were expressed as mean 6 standard error of the
mean (SE). P< 0.05 was considered statistically significant.
RESULTS
Visual Scoring of cH2AX in Buccal Cells
Representative images of nuclei are shown in Figure 1.
Nuclei were classified into three groups based upon the nuclear
shape; either round, long or oval as shown in Figures 1A–1C,
respectively. cH2AX foci were observed in buccal cell nuclei as
shown in Figures 1A–1D, even at baseline i.e., 0 Gy. The fre-
quency (%) of buccal cell nuclei in six individuals that had no
cH2AX foci at baseline (0 Gy) was 11.70 6 3.52%,
13.60 6 3.92%, and 10.89 6 2.80% for round, long, and oval
nuclei, respectively (totaling 36% of all nuclei) as shown in
Table 1. Following exposure to IR the frequency of nuclei (all
three types) containing no foci significantly decreased with
increasing dose of IR exposure (Table 1). This suggested that IR
exposure caused an increase in the levels of cH2AX in the buc-
cal cell nuclei. On further examination, the frequency of long
nuclei containing 15–30 cH2AX foci was significantly increased
following IR exposure to 1 Gy (P< 0.05), 2 Gy (P< 0.001), and
4 Gy (P< 0.0001) as shown in Table 1. Additionally, there was
a significant increase in the frequency of round nuclei contain-
ing 15–30 cH2AX foci at 2 Gy (P< 0.05) and 4 Gy (P< 0.01).
Figure 2. Identification of buccal cell nuclear shapes; round, long, and oval, by laser scanning cytometry. The events from different scat-
tergram regions were relocated and imaged (using an imaging gallery) to empirically identify the three different nuclear shapes present.
A: Individual nuclei were automatically contoured (red contour lines) as described in methods based on a thresholding procedure.
cH2AX signal (green contour lines) was detected and quantified (integral or MaxPixel) within the nuclei following exposure to 0–4 Gy. B:
Nuclei having area values that ranged from 0 to 600 mm and blue integral values that ranged from 0 to 4 3 107 (arbitrary units) in Region
1 (R1) were analyzed in (C) by plotting their circularity (y-axis) versus nuclear area (x-axis) where “Round” nuclei were identified in
Region 2 (R2). D: Nuclei from Region 3 (R3) were further analyzed by plotting their perimeter/diameter ratio (y-axis) versus nuclear area
(x-axis). Two new groups were established from R3; long nuclei were identified in R4 and oval nuclei in R5. Representative galleries of
nuclear shape are shown for (E) round, (F) long, and (G) oval nuclei. [Color figure can be viewed in the online issue, which is available at
wileyonlinelibrary.com.]
Original Article
4 cH2AX Response to Ionizing Radiation in Buccal Cells

The frequency of oval nuclei containing no foci
(10.89 6 2.80%) significantly decreased to 4.04 6 0.92%,
2.22 6 0.54%, and 1.69 6 0.59% for 1 Gy (P< 0.05), 2 Gy
(P< 0.01), and 4 Gy (P< 0.01), respectively, i.e., there were
dose-related increases in the frequency of nuclei with 15–30
cH2AX foci across all nuclear types. However, there was no
statistically significant increase in the frequency of oval nuclei
containing 1–14 cH2AX foci, 15–30 cH2AX foci or diffuse
cH2AX. In fact, regardless of nuclear type, there was no signifi-
cant change in the frequency of nuclei containing diffuse
cH2AX or 1–14 cH2AX foci following IR exposure (Table 1).
Scoring of cH2AX in Buccal Cells by LSC
Figure 3 shows a representative example of the data
obtained from a single individual’s preliminary LSC assay
(from “individual B”). To demonstrate the distribution of
DNA content in the buccal cells, nuclei count versus DAPI
integral (equivalent to DNA content) was plotted as shown in
Figure 2A, whereby 2,634 nuclei were examined. Nuclei were
then classified as <2N, 2N, or >2N prior to further analyses.
Figure 2B shows the DAPI integral was correlated with nuclear
area for the same 2,634 nuclei as in Figure 2A. Figures 2C and
2D shows the cH2AX integral of individual B when plotted
against DNA content (DAPI integral) for 0 Gy (mean 5 0.131
3 106 a.u., n 5 2,634 nuclei) and 4 Gy (mean 5 3.25 3 106
a.u., n 5 1,060 nuclei), respectively.
2N Nuclei
Table 2 summarizes cH2AX integral measurements in
buccal cells exposed to 0, 1, 2, or 4 Gy for six individuals. All
six individuals demonstrated a significant increase in cH2AX
integral in buccal nuclei following exposure to IR as low as 1
Gy. The variation of baseline (0 Gy) cH2AX signals were vari-
able between individuals. For example, two individuals (B and
E) had cH2AX signals that were less than 1 3 106 a.u. at 0 Gy,
whereas the remaining 4 individuals had values that ranged
from 1.209 to 6.067 3 106 a.u. There was also considerable
variation in the response of buccal cells to radiation exposure;
indeed, the individuals with the lowest baseline cH2AX values
(B and E) also showed the greatest fold increase in IR-induced
cH2AX signal. For example, the cH2AX integral in individual
B significantly increased from 0.132 3 106 a.u. at 0 Gy to
1.009 3 106 a.u. (P< 0.0001) at 1 Gy, 1.954 3 106 a.u.
(P< 0.0001) at 2 Gy and 2.673 3 106 a.u. at 4 Gy
(P< 0.0001), representing up to a 20-fold increase of cH2AX
signal in 2N nuclei. Conversely, the individuals with the high-
est cH2AX integral at baseline (0 Gy) showed the least IR-
induced cH2AX signal response, although the responses were
statistically significant. Each individual had a significantly
increased cH2AX integral following IR exposure; however,
when the 4 IR doses were averaged (n 5 6 per IR dose), there
was no significant difference between IR exposure doses com-
pared with 0 Gy, which was likely due to the large amount of
inter-individual variation, particularly at baseline (0 Gy).
Consistent with the increase in cH2AX integral post-IR
as discussed above, both the cH2AX area (data not shown)
and cH2AX MaxPixel values also increased significantly with
IR dose (Table 3). Additionally, both parameters (cH2AX area
and MaxPixel) correlated well with the cH2AX integral values
(cH2AX integral and cH2AX area correlation coefficients were
R2 5 0.979 and R2 5 0.960 for cH2AX area and cH2AX
Table 1. Visually scored cH2AX in buccal cells
NUCLEUS SHAPE cH2AX FOCI RADIATION DOSE
Round 0 Gy 1 Gy 2 Gy 4 Gy
0 foci 11.70 6 3.52 4.13 6 0.90A 1.82 6 0.39B 1.20 6 0.23B
1214 foci 3.20 6 0.86 2.40 6 0.91 1.69 6 0.38 1.24 6 0.64
15230 foci 10.20 6 2.33 12.40 6 2.54 17.87 6 1.57A 20.00 6 1.74B
>30 diffuse foci 9.09 6 1.52 10.71 6 1.75 8.18 6 1.70 7.78 6 1.61
Long 0 Gy 1 Gy 2 Gy 4 Gy
0 foci 13.60 6 3.92 6.76 6 1.97 2.49 6 0.89B 0.71 6 0.21B
1214 foci 1.92 6 0.48 2.67 6 0.93 1.82 6 0.45 0.93 6 0.33
15230 foci 9.14 6 2.94 19.02 6 1.40A 24.62 6 1.36C 28.27 6 2.64D
>30 diffuse foci 8.93 6 1.47 11.96 6 1.67 12.40 6 2.67 9.20 6 3.07
Oval 0 Gy 1 Gy 2 Gy 4 Gy
0 foci 10.89 6 2.80 4.04 6 0.92A 2.22 6 0.54B 1.69 6 0.59B
1214 foci 2.73 6 0.55 2.18 6 0.62 2.62 6 0.69 0.76 6 0.27
15230 foci 11.45 6 2.91 14.22 6 2.95 17.56 6 1.37 15.73 6 3.11
>30 diffuse foci 7.15 6 0.95 9.51 6 1.30 6.71 6 1.98 12.49 6 3.46
All nuclei types
(round 1 long 1 oval)
0 Gy 1 Gy 2 Gy 4 Gy
0 foci 36.17 6 9.94 14.93 6 2.80A 6.53 6 0.90B 3.6 6 0.60C
1214 foci 7.85 6 1.66 7.23 6 1.97 6.13 6 1.39 2.93 6 0.98
15230 foci 30.80 6 7.72 45.63 6 2.81 60.03 6 2.55B 64.00 6 6.45C
>30 diffuse foci 25.18 6 2.84 32.18 6 1.97 27.28 6 1.99 29.46 6 7.54
Frequency (%) of the different nuclear types classified (round, long, and oval nuclei) containing cH2AX signals (n 5 6 individuals, 375
cells scored for each individual) at 0, 1, 2, and 4 Gy in the 6 individuals A2E is shown. Data are presented as Mean 6 SE. AP< 0.05,BP< 0.01, CP< 0.001, DP< 0.0001.
Original Article
Cytometry Part A � 00A: 00�00, 2014 5

MaxPixel, respectively) in buccal cell nuclei exposed to 0, 1, 2,
and 4 Gy in all individuals (n 5 6) (Fig. 4).
<2N Nuclei and >2N Nuclei
Tables 2 and 3 summarize cH2AX integral and Max-
Pixel, respectively for <2N and >2N nuclei from six indi-
viduals. For <2N nuclei, 3 out of 6 individuals showed a
significant increase in cH2AX integral (Table 2) whereas for
>2N nuclei 4 out of 6 individuals had significantly
increased cH2AX integral values at 4 Gy compared with 0
Gy. As expected, both the cH2AX area (not shown) and
cH2AX MaxPixel (Table 3) values also increased signifi-
cantly with IR dose.
Inter- and Intra-Individual Variation
The variation between the six individuals examined for
2N nuclei ranged from 2.326 to 8.942 3 106 a.u. at 4 Gy
(Table 2). When a single individual’s cH2AX integral (2N)
was measured on six separate occasions (individual B), the 4
Gy cH2AX integral ranged from 2.67 to 4.74 3 106 a.u. with a
coefficient of variation of 20.5%.
Nuclear Shape
In an attempt to score nuclear shape by LSC (as was
done for visual scoring of buccal cell nuclei), we categorized
nuclei as either round, long, or oval by using several iterative
processes in iCyte as shown in Figure 2. By using some of the
features available within the iCyte software (area, perimeter,
diameter, and circularity) we empirically classified the buccal
cell nuclei shapes and quantified the cH2AX MaxPixel values
as shown in (Table 4). For each individual, the dose-response
data for each nuclear shape are shown at 0–4 Gy. For round
nuclei, all six individuals showed a significant IR-induced
increase in cH2AX MaxPixel values. For long nuclei, three out
of six individuals showed a significant increase, while for oval
nuclei, four out of six individuals showed significant increases
in MaxPixel values at 4 Gy compared with 0 Gy.
Correlation of Visually Scored cH2AX and cH2AX
Integral by LSC
The frequency of visually scored long nuclei (containing
15–30 foci) was strongly correlated with LSC scored cH2AX
Figure 3. DNA content and cH2AX quantification in buccal cell nuclei by laser scanning cytometry (LSC). A representative example from
individual B showing: A: buccal cell DNA content was calculated automatically from all nuclei by using the DAPI integral feature within the
iCyte software; the DNA content was determined by categorizing nuclei as <2N, 2N, and >2N. 2N was defined as the mean
integral 6 1 S.D. Sub-2N and >2N were less and greater than 1 S.D. from the mean, respectively. Numbers in parentheses represent the
percentage of nuclei. B: The correlation of DAPI integral with nuclear area. cH2AX integral in buccal cells from individual B exposed to
either 0 Gy (C) or 4 Gy (D) IR and cH2AX signal was plotted for all nuclei versus DNA content; the number of nuclei examined by LSC was
n 5 2,634 at 0 Gy and n 5 1,060 nuclei at 4 Gy.
Original Article
6 cH2AX Response to Ionizing Radiation in Buccal Cells

integrals in five out of six individuals (Fig. 5). The Pearson
correlation coefficients from individuals A–E were r 5 0.999,
0.930, 0.964, 0.608, and 0.945 while one individual (individual
F) showed no correlation. Indeed for individual F, the LSC
measured cH2AX integrals (including area and MaxPixel) sig-
nificantly increased with IR dose (see Table 2, 2N nuclei, indi-
vidual F). However, using the visual scoring criteria used here,
we were unable to demonstrate significant differences between
the frequency (%) of nuclei containing 15–30 foci at the dif-
ferent IR doses for individual F. This suggests that LSC was
more sensitive to quantifying the small changes in IR-induced
cH2AX signals in nuclei.
Kinetics of cH2AX in Buccal Cells
The time course of cH2AX was monitored at 0, 0.5, 3,
and 24 h after the exposure of buccal cells to 4 Gy IR in 3
Table 2. Summary of cH2AX integral (a.u. X106) by LSC in <2N, 2N, or >2N buccal cells exposed to 0, 1, 2, or 4 Gy
NUCLEAR PLOIDY INDIVIDUALS 0 GY 1 GY 2 GY 4 GY
<2N A 1.967 6 0.293
(n5108)
3.509 6 0.663
(n588)
3.127 6 0.518
(n5102)
4.152 6 0.491A
(n5111)
B 0.092 6 0.033
(n5353)
0.438 6 0.101D
(n570)
1.984 6 0.203D
(n5320)
2.724 6 0.540D
(n5101)
C 2.902 6 0.570
(n5102)
3.500 6 0.399
(n5187)
2.814 6 0.264
(n5366)
2.278 6 0.340
(n5122)
D 1.121 6 0.119
(n5313)
2.915 6 0.825
(n533)
2.153 6 0.237A
(n5216)
2.641 6 0.332D
(n5215)
E 1.528 6 0.873
(n 5 155)
2.090 6 0.906
(n 5 129)
2.958 6 2.327
(n 5 70)
1.057 6 0.239
(n 5 85)
F 4.388 6 0.516
(n 5 74)
5.227 6 1.065
(n 5 25)
3.657 6 0.458
(n 5 99)
6.440 6 0.715
(n 5 73)
Mean 6 SE 2.000 6 0.610 2.946 6 0.655 2.782 6 0.255 3.215 6 0.761
Individuals 0 Gy 1 Gy 2 Gy 4 Gy
2N A 6.067 6 0.298
(n 5 586)
7.484 6 0.395A
(n 5 397)
7.745 6 0.352C
(n 5 498)
8.942 6 0.455D
(n 5 388)
B 0.132 6 0.021
(n 5 1,913)
1.009 6 0.076D
(n 5 751)
1.954 6 0.078D
(n 5 2,466)
2.673 6 0.122D
(n 5 1,312)
C 3.337 6 0.191
(n 5 810)
5.469 6 0.179D
(n 5 1,626)
4.333 6 0.119D
(n 5 3,218)
4.329 6 0.229B
(n 5 777)
D 1.209 6 0.059
(n 5 1,847)
2.059 6 0.221D
(n 5 209)
2.619 6 0.114D
(n 5 1,444)
3.877 6 0.170D
(n 5 976)
E 0.511 6 0.073
(n 5 433)
0.913 6 0.105B
(n 5 473)
1.242 6 0.418A
(n 5 213)
2.326 6 0.622D
(n 5 211)
F 4.998 6 0.337
(n 5 379)
6.122 6 0.546B
(n 5 148)
5.627 6 0.323A
(n 5 433)
8.872 6 0.490D
(n 5 326)
Mean 6 SE 2.709 6 1.010 3.843 6 1.168 3.920 6 1.007 5.170 6 1.220
Individuals 0 Gy 1 Gy 2 Gy 4 Gy
>2N A 10.620 6 1.536
(n 5 58)
12.040 6 2.190
(n 5 44)
8.364 6 1.147
(n 5 73)
9.229 6 1.550
(n 5 56)
B 0.164 6 0.047
(n 5 368)
3.052 6 0.738D
(n 5 59)
3.478 6 0.270D
(n 5 441)
7.388 6 1.103D
(n 5 108)
C 5.389 6 0.834
(n 5 89)
9.216 6 1.053B
(n 5 122)
8.329 6 0.624B
(n 5 326)
7.520 6 0.952
(n 5 89)
D 1.070 6 0.229
(n 5 262)
2.019 6 0.527C
(n 5 30)
3.567 6 0.456D
(n 5 276)
3.829 6 0.451D
(n 5 177)
E 0.762 6 0.286
(n 5 61)
0.640 6 0.193
(n 5 69)
1.088 6 0.612
(n 5 33)
2.739 6 1.138A
(n 5 34)
F 4.367 6 0.804
(n 5 55)
4.349 6 0.941
(n 5 30)
8.736 6 1.957
(n 5 65)
7.250 6 0.854B
(n 5 58)
Mean 6 SE 3.729 6 1.625 5.219 6 1.818 5.594 6 1.341 6.326 6 1.015
Letters denote the P-values when comparing 1, 2, or 4 Gy IR relative to 0 Gy for each individual. Data are presented as Mean 6 SE.
Numbers in parentheses represent the total number of nuclei that were scored at each IR dose. AP< 0.05, BP< 0.01, CP< 0.001,DP< 0.0001.
Original Article
Cytometry Part A � 00A: 00�00, 2014 7

individuals (B, D, and E). These individuals were chosen for
cH2AX kinetics analyses since they had the greatest dose-
response to irradiation at 0–4 Gy. Figure 6A demonstrates that
the mean frequency (%) of nuclei containing 15–30 cH2AX
foci, when scored visually, remained elevated for a period of
up to 24 h post IR. A peak was reached at 30 min post IR
exposure (4 Gy) and subsequently declined by 40% at 24 h
post IR (4 Gy); however, this remained significantly
(P< 0.0001) higher than the baseline value. A similar result
was obtained by LSC as shown in Figure 6B. The cH2AX inte-
gral significantly increased (P< 0.05) 30 min post IR exposure
and then subsequently declined by 82% 24 h post IR, which
was not significantly different from the baseline value.
DISCUSSION
The objective of the present study was to investigate the
induction and persistence of DNA DSBs in irradiated human
Table 3. Summary of cH2AX MaxPixel (a.u.) by LSC in <2N, 2N, or >2N buccal cells exposed to 0, 1, 2, or 4 Gy
NUCLEAR PLOIDY INDIVIDUALS 0 GY 1 GY 2 GY 4 GY
<2N A 2,994 6 337
(n 5 108)
4,241 6 485
(n 5 88)
3,728 6 473
(n 5 102)
5,614 6 544B
(n 5 111)
B 332 6 100
(n 5 353)
1,820 6 283D
(n 5 70)
2,373 6 217D
(n 5 320)
2,698 6 352D
(n 5 101)
C 4,092 6 524
(n 5 102)
5,356 6 431A
(n 5 187)
4,148 6 263
(n 5 366)
4,520 6 460
(n 5 122)
D 2,289 6 203
(n 5 313)
3,436 6 782
(n 5 33)
2,768 6 241
(n 5 216)
3,820 6 323C
(n 5 215)
E 2023 6 325
(n 5 155)
1913 6 326
(n 5 129)
1897 6 470
(n 5 70)
2279 6 356
(n 5 85)
F 4,680 6 475
(n 5 74)
6,560 6 981
(n 5 25)
3,932 6 381
(n 5 99)
7,449 6 605B
(n 5 73)
Mean 6 SE 2,735 6 636 3,887 6 770 3,141 6 376 4,396 6 785
Individuals 0 Gy 1 Gy 2 Gy 4 Gy
2N A 5,874 6 206
(n 5 586)
6,552 6 247
(n 5 397)
7,381 6 250D
(n 5 498)
8,124 6 303D
(n 5 388)
B 445 6 54
(n 5 1913)
3,085 6 152D
(n 5 751)
2,593 6 79D
(n 5 2466)
3,062 6 103D
(n 5 1312)
C 3,598 6 150
(n 5 810)
5,484 6 120D
(n 5 1626)
5,185 6 87D
(n 5 3218)
5,064 6 178D
(n 5 777)
D 2,163 6 84
(n 5 1847)
3,242 6 251C
(n 5 209)
3,141 6 100D
(n 5 1444)
4,738 6 142D
(n 5 976)
E 1,092 6 132
(n 5 433)
1,498 6 126B
(n 5 473)
1,989 6 289A
(n 5 213)
3,274 6 344D
(n 5 211)
F 5,195 6 274
(n 5 379)
6,886 6 414C
(n 5 148)
5,673 6 202
(n 5 433)
8,199 6 306D
(n 5 326)
Mean 6 SE 3,121 6 909 4,457 6 884 4,327 6 851 5,410 6 927
Individuals 0 Gy 1 Gy 2 Gy 4 Gy
>2N A 9,212 6 804
(n 5 58)
8,786 6 1025
(n 5 44)
8,161 6 819
(n 5 73)
9,451 6 1,194
(n 5 56)
B 587 6 120
(n 5 368)
6,664 6 984D
(n 5 59)
4,012 6 232D
(n 5 441)
6,316 6 583D
(n 5 108)
C 6,575 6 572
(n 5 89)
10,772 6 814C
(n 5 122)
10,690 6 426D
(n 5 326)
10,658 6 1060A
(n 5 89)
D 1,793 6 244
(n 5 262)
3,632 6 609 C
(n 5 30)
3,759 6 292D
(n 5 276)
5,311 6 440D
(n 5 177)
E 1,608 6 380
(n 5 61)
1,841 6 431
(n 5 69)
2,182 6 959
(n 5 33)
5,027 6 1,410A
(n 5 34)
F 4,938 6 536
(n 5 55)
5,210 6 798
(n 5 30)
6,983 6 695
(n 5 65)
8,133 6 603C
(n 5 58)
Mean 6 SE 4,118 6 1376 6,150 6 1,346 5,964 6 1306 7,482 6 939
Letters denote the P-values when comparing 1, 2, or 4 Gy IR relative to 0 Gy for each individual. Data are presented as Mean 6 SE.
Numbers in parentheses represent the total number of nuclei that were scored at each IR dose. AP< 0.05, BP< 0.01, CP< 0.001,DP< 0.0001.
Original Article
8 cH2AX Response to Ionizing Radiation in Buccal Cells

buccal cells. We used two scoring protocols to quantify ioniz-
ing radiation-induced cH2AX, a marker of DNA DSBs. Visual
scoring of nuclei was correlated with the automated laser
scanning cytometry (LSC) method developed here to quantify
cH2AX integral (and MaxPixel) in each nucleus examined in
thousands of buccal cells for each individual. Additionally,
these LSC measurements were combined with quantitation of
nuclear DNA content to classify cells depending on their DNA
content (ploidy status) as well as nuclear shapes based on their
area, perimeter, diameter, and circularity. Our experimental
results demonstrated that buccal cells exposed to IR have the
capacity to accumulate cH2AX which partially remained up
to 24 h post IR exposure suggesting buccal cells have dimin-
ished capacity to repair DNA DSBs. We also observed a large
variation in baseline levels of cH2AX and in cH2AX response
to IR exposure.
In the visual scoring study, we aimed to classify buccal
cells into separate groups based upon their nuclear shapes.
Since the buccal mucosa is known to consist of heterogeneous
cell types that may have discrete functions within the mucosa
(22,23,27,29–33); we therefore hypothesized that our defined
categories may also exhibit differences in their response to
DNA damage induction and subsequent repair. In fact, our
results demonstrated that cH2AX could be measured in buccal
cells and that cH2AX response following IR varied between
nuclei types as has been observed in previous studies
(24,25,34). Long nuclei, for instance, showed the largest dose
response (up to 3-fold) to increasing radiation exposure (0, 1,
2, and 4 Gy) with a higher frequency of nuclei containing 15–
30 foci. In contrast, no significant difference was observed for
oval shaped nuclei, and a weaker dose response (up to 2-fold)
was found in round nuclei containing 15–30 foci. Interest-
ingly, there was no change in the frequency of cells with dif-
fuse foci following exposure to IR. It is likely that these
“diffuse” nuclei we categorized here (�25%) represent the
necrotic or nonviable cell population expressing a phenotype
of reduced response efficiency to DNA damage. This notion is
consistent with previous studies showing that a relatively high
proportion (up to 20%) of buccal cells are nonviable, necrotic,
or apoptotic at baseline (24,35,36). For a more complete
understanding of the DNA damage response biology of buccal
cells, it would therefore be valuable in future studies to com-
bine cH2AX detection with a cytoplasmic marker of cell sub-
types present (if compatible with the current immunofluores-
cence protocol). Such markers could be met, for example, by
the detection of cytokeratin proteins or other markers of epi-
thelial cells, which are expressed differentially between buccal
mucosa cell types depending on their differentiation status
(32,37–39).
LSC has previously been shown as a useful tool to mea-
sure cellular DNA content for cell cycle stage evaluation in
conjunction with cH2AX after inducing DNA damage
(40–42). It was therefore decided to include DNA content
(measured by nuclear DAPI integral) as an additional mea-
surement in our LSC protocol allowing us to classify nuclei as
<2N, 2N, or >2N. Previously, we demonstrated that �60% of
buccal cells are likely to be post-mitotic 2N nuclei (27) which
is similar to the results obtained in this study (see Fig. 3A).
Our current findings support previous observations in that
significant increases of cH2AX in buccal cell nuclei are
induced by exposure to IR (24). A significant increase in
cH2AX signal in 2N nuclei up to 4 Gy was observed in all
individuals and dose responses measured by LSC correlated
with those measured visually. For <2N nuclei only three out
of six individuals showed a significant increase in cH2AX at a
dose of 4 Gy. Alternatively, four out of six individuals showed
a significant increase in cH2AX at a dose of 4 Gy in >2N
nuclei. We believe that the buccal cell <2N and >2N popula-
tions are mainly composed of apoptotic cells, condensed chro-
matin cells or cells immobilized at a cell cycle check point due
to mitotic defects or abnormal nuclear DNA content (27,43).
The nature of the <2N and >2N population of cells may
partly explain their somewhat lower response to radiation
compared to the 2N cell population.
Although all individuals showed an increase in cH2AX
following IR exposure, when the individual data obtained for
Figure 4. Correlation of cH2AX integral with cH2AX area and cH2AX MaxPixel by LSC. A: Correlation of cH2AX foci area and cH2AX inte-
gral or (B) correlation of cH2AX MaxPixel and cH2AX integral, per nucleus scored by LSC in buccal cell nuclei exposed to 0, 1, 2, and 4 Gy
in all individuals (n 5 6). The relationship of the two parameters fitted a second order polynomial (quadratic) resulting in correlation coeffi-
cients (R2) for cH2AX foci area 5 0.979 and for cH2AX MaxPixel 5 0.960.
Original Article
Cytometry Part A � 00A: 00�00, 2014 9

the six individuals was averaged, the significant differences
between IR exposure doses compared to 0 Gy was absent in all
three populations of nuclei (i.e., <2N, 2N, and >2N). How-
ever, we believe this is due to the substantial differences
observed in the cH2AX baseline levels at 0 Gy between the
individuals in this study. Such variation in baseline cH2AX
signal in human buccal cells has been observed previously
when the cH2AX foci were scored. Indeed, values ranged from
0.08 cH2AX foci/nucleus (24) to 4.08 cH2AX foci/nucleus
(34); however, the former study excluded some buccal cell
types from their analyses, which may partly explain the differ-
ences observed between previous studies. In our study, the
LSC protocol was also utilized to extract data on cH2AX inte-
gral, MaxPixel and area measurements from within the con-
toured nuclei. Both cH2AX MaxPixel and area correlated well
with the cH2AX integral as expected, since the integral is a
Table 4. Summary of cH2AX MaxPixel (a.u.) by LSC in round-, long-, and oval-shaped nuclei of buccal cells exposed to 0, 1, 2, or 4 Gy
NUCLEAR SHAPE INDIVIDUALS 0 GY 1 GY 2 GY 4 GY
Round A 6,435 6 200
(n 5 576)
7,443 6 306A
(n 5 277)
7,619 6 256B
(n 5 429)
8,376 6 312D
(n 5 366)
B 1,319 6 54
(n 5 623)
3,450 6 143D
(n 5 494)
3,686 6 83D
(n 5 1817)
5,223 6 157D
(n 5 625)
C 4,093 6 131
(n 5 792)
5,453 6 117D
(n 5 1484)
5,409 6 82D
(n 5 3227)
5,382 6 134D
(n 5 1227)
D 2,510 6 52
(n 5 1963)
3,339 6 352
(n 5 60)
3,534 6 107D
(n 5 866)
5,315 6 136D
(n 5 1015)
E 1,912 6 88
(n 5 431)
2,193 6 105
(n 5 323)
2,170 6 140
(n 5 133)
3,115 6 184D
(n 5 227)
F 5,372 6 284
(n 5 282)
7,727 6 653B
(n 5 62)
5,876 6 220
(n 5 378)
8,878 6 305D
(n 5 322)
Mean 6 SE 3,667 6 857 4,934 6 942 4,716 6 800 6,050 6 888
Individuals 0 Gy 1 Gy 2 Gy 4 Gy
Long A 4,286 6 638
(n 5 34)
5,941 6 633
(n 5 60)
5,662 6 690
(n 5 55)
7,061 6 714A
(n 5 53)
B 1,400 6 90
(n 5 60)
2,846 6 236B
(n 5 137)
3,690 6 259D
(n 5 198)
3,169 6 281C
(n 5 148)
C 4,334 6 872
(n 5 25)
5,207 6 695
(n 5 46)
5,541 6 411
(n 5 133)
3,870 6 453
(n 5 56)
D 2,519 6 373
(n 5 55)
4,150 6 473
(n 5 57)
4,537 6 340B
(n 5 116)
4,671 6 427B
(n 5 84)
E 2,473 6 375
(n 5 44)
3,666 6 494
(n 5 44)
2,894 6 554
(n 5 30)
2,753 6 318
(n 5 34)
F 6,951 6 951
(n 5 26)
6,936 6 827
(n 5 40)
4,682 6 705
(n 5 28)
8,880 6 949
(n 5 34)
Mean 6 SE 3,672 6 803 4,7916 621 4,501 6 436 5,280 6 984
Individuals 0 Gy 1 Gy 2 Gy 4 Gy
Oval A 6,049 6 464
(n 5 124)
6,855 6 388
(n 5 167)
7,000 6 450
(n 5 155)
7,334 6 545
(n 5 106)
B 1,456 6 50
(n 5 1812)
2,698 6 175D
(n 5 210)
3,626 6 114D
(n 5 1030)
3,989 6 234D
(n 5 240)
C 5,418 6 339
(n 5 162)
6,371 6 259
(n 5 341)
6,774 6 228B
(n 5 478)
6,564 6 298A
(n 5 268)
D 2,578 6 125
(n 5 353)
4,030 6 316D
(n 5 115)
3,703 6 106D
(n 5 866)
4,656 6 293D
(n 5 220)
E 2,469 6 166
(n 5 143)
2,540 6 142
(n 5 249)
2,426 6 247
(n 5 128)
2,988 6 339
(n 5 54)
F 4,627 6 284
(n 5 178)
6,282 6 551B
(n 5 84)
5,071 6 279
(n 5 158)
7,836 6 561D
(n 5 91)
Mean 6 SE 3,310 6 673 4,384 6 762 4,320 6 678 5,206 6 803
Letters denote the P-values when comparing 1, 2, or 4 Gy IR relative to 0 Gy for each individual. Data are presented as Mean 6 SE.
Numbers in parentheses represent the total number of nuclei that were scored at each IR dose. AP< 0.05, BP< 0.01, CP< 0.001,DP< 0.0001.
Original Article
10 cH2AX Response to Ionizing Radiation in Buccal Cells

function of both cH2AX total intensity and cH2AX area. Fur-
thermore, the increase in cH2AX MaxPixel and area indicates
that the abundance of phosphorylated histone H2AX proteins
accumulated at sites of DNA breakage, and that the accumula-
tion of cH2AX was dose-dependent and readily quantifiable
by LSC. Therefore, these types of quantifiable parameters
could prove useful as alternative measures to quantify cH2AX
responses within buccal cells that may be achieved with the
use of other automated imaging platforms.
Different nuclear shape morphology has been used as
one of the criteria to distinguish nuclear abnormalities and
has been used in patients with oral squamous cell carcinoma
to assess radiosensitivity (29,44). In this study, we assessed the
cH2AX MaxPixel response to IR in different shaped buccal
Figure 5. Correlation of visually scored and LSC quantified cH2AX signals in buccal cell nuclei exposed to 0, 1, 2, or 4 Gy IR. The frequency
(%) of visually scored buccal nuclei containing 15–30 cH2AX foci are shown on the x-axis and the mean cH2AX integrals (by LSC) per 2N
nuclei are shown on the y-axis for all individuals A–E (n 5 6). Pearson correlation coefficients (r) and P-values are shown as insets within
each graph.
Original Article
Cytometry Part A � 00A: 00�00, 2014 11

cell nuclei (round, long, and oval). Although cH2AX Max-
Pixel dose-dependently increased there appeared to be no par-
ticular nuclear shape that was more responsive than the other.
Nuclear shape could be a parameter used in future studies
when comparing buccal cell nuclei at “baseline” (e.g., in stud-
ies comparing populations or disease states) as it may provide
information on long-term (chronic) DNA damage. One
advantage of LSC (compared with visual scoring) is that mul-
tiple parameters can be examined and quantified in cells (high
content) simultaneously which may provide more informa-
tion on cellular signaling. Ideally, this approach could be com-
bined with cell morphology parameters to accurately identify
the buccal cell-subtypes present.
The kinetics of cH2AX response in buccal cells were
investigated by measuring DNA damage levels up to 24 h
post-IR. LSC and visual scoring demonstrated that cH2AX
signals in nuclei peaked at 30 min after exposure to IR, which
subsequently declined over a period of 24 h. In some individ-
uals the level of cH2AX remained higher than baseline levels
24 h after exposure, suggesting persistent DNA damage
occurred. In a previous study investigating DNA DSBs in buc-
cal cells, the longest time point following IR exposure was 5 h
(24). Our study, therefore, demonstrates for the first time that
buccal cells express variable but persistent cH2AX responses
up to 24 h post-IR. The kinetics of cH2AX can be rapid, with
cH2AX declining over a period of hours (14,16–18). Persist-
ence of DNA damage has also been observed in different mod-
els. For instance, a recent study that used G€ottingen minipig
skin biopsies found that IR-induced cH2AX foci was found to
be significantly lower after 70 days post-IR exposure; however,
a significantly higher number of cH2AX foci still remained in
irradiated epidermal keratinocytes compared with controls
(19). Most recently, cH2AX formation and removal in heart,
brain, and liver tissue following X-ray exposure was tested in
adult Syrian hamsters; it was found that all tissues accumu-
lated cH2AX but heart and brain tissues contained more per-
sistent cH2AX 24 h post-IR indicating the presence of
unrepaired DNA DSBs. This result suggested that kinetics of
IR-induced H2AX phosphorylation (and cH2AX dephospho-
rylation) is tissue specific, being less efficient in heart and
brain in comparison with liver and kidney (45). Since differ-
ent tissues can have distinct cH2AX responses, it may not be
possible to extrapolate buccal cell data generated from our
study to investigations carried out on other tissues. Moreover,
the high level of cH2AX still present in cells after 24 h suggest
that buccal cells may simply not repair DNA damage as effi-
ciently as other cell types. The persistent cH2AX signal after
24 h could be explored for radiation biodosimetry purpose
following a radiation accident. However, this may be limited
by the large variation in baseline cH2AX signal in cells not
exposed to IR between individuals. Understanding the dietary,
life-style, genotoxic exposure, and genetic factors is essential
prior to considering the possibility of using cH2AX assay in
buccal cells for human biodosimetry.
Although a better understanding of the biology of
cH2AX response in buccal cells is needed, our findings sug-
gest that buccal mucosa may be a tissue of interest in moni-
toring radiation exposure in humans or monitoring levels of
DNA damage in patients undergoing radiotherapy. Such
large-scale monitoring may be made possible with the use of
LSC. Indeed, the full automation of this LSC method offers
an efficient unbiased and quantifiable measure of cH2AX
abundance in a large number of cells (thousands of cells per
individual) and should be considered as an alternative
method to visual scoring, which is labor-intensive and sub-
ject to bias. Additionally, the LSC protocol presented here
can combine accurate measurement of cH2AX signal with
nuclei ploidy status and by its design, can potentially incor-
porate the simultaneous measurement of other cellular pro-
teins/markers involved in DNA damage/repair signaling
processes.
LITERATURE CITED
1. Dugle DL, Gillespie CJ, Chapman JD. DNA strand breaks, repair, and survival in x-irradiated mammalian cells. Proc Natl Acad Sci USA 1976;73:809–812.
2. Olive PL. The role of DNA single- and double-strand breaks in cell killing by ioniz-ing radiation. Radiat Res 1998;150:S42–S51.
Figure 6. Twenty-four hour kinetics of cH2AX foci in buccal cell nuclei assessed by visual scoring method or LSC. Buccal cells were
exposed to 4 Gy IR and then subsequently incubated for 0, 0.5, 3, or 24 h prior to fixation. A: The frequency (%) of buccal cell nuclei con-
taining 15–30 cH2AX foci per nucleus was visually scored as described in methods. B: cH2AX integral in 2N nuclei was determined by LSC.
Original Article
12 cH2AX Response to Ionizing Radiation in Buccal Cells

3. Riches LC, Lynch AM, Gooderham NJ. Early events in the mammalian response toDNA double-strand breaks. Mutagenesis 2008;23:331–339.
4. Ismail IH, Wadhra TI, Hammarsten O. An optimized method for detecting gamma-H2AX in blood cells reveals a significant interindividual variation in the gamma-H2AX response among humans. Nucleic Acids Res 2007;35:e36.
5. Tanaka T, Halicka D, Traganos F, Darzynkiewicz Z. Cytometric analysis of DNAdamage: Phosphorylation of histone H2AX as a marker of DNA double-strandbreaks (DSBs). Methods Mol Biol 2009;523:161–168.
6. Turner SD, Wijnhoven SW, Tinwell H, Lashford LS, Rafferty JA, Ashby J, Vrieling H,Fairbairn LJ. Assays to predict the genotoxicity of the chromosomal mutagen etopo-side—Focussing on the best assay. Mutat Res 2001;493:139–147.
7. Pilch DR, Sedelnikova OA, Redon C, Celeste A, Nussenzweig A, Bonner WM. Char-acteristics of gamma-H2AX foci at DNA double-strand breaks sites. Biochem CellBiol 2003;81:123–129.
8. Rogakou EP, Nieves-Neira W, Boon C, Pommier Y, Bonner WM. Initiation of DNAfragmentation during apoptosis induces phosphorylation of H2AX histone at serine139. J Biol Chem 2000;275:9390–9395.
9. Goll MG, Bestor TH. Histone modification and replacement in chromatin activa-tion. Genes Dev 2002;16:1739–1742.
10. Rogakou EP, Boon C, Redon C, Bonner WM. Megabase chromatin domains involvedin DNA double-strand breaks in vivo. J Cell Biol 1999;146:905–916.
11. Mendez-Acuna L, Di Tomaso MV, Palitti F, Martinez-Lopez W. Histone post-translational modifications in DNA damage response. Cytogenet Genome Res 2010;128:28–36.
12. Redon C, Pilch D, Rogakou E, Sedelnikova O, Newrock K, Bonner W. Histone H2Avariants H2AX and H2AZ. Curr Opin Genet Dev 2002;12:162–169.
13. Kinner A, Wu W, Staudt C, Iliakis G. Gamma-H2AX in recognition and signaling ofDNA double-strand breaks in the context of chromatin. Nucleic Acids Res 2008;36:5678–5694.
14. Rogakou EP, Pilch DR, Orr AH, Ivanova VS, Bonner WM. DNA double-strandedbreaks induce histone H2AX phosphorylation on serine 139. J Biol Chem 1998;273:5858–5868.
15. Savic V, Yin B, Maas NL, Bredemeyer AL, Carpenter AC, Helmink BA, Yang-Iott KS,Sleckman BP, Bassing CH. Formation of dynamic gamma-H2AX domains along bro-ken DNA strands is distinctly regulated by ATM and MDC1 and dependent uponH2AX densities in chromatin. Mol Cell 2009;34:298–310.
16. Madigan JP, Chotkowski HL, Glaser RL. DNA double-strand break-induced phos-phorylation of Drosophila histone variant H2Av helps prevent radiation-inducedapoptosis. Nucleic Acids Res 2002;30:3698–3705.
17. Roch-Lefevre S, Mandina T, Voisin P, Gaetan G, Mesa JE, Valente M, Bonnesoeur P,Garcia O, Voisin P, Roy L. Quantification of gamma-H2AX foci in human lympho-cytes: A method for biological dosimetry after ionizing radiation exposure. RadiatRes 2010;174:185–194.
18. Olive PL, Banath JP. Phosphorylation of histone H2AX as a measure of radiosensitiv-ity. Int J Radiat Oncol Biol Phys 2004;58:331–335.
19. Ahmed EA, Agay D, Schrock G, Drouet M, Meineke V, Scherthan H. Persistent DNAdamage after high dose in vivo gamma exposure of minipig skin. PLoS One 2012;7:e39521.
20. Siddiqui MS, Filomeni E, Francois M, Collins SR, Cooper T, Glatz RV, Taylor PW,Fenech M, Leifert WR. Exposure of insect cells to ionising radiation in vivo inducespersistent phosphorylation of a H2AX homologue (H2AvB). Mutagenesis 2013;28:531–541.
21. Liu SK, Olive PL, Bristow RG. Biomarkers for DNA DSB inhibitors and radiotherapyclinical trials. Cancer Metastasis Rev 2008;27:445–458.
22. Leifert WR, Francois M, Thomas P, Luther E, Holden E, Fenech M. Automation ofthe buccal micronucleus cytome assay using laser scanning cytometry. Methods CellBiol 2011;102:321–339.
23. Darzynkiewicz Z, Smolewski P, Holden E, Luther E, Henriksen M, Francois M,Leifert W, Fenech M. Laser scanning cytometry for automation of the micronucleusassay. Mutagenesis 2011;26:153–161.
24. Gonzalez JE, Roch-Lefevre SH, Mandina T, Garcia O, Roy L. Induction of gamma-H2AX foci in human exfoliated buccal cells after in vitro exposure to ionising radia-tion. Int J Radiat Biol 2010;86:752–759.
25. Yoon AJ, Shen J, Wu HC, Angelopoulos C, Singer SR, Chen R, Santella RM. Expres-sion of activated checkpoint kinase 2 and histone 2AX in exfoliative oral cells afterexposure to ionizing radiation. Radiat Res 2009;171:771–775.
26. Thomas P, Holland N, Bolognesi C, Kirsch-Volders M, Bonassi S, Zeiger E,Knasmueller S, Fenech M. Buccal micronucleus cytome assay. Nat Protoc 2009;4:825–837.
27. Francois M, Leifert W, Hecker J, Faunt J, Martins R, Thomas P, Fenech M. Alteredcytological parameters in buccal cells from individuals with mild cognitive impair-ment and Alzheimer’s disease. Cytometry A 2014;85A:698–708.
28. Thomas P, Hecker J, Faunt J, Fenech M. Buccal micronucleus cytome biomarkersmay be associated with Alzheimer’s disease. Mutagenesis 2007;22:371–379.
29. Torres-Bugarin O, Zavala-Cerna MG, Nava A, Flores-Garcia A, Ramos-Ibarra ML.Potential uses, limitations, and basic procedures of micronuclei and nuclear abnor-malities in buccal cells. Dis Markers 2014;2014:956835.
30. Thomas P, Harvey S, Gruner T, Fenech M. The buccal cytome and micronucleus fre-quency is substantially altered in Down’s syndrome and normal ageing compared toyoung healthy controls. Mutat Res 2008;638:37–47.
31. Patten GS, Leifert WR, Burnard SL, Head RJ, McMurchie EJ. Stimulation of humancheek cell Na1/H1 antiporter activity by saliva and salivary electrolytes: Amplifica-tion by nigericin. Mol Cell Biochem 1996;154:133–141.
32. Hosoya A, Lee JM, Cho SW, Kim JY, Shinozaki N, Shibahara T, Shimono M, JungHS. Morphological evidence of basal keratinocyte migration during the re-epithelialization process. Histochem Cell Biol 2008;130:1165–1175.
33. Lavker RM, Sun TT. Heterogeneity in epidermal basal keratinocytes: morphologicaland functional correlations. Science 1982;215:1239–1241.
34. Mondal NK, Ghosh S, Ray MR. Micronucleus formation and DNA damage in buccalepithelial cells of Indian street boys addicted to gasp ’Golden glue’. Mutat Res 2011;721:178–183.
35. Schwartz JL, Muscat JE, Baker V, Larios E, Stephenson GD, Guo W, Xie T, Gu X,Chung FL. Oral cytology assessment by flow cytometry of DNA adducts, aneuploidy,proliferation and apoptosis shows differences between smokers and non-smokers.Oral Oncol 2003;39:842–854.
36. de Oliveira RM, Lia EN, Guimaraes RM, Bocca AL, Cavalcante Neto FF, da Silva TA.Cytologic and cytometric analysis of oral mucosa in Alzheimer’s disease. Anal QuantCytol Histol 2008;30:113–118.
37. Moll R, Franke WW, Schiller DL, Geiger B, Krepler R. The catalog of human cytoker-atins: patterns of expression in normal epithelia, tumors and cultured cells. Cell1982;31:11–24.
38. Vaidya MM, Borges AM, Pradhan SA, Rajpal RM, Bhisey AN. Altered keratin expres-sion in buccal mucosal squamous cell carcinoma. J Oral Pathol Med 1989;18:282–286.
39. Purkis PE, Steel JB, Mackenzie IC, Nathrath WB, Leigh IM, Lane EB. Antibodymarkers of basal cells in complex epithelia. J Cell Sci 1990;97 (Part 1):39–50.
40. Zhao H, Albino AP, Jorgensen E, Traganos F, Darzynkiewicz Z. DNA damageresponse induced by tobacco smoke in normal human bronchial epithelial and A549pulmonary adenocarcinoma cells assessed by laser scanning cytometry. Cytometry A2009;75A:840–847.
41. Tanaka T, Huang X, Halicka HD, Zhao H, Traganos F, Albino AP, Dai W,Darzynkiewicz Z. Cytometry of ATM activation and histone H2AX phosphorylationto estimate extent of DNA damage induced by exogenous agents. Cytometry A 2007;71A:648–661.
42. Huang X, Okafuji M, Traganos F, Luther E, Holden E, Darzynkiewicz Z. Assessmentof histone H2AX phosphorylation induced by DNA topoisomerase I and II inhibi-tors topotecan and mitoxantrone and by the DNA cross-linking agent cisplatin.Cytometry A 2004;58A:99–110.
43. Kirsch-Volders M, Fenech M. Inclusion of micronuclei in non-divided mononuclearlymphocytes and necrosis/apoptosis may provide a more comprehensive cytokinesisblock micronucleus assay for biomonitoring purposes. Mutagenesis 2001;16:51–58.
44. Raj V, Mahajan S. Dose response relationship of nuclear changes with fractionatedradiotherapy in assessing radiosensitivity of oral squamous cell carcinoma. J ClinExp Dent 2011;3:e193–200.
45. Firsanov D, Vasilishina A, Kropotov A, Mikhailov V. Dynamics of gammaH2AX for-mation and elimination in mammalian cells after X-irradiation. Biochimie 2012;94:2416–2422.
Original Article
Cytometry Part A � 00A: 00�00, 2014 13


