Embed Size (px)
Citation preview
The World Bank Ghana Accountability for Learning Outcomes Project (P165557)
Dec 03, 2018 Page 1 of 24
Project Information Document (PID)
Concept Stage | Date Prepared/Updated: 12-Dec-2018 | Report No: PIDISDSC24903
Pub
lic D
iscl
osur
e A
utho
rized
Pub
lic D
iscl
osur
e A
utho
rized
Pub
lic D
iscl
osur
e A
utho
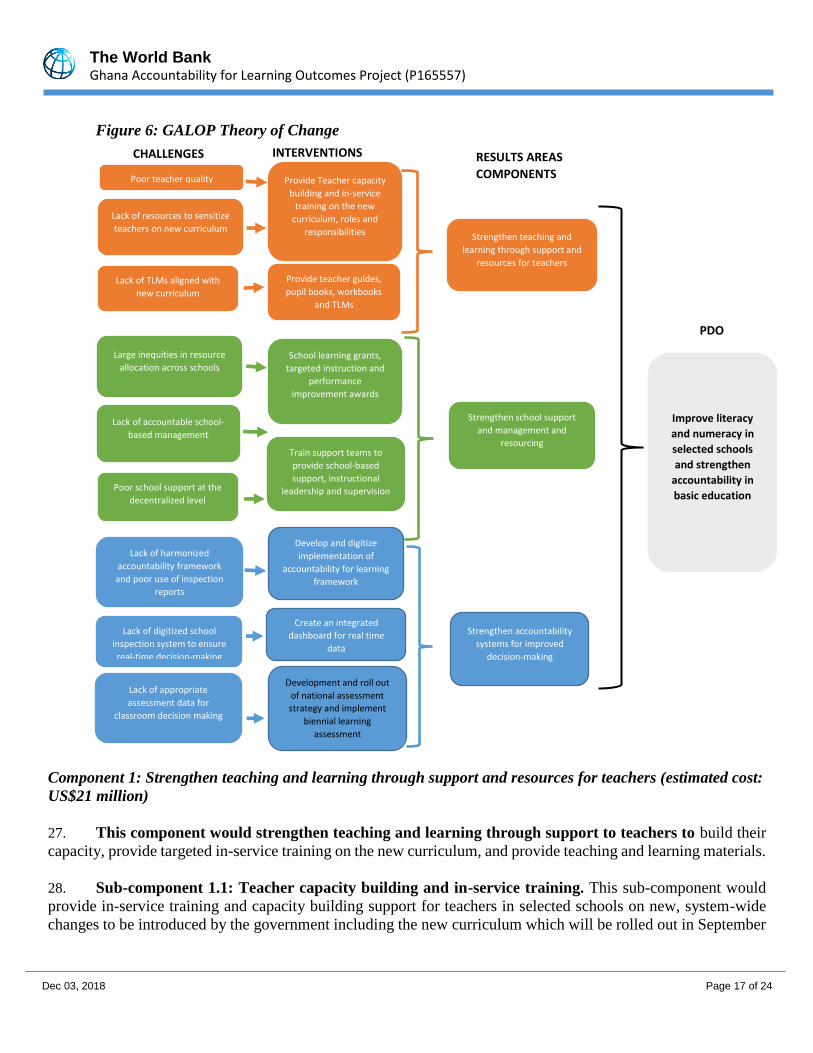
rized
Pub
lic D
iscl
osur
e A
utho
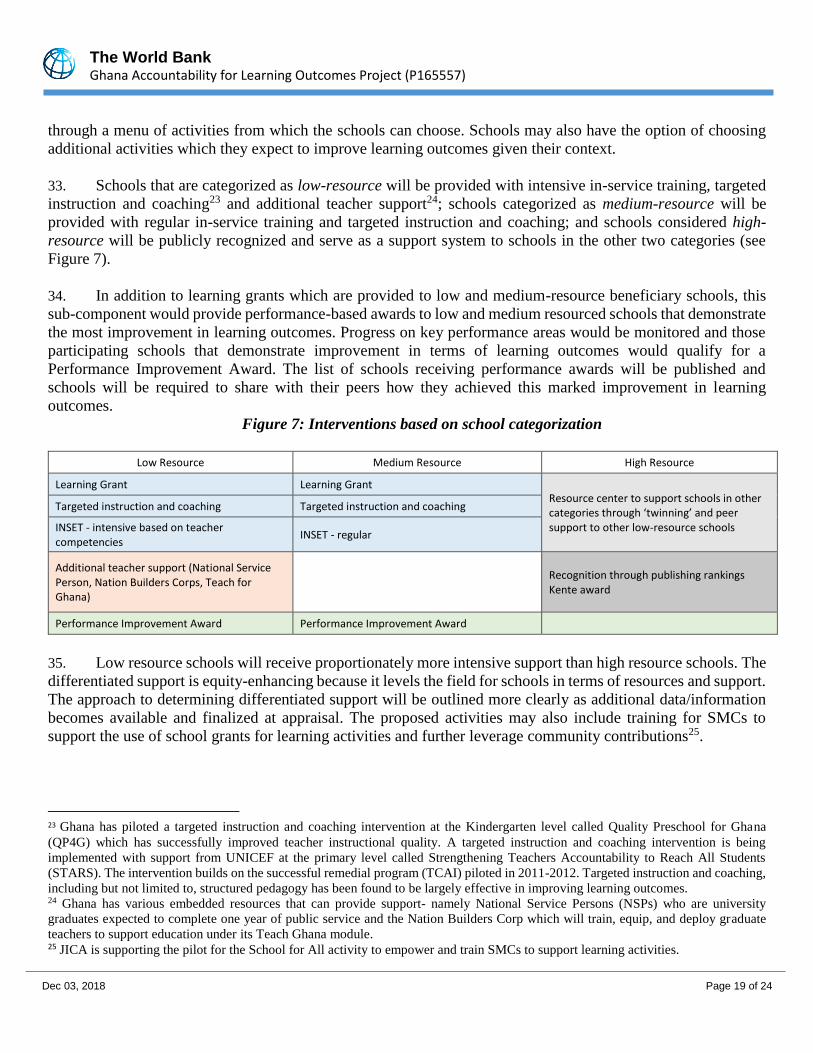
rized
The World Bank Ghana Accountability for Learning Outcomes Project (P165557)
Dec 03, 2018 Page 2 of 24
BASIC INFORMATION
A. Basic Project Data OPS TABLE
Country Project ID Parent Project ID (if any) Project Name
Ghana P165557 Ghana Accountability for Learning Outcomes Project (P165557)
Region Estimated Appraisal Date Estimated Board Date Practice Area (Lead)
AFRICA Mar 26, 2019 Jul 11, 2019 Education
Financing Instrument Borrower(s) Implementing Agency
Investment Project Financing Ministry of Finance Ministry of Education
Proposed Development Objective(s) To improve literacy and numeracy in selected schools and strengthen accountability in basic education in Ghana.
PROJECT FINANCING DATA (US$, Millions)
SUMMARY-NewFin1
Total Project Cost 69.40
Total Financing 69.40
of which IBRD/IDA 45.00
Financing Gap 0.00
DETAILS-NewFinEnh1
World Bank Group Financing
International Development Association (IDA) 45.00
IDA Credit 45.00
Non-World Bank Group Financing
Trust Funds 24.40
Education for All - Fast Track Initiative 24.40
The World Bank Ghana Accountability for Learning Outcomes Project (P165557)
Dec 03, 2018 Page 3 of 24
Environmental and Social Risk Classification Concept Review Decision
Moderate Track II-The review did authorize the preparation to continue
Other Decision (as needed)
B. Introduction and Context Country Context
1. The Republic of Ghana, is a lower middle-income country (LMIC) located in West Africa which
covers approximately 240,000 square kilometers and is bordered by Burkina Faso, Togo, Cote d’Ivoire and the
Atlantic Ocean. Ghana is divided into ten administrative regions – Upper West, Upper East, Northern, Brong
Ahafo, Ashanti, Eastern, Volta, Greater Accra, Central and Western (see Annex 1). It is a multiparty parliamentary
democracy with national elections held every four years. Ghana’s population, at approximately 30 million, is
youthful (40 percent are below 14 years old) with a population growth rate of 2.2 percent. The overall literacy
rate is almost 80 percent, with large sub-regional variation.
2. Ghana’s Gross Domestic Product (GDP) growth has been historically volatile and is strongly linked
to oil and gas production and prices. Between 2008 and 2012, Ghana’s growth rate averaged approximately 9
percent per year, peaking in 2011 when it was the second highest in the world at 14.4 percent. However, worsening
macroeconomic conditions in the form of weak fiscal and monetary policies and declining terms of trade (from
lower oil prices and electricity rationing) slowed growth substantially to less than 4 percent between 2014 and
2016. In 2017, GDP growth recovered and reached 8.5 percent, and 2018 growth is expected to be maintained at
8.3 percent.1 Inflation, which was over 13 percent in January 2017, dropped significantly to 9.6 percent in July
2018. In terms of sector contribution to the GDP, Ghana’s services sector makes up 54 percent of GDP, while
industry accounts for 26 percent and agriculture for 20 percent2.
3. Ghana has made substantial progress in reducing poverty over the last 25 years, but this progress
stalled between 2012 and 2016; in addition, large disparities in levels of poverty and inequality persist. In
1991, the poverty rate was 52.7 percent, but this was more than halved by 2012 when it reached 24.2 percent,
allowing Ghana to achieve Millennium Development Goal (MDG) 1: to eradicate extreme poverty and hunger.
However, the poverty rate has since leveled off and in 2016 was estimated at 23.4 percent. Inequality, as measured
by the country’s Gini coefficient was 0.43 in 2016. Although Ghana compares favorably to other LMICs in sub-
Saharan Africa (SSA), the picture of poverty and inequality is a regional one. In 2016, poverty rates ranged from
2 percent in Greater Accra to 71 percent in Upper West, while the Gini coefficient was between 0.35 in Greater
Accra and Eastern regions and 0.48 in Upper West. Since 2012 poverty rates increased in Upper East, Northern
1 Dontoh, E. and A Vuuren. “Ghana Economic Growth Rate More than Doubles in 2017 to 8.5%. Bloomberg. 11 April 2018. Web. 22
Nov 2018. 2 Ministry of Education, Education Sector Analysis (ESA) 2018.
The World Bank Ghana Accountability for Learning Outcomes Project (P165557)
Dec 03, 2018 Page 4 of 24
and Volta regions and Gini coefficients increased in Northern, Upper East and Brong Ahafo regions. In addition,
26 percent of the country’s poor lives in Ghana’s Northern region (World Bank, 2018).
4. According to the Human Capital Index3 which measures the amount of human capital that a child
born today can expect to attain by age 18, Ghana’s productivity for the next generation of workers is
suboptimal. Five indicators inform the index including survival to age five, adult survival rate, proportion of
children who are not stunted, a child’s expected years of schooling, and harmonized test scores as a measure of
learning quality. The health indicators are above the SSA average with 95 out of 100 children born in Ghana
surviving to age 5, and 19 out of 100 children stunted. Seventy-six percent of 15-year-olds will survive until age
60. However, out of the average years of schooling in Ghana (11.6), the number of quality adjusted learning years
is just 5.7 – children are in school but not learning for nearly six years. Ghana’s HCI at 0.44 means that a child
born in Ghana today will be 44 percent as productive when she grows up as she could be if she had complete
education and full health. In other words, 56 percent of productivity is lost for a child born in Ghana today.
5. The New Patriotic Party (NPP) administration, elected in December 2016, launched the
Coordinated Program of Economic and Social Development Policies (CPESDP) 2017–2024 in March 2018
which aims at doubling GDP by 2024. This is to be achieved by creating favorable conditions for investment in
the private sector and increasing youth employment opportunities by: (a) revitalizing the economy; (b)
transforming agriculture and industry; (c) strengthening social protection and inclusion; (d) revamping economic
and social infrastructure; and (e) reforming public service delivery institutions. A key priority of the
administration is to move ‘Ghana Beyond Aid’ a long term vision centered on five pillars: (a) enhancing domestic
revenue mobilization without undermining productive activities or distorting private incentives for work; (b)
encouraging higher private savings as a source of loanable funds to support domestic credit and capital markets;
(c) pursuing more transparent, prudent, and accountable use of public resources; and (d) leveraging resources in
more innovative ways.
Sectoral and Institutional Context
6. The Ministry of Education (MOE) is responsible for Ghana’s education system and education
policy. The Ghana Education Service (GES) is the implementing agency under the MOE mandated to implement
interventions at the pre-tertiary level of education. Ghana’s pre-tertiary education system is based on a 2-6-3-3
system: basic education includes two years of Kindergarten (KG), six years of Primary and three years of Junior
High School (JHS). Secondary education consists of three years of second cycle education which includes Senior
High School (SHS) or technical/vocational education. SHS programs include business, agriculture, visual arts,
technical, general arts and general science courses. Technical and vocational training is provided by technical
institutes and other training providers and through apprenticeship. The Free Compulsory Universal Basic
Education (FCUBE) program was introduced in 1995 and the free Senior High School and Technical/Vocational
program was rolled out in 2017/18. Entry into SHS and technical/vocational institutions is contingent upon
passing the Basic Education Certificate Examination (BECE) in grade 9 (JHS3). In grade 12 (SHS3), students
take the West African Senior Secondary Certificate Examination (WASSCE). The WASSCE is also taken in The
Gambia, Liberia, Nigeria and Sierra Leone and qualifies students for tertiary education including universities,
polytechnics4, teacher colleges of education, agriculture and nursing training institutes. The GES implements
3 World Bank. 2018. 4 In August 2016, Parliament passed a bill converting 8 out of 10 polytechnics which had met the conversion criteria into technical
universities
The World Bank Ghana Accountability for Learning Outcomes Project (P165557)
Dec 03, 2018 Page 5 of 24
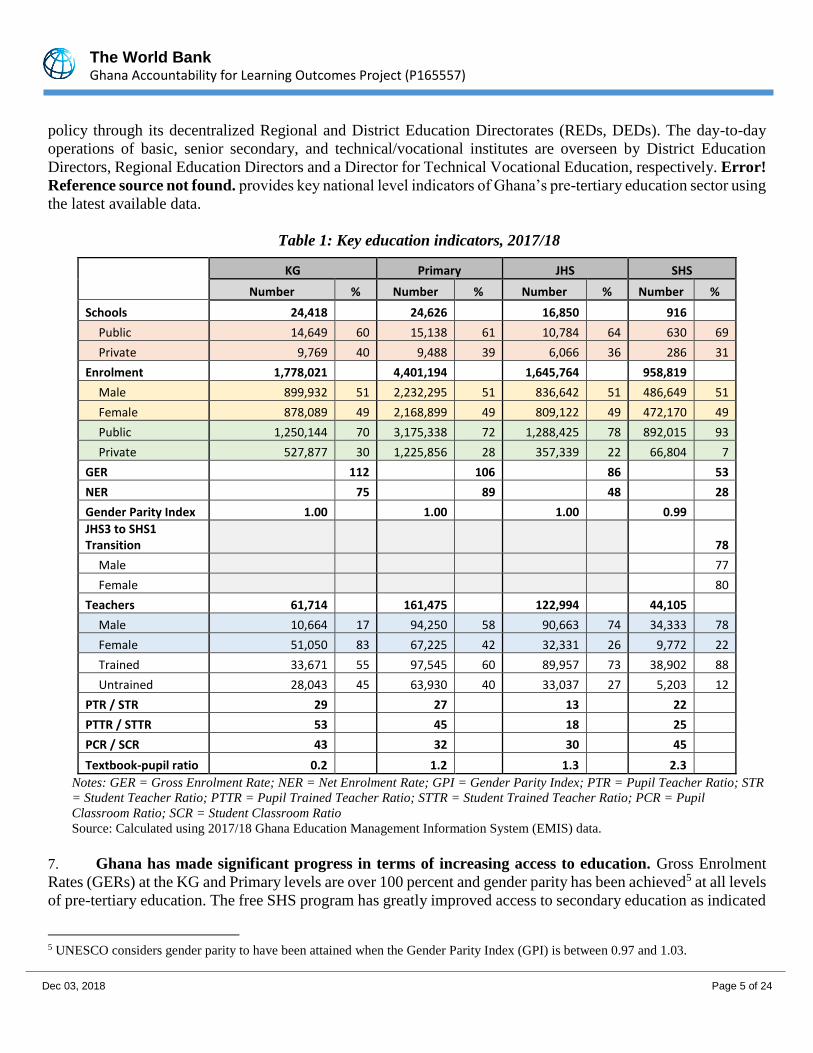
policy through its decentralized Regional and District Education Directorates (REDs, DEDs). The day-to-day
operations of basic, senior secondary, and technical/vocational institutes are overseen by District Education
Directors, Regional Education Directors and a Director for Technical Vocational Education, respectively. Error!
Reference source not found. provides key national level indicators of Ghana’s pre-tertiary education sector using
the latest available data.
Table 1: Key education indicators, 2017/18
KG Primary JHS SHS
Number % Number % Number % Number %
Schools 24,418 24,626 16,850 916
Public 14,649 60 15,138 61 10,784 64 630 69
Private 9,769 40 9,488 39 6,066 36 286 31
Enrolment 1,778,021 4,401,194 1,645,764 958,819
Male 899,932 51 2,232,295 51 836,642 51 486,649 51
Female 878,089 49 2,168,899 49 809,122 49 472,170 49
Public 1,250,144 70 3,175,338 72 1,288,425 78 892,015 93
Private 527,877 30 1,225,856 28 357,339 22 66,804 7
GER 112 106 86 53
NER 75 89 48 28
Gender Parity Index 1.00 1.00 1.00 0.99
JHS3 to SHS1 Transition 78
Male 77
Female 80
Teachers 61,714 161,475 122,994 44,105
Male 10,664 17 94,250 58 90,663 74 34,333 78
Female 51,050 83 67,225 42 32,331 26 9,772 22
Trained 33,671 55 97,545 60 89,957 73 38,902 88
Untrained 28,043 45 63,930 40 33,037 27 5,203 12
PTR / STR 29 27 13 22
PTTR / STTR 53 45 18 25
PCR / SCR 43 32 30 45
Textbook-pupil ratio 0.2 1.2 1.3 2.3
Notes: GER = Gross Enrolment Rate; NER = Net Enrolment Rate; GPI = Gender Parity Index; PTR = Pupil Teacher Ratio; STR
= Student Teacher Ratio; PTTR = Pupil Trained Teacher Ratio; STTR = Student Trained Teacher Ratio; PCR = Pupil
Classroom Ratio; SCR = Student Classroom Ratio
Source: Calculated using 2017/18 Ghana Education Management Information System (EMIS) data.
7. Ghana has made significant progress in terms of increasing access to education. Gross Enrolment
Rates (GERs) at the KG and Primary levels are over 100 percent and gender parity has been achieved5 at all levels
of pre-tertiary education. The free SHS program has greatly improved access to secondary education as indicated
5 UNESCO considers gender parity to have been attained when the Gender Parity Index (GPI) is between 0.97 and 1.03.
The World Bank Ghana Accountability for Learning Outcomes Project (P165557)
Dec 03, 2018 Page 6 of 24
by the JHS3 to SHS1 transition rates, which increased to 78 percent in 2017, ten percentage points from the
previous four years during which years transition rates had stagnated. Despite this increase in access, student-
classroom ratios and student-teacher ratios have remained unchanged, indicating efficient utilization of existing
resources in the short term to accommodate the increased enrolment6.
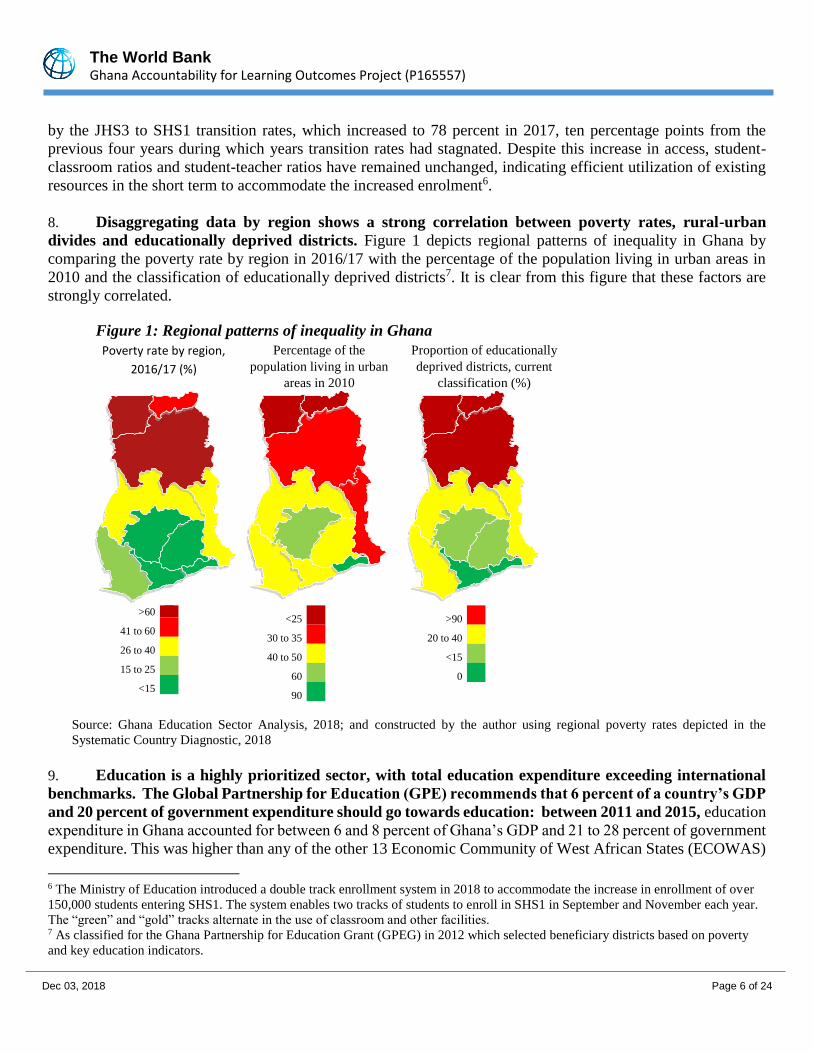
8. Disaggregating data by region shows a strong correlation between poverty rates, rural-urban
divides and educationally deprived districts. Figure 1 depicts regional patterns of inequality in Ghana by
comparing the poverty rate by region in 2016/17 with the percentage of the population living in urban areas in
2010 and the classification of educationally deprived districts7. It is clear from this figure that these factors are
strongly correlated.
Figure 1: Regional patterns of inequality in Ghana
Poverty rate by region,
2016/17 (%)
Percentage of the
population living in urban
areas in 2010
Proportion of educationally
deprived districts, current
classification (%)
>60
41 to 60
26 to 40
15 to 25
<15
<25
30 to 35
40 to 50
60
90
>90
20 to 40
<15
0
Source: Ghana Education Sector Analysis, 2018; and constructed by the author using regional poverty rates depicted in the
Systematic Country Diagnostic, 2018
9. Education is a highly prioritized sector, with total education expenditure exceeding international
benchmarks. The Global Partnership for Education (GPE) recommends that 6 percent of a country’s GDP
and 20 percent of government expenditure should go towards education: between 2011 and 2015, education
expenditure in Ghana accounted for between 6 and 8 percent of Ghana’s GDP and 21 to 28 percent of government
expenditure. This was higher than any of the other 13 Economic Community of West African States (ECOWAS)
6 The Ministry of Education introduced a double track enrollment system in 2018 to accommodate the increase in enrollment of over
150,000 students entering SHS1. The system enables two tracks of students to enroll in SHS1 in September and November each year.
The “green” and “gold” tracks alternate in the use of classroom and other facilities. 7 As classified for the Ghana Partnership for Education Grant (GPEG) in 2012 which selected beneficiary districts based on poverty
and key education indicators.
The World Bank Ghana Accountability for Learning Outcomes Project (P165557)
Dec 03, 2018 Page 7 of 24
countries.8 In addition, education expenditure grew at a faster rate – in both nominal and real terms – than total
government expenditure, evidence of the government’s prioritization of the sector. In terms of sources of
contribution, in 2015, the contribution of the Government of Ghana (GoG) to the education sector was the largest
making up 68 percent of total education expenditure; however, 99.9 percent of these funds was expended on
wages and salaries. Once other sources of education financing9 are added, wages and salaries made up 68 percent
of overall education expenditure, with goods and services accounting for 21 percent and capital expenditure 11
percent. This indicates that almost all non-salary expenditures are from sources other than GoG, i.e., statutory and
development partner funding. The allocation by sub-sector between 2011 and 2015, shows increasing expenditure
at all levels of education, with expenditure for the SHS and tertiary sub-sectors growing more rapidly- much of
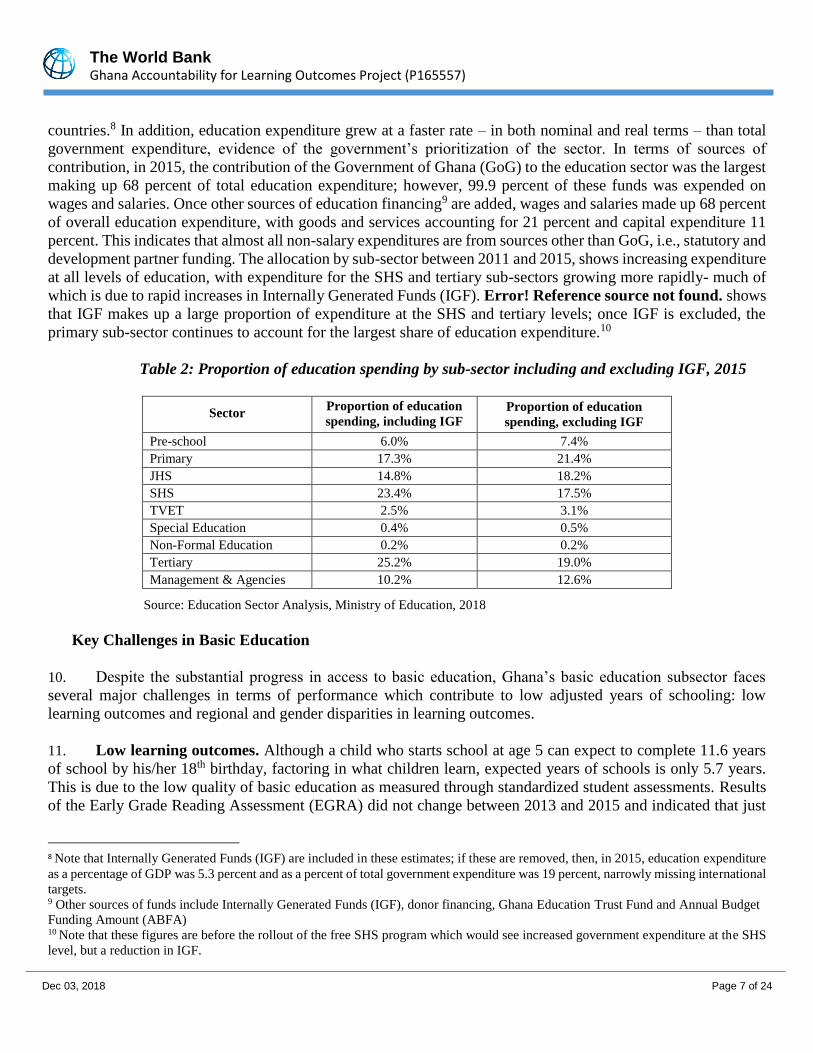
which is due to rapid increases in Internally Generated Funds (IGF). Error! Reference source not found. shows
that IGF makes up a large proportion of expenditure at the SHS and tertiary levels; once IGF is excluded, the
primary sub-sector continues to account for the largest share of education expenditure.10
Table 2: Proportion of education spending by sub-sector including and excluding IGF, 2015
Sector Proportion of education
spending, including IGF Proportion of education
spending, excluding IGF
Pre-school 6.0% 7.4%
Primary 17.3% 21.4%
JHS 14.8% 18.2%
SHS 23.4% 17.5%
TVET 2.5% 3.1%
Special Education 0.4% 0.5%
Non-Formal Education 0.2% 0.2%
Tertiary 25.2% 19.0%
Management & Agencies 10.2% 12.6%
Source: Education Sector Analysis, Ministry of Education, 2018
Key Challenges in Basic Education
10. Despite the substantial progress in access to basic education, Ghana’s basic education subsector faces
several major challenges in terms of performance which contribute to low adjusted years of schooling: low
learning outcomes and regional and gender disparities in learning outcomes.
11. Low learning outcomes. Although a child who starts school at age 5 can expect to complete 11.6 years
of school by his/her 18th birthday, factoring in what children learn, expected years of schools is only 5.7 years.
This is due to the low quality of basic education as measured through standardized student assessments. Results
of the Early Grade Reading Assessment (EGRA) did not change between 2013 and 2015 and indicated that just
8 Note that Internally Generated Funds (IGF) are included in these estimates; if these are removed, then, in 2015, education expenditure
as a percentage of GDP was 5.3 percent and as a percent of total government expenditure was 19 percent, narrowly missing international
targets. 9 Other sources of funds include Internally Generated Funds (IGF), donor financing, Ghana Education Trust Fund and Annual Budget
Funding Amount (ABFA) 10 Note that these figures are before the rollout of the free SHS program which would see increased government expenditure at the SHS
level, but a reduction in IGF.
The World Bank Ghana Accountability for Learning Outcomes Project (P165557)
Dec 03, 2018 Page 8 of 24
2 percent of Primary 2 (P2) pupils were able to read at an appropriate grade level with 50 percent unable to
recognize a single word. The 2015 Early Grade Mathematics Assessment (EGMA) found that higher order
mathematical concepts were a challenge with 75 percent of P2 pupils unable to answer a single conceptual
knowledge subtask (i.e., word problem) correctly. The 2016 National Education Assessment (NEA) confirms
these findings with 30 percent and 50 percent of P4 pupils below the minimum proficiency for English and
Mathematics, respectively; at the P6 level, these figures are approximately 30 percent for both subjects. Poor
literacy and numeracy at the basic level is consequential in later years: at the secondary level, learning outcomes
are also low with only 33 percent of students passing the WASSCE (grade 12 exam) for Mathematics in 2017,
and in 2016, and less than a quarter of students qualified for entry into tertiary education.
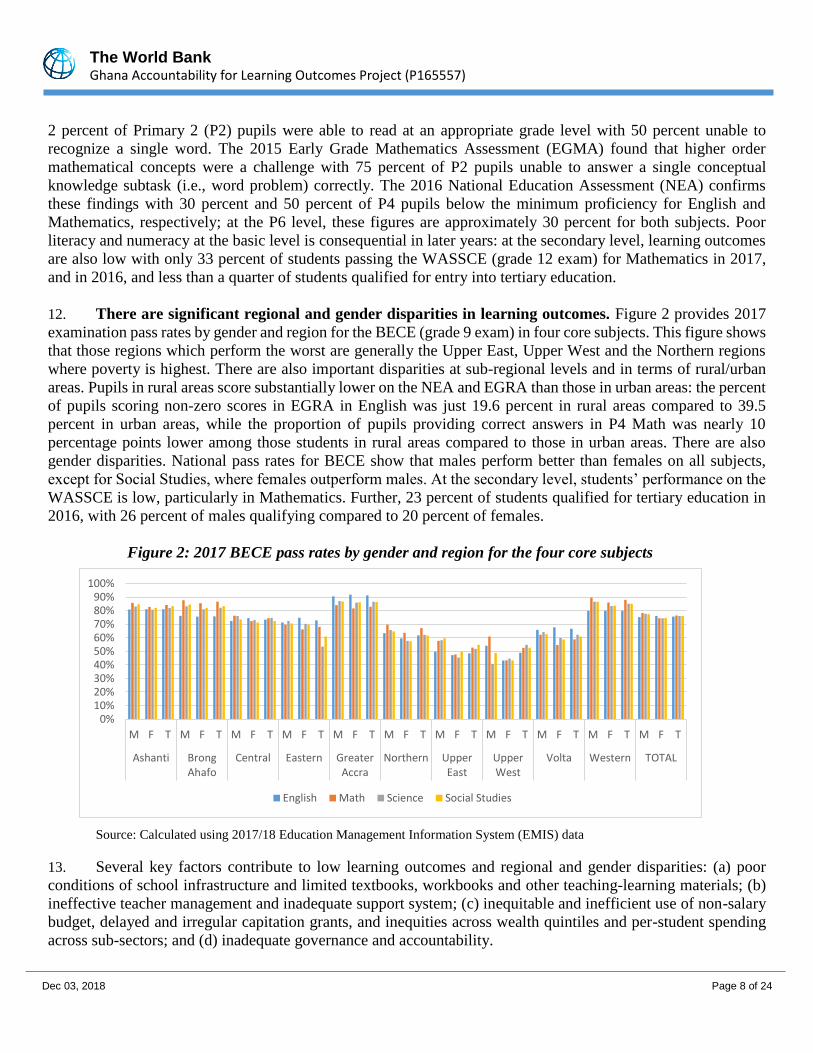
12. There are significant regional and gender disparities in learning outcomes. Figure 2 provides 2017
examination pass rates by gender and region for the BECE (grade 9 exam) in four core subjects. This figure shows
that those regions which perform the worst are generally the Upper East, Upper West and the Northern regions
where poverty is highest. There are also important disparities at sub-regional levels and in terms of rural/urban
areas. Pupils in rural areas score substantially lower on the NEA and EGRA than those in urban areas: the percent
of pupils scoring non-zero scores in EGRA in English was just 19.6 percent in rural areas compared to 39.5
percent in urban areas, while the proportion of pupils providing correct answers in P4 Math was nearly 10
percentage points lower among those students in rural areas compared to those in urban areas. There are also
gender disparities. National pass rates for BECE show that males perform better than females on all subjects,
except for Social Studies, where females outperform males. At the secondary level, students’ performance on the
WASSCE is low, particularly in Mathematics. Further, 23 percent of students qualified for tertiary education in
2016, with 26 percent of males qualifying compared to 20 percent of females.
Figure 2: 2017 BECE pass rates by gender and region for the four core subjects
Source: Calculated using 2017/18 Education Management Information System (EMIS) data
13. Several key factors contribute to low learning outcomes and regional and gender disparities: (a) poor
conditions of school infrastructure and limited textbooks, workbooks and other teaching-learning materials; (b)
ineffective teacher management and inadequate support system; (c) inequitable and inefficient use of non-salary
budget, delayed and irregular capitation grants, and inequities across wealth quintiles and per-student spending
across sub-sectors; and (d) inadequate governance and accountability.
0%10%20%30%40%50%60%70%80%90%
100%
M F T M F T M F T M F T M F T M F T M F T M F T M F T M F T M F T
Ashanti BrongAhafo
Central Eastern GreaterAccra
Northern UpperEast
UpperWest
Volta Western TOTAL
English Math Science Social Studies
The World Bank Ghana Accountability for Learning Outcomes Project (P165557)
Dec 03, 2018 Page 9 of 24
a) Quality of education is impacted by poor conditions of school infrastructure, limited textbooks,
workbooks and other teaching-learning materials. The large wage bill which accounted for nearly all
government expenditure in 2015, crowds out goods and services as well as capital expenditure. The
conditions of many public basic education schools especially those in rural areas reduce the availability
of functional classrooms, furniture, and toilets and/or water and sanitation facilities. Textbook-pupil ratios
are far below established norms (one workbook per child in KG and three per child at Primary and JHS)
with only 0.2 workbooks per child provided at the KG level, 1.4 at Primary, and 1.5 at JHS in 2016/2017.
b) Ineffective teacher management and inadequate teacher support systems contributes to: (i)
ineffective teacher deployment resulting in regional and sub-regional disparities and mismatched language
of instruction; (ii) ineffective training and instructional leadership and support for delivering the
curriculum; and (iii) teacher absenteeism, attrition and time on task.
i. Ghana’s teacher deployment is ineffective with significant variance of PTRs and mismatched
local languages of instruction. Deployment of teachers is an area of concern, with large regional
and sub-regional disparities in pupil-teacher ratios and weak correlation at district level between
the number of students and teachers, especially at the Kindergarten and Senior High School levels.
PTRs11 vary substantially across the country, with districts mostly in the north of Ghana having a
shortage of teachers, while districts in the south of Ghana have a surplus of teachers. In addition,
teacher turnover is high and variable, with a national average of 12 and 18 percent at KG and
primary levels respectively. Data indicate that on average, 20 percent of teachers are placed in
schools where they are not proficient or are only partially proficient in the language of instruction
despite the policy which requires that the language of instruction at KG to P3 is one of the eleven
officially selected Ghanaian languages. In addition, 18 percent of pupils did not speak the language
of instruction that was used/taught in their schools.
ii. Ineffective teacher training and instructional leadership and support for delivering the
curriculum. The ESA (2018) identifies challenges with teacher capacity and support as the
leading factor in basic education performance. The curriculum content is overloaded and lacks
attention to important skills such as critical thinking, collaboration, communication, and digital
literacy and there is very little instructional leadership provided for teachers to deliver the
curriculum. The outdated curriculum and assessment methods for teacher education have not
encouraged the development of effective teaching skills. Skills like classroom management and
teaching strategies geared to the level of the learner are not emphasized. Basic education teachers
are not trained to address the varying needs of learners at different levels, especially students with
special needs and many teachers struggle to teach English and Mathematics. Although the
proportion of trained teachers has increased over the last decade, significant gaps remain at the
KG level (only 65% in 2016/17) and in the three regions in northern Ghana. In addition, the lack
of support, coaching, mentoring, instructional leadership and continuous professional development
(CPD) weakens teacher effectiveness. Teacher education reforms are ongoing to convert the
Colleges of Education into University Colleges and to introduce a new Bachelor of Education
11 PTR target is 30:1. Definitions of surplus and shortage are based on this. An acute shortage is a school with PTR higher than 45:1,
whereas a mild shortage is between 36:1 to 45:1. An acute surplus is a PTR below 15:1, and a mild surplus is between 24:1 and 15:1.
The World Bank Ghana Accountability for Learning Outcomes Project (P165557)
Dec 03, 2018 Page 10 of 24
curriculum based on new standards and assessment frameworks. Government is also in the process
of developing a new basic education curriculum to address these challenges. The teacher education
reforms being rolled out will include a teacher licensing and registration system that aims to ensure
teacher career progression based on skills and competencies and not on years of teaching.
iii. Teacher absenteeism, attrition and time on task have been widely recognized as a problem
with overall teacher absenteeism of 14 percent in 2014/15 as measured in 75 deprived districts
(GPEG districts) and varying considerably by region (higher in the three regions in northern
Ghana). Teacher absenteeism is only one of the reasons for limited instruction and is often linked
to school location, lack of school amenities, opportunities for other income generation activities
and illness. School closings, sports and culture events, poor classroom instructional time use, and
weak instructional and school leadership also contribute to lower time on task. Recent analysis for
the targeted instruction pilot in Ghana - the Teacher Community Assistant Initiative (TCAI) -
found that on average teachers in the program were absent 30 percent of the time, and even when
present in the school, time-on-task was low. Only 15 percent of teachers trained in the remedial
method were found correctly implementing the program during unannounced spot-checks.12 While
lecturing may be counted as interactive learning time, real engagement in learning may be lacking.
A seminal 2006 study found that the percentage of time that students were engaged in learning
according to curriculum objectives was approximately 39 percent in Ghana.13 Teacher attrition
increased to 4 percent in 2016 from 2 percent in 2009 and is likely linked to the introduction of
new teacher vacancy policy whereby positions need to be advertised as available. Many of the
posts in remote rural areas continue to remain difficult to fill.
c) Poor financial management through: (i) inequitable and inefficient use of non-salary budget; (ii) delayed
and irregular capitation grants; and (iii) inequities across wealth quintiles and spending across sub-sectors.
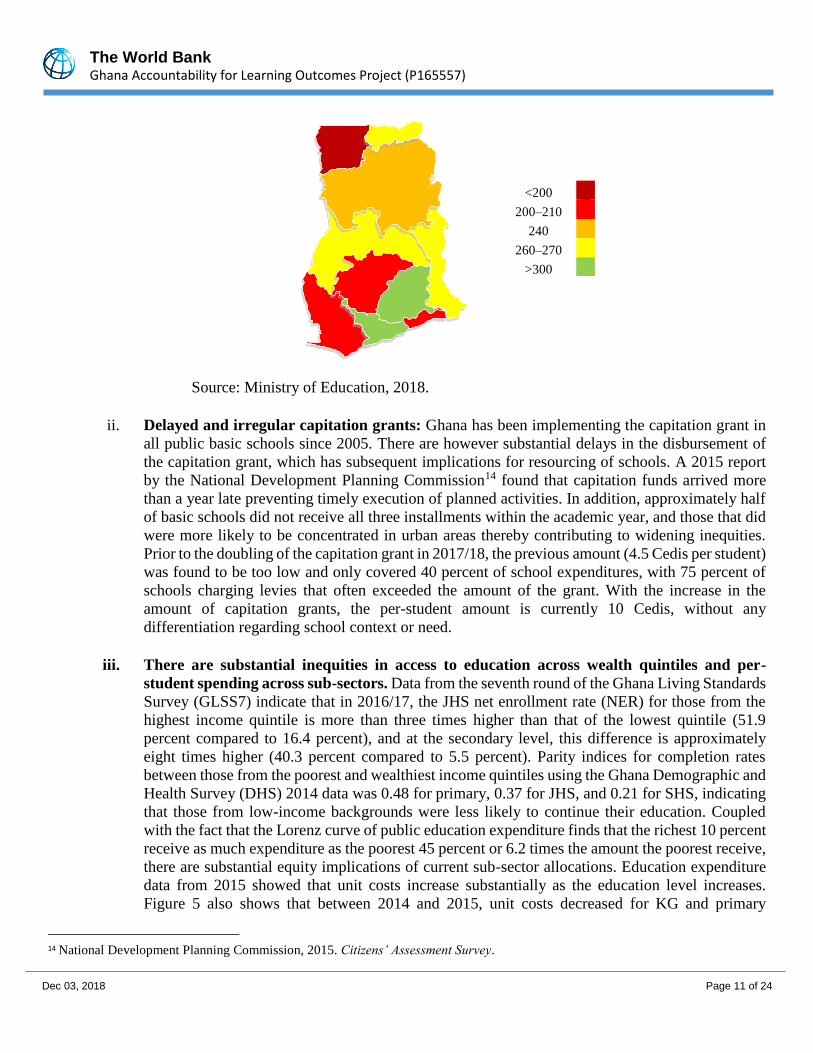
i. Inequitable and inefficient use of non-salary budget is demonstrated by regional inequalities in
per-student spending. Per-student spending varies widely by region as evidenced by Figure 4 with
the least amount spent on the Upper West, Greater Accra, Western, and Ashanti regions and the
most spent on Eastern and Central regions. This has strong correlations with regional distributions
of poverty.
Figure 4: Total per student spending on public primary education 2015
12 Duflo, Annie, Jessica Kiessel, and Adrienne Lucas (2018). " Alternative Models of Increasing Student Achievement: Evidence from
a Nationwide Randomized Experiment". 13 Abadzi, Helen. 2007. Absenteeism and Beyond: Instructional Time Loss and Consequences. Policy Research Working Paper; No.
4376. World Bank, Washington, DC.
The World Bank Ghana Accountability for Learning Outcomes Project (P165557)
Dec 03, 2018 Page 11 of 24
Source: Ministry of Education, 2018.
ii. Delayed and irregular capitation grants: Ghana has been implementing the capitation grant in
all public basic schools since 2005. There are however substantial delays in the disbursement of
the capitation grant, which has subsequent implications for resourcing of schools. A 2015 report
by the National Development Planning Commission14 found that capitation funds arrived more
than a year late preventing timely execution of planned activities. In addition, approximately half
of basic schools did not receive all three installments within the academic year, and those that did
were more likely to be concentrated in urban areas thereby contributing to widening inequities.
Prior to the doubling of the capitation grant in 2017/18, the previous amount (4.5 Cedis per student)
was found to be too low and only covered 40 percent of school expenditures, with 75 percent of
schools charging levies that often exceeded the amount of the grant. With the increase in the
amount of capitation grants, the per-student amount is currently 10 Cedis, without any
differentiation regarding school context or need.
iii. There are substantial inequities in access to education across wealth quintiles and per-
student spending across sub-sectors. Data from the seventh round of the Ghana Living Standards
Survey (GLSS7) indicate that in 2016/17, the JHS net enrollment rate (NER) for those from the
highest income quintile is more than three times higher than that of the lowest quintile (51.9
percent compared to 16.4 percent), and at the secondary level, this difference is approximately
eight times higher (40.3 percent compared to 5.5 percent). Parity indices for completion rates
between those from the poorest and wealthiest income quintiles using the Ghana Demographic and
Health Survey (DHS) 2014 data was 0.48 for primary, 0.37 for JHS, and 0.21 for SHS, indicating
that those from low-income backgrounds were less likely to continue their education. Coupled
with the fact that the Lorenz curve of public education expenditure finds that the richest 10 percent
receive as much expenditure as the poorest 45 percent or 6.2 times the amount the poorest receive,
there are substantial equity implications of current sub-sector allocations. Education expenditure
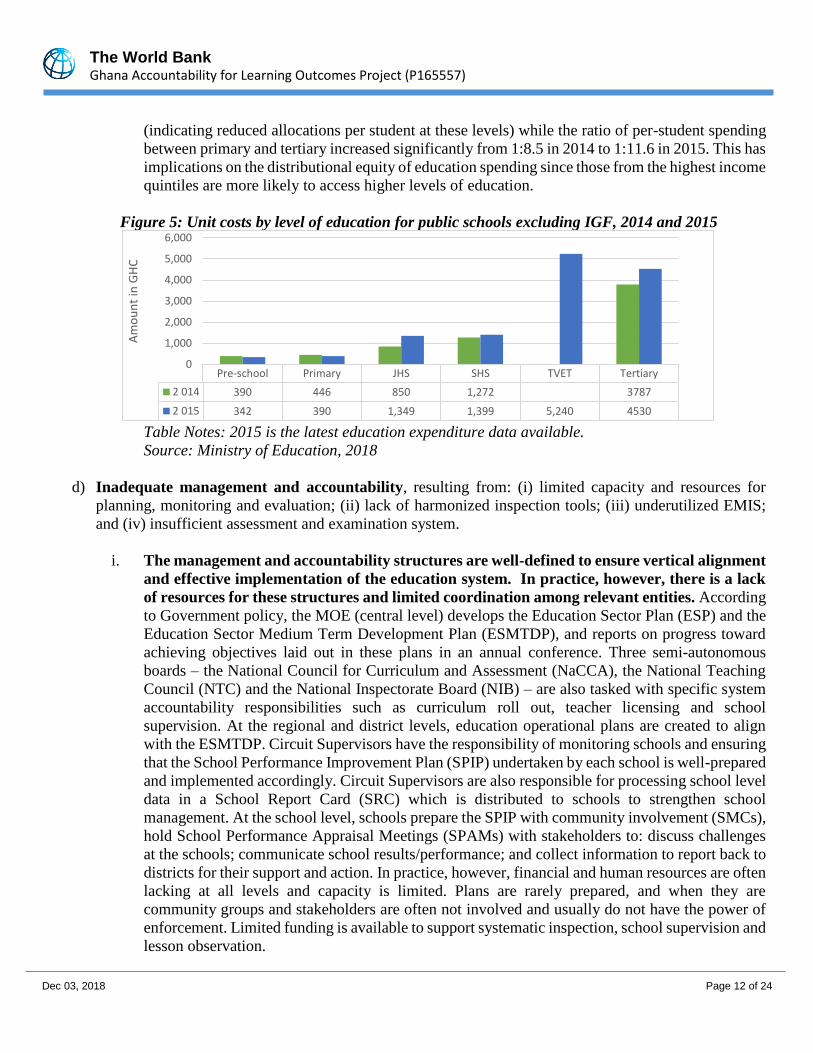
data from 2015 showed that unit costs increase substantially as the education level increases.
Figure 5 also shows that between 2014 and 2015, unit costs decreased for KG and primary
14 National Development Planning Commission, 2015. Citizens’ Assessment Survey.
<200
200–210
240
260–270
>300
The World Bank Ghana Accountability for Learning Outcomes Project (P165557)
Dec 03, 2018 Page 12 of 24
(indicating reduced allocations per student at these levels) while the ratio of per-student spending
between primary and tertiary increased significantly from 1:8.5 in 2014 to 1:11.6 in 2015. This has
implications on the distributional equity of education spending since those from the highest income
quintiles are more likely to access higher levels of education.
Figure 5: Unit costs by level of education for public schools excluding IGF, 2014 and 2015
Table Notes: 2015 is the latest education expenditure data available.
Source: Ministry of Education, 2018
d) Inadequate management and accountability, resulting from: (i) limited capacity and resources for
planning, monitoring and evaluation; (ii) lack of harmonized inspection tools; (iii) underutilized EMIS;
and (iv) insufficient assessment and examination system.
i. The management and accountability structures are well-defined to ensure vertical alignment
and effective implementation of the education system. In practice, however, there is a lack
of resources for these structures and limited coordination among relevant entities. According
to Government policy, the MOE (central level) develops the Education Sector Plan (ESP) and the
Education Sector Medium Term Development Plan (ESMTDP), and reports on progress toward
achieving objectives laid out in these plans in an annual conference. Three semi-autonomous
boards – the National Council for Curriculum and Assessment (NaCCA), the National Teaching
Council (NTC) and the National Inspectorate Board (NIB) – are also tasked with specific system
accountability responsibilities such as curriculum roll out, teacher licensing and school
supervision. At the regional and district levels, education operational plans are created to align
with the ESMTDP. Circuit Supervisors have the responsibility of monitoring schools and ensuring
that the School Performance Improvement Plan (SPIP) undertaken by each school is well-prepared
and implemented accordingly. Circuit Supervisors are also responsible for processing school level
data in a School Report Card (SRC) which is distributed to schools to strengthen school
management. At the school level, schools prepare the SPIP with community involvement (SMCs),
hold School Performance Appraisal Meetings (SPAMs) with stakeholders to: discuss challenges
at the schools; communicate school results/performance; and collect information to report back to
districts for their support and action. In practice, however, financial and human resources are often
lacking at all levels and capacity is limited. Plans are rarely prepared, and when they are
community groups and stakeholders are often not involved and usually do not have the power of
enforcement. Limited funding is available to support systematic inspection, school supervision and
lesson observation.
Pre-school Primary JHS SHS TVET Tertiary
2 014 390 446 850 1,272 3787
2 015 342 390 1,349 1,399 5,240 4530
0
1,000
2,000
3,000
4,000
5,000
6,000
Am
ou
nt
in G
HC
The World Bank Ghana Accountability for Learning Outcomes Project (P165557)
Dec 03, 2018 Page 13 of 24
ii. There is a lack of harmonization of inspection tools to ensure system-wide accountability
resulting in a large degree of fragmentation. Circuit supervisor reports are not standardized or
collated to inform management. The lesson observations are not routinely captured in a format that
can be verified or supervised by other inspections. Districts are often using different inspection
tools depending on type of development partner support provided. Although the National
Inspection Board is expected to conduct annual inspections, the tools have not yet been developed
in alignment with how supervision/monitoring is being carried out at the regional and district
levels. Information is stored across different databases, departments and paper files preventing
their availability and utilization. Furthermore, the National Inspectorate Board is not yet
capacitated to harmonize the inspection process or conduct regular annual inspections.
iii. Ghana has an underutilized education management information system (EMIS) with poor
data sharing and feedback mechanisms. Ghana has an EMIS to gather basic education data on
an annual census wide basis. It covers both public and private schools15, collecting data on key
indicators including enrollment, repeaters, teachers, infrastructure and learning materials.
However, it lacks data on system performance at the school level such as learning outcomes,
teacher absenteeism or time on task. Since independent measures for teacher absenteeism or time
on task are not regularly monitored, there is minimal accountability for how the most important
human resource in education is utilized. Where data is collected, there are major challenges in data
analysis, reporting, and utilization. There is a lack of expedient analysis, reporting and sharing of
data with schools and districts for informed decision making.
iv. Ghana has numerous learning assessments, but these are disjointed and poorly coordinated
without an overarching guiding strategy on national assessments. Students were assessed
through the EGRA and the EGMA at the P2 level in 2013 and 2015. EGRA was administered in
11 local languages as well as in English. The National Education Assessment (NEA) is conducted
biennially for P4 and P6, with the last assessment undertaken in 2016. These assessments are all
done on a sample basis that are regionally and nationally representative, but not representative at
the district or school level. In 2003, 2007, and 2011, Ghana participated in Trends in Mathematics
and Science Study (TIMSS) international assessment. Additionally, these are all donor-supported
and have not been integrated into government budgets. At the end of the primary cycle (JHS3),
students sit the BECE – however, this does not provide information on core numeracy and literacy
competencies and is done at the end of the primary cycle and therefore does not inform
improvements to curriculum and teaching at lower grades. In addition, as a stanine system,
performance can’t be measured from year to year. These assessments do not sufficiently provide
the sector with performance information in a systematic and sustainable manner.
14. The Ministry of Education is currently undertaking several reforms pertaining to teacher,
curriculum and inspection activities. The Education Act 778 (2008) established the National Teaching Council
(NTC) to professionalize teaching through licensing. In 2012, the Colleges of Education Act 847 was passed to
upgrade all Teacher Training Colleges into diploma-awarding institutions affiliated with the education-oriented
universities. The Pre-Tertiary Teacher Professional Development and Management Policy (PTTPDM) was also
15 Data collection for private schools has always been a challenge, therefore EMIS is likely underreporting private school data.
The World Bank Ghana Accountability for Learning Outcomes Project (P165557)
Dec 03, 2018 Page 14 of 24
initiated in 2016 to improve: (i) career progression paths for teachers; (ii) school leadership and management; (iii)
continuous professional development; and; (iv) a teacher assessment framework. The comprehensive teacher
education reforms are being implemented with the first group of approximately 30,000 teachers taking their
licensing examinations in September 2018.16 The Teacher Transformation and Learning (T-TEL) with funding
from DfID is supporting the NTC in implementing these reforms.
15. Curriculum reforms were initiated in 2002 and the National Council for Curriculum and Assessment
(NaCCA) was established. The objectives of the reform are to: (i) provide broad and balanced up-to-date
knowledge, skills, values and attitudes in both existing and new subject disciplines and in a range of foundational
literacies and global competencies; (ii) develop the ability to apply what has been learned with confidence and
competence in the world of work; (iii) instill an understanding of Ghana’s history, culture and traditions and their
rights and responsibilities as citizens; (iv) encourage participation in the learning process and promote lifelong
learning; (v) encourage and support teachers to engage in creative instructional practices; (vi) promote an
inclusive educational system; (vii) encourage mathematics as a foundational building block to learning other
subjects; (viii) encourage environmental awareness; (ix) promote financial literacy and entrepreneurial skills
development; and (x) encourage proficiency in a Ghanaian language and a modern foreign language. The
curriculum and assessment reforms are being led by NaCCA with funding from the Government of Ghana budget.
16. A new school supervision and inspection system is also being introduced with the establishment of the
National Inspectorate Board (NIB) in 2008. The NIB is working on a new inspection framework, inspection tools
and revised inspection protocols, in partnership and with support from the Education Development and Office for
Standards in Education (OFSTED). Reforms would include: (i) strengthened accountability structures and
enhanced monitoring systems; and the (ii) introduction of a new school supervision and inspection system.
17. Other reforms being introduced by the Ministry of Education include: opportunities for Public-Private
Partnerships (PPPs) in education; the introduction of the Free Senior High School and TVET education and the
double track enrollment system; and the decentralization of the basic education system.
18. Ghana is in the process of finalizing a new Education Sector Plan (ESP) which will cover the period
from 2018 to 2030 and is based on evidence presented in the 2018 ESA. A new ESMTDP covering the
period 2018 to 2021 has also been developed and a Reform Secretariat is being established in the MOE to
supervise the reform agenda17. These policy documents acknowledge the challenges identified in this section
and present the following key output/outcome areas: (i) increased trained teachers; (ii) increased NER at KG and
right age entry at P1; (iii) increased efficiency of school grants; (iv) reduced teacher and student absenteeism; (v)
new curriculum and teaching and learning materials (TLMs) in place; (vi) EGRA, EGMA, NEA and BECE
assessments strengthened and expanded; (vii) effective decentralization in place; and (viii) strengthened
community engagement in school affairs. The proposed Ghana Accountability for Learning Outcomes Project
16 The teacher reforms underway aim to: (i) raise the status or practical teaching experience through supported and assessed teaching
in schools; (ii) concentrate on subject knowledge for teaching the school curriculum; (iii) place significant attention on developing
numeracy and literacy skills; (iv) focus on assessment of training against the national teachers’ standards; (v) move from generalist to
level specialization from KG1-P3, P4-P6 and JHS; (vi) improve teacher deployment through rationalization; (vii) address cross-cutting
issues such as equity and inclusivity, assessment, core skills, professional values, action research, and reflection; (viii) include high
quality teacher professional development for tutors, mentors, school and university leaders; (ix) introduce management training for
school heads and managers; and (x) develop and implement a comprehensive teacher policy. 17 The Reform Secretariat is expected to receive support from Department for International Development (DfID).
The World Bank Ghana Accountability for Learning Outcomes Project (P165557)
Dec 03, 2018 Page 15 of 24
(GALOP) will support the implementation of the government’s ESP focusing on basic education through strategic
targeted instruction for teachers in early grades in line with the new curriculum, school support for learning
materials and training, and improved school management, supervision and assessment systems.
Relationship to CPF
19. The World Bank-Ghana Country Partnership Framework (CPF) covering 2019 to 2024 currently under
preparation supports improved access to key basic services, particularly in underserved areas, as well as better
skills training and education for increased employability and earnings. While the CPF is to be finalized over the
next few months, initial drafts include building human capital as one of the key pillars to strengthen skills and to
create jobs. The proposed GALOP builds on the findings of the Systematic Country Diagnostic (SCD 2017/2018)
which identifies education as a critical pathway to increase labor productivity and build human capital.
20. The GALOP includes a US$9.4 million Maximum Country Allocation (MCA) and a US$15 million
multiplier fund grant allocation from the Global Partnership for Education (GPE). In line with the GPE focus
areas, the GALOP will support investments to improve the quality of basic education while aiming to bring about
transformative changes in equity and efficiency of the system. Progress towards these objectives would be
complemented by additional and ongoing programs of development partners and Government budget as identified
in the ESP and ESMTDP18 The Local Education Group (LEG) is involved in supporting the design and scope of
the GALOP while ensuring alignment and potential integration with ongoing and future bilateral assistance. C. Proposed Development Objective(s)
21. To improve literacy and numeracy in selected schools and strengthen accountability in basic education in
Ghana.
Key Results (From PCN)
22. Progress toward meeting the PDO would be measured through the following key outcome
indicators:
• Indicators related to improved literacy and numeracy19
1. Increase in percent of P4 pupils with proficiency in math, of which girls
2. Increase in percent of P4 pupils with proficiency in literacy, of which girls
• Indicators related to strengthened accountability
3. Decrease in percent of teacher absenteeism (ESP 2018-2030)
4. Increase in percent of teacher time on task (ESP 2018-2030)
5. Increase in percent of schools with appropriate PTR at the primary level (ESP 2018-2030)
6. Monitorable systems to hold schools accountable and target resources to underperforming
schools
• Direct project beneficiaries (core indicator), of which female
PDO level indicators are aligned with three GPE pillars of learning (indicators 1-2), efficiency (indicators 3-4)
18 Key Development Partners with ongoing or planned investments in basic education include USAID, DfID, UNICEF, and JICA. 19 These indicators are taken from Ghana's Education Sector Plan (ESP) 2018-2030 and would be disaggregated by gender.
The World Bank Ghana Accountability for Learning Outcomes Project (P165557)
Dec 03, 2018 Page 16 of 24
and equity (indicators 5-6). D. Concept Description
23. The MOE is in the process of finalizing the ESP 2018-2030 which is expected to be endorsed by
Parliament and the LEG end 2018. In addition, the ESMTDP 2018-2021 identifies key education priorities in the
medium term, which are being supported through the creation of a Reform Secretariat to be housed within the
MOE. The ESP and ESMTDP provide the road map for the GALOP to improve learning in basic education by
strengthening teacher capacity, school support and supervision, and strengthening accountability systems.
24. The proposed project would support interventions at system and school levels. While system-level
interventions would be national in scope, learning interventions would be implemented in selected basic schools
which have the greatest challenges in terms of learning outcomes and resourcing. The project would also employ
a phased approach to accommodate the gradual rollout of the new curriculum by the government and will begin
with the early grades (Kindergarten to P2) expanding to other levels of basic education as the new curriculum is
rolled out. The project’s focus on early years is equity enhancing because of the long-term benefits of readiness
to learn and improved future learning outcomes. The learning interventions are expected to reach approximately
7,000 poorly performing public basic schools, which represents approximately one third of basic schools.
25. Building on ongoing interventions in Ghana using distance learning, virtual coaching, and targeted
instruction, the project proposes scaling some of these successful and cost-effective pilots. Many of these
activities are currently supported by development partners, i.e., USAID Evaluating Systems, UNICEF mSRC,
Varkey Foundation activities -Making Ghanaian Girls Great and Train for Tomorrow. In addition, the GALOP
will learn from best practices in India, Kenya, South Africa and other countries where teacher training has been
effective and successful methods for supporting teachers and schools have been tested. The Government is also
committed to an ambitious program of digitizing accountability systems spanning multiple levels, the education
management information system, and linking the various data sources on a user-friendly dashboard interface. The
project will explore options to utilize technology to: collect data; provide timely feedback to teachers and
supervisors; deliver key messages to teachers and students; link remote schools; and assess system accountability.
26. The GALOP would include four components: (i) Strengthen teaching and learning through support and
resources for teachers; (ii) Strengthen school support, management and resourcing; (iii) Strengthen accountability
systems for improved decision-making; and (iv) Institutional strengthening, technical assistance, management
and research. Components 1-3 use a results-based financing (RBF) modality20 and would build upon lessons
learned from completed and existing projects implemented in the education sector. Under Component 4,
IDA/GPE funds would be disbursed based on regularly updated procurement and training plans, which would be
reviewed by the World Bank. Figure 6 depicts the Theory of Change for the project.
20 See Annex 3 for a summary of Disbursement Linked Results areas.
The World Bank Ghana Accountability for Learning Outcomes Project (P165557)
Dec 03, 2018 Page 17 of 24
Figure 6: GALOP Theory of Change
Component 1: Strengthen teaching and learning through support and resources for teachers (estimated cost:
US$21 million)
27. This component would strengthen teaching and learning through support to teachers to build their
capacity, provide targeted in-service training on the new curriculum, and provide teaching and learning materials.
28. Sub-component 1.1: Teacher capacity building and in-service training. This sub-component would
provide in-service training and capacity building support for teachers in selected schools on new, system-wide
changes to be introduced by the government including the new curriculum which will be rolled out in September
Lack of resources to sensitize
teachers on new curriculum
Create an integrated
dashboard for real time
data
CHALLENGES INTERVENTIONS RESULTS AREAS
COMPONENTS
PDO
Strengthen accountability
systems for improved
decision-making
Provide teacher guides,
pupil books, workbooks
and TLMs
Develop and digitize
implementation of
accountability for learning
framework
Train support teams to
provide school-based
support, instructional
leadership and supervision
Strengthen school support
and management and
resourcing
Provide Teacher capacity
building and in-service
training on the new
curriculum, roles and
responsibilities
School learning grants,
targeted instruction and
performance
improvement awards
Strengthen teaching and
learning through support and
resources for teachers
Improve literacy
and numeracy in
selected schools
and strengthen
accountability in
basic education
Poor teacher quality
Large inequities in resource
allocation across schools
Poor school support at the
decentralized level
Lack of accountable school-
based management
Lack of TLMs aligned with
new curriculum
Lack of harmonized
accountability framework
and poor use of inspection
reports
Lack of appropriate
assessment data for
classroom decision making
Lack of digitized school
inspection system to ensure
real-time decision-making
Development and roll out
of national assessment
strategy and implement
biennial learning
assessment
The World Bank Ghana Accountability for Learning Outcomes Project (P165557)
Dec 03, 2018 Page 18 of 24
2019 for K1 to P2 and then gradually expanded to higher grades.21 Training for teachers on the new curriculum
would also include training on the new accountability for learning framework to be supported under the proposed
project. Additional coaching and support would be provided to teachers for implementing the new assessment
system to be introduced, the results of which would be used to inform instruction and learning. Teacher capacity
building and training would also focus on promoting inclusion, i.e., teaching pupils with disabilities, by scaling
up tools developed by UNICEF. The planned teacher training would rely on high quality instruction, both face to
face and distance learning as well as innovative digital methods to support uptake (e.g., video lessons, distance
coaching, WhatsApp reminders). The teacher training will be aligned with the new curriculum standards and
focus areas (inclusion, digital literacy, project-based learning, child protection, etc.). Teacher training will be
implemented by the GES in collaboration with the NTC.
29. Sub-component 1.2: Provision of teaching and learning materials (TLMs). This sub-component
would support the provision of teacher guides, pupil books especially readers and workbooks as well as other
TLMs that are aligned with teaching and learning under the new curriculum. While some of these materials have
already been developed for KG to P2 levels under a different project22, the development of materials that align
with the new curriculum for other levels is currently underway. Appropriate TLMs would be provided for students
with disabilities and teachers would be trained in their use. This sub-component will be implemented by GES.
30. For this component, release of IDA and GPE funds would be linked to achievement of the following
tentative Disbursement-Linked Indicators (DLIs):
• Percentage increase in proficiency of P4 pupils in math
• Percentage increase in proficiency of P4 pupils in literacy
• Number of schools demonstrating increased time on task based on lesson observation
Component 2: Strengthen school support, management and resourcing (Estimated cost: US$30 million)
31. This component would provide resources to schools and strengthen learning support systems by
providing learning grants for beneficiary schools, targeted instruction and additional performance grants to
engender school level management accountability for results.
32. Sub-component 2.1: Differentiated support based on resource categorization of schools for school
learning grants, targeted instruction and performance improvement awards. All schools benefitting under
the project would sign performance agreements to meet the minimum benchmark for improvement in learning
outcomes). Schools would be categorized into low, medium and high-resource based on transparent data-driven
criteria. The resource categorization is determined by resources available at the school level such as TLMs,
furniture, proportion of trained teachers, etc. Low and medium-resource schools will be required to submit
proposals for learning grants developed in collaboration with their SMCs. Schools may also solicit assistance
from civil society organizations (CSOs) and District Education Offices operating in the school catchment area.
The proposal will include activities which will help them achieve the minimum benchmark in improvement in
learning outcomes. These learning grants are expected to improve literacy and numeracy and increase equity,
21 Note that the pre-service training will be provided by the ongoing Transforming Teacher Education and Learning (T-TEL) program
funded by DfID. 22 USAID Partnership for Learning Project.
The World Bank Ghana Accountability for Learning Outcomes Project (P165557)
Dec 03, 2018 Page 19 of 24
through a menu of activities from which the schools can choose. Schools may also have the option of choosing
additional activities which they expect to improve learning outcomes given their context.
33. Schools that are categorized as low-resource will be provided with intensive in-service training, targeted
instruction and coaching23 and additional teacher support24; schools categorized as medium-resource will be
provided with regular in-service training and targeted instruction and coaching; and schools considered high-
resource will be publicly recognized and serve as a support system to schools in the other two categories (see
Figure 7).
34. In addition to learning grants which are provided to low and medium-resource beneficiary schools, this
sub-component would provide performance-based awards to low and medium resourced schools that demonstrate
the most improvement in learning outcomes. Progress on key performance areas would be monitored and those
participating schools that demonstrate improvement in terms of learning outcomes would qualify for a
Performance Improvement Award. The list of schools receiving performance awards will be published and
schools will be required to share with their peers how they achieved this marked improvement in learning
outcomes.
Figure 7: Interventions based on school categorization
Low Resource Medium Resource High Resource
Learning Grant Learning Grant Resource center to support schools in other categories through ‘twinning’ and peer support to other low-resource schools
Targeted instruction and coaching Targeted instruction and coaching
INSET - intensive based on teacher competencies
INSET - regular
Additional teacher support (National Service Person, Nation Builders Corps, Teach for Ghana)
Recognition through publishing rankings Kente award
Performance Improvement Award Performance Improvement Award
35. Low resource schools will receive proportionately more intensive support than high resource schools. The
differentiated support is equity-enhancing because it levels the field for schools in terms of resources and support.
The approach to determining differentiated support will be outlined more clearly as additional data/information
becomes available and finalized at appraisal. The proposed activities may also include training for SMCs to
support the use of school grants for learning activities and further leverage community contributions25.
23 Ghana has piloted a targeted instruction and coaching intervention at the Kindergarten level called Quality Preschool for Ghana
(QP4G) which has successfully improved teacher instructional quality. A targeted instruction and coaching intervention is being
implemented with support from UNICEF at the primary level called Strengthening Teachers Accountability to Reach All Students
(STARS). The intervention builds on the successful remedial program (TCAI) piloted in 2011-2012. Targeted instruction and coaching,
including but not limited to, structured pedagogy has been found to be largely effective in improving learning outcomes. 24 Ghana has various embedded resources that can provide support- namely National Service Persons (NSPs) who are university
graduates expected to complete one year of public service and the Nation Builders Corp which will train, equip, and deploy graduate
teachers to support education under its Teach Ghana module. 25 JICA is supporting the pilot for the School for All activity to empower and train SMCs to support learning activities.
The World Bank Ghana Accountability for Learning Outcomes Project (P165557)
Dec 03, 2018 Page 20 of 24
36. The learning grant would complement the capitation grant (provided by government)26 to fund the School
Performance Improvement Plans (SPIPs). The learning grant aims to ensure that the school has adequate funding
to achieve the minimum learning outcomes. Capitation grants have in the past been irregularly disbursed and are
inadequate. To embed the school learning grants within existing systems, schools will use the same planning
mechanism as they would for capitation grants – the SPIPs. The learning grants are also efficiency-inducing
because the application process ensures that schools that are more motivated are also more likely to apply. At the
same time, schools that do not have the capacity or which may experience difficulties in preparing/submitting
their learning grant proposals will be given support by intermediaries to complete and submit their proposals.
Regional and district education offices will be resourced to support implementation of the proposal process and
provision of learning grants through existing systems in the form of Annual District Education Operational Plans
(ADEOPs).
37. The Performance Improvement Awards will be efficiency-inducing as they will encourage schools to
utilize the learning grants towards improvements in education quality, focusing on outputs rather than inputs.
This sub-component will be implemented by the GES, which oversees district education financing and school-
based capitation grants.
38. Sub-component 2.2: Training support teams for school-based support, instructional leadership and
supervision. This sub-component would support the training of support teams (Curriculum Leads, Circuit
Supervisors, District Training Support Teams-DTSTs, and School Heads) to provide school-based support,
instructional leadership and supervision. These entities will be trained to guide teachers in the teaching of the new
curriculum, the use of assessment to inform instruction, and on inspection and supervision tools. School
management and instructional leadership would be provided through the completion of specific courses (e.g.
online management course)27. Many of the current training modules and systems developed under the USAID
supported Partnership for Learning and UNICEF supported STARS will be extended to GALOP schools. The
implementation of the targeted instruction would be supported by this sub-component including the training,
materials, coaching, and monitoring. This sub-component will be implemented by NTC, NACCA, NIB and GES.
39. For this component, release of IDA and GPE funds would be linked to achievement of the following
tentative Disbursement-Linked Indicators (DLIs):
• Increased number of schools meeting the minimum benchmark for improvement in learning outcomes for
numeracy and literacy
• Increased number of schools awarded performance-based grants based on learning improvements above
the minimum benchmark
Component 3: Strengthen accountability systems for improved decision-making (Estimated cost: US$11
million)
40. Component 3 would support the rollout of an accountability for learning framework, an inspection
dashboard, and learning assessments. This component is expected to be rolled out nationwide.
26 The current annual capitation grant is GHS 10 per pupil; this is divided into a base grant which all schools are provided in the first
term regardless of enrolment, and grants based on enrolment that are provided in the second and third terms Ghana Partnership for
Education Grant project 2012-2016). 27 This course is already being rolled out by the Varkey Foundation with support from DfID.
The World Bank Ghana Accountability for Learning Outcomes Project (P165557)
Dec 03, 2018 Page 21 of 24
41. Sub-component 3.1: Development and implementation of an accountability for learning framework.
The accountability for learning framework would ensure a harmonized system of inspection for all levels of the
education system. Under this sub-component, the following activities would be supported: (a) harmonization of
all inspection tools aligned to meet the needs of schools, districts, regions and Ministry levels; (b) digitization of
tools where possible to ensure more timely collection and analysis of data (e.g., tablet based collection including
lesson observation assessments); (c) continuous and robust communication to stakeholders; and (d) regular
monitoring and reporting on results from inspection findings and dashboard updates.
42. Sub-component 3.2: Creation of an integrated dashboard for real-time data. While Ghana has piloted
the use of various dashboards – i.e., the mobile School Report Card (mSRC) and a dashboard used under the
USAID Partnership for Learning project – this sub-component would aim to build upon these systems by
developing a comprehensive dashboard that would ensure integration of other databases (e.g., EMIS, learning
assessments, etc.). The dashboard will be tailored to the needs of School Heads, Circuit Supervisors and the NIB
to support school inspection and supervision, teacher development and will enable aggregation of real-time data
for decision making. The dashboard will also be accessible to other decision makers at the district, regional and
headquarters levels. This subcomponent would be implemented by MOE in collaboration with GES and NIB.
43. Sub-component 3.3: Development and rollout of a national assessment strategy and implementation
of biennial learning assessments. This sub-component would support the development and rollout of a national
learning assessment strategy and learning assessments every two years. Ghana has numerous learning assessments
– the EGRA and EGMA, the NEA (grades P4 and P6), the BECE (end of JHS) – and has also committed to
participating in the Programme for International Student Assessment (PISA) for Development, which targets 15-
year olds. The Government may consider future participation in the Programme for the Analysis of Education
Systems (PASEC) which targets grade 2, grade 4 and end of primary. The MOE is also planning to introduce a
regularly implemented national, low-cost assessment system that can be administered to every pupil in grades 2,
4, 6 and 8 to be used to provide feedback and better instruction support. The proposed project would initially
support a P4 assessment to ensure baseline data and performance indicators are available to measure results. The
purposes, levels, timeframes, and funding for the various assessments would be carefully thought through, costed
and formalized within a national learning assessment strategy. Capacity building for NaCCA, National
Assessment Unit and MOE would aim to strengthen sustainability of undertaking such assessments. This
subcomponent would be implemented by MOE in collaboration with GES and NaCCA.
44. For this component, release of IDA and GPE funds would be linked to achievement of the following
tentative Disbursement-Linked Indicators (DLIs):
• Accountability for learning framework developed, approved and implemented
• Teacher deployment/rationalization in schools with low number of trained teachers
• Number of schools demonstrating decreased teacher absenteeism based on SRCs and circuit
supervisor’s reports
• National strategy for learning assessments developed, approved and implemented
Component 4: Technical Assistance, institutional strengthening, monitoring, and research (estimated cost:
US$7.4 million)
The World Bank Ghana Accountability for Learning Outcomes Project (P165557)
Dec 03, 2018 Page 22 of 24
45. This component would provide overall support to the other three components; and include two
subcomponents (i) technical assistance for capacity building and on-demand education research/policy analysis;
and (ii) monitoring and evaluation, management, and operational costs.
46. Sub-component 4.1: Technical assistance for capacity building and education research and policy
analysis. This sub-component would fund institutional strengthening/capacity building to supporting the rollout
of the integrated dashboard and the new curriculum, coaching and supervision from the NIB, and the
communications strategy. Under this sub-component, on-demand, high caliber technical assistance for education
research and analysis, including impact evaluations, would also be funded to ensure that the MOE has a robust
body of knowledge they can tap into as and when needed. This is intended to be staffed by individuals who serve
as experts in various areas of education policy and data analysis. The TA would complement staffing and activities
identified under the Reform Secretariat.
47. Sub-component 4.2: Monitoring and evaluation, management and operational costs. This sub-
component would fund all M&E activities conducted at the headquarters, regional and district level, operational
costs, as well as the independent verification of the achievement to the DLIs under the project.
48. Project financing: The proposed project will be financed through a proposed IDA credit of US$45 million
and a proposed GPE grant of US$24.4 million, using the Investment Financing Project with Disbursement Linked
Indicators (IPF with DLIs) lending instrument. Components 1, 2, and 3 will use a Results-Based Financing (RBF)
modality, with disbursements made against selected (eligible) key budget line items of the MOE’s annual budgets
(also referred to as Eligible Expenditure Programs-EEPs), up to a capped absolute amount. Disbursements will
be conditional upon pre-specified results measured by Disbursement-Linked Indicators (DLIs) which will be
detailed at appraisal. A minimum of thirty percent of the GPE grant (or US$7.2 million) is required to be variable;
this portion of the grant must focus on DLIs related to GPE’s themes of equity, efficiency, and learning outcomes.
The MOE is well-versed in an RBF approach, having used this disbursement mechanism for the Secondary
Education Improvement Project (P145741). An RBF approach is advantageous in providing incentives for the
Government to shift the focus from inputs to outcomes. Component 4 would follow a traditional IPF approach.
49. Equity considerations in project design: About one third of schools would be selected to benefit under
the project based on the resources available. The criteria for selection would be informed by the planned ranking
of all schools based on performance as well as covariates of poverty indices of the districts in which they are
located, to ensure that resources are targeted to schools in greatest need. Given the current scope of the ongoing
USAID Partnership for Learning (covering all basic schools in 100 out of 216 districts28), the GALOP under
Components 1 and 2 will aim to cover schools outside this project. With similar interventions targeting early
grade foundational skills, structured pedagogy and technology-based monitoring, the GALOP would help scale
learning interventions. Lessons learned under GPEG, SEIP, USAID, JICA and the UNICEF-supported district
programs have shown the importance of an intervention’s depth relative to its scale which scatters limited
resources. As described earlier, those schools that fall into the low resource group will benefit from more
interventions/support than those that fall into medium resource and high resource. Moreover, low resource schools
would also be provided intermediation to help in preparing their proposals for learning grants to ensure that
schools that have low capacity are not left behind. The project’s focus on early grade education is also equity
enhancing because of the long-term benefits in terms of readiness to learn and improved future learning outcomes.
28 The number of districts in Ghana has been recently increased from 216 to 254 in 2018.
The World Bank Ghana Accountability for Learning Outcomes Project (P165557)
Dec 03, 2018 Page 23 of 24
The learning interventions under Components 1 and 2 are expected to reach approximately 7,000 poorly
performing public basic schools, which represents approximately one third of basic schools. All indicators will
be disaggregated by gender and in schools where gender disparities are pronounced, the SPIPs will focus on
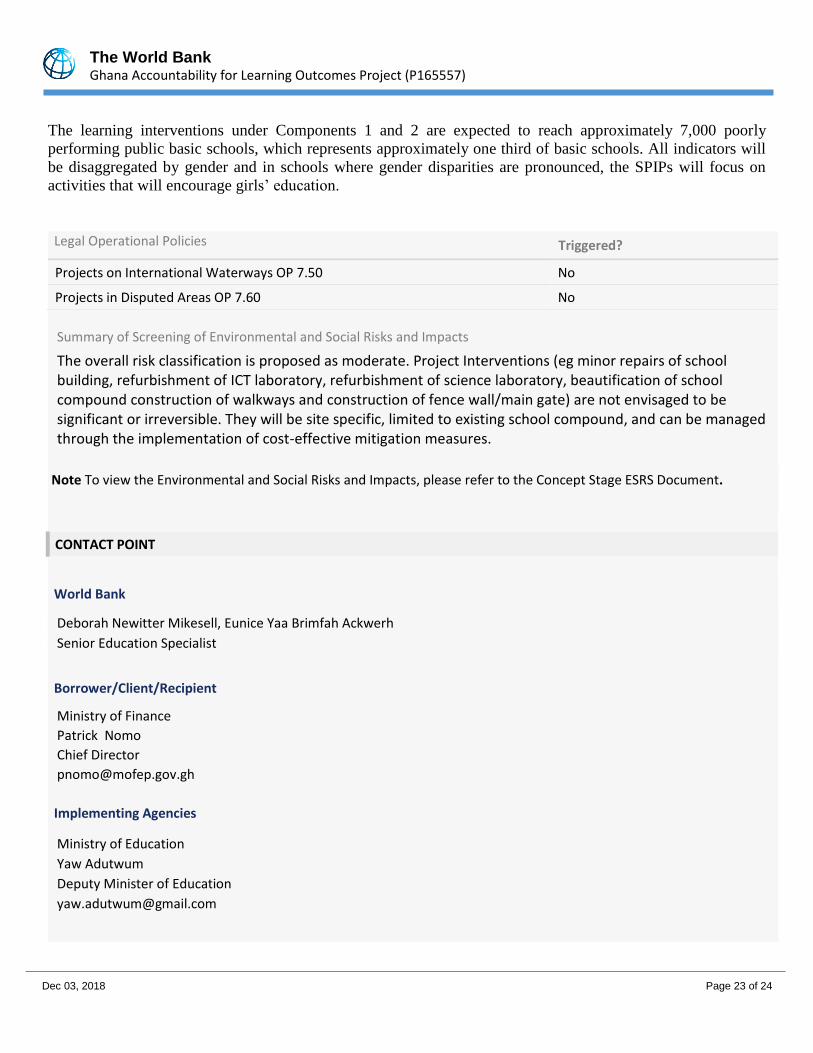
activities that will encourage girls’ education. Legal Operational Policies Triggered?
Projects on International Waterways OP 7.50 No
Projects in Disputed Areas OP 7.60 No
Summary of Screening of Environmental and Social Risks and Impacts
The overall risk classification is proposed as moderate. Project Interventions (eg minor repairs of school building, refurbishment of ICT laboratory, refurbishment of science laboratory, beautification of school compound construction of walkways and construction of fence wall/main gate) are not envisaged to be significant or irreversible. They will be site specific, limited to existing school compound, and can be managed through the implementation of cost-effective mitigation measures.
CONTACT POINT
World Bank
Deborah Newitter Mikesell, Eunice Yaa Brimfah Ackwerh
Senior Education Specialist
Borrower/Client/Recipient
Ministry of Finance
Patrick Nomo
Chief Director
Implementing Agencies
Ministry of Education
Yaw Adutwum
Deputy Minister of Education
Note To view the Environmental and Social Risks and Impacts, please refer to the Concept Stage ESRS Document.
The World Bank Ghana Accountability for Learning Outcomes Project (P165557)
Dec 03, 2018 Page 24 of 24
FOR MORE INFORMATION CONTACT
The World Bank
1818 H Street, NW
Washington, D.C. 20433
Telephone: (202) 473-1000
Web: http://www.worldbank.org/projects
APPROVAL
Task Team Leader(s): Deborah Newitter Mikesell, Eunice Yaa Brimfah Ackwerh
Approved By APPROVALTBL
Practice Manager/Manager:
Country Director: