Embed Size (px)
Citation preview
A 10-year assessment (2010–2019)SIXTH EDITION
Global insecticide use for vector-borne disease control


Global insecticide use for vector-borne disease control A 10-year assessment (2010–2019)
SIXTH EDITION
Global insecticide use for vector-borne disease control: a 10-year assessment (2010–2019), sixth edition
ISBN 978-92-4-003203-3 (electronic version)ISBN 978-92-4-003204-0 (print version)
© World Health Organization 2021
Some rights reserved. This work is available under the Creative Commons Attribution-NonCommercial-ShareAlike 3.0 IGO licence (CC BY-NC-SA 3.0 IGO; https://creativecommons.org/licenses/by-nc-sa/3.0/igo).
Under the terms of this licence, you may copy, redistribute and adapt the work for non-commercial purposes, provided the work is appropriately cited, as indicated below. In any use of this work, there should be no suggestion that WHO endorses any specific organization, products or services. The use of the WHO logo is not permitted. If you adapt the work, then you must license your work under the same or equivalent Creative Commons licence. If you create a translation of this work, you should add the following disclaimer along with the suggested citation: “This translation was not created by the World Health Organization (WHO). WHO is not responsible for the content or accuracy of this translation. The original English edition shall be the binding and authentic edition”.
Any mediation relating to disputes arising under the licence shall be conducted in accordance with the mediation rules of the World Intellectual Property Organization (http://www.wipo.int/amc/en/mediation/rules/).
Suggested citation. Global insecticide use for vector-borne disease control: a 10-year assessment (2010–2019), sixth edition. Geneva: World Health Organization; 2021. Licence: CC BY-NC-SA 3.0 IGO.
Cataloguing-in-Publication (CIP) data. CIP data are available at http://apps.who.int/iris.
Sales, rights and licensing. To purchase WHO publications, see http://apps.who.int/bookorders. To submit requests for commercial use and queries on rights and licensing, see http://www.who.int/about/licensing.
Third-party materials. If you wish to reuse material from this work that is attributed to a third party, such as tables, figures or images, it is your responsibility to determine whether permission is needed for that reuse and to obtain permission from the copyright holder. The risk of claims resulting from infringement of any third-party-owned component in the work rests solely with the user.
General disclaimers. The designations employed and the presentation of the material in this publication do not imply the expression of any opinion whatsoever on the part of WHO concerning the legal status of any country, territory, city or area or of its authorities, or concerning the delimitation of its frontiers or boundaries. Dotted and dashed lines on maps represent approximate border lines for which there may not yet be full agreement. The mention of specific companies or of certain manufacturers’ products does not imply that they are endorsed or recommended by WHO in preference to others of a similar nature that are not mentioned. Errors and omissions excepted, the names of proprietary products are distinguished by initial capital letters.
All reasonable precautions have been taken by WHO to verify the information contained in this publication. However, the published material is being distributed without warranty of any kind, either expressed or implied. The responsibility for the interpretation and use of the material lies with the reader. In no event shall WHO be liable for damages arising from its use.

ContentsAcknowledgements iv
1. Introduction 1
2. Methods 1
3. Survey responses 4
4. Active ingredients 5
5. Insecticide use 8
5.1 All diseases 8
5.2 Malaria 16
5.3 Dengue 20
5.4 Leishmaniasis 22
5.5 Chagas disease 25
5.6 Other vector-borne diseases 26
6. Insecticide-treated nets 27
7. Selected insecticides 30
7.1 Larvicides 30
7.2 DDT 33
7.3 New active ingredients for indoor residual spraying 34
8. Conclusion 36
9. References 38
Annex 1. Data reporting form 41
Annex 2. Annual responses by countries 43
Annex 3. Annual use of insecticides for vector control 49
Global insecticide use for vector-borne disease control
iv
AcknowledgementsThe World Health Organization (WHO) thanks the following people who assisted in the collection and validation of data for this report.
African Region: Ranjith de Alvis (Angola); Anonymous (Benin); Gorata Boithoko and Godira Segoea (Botswana); Yacouba Savadogo (Burkina Faso); Gilbert Ntampuhwe (Burundi); Demba Kodindo Israël (Chad); Anonymous (Côte d’Ivoire); Selam Mihreteab (Eritrea); Zulisile Zulu (Eswatini); Dawit Teshome Akako and Habtamu Berhanu (Ethiopia); Anonymous (Gambia); Anonymous (Ghana); Nambinisoa Andriamananjara, Kiti Eugene and Jean Rakotoson (Madagascar); Anonymous (Mali); Prem Boolaky (Mauritius); Baltazar Candrinho (Mozambique); Hans Angula and Stark Katokele (Namibia); Hadiza Soumaila (Niger); Petrus Inyama and Okeke Joseph (Nigeria); Emmanuel Hakizimana (Rwanda); Mamoudou Wade and Abdoulaye Diop (Senegal); Eunice Misiani (South Africa); Tameklou Agbeko (Togo); Anonymous (Uganda); Charles Mwalimu (United Republic of Tanzania); Rueben Zulu (Zambia); Wilson Chauke and Shadreck Chande (Zimbabwe).
Region of the Americas: Maria Virginia Introini (Argentina); A.C. Thompson (Bahamas); Kim Bautista (Belize); Jose Laura, Favio Rodriguez, José Luis Lara, Carla Romero and Enzo Gamarra (Bolivia, Plurinational State of); Joyce Pereira, Joao de Souza Teixeira and Isaias Teixeira Neto (Brazil); Barbara Hott Harvey (Chile); Jose Fernando Valderrama Vergara, Tania Tibaduiza and Ivan Cárdenas (Colombia); Rodrigo Marín Rodriguez and José Manuel Gutiérrez Alvardo (Costa Rica); Evelyn Martínez Cruz and José Angel Portal Miranda (Cuba); Angel Solis (Dominican Republic); Juliana Solórzano (Ecuador); Rolando Masis López (El Salvador); Kennie James (Grenada); Aida Véliz Sierra and Pedro Marcelino Yax (Guatemala); Govindra Punu and Mohini Sooklall (Guyana); Jesula Leveille (Haiti); Wilberto Montalvan (Honduras); Ruy López Ridaura (Mexico); Carlos Ruiz, Fernando Vizcaino and José Lasso (Panama); Monica Ozorio and Viviana de Egea (Paraguay); Elena Ogusuku (Peru); Naresh Nandram (Trinidad and Tobago); Gabriela Willat (Uruguay).
South-East Asia Region: Shahnila Ferdousi and Sabera Sultana (Bangladesh); Tenzin Wangdi, Sonam Wangdi (Bhutan); Kim Yun Chol (Democratic People’s Republic of Korea); Kalpana Baruah and Roop Kumari (India); Achmad Azhari Naufal (Indonesia); Moosa Haneef, Aishath Thimna Latheef (Maldives); Thet Oo, Badri Thapa, Md. Rahman (Myanmar); Basu Pandey, Usha Kiran (Nepal); M Janaki, Navaratnasingam Janakan, Preshila Samaraweera and Mizaya Cader (Sri Lanka); Pongsakorn Sadakorn and Gopinath Deyer (Thailand); Octavio and Debashish Kundu (Timor-Leste).
European Region: Lusine Paronyan (Armenia); Anonymous (Bosnia and Herzegovina); Marios Violaris (Cyprus); Zhanna Shapiyeva (Kazakhstan); Nebojsa Sekulic (Montenegro); Nikolina Sokolovska (North Macedonia); Anonymous (Republic of Moldova).
Eastern Mediterranean Region: Abdul Ali Ahmadi (Afghanistan); Raja Al Salloom (Bahrain); Mohamed Abdoulkader Guelleh (Djibouti); Hameeda M. Hassan (Iraq); Fatemeh Nikpour (Islamic Republic of Iran); Khalil Kanani and Nizar Maswadi (Jordan); Samia Salem Al Dabeekh (Kuwait); Najib Aachi and Bassel El Bazzal (Lebanon); Herrak Tachfine and Btissam Ameur (Morroco); Khalifa Salim

A 10-year assessment (2010–2019) – Sixth edition
v
Alghusaini and Osama Mahmoud (Oman); Muhammad Mukhtar (Pakistan); Mohamed Alzahrani and Mohammed Al Helal (Saudi Arabia); Said Dahir Ali, Jeylani Busuri Mayow, Hassan Mohamed Jimale and Abdihafidh Yassin (Somalia); Hmooda Kafy, Almustafa Abubaker and Mohamed Elmonshawi (Sudan); Ayman Alkhatib and Atef Al Tawil (Syrian Arab Republic); Jabeur Daaboub and Lamia Somai (Tunisia); Shamsideen Kolawole (United Arab Emirates); Adel Al-Yassari, Adel Al-Jassari, Mohammed Esmail and Yassar Baheshm (Yemen).
Western Pacific Region: Siv Sovannaroth (Cambodia); Qiyong Lui (China); Litia Vatuvoka (Fiji); Santi Maithaviphet (Lao People’s Democratic Republic); Hugo Bugoro (Solomon Islands); Tran Quang Phuc (Viet Nam).
The following staff of WHO regional and country offices are gratefully acknowledged for facilitating data collection.
Haroldo Sergio da Silva Bezerra and Dennis Navarro Costa (WHO Regional Office for the Americas), Samira Al-Eryani (WHO Regional Office for the Eastern Mediterranean), Emmanuel Chanda (WHO Regional Office for Africa), Bhupender N. Nagpal (WHO Regional Office for South-East Asia), Elkhan Gasimov (WHO Regional Office for Europe), Aya Yajima (WHO Regional Office for the Western Pacific) and Tessa B. Knox (WHO Country Office, Vanuatu). John E. Milliner is thanked for extracting and providing data on use of insecticides in treated nets.
The study and data collection were led by Rajpal S. Yadav and Raman Velayudhan (WHO Department of Control of Neglected Tropical Diseases). Henk van den Berg (consultant, Wageningen University, Netherlands) processed and analysed the data and drafted and revised the report, in association with Rajpal S. Yadav. Valuable comments on the draft report were provided by Jan Kolaczinski (WHO Global Malaria Programme), Tessa Knox, Haroldo Sergio da Silva Bezerra and Samira Al-Eryani.
The study was conducted as part of a WHO project supported financially by the Bill & Melinda Gates Foundation, Seattle (WA), United States of America.

Global insecticide use for vector-borne disease control
vi

A 10-year assessment (2010–2019) – Sixth edition
1
1. Introduction
Vector-borne diseases continue to be a major burden among affected communities around the world, predominantly in tropical and subtropical regions (1, 2). The main vector-borne diseases are malaria, dengue, leishmaniasis, Chagas disease, lymphatic filariasis, onchocerciasis, Zika virus disease, yellow fever, Japanese encephalitis and schistosomiasis. These diseases are caused by pathogens that are transmitted to or between humans by mosquitoes, sandflies, triatomine bugs, blackflies and snails. Some disease pathogens are transmitted to humans by fleas, ticks and tsetse flies, and various enteric disease pathogens are transmitted mechanically by flies.
Control of these disease vectors is intended to break the cycle of their transmission. Vector surveillance and control have made a major contribution to the control or elimination of many vector-borne diseases (3, 4). For certain diseases for which effective vaccines or medications are lacking, vector control is the only practicable option for prevention or control. Insecticides have been the mainstay of vector control by killing immature stages or adults or otherwise preventing human biting by vector species.
The Global Vector Control Response 2017–2030 was launched as a comprehensive approach to vector control to counter the impact of vector-borne diseases (1). A key aspect of the response is efficient, efficacious deployment of vector surveillance and control interventions while ensuring management of insecticide resistance and minimizing the adverse effects of pesticides on health and the environment, in accordance with the International Code of Conduct on Pesticide Management (5). A recent global survey, however, showed shortcomings in pesticide life cycle management in all WHO regions (6), including inadequate regulation and quality control of insecticides; shortcomings were also identified in monitoring insecticide resistance, safety measures, storage conditions and waste disposal.
Up-to-date information on the use and impact of insecticides for vector control is essential for evaluating strategies for the control or elimination of vector-borne diseases and pesticide management. Of particular concern is the development of insecticide resistance in vector populations (7, 8), and programmes must adopt strategies for informed selection or application of vector control products or introduction of alternative approaches. In the past decade, various new vector control interventions became available for public health purposes. WHO’s prequalification programme ensures that good-quality vector control products for indoor residual spraying, long-lasting insecticidal nets, space spraying and larviciding are available to those who need them by prescribing uniform standards of efficacy, safety and quality (9). The degree of compliance with these international standards in terms of selection and use of insecticide products is an indicator of the efficacy and safety of vector control interventions.
Data on insecticide use are also required for elaboration or amendment of international agreements, notably the Stockholm Convention on Persistent Organic Pollutants (10), the

Global insecticide use for vector-borne disease control
2
Basel Convention on the Control of Transboundary Movements of Hazardous Wastes and their Disposal (11), the Rotterdam Convention on the Prior Informed Consent Procedure for Certain Hazardous Chemicals and Pesticides in International Trade (12) and a resolution of the International Conference of Chemicals Management on highly hazardous pesticides (13).
WHO published data on the global use of insecticides for the control of vector-borne diseases in several biannual updates (14–17). In 2011, a more comprehensive global assessment was conducted of insecticide use in targeted countries covering the 10-year period 2000–2009 (18). The purpose of this document is to report the use of vector control insecticides over the period 2010–2019 in order to inform decision-making on vector control and insecticide resistance management and to inform the public about use of insecticides in public health. Comparisons are made with the period 2000–2009.

A 10-year assessment (2010–2019) – Sixth edition
1
2. Methods
Data collection. A simple data reporting form, identical to that used for the assessment in 2010, elicited information: year, “compound or product name”, formulation, concentration, “type of application”, “for control of” and the amounts of formulated product and of active ingredient used (in kg or L; Annex 1). The reporting form, in English, French and Spanish, was sent to vector control focal persons at the six WHO regional offices, who distributed the form to the WHO country offices in targeted countries. From those offices, the form was sent to the focal point in the country’s ministry of health for completion by the manager of the main national vector-borne disease control programme (e.g. malaria, dengue) or (when applicable) by the person with overall responsibility for entomological surveillance and vector control in the country. The survey was conducted in two phases, first in 2015, to cover data for 2010–2014, and again in 2020, to cover data for 2010–2019. Where necessary, responding countries were asked for clarifications about the data they had provided.
The countries targeted for the survey were WHO Member States (territories excluded) that were at significant risk or had a significant burden of vector-borne diseases (see Annex 2). In the regions of the Americas and the Western Pacific, all countries were targeted except Australia, Canada, Japan, New Zealand, the Republic of Korea and the USA. In the European Region, countries were targeted according to their overall risk and burden of vector-borne diseases, including leishmaniasis, West Nile virus and Lyme disease. These were: Albania, Armenia, Azerbaijan, Bosnia and Herzegovina, Bulgaria, Croatia, Cyprus, France, Georgia, Greece, Hungary, Israel, Italy, Kazakhstan, Kyrgyzstan, Montenegro, North Macedonia, Portugal, Republic of Moldova, Romania, Russian Federation, Serbia, Spain, Switzerland, Tajikistan, Turkey and Ukraine; all other countries in the European Region were excluded. It is acknowledged that some of the countries that were excluded might have been conducting activities to counter recent threats of invasive mosquito vectors and re-emerging vector-borne diseases that might have included insecticide use. In total, 164 countries were targeted, with a total population of 6.796 billion (Table 1); population data per country for 2019 were used (19), as presented in Annex 2.
Data on insecticide-treated nets (ITNs) were not obtained from the global survey but from a dataset compiled through the Net Mapping Project,1 which represent the total global annual amounts of insecticide used in manufacture of ITNs outside of factories. The actual number of nets covered in our estimate might have been different from the numbers distributed in communities.
Data processing. The survey data were entered onto an electronic spreadsheet and analysed by descriptive statistics. The amounts of insecticides in formulated products were converted to kg of active ingredient from the information provided on concentrations of the formulated product.
1 Data source: J. Milliner (personal communication to WHO, 2020) for data compiled for the Net Mapping Project (https://allianceformalariaprevention.com/working-groups/net-mapping-project/). Data for individual brands of long-lasting insecticidal nets delivered were anonymized and pooled to maintain commercial confidentiality.

Global insecticide use for vector-borne disease control
2
It was assumed that 1 mL of formulated product was equal to 1 g. For the bacterial larvicide Bacillus thuringiensis israelensis, the concentrations of formulated products were calculated with a WHO reference standard (20).
Not all the targeted countries responded to the survey, and, of those that responded, not all provided a complete report for all years (2010–2019). To estimate the total use of insecticides in all the targeted countries, the reported data were divided by a weighting factor consisting of the total population of the countries that responded in a certain year by the total population of the targeted countries. Hence, a weighting factor was calculated separately for each year. Publicly available population data for 2019 were used in the calculations (19). When data were pooled to obtain averages over the period 2010–2019, the weighting factor was applied to each year’s data before pooling, unless specified otherwise.
Most countries indicated product usage by disease; however, some indicated use of an active ingredient against more than one disease and did not provide the amounts separately for each disease. In these cases, it was assumed that the same amounts were used for each of the reported diseases. For example, when 600 kg of deltamethrin were reported to have been used against malaria and dengue, it was assumed that 300 kg of each were used for each disease. Use of mineral oils as larvicides and repellents, which were reported sporadically by some countries, was excluded from the analyses.
Countries were grouped according to the six WHO regions.
Insecticide classes. Vector control insecticides were divided into the following classes: organochlorines, organophosphates, carbamates, pyrethroids, bacterial larvicides, insect growth regulators and novel classes such as neonicotinoids, spinosyns and pyrroles. The first four classes listed are referred to below as “conventional” insecticide classes. Most classes have broad-spectrum effects on organisms, including non-target organisms, while bacterial larvicides and insect growth regulators are more specific to targeted organisms.
Insecticide formulations and concentrations. Insecticide products are manufactured in various formulations according to the use and intervention type (Annex 1). The concentration of formulated products was used to calculate the amount of active ingredient, assuming 1 L equals 1 kg. All insecticide amounts in this document are given in metric tonnes (t) of active ingredient.
Application rate. When comparing volumes of insecticides used, it is important to keep in mind the rate at which they are applied in the field. The recommended rates of application ranged from 0.0225 to 2 g/m2 for use in indoor residual spraying. Pyrethroids are highly potent insecticides, and low application rates are recommended, e.g. 0.025 g/m2 for α-cypermethrin and λ-cyhalothrin and 0.0225 g/m2 for deltamethrin (21). The recommended rates of application of organochlorines are 1.5 g/m2 (average of 1–2 g/m2) for DDT, 0.4–1.5 g/m2 for carbamates and 1–2 g/m2 for organophosphates (21). Consequently, 1 kg of active ingredient of λ-cyhalothrin would achieve the same spray coverage as 60 kg of DDT when both are applied at their recommended rates.
Intervention type. The major types of methods by which insecticides are applied are: residual spraying, space spraying, ITNs, treatment of nets (ITN-kits) and larviciding (22). Residual spraying

A 10-year assessment (2010–2019) – Sixth edition
3
can be conducted indoors or outdoors. Indoor residual spraying consists of application of residual insecticide products on indoor surfaces (e.g. walls) to kill vectors landing or resting on those surfaces; it is commonly used against indoor-resting mosquitoes, sandflies and triatomine bugs for control of malaria, arbovirus diseases (e.g. dengue, chikungunya, Zika virus disease), leishmaniasis and Chagas disease. Outdoor residual spraying, commonly referred to as “perifocal treatment”, consists of spraying the surfaces of breeding containers, with or without standing water, for a combination of larvicidal and adulticidal effects on dengue vectors (23). For this report, data on indoor residual spraying and perifocal spraying were combined as “residual spraying”, although perifocal treatment comprised less than 1% of residual spraying. Space spraying, or fogging, produces insecticide-containing droplets that are small enough to remain airborne for some time (24) and are intended to cause a quick knock-down effect on flying or resting mosquito vectors upon direct contact. As low doses of chemical insecticides are used for space spraying, it does not leave a meaningful deposit that could have a residual effect (25). Space spraying has been commonly used for the control of dengue outbreaks because of its efficacy against vector species, despite lack of evidence of its effectiveness (26, 27). For this report, space spraying includes thermal fogging, cold fogging and ultra-low volume application, both outdoors and indoors.
ITNs are mosquito nets that repel, disable or kill mosquitoes that come into contact with the insecticide on the netting material (28). Factory-treated ITNs include pyrethroid-only long-lasting insecticidal nets, pyrethroid–piperonyl butoxide nets and dual-insecticide nets. In this report, conventionally treated nets, which are nets that are periodically treated by the users, are considered separately; the insecticides used for treating the nets are referred to as “ITN-kits”. Hence, ITN-kits (or treatment of nets) refer to WHO-recommended insecticide kits used for periodic treatment of mosquito nets by dipping the nets in insecticide. Larviciding is the use of insecticides to treat aquatic breeding sites of vectors. Other types of insecticide use include application of repellents on human skin (e.g. against mosquitoes, ticks), baits (e.g. against flies, rodents), dusting (e.g. against lice or fleas) and insecticide-treated clothing (22). These minor types of application accounted for less than 0.1% of the total reported vector control insecticide use and were therefore excluded from the final analysis.
Limitations. A limitation of this study was that several at-risk countries did not respond to the survey. A weighting factor was used to estimate the insecticide use by all countries; however, the results might be slight overestimates if countries with low insecticide use were less likely to respond. Furthermore, the assumption made about insecticide use against multiple diseases may have reduced the accuracy of results. Another possible limitation of the study was that the respondents to the survey might not have had access to all data on insecticide use for vector control, particularly in areas in which programmes were implemented by the private sector, nongovernmental organizations or decentralized subnational (e.g. district or municipality) health services, or where there was attrition of vector control staff and poor institutional retention of records of insecticide use. Furthermore, the data on ITN deliveries to countries may not reflect the numbers of ITNs distributed to communities in any given year because of distribution delays and stock retention.

Global insecticide use for vector-borne disease control
4
3. Survey responses
Out of 164 countries targeted for the survey, 92 provided data on insecticide use data one or more years during the period (Table 1). Annex 2 gives a complete list of the countries that responded, by year. The numbers of responding countries per region were 28 for the African, 22 for the Americas, 18 for the Eastern Mediterranean, 7 for the European, 11 for the South-East Asia and 6 for the Western Pacific regions. The country response rate was highest in the South-East Asia Region (100%) and lowest among targeted countries in the European Region (24%). In total, the country response rate was 56%.
Table 1. Numbers of countries targeted and numbers that responded to the survey
WHO regionNumber of countries
Targeted Responded Response rateAfrican 47 28 60%Americas 33 22 67%
Eastern Mediterranean 21 18 86%
European 29 7 24%South-East Asia 11 11 100%Western Pacific 23 6 26%All 164 92 56%
The annual weighting factor, which was obtained by dividing the total population of the responding countries by the total population of the targeted countries, ranged from 0.80 in 2010 to 0.70 in 2019 (Table 2). The annual weighting factor was used to estimate the total use of insecticides in all targeted countries. The two most populous countries (China and India) were among those which responded, while many countries that did not respond have relatively small populations. Consequently, the annual weighting factor was higher than the country response rate.
Table 2. Annual weighting factors (responding country population divided by the targeted country population)
ItemYear
2010 2011 2012 2013 2014 2015 2016 2017 2018 2019Responding country population (millions) 5459 5440 5313 5448 5358 5211 5051 5103 4919 4770
Targeted country population (millions) 6796 6796 6796 6796 6796 6796 6796 6796 6796 6796
Weighting factor 0.803 0.800 0.782 0.802 0.788 0.767 0.743 0.751 0.724 0.702

A 10-year assessment (2010–2019) – Sixth edition
5
4. Active ingredients
A variety of insecticide active ingredients were used for disease vector control during the period 2010–2019 (Table 3). By far the most often used active ingredient by weight globally was DDT, which was used in the African and South-East Asia regions. The second most frequently used was malathion, mainly in the Americas; the third was pirimiphos-methyl, used predominantly in the African Region. The next most frequently used active ingredients were two carbamates, propoxur and bendiocarb, with the highest use in the African and Americas regions, and the organophosphate chlorpyrifos, used predominantly in the Americas.
Table 3. Active ingredients ranked by weight, from the most frequently used compound, and the annual amounts used in vector control spraying (diseases combined) per region. Data are expressed in metric tonnes (t) of active ingredient and were weighted and pooled for the period 2010–2019.
Rank Active ingredientInsecticide
class
WHO region
All African Americas
Eastern Mediter-ranean European
South-East Asia
Western Pacific
1 DDT OC 3313.8 337.1 0.0 0.0 0.0 2976.7 0.02 Malathion* OP 942.0 0.1 868.2 0.1 0.3 73.2 0.1
3 Pirimiphos-methyl* OP 406.0 387.5 17.2 0.0 0.0 1.3 0.0
4 Propoxur C 354.3 168.2 180.3 0.0 0.0 0.0 5.85 Bendiocarb* C 322.8 166.6 106.6 46.7 0.0 2.8 0.06 Chlorpyrifos OP 153.6 0.0 147.9 0.0 0.3 0.0 5.47 Temephos* OP 92.3 2.6 54.4 14.4 0.0 17.9 3.0
8Bacillus thuringiensis israelensis*
BL 81.8 0.1 41.4 2.4 0.2 36.6 1.2
9 Deltamethrin* PY 50.5 17.0 16.5 9.4 0.0 6.6 1.110 Clothianidin* NN 35.7 34.5 0.0 1.2 0.0 0.0 0.011 α-Cypermethrin* PY 34.3 1.0 12.2 2.9 0.0 16.4 1.812 λ-Cyhalothrin* PY 31.2 15.8 3.0 1.4 0.0 4.4 6.713 Permethrin PY 27.3 0.0 16.5 7.2 0.0 0.0 3.514 Cypermethrin PY 25.8 0.1 17.9 0.1 0.0 1.1 6.715 Spinosad* SP 15.8 0.0 10.3 5.5 0.0 0.0 0.016 Phoxim OP 12.4 0.0 0.0 0.0 0.0 0.0 12.417 Diflubenzeron* IGR 9.9 0.1 5.0 4.1 0.0 0.7 0.018 Fenitrothion OP 9.5 0.0 9.5 0.0 0.0 0.0 0.019 Pyriproxyfen* IGR 9.2 0.0 8.0 1.2 0.0 0.0 0.0
Global insecticide use for vector-borne disease control
6
Rank Active ingredientInsecticide
class
WHO region
All African Americas
Eastern Mediter-ranean European
South-East Asia
Western Pacific
20 β-Cypermethrin PY 6.8 0.0 0.0 0.0 0.0 0.0 6.821 Dichlorvos OP 6.3 0.0 6.3 0.0 0.0 0.0 0.022 Etofenprox* PY 6.1 0.3 4.2 1.4 0.0 0.2 0.023 Phenothrin PY 3.0 0.0 3.0 0.0 0.0 0.0 0.024 Cyphenothrin* PY 2.7 0.0 0.0 2.0 0.0 0.7 0.025 Fenthion OP 2.9 0.0 0.1 0.6 0.1 0.0 2.126 Bifenthrin* PY 2.3 0.0 1.9 0.1 0.0 0.2 0.027 Bacillus sphaericus* BL 2.1 0.0 1.7 0.0 0.0 0.0 0.428 β-Cyfluthrin PY 1.3 0.0 0.0 0.0 0.0 0.0 1.329 Cyfluthrin PY 1.1 0.0 0.0 0.5 0.0 0.5 0.030 Novaluron* IGR 0.6 0.0 0.6 0.0 0.0 0.0 0.0
31 Permethrin-allethrin PY 0.5 0.0 0.0 0.0 0.0 0.0 0.5
32 Pyrethrum PY 0.4 0.0 0.0 0.0 0.0 0.4 0.033 Imidacloprid* NN 0.3 0.0 0.3 0.0 0.0 0.0 0.0
34 D-tetramethrin + cyphenothrin PY 0.3 0.0 0.0 0.0 0.0 0.3 0.0
35 Chlorpyrifos-ethyl OP 0.2 0.2 0.0 0.0 0.0 0.0 0.036 Tetramethrin PY 0.2 0.0 0.0 0.0 0.0 0.0 0.237 Transfluthrin IGR 0.2 0.0 0.2 0.0 0.0 0.0 0.038 Methoprene IGR 0.1 0.0 0.0 0.1 0.0 0.0 0.039 Diazinon OP 0.1 0.0 0.0 0.0 0.0 0.0 0.140 Dimethoate OP 0.0 0.0 0.0 0.0 0.0 0.0 0.0
BL, bacterial larvicides; C, carbamates; IGR, insect growth regulators; NN, neonicotinoids; OC, organochlorines; OP, organophosphates; PY, pyrethroids; SP, spinosyns
* Active ingredients one or more of which had been prequalified by WHO, as of November 2020.
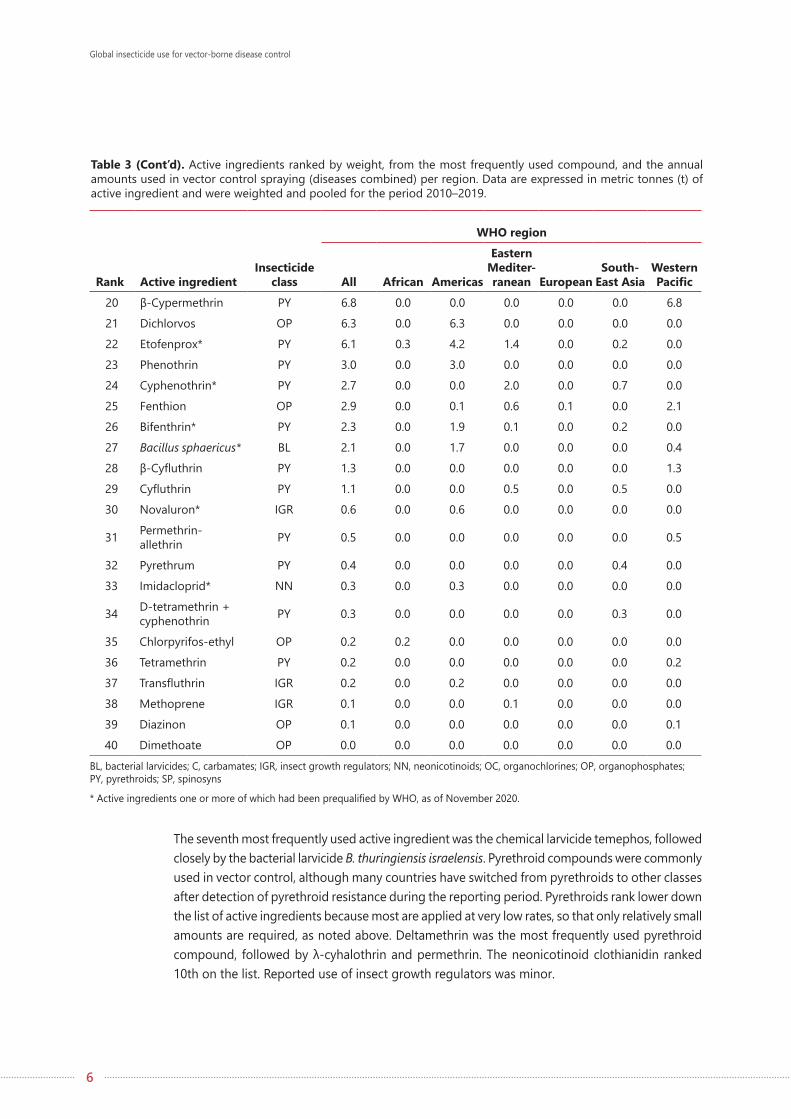
The seventh most frequently used active ingredient was the chemical larvicide temephos, followed closely by the bacterial larvicide B. thuringiensis israelensis. Pyrethroid compounds were commonly used in vector control, although many countries have switched from pyrethroids to other classes after detection of pyrethroid resistance during the reporting period. Pyrethroids rank lower down the list of active ingredients because most are applied at very low rates, so that only relatively small amounts are required, as noted above. Deltamethrin was the most frequently used pyrethroid compound, followed by λ-cyhalothrin and permethrin. The neonicotinoid clothianidin ranked 10th on the list. Reported use of insect growth regulators was minor.
Table 3 (Cont’d). Active ingredients ranked by weight, from the most frequently used compound, and the annual amounts used in vector control spraying (diseases combined) per region. Data are expressed in metric tonnes (t) of active ingredient and were weighted and pooled for the period 2010–2019.
A 10-year assessment (2010–2019) – Sixth edition
7
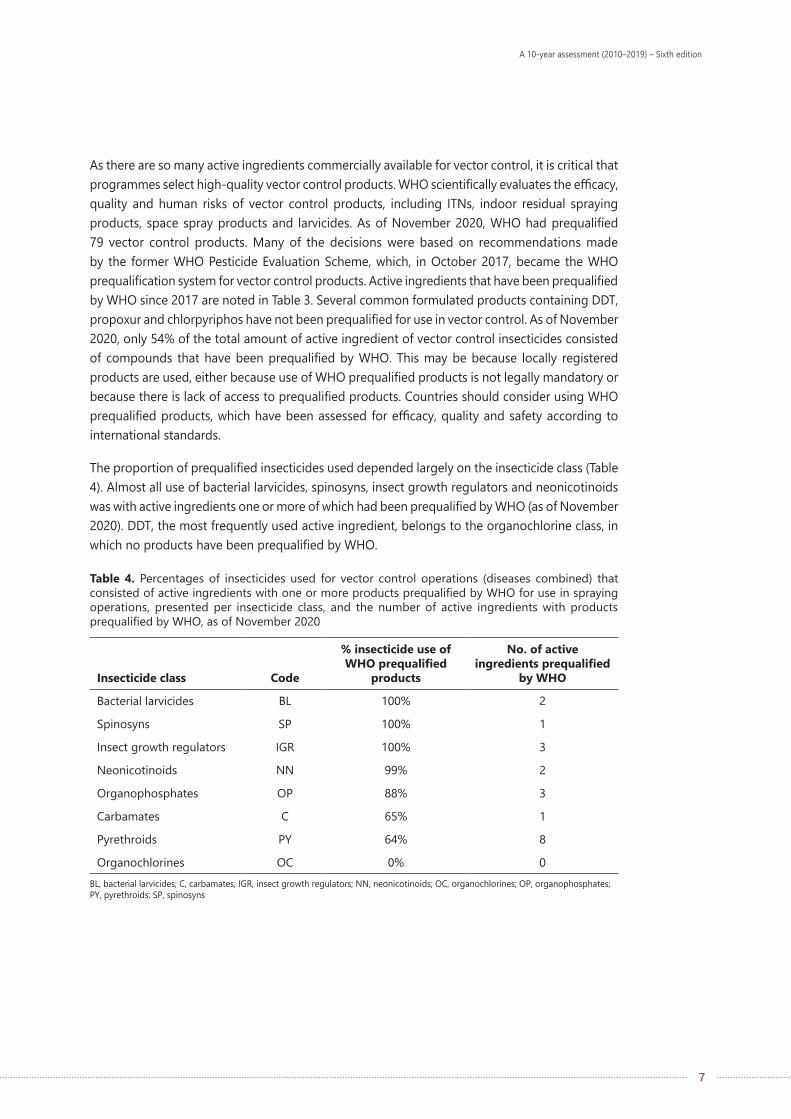
As there are so many active ingredients commercially available for vector control, it is critical that programmes select high-quality vector control products. WHO scientifically evaluates the efficacy, quality and human risks of vector control products, including ITNs, indoor residual spraying products, space spray products and larvicides. As of November 2020, WHO had prequalified 79 vector control products. Many of the decisions were based on recommendations made by the former WHO Pesticide Evaluation Scheme, which, in October 2017, became the WHO prequalification system for vector control products. Active ingredients that have been prequalified by WHO since 2017 are noted in Table 3. Several common formulated products containing DDT, propoxur and chlorpyriphos have not been prequalified for use in vector control. As of November 2020, only 54% of the total amount of active ingredient of vector control insecticides consisted of compounds that have been prequalified by WHO. This may be because locally registered products are used, either because use of WHO prequalified products is not legally mandatory or because there is lack of access to prequalified products. Countries should consider using WHO prequalified products, which have been assessed for efficacy, quality and safety according to international standards.
The proportion of prequalified insecticides used depended largely on the insecticide class (Table 4). Almost all use of bacterial larvicides, spinosyns, insect growth regulators and neonicotinoids was with active ingredients one or more of which had been prequalified by WHO (as of November 2020). DDT, the most frequently used active ingredient, belongs to the organochlorine class, in which no products have been prequalified by WHO.
Table 4. Percentages of insecticides used for vector control operations (diseases combined) that consisted of active ingredients with one or more products prequalified by WHO for use in spraying operations, presented per insecticide class, and the number of active ingredients with products prequalified by WHO, as of November 2020
Insecticide class Code
% insecticide use of WHO prequalified
products
No. of active ingredients prequalified
by WHO
Bacterial larvicides BL 100% 2
Spinosyns SP 100% 1
Insect growth regulators IGR 100% 3
Neonicotinoids NN 99% 2
Organophosphates OP 88% 3
Carbamates C 65% 1
Pyrethroids PY 64% 8
Organochlorines OC 0% 0BL, bacterial larvicides; C, carbamates; IGR, insect growth regulators; NN, neonicotinoids; OC, organochlorines; OP, organophosphates; PY, pyrethroids; SP, spinosyns
Global insecticide use for vector-borne disease control
8
5. Insecticide use
5.1 All diseases
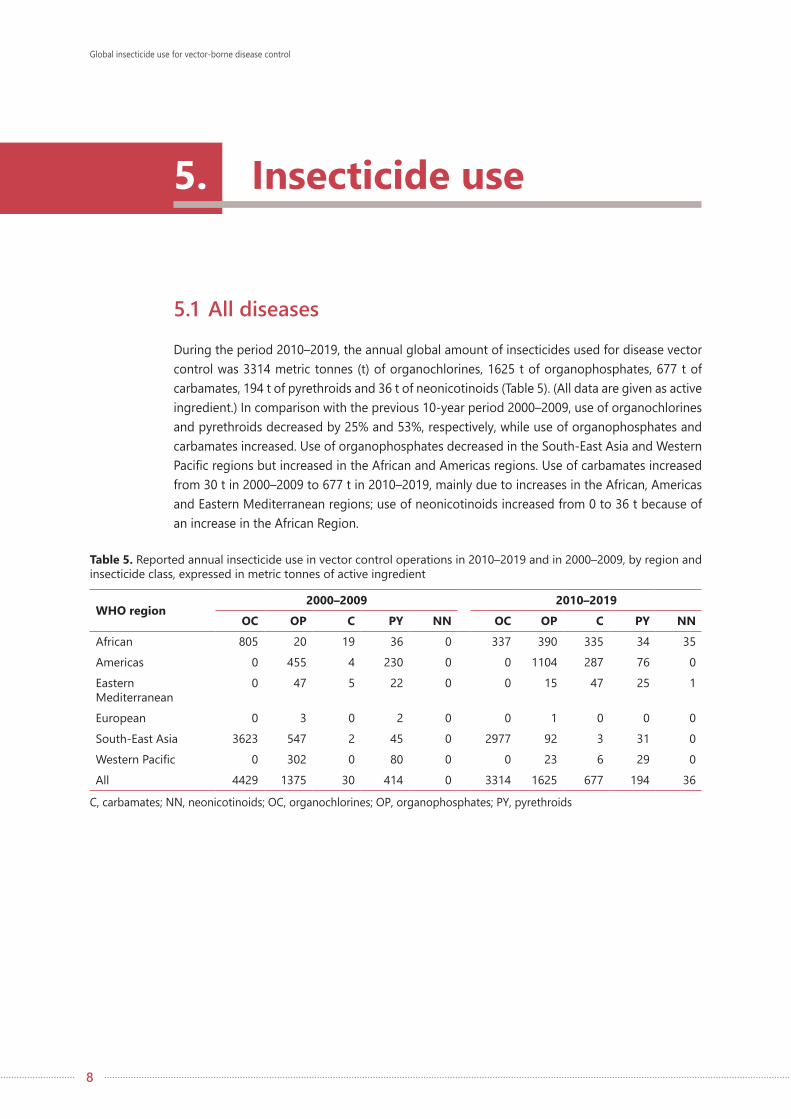
During the period 2010–2019, the annual global amount of insecticides used for disease vector control was 3314 metric tonnes (t) of organochlorines, 1625 t of organophosphates, 677 t of carbamates, 194 t of pyrethroids and 36 t of neonicotinoids (Table 5). (All data are given as active ingredient.) In comparison with the previous 10-year period 2000–2009, use of organochlorines and pyrethroids decreased by 25% and 53%, respectively, while use of organophosphates and carbamates increased. Use of organophosphates decreased in the South-East Asia and Western Pacific regions but increased in the African and Americas regions. Use of carbamates increased from 30 t in 2000–2009 to 677 t in 2010–2019, mainly due to increases in the African, Americas and Eastern Mediterranean regions; use of neonicotinoids increased from 0 to 36 t because of an increase in the African Region.
Table 5. Reported annual insecticide use in vector control operations in 2010–2019 and in 2000–2009, by region and insecticide class, expressed in metric tonnes of active ingredient
WHO region2000–2009 2010–2019
OC OP C PY NN OC OP C PY NNAfrican 805 20 19 36 0 337 390 335 34 35Americas 0 455 4 230 0 0 1104 287 76 0Eastern Mediterranean
0 47 5 22 0 0 15 47 25 1
European 0 3 0 2 0 0 1 0 0 0South-East Asia 3623 547 2 45 0 2977 92 3 31 0Western Pacific 0 302 0 80 0 0 23 6 29 0All 4429 1375 30 414 0 3314 1625 677 194 36
C, carbamates; NN, neonicotinoids; OC, organochlorines; OP, organophosphates; PY, pyrethroids

A 10-year assessment (2010–2019) – Sixth edition
9
Most insecticides were used by residual spraying, followed by space spraying and larviciding (Table 6). Organochlorines were used only for residual spraying, and DDT was the only compound used. Organochlorine use was concentrated in the South-East Asia Region and, to a lesser extent, the African Region. Use of organophosphates, carbamates, pyrethroids and neonicotinoids for residual spraying was highest in the African Region. Residual spraying was predominantly indoors, with less than 1% for outdoor use. Space spraying with organophosphates, carbamates and pyrethroids was by far the highest in the Americas. Use of ITN-kits for treatment of conventional nets was minimal during the study period. Similar amounts of organophosphates and bacterial larvicides were used for larviciding in 2010–2019, while use of spinosyns and insect growth regulators was substantially lower.
Table 6. Annual use of insecticides for vector control by spraying, by region, type of application and insecticide class, expressed in metric tonnes of active ingredient
WHO regionResidual spraying Space spraying ITN-kits Larviciding
OC OP C PY NN OP C PY NN PY OP BL IGR SPAfrican 337 388 335 34 35 0 0 0 0 0 3 0 0 0
Americas 0 6 253 31 0 1040 34 45 0 0 58 43 14 10Eastern Mediterranean
0 0 47 14 1 0 0 11 0 0 15 2 5 5
European 0 1 0 0 0 0 0 0 0 0 0 0 0 0South-East Asia
2977 62 3 26 0 13 0 5 0 0 18 37 1 0
Western Pacific
0 1 5 11 0 17 0 15 0 2 5 2 0 0
All 3314 457 643 116 36 1070 34 76 0 2 99 84 20 16BL, bacterial larvicides; C, carbamates; IGR, insect growth regulators; NN, neonicotinoids; OC, organochlorines; OP, organophosphates; PY, pyrethroids; SP, spinosyns
Fig. 1 illustrates annual global use of the four conventional insecticide classes for vector control (organochlorine, organophosphate, carbamate and pyrethroid) in 2010–2019 and 2000–2009. Annual data indicate a gradual decrease in use of organochlorines during the past two decades, an increase in use of organophosphates and a temporary peak in use of carbamates around 2014 (due to high reported use in one country, Mexico). Use of pyrethroids has decreased gradually, but, as they are generally applied at much lower rates than other insecticides, they still constituted an important share of total insecticide use for vector control. The use of pyrethroids is shown only for spraying operations and does not include use in factory-treated ITNs (see section 8).

Global insecticide use for vector-borne disease control
10
Fig. 1. Annual global use of insecticides for vector control (all diseases combined), by insecticide class: (A) organochlorines, organophosphates and carbamates; (B) pyrethroids
0
1000
2000
3000
4000
5000
6000
7000
2000
2001
2002
2003
2004
2005
2006
2007
2008
2009
2010
2011
2012
2013
2014
2015
2016
2017
2018
2019
Organochlorines
Organophosphates
Carbamates
0
200
400
600
800
1000
1200
1400
1600
2000
2001
2002
2003
2004
2005
2006
2007
2008
2009
2010
2011
2012
2013
2014
2015
2016
2017
2018
2019
Year
B
A
Pyrethroids
Met
ric to
nnes
(a.i.)
Met
ric to
nnes
(a.i.)
a.i., active ingredient
A 10-year assessment (2010–2019) – Sixth edition
11
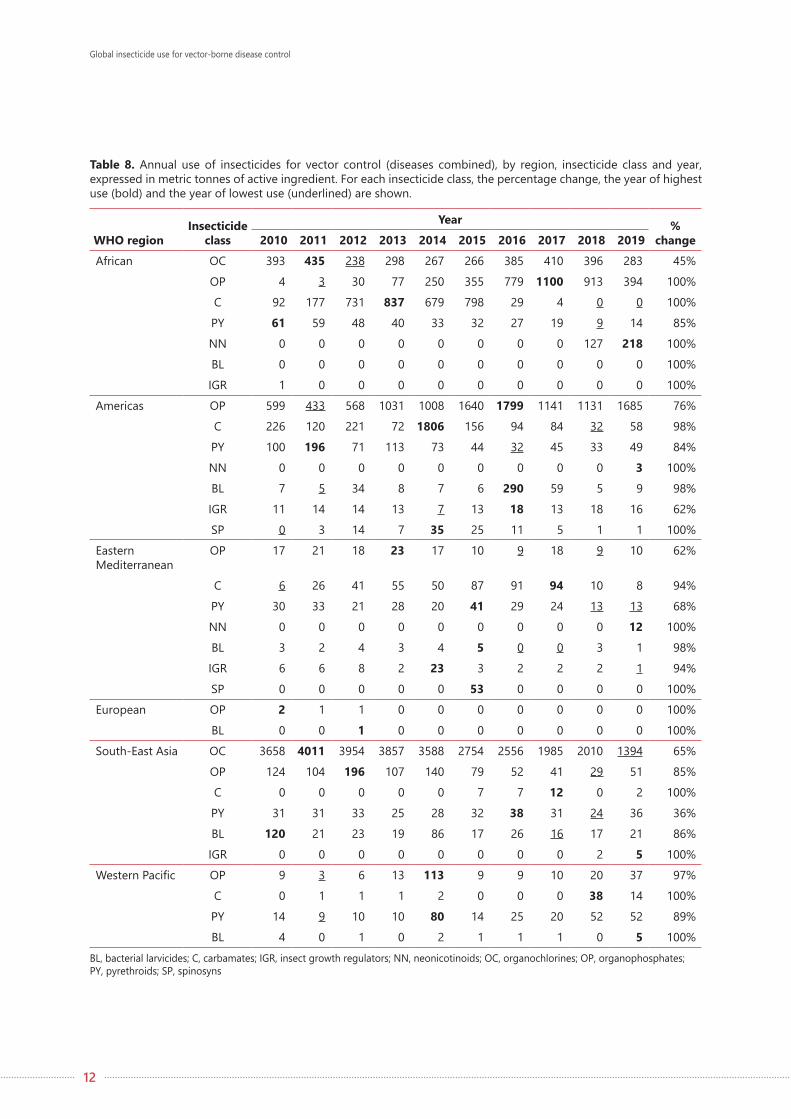
Table 8 shows annual use in each WHO region. The increase in use of organophosphates and temporary increase in use carbamates in the African Region are clearly seen. The Region also showed a gradual decrease in the use of pyrethroids and recent adoption of neonicotinoids (clothianidin as the only active ingredient, with two prequalified products). In the Americas, the use of organophosphates increased, but that of carbamates and pyrethroids decreased. In South-East Asia, there was a substantial decrease in the use of the organochlorine DDT and a smaller decrease in the use of organophosphates; this Region reported the highest use of bacterial larvicides of all the regions.
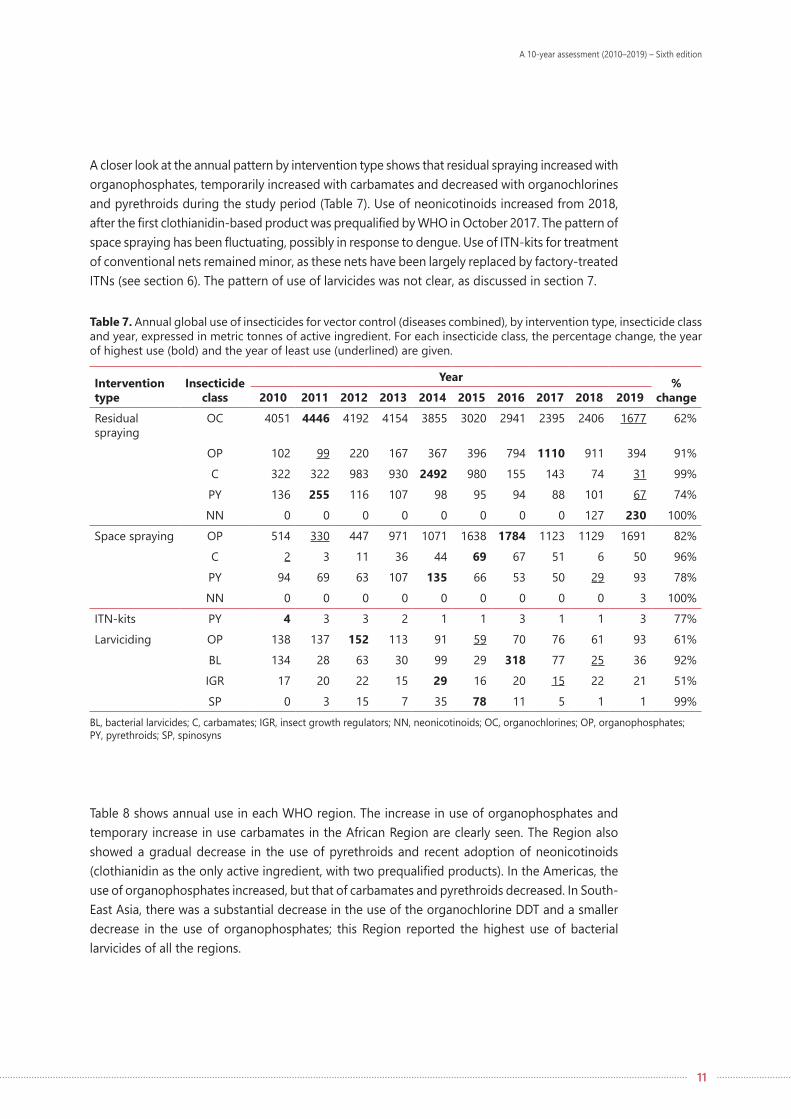
Table 7. Annual global use of insecticides for vector control (diseases combined), by intervention type, insecticide class and year, expressed in metric tonnes of active ingredient. For each insecticide class, the percentage change, the year of highest use (bold) and the year of least use (underlined) are given.
Intervention type
Insecticide class
Year % change2010 2011 2012 2013 2014 2015 2016 2017 2018 2019
Residual spraying
OC 4051 4446 4192 4154 3855 3020 2941 2395 2406 1677 62%
OP 102 99 220 167 367 396 794 1110 911 394 91%C 322 322 983 930 2492 980 155 143 74 31 99%PY 136 255 116 107 98 95 94 88 101 67 74%
NN 0 0 0 0 0 0 0 0 127 230 100%Space spraying OP 514 330 447 971 1071 1638 1784 1123 1129 1691 82%
C 2 3 11 36 44 69 67 51 6 50 96%PY 94 69 63 107 135 66 53 50 29 93 78%
NN 0 0 0 0 0 0 0 0 0 3 100%ITN-kits PY 4 3 3 2 1 1 3 1 1 3 77%Larviciding OP 138 137 152 113 91 59 70 76 61 93 61%
BL 134 28 63 30 99 29 318 77 25 36 92%IGR 17 20 22 15 29 16 20 15 22 21 51%
SP 0 3 15 7 35 78 11 5 1 1 99%BL, bacterial larvicides; C, carbamates; IGR, insect growth regulators; NN, neonicotinoids; OC, organochlorines; OP, organophosphates; PY, pyrethroids; SP, spinosyns
A closer look at the annual pattern by intervention type shows that residual spraying increased with organophosphates, temporarily increased with carbamates and decreased with organochlorines and pyrethroids during the study period (Table 7). Use of neonicotinoids increased from 2018, after the first clothianidin-based product was prequalified by WHO in October 2017. The pattern of space spraying has been fluctuating, possibly in response to dengue. Use of ITN-kits for treatment of conventional nets remained minor, as these nets have been largely replaced by factory-treated ITNs (see section 6). The pattern of use of larvicides was not clear, as discussed in section 7.
Global insecticide use for vector-borne disease control
12
Table 8. Annual use of insecticides for vector control (diseases combined), by region, insecticide class and year, expressed in metric tonnes of active ingredient. For each insecticide class, the percentage change, the year of highest use (bold) and the year of lowest use (underlined) are shown.
WHO regionInsecticide
classYear %
change2010 2011 2012 2013 2014 2015 2016 2017 2018 2019African OC 393 435 238 298 267 266 385 410 396 283 45%
OP 4 3 30 77 250 355 779 1100 913 394 100%C 92 177 731 837 679 798 29 4 0 0 100%PY 61 59 48 40 33 32 27 19 9 14 85%NN 0 0 0 0 0 0 0 0 127 218 100%BL 0 0 0 0 0 0 0 0 0 0 100%
IGR 1 0 0 0 0 0 0 0 0 0 100%Americas OP 599 433 568 1031 1008 1640 1799 1141 1131 1685 76%
C 226 120 221 72 1806 156 94 84 32 58 98%PY 100 196 71 113 73 44 32 45 33 49 84%NN 0 0 0 0 0 0 0 0 0 3 100%BL 7 5 34 8 7 6 290 59 5 9 98%IGR 11 14 14 13 7 13 18 13 18 16 62%
SP 0 3 14 7 35 25 11 5 1 1 100%Eastern Mediterranean
OP 17 21 18 23 17 10 9 18 9 10 62%
C 6 26 41 55 50 87 91 94 10 8 94%PY 30 33 21 28 20 41 29 24 13 13 68%NN 0 0 0 0 0 0 0 0 0 12 100%BL 3 2 4 3 4 5 0 0 3 1 98%IGR 6 6 8 2 23 3 2 2 2 1 94%
SP 0 0 0 0 0 53 0 0 0 0 100%European OP 2 1 1 0 0 0 0 0 0 0 100% BL 0 0 1 0 0 0 0 0 0 0 100%South-East Asia OC 3658 4011 3954 3857 3588 2754 2556 1985 2010 1394 65%
OP 124 104 196 107 140 79 52 41 29 51 85%C 0 0 0 0 0 7 7 12 0 2 100%PY 31 31 33 25 28 32 38 31 24 36 36%BL 120 21 23 19 86 17 26 16 17 21 86%
IGR 0 0 0 0 0 0 0 0 2 5 100%Western Pacific OP 9 3 6 13 113 9 9 10 20 37 97%
C 0 1 1 1 2 0 0 0 38 14 100%PY 14 9 10 10 80 14 25 20 52 52 89%
BL 4 0 1 0 2 1 1 1 0 5 100%BL, bacterial larvicides; C, carbamates; IGR, insect growth regulators; NN, neonicotinoids; OC, organochlorines; OP, organophosphates; PY, pyrethroids; SP, spinosyns

A 10-year assessment (2010–2019) – Sixth edition
13
More detailed data on insecticide use are presented in Annex 3 (Table A3.1).
Insecticides were used against a variety of vectors of diseases (Table 9), although most (99.7%) were used for the control of four diseases, namely, malaria (61.3%), dengue (23.7%), leishmaniasis (12.5%) and Chagas disease (2.2%). Total use of insecticides was highest for malaria and comprised mainly organochlorines (DDT as the only active ingredient), followed by organophosphates, carbamates and pyrethroids. For control of dengue, organophosphates, carbamates and pyrethroids were the insecticide classes most often used. Most larvicides, particularly bacterial larvicides, were used for control of dengue. Leishmaniasis control was conducted mainly with organochlorines, while Chagas disease was controlled mainly with carbamates. It was noted that vector control of dengue is decentralized in most countries and is conducted by municipalities or districts that procure their own insecticides. Hence, comprehensive data on insecticide use for dengue control might not be available centrally in countries, and the amounts of insecticide used to control dengue are likely to have been underestimated.
Other vector-borne diseases against which insecticides were reported to have been used were lymphatic filariasis, flea- and lice-borne diseases, Zika virus disease, chikungunya, Japanese encephalitis, onchocerciasis, schistosomiasis, tungiasis and tick-borne diseases. Together, these neglected tropical diseases accounted for only 0.3% of the total use of vector control insecticides.
The survey form requested data on insecticide use for vector-borne disease control. Some countries also reported on insecticide use for public health pests that are not vectors of disease (e.g. nuisance mosquitoes); however, these data are not considered to be representative of the targeted countries as the information was not requested. Nonetheless, use of insecticides for the control of nuisance mosquitoes, flies and other pests have been added to Table 9.

Global insecticide use for vector-borne disease control
14
Table 9. Annual global use of insecticides for vector control operations as reported to WHO, specified per disease (or public health pest) and insecticide class, and expressed in metric tonnes of active ingredient. Data were weighted and pooled over the period 2010–2019.
Disease or pest VectorInsecticide class
Total OC OP C PY NN BL IGR SP Disease
Malaria Anopheline mosquitoes
2619 526 358 96 36 23 3 3 3662
Dengue Aedine mosquitoes 0 1097 173 71 0 61 17 13 1433Leishmaniasis Phlebotomine
sandflies695 0 16 14 0 0 0 0 725
Chagas disease Triatomine bugs 0 0 118 9 0 0 0 0 127Lymphatic filariasis Mosquitoes 0 0 12 0 0 0 0 0 12Flea- and lice-borne diseases
Fleas, lice 0 0 0 3 0 0 0 0 3
Zika virus disease Aedine mosquitoes 0 1 0 1 0 0 0 0 1Chikungunya Aedine mosquitoes 0 1 0 0 0 0 0 0 1Japanese encephalitis
Culicine mosquitoes
0 0 0 1 0 0 0 0 1
Onchocerciasis Simuliid blackflies 0 0 0 0 0 0 0 0 0Schistosomiasis Snails 0 0 0 0 0 0 0 0 0Tungiasis Sand fleas 0 0 0 0 0 0 0 0 0Tick-borne diseases Ticks 0 0 0 0 0 0 0 0 0
PestNuisance mosquitoes
Not applicable 0 23 5 16 0 2 0 1 47
Flies and other pests
Not applicable 0 0 3 0 0 0 0 0 3
BL, bacterial larvicides; C, carbamates; IGR, insect growth regulators; NN, neonicotinoids; OC, organochlorines; OP, organophosphates; PY, pyrethroids; SP, spinosyns
Residual spraying was the main type of vector control (by weight of active ingredient) for malaria, leishmaniasis and Chagas disease (Fig. 2). Space spraying was the main method used for dengue control, followed by residual spraying and larviciding. Larviciding is not applicable as an intervention against leishmaniasis or Chagas disease because the larval or nymphal stages of the vectors of these diseases do not breed in aquatic habitats.

A 10-year assessment (2010–2019) – Sixth edition
15
Fig. 2. Contributions of four types of intervention to global use of insecticides for vector control (excluding ITNs) for four diseases
0%
10%
20%
30%
40%
50%
60%
70%
80%
90%
100%
Malaria Dengue Leishmaniasis Chagas disease
Perc
enta
ge o
f ins
ectic
ides
use
d
Space sprayingLarvicidingITN-kitsResidual spraying
The numbers of countries that reported use of each insecticide class for control of malaria, dengue, leishmaniasis and Chagas disease are presented in Table 10. The number of countries that used pyrethroids for malaria control (excluding for ITNs) decreased from 59 in 2010 to 27 in 2019, a 54% decrease. The number of countries that used organochlorines (DDT as the only active ingredient) for malaria control decreased from 13 in 2010 to 5 in 2019, a 62% decrease. Conversely, the number of countries that used neonicotinoids for malaria control increased from 0 in 2010 to 11 in 2019. The number of countries that used organophosphates for dengue control decreased from 30 in 2010 to 19 in 2019, and the number that used pyrethroids decreased from 31 in 2010 to 18 in 2019. Similar decreases in the numbers of countries that used pyrethroids were seen for leishmaniasis and Chagas disease. Bacterial larvicides were used for dengue control in 18 countries in 2015 and in only 9 in 2019.

Global insecticide use for vector-borne disease control
16
Table 10. Numbers of countries that reported use of vector control insecticides, by disease, insecticide class and year, with the percentage change, the year of the highest number (bold) and the year of the lowest number (underlined) specified for each insecticide class
DiseaseInsecticide
classYear %
change2010 2011 2012 2013 2014 2015 2016 2017 2018 2019Malaria OC 13 9 7 9 8 7 4 5 4 5 69%
OP 26 23 27 26 30 30 27 28 27 20 33%C 9 11 13 16 14 13 9 7 4 5 75%PY 59 51 54 50 52 38 39 32 28 27 54%NN 0 0 0 0 0 0 0 0 6 11 100%BL 10 10 11 9 6 8 8 8 4 8 64%IGR 5 3 5 3 3 2 3 3 3 3 60%
SP 1 1 2 2 1 2 2 2 2 2 50%Dengue OP 30 31 31 27 29 26 21 21 18 19 42%
C 4 4 5 5 5 4 4 4 4 4 20%PY 31 30 28 29 30 26 22 21 15 18 52%NN 0 0 0 0 0 0 0 1 1 1 100%BL 12 8 12 11 14 18 13 12 8 9 56%IGR 4 5 5 5 5 6 8 9 7 8 56%
SP 2 3 4 4 3 4 4 4 4 4 50%Leishmaniasis OC 1 1 1 1 1 1 0 0 0 0 100%
OP 2 1 1 1 1 0 0 0 0 0 100%C 2 3 2 2 2 2 2 2 1 1 67%
PY 15 15 13 13 16 11 13 12 8 8 50%Chagas disease
OP 1 0 0 0 0 0 0 0 0 0 100%
C 2 2 2 2 2 2 1 1 1 1 50% PY 8 8 7 6 8 6 8 7 4 4 50%
BL, bacterial larvicides; C, carbamates; IGR, insect growth regulators; NN, neonicotinoids; OC, organochlorines; OP, organophosphates; PY, pyrethroids; SP, spinosyns
5.2 Malaria
Global use of insecticides in terms of amounts of active ingredients was highest for malaria. Over the period 2010–2019, annual global use of the main insecticide classes for malaria control was 2619 t of organochlorines, 5268 t of organophosphates, 358 t of carbamates, 96 t of pyrethroids and 36 t of neonicotinoids (Table 11). In comparison with the previous 10-year period 2000–2009, use of organochlorines, organophosphates and pyrethroids for malaria control decreased by 41%, 44% and 44%, respectively. Use of organophosphates for malaria control increased in the African Region but decreased in several other regions, whereas use of pyrethroids remained constant in the African Region and decreased in several other regions. Use of carbamates in malaria control increased globally, from 26 t annually in 2000–2009 to 358 t annually in 2010–2019, due to the increase in use in the African Region. The first neonicotinoid product was prequalified for indoor residual spraying in October 2017.

A 10-year assessment (2010–2019) – Sixth edition
17
Table 11. Annual insecticide use for malaria vector control in 2010–2019 and in 2000–2009, by region and insecticide class, expressed in metric tonnes of active ingredient
WHO region2000–2009 2010–2019
OC OP C PY NN OC OP C PY NNAfrican 805 20 19 33 0 337 390 335 34 35Americas 0 149 2 55 0 0 64 1 18 0Eastern Mediterranean 0 32 4 15 0 0 8 19 12 1European 0 3 0 1 0 0 1 0 0 0South-East Asia 3623 518 2 38 0 2282 62 3 25 0Western Pacific 0 213 0 28 0 0 1 0 7 0All 4429 934 26 171 0 2619 526 358 96 36
C, carbamates; NN, neonicotinoids; OC, organochlorines; OP, organophosphates; PY, pyrethroids
During the study period, most insecticides for malaria control were used in indoor residual spraying, followed by space spraying and larviciding (Table 12). Use of organochlorines, with DDT as only active ingredient, was highest in the South-East Asia Region. In the African Region, five insecticide classes were commonly used for malaria control, which included DDT as well as the new neonicotinoid clothianidin. Space spraying for malaria control was reported mainly from the Americas and from a few other regions, although WHO does not recommend space spraying for malaria control (28). Use of ITN-kits for retreatment of nets for malaria control was minimal, indicating that factory-treated ITNs have largely replaced periodic manual treatment of conventional nets. Larviciding for malaria control was conducted with equal amounts of organophosphates and bacterial larvicides (19–23 t per year).
Table 12. Annual use of insecticides for malaria vector control, by region, intervention type and insecticide class expressed in metric tonnes of active ingredient
WHO regionResidual spraying Space spraying
ITN-kits Larviciding
OC OP C PY NN OP C PY NN PY OP BL IGR SPAfrican 337 388 335 34 35 0 0 0 0 0 3 0 0 0Americas 0 6 1 12 0 50 0 6 0 0 9 2 0 0Eastern Mediterranean
0 0 19 8 1 0 0 4 0 0 8 2 3 3
European 0 1 0 0 0 0 0 0 0 0 0 0 0 0South-East Asia
2282 62 3 22 0 0 0 3 0 0 0 18 0 0
Western Pacific 0 1 0 4 0 0 0 0 0 2 0 0 0 0All 2619 456 358 80 36 50 0 14 0 2 19 23 3 3
BL, bacterial larvicides; C, carbamates; IGR, insect growth regulators; NN, neonicotinoids; OC, organochlorines; OP, organophosphates; PY, pyrethroids; SP, spinosyns

Global insecticide use for vector-borne disease control
18
The global pattern of use of organochlorines for malaria control showed a steady decrease during the study period, from 3107 t in 2010 to 1677 t in 2019 (Table 13), a 46% reduction. Residual spraying with carbamates and pyrethroids for malaria control also decreased, but use of organophosphates and neonicotinoids increased. Larviciding with organophosphates or bacterial larvicides for malaria control decreased during the study period. Use of ITN-kits also showed a slight decrease.
Table 13. Annual global use of insecticides for malaria vector control operations, by intervention type, insecticide class and year, expressed in metric tonnes of active ingredient. The percentage change, the year of highest use (bold) and the year of lowest use (underlined) are shown for each insecticide class.
Intervention type
Insecticide class
Year % change2010 2011 2012 2013 2014 2015 2016 2017 2018 2019
Residual spraying
OC 3107 2990 2723 2489 2517 2942 2941 2395 2406 1677 46%
OP 102 99 220 167 367 396 793 1109 911 394 91%C 113 140 92 77 71 70 69 67 56 41 71%PY 92 184 745 855 703 855 75 56 9 7 99%
NN 0 0 0 0 0 0 0 0 127 230 100%Space spraying OP 73 30 28 77 103 144 13 17 10 10 93%
C 0 0 0 0 0 0 0 0 0 0 NA PY 32 20 14 10 13 10 10 6 1 21 96%ITN-kits PY 4 3 3 2 1 1 3 1 1 3 77%Larviciding OP 40 36 32 21 19 13 8 15 6 4 91%
BL 67 14 30 13 47 11 13 8 10 13 89%IGR 4 3 4 1 11 1 1 1 1 1 93%
SP 0 0 0 0 0 27 0 0 0 0 100%BL, bacterial larvicides; C, carbamates; IGR, insect growth regulators; NN, neonicotinoids; OC, organochlorines; OP, organophosphates; PY, pyrethroids; SP, spinosyns
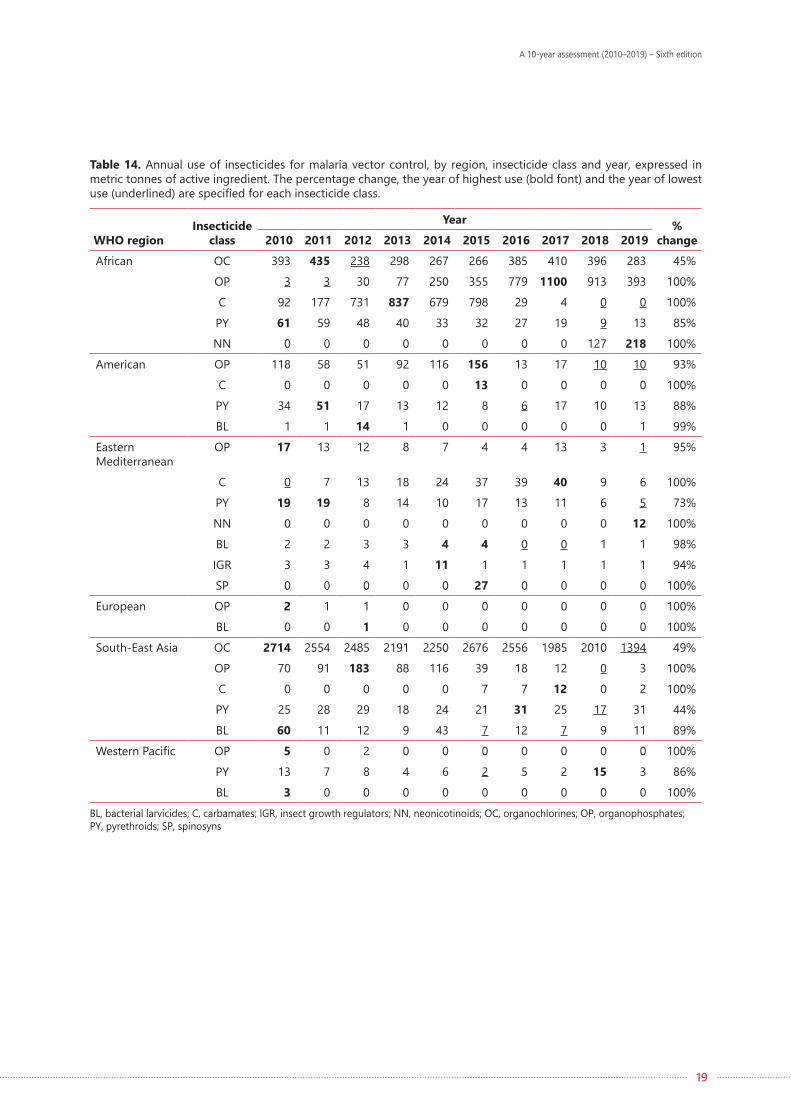
Insecticide use for malaria control was highest in the South-East Asia Region, with high use of organochlorines, followed by the African Region (Table 14). The increase in use of organophosphates and the decrease in use of carbamates and pyrethroids were, as noted earlier, apparently attributable to the use pattern in the African Region, where recent adoption of neonicotinoids for malaria control led to an increase in use. Use of insecticides for malaria control decreased drastically in the Americas. In the Eastern Mediterranean, insecticide use for malaria control was relatively minor but with a relatively large contribution of larvicides (i.e. bacterial larvicides, insect growth regulators and spinosyns). In the South-East Asia Region, use of organochlorines and organophosphates gradually decreased, while use of pyrethroids remained constant and use of bacterial larvicides was variable. Insecticide use for malaria control in the Western Pacific and European regions was minor throughout the study period. More detailed data on insecticide use for malaria control are presented in Annex 3 (Table A3.2).
A 10-year assessment (2010–2019) – Sixth edition
19
Table 14. Annual use of insecticides for malaria vector control, by region, insecticide class and year, expressed in metric tonnes of active ingredient. The percentage change, the year of highest use (bold font) and the year of lowest use (underlined) are specified for each insecticide class.
WHO regionInsecticide
classYear %
change2010 2011 2012 2013 2014 2015 2016 2017 2018 2019African OC 393 435 238 298 267 266 385 410 396 283 45%
OP 3 3 30 77 250 355 779 1100 913 393 100%C 92 177 731 837 679 798 29 4 0 0 100%PY 61 59 48 40 33 32 27 19 9 13 85%
NN 0 0 0 0 0 0 0 0 127 218 100%American OP 118 58 51 92 116 156 13 17 10 10 93%
C 0 0 0 0 0 13 0 0 0 0 100%PY 34 51 17 13 12 8 6 17 10 13 88%
BL 1 1 14 1 0 0 0 0 0 1 99%Eastern Mediterranean
OP 17 13 12 8 7 4 4 13 3 1 95%
C 0 7 13 18 24 37 39 40 9 6 100%PY 19 19 8 14 10 17 13 11 6 5 73%NN 0 0 0 0 0 0 0 0 0 12 100%BL 2 2 3 3 4 4 0 0 1 1 98%IGR 3 3 4 1 11 1 1 1 1 1 94%
SP 0 0 0 0 0 27 0 0 0 0 100%European OP 2 1 1 0 0 0 0 0 0 0 100% BL 0 0 1 0 0 0 0 0 0 0 100%South-East Asia OC 2714 2554 2485 2191 2250 2676 2556 1985 2010 1394 49%
OP 70 91 183 88 116 39 18 12 0 3 100%C 0 0 0 0 0 7 7 12 0 2 100%PY 25 28 29 18 24 21 31 25 17 31 44%
BL 60 11 12 9 43 7 12 7 9 11 89%Western Pacific OP 5 0 2 0 0 0 0 0 0 0 100%
PY 13 7 8 4 6 2 5 2 15 3 86% BL 3 0 0 0 0 0 0 0 0 0 100%
BL, bacterial larvicides; C, carbamates; IGR, insect growth regulators; NN, neonicotinoids; OC, organochlorines; OP, organophosphates; PY, pyrethroids; SP, spinosyns

Global insecticide use for vector-borne disease control
20
5.3 Dengue
As noted earlier, the amounts of insecticide used for control of dengue might be underestimated, because dengue vector control is often implemented by municipalities or districts, which may not send their data on insecticide use to the central agencies that responded to the survey. In some areas, insecticides for dengue control might also have been used against chikungunya and Zika virus disease, which are generally transmitted by the same vectors.
Over the period 2010–2019, annual global use of the main insecticide classes for dengue control was 1097 t of organophosphates, 173 t of carbamates and 71 t of pyrethroids (Table 15). In comparison with the previous 10-year period, 2000–2009, use of organophosphates increased by 239% and that of pyrethroids decreased by 25%. Annual use of carbamates for dengue control increased sharply, from 1 t in 2000–2009 to 173 t in 2010–2019, due mainly to their adoption in the Americas. No insecticide use for dengue control was reported from the African or European region. Overall, reported insecticide use for dengue control increased substantially, possibly in response to an increase in dengue outbreaks.
Table 15. Annual insecticide use for vector control of dengue in spraying operations in 2010–2019 and in 2000–2009, by region and insecticide class, expressed in metric tonnes of active ingredient
WHO region2000–2009 2010–2019
OC OP C PY NN OC OP C PY NNAfrican 0 0 0 0 0 0 0 0 0 0Americas 0 274 1 84 0 0 1037 168 41 0Eastern Mediterranean 0 0 0 0 0 0 7 0 7 0European 0 0 0 0 0 0 0 0 0 0South-East Asia 0 17 0 1 0 0 30 0 2 0Western Pacific 0 33 0 10 0 0 22 6 21 0All 0 324 1 95 0 0 1097 173 71 0
C, carbamates; NN, neonicotinoids; OC, organochlorines; OP, organophosphates; PY, pyrethroids
Between 2010 and 2019, most insecticides for dengue control were applied by space spraying, followed by larviciding and residual spraying (Table 16). Space spraying for dengue control was particularly common in the Americas, where use of insecticides in residual spraying was highest. Larviciding for dengue control was most common in the Americas and South-East Asia regions.

A 10-year assessment (2010–2019) – Sixth edition
21
Table 16. Annual use of insecticides for vector control of dengue, by region, intervention type and insecticide class, expressed in metric tonnes of active ingredient
WHO regionResidual spraying Space spraying
ITN-kits Larviciding
OC OP C PY NN OP C PY NN PY OP BL IGR SPAfrican 0 0 0 0 0 0 0 0 0 0 0 0 0 0Americas 0 0 134 4 0 987 34 37 0 0 50 41 14 10Eastern Mediterranean
0 0 0 2 0 0 0 5 0 0 7 0 3 3
European 0 0 0 0 0 0 0 0 0 0 0 0 0 0South-East Asia 0 0 0 0 0 12 0 2 0 0 18 19 1 0Western Pacific 0 0 5 6 0 17 0 15 0 0 5 1 0 0All 0 0 139 12 0 1017 34 59 0 0 80 61 17 13
BL, bacterial larvicides; C, carbamates; IGR, insect growth regulators; NN, neonicotinoids; OC, organochlorines; OP, organophosphates; PY, pyrethroids; SP, spinosyns
Increasing use of organophosphates and carbamates in space spraying for dengue control was seen globally, with an increase in the use of organophosphates for space spraying from 434 t in 2010 to 1680 t in 2019 (Table 17). Pyrethroid use for dengue control was variable, with no clear trend. A peak in the use of carbamates for residual spraying was observed in 2014 because of high use reported by one country (Mexico), but their use has decreased in recent years. In 2019, modest amounts of the neonicotinoid imidacloprid were used for dengue control, for space spraying in the Americas. Use of larvicides for dengue control did not show clear temporal patterns.
Table 17. Annual global use of insecticides for vector control of dengue, by intervention type, insecticide class and year, expressed in metric tonnes of active ingredient. The percentage change, the year of highest use (bold) and the year of lowest use (underlined) are shown for each insecticide class.
Intervention type
Insecticide class
Year % change2010 2011 2012 2013 2014 2015 2016 2017 2018 2019
Residual spraying
OP 0 0 0 0 0 0 0 0 0 0 100%
C 117 59 105 24 892 56 26 32 63 21 98% PY 2 31 3 7 11 11 11 9 26 15 95%Space spraying OP 434 299 417 893 964 1490 1771 1100 1120 1680 83%
C 2 3 11 36 44 69 67 51 6 50 96%PY 60 44 46 95 121 51 33 40 27 71 77%
NN 0 0 0 0 0 0 0 0 0 3 100%Larviciding OP 98 100 121 92 72 46 62 61 56 89 62%
BL 67 14 33 17 52 17 305 69 15 23 95%IGR 14 17 18 14 18 15 19 14 21 21 35%
SP 0 3 15 7 35 52 11 5 1 1 100%BL, bacterial larvicides; C, carbamates; IGR, insect growth regulators; NN, neonicotinoids; OC, organochlorines; OP, organophosphates; PY, pyrethroids; SP, spinosyns

Global insecticide use for vector-borne disease control
22
Table 18 shows consistently high insecticide use for dengue control in the Americas, with an increase in the use of organophosphates from 474 t in 2010 to 1675 t in 2019. The amounts used were much lower in other regions. More detailed data on insecticide use for dengue control are presented in Annex 3 (Table A3.3).
Table 18. Annual use of insecticides for vector control of dengue in spraying operations, by region, insecticide class and year, expressed in metric tonnes of active ingredient. The percentage change, the year of highest use (bold) and the year of lowest use (underlined) are shown for each insecticide class.
WHO regionInsecticide
classYear %
change2010 2011 2012 2013 2014 2015 2016 2017 2018 2019Americas OP 474 376 517 939 888 1480 1786 1118 1120 1675 79%
C 119 60 115 60 934 125 93 82 30 57 97%PY 52 68 41 87 51 29 11 19 17 33 87%NN 0 0 0 0 0 0 0 0 0 3 100%BL 6 4 20 7 6 6 290 59 5 8 99%IGR 11 14 14 13 7 13 18 13 18 15 61%
SP 0 3 14 7 35 25 11 5 1 1 100%Eastern Mediterranean
OP 0 8 6 14 10 6 4 5 6 9 100%
PY 6 4 6 8 4 13 10 8 4 4 71%BL 0 0 0 0 0 1 0 0 1 1 100%IGR 3 3 4 1 11 1 1 1 1 1 94%
SP 0 0 0 0 0 27 0 0 0 0 100%South-East Asia OP 54 12 11 19 24 41 34 29 29 49 80%
PY 2 0 0 2 2 8 3 3 2 2 98%BL 60 11 12 10 43 10 14 9 9 9 86%
IGR 0 0 0 0 0 0 0 0 2 5 100%Western Pacific OP 4 3 4 13 113 9 9 10 20 37 97%
C 0 1 1 1 2 0 0 0 38 14 100%PY 1 2 2 6 75 12 20 18 30 49 99%
BL 1 0 1 0 2 1 1 1 0 5 100%BL, bacterial larvicides; C, carbamates; IGR, insect growth regulators; NN, neonicotinoids; OC, organochlorines; OP, organophosphates; PY, pyrethroids; SP, spinosyns
5.4 Leishmaniasis
Annual global use of insecticides for control of leishmaniasis (visceral and cutaneous leishmaniasis combined) was 695 t of organochlorines (DDT as the only active ingredient), 16 t of carbamates and 14 t of pyrethroids (Table 19). In comparison with the previous 10-year period, 2000–2009, insecticide use for leishmaniasis control was slightly lower, annual use of organochlorines having decreased by 16% and that of pyrethroids by 33%. Insecticide use for leishmaniasis control was concentrated in the Eastern Mediterranean and South-East Asia regions, with no or little use reported from the African, Americas, European and Western Pacific regions.

A 10-year assessment (2010–2019) – Sixth edition
23
Table 19. Annual insecticide use for vector control of leishmaniasis in spraying operations in 2010–2019 and 2000–2009, by region and insecticide class, expressed in metric tonnes of active ingredient
WHO region2000–2009 2010–2019
OC OP C PY NN OC OP C PY NNAfrican 0 0 0 3 0 0 0 0 0 0Americas 0 0 0 17 0 0 0 0 4 0Eastern Mediterranean 0 1 1 1 0 0 0 16 6 0European 0 0 0 0 0 0 0 0 0 0South-East Asia 825 0 0 0 0 695 0 0 4 0Western Pacific 0 0 0 0 0 0 0 0 0 0All 825 1 1 21 0 695 0 16 14 0
C, carbamates; NN, neonicotinoids; OC, organochlorines; OP, organophosphates; PY, pyrethroids
Use of insecticides in leishmaniasis control was predominantly for indoor residual spraying in both the Eastern Mediterranean and South-East Asia regions (Table 20). Carbamates and pyrethroids were the main insecticides used in the Eastern Mediterranean Region, while considerable amounts of the organochlorine DDT and smaller amounts of pyrethroids were used in the South-East Asia Region. Use of pyrethroids for space spraying in leishmaniasis control was reported also from the Eastern Mediterranean Region. No use of insecticides for treatment of nets in the control of leishmaniasis was reported.
Table 20. Annual use of insecticides for vector control of leishmaniasis in spraying operations, by region, intervention type and insecticide class, expressed in metric tonnes of active ingredient
WHO regionResidual spraying Space spraying ITN-kits
OC OP C PY NN OP C PY NN PYAfrican 0 0 0 0 0 0 0 0 0 0Americas 0 0 0 4 0 0 0 0 0 0Eastern Mediterranean
0 0 16 4 0 0 0 2 0 0
European 0 0 0 0 0 0 0 0 0 0South-East Asia 695 0 0 4 0 0 0 0 0 0Western Pacific 0 0 0 0 0 0 0 0 0 0All 695 0 16 12 0 0 0 2 0 0
C, carbamates; NN, neonicotinoids; OC, organochlorines; OP, organophosphates; PY, pyrethroids

Global insecticide use for vector-borne disease control
24
The pattern of annual insecticide use for leishmaniasis control shows that use of organochlorines almost stopped in 2015 and completely stopped in 2016 (Tables 21 and 22). This is due to changes in the use of DDT for visceral leishmaniasis (kala-azar) in India. Large amounts were used during the period 2010–2014; however, in response to high levels of DDT resistance, a policy decision was taken to switch from DDT to pyrethroids for control of the sandfly vectors (29, 30). Use of carbamates for leishmaniasis control, which has been reported from the Eastern Mediterranean Region, has decreased in recent years (Table 22), and space spraying has decreased to marginal levels. More detailed data on insecticide use for leishmaniasis control are presented in Annex 3 (Table A3.4).
Table 21. Annual global use of insecticides for vector control of leishmaniasis in spraying operations, by intervention type, insecticide class and year, expressed in metric tonnes of active ingredient. The percentage change, the year of highest use (bold) and the year of lowest use (underlined) are shown for each insecticide class.
Intervention type
Insecticide class
Year % change2010 2011 2012 2013 2014 2015 2016 2017 2018 2019
Residual spraying
OC 944 1457 1469 1665 1338 78 0 0 0 0 100%
C 6 13 16 23 15 26 27 28 1 2 96%PY 13 16 14 16 10 9 10 9 10 9 46%
Space spraying OP 4 0 0 0 0 0 0 0 0 0 100% PY 2 4 3 2 1 5 3 2 0 0 91%
C, carbamates; OC, organochlorines; OP, organophosphates; PY, pyrethroids
Table 22. Annual use of insecticides for vector control of leishmaniasis in spraying operations, by region, insecticide class and year, expressed in metric tonnes of active ingredient. The percentage change, the year of highest use (bold) and the year of lowest use (underlined) are shown for each insecticide class.
WHO regionInsecticide
classYear %
change2010 2011 2012 2013 2014 2015 2016 2017 2018 2019American OP 4 0 0 0 0 0 0 0 0 0 100%
PY 6 8 6 5 3 2 3 4 3 1 83%Eastern Mediterranean
C 6 13 16 23 15 26 27 28 1 2 96%
PY 5 9 7 7 4 10 6 5 3 4 73%South-East Asia OC 944 1457 1469 1665 1338 78 0 0 0 0 100% PY 5 3 4 6 3 2 4 3 5 4 56%
C, carbamates; OC, organochlorines; OP, organophosphates; PY, pyrethroids

A 10-year assessment (2010–2019) – Sixth edition
25
5.5 Chagas disease
Chagas disease, or American trypanosomiasis, was previously endemic only in countries in continental Latin America; however, increasing numbers of cases have been detected in other regions of the world due to population mobility, urbanization and emigration. Insecticide use for control of Chagas disease was reported only from the Americas. Annual global use of insecticides for control of Chagas disease was 118 t of carbamates and 9 t of pyrethroids (Table 23). This presents a change from the previous period, 2000–2009, when mainly pyrethroids were used. The shift may be in response to resistance to pyrethroids (31). Insecticides for Chagas disease control are applied mainly by residual spraying, with minor use of space spraying (Table 24).
Table 23. Annual insecticide use for vector control of Chagas disease in spraying operations in 2010–2019 and in 2000–2009, by region and insecticide class, expressed in metric tonnes of active ingredient
2000–2009 2010–2019WHO region OC OP C PY NN OC OP C PY NNAfrican 0 0 0 0 0 0 0 0 0 0Americas 0 5 1 35 0 0 0 118 9 0Eastern Mediterranean 0 0 0 0 0 0 0 0 0 0European 0 0 0 0 0 0 0 0 0 0South-East Asia 0 0 0 0 0 0 0 0 0 0Western Pacific 0 0 0 0 0 0 0 0 0 0All 0 5 1 35 0 0 0 118 9 0
C, carbamates; NN, neonicotinoids; OC, organochlorines; OP, organophosphates; PY, pyrethroids
Table 24. Annual use of insecticides for vector control of Chagas disease in spraying operations, by region, intervention type and insecticide class, expressed in metric tonnes of active ingredient
Residual spraying Space sprayingITN-kits
WHO region OC OP C PY NN OP C PY NN PYAfrican 0 0 0 0 0 0 0 0 0 0Americas 0 0 118 8 0 0 0 0.5 0 0Eastern Mediterranean 0 0 0 0 0 0 0 0 0 0European 0 0 0 0 0 0 0 0 0 0South-East Asia 0 0 0 0 0 0 0 0 0 0Western Pacific 0 0 0 0 0 0 0 0 0 0All 0 0 118 8 0 0 0 0.5 0 0
C, carbamates; NN, neonicotinoids; OC, organochlorines; OP, organophosphates; PY, pyrethroids
Residual spraying with carbamates has reportedly decreased in recent years (Table 25). A sharp peak in carbamate use was observed in 2014, which was due to high reported use in Mexico.

Global insecticide use for vector-borne disease control
26
Table 25. Annual global use of insecticides for vector control of Chagas disease in spraying operations, by intervention type, insecticide class and year, expressed in metric tonnes of active ingredient. The percentage change, the year of highest use (bold) and the year of lowest use (underlined) are shown for each insecticide class.
Intervention type
Insecticide class
Year % change2010 2011 2012 2013 2014 2015 2016 2017 2018 2019
Residual spraying
C 107 59 106 13 871 19 2 1 2 1 100%PY 7 38 7 7 5 4 4 4 4 2 95%
Space spraying OP 4 0 0 0 0 0 0 0 0 0 100% PY 1 1 0 0 1 0 1 2 0 0 100%
C, carbamates; NN, neonicotinoids; OC, organochlorines; OP, organophosphates; PY, pyrethroids
5.6 Other vector-borne diseases
Reported use of insecticides for control of vector-borne diseases other than malaria, dengue, leishmaniasis and Chagas disease was marginal during the period 2010–2019. Annual global use for control of lymphatic filariasis, flea- and lice-borne diseases, Zika virus disease, chikungunya, Japanese encephalitis and several other vector-borne diseases was 12 t of carbamates and 4 t of pyrethroids for application in residual spraying and 2 t of organophosphates and 1 t of pyrethroids for space spraying (Table 26).
Table 26. Annual use of insecticides for control of vector-borne diseases other than malaria, dengue, leishmaniasis and Chagas disease, by region, intervention type and insecticide class, expressed in metric tonnes of active ingredient
WHO regionResidual spraying Space spraying
ITN-kits Larviciding
OC OP C PY NN OP C PY NN PY OP BL IGR SPAfrican 0 0 0 0 0 0 0 0 0 0 0 0 0 0Americas 0 0 0 3 0 1 0 1 0 0 0 0 0 0Eastern Mediterranean
0 0 12 0 0 0 0 0 0 0 0 0 0 0
European 0 0 0 0 0 0 0 0 0 0 0 0 0 0South-East Asia
0 0 0 0 0 0 0 0 0 0 0 0 0 0
Western Pacific 0 0 0 1 0 0 0 0 0 0 0 0 0 0All 0 0 12 4 0 2 0 1 0 0 0 0 0 0
BL, bacterial larvicides; C, carbamates; IGR, insect growth regulators; NN, neonicotinoids; OC, organochlorines; OP, organophosphates; PY, pyrethroids; SP, spinosyns

A 10-year assessment (2010–2019) – Sixth edition
27
6. Insecticide-treated nets
Vector control insecticides have been used not only in spraying operations but also in the manufacture of treated nets, which include long-lasting insecticidal nets, pyrethroid–piperonyl butoxide nets and dual-insecticide nets. As noted in section 2, the term “insecticide-treated net” (ITN) is used in this report to describe factory-treated nets only; the insecticides used for conventional treatment of nets are referred to as ITN-kits.
Data on global deliveries of ITNs were used to determine the amounts of active ingredients and synergists used in this vector control method (Table 27). Results are provided separately for sub-Saharan Africa and for the WHO regions (countries in sub-Saharan Africa are in both the WHO African and the Eastern Mediterranean regions). Three pyrethroid compounds, α-cypermethrin, deltamethrin and permethrin, have been used in ITNs. The average dose of active ingredient per net differs for each pyrethroid compound, from 0.9 g per net for deltamethrin, 3.5 g per net for α-cypermethrin and 11.6 g per net for permethrin.
Annual global use of pyrethroids in ITNs was 624.8 t (active ingredient) during the period 2010–2019. Overall, 87% of the total amount of active ingredient of pyrethroids in ITNs was delivered to sub-Saharan Africa.
Table 27. Annual amounts of insecticides and synergists in insecticide-treated nets according to global deliveries in sub-Saharan African and elsewhere, 2010–2019, expressed in metric tonnes of active ingredient
Active ingredient Year
2010 2011 2012 2013 2014 2015 2016 2017 2018 2019Sub-Saharan Africa
Pyrethroids 558.2 456.5 325.5 559.4 598.2 581.8 487.6 636.2 524.7 707.0Other insecticide classes 0.0 0.0 0.0 0.0 0.0 0.0 0.0 0.0 0.0 12.9Synergists 0.0 0.0 0.0 0.0 0.0 0.0 0.0 0.0 21.9 62.8
Outside sub-Saharan AfricaPyrethroids 67.9 168.8 51.8 54.4 92.6 59.9 40.3 89.5 66.6 120.6Other insecticide classes 0.0 0.0 0.0 0.0 0.0 0.0 0.0 0.0 0.0 0.0Synergists 0.0 0.0 0.0 0.0 0.0 0.0 0.0 0.0 0.5 0.8
World totalPyrethroids 626.1 625.3 377.3 613.8 690.8 641.7 527.9 725.7 591.4 827.6Other insecticide classes 0.0 0.0 0.0 0.0 0.0 0.0 0.0 0.0 0.0 12.9Synergists 0.0 0.0 0.0 0.0 0.0 0.0 0.0 0.0 22.4 63.6
Source: J. Milliner (personal communication to WHO, 2020) for data compiled for the Net Mapping Project (https://allianceformalariaprevention.com/working-groups/net-mapping-project/). Data for individual brands of long-lasting insecticidal nets delivered were anonymized and pooled to maintain commercial confidentiality.

Global insecticide use for vector-borne disease control
28
Since 2018, substantial volumes of ITN products with the added synergist piperonyl butoxide have been delivered in areas in which malaria vector populations are resistant to pyrethroids (32), with global amounts of 22.4 t in 2018 and 63.6 t in 2019. Since 2019, several dual-insecticide ITN products have been delivered, in which chlorfenapyr (pyrrole) or pyriproxyfen (insect growth regulator) is added to the pyrethroid, which were also targeted to areas in which malaria vector populations show pyrethroid resistance. Thus far, the market share of dual-insecticide products has been small, and therefore the total amounts of chlorfenapyr and pyriproxyfen (i.e. “other insecticides” in Table 27) have been smaller than the amounts of pyrethroids used in ITNs.
The annual amounts of pyrethroids in ITNs showed an increasing trend during the period 2010–2019 (Fig. 3), with 32% more pyrethroids delivered in ITNs in 2019 than in 2010. It should be noted that the total amounts of pyrethroids delivered are not necessarily representative of the number of ITNs delivered, because of changing proportions in the three pyrethroid compounds over the years and different doses of each compound used per net.
Fig. 3. Annual amounts of pyrethroids (α-cypermethrin, deltamethrin and permethrin combined) in insecticide-treated nets according to global deliveries in sub-Saharan Africa and elsewhere, expressed in metric tonnes of active ingredient
0
100
200
300
400
500
600
700
800
900
2010 2011 2012 2013 2014 2015 2016 2017 2018 2019
Met
ric to
nnes
(a.i.)
Year
Outside sub-Saharan Africa
Sub-Saharan Africa
a.i., active ingredient

A 10-year assessment (2010–2019) – Sixth edition
29
Comparison of use of pyrethroids in ITNs and in other vector control interventions shows that ITNs constituted the main use of pyrethroids for vector control during 2010–2019 (Fig. 4), accounting for 76.3% of annual global use of pyrethroids for vector control; residual spraying accounted for 14.1%, space spraying for 9.3% and ITN-kits for 0.3%.
Fig. 4. Annual global use of pyrethroids according to vector control tool or intervention, pooled for the period 2010–2019
0
100
200
300
400
500
600
700
ITN Residual spraying Space spraying ITN-kits
Met
ric to
nnes
(a.i.)
Tool/application method
a.i., active ingredient

Global insecticide use for vector-borne disease control
30
7. Selected insecticides
7.1 Larvicides
In the past, larviciding for vector control was conducted mainly with organophosphates. In 2000–2009, the contribution of other classes of larvicide was negligible (Fig. 5). During the period of this report, 2010–2019, however, use of organophosphates for larviciding decreased, and the contribution of other larvicides increased (Fig. 5). Temephos accounted for 93.2% of organophosphates used for larviciding in 2010–2019, the remainder being fenitrothion and fenthion. In 2010–2019, the insecticide class most frequently used for larviciding, apart from organophosphates, was bacterial larvicides, which showed fluctuating use, with a peak in 2016. Other larvicides used were spinosyns and insect growth regulators. The modes of action of larvicide classes other than organophosphates are distinct from those used in residual spraying and space spraying. The shift to other larvicide classes thus indicates that progress has been made in managing insecticide resistance.
Fig. 5. Annual global use of insecticides for vector larval control (diseases combined), by insecticide class, 2000–2019
-
50
100
150
200
250
300
350
2000
2001
2002
2003
2004
2005
2006
2007
2008
2009
2010
2011
2012
2013
2014
2015
2016
2017
2018
2019
Met
ric to
nnes
(a.i.)
Year
OrganophosphatesBacterial larvicidesInsect growth regulatorsSpinosyns
a.i., active ingredient
B. thuringiensis israelensis and temephos were the most frequently used larvicides (Table 28). No clear trend was observed in use of any larvicide product. Use of spinosad peaked in 2014 and 2015 but fell thereafter.

A 10-year assessment (2010–2019) – Sixth edition
31
Table 28. Annual global use of larvicide compounds (diseases combined), by year, expressed in metric tonnes of active ingredient. The percentage change, the year of highest use (bold) and the year of lowest use (underlined) are shown for each insecticide class.
Active ingredientInsecticide
classYear %
change2010 2011 2012 2013 2014 2015 2016 2017 2018 2019Temephos OP 114.8 125.0 144.9 109.3 83.3 57.9 69.6 74.9 56.3 87.2 61%Bacillus thuringiensis israelensis
BL 129.7 27.0 49.6 29.5 98.6 28.8 317.8 76.5 25.0 35.0 92%
Spinosad SP 0.4 3.0 14.9 7.0 35.3 78.2 10.9 5.4 1.4 1.1 99%Diflubenzeron IGR 16.8 18.7 20.7 13.6 12.0 2.6 2.0 2.2 4.6 6.1 90%Pyriproxifen IGR 0.1 0.2 0.1 0.0 15.8 13.4 17.6 12.6 17.4 14.6 100%Fenitrothion OP 20.9 10.4 6.1 1.8 0.0 0.0 0.0 0.0 0.0 0.0 100%Fenthion OP 2.3 1.2 1.4 1.6 7.9 1.2 0.7 0.7 5.2 5.6 92%Bacillus sphaericus BL 4.0 1.0 13.7 0.3 0.5 0.1 0.2 0.2 0.1 0.9 99%Novaluron IGR 0.1 0.7 0.9 0.9 1.7 0.0 0.0 0.2 0.4 0.7 100%Polydimethylsiloxane NA 0.0 0.0 0.0 0.0 0.0 3.1 0.0 0.0 0.7 0.2 100%Methoprene IGR 0.2 0.2 0.2 0.0 0.0 0.0 0.0 0.0 0.1 0.1 95%
BL, bacterial larvicide; IGR, insect growth regulator; NA, not applicable; OP, organophosphate; SP, spinosyn
Of the non-conventional larvicide compounds (i.e. insecticide classes other than organochlorines, organophosphates, carbamates and pyrethroids), B. thuringiensis israelensis has been most commonly used, particularly in the Americas and South-East Asia regions, for control of dengue and malaria (Table 29). Another bacterial larvicide, B. sphaericus, was used in smaller quantities in the Americas and the Western Pacific regions, primarily for control of malaria. Insect growth regulators, including diflubenzeron, methoprene, novaluron, pyriproxyfen and triflumuron, have been used in small amounts, except in the Americas and the Eastern Mediterranean Region, where moderate amounts of diflubenzeron and pyriproxyfen were reported for control of malaria and dengue. The spinosyn compound spinosad has been used for dengue control in the Americas (21 t per year) and for malaria and dengue control in the Eastern Mediterranean Region (11 t per year). In the Americas, 84 t of B. thuringiensis israelensis were used for dengue control and 3.5 t of B. sphaericus for malaria control. Small amounts of polydimethylsiloxane, a silicon-based organic polymer that provides a physical barrier to breeding of mosquito vectors in aquatic habitats, have reportedly been used in the Americas, Eastern Mediterranean and South-East Asia regions.

Global insecticide use for vector-borne disease control
32
Table 29. Annual use of bacterial larvicides, insect growth regulators and other non-conventional larvicides, by region and disease or pest, expressed in metric tonnes of active ingredient
WHO region Active ingredientInsecticide
class
Vector-borne disease
Malaria Dengue Lymphatic filariasisAfrican Bacillus thuringiensis
israelensisBL 0.19 0.05 0.00
Diflubenzeron IGR 0.17 0.03 0.00Americas Bacillus sphaericus BL 3.46 0.05 0.00
Bacillus thuringiensis israelensis
BL 0.59 83.56 0.00
Diflubenzeron IGR 0.07 3.69 0.00Methoprene IGR 0.01 0.04 0.00Novaluron IGR 0.00 0.65 0.00Polydimethylsiloxane NA 0.24 0.24 0.14Pyriproxyfen IGR 0.00 7.78 0.00Spinosad SP 0.04 21.15 0.00
Eastern Mediterranean
Bacillus thuringiensis israelensis
BL 4.06 0.70 0.06
Diflubenzeron IGR 4.01 4.01 0.00Methoprene IGR 0.06 0.06 0.00Polydimethylsiloxane NA 0.13 0.00 0.00Pyriproxyfen IGR 1.26 1.26 0.00Spinosad SP 5.66 5.66 0.00Triflumuron IGR 0.00 0.00 0.00
European Bacillus thuringiensis israelensis
BL 0.18 0.00 0.00
Diflubenzeron IGR 0.02 0.00 0.00Methoprene IGR 0.00 0.00 0.00
South-East Asia Bacillus thuringiensis israelensis
BL 36.72 38.05 0.00
Diflubenzeron IGR 0.00 1.41 0.00Polydimethylsiloxane NA 0.00 0.03 0.00
Western Pacific Bacillus sphaericus BL 0.72 0.07 0.00Bacillus thuringiensis israelensis
BL 0.00 2.40 0.00
BL, bacterial larvicides; C, carbamates; IGR, insect growth regulators; NA, not applicable; NN, neonicotinoids; OC, organochlorines; OP, organophosphates; PY, pyrethroids; SP, spinosyns

A 10-year assessment (2010–2019) – Sixth edition
33
7.2 DDT
Use of the organochlorine DDT is restricted under the Stockholm Convention on Persistent Organic Pollutants (33). Consequently, data on use of this compound for disease vector control in countries will serve to inform activities under the Convention. The Convention has a separate mechanism for collecting data on the production and use of DDT. Thirteen countries reported use of DDT for malaria disease vector control during the period 2010–2019, 11 of which are in the African Region and 2 of which are in the South-East Asia Region (Table 30). Some countries have recently stopped using DDT: of the 13 countries that reported DDT use in 2010, only 5 still used DDT in 2019. All 13 countries reported use of DDT for malaria control. While India reported its use for control of both malaria and visceral leishmaniasis, its use for the latter was stopped in 2016 in response to the detection of resistance in the sandfly vectors (29, 30). Annual global use of DDT decreased from 3254 t of active ingredient in 2010 to 1177 t in 2019, a 64% decrease.
Table 30. Annual use of the organochlorine insecticide DDT for vector control, by country and year, expressed in metric tonnes of active ingredient. The data are the actual amounts reported by countries, with no weighting.
Country/region Disease
Year 2010–20192010 2011 2012 2013 2014 2015 2016 2017 2018 2019
Botswana Malaria 7 0 0 4 6 6 0 3 0 0 27Eritrea Malaria 14 17 5 0 0 0 0 0 0 0 36Eswatini Malaria 4 3 2 4 4 1 0 0 0 0 18Gambia Malaria 11 8 11 15 9 0 0 0 0 0 54Mauritius Malaria 0 0 0 0 0 0 0 0 0 0 0Mozambique Malaria 16 66 0 4 12 39 0 0 0 0 136Namibia Malaria 76 45 34 45 51 26 17 17 50 1 363Senegal Malaria 0 0 0 0 0 0 0 0 0 0 0South Africa Malaria 18 75 29 62 36 33 27 10 30 37 356Zambia Malaria 1 0 0 0 0 0 0 0 0 43 44Zimbabwe Malaria 169 135 105 105 92 100 241 277 207 118 1 549India Malaria 2 180 2 045 1 943 1 757 1 774 2 052 1 900 1 491 1 455 978 17 572India Leishmaniasis 758 1 166 1 149 1 335 1 055 60 0 0 0 0 5 523Myanmar Malaria 1 0 0 0 0 0 0 0 0 0 1Region:African All 315 349 186 239 210 204 286 308 287 199 2 582South-East Asia
All 2 938 3 211 3 091 3 092 2 829 2 112 1 900 1 491 1 455 978 23 095
World Malaria 2 496 2 393 2 129 1 995 1 984 2 256 2 186 1 798 1 742 1 177 20 155World Leishmaniasis 758 1 166 1 149 1 335 1 055 60 0 0 0 0 5 523World All 3 254 3 559 3 277 3 330 3 039 2 316 2 186 1 798 1 742 1 177 25 677

Global insecticide use for vector-borne disease control
34
The temporal pattern of DDT use shows a decreasing trend since 2008 (Fig. 6), which has been most striking in recent years and is attributable mainly to the reduced use in India.
Fig. 6. Annual global use of DDT for vector control (diseases combined) by WHO region; no weighting was applied.
0
1000
2000
3000
4000
5000
6000
2000
2001
2002
2003
2004
2005
2006
2007
2008
2009
2010
2011
2012
2013
2014
2015
2016
2017
2018
2019
Met
ric to
nnes
(a.i.)
Year
South-East AsiaAfrican
a.i., active ingredient
7.3 New active ingredients for indoor residual spraying
Products in two insecticide classes have recently been recommended for use in indoor residual spraying: a repurposed formulation of pirimiphos-methyl (organophosphate) and clothianidin (neonicotinoid). These products have longer residual activity than some others, of up to 12 months for pirimiphos-methyl 300 CS (34) and up to 9 months for clothianidin (35), depending on the substrate, as compared with approximately 3 months for bendiocarb and 6 months for DDT (36, 37). Moreover, neonicotinoids provide an additional means for managing resistance to insecticides in malaria vector control, which is an important obstacle to the control and elimination of malaria in Africa and elsewhere (38, 39). With the evolution and spread of pyrethroid resistance, use of pirimiphos-methyl increased rapidly from 2012 onwards, to a peak in 2017, and decreased subsequently (Fig. 7), coinciding with the prequalification of neonicotinoid insecticides for indoor residual spraying and the conditional WHO recommendation for use of pyrethroid–piperonyl butoxide nets, both of which provide alternatives for vector control in areas of pyrethroid resistance. Use of repurposed pirimiphos-methyl (96% for malaria control, 4% for dengue control) and clothianidin (100% for malaria control) has been concentrated in the African Region. It is imperative that such new active ingredients and products be used in accordance with a plan to preserve susceptibility to the new modes of action in the targeted vector populations.

A 10-year assessment (2010–2019) – Sixth edition
35
Fig. 7. Annual global use of two new active ingredients for indoor residual spraying (diseases combined)
–
200
400
600
800
1000
1200
2010 2011 2012 2013 2014 2015 2016 2017 2018 2019
Met
ric to
nnes
(a.i.)
Year
ClothianidinPirimiphos-methyl
a.i., active ingredient

Global insecticide use for vector-borne disease control
36
8. Conclusion
In the period 2010–2019, various active ingredients in several insecticide classes were used for vector control. The most frequently used in spraying operations (i.e. excluding ITNs), in terms of the amount of active ingredient, were DDT, malathion, pirimiphos-methyl, propoxur and bendiocarb.
Annual global use of insecticides in spraying operations was 3314 t active ingredient of organochlorines, 1625 t of organophosphates, 677 t of carbamates, 194 t of pyrethroids and 36 t of neonicotinoids. In comparison with data from the previous reporting period, 2000–2009, use of organochlorines and pyrethroids decreased by 25% and 53%, respectively, while use of organophosphates and carbamates increased, that of carbamates increasing from 30 t of active ingredient in 2000–2009 to 677 t in 2010–2019 and that of neonicotinoids from 0 to 36 t. During 2010–2019, use of organochlorines decreased further, that of organophosphates continued to increase and that of carbamates increased temporarily.
Insecticides were used mainly for control of malaria (61% of total use), followed by dengue (24%), leishmaniasis (13%) and Chagas disease (2%). The amounts of insecticide used for control of dengue may have been underestimated because dengue vector control is decentralized in many countries. Large differences among WHO regions were found in terms of disease-specific insecticide use, insecticide classes used and types of intervention used. The number of countries that reported use of pyrethroids (excluding ITNs) for control of malaria, dengue, leishmaniasis and Chagas disease decreased steadily during the study period, possibly in response to detection of insecticide resistance.
The largest amounts of insecticides used in spraying operations were applied for residual spraying, followed by space spraying. Use of ITN-kits for treating conventional nets was minor, as these nets have been largely replaced by factory-treated ITNs for malaria control. Use of larvicides remained relatively low, despite an increase in the contributions of bacterial larvicides, insect growth regulators and spinosyns. Insecticides were used for control of malaria, leishmaniasis and Chagas disease predominantly by residual spraying, while insecticides were applied for dengue control mainly by space spraying and partly by larviciding and residual spraying.
Vector control insecticides have been used not only in spraying operations but also on a large scale in treatment of ITNs. The annual global use of pyrethroids in ITNs was 625 t active ingredient of pyrethroids during the period 2010–2019, of which 87% was for ITNs delivered to sub-Saharan Africa. ITNs accounted for 76% of the annual global use of pyrethroids for vector control.

A 10-year assessment (2010–2019) – Sixth edition
37
Use of DDT for vector control, which is restricted under the Stockholm Convention on Persistent Organic Pollutants, decreased by 64% during the period 2010–2019, and the number of countries that used DDT in malaria control decreased from 13 in 2010 to 5 in 2019.
Use of two new active ingredients, pirimiphos-methyl (organophosphate) and clothianidin (neonicotinoid), has increased rapidly for indoor residual spraying in the African Region. It is imperative that these new active ingredients be used in accordance with a plan to preserve susceptibility to the modes of action in the targeted vector populations, for example, by annual rotation of products with different modes of action.
Global insecticide use for vector-borne disease control
38
References
1. Global vector control response 2017–2030. Geneva: World Health Organization; 2017 (http://apps.who.int/iris/bitstream/handle/10665/259205/9789241512978-eng.pdf).
2. Kyu HH, Abate D, Abate KH, Abay SM, Abbafati C, Abbasi N et al. Global, regional, and national disability-adjusted life-years (DALYs) for 359 diseases and injuries and healthy life expectancy (HALE) for 195 countries and territories, 1990–2017: a systematic analysis for the Global Burden of Disease Study 2017. Lancet. 2018;392:1859–922.
3. Wilson AL, Courtenay O, Kelly-Hope LA, Scott TW, Takken W, Torr SJ et al. The importance of vector control for the control and elimination of vector-borne diseases. PLoS Negl Trop Dis. 2020;14:e0007831.
4. Bhatt S, Weiss DJ, Cameron E, Bisanzio D, Mappin B, Dalrymple U et al. The effect of malaria control on Plasmodium falciparum in Africa between 2000 and 2015. Nature. 2015;526:207–11.
5. International Code of Conduct on Pesticide Management. Rome: Food and Agriculture Organization of the United Nations; Geneva: World Health Organization; 2014 (http://www.fao.org/fileadmin/templates/agphome/documents/Pests_Pesticides/Code/CODE_2014Sep_ENG.pdf).
6. Global situation of pesticide management in agriculture and public health. Report of a 2018 WHO–FAO survey. Geneva: World Health Organization; Rome: Food and Agriculture Organization of the United Nations; 2019 (https://apps.who.int/iris/bitstream/handle/10665/329971/9789241516884-eng.pdf).
7. Global report on insecticide resistance in malaria vectors: 2010–2016. Geneva: World Health Organization; 2018.
8. Moyes CL, Vontas J, Martins AJ, Ng LC, Koou SY, Dusfour I et al. Contemporary status of insecticide resistance in the major Aedes vectors of arboviruses infecting humans. PLoS Negl Trop Dis. 2017;11:e0005625.
9. Prequalification vector control. Geneva: World Health Organization; 2021 (http://www.who.int/pq-vector-control/en/).
10. Stockholm Convention on Persistent Organic Pollutants (POPs), as amended in 2009. Nairobi: United Nations Environment Programme; 2010 (http://chm.pops.int/TheConvention/Overview/TextoftheConvention/tabid/2232/Default.aspx).
11. Basel Convention on the Control of Transboundary Movements of Hazardous Waste and their disposal. Nairobi: United Nations Environment Programme; 2012 (http://www.basel.int/Portals/4/Basel%20Convention/docs/text/BaselConventionText-e.pdf).
12. Rotterdam Convention on the Prior Informed Consent Procedure for Certain Hazardous Chemicals and Pesticides in International Trade. Nairobi: United Nations Environment Programme; 2011 (http://www.pic.int/TheConvention/Overview/TextoftheConvention/tabid/1048/language/en-US/Default.aspx).

A 10-year assessment (2010–2019) – Sixth edition
39
13. Strategy to address highly hazardous pesticides in the context of the Strategic Approach to International Chemicals Management. Resolution, 4th International Conference of Chemicals Management (ICCM4). 2015. (http://www.saicm.org/Portals/12/Documents/EPI/HHP%20strategy%20English.pdf).
14. Zaim M. Global insecticide use for vector-borne disease control. Geneva: World Health Organization; 2002. (https://apps.who.int/iris/handle/10665/67206).
15. Zaim M, Jambulingam P. Global insecticide use for vector-borne disease control, second edition. Geneva: World Health Organization; 2004. (https://apps.who.int/iris/handle/10665/68803).
16. Zaim M, Jambulingam P. Global insecticide use for vector-borne disease control, third edition. Geneva: World Health Organization; 2007. (https://apps.who.int/iris/handle/10665/69656).
17. Global insecticide use for vector-borne disease control, fourth edition. Geneva: World Health Organization; 2009. (http://apps.who.int/iris/bitstream/handle/10665/44220/9789241598781_eng.pdf).
18. Global use of insecticides for vector-borne disease control: a 10-year assessment, 2000–2009. Geneva: World Health Organization; 2011 (http://whqlibdoc.who.int/publications/2011/9789241502153_eng.pdf).
19. World Population Prospects 2019. New York City (NY): United Nations, Department of Economic and Social Affairs; 2020. (https://population.un.org/wpp/Download/Standard/Population/).
20. WHO specifications and evaluations for public health pesticides: Bacillus thuringiensis subspecies israelensis strain AM65-52. Geneva: World Health Organization Pesticide Evaluation Scheme; 2007 (https://www.who.int/pq-vector-control/prequalified-lists/Bacillus_thuringiensis_subspecies_israelensis.pdf).
21. Najera JA, Zaim M. Malaria vector control: decision making criteria and procedures for judicious use of insecticides. Geneva: World Health Organization; 2002. (https://www.who.int/malaria/publications/atoz/who_cds_whopes_2002_5_rev_1/en/).
22. Pesticides and their application for the control of vectors and pests of public health importance. Geneva: World Health Organization; 2006 (http://whqlibdoc.who.int/hq/2006/WHO_CDS_NTD_WHOPES_GCDPP_2006.1_eng.pdf).
23. Dengue: guidelines for diagnosis, treatment, prevention and control. Geneva: World Health Organization; Special Programme for Research and Training in Tropical Diseases; 2009 (http://apps.who.int/tdr/svc/publications/training-guideline-publications/dengue-diagnosis-treatment).
24. Generic risk assessment model for indoor and outdoor space spraying of insecticides. Geneva: World Health Organization; 2011 (http://whqlibdoc.who.int/publications/2010/9789241599542_eng.pdf).
25. Space spray application of insecticides for vector and public health pest control: a practitioner’s guide. Geneva: World Health Organization; 2003; (http://whqlibdoc.who.int/hq/2003/WHO_CDS_WHOPES_GCDPP_2003.5.pdf).
26. Esu E, Lenhart A, Smith L, Horstick O. Effectiveness of peridomestic space spraying with insecticide on dengue transmission; systematic review. Trop Med Int Health. 2010;15:619–31.
27. Bowman LR, Donegan S, McCall PJ. Is dengue vector control deficient in effectiveness or evidence? Systematic review and meta-analysis. PLoS Negl Trop Dis. 2016;10:e0004551.

Global insecticide use for vector-borne disease control
40
28. Guidelines for malaria vector control. Geneva: World Health Organization; 2019. (https://apps.who.int/iris/bitstream/handle/10665/310862/9789241550499-eng.pdf).
29. Coleman M, Foster GM, Deb R, Singh RP, Ismail HM, Shivam P et al. DDT-based indoor residual spraying suboptimal for visceral leishmaniasis elimination in India. Proc Natl Acad Sci U S A. 2015;112:8573–8.
30. Dhiman RC, Yadav RS. Insecticide resistance in phlebotomine sandflies in Southeast Asia with emphasis on the Indian subcontinent. Infect Dis Poverty. 2016;5:106.
31. Gomez MB, Diotaiuti LG, Gorla DE. Distribution of pyrethroid resistant populations of Triatoma infestans in the southern cone of South America. PLoS Negl Trop Dis. 2016;10(3):e0004561.
32. Conditions for deployment of mosquito nets treated with a pyrethroid and piperonyl butoxide. Geneva: World Health Organization; 2017. (http://apps.who.int/iris/bitstream/handle/10665/258939/WHO-HTM-GMP-2017.17-eng.pdf).
33. Stockholm Convention on Persistent Organic Pollutants. Texts and annexes. Revised in 2017. Nairobi: United Nations Environment Programme; 2018. (http://chm.pops.int/TheConvention/Overview/TextoftheConvention/tabid/2232/Default.aspx).
34. Oxborough RM, Kitau J, Jones R, Feston E, Matowo J, Mosha FW et al. Long-lasting control of Anopheles arabiensis by a single spray application of micro-encapsulated pirimiphos-methyl (Actellic® 300 CS). Malar J. 2014;13:37.
35. Ngwej LM, Hattingh I, Mlambo G, Mashat EM, Kashala JCK, Malonga FK et al. Indoor residual spray bio-efficacy and residual activity of a clothianidin-based formulation (SumiShield® 50WG) provides long persistence on various wall surfaces for malaria control in the Democratic Republic of the Congo. Malar J. 2019;18:1–18.
36. Bradley J, Matias A, Schwabe C, Vargas D, Monti F, Nseng G et al. Increased risks of malaria due to limited residual life of insecticide and outdoor biting versus protection by combined use of nets and indoor residual spraying on Bioko Island, Equatorial Guinea. Malar J. 2012;11:1–9.
37. WHO recommended insecticides for indoor residual spraying against malaria vectors. Geneva: World Health Organization; 2017 (http://www.who.int/whopes/Insecticides_IRS_2_March_2015.pdf).
38. Ranson H, Lissenden N. Insecticide resistance in African Anopheles mosquitoes: a worsening situation that needs urgent action to maintain malaria control. Trends Parasitol. 2016;32:187–96.
39. Hemingway J, Ranson H, Magill A, Kolaczinski J, Fornadel C, Gimnig J et al. Averting a malaria disaster: Will insecticide resistance derail malaria control? Lancet. 2016;387:1785–8.

A 10-year assessment (2010–2019) – Sixth edition
41
Annex 1. Data reporting form
DATA ON THE USE OF INSECTICIDES BY MEMBER STATES FOR VECTOR-BORNE DISEASE CONTROL
In completing the form, please follow the instructions given below. Each row is for a single application of a pesticide:
Example:
YEARCOMPOUND or PRODUCT1 CLASS2
FORMU-LATION3
CONCEN-TRATION4
TYPE OF APPLICATION5
FOR CONTROL
OF6
AMOUNT OF
FORMUL-ATION USED
(kg or L)7
AMOUNT OF ACTIVE
INGREDIENT (kg)8
2010 Pirimiphos-methyl
OP CS 300 g/L Indoor residual spraying
Malaria 1,000 L 300
2010 Deltamethrin PY SC 10 g/L Treatment of mosquito nets
Malaria 200 L 2
20… Temephos OP GR 10 g/kg Larviciding Dengue 1500 kg 15
20… Diflubenzuron BU WP 250 g/kg Larviciding Dengue 500 kg 125
20… Bacillus thuringiensis israelensis
BL WG 3000 ITU/mg Larviciding Malaria 200 kg −
20… Malathion OP EW 400 g/L Space spraying Dengue 1000 L 400
20…. Clothianidin NN WG 500 g/kg Indoor residual spraying
Malaria 1000 kg 500
1. COMPOUND or PRODUCT – Only list the chemical name of the pesticide (e.g., malathion, deltamethrin, diflubenzuron), or in the case of bacterial larvicides the name of the genus, species and subspecies (e.g. Bacillus thuringiensis israelensis).
Note: The use of trade name should be avoided since a product may be registered under different trade names, in different countries.
2. CLASS – Indicate the chemical class, e.g. BL = bacterial larvicide; BU = benzoylureas; C = carbamate; JH = juvenile hormone mimics; NN = neonicotinoid; OC = organochlorine; OP = organophosphate; PY = pyrethroid; SP = spinosyns.
3. FORMULATION – Indicate the formulation type according to the label/packaging of the product, e.g.:
CS = capsule suspension; DP = dustable powder; DT = tablet for direct application; EC = emulsifiable concentrate; EW = emulsion, oil in water; GR = granule; MR = Matrix release; SC = suspension concentrate; SC-PE = polymer enhanced suspension concentrate; UL = ultra-low volume liquid; WG = water dispersible granules; WG-SB = water dispersible granules packaged in water soluble bags; WP = wettable powder; WP-SB = wettable powder packaged in water soluble bags; WT = water dispersible tablet.
4. CONCENTRATION – Indicate the concentration of the active ingredient of the insecticide in the formulation, as a percentage (e.g. 5%). Special care is required as product label/packaging usually provides this information in g/kg or g/L.

Global insecticide use for vector-borne disease control
42
5. TYPE OF APPLICATION – Indicate the type of application, e.g.:
Indoor residual spraying Treatment of mosquito nets
Space spraying Larviciding
Dusting (e.g. for flea control)
6. FOR CONTROL OF – Name the disease or pest control activity for which the pesticide is used, e.g., malaria, dengue, Chagas disease, onchocerciasis, visceral leishmaniasis, JE; or house fly/flea control, or general mosquito nuisance control.
7. AMOUNT OF FORMULATION USED – Indicate the amount of formulation used in kg (for solids) or L (for liquids) (Excel sheet-1).
8. AMOUNT OF ACTIVE INGREDIENT –The amount of active ingredient used is equal to the amount of formulation used X concentration of the formulation, e.g., where 1000 kg of malathion 50%WP has been used, the total amount of active ingredient used is = 1000 X 50/100 = 500 kg.

A 10-year assessment (2010–2019) – Sixth edition
43
Annex 2. Annual responses by countries
WHO Region
Targeted country
Population (mln)b
Responding countries by year2010 2011 2012 2013 2014 2015 2016 2017 2018 2019
African Algeria 43.1 Angola 31.8 1 1 1 Benin 11.8 1 1 1 1 1 1 1 1 1 Botswana 2.3 1 1 1 1 1 1 1 1 1 1Burkina Faso 20.3 1 1 1 1 1 1 1Burundi 11.5 1 1 Cabo Verde 0.5 Cameroon 25.9 Central African Republic
4.7
Chad 15.9 1 1 Comoros (the) 0.9 Congo 5.4 Democratic Rep. of the Congo
86.8
Côte d'Ivoire 25.7 1 1 1 1 1 1 1 1 1 1Equatorial Guinea
1.4
Eritrea 3.5 1 1 1 1 1 1 1 1 1 1Eswatini 1.1 1 1 1 1 1 1 1 1 1 1Ethiopia 112.1 1 1 1 1 1 1 1 1 1 1Gabon 2.2 Gambia 2.3 1 1 1 1 1 Ghana 30.4 1 1 1 1 1 1 1 1 1 1Guinea 12.8 Guinea-Bissau 1.9 Kenya 52.6 1 1 Lesotho 2.1 Liberia 4.9 Madagascar 27.0 1 1 1 1 1 1 1 1 1

Global insecticide use for vector-borne disease control
44
WHO Region
Targeted country
Population (mln)b
Responding countries by year2010 2011 2012 2013 2014 2015 2016 2017 2018 2019
Malawi 18.6 Mali 19.7 1 1 1 1 1 1 1 1 1 1Mauritania 4.5 Mauritius 1.3 1 1 1 1 1 Mozambique 30.4 1 1 1 1 1 1 1 1 1 1Namibia 2.5 1 1 1 1 1 1 1 1 1 1Niger 23.3 1 1 1 Nigeria 201.0 1 1 1 Rwanda 12.6 1 1 1 1 1 1 1 1 1 1Sao Tomé & Principe
0.2
Senegal 16.3 1 1 1 1 1 1 1 1 Seychelles 0.1 Sierra Leone 7.8 South Africa 58.6 1 1 1 1 1 1 1 1 1 1South Sudan 11.1 United Rep. of Tanzania
58.0 1 1 1 1 1 1 1 1 1
Togo 8.1 1 Uganda 44.3 1 1 1 1 1 1 1 1 1 1Zambia 17.9 1 1 1 1 1 1 1 1 1 1Zimbabwe 14.6 1 1 1 1 1 1 1 1 1 1
American Antigua and Barbuda
0.1
Argentina 44.8 1 1 1 1 1 1 Bahamas 0.4 1 1 1 1 1 1 1 1 Barbados 0.3 Belize 0.4 1 1 1 1 1 1 1 1 1 1Bolivia (Plurinational State of)
11.5 1 1 1 1 1 1 1 1 1 1
Brazil 211.0 1 1 1 1 1 1 1 1 1 1Chile 19.0 1 1 1 1 1 1 1 1 1 1Colombia 50.3 1 1 1 1 1 1 1 1 1Costa Rica 5.0 1 1 1 1 1 1 1 1 1 1Cuba 11.3 1 1 1 1 1 1 1 1 1 1Dominica 0.1 Dominican Republic (the)
10.7 1 1 1 1 1 1 1 1

A 10-year assessment (2010–2019) – Sixth edition
45
WHO Region
Targeted country
Population (mln)b
Responding countries by year2010 2011 2012 2013 2014 2015 2016 2017 2018 2019
Ecuador 17.4 1 1 1 1 1 1 1 1 El Salvador 6.5 1 1 1 1 1 1 1 1 Grenada 0.1 1 1 1 1 1 1 1 1 Guatemala 17.6 1 1 1 1 1 1 1 1 1 1Guyana 0.8 1 1 Haiti 11.3 1 1 1 1 1 1Honduras 9.7 Jamaica 2.9 Mexico 127.6 1 1 1 1 1 1 1 1 1 1Nicaragua 6.5 Panama 4.2 1 1 1 1 1 1 Paraguay 7.0 1 1 1 1 1 1 1 1 1 1Peru 32.5 1 1 1 1 1 1 1 Saint Kitts and Nevis
0.1
Saint Lucia 0.2 Saint Vincent and the Grenadines
0.1
Suriname 0.6 Trinidad and Tobago
1.4 1 1 1 1 1 1
Uruguay 3.5 1 1 1 1 1 1 1 1 Venezuela (Bolivarian Rep. of)
28.5
South-East Asia
Bangladesh 163.0 1 1 1 1 1 1 1 1 1 1Bhutan 0.8 1 1 1 1 1 1India 1366.4 1 1 1 1 1 1 1 1 1 1Indonesia 270.6 1 1 1 1 1 1 1 1 1 1Democratic People’s Republic of Korea
25.7 1 1 1 1 1 1 1 1
Maldives 0.5 1 1 1 1 1 1 Myanmar 54.0 1 1 1 1 1 1 1 1 1 1Nepal 28.6 1 1 1 1 1 1 1 1 1 1Sri Lanka 21.3 1 1 1 1 1 1 1 1 1 1Thailand 69.6 1 1 1 1 1 1 Timor-Leste 1.3 1 1 1 1 1

Global insecticide use for vector-borne disease control
46
WHO Region
Targeted country
Population (mln)b
Responding countries by year2010 2011 2012 2013 2014 2015 2016 2017 2018 2019
European Albania 2.9 Armenia 3.0 1 1 1 1 1 Azerbaijan 10.0 Bosnia and Herzegovina
3.3 1 1 1 1 1
Bulgaria 7.0 Croatia 4.1 Cyprus 1.2 1 1 1 1 1 Estonia 1.3 France 65.1 Georgia 4.0 Greece 10.5 Hungary 9.7 Israel 8.5 Italy 60.6 Kazakhstan 18.6 1 1 1 1 1 Kyrgyzstan 6.4 Republic of Moldova
4.0 1 1 1
Montenegro 0.6 1 1 1 1 1 North Macedonia
2.1 1 1 1 1 1
Portugal 10.2 Romania 19.4 Russian Federation
145.9
Serbia 8.8 Spain 46.7 Switzerland 8.6 Tajikistan 9.3 Turkey 83.4 Ukraine 44.0 Uzbekistan 33.0

A 10-year assessment (2010–2019) – Sixth edition
47
WHO Region
Targeted country
Population (mln)b
Responding countries by year2010 2011 2012 2013 2014 2015 2016 2017 2018 2019
Eastern Mediter-ranean
Afghanistan 38.0 1 1 1 1 1Bahrain 1.6 1 1 1 1 1 1 1 1 1Djibouti 1.0 1 1 1 1 1 1 1 1 1 1Egypt 100.4 Iran (Islamic Republic of)
82.9 1 1 1 1 1 1 1 1
Iraq 39.3 1 1 1 1 1 1 1 1 1 1Jordan 10.1 1 1 1 1 1 1 1 1 1 1Kuwait 4.2 1 1 1 1 1 1 1 1 Lebanon 6.9 1 1 1 1 1 1 1 1 1 1Libya 6.8 Morocco 36.5 1 1 1 1 1 1 1 1 1 1Oman 5.0 1 1 1 1 1 Pakistan 216.6 1 1 1 1 1 1 1 1 1 1Qatar 2.8 Saudi Arabia 34.3 1 1 1 1 1 1 1 1 1 1Somalia 15.4 1 1 Sudan 42.8 1 1 1 1 1 1 1 1 Syrian Arab Rep. 17.1 1 1 1 1 1 1 1 1 1 1Tunisia 11.7 1 1 1 1 1 United Arab Emirates
9.8 1 1 1 1 1 1 1 1 1 1
Yemen 29.2 1 1 1 1 1 1 1 1 1 1Western Pacific
Brunei Darussalam
0.4
Cambodia 16.5 1 1 1 1 1 1 1 1 1 1China 1433.8 1 1 1 1 1 1 1 1 1 1Cook Islands 0.0 Fiji 0.9 1 1 1 1 1 1 1 1 1 1Kiribati 0.1 Lao People’s Democratic Republic
7.2 1 1 1 1 1 1 1 1 1 1
Malaysia 31.9 Marshall Islands 0.1 Micronesia (Fed. States of)
0.1
Mongolia 3.2 Nauru 0.0 Niue 0.0 Palau 0.0

Global insecticide use for vector-borne disease control
48
WHO Region
Targeted country
Population (mln)b
Responding countries by year2010 2011 2012 2013 2014 2015 2016 2017 2018 2019
Papua New Guinea
8.8
Philippines 108.1 Samoa 0.2 Singapore 5.8 Solomon Islands 0.7 1 1 1 1 1 1 1 1 1 1Tonga 0.1 Tuvalu 0.0 Vanuatu 0.3 Viet Nam 96.5 1 1 1 1 1 1 1 1 1 1
By WHO Region: African 1091.8 24 23 23 25 24 18 18 19 19 15American 643.5 20 20 20 19 21 22 18 18 11 11 South-East Asia 2001.9 10 9 9 9 10 11 9 8 8 8 European 632.2 6 6 7 7 7 Eastern Mediterranean 712.3 15 16 17 17 18 15 14 14 12 12 Western Pacific 1714.7 6 6 6 6 6 6 6 6 6 6 All 6796.4 81 80 82 83 86 72 65 65 56 52

A 10-year assessment (2010–2019) – Sixth edition
49
Annex 3. Annual use of insecticides for vector control
Table A3.1. Annual use of insecticides for vector control in spraying operations (diseases combined), by region, intervention type, insecticide class and year, expressed in metric tonnes of active ingredient
Insecticide
class
Year
WHO region Intervention type 2010 2011 2012 2013 2014 2015 2016 2017 2018 2019
African Residual spraying OC 392.7 435.5 238.5 297.6 266.6 266.3 384.5 409.5 396.1 283.2
OP 0.6 0.0 27.2 74.5 247.3 352.8 775.8 1098.0 910.6 390.6
C 92.3 177.5 730.9 837.5 678.8 798.3 28.9 3.9 0.0 0.0
PY 61.0 58.8 47.9 39.8 33.0 31.5 27.0 18.7 9.0 13.4
NN 0.0 0.0 0.0 0.0 0.0 0.0 0.0 0.0 126.9 218.1
Space spraying OP 0.0 0.0 0.0 0.0 0.0 0.0 0.0 0.0 0.0 0.6
PY 0.1 0.0 0.2 0.1 0.1 0.0 0.2 0.0 0.1 0.1
ITN-kits PY 0.0 0.0 0.0 0.0 0.0 0.0 0.0 0.0 0.0 0.0
Larviciding OP 3.1 3.1 2.4 2.3 3.1 2.3 3.2 1.6 2.7 2.5
BL 0.2 0.0 0.3 0.2 0.0 0.0 0.1 0.2 0.1 0.0
IGR 0.9 0.0 0.0 0.1 0.0 0.0 0.0 0.0 0.0 0.0
Americas Residual spraying OP 25.8 8.7 7.3 4.7 4.0 4.3 0.0 0.0 0.4 0.4
C 223.6 117.2 210.2 36.9 1761.9 87.5 27.8 32.9 27.3 7.5
PY 20.8 143.0 21.8 20.5 15.9 16.2 12.2 24.7 16.7 16.2
Space spraying OP 462.5 325.1 439.0 959.4 962.8 1607.0 1760.5 1112.7 1107.8 1660.2
C 2.5 2.5 11.0 35.6 43.6 69.0 66.5 50.7 4.8 50.5
PY 78.9 52.3 49.0 92.1 57.1 28.0 19.5 20.8 16.6 32.6
NN 0.0 0.0 0.0 0.0 0.0 0.0 0.0 0.0 0.1 2.9
ITN-kits PY 0.0 0.3 0.0 0.0 0.0 0.0 0.0 0.0 0.0 0.0
Larviciding OP 111.1 99.6 121.9 67.1 40.9 28.8 38.9 28.2 22.8 24.9
BL 6.7 5.2 33.8 8.3 6.6 6.2 290.4 59.0 5.5 9.4
IGR 10.7 13.8 14.3 12.9 6.9 13.1 17.6 12.7 18.0 15.5
SP 0.0 2.9 14.4 7.0 35.3 24.9 10.8 5.4 1.1 1.1
Eastern Mediter-ranean
Residual spraying OP 0.0 0.1 0.0 0.0 0.0 0.0 0.0 0.0 0.0 0.0
C 5.7 26.4 40.9 55.4 49.8 86.6 90.7 94.3 9.7 7.6
PY 17.4 21.1 10.2 19.4 11.1 18.8 10.9 11.3 10.3 11.1
NN 0.0 0.0 0.0 0.0 0.0 0.0 0.0 0.0 0.0 12.0

Global insecticide use for vector-borne disease control
50
Insecticide
class
Year
WHO region Intervention type 2010 2011 2012 2013 2014 2015 2016 2017 2018 2019
Space spraying OP 0.4 0.4 0.4 0.0 0.0 0.0 0.0 0.0 0.0 0.0
C 0.0 0.0 0.0 0.0 0.0 0.0 0.1 0.1 0.1 0.0
PY 10.3 12.1 10.6 8.7 8.4 21.8 17.8 12.4 2.6 1.9
ITN-kits PY 0.0 0.0 0.0 0.0 0.0 0.0 0.0 0.0 0.0 0.0
Larviciding OP 16.4 20.8 17.9 22.6 17.2 9.9 8.7 17.6 8.7 9.9
BL 2.5 1.6 4.0 2.6 4.0 4.9 0.5 0.1 2.6 1.2
IGR 5.6 6.0 7.5 1.6 22.6 2.9 2.1 2.0 2.1 1.3
SP 0.4 0.1 0.4 0.1 0.0 53.3 0.1 0.0 0.4 0.0
European Residual spraying OP 1.6 0.8 1.5 0.1 0.1 0.0 0.0 0.0 0.0 0.0
PY 0.0 0.0 0.0 0.0 0.1 0.0 0.0 0.0 0.0 0.0
Space spraying PY 0.0 0.0 0.0 0.0 0.0 0.0 0.0 0.0 0.0 0.0
ITN-kits PY 0.0 0.0 0.0 0.0 0.0 0.0 0.0 0.0 0.0 0.0
Larviciding BL 0.0 0.0 0.8 0.0 0.0 0.0 0.0 0.0 0.0 0.0
IGR 0.0 0.0 0.1 0.0 0.0 0.0 0.0 0.0 0.0 0.0
South-East Asia
Residual spraying OC 3658.0 4010.8 3953.8 3856.9 3588.5 2754.1 2556.4 1985.1 2010.2 1393.5
OP 69.4 89.8 181.9 88.1 116.0 38.6 18.0 11.7 0.4 2.8
C 0.0 0.0 0.0 0.0 0.0 7.2 7.5 12.0 0.0 1.6
PY 29.0 28.5 32.0 22.3 25.4 23.2 33.9 27.1 21.6 14.4
Space spraying OP 48.9 2.7 6.2 3.4 8.5 25.3 17.8 4.7 8.1 2.4
PY 2.2 2.9 0.9 2.8 3.1 8.4 3.7 3.6 2.4 22.0
ITN-kits PY 0.0 0.0 0.0 0.0 0.0 0.0 0.0 0.0 0.0 0.0
Larviciding OP 5.8 11.2 7.8 15.8 15.9 15.3 16.1 24.7 20.4 45.9
BL 119.9 21.0 23.4 18.5 86.4 16.6 26.0 16.3 17.0 20.6
IGR 0.0 0.0 0.0 0.0 0.0 0.0 0.0 0.2 2.3 4.6
Western Pacific
Residual spraying OP 5.0 0.0 2.3 0.0 0.0 0.0 0.0 0.0 0.0 0.0
C 0.0 1.2 1.0 0.0 1.3 0.0 0.0 0.0 37.3 14.2
PY 7.8 3.9 4.5 5.1 12.6 5.0 9.9 6.3 43.4 12.3
Space spraying OP 2.6 1.5 1.4 7.8 99.2 6.0 6.1 6.1 13.5 27.7
C 0.0 0.0 0.0 0.5 0.7 0.0 0.2 0.2 0.8 0.0
PY 2.8 1.8 2.2 3.3 66.7 8.3 11.6 12.8 7.5 36.4
ITN-kits PY 3.4 2.9 3.0 1.5 1.0 0.8 3.3 0.9 0.8 3.0
Larviciding OP 1.6 1.9 2.5 4.8 14.1 2.8 3.3 3.5 6.8 9.6
BL 4.3 0.0 1.0 0.2 2.1 1.2 1.0 1.0 0.0 4.7
BL, bacterial larvicides; C, carbamates; IGR, insect growth regulators; NN, neonicotinoids; OC, organochlorines; OP, organophosphates; PY, pyrethroids; SP, spinosyns
Table A3.1 (Cont’d). Annual use of insecticides for vector control in spraying operations (diseases combined), by region, intervention type, insecticide class and year, expressed in metric tonnes of active ingredient

A 10-year assessment (2010–2019) – Sixth edition
51
Table A3.2. Annual use of insecticides for vector control of malaria in spraying operations, by region, intervention type, insecticide class and year, expressed in metric tonnes of active ingredient
Insecticide
class
Year
WHO region Intervention type 2010 2011 2012 2013 2014 2015 2016 2017 2018 2019
African Residual spraying OC 392.7 435.5 238.5 297.6 266.6 266.3 384.5 409.5 396.1 283.2
OP 0.6 0.0 27.2 74.5 247.3 352.8 775.8 1098.0 910.6 390.6
C 92.3 177.5 730.9 837.5 678.8 798.3 28.9 3.9 0.0 0.0
PY 61.0 58.8 47.9 39.8 32.9 31.5 27.0 18.7 9.0 13.4
NN 0.0 0.0 0.0 0.0 0.0 0.0 0.0 0.0 126.9 218.1
Space spraying PY 0.0 0.0 0.2 0.1 0.1 0.0 0.2 0.0 0.0 0.0
ITN-kits PY 0.0 0.0 0.0 0.0 0.0 0.0 0.0 0.0 0.0 0.0
Larviciding OP 2.9 2.9 2.3 2.2 2.9 2.3 3.2 1.6 2.7 2.5
BL 0.1 0.0 0.3 0.2 0.0 0.0 0.1 0.2 0.0 0.0
IGR 0.7 0.0 0.0 0.1 0.0 0.0 0.0 0.0 0.0 0.0
Americas Residual spraying OP 25.8 8.7 7.3 4.7 4.0 4.3 0.0 0.0 0.4 0.4
C 0.2 0.2 0.1 0.2 0.2 12.9 0.0 0.1 0.1 0.1
PY 7.1 38.4 8.1 7.1 5.9 7.7 5.4 17.2 10.2 12.9
Space spraying OP 71.9 28.5 26.4 77.2 102.6 144.1 13.1 17.3 9.8 9.8
PY 26.8 12.6 8.6 5.9 6.1 0.7 0.8 0.3 0.1 0.1
ITN-kits PY 0.0 0.3 0.0 0.0 0.0 0.0 0.0 0.0 0.0 0.0
Larviciding OP 20.3 20.4 17.3 10.1 9.0 7.4 0.3 0.2 0.2 0.2
BL 1.1 1.4 13.9 1.2 0.4 0.2 0.4 0.4 0.2 1.0
IGR 0.0 0.0 0.0 0.0 0.0 0.0 0.0 0.0 0.2 0.2
SP 0.0 0.0 0.0 0.0 0.0 0.0 0.0 0.0 0.0 0.0
Eastern Mediter-ranean
Residual spraying OP 0.0 0.1 0.0 0.0 0.0 0.0 0.0 0.0 0.0 0.0
C 0.0 6.7 13.0 17.6 24.1 37.1 38.7 39.9 8.5 5.8
PY 13.5 13.9 3.8 10.1 6.3 9.0 5.5 5.4 5.0 4.5
NN 0.0 0.0 0.0 0.0 0.0 0.0 0.0 0.0 0.0 12.0
Space spraying OP 0.4 0.4 0.4 0.0 0.0 0.0 0.0 0.0 0.0 0.0
C 0.0 0.0 0.0 0.0 0.0 0.0 0.1 0.1 0.1 0.0
PY 2.9 5.0 4.5 3.4 3.8 8.2 7.9 5.3 1.1 0.6
Larviciding OP 16.4 13.0 12.0 8.3 7.0 3.7 4.4 12.9 2.7 0.9
BL 2.0 1.6 3.2 2.6 4.0 4.2 0.5 0.1 1.3 0.6
IGR 2.8 3.0 3.8 0.8 11.3 1.4 1.0 1.0 1.1 0.6
SP 0.2 0.0 0.2 0.0 0.0 26.6 0.0 0.0 0.2 0.0
European Residual spraying OP 1.6 0.7 1.4 0.1 0.1 0.0 0.0 0.0 0.0 0.0
PY 0.0 0.0 0.0 0.0 0.0 0.0 0.0 0.0 0.0 0.0
Space spraying PY 0.0 0.0 0.0 0.0 0.0 0.0 0.0 0.0 0.0 0.0
ITN-kits PY 0.0 0.0 0.0 0.0 0.0 0.0 0.0 0.0 0.0 0.0
Larviciding BL 0.0 0.0 0.8 0.0 0.0 0.0 0.0 0.0 0.0 0.0
IGR 0.0 0.0 0.1 0.0 0.0 0.0 0.0 0.0 0.0 0.0

Global insecticide use for vector-borne disease control
52
Insecticide
class
Year
WHO region Intervention type 2010 2011 2012 2013 2014 2015 2016 2017 2018 2019
South-East Asia
Residual spraying OC 2714.3 2554.1 2484.7 2191.4 2250.3 2675.8 2556.4 1985.1 2010.2 1393.5
OP 69.4 89.8 181.9 88.1 116.0 38.6 17.6 11.5 0.2 2.5
C 0.0 0.0 0.0 0.0 0.0 7.2 7.5 12.0 0.0 1.6
PY 24.3 25.6 28.2 16.7 22.6 20.7 29.9 24.4 17.0 10.1
Space spraying OP 0.3 0.9 1.4 0.0 0.0 0.0 0.0 0.0 0.0 0.0
PY 0.2 2.4 0.7 1.0 1.4 0.7 0.7 0.2 0.2 20.5
ITN-kits PY 0.0 0.0 0.0 0.0 0.0 0.0 0.0 0.0 0.0 0.0
Larviciding OP 0.0 0.0 0.0 0.0 0.1 0.1 0.1 0.2 0.2 0.1
BL 60.0 10.5 11.7 9.0 43.0 7.0 11.9 6.9 8.5 11.2
IGR 0.0 0.0 0.0 0.0 0.0 0.0 0.0 0.0 0.0 0.0
Western Pacific
Residual spraying OP 5.0 0.0 2.3 0.0 0.0 0.0 0.0 0.0 0.0 0.0
C 0.0 0.0 0.4 0.0 0.0 0.0 0.0 0.0 0.0 0.0
PY 7.6 3.8 4.2 2.8 3.5 1.4 1.3 1.3 14.6 0.2
Space spraying PY 2.1 0.0 0.4 0.0 1.3 0.0 0.0 0.0 0.0 0.0
ITN-kits PY 3.4 2.9 3.0 1.5 1.0 0.8 3.3 0.9 0.8 3.0
Larviciding BL 3.4 0.0 0.0 0.0 0.0 0.0 0.0 0.0 0.0 0.0
BL, bacterial larvicides; C, carbamates; IGR, insect growth regulators; NN, neonicotinoids; OC, organochlorines; OP, organophosphates; PY, pyrethroids; SP, spinosyns
Table A3.2 (Cont’d). Annual use of insecticides for vector control of malaria in spraying operations, by region, intervention type, insecticide class and year, expressed in metric tonnes of active ingredient
Table A3.3. Annual use of insecticides for vector control of dengue in spraying operation, by region, intervention type, insecticide class and year, expressed in metric tonnes of active ingredient
WHO region Intervention typeInsecticide
class
Year
2010 2011 2012 2013 2014 2015 2016 2017 2018 2019
African Space spraying PY 0.1 0.0 0.0 0.0 0.0 0.0 0.0 0.0 0.1 0.0
Larviciding OP 0.2 0.2 0.1 0.1 0.2 0.0 0.0 0.0 0.0 0.0
BL 0.1 0.0 0.0 0.0 0.0 0.0 0.0 0.1 0.1 0.0
IGR 0.2 0.0 0.0 0.0 0.0 0.0 0.0 0.0 0.0 0.0
Americas Residual spraying OP 0.0 0.0 0.0 0.0 0.0 0.0 0.0 0.0 0.0 0.0
C 116.9 57.6 104.0 24.0 890.7 55.7 26.2 31.6 25.5 6.8
PY 1.4 30.7 0.8 0.7 1.4 2.9 0.4 1.3 0.0 0.1
Space spraying OP 383.4 296.7 412.5 882.2 856.2 1458.4 1747.3 1089.6 1097.9 1650.3
C 2.5 2.5 11.0 35.6 43.6 69.0 66.5 50.7 4.8 50.5
PY 50.9 37.0 40.1 86.0 49.5 26.2 10.9 17.9 16.5 32.5
NN 0.0 0.0 0.0 0.0 0.0 0.0 0.0 0.0 0.1 2.9
Larviciding OP 90.8 79.3 104.6 57.1 31.7 21.3 38.2 28.0 22.5 24.7
BL 5.7 3.8 19.9 7.1 6.2 6.0 290.0 58.7 5.3 8.4
IGR 10.7 13.8 14.3 12.9 6.9 13.1 17.6 12.7 17.8 15.3
SP 0.0 2.9 14.4 7.0 35.3 24.9 10.7 5.3 1.0 1.1

A 10-year assessment (2010–2019) – Sixth edition
53
WHO region Intervention typeInsecticide
class
Year
2010 2011 2012 2013 2014 2015 2016 2017 2018 2019
Eastern Mediter-ranean
Residual spraying PY 0.0 0.0 2.0 3.7 0.0 4.5 1.8 2.4 3.1 2.9
Space spraying PY 6.0 4.3 3.7 4.0 4.5 8.8 7.8 5.8 1.1 0.9
Larviciding OP 0.0 7.8 5.8 14.3 10.2 6.2 4.3 4.7 6.0 9.0
BL 0.5 0.0 0.5 0.0 0.0 0.6 0.0 0.0 1.3 0.5
IGR 2.8 3.0 3.8 0.8 11.3 1.4 1.0 1.0 1.1 0.6
SP 0.2 0.0 0.2 0.0 0.0 26.6 0.0 0.0 0.2 0.0
South-East Asia
Residual spraying OP 0.0 0.0 0.0 0.0 0.0 0.1 0.4 0.3 0.3 0.3
Space spraying OP 48.3 0.9 3.3 3.4 8.5 25.3 17.8 4.7 8.1 2.4
PY 2.0 0.5 0.1 1.8 1.7 7.7 3.0 3.3 2.2 1.5
Larviciding OP 5.8 11.2 7.7 15.7 15.8 15.2 16.0 24.5 20.2 45.8
BL 60.0 10.5 11.7 9.5 43.4 9.5 14.2 9.4 8.5 9.4
IGR 0.0 0.0 0.0 0.0 0.0 0.0 0.0 0.2 2.3 4.6
Western Pacific
Residual spraying C 0.0 1.2 0.5 0.0 1.3 0.0 0.0 0.0 37.3 14.2
PY 0.2 0.1 0.4 2.2 9.1 3.6 8.6 5.0 23.0 12.1
Space spraying OP 2.6 1.5 1.4 7.8 99.2 6.0 6.1 6.1 13.5 27.7
C 0.0 0.0 0.0 0.5 0.7 0.0 0.2 0.2 0.8 0.0
PY 0.7 1.8 1.7 3.3 65.4 8.3 11.6 12.8 7.5 36.4
Larviciding OP 1.6 1.9 2.5 4.8 14.1 2.8 3.3 3.5 6.8 9.6
BL 1.0 0.0 1.0 0.2 2.1 1.2 1.0 1.0 0.0 4.7
BL, bacterial larvicides; C, carbamates; IGR, insect growth regulators; NN, neonicotinoids; OC, organochlorines; OP, organophosphates; PY, pyrethroids; SP, spinosyns
Table A3.4. Annual use of insecticides for vector control of leishmaniasis in spraying operations, by region, intervention type, insecticide class and year, expressed in metric tonnes of active ingredient
Insecticide
class
Year
WHO region Intervention type 2010 2011 2012 2013 2014 2015 2016 2017 2018 2019
Americas Residual spraying PY 5.5 6.8 5.5 5.1 2.7 1.6 2.6 2.6 2.9 1.4
Space spraying OP 3.6 0.0 0.0 0.0 0.0 0.0 0.0 0.0 0.0 0.0
PY 0.7 1.4 0.2 0.1 0.7 0.0 0.6 1.0 0.0 0.0
Eastern Mediter-ranean
Residual spraying C 5.7 13.1 16.4 23.4 14.5 26.3 26.7 27.8 1.1 1.9
PY 3.1 6.5 4.4 5.3 4.0 5.2 3.7 3.5 2.3 3.7
Space spraying PY 1.4 2.7 2.4 1.4 0.1 4.9 2.1 1.3 0.4 0.4
European Residual spraying OP 0.0 0.1 0.1 0.1 0.0 0.0 0.0 0.0 0.0 0.0
South-East Asia
Residual spraying OC 943.7 1456.6 1469.1 1665.5 1338.2 78.3 0.0 0.0 0.0 0.0
PY 4.7 3.0 3.8 5.6 2.8 2.5 4.0 2.7 4.6 4.4
C, carbamates; OC, organochlorines; OP, organophosphates; PY, pyrethroids
Table A3.3 (Cont’d). Annual use of insecticides for vector control of dengue in spraying operation, by region, intervention type, insecticide class and year, expressed in metric tonnes of active ingredient

A 10-year assessment (2010–2019)SIXTH EDITION
Global insecticide use for vector-borne disease control


