Embed Size (px)
Citation preview
GLOSSARY
4 (Four) Box
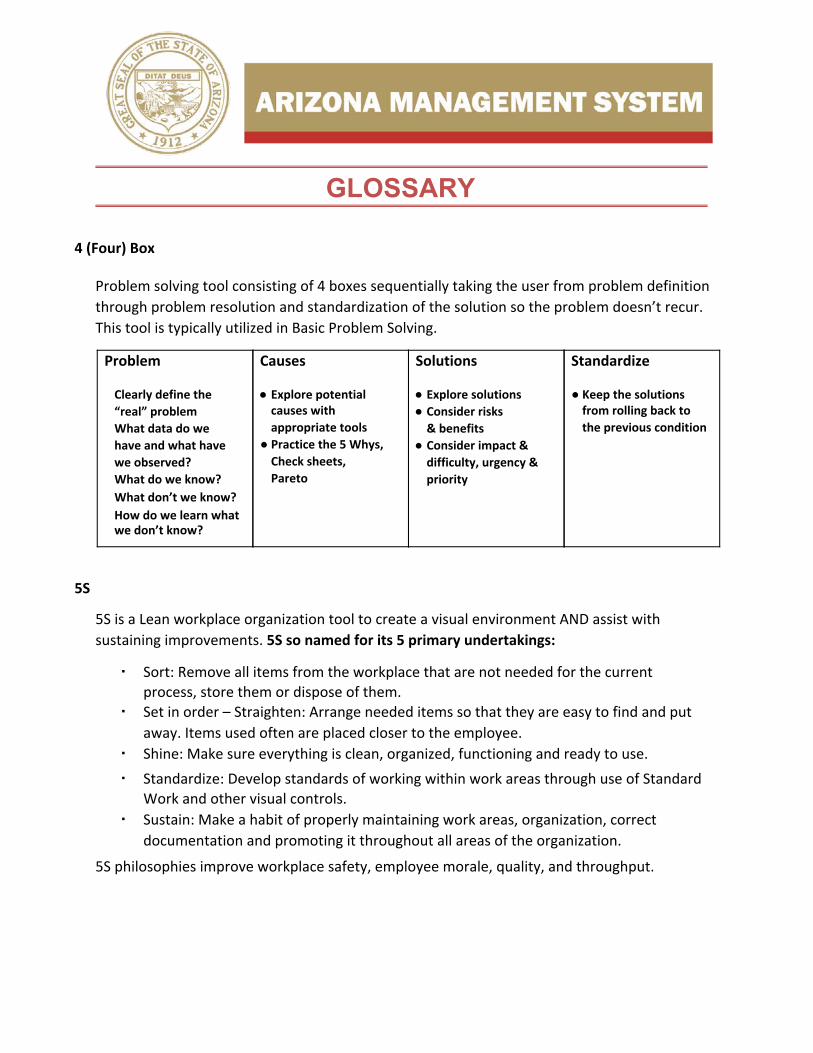
Problem solving tool consisting of 4 boxes sequentially taking the user from problem definition
through problem resolution and standardization of the solution so the problem doesn’t recur.
This tool is typically utilized in Basic Problem Solving.
5S
5S is a Lean workplace organization tool to create a visual environment AND assist with
sustaining improvements. 5S so named for its 5 primary undertakings:
▪ Sort: Remove all items from the workplace that are not needed for the current process, store them or dispose of them.
▪ Set in order – Straighten: Arrange needed items so that they are easy to find and put
away. Items used often are placed closer to the employee.
▪ Shine: Make sure everything is clean, organized, functioning and ready to use.
▪ Standardize: Develop standards of working within work areas through use of Standard Work and other visual controls.
▪ Sustain: Make a habit of properly maintaining work areas, organization, correct
documentation and promoting it throughout all areas of the organization.
5S philosophies improve workplace safety, employee morale, quality, and throughput.
Problem
Clearly define the “real” problem
What data do we have and what have we observed?
What do we know?
What don’t we know?
How do we learn what we don’t know?
Causes
● Explore potential causes with appropriate tools
● Practice the 5 Whys, Check sheets, Pareto
Solutions
● Explore solutions ● Consider risks
& benefits ● Consider impact &
difficulty, urgency & priority
Standardize
● Keep the solutions from rolling back to the previous condition
AMS Glossary 2
5 (Five) Why’s
A Lean tool for discovering the root cause of a problem or issue via the asking of Why. Example: (1st Why) Why is there oil on the floor? (Answer after investigation) It is leaking from a hose. (2nd Why) Why is oil leaking from this hose? (Answer after investigation) The hose is rubbing on a fan belt. (3rd Why) Why is it rubbing on the fan belt? (Answer after investigation) The fan belt housing is very loose. (4th Why) Why is the fan belt housing so loose? (Answer after investigation) Some of the bolts that hold it in place are missing or broken off. This example only includes 4 whys; the number of whys is less important than finding and fixing the root cause of the problem.
6 (Six) Sigma
A scientific/data-driven approach for reducing deviations in standard work. It is different from
Lean, which is about reducing waste from systems and processes. Six Sigma may be used in
conjunction with Lean, but it is advisable to lean processes first because there is no need to
reduce deviation in processes that shouldn’t be done in the first place.
8 Wastes (Muda)
Waste is any activity that uses equipment, materials, parts, space, employee time or other organization resources beyond the minimum amount required for value-added operations. Toyota identified 8 common types of waste, which can readily be remembered using the acronym DOWNTIME:
Defects - Creating products that must be revised or changed. Overproduction - Making more products than the customer wants. Waiting - Waiting for processing, products sitting in in-boxes, etc. Not Using Talent – Failing to optimize the knowledge, skills and abilities of team members. Transportation - Moving products to various storage locations, from process to process, etc. Inventory - Committing money and storage space to products not wanted by customers. Motion - Moving products/people more than what is needed to complete a process.
Excess Processing - Doing more “work” to a product than is required.
AMS Glossary 3
A
A3
Historically, an A3 is a structured problem solving and continuous improvement approach developed by Toyota, placed on an A3 (11”x17”) single sheet paper. The A3 is used for both problem solving and project management, as well as to communicate progress and results. A Project A3 should be used for any continuous improvement activities that take more than 40 person-hours to complete.
Affinity Diagram
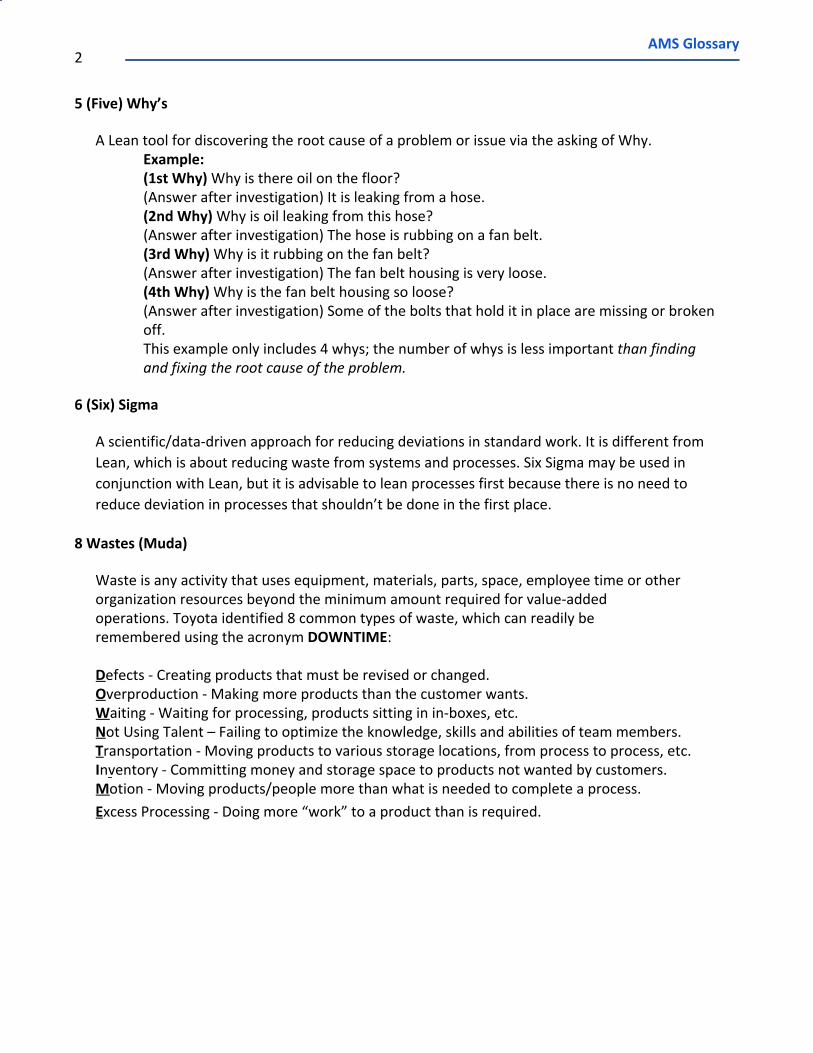
Tool commonly used within kaizen events and allows large numbers of ideas stemming from
brainstorming to be sorted into groups based on their natural relationships.
Andon
Andon is a system to stop and notify management and other workers of a quality or process
problem. The point is to design the system to visualize when an abnormality occurs so team
members can stop the process and fix the problem. Flow boards are often used for Andon in
information/knowledge type processes, which may not lend themselves to signals involving the
actual work itself. See Flow Board.
Andon Response
Andon response is the action(s) taken when the Andon signal is given. The actions typically include escalation of the problem to the appropriate expert or management level for assistance in resolution.
AMS Glossary 4
Arizona Management System (AMS)
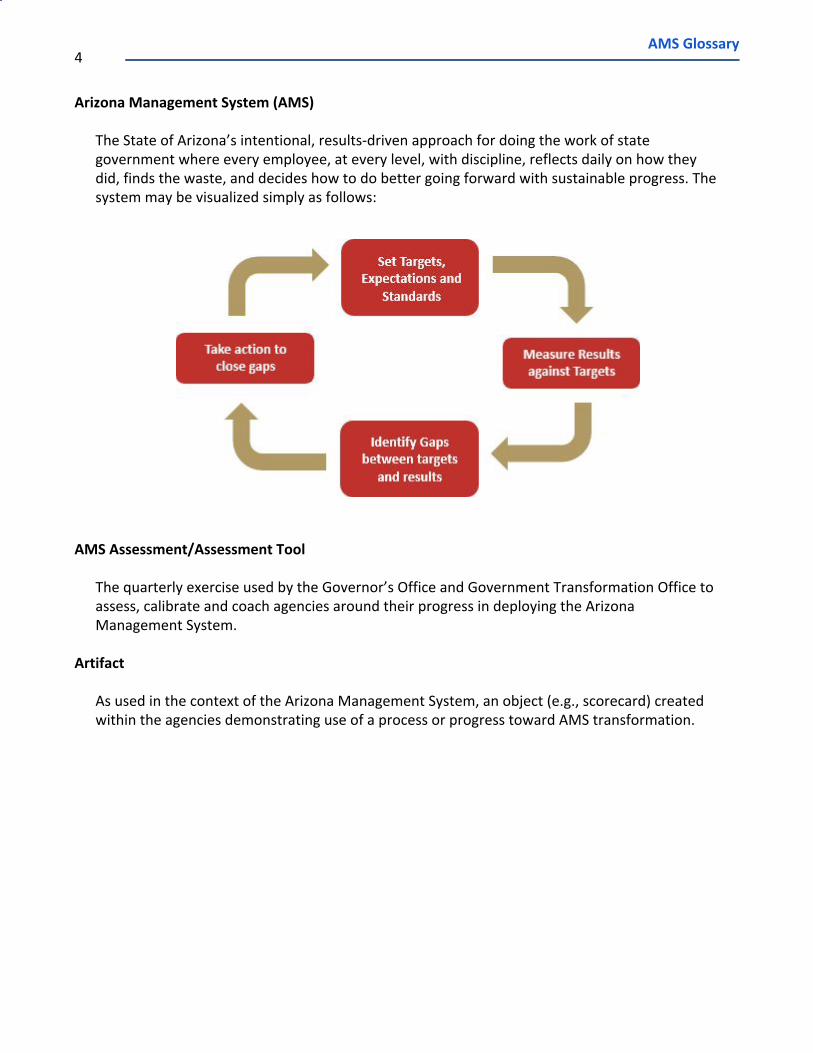
The State of Arizona’s intentional, results-driven approach for doing the work of state government where every employee, at every level, with discipline, reflects daily on how they did, finds the waste, and decides how to do better going forward with sustainable progress. The system may be visualized simply as follows:
AMS Assessment/Assessment Tool
The quarterly exercise used by the Governor’s Office and Government Transformation Office to assess, calibrate and coach agencies around their progress in deploying the Arizona Management System.
Artifact
As used in the context of the Arizona Management System, an object (e.g., scorecard) created within the agencies demonstrating use of a process or progress toward AMS transformation.
AMS Glossary 5
B
Batch Processing
Producing lots or quantities of a product in batches. Batching is wrongly assumed to be more economical than single piece process for various reasons. Often when large “batches” are the preferred operating mode it is due to excessively long or difficult changeover practices. Improving changeover techniques will generally minimize “batch” sizes, reduce finished goods inventory on-hand, allow for increased varieties of products that can be made more quickly, and ultimately lead to greater customer responsiveness.
Benchmarking
A comparison tool used to determine the level of process, product, or other successes your agency is experiencing when compared to best practices of other agencies, state governments or other similar industries/organizations.
Bottleneck
The slowest step in a process affecting continuous flow. Any part of the process that has a capacity less than the demands placed upon it. Example: In a value stream containing 5 dissimilar processes, the 3rd process takes twice as long to complete as the other processes. The slowest process is the typical bottleneck.
Bowling Sheet
This is the name given to the tracking sheets used to monitor either Key Performance Indicators (KPI) or policy deployment objectives.
AMS Glossary 6
Brainstorming
A group creativity technique by which efforts are made to find a conclusion for a specific problem by gathering a list of ideas spontaneously contributed by its members. All ideas are accepted.
Breakthrough
A Breakthrough is an agency breakthrough scorecard metric that: ● Aligns with and is represented by one or more performance measures in your agency’s
strategic plan,
● Results in a sustainable success that addresses a pressing customer or stakeholder
concern, and/or achieves performance that was considered unreachable in the past in
terms of Mission Outcomes, Service, Quality, People or Cost, and
● Requires a substantial design or re-design of a work process documented with an A3 project plan.
Business Review/Performance Review
An element of the Arizona Management System, the business review is typically conducted monthly and comprises a review of the agency performance metrics (scorecards), counter measures, financials, agency strategic plan, AMS progress and breakthrough projects. It is a way to assess the overall health and progress of the agency to ensure breakthrough performance and continuous improvement are sustained.
AMS Glossary 7
C
Cadence
The pace and interval at which scheduled things happen. For example, team huddle meetings typically occur on a daily or weekly cadence.
Capacity
The maximum amount a process, machine, or system can produce. If a machine is running “at capacity” it is going as fast as it can go and producing as much as it can produce. If a machine is running “below capacity” it can do more than it is currently doing.
Cause and Effect Diagram or “Fishbone” (Ishikawa Diagram)
A problem-solving tool that graphically illustrates the relationship(s) between various process elements which prepares problem solvers to assess the impact of variation from standard. The Diagram itself resembles (somewhat) the skeleton of a fish. The image below depicts typical areas to analyze.
Change Agent(s)
Person(s) who lead a company from the traditional practices and philosophies to becoming a Lean organization.
Co-location
Physically locating personnel and product lines in a single area thereby enabling rapid and constant communication among the key personnel responsible for the output.
AMS Glossary 8
Concurrent Engineering (Front Loading)
The reorganization of product design, development, planning and support processes to take place to the extent possible in parallel (more or less at the same time), using multi-disciplinary project teams, electronic information management, and improved communications. Input is gathered and assimilated from all stakeholders including customers before the initiation of the process. See Quality-by-Design.
Continuous Improvement
The ongoing process/philosophy of doing things better, faster, and for lower cost. A structured Continuous Improvement system enables an organization to refine and enhance the benefits they now enjoy as a Lean organization through usually small and incremental changes within the system. See PDCA.
Continuous Flow
Moving products through a system without separating them into lots. In the ideal system we attempt to achieve “1-piece flow” in which each product is passed or moved along in the process independently until it is completed and ready to be shipped to a waiting customer.
Countermeasure
Countermeasures are the actions taken to reduce or eliminate the root causes of problems that
are preventing you from reaching your goals. See Root Cause Analysis.
AMS Glossary 9
Cross-training
Cross-training in business operations involves training employees for flexible response to changing organization schedules and absenteeism.
Current State Map
The “Current State Map” shows the value stream or process map as it is operating right now. The “Current State Map” is used as a springboard for creating a “Future State Map,” which removes waste from the value stream.
Customer
Anyone who uses your product or service. May be internal (someone who is directly connected to or employed by your organization) or external. May also be an “end user,” i.e., the person for whom the output was specifically designed for use and uses it to achieve a desired outcome, or a “broker,” someone who acts as an agent for either the end user, the producer, or both. For any externally facing organization, external end users are the most important customers because they define the value of your product or service. See Stakeholder and Investor.
Cycle Time
The time it takes to do one repetition of any particular task, typically measured from start of a task or process until its completion.
AMS Glossary 10
D
Dashboard
A tool used to visually display the status of performance, such as lead and lag metrics. See Metrics.
Defect
An imperfection, inaccuracy or mistake that causes inadequacy or failure; a shortcoming or
deficiency; less than 100% complete and accurate.
Deployment Milestone
An action or event marking achievement of a key step forward in an agency’s AMS deployment plan.
Deployment Plan
The actionable deployment methodology an agency uses for standing up each element of the Arizona Management System (AMS) throughout its ranks.
Deployment Strategy
The high-level planning leading to integration of AMS throughout the agency over time. The deployment strategy may include multiple deployment plans.
DMAIC
An acronym meaning “Define,” “Measure,” “Analyze,” “Improve,” and “Control.” It is a structured, disciplined and rigorous approach to process improvement consisting of these five phases, with each phase linked logically to the previous and subsequent phases.
AMS Glossary 11
E
Elapsed Time
The total time it takes for one process step to be completed, it includes Touch Time and Delay Time (in minutes or hours.) See Lead Time, Touch Time and Wait Time.
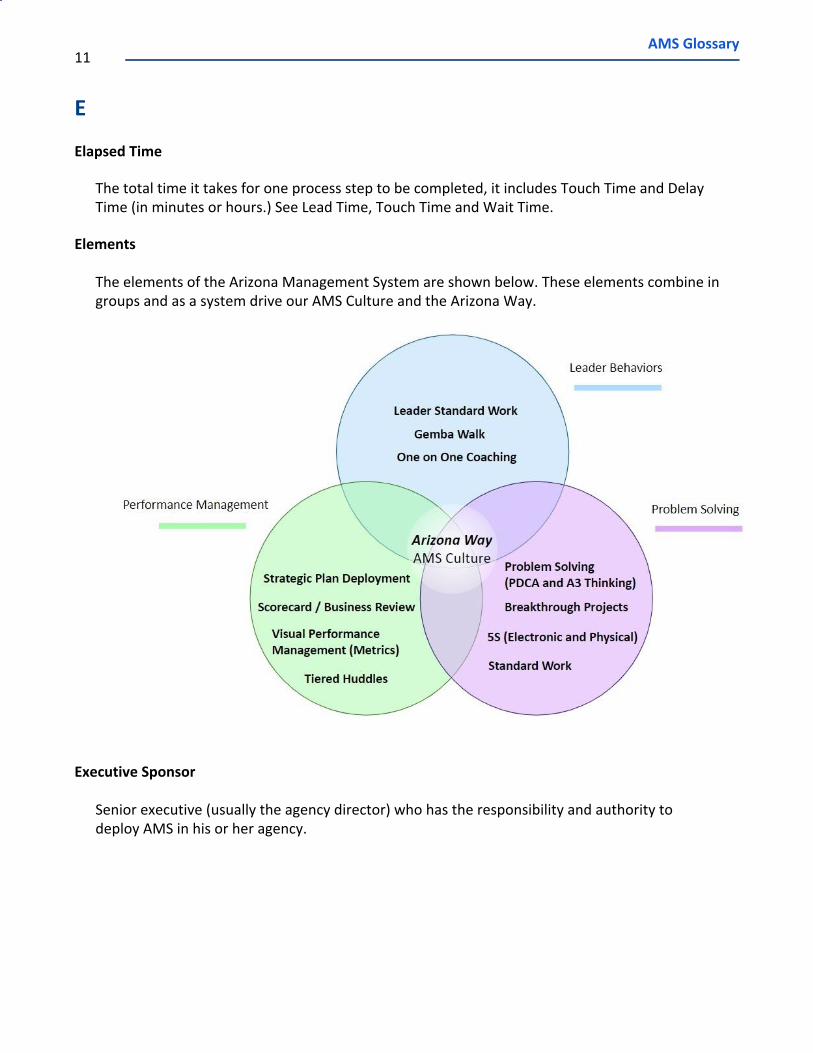
Elements
The elements of the Arizona Management System are shown below. These elements combine in groups and as a system drive our AMS Culture and the Arizona Way.
Executive Sponsor
Senior executive (usually the agency director) who has the responsibility and authority to deploy AMS in his or her agency.
AMS Glossary 12
F
FIFO – First In First Out
A system for keeping track of the order in which information or materials are to be processed. Example, the first goods purchased are also the first goods sold.
Fishbone Diagram
See Cause and Effect Diagram and Ishikawa Diagram. Flow
Contiguous activities that add value by transforming material or information incrementally closer to what the customer wants or needs.
Flow Board (Visual Management)
A visual tool containing Visual Process Adherence (VPA) indicators for process/product flow status, typically posted near the actual work area. The Flow Board allows for rapid detection of problems or delays.
Flow Chart
A type of Process Map that visually depicts the steps in a process or system. See also Process Map.
Future State Map
A future-looking version of a process map depicting how a process will work after improvements are implemented. See Current State Map.
AMS Glossary 13
G
Gantt Chart
Chart that manages project progress by identifying owners, due dates, and status of actions across a timeline.
Gap Analysis
Assessment of the improvement required to get from the current state to the future state. Gemba (Gemba Walk)
A Japanese concept of continuous improvement designed for enhancing processes and reducing waste. Gemba refers to the place where value is created. A key element of Leader Standard Work, leaders go see where the work is being done and humbly observe process conditions, observe and ask employees about the Standard Work, gain knowledge about the work status, coach team members and build relationships with employees.
H
Heijunka
See Level Loading. Hoshin Kanri
A method to develop and maintain strategic planning goals to drive continued progress and
action at all levels within an organization, which helps eliminate waste from inconsistent
direction and poor communication. See Strategic Planning.
Huddle Board (Performance Board)
The tool used to facilitate regular team huddles at all levels in an agency. Required elements include a huddle agenda, visual management (metrics and visual process adherence,) problem tracking, success tracking and standard work for maintaining the huddle board.
AMS Glossary 14
I
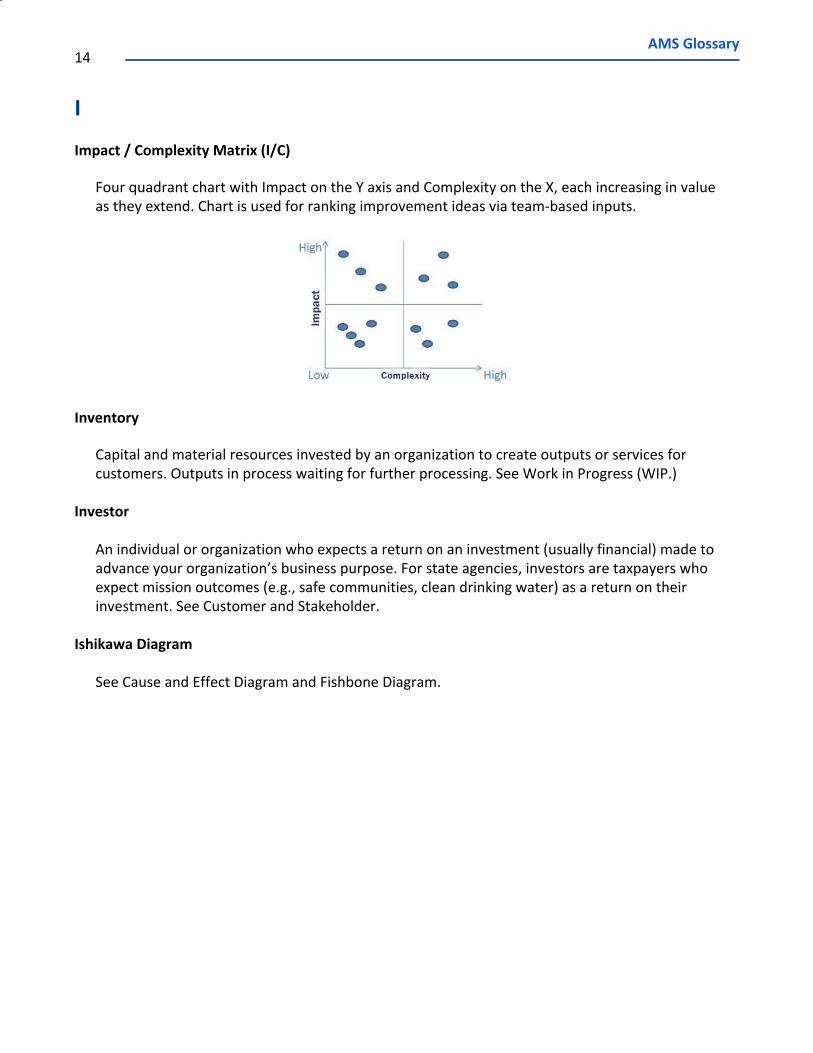
Impact / Complexity Matrix (I/C)
Four quadrant chart with Impact on the Y axis and Complexity on the X, each increasing in value as they extend. Chart is used for ranking improvement ideas via team-based inputs.
Inventory
Capital and material resources invested by an organization to create outputs or services for customers. Outputs in process waiting for further processing. See Work in Progress (WIP.)
Investor
An individual or organization who expects a return on an investment (usually financial) made to advance your organization’s business purpose. For state agencies, investors are taxpayers who expect mission outcomes (e.g., safe communities, clean drinking water) as a return on their investment. See Customer and Stakeholder.
Ishikawa Diagram
See Cause and Effect Diagram and Fishbone Diagram.
AMS Glossary 15
J
Just Do It (JDI)
Simple action or activity typically requiring less than a week and minimal cost to complete,
entails no risk to implement.
Just-in-Time (JIT)
A Lean process for synchronizing materials, equipment and people so that outputs occur when needed, where needed and as needed per the customer’s expectations.
AMS Glossary 16
K
Kaizen
Japanese for "change for better." A practice of continuous improvement. Kaizen Burst
Visual indicator on a Flow Map indicating an improvement opportunity or requirement. Kaizen Event
Formal, focused event, typically 2- to 5-days long, requiring detailed pre-planning. Typically
involves people involved in the work process and customers. Event focuses on continuous
process improvement with sustained outcomes.
Kaizen Newspaper
An action item list with responsibility and due dates. A tool for both managing the workload
from a project or kaizen event, and for keeping track of the follow-up activities.
KanBan
Japanese for “visual record” or “card.” In Lean, KanBan has come to mean “signal,” i.e., there is
action to be taken. For example, a register receipt that changes color as it nears the end of the
roll.
KanBan Board
Typically these boards have column headings “To Do,” “Doing” and “Done.” As a tool of the Arizona Management System, employees and teams use KanBan boards to plan, apportion and
track the work to be done in a given day or week. What work can a team member reasonably
be expected to complete in the time allotted?
AMS Glossary 17
L
Lead-Time/Total Elapsed Time
The total time required from start of process (e.g., receipt of order or request) until outputs are delivered or issued to a customer. See Elapsed Time, Touch Time and Wait Time.
Lead and Lag Metrics
See Metrics. Leader Standard Work (LSW)
An element of the Arizona Management System, LSW comprises the documented, standardized practices for leaders to promote the primary role of building problem solving muscle at every level of the organization. LSW aims to improve leadership behavior to foster a culture of Kaizen. See Gemba and 1-on-1 coaching, which are integral elements of LSW.
Lean
Lean is a set of concepts, principles and tools used to create and deliver the most value from
the customer’s perspective while consuming the fewest resources, and by engaging people in
continuous problem solving. Lean is a mindset, not just a set of tools!
Lean Management System
Lean management is an approach to running an organization that supports the concept of
continuous and sustainable improvement, a long-term approach to work that systematically
seeks to achieve changes in processes in order to improve efficiency and quality. The Arizona
Management System is the State of Arizona’s lean management system.
Level-Loading (Heijunka)
A technique used to balance (+ or -) process throughput according to customer demand.
AMS Glossary 18
M
Metric
Standards of measurement by which efficiency, performance, progress, or quality of a plan,
process, or product can be assessed. Developing performance metrics usually follows a process
of establishing core processes/customer requirements, identifying specific, quantifiable outputs
of work and establishing targets against which results can be scored. See SIPOC.
Lag Metric - Lagging metrics are typically output-oriented, showing a result.
Lead Metrics - Leading metrics are typically input-oriented, allowing influence to be achieved
before the result. Lead measurements are incremental enough to see improvement impacts in
shorter periods of time than Lag measurements.
Mission
The written declaration of an organization's core purpose and focus that normally remains
unchanged over time. See also True North.
AMS Glossary 19
N
Nemawashi
Informal process of getting input and support from stakeholders and others before starting a
project or activity to increase the chances of success. “Meeting before the meeting.”
Non-Value-Added But Necessary
Steps in your process or procedure that don’t add value to your customer, but are necessary
per statutory or regulatory requirements, for safety or for the functioning of the agency (i.e.
payroll, purchasing, etc.)
Non-Value-Added (Waste)
Any process or event that does not make a product more like what a customer is willing to pay
for, this is called Waste. Lean is significantly focused on removing waste from processes. Waste
is identified as any activity that consumes resources but creates no value for the customer. See
8 Wastes.
O
One-on-One Coaching (1:1 Coaching)
An element of the Arizona Management System, 1:1 coaching is the regular cadence of discussion between managers and staff for the purpose of developing employees and providing regular, structured feedback on performance.
Overproduction
Making more outputs than the customer wants or needs. Over Processing
Doing more “work” to an output than is required to meet customer demand.
AMS Glossary 20
P
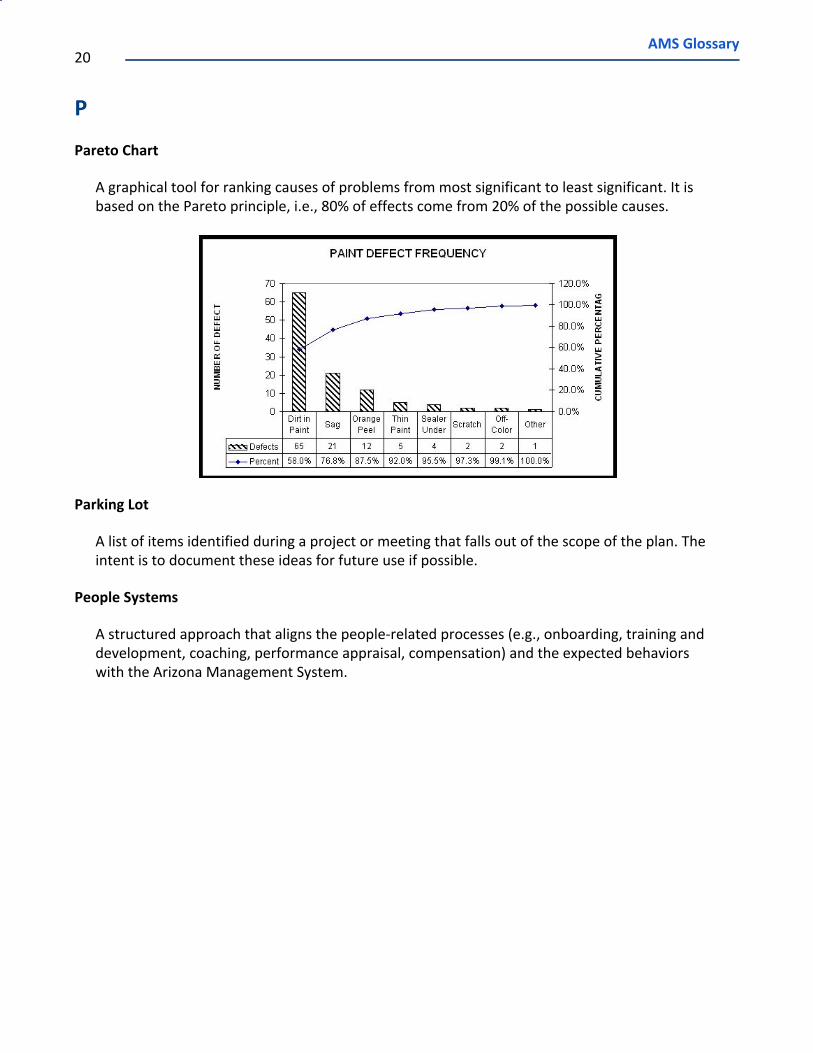
Pareto Chart
A graphical tool for ranking causes of problems from most significant to least significant. It is based on the Pareto principle, i.e., 80% of effects come from 20% of the possible causes.
Parking Lot
A list of items identified during a project or meeting that falls out of the scope of the plan. The intent is to document these ideas for future use if possible.
People Systems
A structured approach that aligns the people-related processes (e.g., onboarding, training and development, coaching, performance appraisal, compensation) and the expected behaviors with the Arizona Management System.
AMS Glossary 21
PDCA
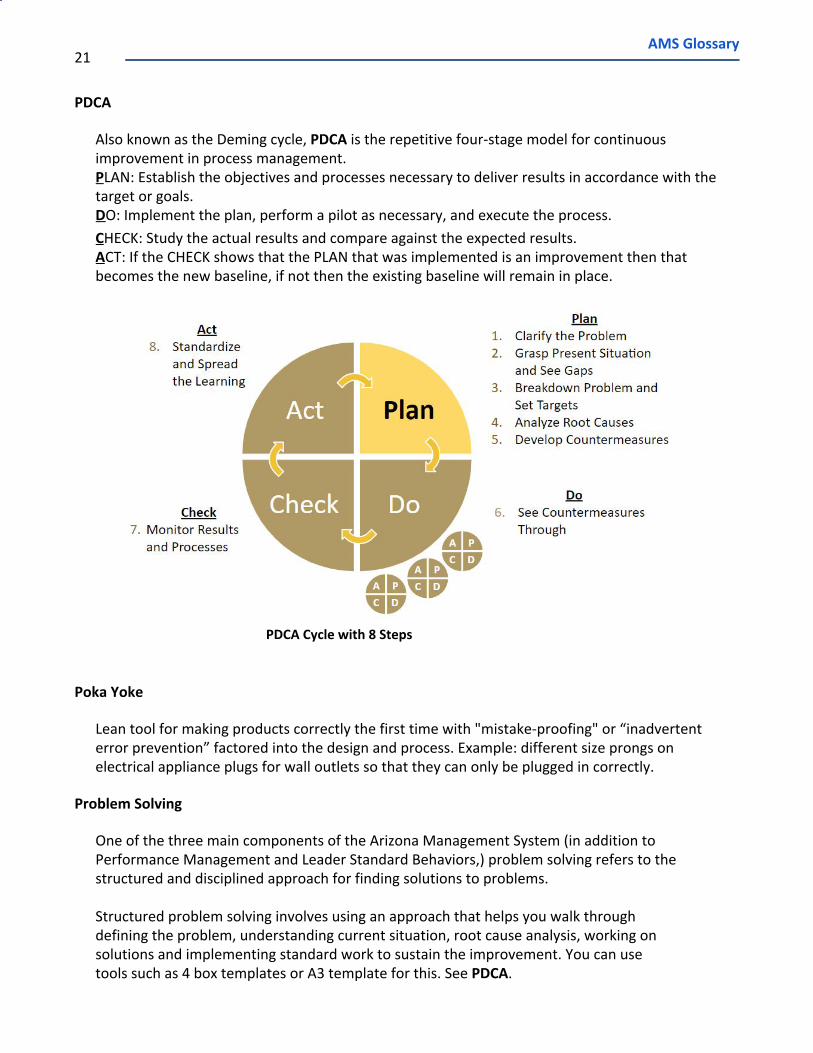
Also known as the Deming cycle, PDCA is the repetitive four-stage model for continuous improvement in process management. PLAN: Establish the objectives and processes necessary to deliver results in accordance with the target or goals. DO: Implement the plan, perform a pilot as necessary, and execute the process.
CHECK: Study the actual results and compare against the expected results. ACT: If the CHECK shows that the PLAN that was implemented is an improvement then that becomes the new baseline, if not then the existing baseline will remain in place.
PDCA Cycle with 8 Steps
Poka Yoke
Lean tool for making products correctly the first time with "mistake-proofing" or “inadvertent error prevention” factored into the design and process. Example: different size prongs on electrical appliance plugs for wall outlets so that they can only be plugged in correctly.
Problem Solving
One of the three main components of the Arizona Management System (in addition to Performance Management and Leader Standard Behaviors,) problem solving refers to the structured and disciplined approach for finding solutions to problems. Structured problem solving involves using an approach that helps you walk through defining the problem, understanding current situation, root cause analysis, working on solutions and implementing standard work to sustain the improvement. You can use tools such as 4 box templates or A3 template for this. See PDCA.
AMS Glossary 22
Process
A results-driven set of activities, or process steps, that produces an outcome. Alternate Definition: A series of activities that collectively accomplish a distinct objective.
Process Map
A diagram that depicts the elements of a work flow often using time, people, and equipment information to illustrate tasks and results. Process Maps include Value Stream Maps, Flow Charts and Swim Lane Charts and typically go to process step detail.
Process Owner (PO)
The agency leader(s) who is “in the fire” of hands-on, day-to-day coordination and management of deploying the Arizona Management system in the agency. This individual(s) coordinates progress with the agency Scorecard, AMS Deployment Strategy/Plan, and AMS Assessment documents, and ensures leadership is fully informed of the agency’s AMS status. (See also Transformation Owner, Deployment Plan and Element Champion.)
Pull
A pull system is designed to deliver outputs or services when the customer requires – making to order. See Push.
Push
A push system imposes outputs or services on to the customer at a pace dictated by inventory – making to stock. See Pull.
AMS Glossary 23
Q
Quality
A measure of excellence or a state of being free from deficiencies. How good or bad something is.
Quantity
The amount or number of something.
R
Root Cause Analysis
Another name for Problem Solving with the requirement to get to the ultimate cause(s) of a problem so as not to merely fix the symptoms. Popular methods that have this goal are for example 5 Why and Fishbone Diagram. The root cause analysis is part of an A3 or 4 Box problem solving.
AMS Glossary 24
S
Scope
The boundary limits (beginning/end, “in scope”/”out of scope”) to which a process, project or problem is implemented or addressed.
Scorecard
An element of the Arizona Management System, a scorecard is a visual tool used by agencies to manage and measure key agency performance metrics. See also Bowling Sheet.
SIPOC
An acronym standing for “Suppliers,” “Inputs,” “Process,” “Outputs,” and “Customer.” SIPOC is a high-level process mapping and communications tool that summarizes inputs and outputs of core processes, identifies relevant value-adding steps, and evaluates quality and value from the customer’s perspective, as well as your own as a customer of your suppliers.
Stakeholder
An individual or organization with an interest in results and outcomes of an agency’s business processes. See Customer and Investor.
Standard Work
An element of the Arizona Management System, Standard Work is the documented current one best way to perform a process. See Leader Standard Work.
Strategic Plan
A document used to communicate the organization’s goals, objectives, measures and the
actions needed to achieve success.
Strategic Plan Deployment
A systematic, organizational management process to set priorities, focus energy and resources,
strengthen operations, ensure that employees and stakeholders are working toward common
goals, establish agreement around intended outcomes/results, and assess and adjust the
organization's direction in response to a changing environment. Should align with the
organization’s vision and mission.

AMS Glossary 25
Swim Lane Chart
A visual element used in process flow diagrams or process mapping that visually distinguishes job sharing and responsibilities for steps within a business process. Swim lanes may be arranged either horizontally or vertically.
AMS Glossary 26
T
Takt Time
Matching the rate of output to the rate of sales or consumption. Takt Time (a German word for meter or measure) is often compared to a metronome symbolizing “keeping time.” in its purest sense Takt Time is used to only produce exactly what your customers will consume; nothing more and nothing less.
Tiered Huddles
An element of the Arizona Management System, tiered huddles builds upon the brief daily or weekly huddles by teams using visual management to reflect on performance, identify and solve problems and commit to making adjustments. The tiered structure facilitates communication and problem escalation through the management chain when necessary.
Touch Time
The total time spent actively working on the process (usually in minutes or hours.) See Elapsed Time, Lead Time/Total Elapsed Time, and Wait Time.
Toyota Production System (TPS)
An integrated socio-technical system, developed by Toyota that comprises its management philosophy and practices. The TPS organizes manufacturing and logistics for the automobile manufacturer, including interaction with suppliers and customers. The system is a major precursor and foundation for Lean.
AMS Glossary 27
Transformation Owner (TO)
The agency leader (typically a director or deputy director) who is responsible for spreading the
good of the agency’s transformation as a continuously improving organization and accountable
for the agency’s adherence to the AMS Deployment Plan. See Deployment Plan, Process Owner,
Element Champion.
True North
Based on True North as the geographic North Pole (as compared to the magnetic North Pole,) True North is a leader’s orienting point, the fixed point in a spinning world that helps leaders keep the organization on track with its most deeply held beliefs, values and principles.
AMS Glossary 28
V
Value / Value-added
Any activity that incrementally improves an output or service to more align with customer’s
needs and expectations. Your customer defines value or value-added with the following three
conditions:
1. It must transform the output or service.
2. The customer must be willing to “pay” for it.
3. It must be done correctly the first time.
Value Stream
All the actions, both value-creating and non-value-creating, required to bring an output from concept to launch and from order to delivery. These include actions to process information from the customer and actions to transform the output.
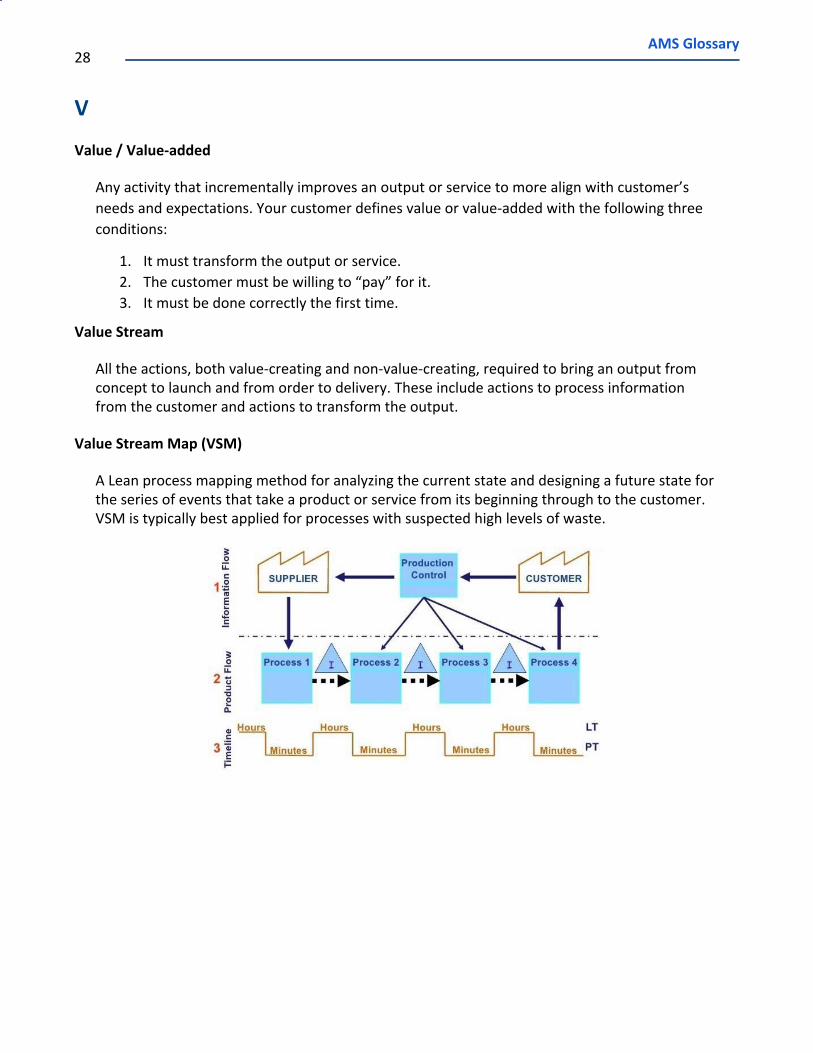
Value Stream Map (VSM)
A Lean process mapping method for analyzing the current state and designing a future state for the series of events that take a product or service from its beginning through to the customer. VSM is typically best applied for processes with suspected high levels of waste.
AMS Glossary 29
Visual Performance Management (VPM)
Includes practices for communicating using status or visual cues to make succinct, accurate information within a workplace available at all times to those who need to know it. Visual management systems increase the efficiency and effectiveness of a process by making the steps in that process more visible and allow for improved decision-making. Also see: Flow Board, Huddle Board.
Visual Process Adherence (VPA)
Visual Management tool designed to keep everyone informed of what the process actually is and whether or not it’s being adhered to. Simple visual tools at determined points in the value stream representing the key points we deem important such as a flow board, Kanban post, etc.
Visual Process Performance (VPP)
Visual Management tool designed to keep everyone informed of how the value stream is performing to agreed-upon measurements such as a Huddle board with metric charts.
Voice of the Customer (VOC)
VOC is the collective insight into customer needs, wants, perceptions, and preferences gained
through direct and indirect questioning. This questioning provides a “critical to quality”
definition to utilize in product/process design and implementation.
W
Wait Time
The time between processes that is not considered to be Touch Time. See Elapsed Time, Lead Time and Touch Time.
Waste
See 8 Wastes. WIP – Work in Process
In-process inventory or partially finished outputs waiting for completion. These items are either
just being processed or waiting for further processing in a queue or a buffer storage.
Work Cells
Generally, a horseshoe or U-Shaped work area layout that enables workers to easily move from one process to another in close proximity and pass information or WIP between workers with little effort. Purpose is to reduce
AMS Glossary 30
Workplace Organization (5S)
See 5S.
Y
Yokoten
Spreading information across the organization, both the results, but even more importantly, the
process, for how the results were achieved.


