Embed Size (px)
Citation preview

The
Jour
nal o
f G
ener
al P
hysi
olo
gy
A RT I C L E
The Rockefeller University Press $30.00J. Gen. Physiol. Vol. 132 No. 3 329–338www.jgp.org/cgi/doi/10.1085/jgp.200810044 329
I N T R O D U C T I O N
In mammals, glucose homeostasis is regulated by pan-
creatic � cells. When serum glucose is elevated, � cells
release insulin, which signals muscle, liver, and fat to
take up and store glucose. While it is clear that Ca 2+ in-
fl ux is a key factor in the regulation of glucose-induced
insulin secretion, the role of other second messengers,
such as cAMP, remain unclear. Studies dating back three
decades suggest that glucose itself elevates cAMP levels
( Charles et al., 1973 ; Grill and Cerasi, 1973 ; Rutter, 2001 );
however, in the absence of a mechanism for glucose-
induced cAMP generation, the signifi cance of these
fi ndings was questioned ( Montrose-Rafi zadeh et al., 1997 ;
Rutter, 2001 ; Delmeire et al., 2003 ).
In � cells, metabolism of glucose leads to an increase
in intracellular ATP, which in turn induces the depolar-
ization of the plasma membrane through the closure of
ATP-sensitive potassium (K ATP ) channels ( Ashcroft and
Rorsman, 1989 ). Subsequently, membrane depolariza-
tion causes the opening of voltage-dependent calcium
channels and elevation of cytosolic calcium ( Rutter et al.,
1993 ). The resultant rise in intracellular calcium is re-
quired for insulin release. This rise is also linked to an
increase in the second messenger cAMP ( Charles et al.,
1975 ; Rutter, 2001 ; Landa et al., 2005 ). Coordinated re-
L.S. Ramos and J.H. Zippin contributed equally to this paper.
Correspondence to Jochen Buck: j o b u c k @ m e d . c o r n e l l . e d u
J.H. Zippin ’ s present address is Department of Dermatology, Weill Medical
College of Cornell University, 1300 York Avenue, New York, NY 10065.
Abbreviations used in this paper: 2 ’ 5 � ddAdo, 2 ’ 5 � dideoxyadenosine;
ERK1/2, extracellular signal-regulated kinases 1 and 2; GPCR, G protein –
coupled receptor; IBMX, 3-isobutyl-1-methylxanthine; MAP, mitogen-acti-
vated protein; PDE, phosphodiesterase; sAC, soluble adenylyl cyclase;
tmAC, transmembrane adenylyl cyclase.
The online version of this article contains supplemental material.
lease from calcium stores results in calcium waves, which
are temporally and spatially linked to fl uctuations of
cAMP ( Landa et al., 2005 ; Dyachok et al., 2006 ). These
studies convincingly demonstrated that cAMP is gener-
ated consequent to glucose metabolism, but the specifi c
source of the second messenger remained unclear.
In contrast to the controversy surrounding glucose-
induced cAMP generation, it is well accepted that cAMP
is produced in � cells in response to incretins released
by the intestine in response to food intake. The incretin
glucagon-like peptide-1 (GLP-1) increases cAMP levels by
activating a specifi c G protein – coupled receptor (GLP-1
receptor), resulting in stimulation of one of a family
of G protein – responsive, transmembrane adenylyl cyclases
(tmACs) ( Thorens, 1992 ; Usdin et al., 1993 ; Moens et al.,
1996 ). Although unable to elicit insulin secretion on its
own, GLP-1 – induced cAMP potentiates glucose-induced
insulin secretion ( Holz et al., 1995 ; Yang et al., 1999 ;
Delmeire et al., 2003 ; Dyachok et al., 2006 ).
A recent study examining glucose-induced cAMP
generation in the Min6 � -cell line using a FRET-based
cAMP sensor revealed a temporal distinction between
glucose-induced and GLP-1 – induced cAMP production
( Landa et al., 2005 ). In response to exendin-4, a GLP-1
receptor agonist, or to the pharmacological stimulator
of tmACs, forskolin, cAMP production was stimulated
within the fi rst minutes of agonist addition. In contrast,
the cAMP rise observed in response to high glucose media
Glucose and GLP-1 Stimulate cAMP Production via Distinct Adenylyl Cyclases in INS-1E Insulinoma Cells
Lavoisier S. Ramos , 1 Jonathan Hale Zippin , 2 Margarita Kamenetsky , 1 Jochen Buck , 1 and Lonny R. Levin 1
1 Department of Pharmacology and 2 Tri-instutional MD/PhD Program, Weill Medical College of Cornell University, New York, NY 10065
In � cells, both glucose and hormones, such as GLP-1, stimulate production of the second messenger cAMP, but glucose and GLP-1 elicit distinct cellular responses. We now show in INS-1E insulinoma cells that glucose and GLP-1 produce cAMP with distinct kinetics via different adenylyl cyclases. GLP-1 induces a rapid cAMP signal mediated by G protein – responsive transmembrane adenylyl cyclases (tmAC). In contrast, glucose elicits a delayed cAMP rise mediated by bicarbonate, calcium, and ATP-sensitive soluble adenylyl cyclase (sAC). This glucose-induced, sAC-de-pendent cAMP rise is dependent upon calcium infl ux and is responsible for the glucose-induced activation of the mitogen-activated protein kinase (ERK1/2) pathway. These results demonstrate that sAC-generated and tmAC-generated cAMP defi ne distinct signaling cascades.
© 2008 Ramos et al. This article is distributed under the terms of an Attribution–Noncom-mercial–Share Alike–No Mirror Sites license for the fi rst six months after the publication date (see http://www.jgp.org/misc/terms.shtml). After six months it is available under a Cre-ative Commons License (Attribution–Noncommercial–Share Alike 3.0 Unported license, as described at http://creativecommons.org/licenses/by-nc-sa/3.0/).
on July 23, 2015jgp.rupress.org
Dow
nloaded from
Published August 11, 2008
http://jgp.rupress.org/content/suppl/2008/08/10/jgp.200810044.DC1.html Supplemental Material can be found at:

330 Glucose-induced cAMP in INS-1E Cells
including insulin secretion ( Kennedy et al., 1996 ;
Scheenen et al., 1998 ; Maechler et al., 1999 ; Hohmeier
et al., 2000 ; Kang and Holz, 2003 ), and they are a stable
subline ( Merglen et al., 2004 ) of the cell line used most
extensively to study the cAMP-mediated, glucose-induced
activation of the mitogen-activated protein (MAP) kinase
ERK (extracellular signal – regulated kinase) ( Frodin et al.,
1995 ; Khoo and Cobb, 1997 ). We now show that sAC-
generated cAMP and tmAC-generated cAMP play dis-
tinct roles in both glucose-induced cAMP generation
and activation of the MAP kinases ERK1/2. While both
tmACs and sAC contribute to the total intracellular cAMP
level in the presence of high glucose, tmACs are mainly
responsible for basal cAMP production while sAC is
responsible for the glucose-induced component. We fur-
ther fi nd that glucose-induced, sAC-generated cAMP is
uniquely responsible for the ERK1/2 activation observed
subsequent to glucose metabolism.
M AT E R I A L S A N D M E T H O D S
Reagents INS-1E cells were a gift from Claus Wollheim (University Medical Center, Geneva, Switzerland). RPMI media and HEPES were pur-chased from CellGrow, FBS from Gemini Bio-Products, and � -mer-captoethanol from JT Baker. Opti-MEM was from Invitrogen. Phospho-ERK and total ERK rabbit polyclonal antibodies were ob-tained from Cell Signaling Technology, and actin rabbit polyclonal antibody was from Santa Cruz Biotechnology, Inc. Horseradish peroxidase – linked anti-mouse and anti-rabbit antibodies and Su-perSignal West Pico Chemiluminescent Substrate were from Pierce Chemical Co. GLP-1 (7-36) was obtained from Bachem. Verapamil, 2 ’ 5 � dideoxyadenosine, and EGTA-AM were from Calbiochem, Sp-8Br-cAMP was from Biolog, diazoxide was from Biomol, and 3-iso-butyl-1-methylxanthine (IBMX) was from Sigma-Aldrich. KH7 was synthesized by ChemDiv, Inc. or by the Milstein Chemical Core Fa-cility of Weill Medical College of Cornell University. The anti-sAC mAbs R21 and R37 were developed in our laboratory; R21 is di-rected against amino acids 203 – 216 and R37 against amino acids 436 – 466 of human sAC. Antibodies were conjugated to biotin for use in Western blotting following immunoprecipitation.
Cell Culture INS-1E cells (passage 150 – 175) were cultured as previously de-scribed ( Asfari et al., 1992 ). The cells were cultured under 5% CO 2 in RPMI media containing 10% heat-inactivated FBS, 10 mM HEPES, 1 mM sodium pyruvate, and 50 μ M � -mercaptoethanol, and pas-saged every 2 – 3 d.
Western Blot 100 μ l of Laemmli sample buffer was added directly to the cells in the well of a 24-well plate. 10 – 15 μ l of sample was resolved on an SDS-PAGE, transferred to a PVDF membrane, and probed with specifi c antibodies (i.e., R21, actin, phospho-ERK, or ERK). Where indicated, quantifi cation of bands was performed using a Fluoro-chem 8800 image station (Alpha Innotech).
Immunoprecipitation Cells were lysed in NP-40 buffer (150 mM NaCl, 1.0% NP-40 de-tergent, 50 mM Tris, pH 8.0) in the presence of 10 μ g/ml apro-tinin, 10 μ g/ml leupeptin, and 1 mM PMSF for 30 min, and spun for 15 min at 10,000 g . The supernatant was precleared overnight
required more than 6 min. These different kinetics are
consistent with distinct mechanisms of cAMP generation.
Cellular cAMP levels are determined by the relative
activities of adenylyl cyclases, which synthesize the sec-
ond messenger, and phosphodiesterases (PDEs), which
catabolize it. Various studies have demonstrated that
the glucose-induced cAMP rise occurs in the presence
of PDE inhibitors ( Charles et al., 1973 ; Landa et al.,
2005 ), revealing the actions of glucose must be medi-
ated by changes in the rate of cAMP synthesis by adenylyl
cyclases. In mammals, there are two families of cAMP-
producing adenylyl cyclases, tmACs and “ soluble ” ade-
nylyl cyclase (sAC). Both families of adenylyl cyclase
include members whose activity can be stimulated by
calcium ( Kamenetsky et al., 2006 ). The tmAC family
consists of nine G protein – responsive cyclases, of which
two (tmAC types I and VIII) can be activated by calcium
( Willoughby and Cooper, 2007 ) and are found in � cells
( Yang et al., 1999 ; Delmeire et al., 2003 ; Landa et al.,
2005 ). Our laboratory identifi ed a distinct source of
cAMP in mammalian cells, sAC, which is insensitive to
G proteins and forskolin ( Buck et al., 1999 ). Unlike tmACs,
sAC is not exclusively linked to the plasma membrane
but distributed to several subcellular compartments, such
as the mitochondria, the nucleus, and the centrioles
( Zippin et al., 2003, 2004 ; Bundey and Insel, 2004 ). sAC
activity has been extensively characterized in vitro, and
its activity can be modulated by bicarbonate anions ( Chen
et al., 2000 ), calcium ( Jaiswal and Conti, 2003 ; Litvin et al.,
2003 ), or synergistically by calcium and bicarbonate
( Litvin et al., 2003 ). Additionally, because its affi nity for
substrate, ATP, is in the millimolar range, cellular sAC
activity is predicted to be sensitive to cellular levels of
ATP ( Litvin et al., 2003 ). Bicarbonate regulation of
sAC was shown to be physiologically relevant in sperm
( Esposito et al., 2004 ; Hess et al., 2005 ), bronchii ( Schmid
et al., 2007 ), and epididymis ( Pastor-Soler et al., 2003 ),
while calcium stimulation of sAC was found to be es-
sential for cellular responses to nerve growth factor in
PC12 cells ( Stessin et al., 2006 ) and tumor necrosis factor
in neutrophils ( Han et al., 2005 ).
The two classes of adenylyl cyclases can be distinguished
by pharmacological inhibitors. The P site ligand 2 ’ 5 � -dideoxyadenosine (2 ’ 5 � ddAdo) potently inhibits tmACs
(IC 50 = 3 – 16 μ M) and inhibits sAC only at high concen-
trations ( Johnson et al., 1997 ; Gille et al., 2004 ); in con-
trast, KH7, a molecule identifi ed in our laboratory by a
chemical library screen, is a potent inhibitor of sAC
(IC 50 = 2 – 5 μ M) and inert toward tmACs ( Han et al.,
2005 ; Hess et al., 2005 ; Stessin et al., 2006 ; Wu et al.,
2006 ; Schmid et al., 2007 ). Here we use these pharma-
cological inhibitors, along with genetic knockdown of
sAC, to identify the sources of GLP-1 – induced and glu-
cose-induced cAMP in INS-1E cells. INS-1E cells are an
extensively characterized cell line used for � -cell stud-
ies, and in particular, studies of glucose-induced responses,
on July 23, 2015jgp.rupress.org
Dow
nloaded from
Published August 11, 2008

Ramos et al. 331
R E S U LT S
Temporal Difference in cAMP Production Addition of GLP-1 to INS-1E cells elicited the expected
rise in cellular cAMP levels ( Fig. 1 ). Consistent with pre-
vious observations ( Landa et al., 2005 ), GLP-1 stimu-
lation of cAMP production was rapid; the maximum
2.5-fold increase above basal levels was observed at the
fi rst time point measured (5 min). We included the
broad specifi city PDE inhibitor IBMX to facilitate cAMP
measurements and to focus on cAMP synthesis by ade-
nylyl cyclases. Despite the presence of IBMX, cellular
levels of cAMP were greatly reduced by 15 min. There
are several possible reasons for this decline in cAMP
level, including the potential presence of IBMX-insensitive
PDEs, IBMX inactivation, or cAMP extrusion or leak
out of the cell.
Incubation in high glucose (16 mM) induced a 1.7-fold
increase above basal cAMP levels. However, in contrast to
the rapid and transient cAMP rise following GLP-1, glu-
cose-induced cAMP required more than 5 min to accu-
mulate to detectable levels. This delayed elevation peaked
at 15 min and was sustained for the duration of the ex-
periment (30 min). Thus, our whole cell measurements
replicate the distinct time courses for hormonally stimu-
lated versus glucose-induced cAMP generation previously
seen in studies using intracellular cAMP sensors ( Landa
et al., 2005 ). Because our cAMP measurements were ob-
tained in the presence of the broad specifi city PDE in-
hibitor IBMX, the distinct kinetics induced by hormonal
stimulation and nutrient sensing likely refl ect differen-
tial activation of the cell ’ s adenylyl cyclases.
GLP-1 stimulates a G protein – coupled receptor ( Thorens,
1992 ; Usdin et al., 1993 ), and as expected, the increase
in cAMP due to GLP-1, measured at 5 min, was blocked by
with 50 μ l of 70% protein G slurry (Amersham Pharmacia). Pre-cleared sample was incubated for 4 h or overnight with 50 μ g of R37 or 50 μ g of mouse IgG, followed by incubation for 1 h with protein G slurry. The immune complexes on beads were washed fi ve times with lysis buffer, and resuspended in Laemmli buffer for Western blot analysis.
Immunocytochemistry INS-1E cells were fi xed for 15 min in 4% paraformaldehyde, washed, permeabilized in 0.1% Triton X-100, washed, blocked in 2% BSA, and then probed with R21 overnight. Sections and coverslips were then washed and probed with FITC-conjugated goat anti-mouse secondary antibody (1:200, Alexafl uor, Molecular Probes) and DAPI. Controls included no primary antibody and R21 primary an-tibody preincubated with blocking peptide (amino acids 203 – 216 of human sAC fl ). Images were recorded on a Nikon microscope.
cAMP Accumulation On day one, 2.5 × 10 5 INS-1E cells were plated in each well of a 24-well plate. On day three, cells were incubated in 2.5 mM glu-cose Krebs-Ringer buffer (pH 7.5) supplemented with 2 mM so-dium bicarbonate, 10 mM HEPES, and 0.1% BSA for 1 – 2 h before start of the experiment. At time zero for each experiment, media was switched to Krebs-Ringer buffer containing 2.5 mM glucose, 16 mM glucose, or 2.5 mM glucose plus 60 mM KCl Krebs-Ringer buffer containing 500 μ M IBMX in the presence of the different inhibitors (i.e., DMSO vehicle, 30 μ M KH7, or 50 μ M 2 ’ 5 � dide-oxyadenosine, 100 μ M EGTA-AM, 300 μ M diazoxide, or 60 μ M verapamil) or additional reagents (i.e., 30 nM GLP-1, 0.5 mM Sp-8Br-cAMP) as indicated. In experiments using EGTA-AM, diazox-ide and verapamil, cells were pretreated with inhibitor for 15 min before media change. After media change, cells were incubated for the indicated time at 37 ° C, media was aspirated, and cells lysed in 200 μ l 0.1 M HCl. Intracellular cAMP content was determined using Correlate-EIA Direct Assay (Assay Designs, Inc).
RNAi Silencing RNAi oligonucleotides were purchased from QIAGEN and recon-stituted as per manufacturer ’ s instructions. sAC RNAi was targeted to the following sequence in the rat sAC mRNA: TCGGAGCAT-GATTGAAATCGA. Controls included untransfected cells, cells transfected with no RNA (mock transfected), and cells transfected with QIAGEN AllStars Negative Control siRNA (negative control). For transfection, INS-1E cells were split into 24-well plates or 10-mm dishes and transfection was performed on the same day. After 72 – 80 h, cells were assayed for cAMP and sAC content as above.
RNA Production and RT-PCR Amplifi cation of sAC Products Total RNA was harvested from rat pancreas or INS-1E cells using Trizol according to manufacturer ’ s protocol. Total RNA was quanti-fi ed spectrophotometrically, and at least 2 mg of total RNA was used to generate polyA + RNA using the Micro Poly(A) Purist Kit accord-ing to manufacturer ’ s protocol (Ambion). Purifi ed polyA + RNA was resuspended in DEPC-treated water and treated with amplifi cation grade DNase I according to the manufacturer ’ s protocol (Invitro-gen). Approximately 500 ng of polyA + RNA was used to generate fi rst strand cDNA using Invitrogen ’ s Platinum Taq PCR kit accord-ing to manufacturer ’ s instructions. Polymerase chain reactions used a three-step standard protocol with an initial denaturation step at 93 ° C for 3 min, followed by 40 cycles of 93 ° C for 20 s, 60 ° C for 20 s, and 68 ° C for 1 – 3 min, followed by a fi nal step at 68 ° C for 10 min.
Online Supplemental Material For data presented in Fig. 3 , ANOVA statistical analyses were performed with the Bonferroni comparison test and are provided in Table S1 (available at http://www.jgp.org/cgi/content/full/jgp.200810044/DC1).
Figure 1. Effects of GLP-1 and glucose on cAMP levels in INS-1E cells. Total cellular cAMP was measured in INS-1E cells at the in-dicated times after incubation in Krebs Ringer buffer with 2.5 mM ( � ) glucose, 16 mM ( � ) glucose, or 2.5 mM glucose with 30 nM GLP-1 ( � ) in the presence of 0.5 mM IBMX. Values represent means ± SEM ( n = 4) of total cAMP content per well, with each well containing equivalent number of cells (2.5 × 10 5 cells were plated into each well two days before the assay).
on July 23, 2015jgp.rupress.org
Dow
nloaded from
Published August 11, 2008

332 Glucose-induced cAMP in INS-1E Cells
(i.e., the consistent production of cAMP that is balanced
by intrinsic PDE activity) in Krebs-Ringer buffer with 2.5
mM glucose is due to tmACs.
We next explored whether tmACs contribute to the
cAMP induced by high glucose. Because the glucose-in-
duced elevation of cAMP required more than 5 min to
reach detectable levels ( Landa et al., 2005 ; Fig. 1 ) and
plateaued after 15 min ( Fig. 1 ), we measured total cAMP
accumulation in INS-1E cells after 5, 10, and 15 min. Glu-
cose still induced cAMP production in the presence of
the tmAC-selective P-site inhibitor 2 ’ 5 � ddAdo ( Fig. 3 A ).
While inclusion of 2 ’ 5 � ddAdo did diminish the total
cellular content of cAMP in high glucose, this effect was
primarily due to lowered basal cAMP accumulation in
Krebs-Ringer buffer ( Fig. 2 and Fig. 3 A ). In fact, INS-1E
cells retained almost normal cAMP responsiveness to
high glucose in the absence of any contribution by tmACs:
high glucose stimulated cAMP production 51% in the ab-
sence of P-site inhibitors and 43% in their presence.
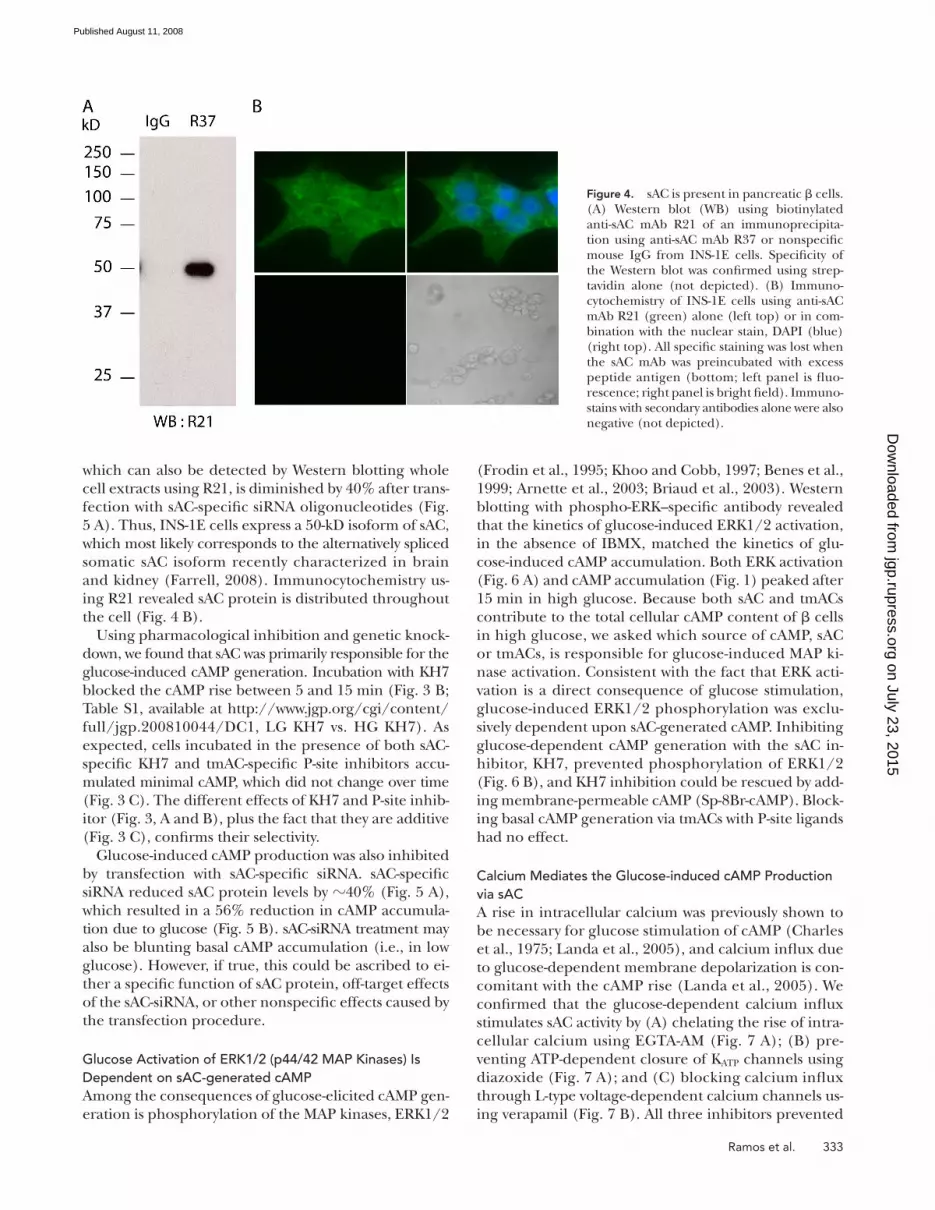
Soluble Adenylyl Cyclase Is the Predominant Source of Glucose-induced cAMP in INS-1E Cells Because glucose-induced cAMP accumulation appears
to be mostly independent of tmAC activity, we explored
the possibility that soluble adenylyl cyclase plays a role.
We demonstrated the presence of sAC mRNA in pan-
creas (Chen, Y., personal communication; unpublished
data) and INS-1E cells by reverse transcription polymer-
ase chain reaction (unpublished data). Interestingly the
sAC mRNA in INS-1E cells seems to arise from a somatic
cell-specifi c promoter ( Farrell, 2008 ). We confi rmed
the presence of sAC protein in INS-1E cells using two
distinct monoclonal antibodies specifi c for sAC ( Fig. 4 A ).
Immuno precipitation of sAC from INS-1E cells with a
monoclonal antibody (R37) followed by Western blotting
using a second mAb (R21) detecting a nonoverlapping
epitope identifi ed a 50-kD protein. This 50-kD protein,
inhibition of G protein – responsive tmACs using 2 ’ 5 � dide-
oxyadenosine (ddAdo) ( Fig. 2 ). Inclusion of KH7,
which inhibits sAC, had no effect on GLP-1 – stimulated
cAMP levels, confi rming both the specifi city of KH7 and
the lack of sAC contribution to GLP-1 – induced cAMP
levels. Thus, GLP-1 increases cAMP levels in INS-1E
cells exclusively via G protein – coupled receptor (GPCR)
stimulation of tmAC activity. Notably, P site inhibitors,
but not KH7, reproducibly diminished the “ basal ” cAMP
accumulation seen in Krebs-Ringer Buffer with low
glucose, implying that the majority of cAMP “ turnover ”
Figure 2. GLP-1-induced cAMP production is mediated via tmACs. Cyclic AMP was measured in INS-1E cells after incubation for 5 min in 2.5 mM glucose in the presence of 0.5 mM IBMX, with either vehicle control, 30 μ M KH7, 50 μ M 2 ’ 5 � ddAdo, 30 nM GLP-1, GLP-1 and KH7, or GLP-1 and 2 ’ 5 � ddAdo. 2 d before the assay, 2.5 × 10 5 cells were plated into each well. Values represent means ± SEM ( n = 8). ANOVA statistical analyses were performed with the Newman-Keuls post-hoc test. ***, indicates P < 0.001; *, P < 0.05.
Figure 3. Individual contribution of tmACs and sAC to glucose-induced cAMP. Total cellular cAMP was measured in INS-1E cells at the indicated times in Krebs Ringer buffer with 2.5 mM glu-cose (triangle symbols) or 16 mM glu-cose (square symbols) in the presence of IBMX, with either vehicle control (A, B, and C, closed symbols and solid lines: � and � ), or in the presence of the inhib-itors (open symbols with dotted lines: � and � ); 50 μ M 2 ’ 5 � ddAdo (A), 30 μ M KH7 (B), or both ddAdo and KH7 (C). Values represent means ± SEM ( n = 4) of total cAMP content per well, with each well containing equivalent num-ber of cells. ANOVA statistical analyses were performed with the Bonferroni com-parison test and provided in Table S1 (available at http://www.jgp.org/cgi/content/full/jgp.200810044/DC1).
on July 23, 2015jgp.rupress.org
Dow
nloaded from
Published August 11, 2008
Ramos et al. 333
( Frodin et al., 1995 ; Khoo and Cobb, 1997 ; Benes et al.,
1999 ; Arnette et al., 2003 ; Briaud et al., 2003 ). Western
blotting with phospho-ERK – specifi c antibody revealed
that the kinetics of glucose-induced ERK1/2 activation,
in the absence of IBMX, matched the kinetics of glu-
cose-induced cAMP accumulation. Both ERK activation
( Fig. 6 A ) and cAMP accumulation ( Fig. 1 ) peaked after
15 min in high glucose. Because both sAC and tmACs
contribute to the total cellular cAMP content of � cells
in high glucose, we asked which source of cAMP, sAC
or tmACs, is responsible for glucose-induced MAP ki-
nase activation. Consistent with the fact that ERK acti-
vation is a direct consequence of glucose stimulation,
glucose-induced ERK1/2 phosphorylation was exclu-
sively dependent upon sAC-generated cAMP. Inhibiting
glucose-dependent cAMP generation with the sAC in-
hibitor, KH7, prevented phosphorylation of ERK1/2
( Fig. 6 B ), and KH7 inhibition could be rescued by add-
ing membrane-permeable cAMP (Sp-8Br-cAMP). Block-
ing basal cAMP generation via tmACs with P-site ligands
had no effect.
Calcium Mediates the Glucose-induced cAMP Production via sAC A rise in intracellular calcium was previously shown to
be necessary for glucose stimulation of cAMP ( Charles
et al., 1975 ; Landa et al., 2005 ), and calcium infl ux due
to glucose-dependent membrane depolarization is con-
comitant with the cAMP rise ( Landa et al., 2005 ). We
confi rmed that the glucose-dependent calcium infl ux
stimulates sAC activity by (A) chelating the rise of intra-
cellular calcium using EGTA-AM ( Fig. 7 A ); (B) pre-
venting ATP-dependent closure of K ATP channels using
diazoxide ( Fig. 7 A ); and (C) blocking calcium infl ux
through L-type voltage-dependent calcium channels us-
ing verapamil ( Fig. 7 B ). All three inhibitors prevented
which can also be detected by Western blotting whole
cell extracts using R21, is diminished by 40% after trans-
fection with sAC-specifi c siRNA oligonucleotides ( Fig.
5 A ). Thus, INS-1E cells express a 50-kD isoform of sAC,
which most likely corresponds to the alternatively spliced
somatic sAC isoform recently characterized in brain
and kidney ( Farrell, 2008 ). Immunocytochemistry us-
ing R21 revealed sAC protein is distributed throughout
the cell ( Fig. 4 B ).
Using pharmacological inhibition and genetic knock-
down, we found that sAC was primarily responsible for the
glucose-induced cAMP generation. Incubation with KH7
blocked the cAMP rise between 5 and 15 min ( Fig. 3 B ;
Table S1, available at http://www.jgp.org/cgi/content/
full/jgp.200810044/DC1, LG KH7 vs. HG KH7). As
expected, cells incubated in the presence of both sAC-
specifi c KH7 and tmAC-specifi c P-site inhibitors accu-
mulated minimal cAMP, which did not change over time
( Fig. 3 C ). The different effects of KH7 and P-site inhib-
itor ( Fig. 3, A and B ), plus the fact that they are additive
( Fig. 3 C ), confi rms their selectivity.
Glucose-induced cAMP production was also inhibited
by transfection with sAC-specifi c siRNA. sAC-specifi c
siRNA reduced sAC protein levels by � 40% ( Fig. 5 A ),
which resulted in a 56% reduction in cAMP accumula-
tion due to glucose ( Fig. 5 B ). sAC-siRNA treatment may
also be blunting basal cAMP accumulation (i.e., in low
glucose). However, if true, this could be ascribed to ei-
ther a specifi c function of sAC protein, off-target effects
of the sAC-siRNA, or other nonspecifi c effects caused by
the transfection procedure.
Glucose Activation of ERK1/2 (p44/42 MAP Kinases) Is Dependent on sAC-generated cAMP Among the consequences of glucose-elicited cAMP gen-
eration is phosphorylation of the MAP kinases, ERK1/2
Figure 4. sAC is present in pancreatic � cells. (A) Western blot (WB) using biotinylated anti-sAC mAb R21 of an immunoprecipita-tion using anti-sAC mAb R37 or nonspecifi c mouse IgG from INS-1E cells. Specifi city of the Western blot was confi rmed using strep-tavidin alone (not depicted). (B) Immuno-cytochemistry of INS-1E cells using anti-sAC mAb R21 (green) alone (left top) or in com-bination with the nuclear stain, DAPI (blue) (right top). All specifi c staining was lost when the sAC mAb was preincubated with excess peptide antigen (bottom; left panel is fl uo-rescence; right panel is bright fi eld). Immuno-stains with secondary antibodies alone were also negative (not depicted).
on July 23, 2015jgp.rupress.org
Dow
nloaded from
Published August 11, 2008

334 Glucose-induced cAMP in INS-1E Cells
concentration of KCl, in low glucose, increased cAMP
production, which was blocked by KH7 but not by P-site
inhibitor ( Fig. 8 A ). Furthermore, this depolarization-
induced, sAC-dependent cAMP rise was responsible for
activation of ERK1/2 ( Fig. 8 B ); thus, depolarization-in-
duced calcium infl ux effectively mimics the situation in
high glucose.
D I S C U S S I O N
Signal transduction specifi city is dependent upon spa-
tial restriction of the signaling machinery. For second
messengers, such as cAMP, this is achieved by compart-
mentalization of the second messenger and its effec-
tors ( Buxton and Brunton, 1983 ; Zaccolo et al., 2002 ;
Zaccolo and Pozzan, 2002 ; Zippin et al., 2003 ; Baillie
et al., 2005 ; Willoughby and Cooper, 2007 ). Compart-
mentalization of a cell into multiple cAMP signaling
microdomains permits this second messenger to medi-
ate various, independent cellular processes. Here, we
identify two temporally and mechanistically separate
cAMP signaling cascades in INS-1E cells, a model for
pancreatic � cells. GLP-1 induces a rapid elevation of
cAMP via stimulation of membrane-anchored tmACs,
while glucose induces a delayed elevation of cAMP via
stimulation of sAC. Because sAC isoforms are not teth-
ered to the plasma membrane, like tmACs, but are dis-
tributed throughout the cytoplasm and in organelles
( Fig. 4 B ; Zippin et al., 2003, 2004 ), we presume GLP-1 –
and glucose-regulated cAMP microdomains are spatially
distinct as well. However, determination of their subcel-
lular localization requires further study using targeted,
intracellular cAMP sensors.
A rapid and transient response induced by the in-
cretin, GLP-1, is consistent with it being mediated via
GPCR stimulation of a tmAC ( Thorens, 1992 ; Doyle and
Egan, 2007 ). Each step of a GPCR signaling cascade,
from receptor desensitization to intrinsic timing of the
glucose-induced cAMP generation in INS-1E cells in the
presence of 16 mM glucose. Consistently, these meth-
ods for blocking calcium infl ux were previously shown
to impair glucose-induced ERK activation ( Benes et al.,
1998 ; Arnette et al., 2003 ; Briaud et al., 2003 ).
We next tested whether depolarization-induced cal-
cium infl ux was suffi cient to stimulate cAMP produc-
tion via sAC. Incubation of INS-1E cells in depolarizing
Figure 5. RNAi confi rms the role of sAC in glucose-induced cAMP production. (A) Western blot, along with quantitation, using sAC-specifi c mAb R21 (top) or anti – � -actin mAb (middle) of INS-1E cells trans-fected with no RNA (mock; white bar), sAC-specifi c RNAi oligonucleotide (sAC-siRNA; black bar), or non-specifi c oligonucleotide (Neg C; gray bar). sAC bands from two independent transfections were quantifi ed by densitometry and normalized to � -actin (bottom). (B) Total cellular cAMP in untransfected INS-1E cells (Un) or INS-1E cells transfected with no RNA (mock), sAC-specifi c RNAi (sAC siRNA), or nonspecifi c oligo-nucleotide (neg C) after incubation for 15 min in Krebs Ringer buffer with low (2.5 mM; white bars) or high (16 mM; black bars) glucose. Values represent means ± SEM ( n = 6) of total cAMP content per well, where each well contained equivalent number of cells
upon RNAi transfection. High glucose stimulated cAMP production 1.78-fold in controls (untransfected, mock-transfected, and negative control – transfected cells) and 1.34-fold in sAC-siRNA-transfected INS-1E cells. ANOVA statistical analysis was performed with the New-man-Keuls post-hoc test. ns, not signifi cant; **, P < 0.01; ***, P < 0.001.
Figure 6. Glucose leads to ERK (p42/44) activation in a sAC-de-pendent manner. Western blots using anti-phosphoERK (pERK) or total ERK (ERK) of INS-1 cells incubated in Krebs Ringer buf-fer with 2.5 mM glucose (LG) or 16 mM glucose (HG) (in the ab-sence of IBMX) (A) for 5, 10, 15, 20, and 30 min or (B) for 15 min in the presence or absence of 30 μ M KH7 or 50 μ M 2 ’ 5 � ddAdo or KH7 and 0.5 mM Sp-8Br-cAMP. Western blot shows phosphory-lation and total protein for both ERK1 and ERK2, p44 and p42. Shown are representative experiments repeated multiple times (for A, n = 4; for B, n = 7).
on July 23, 2015jgp.rupress.org
Dow
nloaded from
Published August 11, 2008

Ramos et al. 335
calcium, all three of which are elevated downstream
of glucose metabolism in � cells. We have shown cal-
cium infl ux due to glucose is both necessary and suffi -
cient for sAC activation, but calcium stimulation may
not be the sole modulator of sAC. Because its Km for
substrate ATP of 1 mM matches predicted cytosolic
levels, sAC would also serve as a cellular ATP sensor. In
addition, cellular bicarbonate levels fl uctuate in direct
proportion to the rate of CO 2 synthesis. Thus, all three
sAC modulators would increase due to glucose metab-
olism, and sAC activity would only be stimulated after
glucose is metabolized. Furthermore, as long as glucose
is being metabolized, all three sAC modulators would
remain elevated, resulting in sustained stimulation of
sAC activity.
Two recent studies explored cAMP generation in � -cell
lines using intracellular, FRET-based sensors. Dyachok
et al. ( 2006 ) focused on the interrelationship between
calcium infl ux and cAMP generation in INS-1E cells.
Their data demonstrating cAMP induction by GLP-1
agrees with our studies; i.e., physiological levels of the
G protein activation cycle, ensures its transient nature.
Furthermore, the functions of an incretin may be well
served by a pulse of cAMP. Incretins represent tonic sig-
nals that need to be interpreted once by � cells, for
example, by a spike of cAMP, to prepare them for com-
ing nutrients.
The INS-1E cell response to glucose was different; cAMP
production was delayed when the cells were moved into
high glucose. In contrast to the incretin-induced pulse
of cAMP, which primes the � -cell for coming nutrients,
the slow increase in second messenger would be an appro-
priate response to a chronic signal, like elevated glucose.
Our cAMP accumulation experiments were performed
in the presence of IBMX, to enable in vitro measurements
of accumulated cAMP; therefore, it is unclear whether
the sustained cAMP elevation observed here would be
reproduced in vivo. Such a study awaits identifi cation of
a correctly targeted intracellular cAMP sensor. We spec-
ulate that the sAC-dependent elevation of cAMP due to
glucose will be maintained for as long as glucose re-
mains elevated; in this way, the glucose-dependent regu-
lation would resemble a thermostat.
A delayed response is consistent with sAC biochemis-
try. sAC is directly modulated by ATP, bicarbonate, and
Figure 7. Glucose-induced calcium entry is necessary for sAC ac-tivation. Cyclic AMP was measured in INS-1E cells after incubation for 15 min in 2.5 or 16 mM glucose in the presence of 0.5 mM IBMX, with either vehicle control (white bars) or (A) 100 μ M EGTA-AM (gray bars), 300 μ M diazoxide (black bars) or (B) 60 μ M verapamil (black bars). Values represent means ± SEM ( n ≥ 4). ANOVA statistical analyses were performed with the Newman-Keuls post-hoc test. ***, P < 0.001.
Figure 8. Depolarization-induced calcium entry is suffi cient to induce functional sAC-generated cAMP. (A) Cyclic AMP was mea-sured in INS-1E cells after incubation for 15 min in 2.5 mM glu-cose (white bars) or 2.5 mM glucose plus 60 mM KCl (gray bars) in the presence of 0.5 mM IBMX, with either vehicle control, 50 μ M 2 ’ 5 � ddAdo, and/or 30 μ M KH7. Values represent means ± SEM ( n ≥ 4). ANOVA statistical analyses were performed with the Bonferroni comparison test. ***, P < 0.001. (B) Western blots us-ing anti-phosphoERK (pERK) or total ERK (ERK) of INS-1E cells incubated in Krebs-Ringer buffer with 2.5 mM glucose (LG) or 2.5 mM glucose with 60 mM KCl (LG+KCl), in the absence of IBMX, for 15 min in the presence or absence of 50 μ M 2 ’ 5 � ddAdo or 30 μ M KH7. Shown are representative experiments repeated four times.
on July 23, 2015jgp.rupress.org
Dow
nloaded from
Published August 11, 2008

336 Glucose-induced cAMP in INS-1E Cells
comments on the manuscript, Dr. Martin Tresguerres for micros-copy assistance, and P. Antinozzi and C. Wollheim for the kind gift of INS-1E cells.
This work has been funded by the Ellison Medical Foundation (J. Buck), American Diabetes Association (L.R. Levin), Hirschl-Weil Cauler Trust (L.R. Levin), National Institutes of Health (GM62328 to J. Buck; DA007274 to M. Kamenetsky), Tri-Institutional MSTP (J.H. Zippin), and Barbara and Stephen Friedman Fellowship (J.H. Zippin).
Olaf S. Andersen served as editor.
Submitted: 14 May 2008 Accepted: 25 July 2008
Note added in proof. Our assumption that Dyachok et al. (2006) did not observe a glucose-induced elevation of cAMP because they only measured short times after glucose addition proved to be true. More recent work from Dyachok et al. (Dyachok, O., O. Idevall-Hagren, J. Sågetorp, G. Tian, A. Wuttke, C. Arrieumerlou, G. Akusjärvi, E. Gylfe, and A. Tengholm. 2008. Cell Metab. 8:26 – 37) describes a delayed, glucose-induced rise in cAMP in Min6 cells.
R E F E R E N C E S Arnette , D. , T.B. Gibson , M.C. Lawrence , B. January , S. Khoo , K.
McGlynn , C.A. Vanderbilt , and M.H. Cobb . 2003 . Regulation of
ERK1 and ERK2 by glucose and peptide hormones in pancreatic
� cells. J. Biol. Chem. 278 : 32517 – 32525 .
Asfari , M. , D. Janjic , P. Meda , G. Li , P.A. Halban , and C.B. Wollheim .
1992 . Establishment of 2-mercaptoethanol-dependent differenti-
ated insulin-secreting cell lines. Endocrinology . 130 : 167 – 178 .
Ashcroft , F.M., and P. Rorsman. 1989 . Electrophysiology of the pan-
creatic � -cell. Prog. Biophys. Mol. Biol. 54 : 87 – 143 .
Baillie , G.S. , J.D. Scott , and M.D. Houslay . 2005 . Compartmentalisation
of phosphodiesterases and protein kinase A: opposites attract.
FEBS Lett. 579 : 3264 – 3270 .
Benes , C. , M.P. Roisin , H.V. Tan , C. Creuzet , J. Miyazaki , and R.
Fagard . 1998 . Rapid activation and nuclear translocation of mi-
togen-activated protein kinases in response to physiological con-
centration of glucose in the MIN6 pancreatic � cell line. J. Biol. Chem. 273 : 15507 – 15513 .
Benes , C. , V. Poitout , J.C. Marie , J. Martin-Perez , M.P. Roisin , and
R. Fagard . 1999 . Mode of regulation of the extracellular signal-
regulated kinases in the pancreatic � -cell line MIN6 and their im-
plication in the regulation of insulin gene transcription. Biochem. J. 340 : 219 – 225 .
Briaud , I. , M.K. Lingohr , L.M. Dickson , C.E. Wrede , and C.J.
Rhodes . 2003 . Differential activation mechanisms of Erk-1/2 and
p70(S6K) by glucose in pancreatic � -cells. Diabetes . 52 : 974 – 983 .
Buck , J. , M.L. Sinclair , L. Schapal , M.J. Cann , and L.R. Levin . 1999 .
Cytosolic adenylyl cyclase defi nes a unique signaling molecule in
mammals. Proc. Natl. Acad. Sci. USA . 96 : 79 – 84 .
Bundey , R.A., and P.A. Insel . 2004. Discrete intracellular signaling do-
mains of soluble adenylyl cyclase: camps of cAMP? Sci. STKE . pe19 .
Buxton , I.L., and L.L. Brunton . 1983 . Compartments of cyclic AMP
and protein kinase in mammalian cardiomyocytes. J. Biol. Chem. 258 : 10233 – 10239 .
Charles , M.A. , R. Fanska , F.G. Schmid , P.H. Forsham , and G.M.
Grodsky . 1973 . Adenosine 3 � ,5 � -monophosphate in pancreatic
islets: glucose-induced insulin release. Science . 179 : 569 – 571 .
Charles , M.A. , J. Lawecki , R. Pictet , and G.M. Grodsky . 1975 . Insulin
secretion. Interrelationships of glucose, cyclic adenosine 3:5-mono-
phosphate, and calcium. J. Biol. Chem. 250 : 6134 – 6140 .
Chen , Y. , M.J. Cann , T.N. Litvin , V. Iourgenko , M.L. Sinclair , L.R.
Levin , and J. Buck . 2000 . Soluble adenylyl cyclase as an evolution-
arily conserved bicarbonate sensor. Science . 289 : 625 – 628 .
incretin induce rapid and transient cAMP induction.
However, this study did not detect a glucose-induced
cAMP rise. Our data suggests this is likely due to the fact
that cAMP was measured for short times ( < 5 min) after
glucose addition. The kinetics due to GLP-1 and glucose
observed in the second study, by Landa et al. ( 2005 ),
agree with our data using whole cell cAMP measure-
ments. However, they observed nearly complete inhibition
of the glucose-induced cAMP elevation by 50 μ M P-site
inhibitors. There are a number of differences in the ex-
perimental design of our study compared with theirs.
Landa et al. use a cytosolic FRET-based probe in mouse
Min6 cells, while we are measuring whole cell cAMP in rat
INS-1E cells. We found sAC to be distributed through-
out INS-1E cells ( Fig. 4 B ), and its localization is consis-
tent with other proliferating cells, where sAC is found
inside the nucleus, at mitochondria, in the centrosome,
and throughout the cytoplasm ( Zippin et al., 2003 ). We do
not know which subset of sAC is responsible for glucose-
induced cAMP. Suppose, for example, that the major
elevation of cAMP is due to intramitochondrial-localized
sAC, then the major changes we are studying here would
not be identifi ed by a cytosolic cAMP sensor. For these
reasons, our measurements of whole cell cAMP accumula-
tion are complementary to the previously described cyto-
solic FRET-based sensor.
In INS-1E cells, glucose metabolism leads to activa-
tion of the MAP kinases ERK1 and ERK2 ( Frodin et al.,
1995 ; Khoo and Cobb, 1997 ; Benes et al., 1999 ; Arnette
et al., 2003 ; Briaud et al., 2003 ). The glucose-induced
ERK1/2 phosphorylation was shown to be mediated via
the cAMP-induced activation of PKA. We now show that
the glucose-induced cAMP generation by sAC is respon-
sible for ERK activation, which plays a role in insulin
gene expression ( Khoo et al., 2003 ). Thus, glucose-in-
duced cAMP generation by sAC is functionally relevant
in � cells. It remains to be seen whether glucose-induced,
sAC-dependent cAMP generation also plays a role in in-
sulin release.
The distinct kinetics of GLP-1 – induced and glucose-
induced cAMP generation may underlie the reason for
evolution of two types of cAMP signaling cascades in
mammalian cells: tmACs, which respond with a spike to a
tonic signal like hormones and neurotransmitters, versus
sAC, which responds with a sustained signal to prolonged
cues, such as glucose sensing by � cells, bicarbonate sens-
ing by sperm ( Esposito et al., 2004 ; Hess et al., 2005 ),
CO 2 sensing in bronchii ( Schmid et al., 2007 ), pH sensing
in epididymis ( Pastor-Soler et al., 2003 ), migration toward
guidance cues like Netrin-1 in developing neurons ( Wu
et al., 2006 ), and responses to growth factors like TNF
( Han et al., 2005 ) and NGF ( Stessin et al., 2006 ) in neutro-
phils and neurons, respectively.
We would like to thank the members of the Levin/Buck Labora-tory, especially Eric Salazar and Dr. Martin Tresguerres for critical
on July 23, 2015jgp.rupress.org
Dow
nloaded from
Published August 11, 2008

Ramos et al. 337
Khoo , S. , S.C. Griffen , Y. Xia , R.J. Baer , M.S. German , and M.H.
Cobb . 2003 . Regulation of insulin gene transcription by ERK1
and ERK2 in pancreatic � cells. J. Biol. Chem. 278 : 32969 – 32977 .
Landa , L.R. Jr ., M. Harbeck , K. Kaihara , O. Chepurny , K.
Kitiphongspattana , O. Graf , V.O. Nikolaev , M.J. Lohse , G.G.
Holz , and M.W. Roe . 2005 . Interplay of Ca2 + and cAMP sig-
naling in the insulin-secreting MIN6 � -cell line. J. Biol. Chem. 280 : 31294 – 31302 .
Litvin , T.N. , M. Kamenetsky , A. Zarifyan , J. Buck , and L.R.
Levin . 2003 . Kinetic properties of “ soluble ” adenylyl cyclase.
Synergism between calcium and bicarbonate. J. Biol. Chem. 278 : 15922 – 15926 .
Maechler , P. , E.D. Kennedy , E. Sebo , A. Valeva , T. Pozzan , and C.B.
Wollheim . 1999 . Secretagogues modulate the calcium concen-
tration in the endoplasmic reticulum of insulin-secreting cells.
Studies in aequorin-expressing intact and permeabilized INS-1
cells . J. Biol. Chem. 274 : 12583 – 12592 .
Merglen , A. , S. Theander , B. Rubi , G. Chaffard , C.B. Wollheim , and
P. Maechler . 2004 . Glucose sensitivity and metabolism-secretion
coupling studied during two-year continuous culture in INS-1E
insulinoma cells. Endocrinology . 145 : 667 – 678 .
Moens , K. , H. Heimberg , D. Flamez , P. Huypens , E. Quartier , Z.
Ling , D. Pipeleers , S. Gremlich , B. Thorens , and F. Schuit . 1996 .
Expression and functional activity of glucagon, glucagon-like
peptide I, and glucose-dependent insulinotropic peptide recep-
tors in rat pancreatic islet cells. Diabetes . 45 : 257 – 261 .
Montrose-Rafi zadeh , C. , Y. Wang , A.M. Janczewski , T.E. Henderson ,
and J.M. Egan . 1997 . Overexpression of glucagon-like peptide-1
receptor in an insulin-secreting cell line enhances glucose re-
sponsiveness. Mol. Cell. Endocrinol. 130 : 109 – 117 .
Pastor-Soler , N. , V. Beaulieu , T.N. Litvin , N. Da Silva , Y. Chen , D.
Brown , J. Buck , L.R. Levin , and S. Breton . 2003 . Bicarbonate-reg-
ulated adenylyl cyclase (sAC) is a sensor that regulates pH-depen-
dent V-ATPase recycling. J. Biol. Chem. 278 : 49523 – 49529 .
Rutter , G.A. 2001 . Nutrient-secretion coupling in the pancreatic
islet � -cell: recent advances. Mol. Aspects Med. 22 : 247 – 284 .
Rutter , G.A. , J.M. Theler , M. Murgia , C.B. Wollheim , T. Pozzan , and
R. Rizzuto . 1993 . Stimulated Ca 2+ infl ux raises mitochondrial
free Ca 2+ to supramicromolar levels in a pancreatic � -cell line.
Possible role in glucose and agonist-induced insulin secretion.
J. Biol. Chem. 268 : 22385 – 22390 .
Scheenen , W.J. , C.B. Wollheim , T. Pozzan , and C. Fasolato . 1998 .
Ca 2+ depletion from granules ihibits exocytosis. A study with insu-
lin-secreting cells. J. Biol. Chem. 273 : 19002 – 19008 .
Schmid , A. , Z. Sutto , M.C. Nlend , G. Horvath , N. Schmid , J. Buck ,
L.R. Levin , G.E. Conner , N. Fregien , and M. Salathe . 2007 .
Soluble adenylyl cyclase is localized to cilia and contributes to
ciliary beat frequency regulation via production of cAMP. J. Gen. Physiol. 130 : 99 – 109 .
Stessin , A.M. , J.H. Zippin , M. Kamenetsky , K.C. Hess , J. Buck , and L.R.
Levin . 2006 . Soluble adenylyl cyclase mediates nerve growth fac-
tor-induced activation of Rap1. J. Biol. Chem. 281 : 17253 – 17258 .
Thorens , B. 1992 . Expression cloning of the pancreatic B cell recep-
tor for the gluco-incretin hormone glucagon-like peptide 1. Proc. Natl. Acad. Sci. USA . 89 : 8641 – 8645 .
Usdin , T. , E. Mezey , D.C. Button , M.J. Brownstein , and D.C. Bonner .
1993 . Gastric inhibitory polypeptide receptor, a member of the
secretin-vasoactive intestinal peptide receptor family, is widely
distributed in peripheral oragans and the brain. Endocrinology . 133 : 2861 – 2870 .
Willoughby , D., and D.M. Cooper. 2007 . Organization and Ca 2+
regulation of adenylyl cyclases in cAMP microdomains. Physiol. Rev. 87 : 965 – 1010 .
Wu , K.Y. , J.H. Zippin , D.R. Huron , M. Kamenetsky , U. Hengst , J.
Buck , L.R. Levin , and S.R. Jaffrey . 2006 . Soluble adenylyl cyclase is
Delmeire , D. , D. Flamez , S.A. Hinke , J.J. Cali , D. Pipeleers , and F.
Schuit . 2003 . Type VIII adenylyl cyclase in rat � cells: coincidence
signal detector/generator for glucose and GLP-1. Diabetologia . 46 : 1383 – 1393 .
Doyle , M.E. , and J.M. Egan . 2007 . Mechanisms of action of glucagon-
like peptide 1 in the pancreas. Pharmacol. Ther. 113 : 546 – 593 .
Dyachok , O. , Y. Isakov , J. Sagetorp , and A. Tengholm . 2006 .
Oscillations of cyclic AMP in hormone-stimulated insulin-secret-
ing � -cells. Nature . 439 : 349 – 352 .
Esposito , G. , B.S. Jaiswal , F. Xie , M.A. Krajnc-Franken , T.J. Robben ,
A.M. Strik , C. Kuil , R.L. Philipsen , M. Van Duin , M. Conti , and
J.A. Gossen . 2004 . Mice defi cient for soluble adenylyl cyclase are
infertile because of a severe sperm-motility defect. Proc. Natl. Acad. Sci. USA . 101 : 2993 – 2998 .
Farrell , J. 2008 . The molecular identity of soluble adenylyl cyclase.
Weill Medical College of Cornell University, New York.
Frodin , M. , N. Sekine , E. Roche , C. Filloux , M. Prentki , C.B.
Wollheim , and E. Van Obberghen . 1995 . Glucose, other secre-
tagogues, and nerve growth factor stimulate mitogen-activated
protein kinase in the insulin-secreting � -cell line, INS-1. J. Biol. Chem. 270 : 7882 – 7889 .
Gille , A. , G.H. Lushington , T.C. Mou , M.B. Doughty , R.A. Johnson ,
and R. Seifert . 2004 . Differential inhibition of adenylyl cyclase
isoforms and soluble guanylyl cyclase by purine and pyrimidine
nucleotides. J. Biol. Chem. 279 : 19955 – 19969 .
Grill , V., and E. Cerasi. 1973 . Activation by glucose of adenylyl cy-
clase in pancreatic islets of the rat. FEBS Lett. 33 : 311 – 314 .
Han , H. , A. Stessin , J. Roberts , K. Hess , N. Gautam , M. Kamenetsky ,
O. Lou , E. Hyde , N. Nathan , W.A. Muller , J. Buck , L.R. Levin , and
C. Nathan . 2005 . Calcium-sensing soluble adenylyl cyclase medi-
ates TNF signal transduction in human neutrophils. J. Exp. Med. 202 : 353 – 361 .
Hess , K.C. , B.H. Jones , B. Marquez , Y. Chen , T.S. Ord , M. Kamenetsky ,
C. Miyamoto , J.H. Zippin , G.S. Kopf , S.S. Suarez , et al . 2005 . The
“ soluble ” adenylyl cyclase in sperm mediates multiple signaling
events required for fertilization. Dev. Cell . 9 : 249 – 259 .
Hohmeier , H.E. , H. Mulder , G. Chen , R. Henkel-Reiger , M. Prentki ,
and C.B. Newgard . 2000 . Isolation of INS-1 derived-cell lines
with robust ATP-sensitive K + channel-dependent and -independent
glucose-stimulated insulin secretion. Diabetes . 49 : 424 – 430 .
Holz , G.G. , C.A. Leech , and J.F. Haberner . 1995 . Activation of
a cAMP-regulated Ca 2+ -signaling pathway in pancreatic B-cells
by the insulinotropic hormone glucagon-like peptide-1. J. Biol. Chem. 270 : 17749 – 17757 .
Jaiswal , B.S., and M. Conti . 2003 . Calcium regulation of the soluble
adenylyl cyclase expressed in mammalian spermatozoa. Proc. Natl. Acad. Sci. USA . 100 : 10676 – 10681 .
Johnson , R.A. , L. Desaubry , G. Bianchi , I. Shoshani , E. Lyons Jr .,
R. Taussig , P.A. Watson , J.J. Cali , J. Krupinski , J.P. Pieroni , and
R. Iyengar . 1997 . Isozyme-dependent sensitivity of adenylyl cyclases
to P-site-mediated inhibition by adenine nucleosides and nucleo-
side 3 � -polyphosphates. J. Biol. Chem. 272 : 8962 – 8966 .
Kamenetsky , M. , S. Middelhaufe , E.M. Bank , L.R. Levin , J. Buck ,
and C. Steegborn . 2006 . Molecular details of cAMP generation in
mammalian cells: a tale of two systems. J. Mol. Biol. 362 : 623 – 639 .
Kang , G. , and G.G. Holz . 2003 . Amplifi cation of exocytosis by
Ca2 + -induced Ca2 + release in INS-1 pancreatic � cells. J. Physiol. 546 : 175 – 189 .
Kennedy , E.D. , R. Rizzuto , J.M. Theler , W.F. Pralong , C. Bastianutto ,
T. Pozzan , and C.B. Wollheim . 1996 . Glucose-stimulated insulin
secretion correlates with changes in mitochondrial and cytosolic Ca 2+
in aequorin-expressing INS-1 cells. J. Clin. Invest. 98 : 2524 – 2538 .
Khoo , S., and M.H. Cobb . 1997 . Activation of mitogen-activating
protein kinase by glucose is not required for insulin secretion.
Proc. Natl. Acad. Sci. USA . 94 : 5599 – 5604 .
on July 23, 2015jgp.rupress.org
Dow
nloaded from
Published August 11, 2008

338 Glucose-induced cAMP in INS-1E Cells
Zaccolo , M. , P. Magalhaes , and T. Pozzan . 2002 . Compartmentalisa-
tion of cAMP and Ca 2+ signals. Curr. Opin. Cell Biol. 14 : 160 – 166 .
Zippin , J.H. , Y. Chen , P. Nahirney , M. Kamenetsky , M.S. Wuttke , D.A.
Fischman , L.R. Levin , and J. Buck . 2003 . Compartmentalization of
bicarbonate-sensitive adenylyl cyclase in distinct signaling microdo-
mains. FASEB J. 17 : 82 – 84 .
Zippin , J.H. , J. Farrell , D. Huron , M. Kamenetsky , K.C. Hess , D.A.
Fischman , L.R. Levin , and J. Buck . 2004 . Bicarbonate-responsive
“ soluble ” adenylyl cyclase defi nes a nuclear cAMP microdomain.
J. Cell Biol. 164 : 527 – 534 .
required for netrin-1 signaling in nerve growth cones. Nat. Neurosci. 9 : 1257 – 1264 .
Yang , B. , B. He , S.M. Abdel-Halim , A. Tibell , M.D. Brendel , R.G.
Bretzel , S. Efendic , and J. Hillert . 1999 . Molecular cloning
of a full-length cDNA for human type 3 adenylyl cyclase and
its expression in human islets. Biochem. Biophys. Res. Commun. 254 : 548 – 551 .
Zaccolo , M., and T. Pozzan . 2002 . Discrete microdomains with high
concentration of cAMP in stimulated rat neonatal cardiac myo-
cytes. Science . 295 : 1711 – 1715 .
on July 23, 2015jgp.rupress.org
Dow
nloaded from
Published August 11, 2008


