Embed Size (px)
Citation preview
This journal is c The Royal Society of Chemistry 2012 Catal. Sci. Technol., 2012, 2, 1173–1179 1173
Cite this: Catal. Sci. Technol., 2012, 2, 1173–1179
Glycerol utilization: solvent-free acetalisation over niobia catalysts
G. S. Nair,aE. Adrijanto,
aA. Alsalme,
bcI. V. Kozhevnikov,
bD. J. Cooke,
a
D. R. Brownaand N. R. Shiju*
d
Received 23rd August 2011, Accepted 16th January 2012
DOI: 10.1039/c2cy00335j
With increasing biodiesel production, availability of glycerol is expected to increase. New
processes are needed for converting this surplus glycerol to value-added chemicals. In this work,
we used niobia catalysts for the liquid-phase acetalisation of glycerol without using any solvent.
High conversions were achieved (B80%), though water was present in the reaction system. The
calcination temperature changed the strength as well as the nature of acidity of the samples.
Samples with higher Brønsted acid strength exhibited higher catalytic performance. The results
show that niobia is a water tolerant, reusable catalyst for glycerol acetalisation.
1. Introduction
Biodiesel production is accompanied by the formation of
glycerol as a by-product. Its availability has tripled within
the last ten years due to the increased biodiesel production.1
Several countries target increased biofuel usage in future,
hence the glycerol availability will still increase.2 With the
oversupply and the consequent drop in price, glycerol is
expected to become a major platform chemical.3 The use of
glycerol is limited now, being mainly confined to pharmaceuticals
and cosmetics. Hence new processes are needed that can convert
the surplus glycerol to value-added chemicals. In addition to
taking advantage of the relatively low price of glycerol, this will
also improve the economic viability of biodiesel manufacture.
Research efforts are gaining momentum for the synthesis of
value added products from glycerol. A few studies on glycerol
reactions have been reported that involve catalytic processes
such as reforming, oxidation, hydrogenolysis, etherification,
dehydration and esterification reactions.1,4,5 A possible way of
utilizing glycerol is through its condensation with aldehydes
and ketones to acetals and ketals respectively.6–12 Glycerol
acetals and ketals may be used as fuel additives, surfactants
and flavours.6–12 When incorporated into standard diesel fuel,
they have led to a decrease in particles, hydrocarbons, carbon
monoxide and unregulated aldehyde emissions.12,13 These
products can act as cold flow improvers for use in biodiesel, also
reducing its viscosity. This is important because there is a growing
demand for new additives specifically for biodiesel that are
biodegradable, non-toxic and renewable. The addition of these
compounds to biodiesel improved the viscosity and also met the
established requirements for flash point and oxidation stability.14
The main drawback of the glycerol acetalisation is the produc-
tion of water. This weakens the acid strength of the catalyst and
limits the glycerol conversion. The use of solvents such as benzene,
toluene, petroleum ether or chloroform to increase the glycerol
conversion into acetals or ketals has been described.7 However, this
method is not very efficient and presents environmental problems.
We report solvent-free liquid-phase glycerol acetalisation with
acetone using niobia catalysts. Niobia (Nb2O5) has been used as
a water-tolerant solid acid catalyst for various water-involving
reactions.15–17 The effect of calcination/pretreatment temperature
of hydrated niobium oxide, acidity and other reaction parameters
on the catalytic performance was investigated. The results of this
study show that niobia acts as a stable active catalyst for glycerol
acetalisation (Scheme 1), forming 2,2-dimethyl 4-hydroxymethyl-
1,3-dioxolane (solketal) predominantly.
2. Experimental
Niobia sample (Niobia HY-340) was kindly provided by
CBMM, Brazil. The composition of this batch is as follows:
Nb2O5 80.5 � 5%, Fe 200 ppm max., free Cl 400 ppm max.
and loss on ignition 20.5 � 5%. The samples were calcined at
different temperatures for 4 h in a muffle furnace in static air
before use. The catalysts are represented as Nb2O5-xxx, where
Scheme 1 Acetalisation of glycerol.
aMaterials and Catalysis Research Centre, Dept. of Chemical andBiological Sciences, University of Huddersfield,Queensgate HD1 3DH, UK
bDepartment of Chemistry, University of Liverpool,Liverpool L69 7ZD, UK
cKing Saud University, PO Box 2455, Riyadh 11451, Saudi ArabiadVan’ t Hoff Institute for Molecular Sciences, University ofAmsterdam, Science Park 904, 1098 XH Amsterdam,The Netherlands. E-mail: [email protected]; Fax: +31 (0)20 525 5604
CatalysisScience & Technology
Dynamic Article Links
www.rsc.org/catalysis PAPER
Publ
ishe
d on
01
Mar
ch 2
012.
Dow
nloa
ded
on 2
1/06
/201
4 18
:58:
06.
View Article Online / Journal Homepage / Table of Contents for this issue
1174 Catal. Sci. Technol., 2012, 2, 1173–1179 This journal is c The Royal Society of Chemistry 2012
xxx denotes the calcination temperature in K (Table 1). The
reactions were carried out in the liquid phase in a 50 ml glass
reactor equipped with a condenser and a magnetic stirrer.
Required amounts of glycerol (99+%, Alfa Aesar) and
acetone (99+%, Alfa Aesar) were stirred with a specific mass
of the catalyst in powder form. The molar ratio of glycerol to
acetone was 1 : 1.5 unless otherwise stated. To monitor the
reaction, samples of the reaction mixture were taken periodically
and analysed by gas chromatography (Perkin Elmer Clarus 500)
using a 50 m BP5 capillary column and an FID detector. In a
typical reaction, 34 mmol of glycerol was reacted with 50 mmol
acetone and 0.2 g catalyst. The N2 adsorption–desorption
isotherms were measured at 77 K on a Micromeritics ASAP-
2000 after evacuation at 473 K for 5 h. Surface areas were
calculated by the BETmethod. Powder X-ray diffraction patterns
were collected on a Bruker powder X-ray Diffractometer (D5000)
operated at 40 kV and 20 mA using Nickel filtered Cu Karadiation (1.5406 A). The system used for ammonia adsorption
flow calorimetry has been described previously.18,19 It is based on
a Setaram 111 DSC with an automated gas flow and switching
system, with a mass spectrometer (Hiden HPR20) to sample the
downstream gas flow. The sample (20–30 mg) was held on a glass
frit in a vertical silica sample tube and activated at 423 K under a
dried nitrogen flow (5 ml min�1) for five hours. After activation,
the sample temperature was maintained at 423 K and 1 ml pulses
of the probe gas (1% ammonia in nitrogen) at atmospheric
pressure were injected at regular intervals into the carrier gas
stream from a gas sampling valve. The ammonia concentration
downstream of the sample was monitored continuously by mass
spectroscopy. The pulse interval was chosen to ensure that the
ammonia concentration in the carrier gas returned to zero to
allow the DSC baseline to stabilise. The net amount of
ammonia irreversibly adsorbed from each pulse was determined
by comparing the MS signal with that recorded through a control
experiment with a blank sample tube. The net heat released by each
pulse was calculated from the thermalDSC curve (Table 1). Diffuse
reflectance infrared Fourier transform (DRIFT) spectra of
adsorbed pyridine were obtained on a Nicolet NEXUS FTIR
spectrometer equipped with a controlled environment chamber
(Spectra-Tech Inc., model 0030-101). Catalyst samples were diluted
with KBr powder (10 wt% in KBr) and pre-treated at
150 1C/0.1 Torr for 1 h. The samples were then exposed
to pyridine vapour at room temperature for 1 h, followed
by pumping out at 150 1C/0.1 Torr for 1 h to remove
the physisorbed pyridine. Then the DRIFT spectra of the
adsorbed pyridine were recorded at room temperature.
Atomistic simulation techniques used in this work are
formulated within the framework of the Born model of the
solids.20 This comprises of long-range electrostatic and short-range
interactions to describe the attractive van der Waals interactions
and the dispersive London forces acting between the ions. The
long-range Coulombic interactions converge slowly as a function
of increasing ion separation. This is overcome by using the
mathematical transformation of Ewald21 when the system is
periodic in three dimensions and that of Parry22 when the system
is only periodic in two dimensions (for example when studying
surfaces). The short-range forces are described using simple,
parameterised, pairwise potentials such as the Buckingham
potential of the form F(rij) = Aijexp(�rij/rij) � (Cij/r6ij), where
F(rij) is the short range interaction energy and Aij, rij and Cij are
parameters specific to each pairwise interaction and rij is the
separation between atom i and atom j. Additionally, the effect of
polarisability on the anion is incorporated using the shell model of
Table 1 Textural properties of niobia samples
Catalyst calcinationtemperature/K
BET surfacearea/m2 g�1
Pore volume/cm3 g�1
Average porediametera/nm
Average porediameterb/nm
Acid site concentrationc/mmol g�1
Acid strengthd/kJ mol�1
473 121.0 0.18 5.8 5.5 0.28 92.8573 105.3 0.17 6.5 6.3 0.20 98.3773 59.4 0.16 9.0 8.2 0.13 87.3973 10.6 0.05 — — — —
a Calculated from BJH adsorption. b From BJH desorption. c NH3 adsorbed with �DHoads Z 80 kJ mol�1. d Average heat of adsorption
above 80 kJ mol�1.
Table 2 Potential parameters used in this work
A/eV P/A C/eV A6 C/eV A�2 Charges, e
Nb5+(core)� � �O2�(shell) 3023.184 0.300 0.0 — Nb 5+O2�(shell)� � �O2�(shell) 22 764 0.149 27.89 — O (core) 0.077O2�(core)� � �O2� (shell) — — — 27.29 O (shell) �2.077
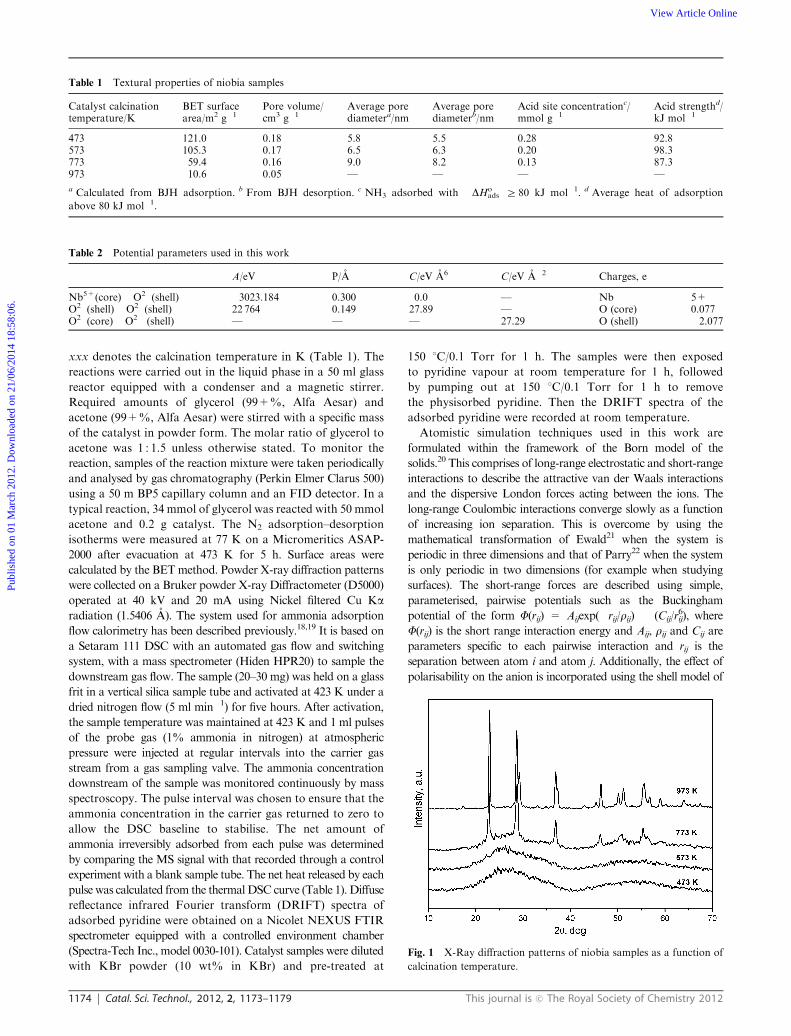
Fig. 1 X-Ray diffraction patterns of niobia samples as a function of
calcination temperature.
Publ
ishe
d on
01
Mar
ch 2
012.
Dow
nloa
ded
on 2
1/06
/201
4 18
:58:
06.
View Article Online
This journal is c The Royal Society of Chemistry 2012 Catal. Sci. Technol., 2012, 2, 1173–1179 1175
Dick and Overhauser.23 Here the ion is divided into a core
containing the mass and the core electron charge and a shell
containing the valence electron charge. These are connected by a
harmonic spring. The polarisability of the model ion is then
determined by the spring constant (k) and the charges of the core
and the shell. We used the values of the potential parameters
reported by Jackson et al.24 and are shown in Table 2.
All simulations were performed using the METADISE
(minimum energy techniques applied to dislocation interface and
surface energies) code which enables us to perform static, energy
minimisations on a solid-state system.25 In the METADISE
program the crystal is regarded as a series of charged planes
parallel to the surface and periodic in two dimensions. The basis
of this approach is to calculate the total interaction energy, often
called the lattice energy.
3. Results and discussion
Fig. 1 shows the XRD patterns of the Nb2O5 catalysts calcined
at different temperatures. The samples heated to 473 and
573 K were essentially amorphous, with very broad peaks.
For the sample calcined at 773 K, peaks corresponding to the
orthorhombic (T) phase of niobium pentoxide were observed.
Some amorphous material was still present in this sample
(Fig. 1). At 973 K, well defined peaks corresponding to the
characteristic reflections of T-Nb2O5 were observed, indicating
complete crystallization. The niobia structure was simulated
starting from the bulk T-Nb2O5 previously described by Kato
and Tamura.26 This structure has a space group symmetry of
PBAM. From this, a pseudo cell was generated with no
symmetry constraints where Nb lattice sites with less than
10% occupancy were removed. The lattice disorder of the
remaining Nb, described by 50% occupied sites less than 1 A
were replaced by a singular occupied site representing an
average of the two sites. The structure of the crystal was then
optimised with no applied pressure in order to find the
minimum energy configuration. During the optimisation, no
symmetry constraints were applied. The relaxed structure
has lattice parameters of a = 6.00, b = 27.58, c = 3.63 and
a= b= g= 901, which differs from the original experimental
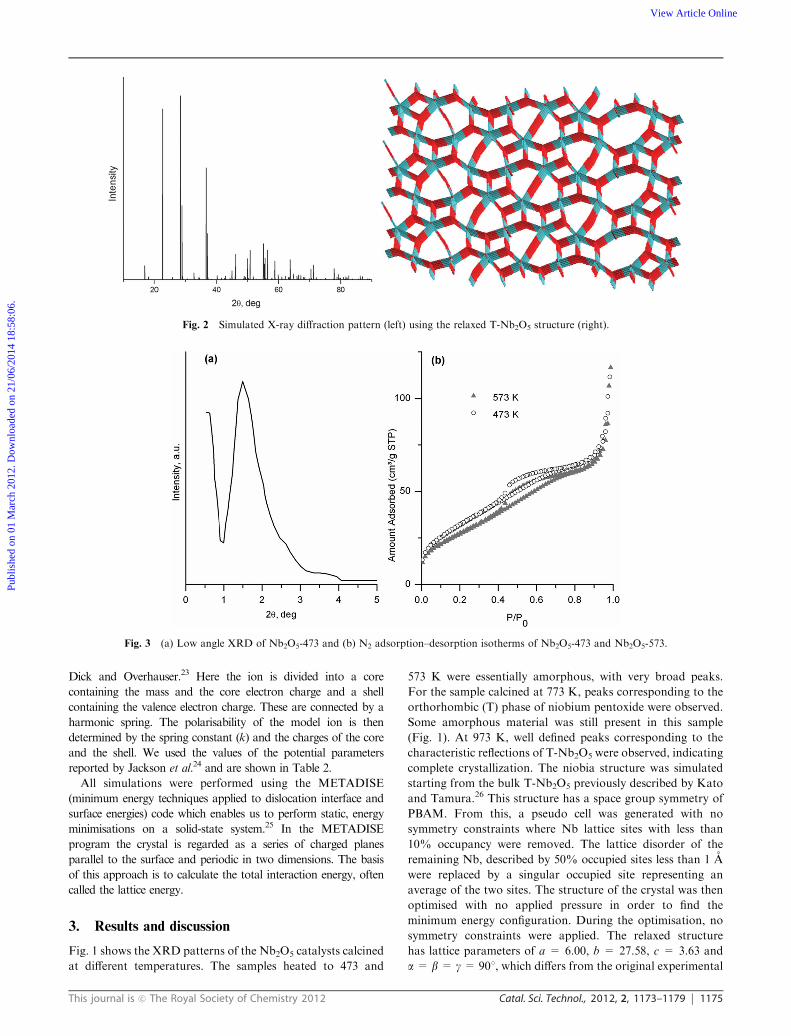
Fig. 2 Simulated X-ray diffraction pattern (left) using the relaxed T-Nb2O5 structure (right).
Fig. 3 (a) Low angle XRD of Nb2O5-473 and (b) N2 adsorption–desorption isotherms of Nb2O5-473 and Nb2O5-573.
Publ
ishe
d on
01
Mar
ch 2
012.
Dow
nloa
ded
on 2
1/06
/201
4 18
:58:
06.
View Article Online
1176 Catal. Sci. Technol., 2012, 2, 1173–1179 This journal is c The Royal Society of Chemistry 2012
structure by 3–8%. This is in good agreement, especially
considering that the structure of T-Nb2O5 was not used in
the derivation of the potential model and that no symmetry
restraints were applied during the simulation. Fig. 2 shows the
relaxed T-Nb2O5 structure, in which 8 Nb ions are present in
distorted octahedra and the remaining 8 Nb ions occupy
pentagonal bipyramidal sites. The oxide ions form a large open
channel structure throughout the unit cell. Using this relaxed
structure, a simulated X-ray powder diffraction pattern (Fig. 2)
was generated using the methodology of Gaussian function as
implemented in the GDIS-Package.27 This pattern matches well
with the experimental pattern, demonstrating that the experimental
sample and the simulated niobia lattice have the same structure.
Table 1 shows the textural properties of the Nb2O5 samples
derived from the nitrogen physisorption isotherms. Both surface
area (from 121 to 10.6 m2 g�1) and pore volume (from 0.18 to
0.06 cm3 g�1) decreased with increasing calcination temperature.
The average pore diameter increased with calcination. These
changes may be correlated with amorphous to crystalline
transformation. In general, surface area decreased with
increasing crystallinity. The most crystalline orthorhombic
(T) phase obtained by calcination at 973 K had the lowest
surface area. The low angle XRD pattern of Nb2O5-473
(Fig. 3a) shows only one peak at around a 2y value of 1.51.
The pattern resembles more that of disordered mesoporous
materials than that of regular mesoporous materials.28–31 The
mesoporosity in these samples is due to the extra framework
void space resulting from the intergrowth of small primary
particles. The mesoporosity is confirmed by the N2 adsorption
isotherm (Fig. 3b), which can be classified as type IV.
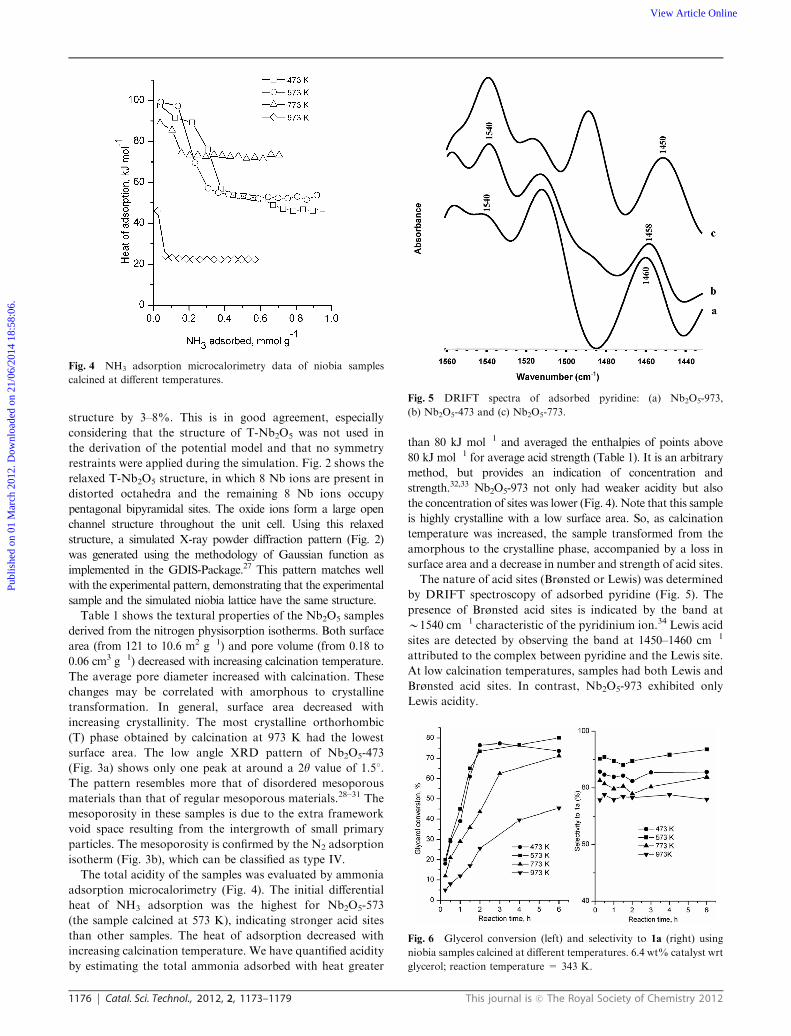
The total acidity of the samples was evaluated by ammonia
adsorption microcalorimetry (Fig. 4). The initial differential
heat of NH3 adsorption was the highest for Nb2O5-573
(the sample calcined at 573 K), indicating stronger acid sites
than other samples. The heat of adsorption decreased with
increasing calcination temperature. We have quantified acidity
by estimating the total ammonia adsorbed with heat greater
than 80 kJ mol�1 and averaged the enthalpies of points above
80 kJ mol�1 for average acid strength (Table 1). It is an arbitrary
method, but provides an indication of concentration and
strength.32,33 Nb2O5-973 not only had weaker acidity but also
the concentration of sites was lower (Fig. 4). Note that this sample
is highly crystalline with a low surface area. So, as calcination
temperature was increased, the sample transformed from the
amorphous to the crystalline phase, accompanied by a loss in
surface area and a decrease in number and strength of acid sites.
The nature of acid sites (Brønsted or Lewis) was determined
by DRIFT spectroscopy of adsorbed pyridine (Fig. 5). The
presence of Brønsted acid sites is indicated by the band at
B1540 cm�1 characteristic of the pyridinium ion.34 Lewis acid
sites are detected by observing the band at 1450–1460 cm�1
attributed to the complex between pyridine and the Lewis site.
At low calcination temperatures, samples had both Lewis and
Brønsted acid sites. In contrast, Nb2O5-973 exhibited only
Lewis acidity.
Fig. 4 NH3 adsorption microcalorimetry data of niobia samples
calcined at different temperatures.
Fig. 5 DRIFT spectra of adsorbed pyridine: (a) Nb2O5-973,
(b) Nb2O5-473 and (c) Nb2O5-773.
Fig. 6 Glycerol conversion (left) and selectivity to 1a (right) using
niobia samples calcined at different temperatures. 6.4 wt% catalyst wrt
glycerol; reaction temperature = 343 K.
Publ
ishe
d on
01
Mar
ch 2
012.
Dow
nloa
ded
on 2
1/06
/201
4 18
:58:
06.
View Article Online
This journal is c The Royal Society of Chemistry 2012 Catal. Sci. Technol., 2012, 2, 1173–1179 1177
Fig. 6 shows the catalytic performance of niobia samples.
These acetalisation reactions were conducted at 343 K, with a
glycerol : acetone molar ratio of 1 : 1.5 using 6.4 wt% of
catalyst (wrt glycerol) without any solvent. The activities were
influenced significantly by the calcination temperature. The
samples pre-treated at lower temperatures were most active
while the sample calcined at 973 K was least active. For the
samples pre-treated at 473 and 573 K, more than 70% glycerol
was converted after 2 h. For the samples calcined at higher
temperatures, initial conversions were lower but increased
over extended reaction time. Initial activities (TOF, s�1) were
calculated from the glycerol kinetic curve and taking ammonia
adsorbed with heat greater than 80 kJ mol�1 for acid site
concentration. The values are 4.7, 8.0 and 5.7 for niobia
calcined at 473, 573 and 773 K. Comparison with NH3
adsorption microcalorimetry data (Fig. 4) shows that the
activity of the catalysts is in accordance with their acidity,
indicating that higher acidity is favourable for higher catalytic
activity. A reaction without any catalyst gave B15% glycerol
conversion at a temperature of 343 K after 6 h.
Glycerol acetalisation can produce two isomers, 5- and
6-membered cyclic acetals 1a and 1b, respectively
(Scheme 1), with the simultaneous liberation of water. In
our experiments, all catalysts exhibited higher selectivity to
the 5-membered cyclic acetal 1a. Selectivity preference towards
5-membered acetal was observed previously.6 It is proposed
that dehydration of the acetone/glycerol hemiketal yields a
tertiary carbenium ion, followed by a rapid nucleophilic attack
of the secondary hydroxyl group to form the five-membered
ring ketal (Scheme 2).6 The acid strength had an obvious effect
on the selectivity. The selectivity to 5-membered cyclic acetal
was higher when the catalyst acidity was stronger. The sample
pre-treated at 573 K, which possesses stronger acid sites,
converted around 80% of glycerol with a selectivity towards
1a of B92% after 6 h at 343 K, indicating the usefulness of
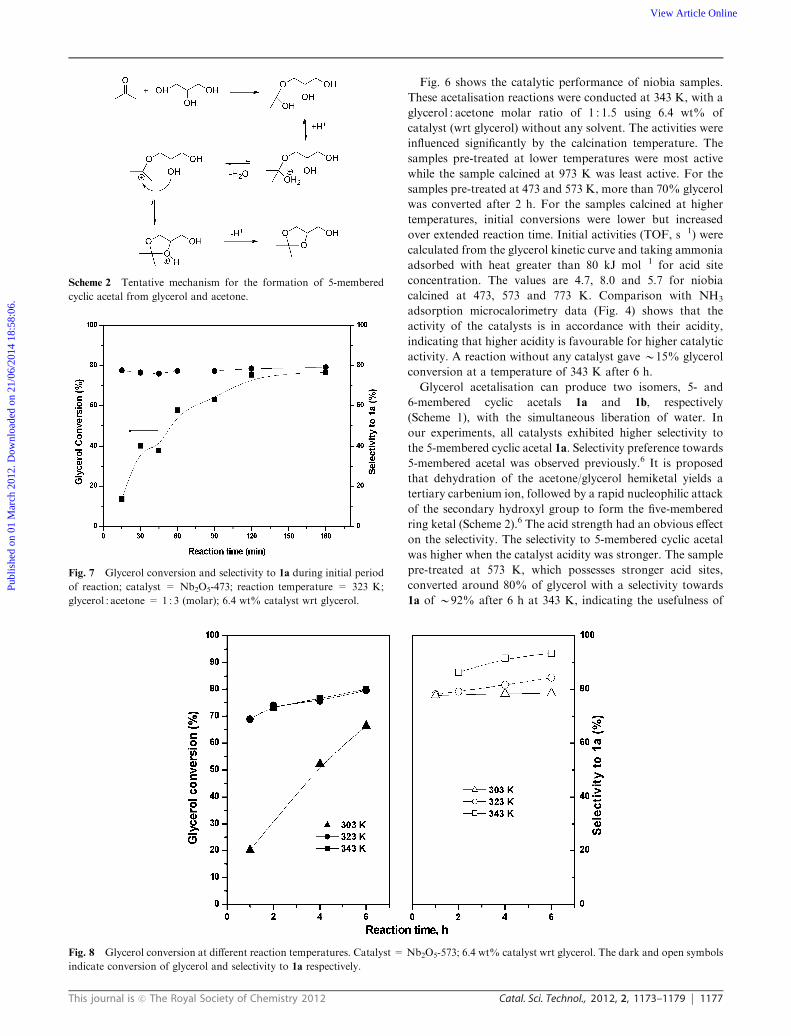
Scheme 2 Tentative mechanism for the formation of 5-membered
cyclic acetal from glycerol and acetone.
Fig. 7 Glycerol conversion and selectivity to 1a during initial period
of reaction; catalyst = Nb2O5-473; reaction temperature = 323 K;
glycerol : acetone = 1 : 3 (molar); 6.4 wt% catalyst wrt glycerol.
Fig. 8 Glycerol conversion at different reaction temperatures. Catalyst = Nb2O5-573; 6.4 wt% catalyst wrt glycerol. The dark and open symbols
indicate conversion of glycerol and selectivity to 1a respectively.
Publ
ishe
d on
01
Mar
ch 2
012.
Dow
nloa
ded
on 2
1/06
/201
4 18
:58:
06.
View Article Online
1178 Catal. Sci. Technol., 2012, 2, 1173–1179 This journal is c The Royal Society of Chemistry 2012
this material for glycerol acetalisation (Fig. 6). Though water
is produced during the reaction, high conversions were
achieved indicating the tolerance of niobia acid sites towards
water. Based on the present results, it is not so straightforward
to correlate the nature of acid sites (Brønsted/Lewis) with the
activity and selectivity.
The reaction occurs significantly during the first few hours
itself as illustrated by the data obtained for Nb2O5-473 at
323 K (Fig. 7). Glycerol conversion wasB15% after 15 minutes
of reaction, increased rapidly for around 2 h, and then more or
less remained constant with reaction time. The selectivity to
5-membered acetal was high from the beginning of the reaction
and remained so with reaction time.
The catalytic performance was influenced by the reaction
temperature (Fig. 8). 20% glycerol was converted after 1 h at
303 K using sample calcined at 573 K, which increased to
B70% after 20 h of reaction. Upon increasing the reaction
temperature to 323 K, the rate increased and B68% glycerol
conversion was observed at 1 h. However, further increase in
reaction temperature to 343 K did not seem to increase the rate
a great deal. If the higher reaction times are affordable, the
reaction may be conducted at temperatures even close to room
temperature. Higher temperatures favour 5-membered acetal
(1a) (Fig. 8). Nevertheless, 1a was the major product even
at 303 K.
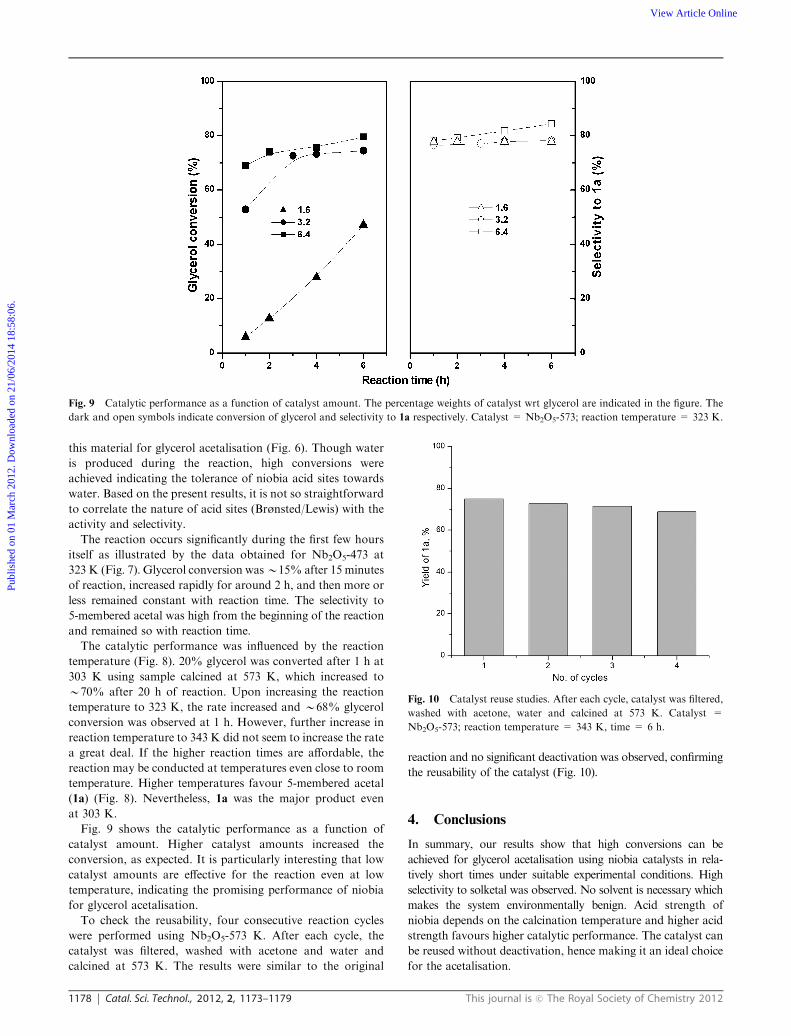
Fig. 9 shows the catalytic performance as a function of
catalyst amount. Higher catalyst amounts increased the
conversion, as expected. It is particularly interesting that low
catalyst amounts are effective for the reaction even at low
temperature, indicating the promising performance of niobia
for glycerol acetalisation.
To check the reusability, four consecutive reaction cycles
were performed using Nb2O5-573 K. After each cycle, the
catalyst was filtered, washed with acetone and water and
calcined at 573 K. The results were similar to the original
reaction and no significant deactivation was observed, confirming
the reusability of the catalyst (Fig. 10).
4. Conclusions
In summary, our results show that high conversions can be
achieved for glycerol acetalisation using niobia catalysts in rela-
tively short times under suitable experimental conditions. High
selectivity to solketal was observed. No solvent is necessary which
makes the system environmentally benign. Acid strength of
niobia depends on the calcination temperature and higher acid
strength favours higher catalytic performance. The catalyst can
be reused without deactivation, hence making it an ideal choice
for the acetalisation.
Fig. 9 Catalytic performance as a function of catalyst amount. The percentage weights of catalyst wrt glycerol are indicated in the figure. The
dark and open symbols indicate conversion of glycerol and selectivity to 1a respectively. Catalyst = Nb2O5-573; reaction temperature = 323 K.
Fig. 10 Catalyst reuse studies. After each cycle, catalyst was filtered,
washed with acetone, water and calcined at 573 K. Catalyst =
Nb2O5-573; reaction temperature = 343 K, time = 6 h.
Publ
ishe
d on
01
Mar
ch 2
012.
Dow
nloa
ded
on 2
1/06
/201
4 18
:58:
06.
View Article Online
This journal is c The Royal Society of Chemistry 2012 Catal. Sci. Technol., 2012, 2, 1173–1179 1179
Acknowledgements
We acknowledge CBMM, Brazil for providing niobium oxide.
References
1 C.-H. Zhou, J. N. Beltramini, Y.-X. Fana and G. Q. Lu, Chem. Soc.Rev., 2008, 37, 527; A. Behr, J. Eilting, K. Irawadi, J. Leschinski andF. Lindner, Green Chem., 2008, 10, 13.
2 Official Journal of the European Union, L140/6, 05-06-2009.3 Top value added chemicals from biomass, ed. T. Werpy andG. Petersen, US Department of Energy (USDOE), vol. 1, 2004.
4 M. Pagliaro, R. Ciriminna, H. Kimura, M. Rossi and C. D. Pina,Angew. Chem., Int. Ed., 2007, 46, 4434.
5 N. R. Shiju, D. R. Brown, K. Wilson and G. Rothenberg,Top. Catal., 2010, 53, 1217.
6 C. X. A. da Silva, V. L. C. Goncalves and C. J. A. Mota,Green Chem., 2009, 11, 38.
7 J. Deutsch, A. Martin and H. Lieske, J. Catal., 2007, 245, 428.8 (a) B. Delfort, I. Durand, A. Jaecker, T. Lacome, X. Montagneand F. Paille, Fr Patent, 2 833 607 A1, 2003; (b) G. Hillion,B. Delfort and I. Durand, Int Patent, 2005/093 015 A1, 2005.
9 A. Piasecki, A. Sokolowski, B. Burczyk and U. Kotlewska, J. Am.Oil Chem. Soc., 1997, 74, 33.
10 (a) M. J. Climent, A. Veltry and A. Corma, Green Chem., 2002, 4, 565;(b) M. J. Climent, A. Corma and A. Veltry, Appl. Catal., A, 2004,263, 155.
11 P. Ferreira, I. M. Fonseca, A. M. Ramos, J. Vital andJ. E. Castanheiro, Appl. Catal., B, 2010, 98, 94.
12 G. Vicente, J. A. Melero, G. Morales, M. Paniagua and E. Martın,Green Chem., 2010, 12, 899.
13 B. Delfort, I. Durand, A. Jaecker, T. Lacome, X. Montagne andF. Paille, US Patent, 6890364, 2005.
14 E. Garcıa, M. Laca, E. Perez, A. Garrido and J. Peinado, EnergyFuels, 2008, 22, 4274–4280.
15 I. Nowak and M. Ziolek, Chem. Rev., 1999, 99, 3603.16 K. Tanabe, Catal. Today, 2003, 78, 65.17 M. Ziolek, Catal. Today, 2003, 78, 47.18 N. R. Shiju, M. AnilKumar, W. F. Hoelderich and D. R. Brown,
J. Phys. Chem. C, 2009, 113, 7735.19 N. R. Shiju, H. M. Williams and D. R. Brown, Appl. Catal., B,
2009, 90, 451.20 M. Born and K. Huang, Dynamical Theory of Crystal Lattices,
Oxford University Press, 1954.21 P. Ewald, Ann. Phys. (Leipzig), 1921, 369, 253.22 D. E. Parry, Surf. Sci., 1975, 49, 433.23 B. G. Dick and A. W. Overhauser, Phys. Rev., 1958, 112, 90.24 M. Kilo, R. A. Jackson and G. Borchardt, Philos. Mag., 2003,
83, 3309.25 G. W. Watson, E. T. Kelsey, N. H. de Leeuw, D. J. Harris and
S. C. Parker, J. Chem. Soc., Faraday Trans., 1996, 92, 433.26 K. Kato and S. Tamura, Acta Crystallogr., Sect. B: Struct.
Crystallogr. Cryst. Chem., 1975, 31, 673.27 S. Fleming and A. Rohl, Z. Kristallogr., 2004, 220, 580.28 E. Prouzet and T. J. Pinnavaia, Angew. Chem., Int. Ed. Engl., 1997,
36, 516.29 Z. Zhang and T. Pinnavaia, J. Am. Chem. Soc., 2002, 124,
12294.30 K. Sivaranjani and C. S. Gopinath, J. Mater. Chem., 2011, 21,
2639.31 D. G. Kulkarni, A. V. Murugan, A. K. Viswanath and
C. S. Gopinath, J. Nanosci. Nanotechnol., 2009, 9, 371.32 P. F. Siril, N. R. Shiju, D. R. Brown and K. Wilson, Appl. Catal., A,
2009, 364, 95.33 A. Auroux, Top. Catal., 1997, 4, 71.34 K. Tanabe, in Catalysis Science and Technology, ed. J. R. Anderson
and M. Boudart, Springer, 1981, ch. 5.
Publ
ishe
d on
01
Mar
ch 2
012.
Dow
nloa
ded
on 2
1/06
/201
4 18
:58:
06.
View Article Online


