Embed Size (px)
Citation preview
Available online at www.sciencedirect.com
www.elsevier.com/locate/asr
Advances in Space Research 52 (2013) 1237–1246
GNSS station characterisation for ionosphericscintillation applications
Vincenzo Romano a,b,⇑, Luca Spogli b, Marcio Aquino a, Alan Dodson a, Craig Hancock a,Biagio Forte c
a Nottingham Geospatial Institute, University of Nottingham, United Kingdomb Istituto Nazionale di Geofisica e Vulcanologia, Italy
c University of Bath, United Kingdom
Received 22 March 2013; received in revised form 24 June 2013; accepted 28 June 2013Available online 6 July 2013
Abstract
Ionospheric scintillations are fluctuations in the phase and amplitude of the signals from GNSS (Global Navigation Satellite Systems)occurring when they cross regions of electron density irregularities in the ionosphere. Such disturbances can cause serious degradation ofseveral aspects of GNSS system performance, including integrity, accuracy and availability. The two indices adopted worldwide to char-acterise ionospheric scintillations are: the amplitude scintillation index, S4, which is the standard deviation of the received power nor-malised by its mean value, and the phase scintillation index, rU, which is the standard deviation of the de-trended carrier phase.Collaborative work between NGI and INGV supports a permanent network of GISTM (GPS Ionospheric Scintillation and TEC Mon-itor) receivers that covers a wide range of latitudes in the northern European sector. Data from this network has contributed significantlyto several papers during the past few years (see e.g. De Franceschi et al., 2008; Aquino et al., 2009; Spogli et al., 2009, 2010; Alfonsi et al.,2011). In these investigations multipath effects and noise that contaminate the scintillation measurements are largely filtered by applyingan elevation angle threshold. A deeper analysis of the data quality and the development of a more complex filtering technique canimprove the results obtained so far. The structures in the environment of each receiver in the network which contaminate scintillationmeasurements should be identified in order to improve the quality of the scintillation and TEC data by removing error sources due to thelocal environment. The analysis in this paper considers a data set characterised by quiet ionospheric conditions of the mid-latitude sta-tion located in Nottingham (UK), followed by a case study of the severe geomagnetic storm, which occurred in late 2003, known gen-erally as the “Halloween Storm”.� 2013 Published by Elsevier Ltd. on behalf of COSPAR.
Keywords: GNSS; GPS; Ionosphere; Ionospheric scintillation; Multipath
1. Introduction
The signal distortion caused by scintillation can affectGNSS receiver performance from degradation of accuracy(through range errors) to the complete loss of signal track-ing. It can degrade the performance of navigation systemsand generate errors in received messages. Since ionospheric
0273-1177/$36.00 � 2013 Published by Elsevier Ltd. on behalf of COSPAR.
http://dx.doi.org/10.1016/j.asr.2013.06.028
⇑ Corresponding author at: Istituto Nazionale di Geofisica e Vulcano-logia, 00143 Rome, Italy. Fax: +39 06 5186 2397.
E-mail address: [email protected] (V. Romano).
scintillation originates from random electron density irreg-ularities acting as wave scatterers, research on the forma-tion and evolution of irregularities is closely related toscintillation studies. Over the past four decades there hasbeen lively interest in this field. Many excellent reviews ofscintillation theory and observations have been published(e.g. Aarons, 1982, 1993; Yeh and Liu, 1982; Basu andBasu, 1985, 1993; Bhattacharyya et al., 1992). Comprehen-sive reviews of the physics of ionospheric irregularities canbe found in a book by Kelley (1989) and in articles (e.g.Keskinen and Ossakow, 1983; Kintner and Seyler, 1985;
1238 V. Romano et al. / Advances in Space Research 52 (2013) 1237–1246
Tsunoda, 1988; Huba, 1989; Heppner et al., 1993; Fejer,1996). The investigation of small scale fast irregularitiescausing radio scintillation can be carried out with specialGPS receivers sampling the satellite signal at a high ratesuch as 50 Hz (see, e.g. De Franceschi et al., 2006; VanDierendonck, 2001). Scintillations can not only degradesignal quality but also cause receiver loss of lock on GNSS,therefore posing a major threat to GNSS-based applica-tions which demand high levels of accuracy, availabilityand integrity, including EGNOS-based applications. Thetwo geographic areas most affected by scintillations arethe equatorial regions (±15� magnetic latitude) and theauroral zones (see, e.g. Basu et al., 1988).
The Nottingham Geospatial Institute (NGI), formerlythe Institute of Engineering Surveying and Space Geodesy(IESSG), of the University of Nottingham pioneered GPSionospheric scintillation monitoring in Northern Europewith GISTM (GPS ionospheric scintillation and TEC mon-itor, Van Dierendonck et al., 1993; Van Dierendonck,2001) receivers. Between June 2001 and December 2003four units were installed at stations in the UK and Norway,covering geographic latitudes from 53�N to 70�N, approx-imately. These units were decommissioned in 2004 andthen, with the support of the Engineering and Physical Sci-ences Research Council (EPSRC) and in the frame of thePolaris project, they have been re-deployed, together withadditional new receivers, at Bronnoysund (Norway),Trondheim (Norway), Lerwick (UK), Newcastle (UK),Nottingham (UK), Rome (Italy) and Nicosia (Cyprus, incollaboration with the Frederick Institute of Technology),where high rate (50 Hz) data as well as scintillation param-eters are being recorded. An additional station wasdeployed by the NGI in Dourbes, Belgium (in collabora-tion with the Royal Meteorological Institute of Belgium)between 2006 and 2011. The Istituto Nazionale di Geofisicae Vulcanologia (INGV) is in charge of the ISACCO (Ion-ospheric Scintillation Arctic Campaign CoordinatedObservations) project in the Arctic, which started in2003, and currently runs three GISTM receivers in Sval-bard (De Franceschi et al., 2006) and another two at Euro-
Table 1Table of the main features of the NGI–INGV GISTM network in the Europe
ID Station Owner
NYA1 Ny-Alesund (Svalbard, Norway) INGVNYA0 Ny-Alesund (Svalbard, Norway) INGVLYB0 Longyearbyen(Svalbard, Norway) INGVBRON Bronnoysund (Norway) NGINSF02 Trondheim (Norway) NGILERW Lerwick (Scotland, UK) NGINYM17 Newcastle (England, UK) NGINSF06 Nottingham (England, UK) NGINSF01 Rome (Italy) NGINSF05 Dourbes (Belgium) NGILAM0 Lampedusa (Italy) INGVCHA1 Chania (Crete, Greece) INGVCYPR Nicosia (Cyprus) NGI
pean mid latitudes: Chania (Greece) and Lampedusa(Italy). A list of the stations is shown in Table 1. The mea-surements of TEC (Total Electron Content) and scintilla-tion parameters acquired in this context have beencarefully analysed to investigate the ionospheric conditionsfavouring scintillation occurrence. A case study of anintense and deeply studied storm, such as the one whichoccurred in late October 2003, during the descending phaseof the past solar cycle, highlight the importance of runningexperimental observations to follow the spatial/temporalevolution of the ionospheric plasma giving rise to scintilla-tions. The use of the same kind of GPS receivers allowsINGV and NGI to exploit baselines of different lengthsto estimate positioning errors due to scintillation occur-rence and to investigate their mitigation by developing cor-rection algorithms (Conker et al., 2003). The NGI–INGVscintillation monitoring chain offers a unique opportunityto analyse long term data of the entire network to obtainan ionospheric climatology for Northern Europe. TheNGI–INGV GISTM network covers a wide range of lati-tudes in the northern European sector by means of a chainof permanent stations (Romano et al., 2008). The struc-tures in the environment of each receiver location whichcontaminate scintillation measurements should be identi-fied in order to improve the quality of the scintillationand TEC data by removing the sources of the errors into the local environment or mitigating their effects throughdata filtering. The aim of this work is the identification ofthe ray-paths affected by error sources, that could mimicscintillation, and by signal degradations. To do this, weidentify the structures in the environment (trees, buildings,etc.) that are source of multipath and degradation andthen, if it becomes feasible, to physically remove such struc-tures. The identification of the directions where the signal issystematically affected by such sources is a first steptowards new data filtering procedures, that are not subjectof this paper. In this paper we show the results of the appli-cation of a characterisation method to the NottinghamGISTM data, that is a mid latitude station, during a year,2008, with quiet solar conditions.
an Northern Hemisphere.
Latitude (�N) Longitude (�E) Status
78.93 11.86 In operation78.92 11.93 In operation78.17 15.99 In operation65.46 12.21 In operation63.41 10.40 In operation60.15 �1.13 In operation54.98 �1.61 In operation52.94 1.19 In operation41.83 12.51 In operation50.09 4.60 Stopped in 201135.52 12.62 In operation35.51 24.02 In operation35.14 N 33.48 In operation
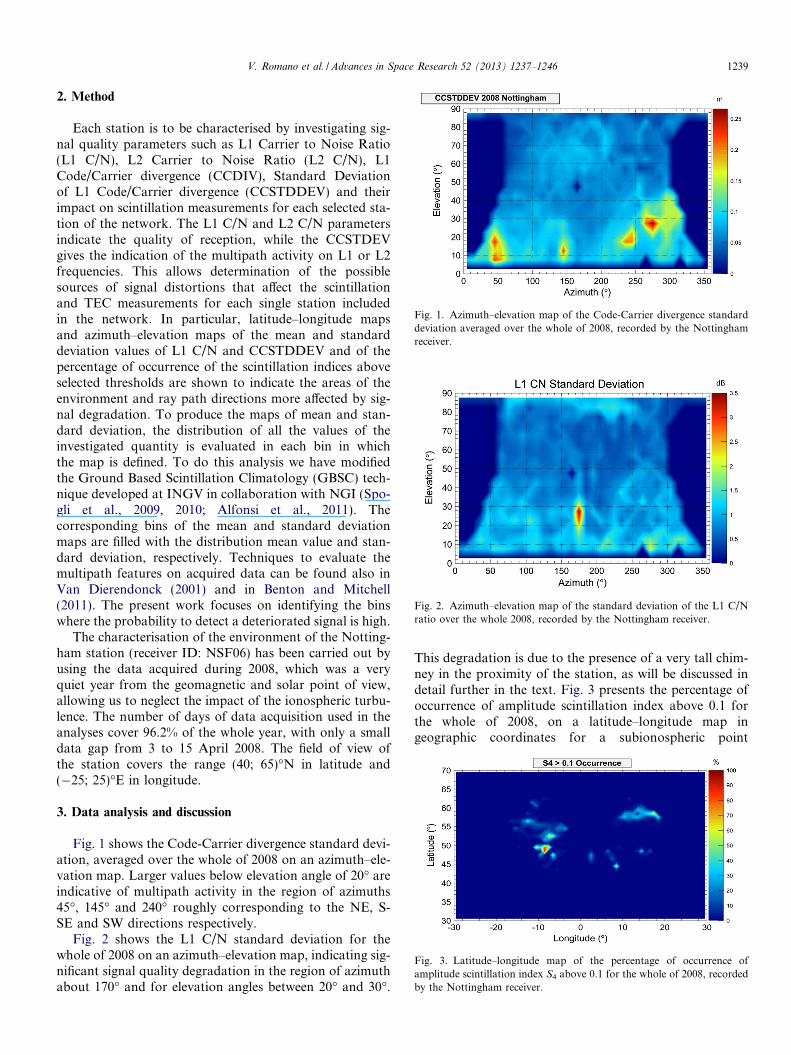
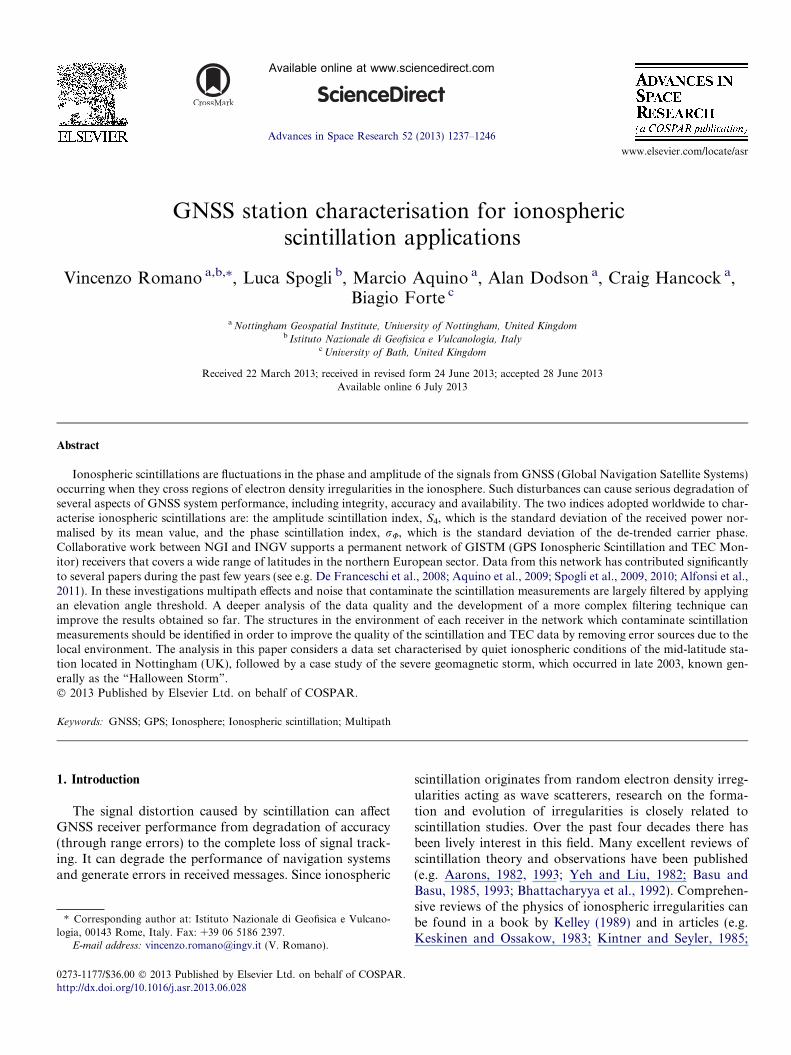
Fig. 1. Azimuth–elevation map of the Code-Carrier divergence standarddeviation averaged over the whole of 2008, recorded by the Nottinghamreceiver.
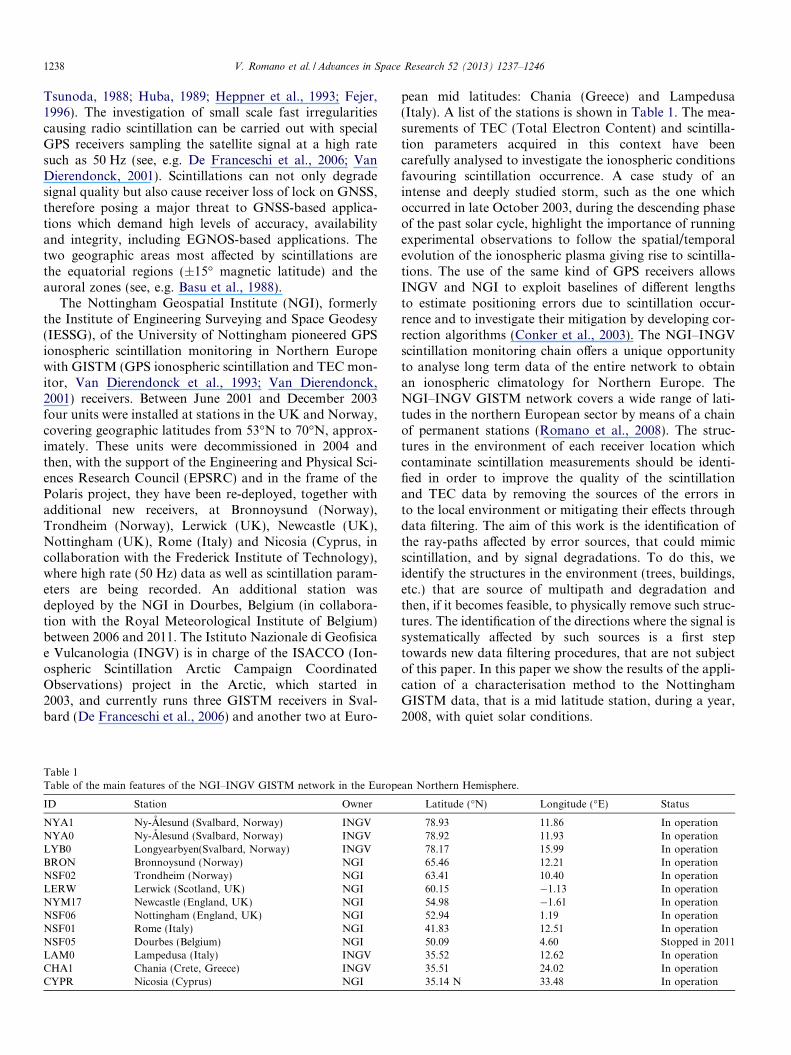
Fig. 2. Azimuth–elevation map of the standard deviation of the L1 C/Nratio over the whole 2008, recorded by the Nottingham receiver.
Fig. 3. Latitude–longitude map of the percentage of occurrence ofamplitude scintillation index S4 above 0.1 for the whole of 2008, recordedby the Nottingham receiver.
V. Romano et al. / Advances in Space Research 52 (2013) 1237–1246 1239
2. Method
Each station is to be characterised by investigating sig-nal quality parameters such as L1 Carrier to Noise Ratio(L1 C/N), L2 Carrier to Noise Ratio (L2 C/N), L1Code/Carrier divergence (CCDIV), Standard Deviationof L1 Code/Carrier divergence (CCSTDDEV) and theirimpact on scintillation measurements for each selected sta-tion of the network. The L1 C/N and L2 C/N parametersindicate the quality of reception, while the CCSTDEVgives the indication of the multipath activity on L1 or L2frequencies. This allows determination of the possiblesources of signal distortions that affect the scintillationand TEC measurements for each single station includedin the network. In particular, latitude–longitude mapsand azimuth–elevation maps of the mean and standarddeviation values of L1 C/N and CCSTDDEV and of thepercentage of occurrence of the scintillation indices aboveselected thresholds are shown to indicate the areas of theenvironment and ray path directions more affected by sig-nal degradation. To produce the maps of mean and stan-dard deviation, the distribution of all the values of theinvestigated quantity is evaluated in each bin in whichthe map is defined. To do this analysis we have modifiedthe Ground Based Scintillation Climatology (GBSC) tech-nique developed at INGV in collaboration with NGI (Spo-gli et al., 2009, 2010; Alfonsi et al., 2011). Thecorresponding bins of the mean and standard deviationmaps are filled with the distribution mean value and stan-dard deviation, respectively. Techniques to evaluate themultipath features on acquired data can be found also inVan Dierendonck (2001) and in Benton and Mitchell(2011). The present work focuses on identifying the binswhere the probability to detect a deteriorated signal is high.
The characterisation of the environment of the Notting-ham station (receiver ID: NSF06) has been carried out byusing the data acquired during 2008, which was a veryquiet year from the geomagnetic and solar point of view,allowing us to neglect the impact of the ionospheric turbu-lence. The number of days of data acquisition used in theanalyses cover 96.2% of the whole year, with only a smalldata gap from 3 to 15 April 2008. The field of view ofthe station covers the range (40; 65)�N in latitude and(�25; 25)�E in longitude.
3. Data analysis and discussion
Fig. 1 shows the Code-Carrier divergence standard devi-ation, averaged over the whole of 2008 on an azimuth–ele-vation map. Larger values below elevation angle of 20� areindicative of multipath activity in the region of azimuths45�, 145� and 240� roughly corresponding to the NE, S-SE and SW directions respectively.
Fig. 2 shows the L1 C/N standard deviation for thewhole of 2008 on an azimuth–elevation map, indicating sig-nificant signal quality degradation in the region of azimuthabout 170� and for elevation angles between 20� and 30�.
This degradation is due to the presence of a very tall chim-ney in the proximity of the station, as will be discussed indetail further in the text. Fig. 3 presents the percentage ofoccurrence of amplitude scintillation index above 0.1 forthe whole of 2008, on a latitude–longitude map ingeographic coordinates for a subionospheric point
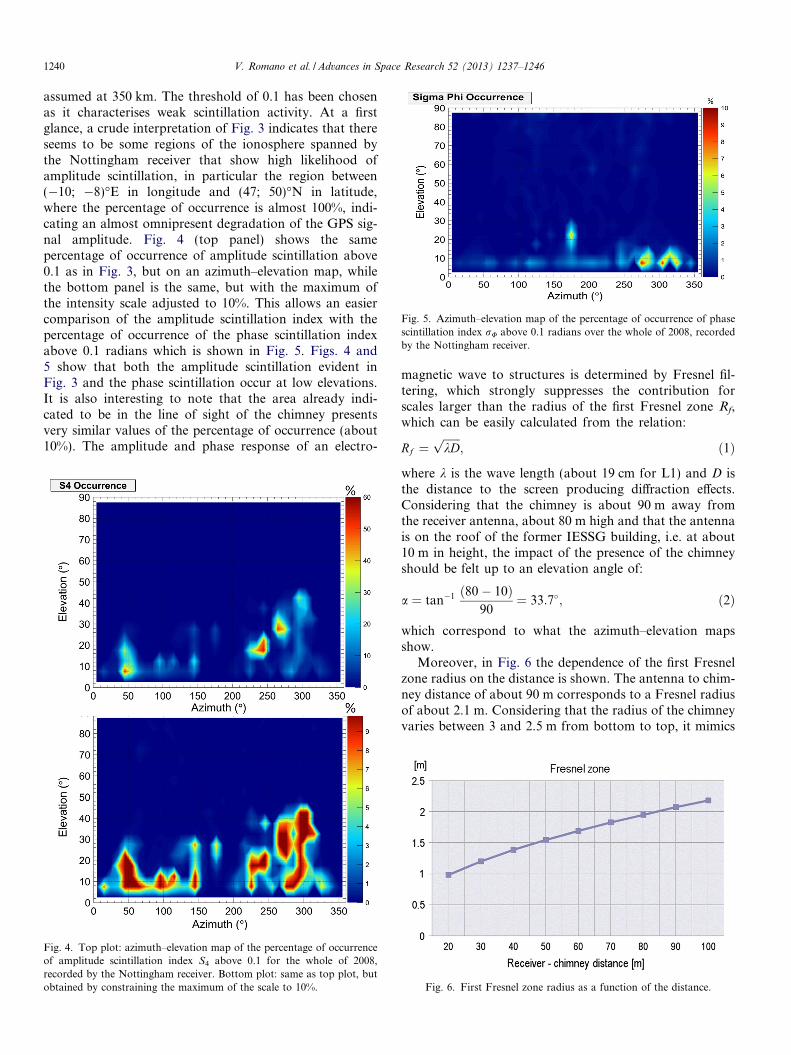
Fig. 5. Azimuth–elevation map of the percentage of occurrence of phasescintillation index rU above 0.1 radians over the whole of 2008, recordedby the Nottingham receiver.
1240 V. Romano et al. / Advances in Space Research 52 (2013) 1237–1246
assumed at 350 km. The threshold of 0.1 has been chosenas it characterises weak scintillation activity. At a firstglance, a crude interpretation of Fig. 3 indicates that thereseems to be some regions of the ionosphere spanned bythe Nottingham receiver that show high likelihood ofamplitude scintillation, in particular the region between(�10; �8)�E in longitude and (47; 50)�N in latitude,where the percentage of occurrence is almost 100%, indi-cating an almost omnipresent degradation of the GPS sig-nal amplitude. Fig. 4 (top panel) shows the samepercentage of occurrence of amplitude scintillation above0.1 as in Fig. 3, but on an azimuth–elevation map, whilethe bottom panel is the same, but with the maximum ofthe intensity scale adjusted to 10%. This allows an easiercomparison of the amplitude scintillation index with thepercentage of occurrence of the phase scintillation indexabove 0.1 radians which is shown in Fig. 5. Figs. 4 and5 show that both the amplitude scintillation evident inFig. 3 and the phase scintillation occur at low elevations.It is also interesting to note that the area already indi-cated to be in the line of sight of the chimney presentsvery similar values of the percentage of occurrence (about10%). The amplitude and phase response of an electro-
Fig. 4. Top plot: azimuth–elevation map of the percentage of occurrenceof amplitude scintillation index S4 above 0.1 for the whole of 2008,recorded by the Nottingham receiver. Bottom plot: same as top plot, butobtained by constraining the maximum of the scale to 10%.
magnetic wave to structures is determined by Fresnel fil-tering, which strongly suppresses the contribution forscales larger than the radius of the first Fresnel zone Rf,which can be easily calculated from the relation:
Rf ¼ffiffiffiffiffiffi
kDp
; ð1Þ
where k is the wave length (about 19 cm for L1) and D isthe distance to the screen producing diffraction effects.Considering that the chimney is about 90 m away fromthe receiver antenna, about 80 m high and that the antennais on the roof of the former IESSG building, i.e. at about10 m in height, the impact of the presence of the chimneyshould be felt up to an elevation angle of:
a ¼ tan�1 ð80� 10Þ90
¼ 33:7�; ð2Þ
which correspond to what the azimuth–elevation mapsshow.
Moreover, in Fig. 6 the dependence of the first Fresnelzone radius on the distance is shown. The antenna to chim-ney distance of about 90 m corresponds to a Fresnel radiusof about 2.1 m. Considering that the radius of the chimneyvaries between 3 and 2.5 m from bottom to top, it mimics
Fig. 6. First Fresnel zone radius as a function of the distance.
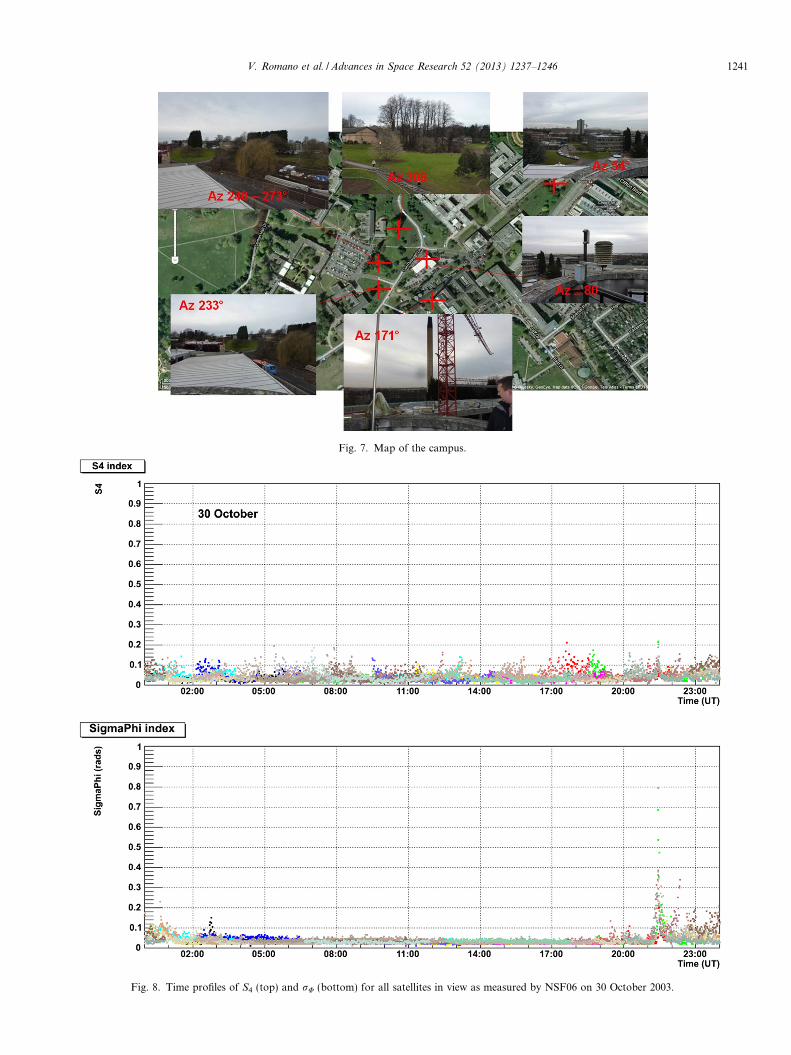
Fig. 7. Map of the campus.
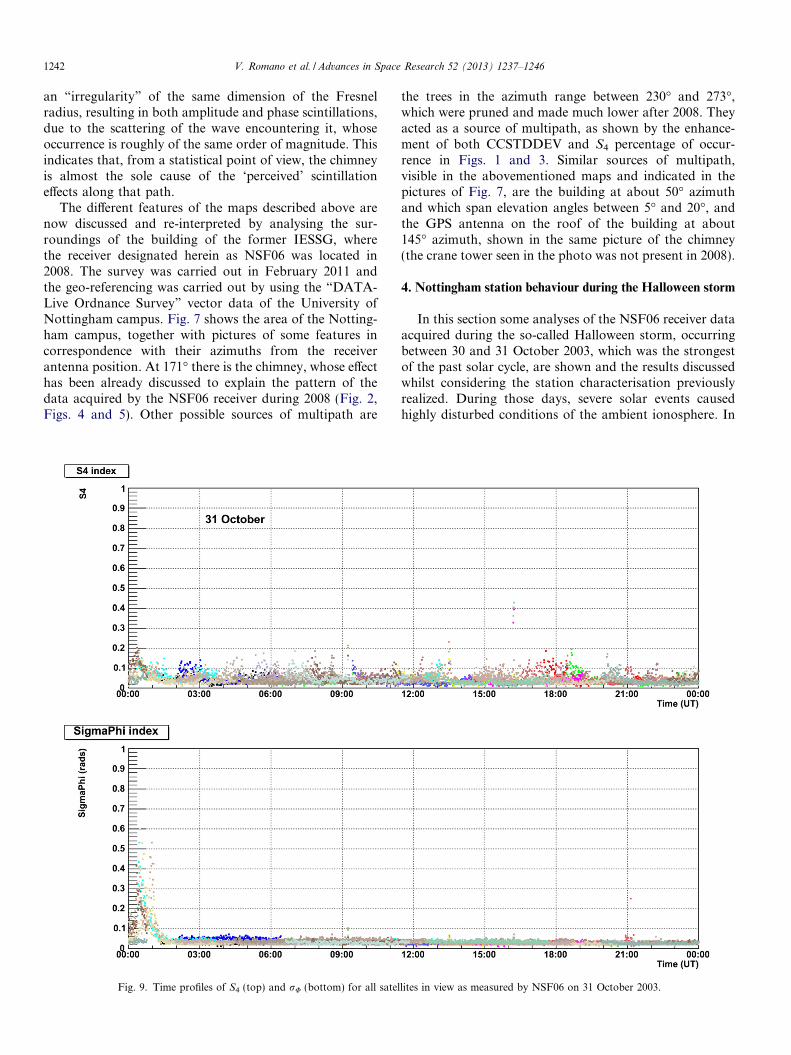
Fig. 8. Time profiles of S4 (top) and rU (bottom) for all satellites in view as measured by NSF06 on 30 October 2003.
V. Romano et al. / Advances in Space Research 52 (2013) 1237–1246 1241
1242 V. Romano et al. / Advances in Space Research 52 (2013) 1237–1246
an “irregularity” of the same dimension of the Fresnelradius, resulting in both amplitude and phase scintillations,due to the scattering of the wave encountering it, whoseoccurrence is roughly of the same order of magnitude. Thisindicates that, from a statistical point of view, the chimneyis almost the sole cause of the ‘perceived’ scintillationeffects along that path.
The different features of the maps described above arenow discussed and re-interpreted by analysing the sur-roundings of the building of the former IESSG, wherethe receiver designated herein as NSF06 was located in2008. The survey was carried out in February 2011 andthe geo-referencing was carried out by using the “DATA-Live Ordnance Survey” vector data of the University ofNottingham campus. Fig. 7 shows the area of the Notting-ham campus, together with pictures of some features incorrespondence with their azimuths from the receiverantenna position. At 171� there is the chimney, whose effecthas been already discussed to explain the pattern of thedata acquired by the NSF06 receiver during 2008 (Fig. 2,Figs. 4 and 5). Other possible sources of multipath are
Fig. 9. Time profiles of S4 (top) and rU (bottom) for all satel
the trees in the azimuth range between 230� and 273�,which were pruned and made much lower after 2008. Theyacted as a source of multipath, as shown by the enhance-ment of both CCSTDDEV and S4 percentage of occur-rence in Figs. 1 and 3. Similar sources of multipath,visible in the abovementioned maps and indicated in thepictures of Fig. 7, are the building at about 50� azimuthand which span elevation angles between 5� and 20�, andthe GPS antenna on the roof of the building at about145� azimuth, shown in the same picture of the chimney(the crane tower seen in the photo was not present in 2008).
4. Nottingham station behaviour during the Halloween storm
In this section some analyses of the NSF06 receiver dataacquired during the so-called Halloween storm, occurringbetween 30 and 31 October 2003, which was the strongestof the past solar cycle, are shown and the results discussedwhilst considering the station characterisation previouslyrealized. During those days, severe solar events causedhighly disturbed conditions of the ambient ionosphere. In
lites in view as measured by NSF06 on 31 October 2003.
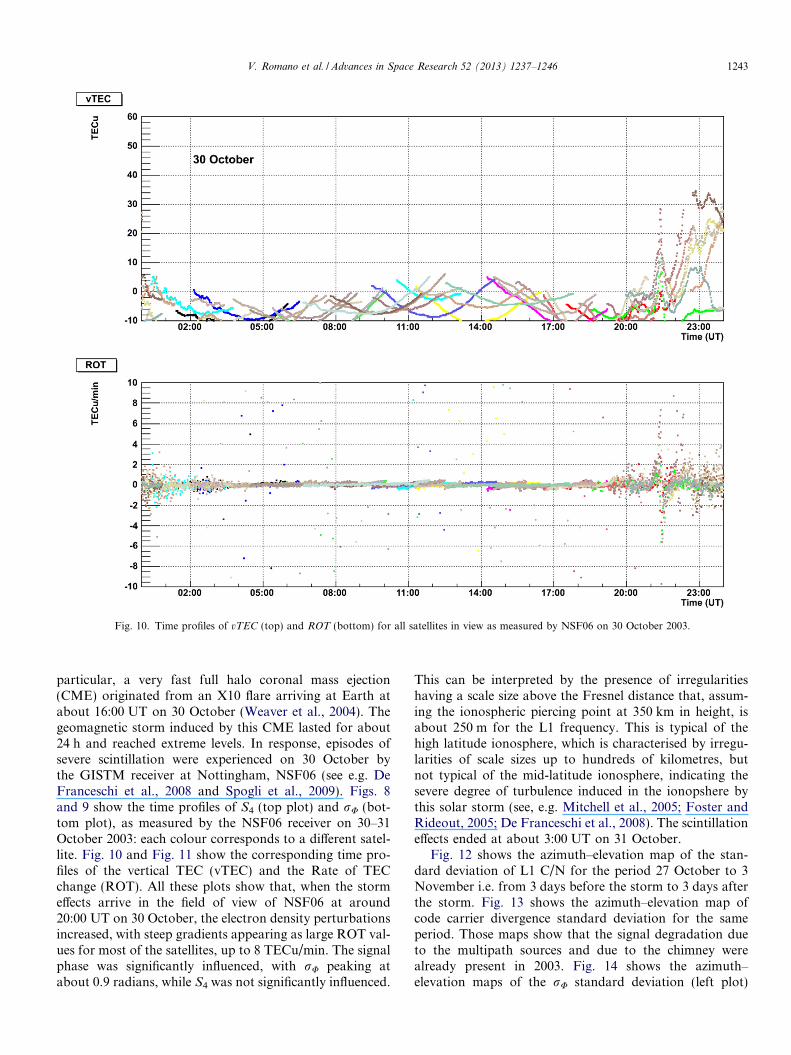
Fig. 10. Time profiles of vTEC (top) and ROT (bottom) for all satellites in view as measured by NSF06 on 30 October 2003.
V. Romano et al. / Advances in Space Research 52 (2013) 1237–1246 1243
particular, a very fast full halo coronal mass ejection(CME) originated from an X10 flare arriving at Earth atabout 16:00 UT on 30 October (Weaver et al., 2004). Thegeomagnetic storm induced by this CME lasted for about24 h and reached extreme levels. In response, episodes ofsevere scintillation were experienced on 30 October bythe GISTM receiver at Nottingham, NSF06 (see e.g. DeFranceschi et al., 2008 and Spogli et al., 2009). Figs. 8and 9 show the time profiles of S4 (top plot) and rU (bot-tom plot), as measured by the NSF06 receiver on 30–31October 2003: each colour corresponds to a different satel-lite. Fig. 10 and Fig. 11 show the corresponding time pro-files of the vertical TEC (vTEC) and the Rate of TECchange (ROT). All these plots show that, when the stormeffects arrive in the field of view of NSF06 at around20:00 UT on 30 October, the electron density perturbationsincreased, with steep gradients appearing as large ROT val-ues for most of the satellites, up to 8 TECu/min. The signalphase was significantly influenced, with rU peaking atabout 0.9 radians, while S4 was not significantly influenced.
This can be interpreted by the presence of irregularitieshaving a scale size above the Fresnel distance that, assum-ing the ionospheric piercing point at 350 km in height, isabout 250 m for the L1 frequency. This is typical of thehigh latitude ionosphere, which is characterised by irregu-larities of scale sizes up to hundreds of kilometres, butnot typical of the mid-latitude ionosphere, indicating thesevere degree of turbulence induced in the ionopshere bythis solar storm (see, e.g. Mitchell et al., 2005; Foster andRideout, 2005; De Franceschi et al., 2008). The scintillationeffects ended at about 3:00 UT on 31 October.
Fig. 12 shows the azimuth–elevation map of the stan-dard deviation of L1 C/N for the period 27 October to 3November i.e. from 3 days before the storm to 3 days afterthe storm. Fig. 13 shows the azimuth–elevation map ofcode carrier divergence standard deviation for the sameperiod. Those maps show that the signal degradation dueto the multipath sources and due to the chimney werealready present in 2003. Fig. 14 shows the azimuth–elevation maps of the rU standard deviation (left plot)
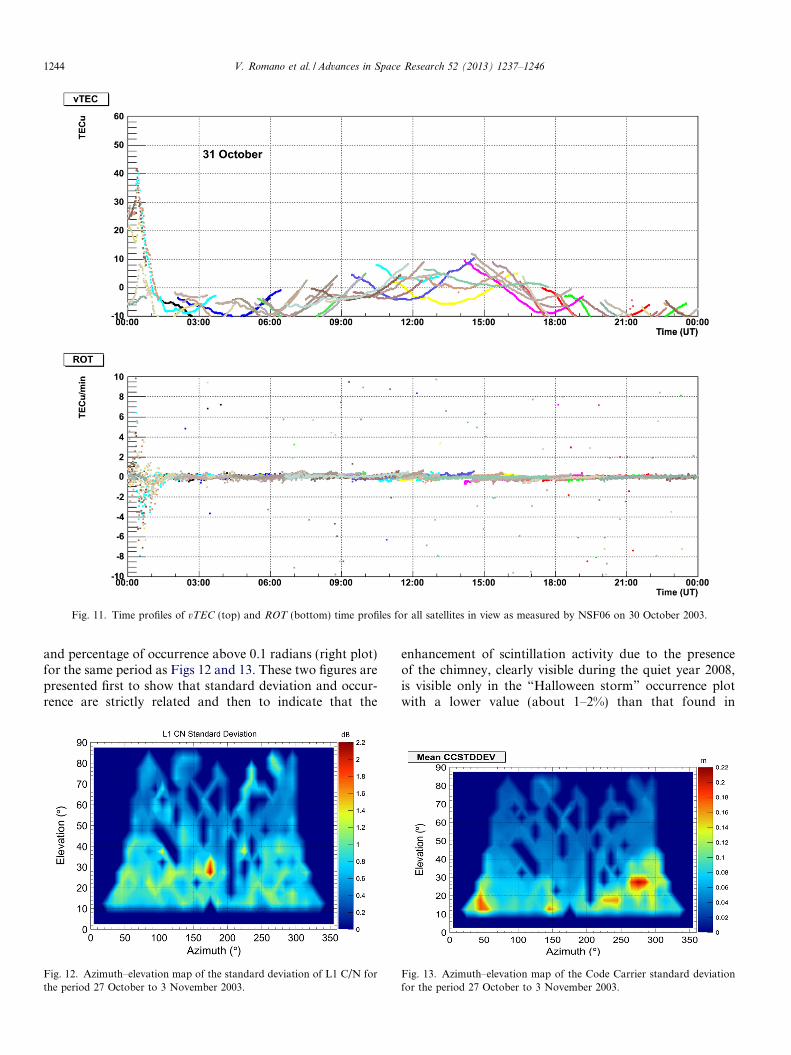
Fig. 11. Time profiles of vTEC (top) and ROT (bottom) time profiles for all satellites in view as measured by NSF06 on 30 October 2003.
1244 V. Romano et al. / Advances in Space Research 52 (2013) 1237–1246
and percentage of occurrence above 0.1 radians (right plot)for the same period as Figs 12 and 13. These two figures arepresented first to show that standard deviation and occur-rence are strictly related and then to indicate that the
Fig. 12. Azimuth–elevation map of the standard deviation of L1 C/N forthe period 27 October to 3 November 2003.
enhancement of scintillation activity due to the presenceof the chimney, clearly visible during the quiet year 2008,is visible only in the “Halloween storm” occurrence plotwith a lower value (about 1–2%) than that found in
Fig. 13. Azimuth–elevation map of the Code Carrier standard deviationfor the period 27 October to 3 November 2003.
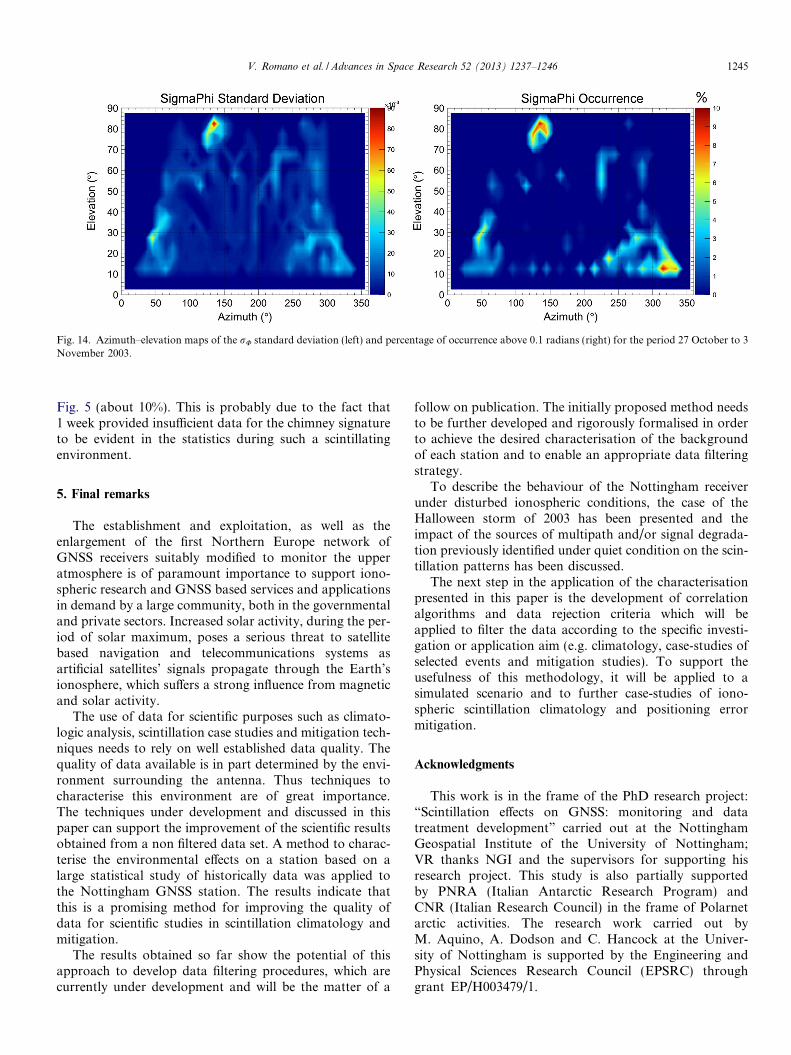
Fig. 14. Azimuth–elevation maps of the rU standard deviation (left) and percentage of occurrence above 0.1 radians (right) for the period 27 October to 3November 2003.
V. Romano et al. / Advances in Space Research 52 (2013) 1237–1246 1245
Fig. 5 (about 10%). This is probably due to the fact that1 week provided insufficient data for the chimney signatureto be evident in the statistics during such a scintillatingenvironment.
5. Final remarks
The establishment and exploitation, as well as theenlargement of the first Northern Europe network ofGNSS receivers suitably modified to monitor the upperatmosphere is of paramount importance to support iono-spheric research and GNSS based services and applicationsin demand by a large community, both in the governmentaland private sectors. Increased solar activity, during the per-iod of solar maximum, poses a serious threat to satellitebased navigation and telecommunications systems asartificial satellites’ signals propagate through the Earth’sionosphere, which suffers a strong influence from magneticand solar activity.
The use of data for scientific purposes such as climato-logic analysis, scintillation case studies and mitigation tech-niques needs to rely on well established data quality. Thequality of data available is in part determined by the envi-ronment surrounding the antenna. Thus techniques tocharacterise this environment are of great importance.The techniques under development and discussed in thispaper can support the improvement of the scientific resultsobtained from a non filtered data set. A method to charac-terise the environmental effects on a station based on alarge statistical study of historically data was applied tothe Nottingham GNSS station. The results indicate thatthis is a promising method for improving the quality ofdata for scientific studies in scintillation climatology andmitigation.
The results obtained so far show the potential of thisapproach to develop data filtering procedures, which arecurrently under development and will be the matter of a
follow on publication. The initially proposed method needsto be further developed and rigorously formalised in orderto achieve the desired characterisation of the backgroundof each station and to enable an appropriate data filteringstrategy.
To describe the behaviour of the Nottingham receiverunder disturbed ionospheric conditions, the case of theHalloween storm of 2003 has been presented and theimpact of the sources of multipath and/or signal degrada-tion previously identified under quiet condition on the scin-tillation patterns has been discussed.
The next step in the application of the characterisationpresented in this paper is the development of correlationalgorithms and data rejection criteria which will beapplied to filter the data according to the specific investi-gation or application aim (e.g. climatology, case-studies ofselected events and mitigation studies). To support theusefulness of this methodology, it will be applied to asimulated scenario and to further case-studies of iono-spheric scintillation climatology and positioning errormitigation.
Acknowledgments
This work is in the frame of the PhD research project:“Scintillation effects on GNSS: monitoring and datatreatment development” carried out at the NottinghamGeospatial Institute of the University of Nottingham;VR thanks NGI and the supervisors for supporting hisresearch project. This study is also partially supportedby PNRA (Italian Antarctic Research Program) andCNR (Italian Research Council) in the frame of Polarnetarctic activities. The research work carried out byM. Aquino, A. Dodson and C. Hancock at the Univer-sity of Nottingham is supported by the Engineering andPhysical Sciences Research Council (EPSRC) throughgrant EP/H003479/1.
1246 V. Romano et al. / Advances in Space Research 52 (2013) 1237–1246
References
Alfonsi, L., Spogli, L., De Franceschi, G., Romano, V., Aquino, M.,Dodson, A., Mitchell, C.N. Bipolar climatology of GPS ionosphericscintillation at solar minimum. Radio Sci. 46, RS0D05, http://dx.doi.org/10.1029/2010RS004571, 2011.
Aarons, J. Global morphology of ionospheric scintillations. Proc. IEEE 70(4), 360–378, 1982.
Aarons, J. The longitudinal morphology of equatorial F-layer irregular-ities relevant to their occurrence. Space Sci. Rev. 63, 209–243, 1993.
Aquino, M., Monico, J.F.G., Dodson, A.H., Marques, H., De Franceschi,G., Alfonsi, L., Romano, V., Andreotti, M. Improving the GNSSpositioning stochastic model in the presence of ionospheric scintilla-tion. J. Geod., http://dx.doi.org/10.1007/s00190-009-0313-6, 2009.
Basu, Su., Basu, Ss. Equatorial scintillations: advances since ISEA-6. J.Atmos. Terr. Phys. 47, 753–768, 1985.
Basu, S., Mackenzie, E., Basu, S. Ionospheric constraints on VHF/UHFcommunication links during solar maximum and minimum periods.Radio Sci. 23 (3), 363–378, 1988.
Basu Sa., Basu, Su. Ionospheric structures and scintillation spectra, in:Tatarski, V.I., Ishimaru, A., Zavorotny, V.U. (Eds.), Wave Propaga-tion in Random Media (Scintillation), The International Society forOptical Engineering, Bellingham, WA, USA, pp. 139–153, 1993.
Benton, C.J., Mitchell, C.N. Isolating the multipath component in GNSSsignal-to-noise data and locating reflecting objects. Radio Sci. 46,RS6002, http://dx.doi.org/10.1029/2011RS004767, 2011.
Bhattacharyya, A., Yeh, K.C., Franke, S.J. Deducting turbulenceparameters form transionospheric scintillation measurements. SpaceSci. Rev. 61, 335–386, 1992.
Conker, R.S., El Arini, M.B., Hegarty, C.J., Hsiao, T. Modeling theeffects of ionospheric scintillation on GPS/SBAS availability. RadioSci. 38, 2003.
De Franceschi, G., Alfonsi, L., Romano, V. ISACCO: an Italian projectto monitor the high latitudes ionosphere by means of GPSreceivers. GPS Solutions 8, http://dx.doi.org/10.1007/s10291-006-0036-6, 2006.
De Franceschi, G., Alfonsi, L., Romano, V., Aquino, M.H.O., Dodson,A., Mitchell, C.N., Wernik, A.W. Dynamics of high latitude patchesand associated small scale irregularities. J. Atmos. Sol. Terr. Phys. 70,879–888, http://dx.doi.org/10.1016/j.jastp.2007.05.018, 2008.
Fejer, B.G. Natural ionospheric plasma waves, in: Kohl, H., Ruster, R.,Schlegel, K. (Eds.), Modern Ionospheric Science, European Geophys-ical Society, Katlenburg-Lindau, FRG, pp. 216–273, 1996.
Foster, J.C., Rideout, W. Mid latitude TEC enhancements during theOctober 2003 supestorm. Geophys. Res. Lett. 32, L12S04, http://dx.doi.org/10.1029/2004GL021719, 2005.
Heppner, J.P., Liebrecht, M.C., Maynard, N.C., Pfaff, R.F. High-latitudedistributions of plasma waves and spatial irregularities from DE 2
alternating current electric field observations. J. Geophys. Res. 98,1629–1652, 1993.
Huba, J.D. Theoretical and simulation methods applied to high latitude, Fregion turbulence, in: Liu, C.H. (Ed.), World Ionosphere/Thermo-sphere Study, WITS Handbook, vol. 2, SCOSTEP Secretariat,Boulder, CO., pp. 399–428, 1989.
Kelley, M.C. The Earth’s Ionosphere, International Geophysics Series, 43.Academic Press, London, 1989.
Keskinen, M.J., Ossakow, S.L. Theories of high-latitude irregularities: areview. Radio Sci. 18, 1077–1092, 1983.
Kintner, P.M., Seyler, C.E. The status of observations and theory of highlatitude ionospheric and magnetospheric plasma turbulence. Space Sci.Rev. 41, 91–129, 1985.
Mitchell, N., Alfonsi, L., De Franceschi, G., Lester, M., Romano, V.,Wernik, A.W. GPS TEC and scintillation measurements from thepolar ionosphere during the October 2003 storm. Geophys. Res. Lett.32 (12), L12S03, http://dx.doi.org/10.1029/2004GL021644, 2005.
Romano, V., Pau, S., Pezzopane, M., Zuccheretti, E., Zolesi, B., DeFranceschi, G., Locatelli, S. The electronic space weather upperatmosphere (eSWua) project at INGV: advancements and state of theart. Ann. Geophys. 26, 345–351, 2008.
Spogli, L., Alfonsi, L., De Franceschi, G., Romano, V., Aquino, M.H.O.,Dodson, A. Climatology of GPS ionospheric scintillations over highand mid-latitude European regions. Ann. Geophys. 27, 3429–3437,2009.
Spogli, L., Alfonsi, Lu., De Franceschi, G., Romano, V., Aquino,M.H.O., Dodson, A. Climatology of GNSS ionospheric scintillation athigh and mid-latitudes under different solar activity conditions, NuovoCimento della Societa Italiana di Fisica B-General Physics RelativityAstronomy And Mathematical Physics And Methods 125 B, N. 5–6,ISSN: 1826–9877. http://dx.doi.org/10.1393/ncb/i2010-10857-7, 2010.
Tsunoda, R.T. High latitude F region irregularities: a review andsynthesis. Rev. Geophys. Space Phys. 26, 719–760, 1988.
Van Dierendonck, A.J., Klobuchar, J., Hua, Q. Ionospheric scintillationmonitoring using commercial single frequency C/A code receivers, in:ION GPS-93 Proceedings of the Sixth International Technical Meetingof the Satellite Division of the Institute of Navigation, Salt Lake City,USA, 22–24 September, 1333–1342, 1993.
Van Dierendonck, A.J. Measuring ionospheric scintillation effects fromGPS signals, in: Proceedings of 57th Annual Meeting of the Institute ofNavigation, Albuquerque, pp 391–396, 2001.
Weaver M., Murtagh, W., Balch, C., Biesecker, D., Combs, L., Crown,M., Doggett, K., Kunches, J., Singer, H., Zezula, D. Halloween spaceweather storms of 2003, NOAA Technical Memorandum OAR SEC-88, 2004. available at <http://www.swpc.noaa.gov/Services/HalloweenStorms_assessment.pdf>.
Yeh, K.C., Liu, C.H. Radio wave scintillations in the ionosphere. Proc.IEEE 70, 324–360, 1982.


