Embed Size (px)
Citation preview

Cite this: RSC Advances, 2013, 3,16516
Gold dissolution: towards understanding of noblemetal corrosion
Received 31st May 2013,Accepted 5th July 2013
DOI: 10.1039/c3ra42684j
www.rsc.org/advances
Serhiy Cherevko,* Angel A. Topalov, Aleksandar R. Zeradjanin, Ioannis Katsounarosand Karl J. J. Mayrhofer*
The electrochemical dissolution of gold is an intricate topic and even though it has been studied for more
than 50 years, its understanding remains rather limited. In the current work, we obtain unique information
on gold dissolution by using a setup composed of a micro-electrochemical scanning flow cell (SFC) and
inductively coupled plasma mass spectrometry (ICP-MS). Thus, comprehensive online gold dissolution
profiles during the initial stage of oxidation as a function of the potential, time and pH are presented. A
microscopic model explaining the experimental findings is proposed. According to this model, two
dissolution mechanisms take place in two different potential regions: at low anodic potentials the
dissolution is driven by the place-exchange between metal and adsorbed hydroxyl/oxygen ions, while at
higher potentials the oxygen evolution reaction taking place on the surface of gold oxide initiates
concomitant gold loss.
1. Introduction
Gold is a commonly used material in electrochemistry. Due toits chemical inertness and resistance to oxide formationwithin the stability potential window of water, gold is amaterial of choice for many electrode reactions.1 In general,gold is considered as an ideally inert electrode in thesestudies, even though it is known that it is susceptible todissolution in the presence of complexing agents like CN2,Cl2 or Br2,2–4 which often restricts its application to solutionsfree from those species. However, also in the absence of suchcomplexing agents Au can still dissolve at positive potentials,an effect that is frequently neglected. Despite its importance,our knowledge on the fundamentals of gold dissolution isbased on few works only. More than a century ago, in 1907,Campbell observed gold dissolution on the anode and itsdeposition on a platinum cathode, when a voltage of 10 V wasapplied in a two-electrode cell.5 The authors, however did notfind Au in solution, which is probably due to the insufficientdetection limits of the methods used at that time. Most likelydue to such limitations, there was no significant progress fordecades, so that only in late 1960s and early 1970s with therapid development of new electrochemical equipment andtechniques the issue was revisited. Early voltammetric resultson the oxidation/reduction of noble metals and particularly ongold revealed a charge imbalance between oxidation andreduction,6 which was attributed to the anodic dissolution of
metals.7 In particular, Rand and Woods found that during thegold electrode cycling between +0.6 and +1.54 VRHE in 1 MH2SO4, the anodic charge was by 3.8 ¡ 0.2 mC cm22 higherthan the cathodic one, and they attributed this to thedissolution of gold during the positive-going sweep. Postanalysis of the electrolyte performed by atomic absorptionspectroscopy after 1040 cycles, confirmed the voltammetricdata since the amount of dissolved gold corresponded (usingthe Faraday’s law) to a similar charge of 3.6 ¡ 0.4 mC cm22. Inaddition, extensive work on the investigation of the anodicdissolution of certain noble metals, including gold, was doneat the Karpov Institute of Physical Chemistry in Moscow byKolotyrkin, Chemodanov and others, by means of highlysensitive radiometric determination of corrosion products inelectrolyte.8,9 On the other side, Cadle and Bruckensteinshowed that gold dissolves also during the reduction of goldoxide using a rotating ring-disk electrode (RRDE) setup.10 Intheir experiments, gold was polarized at an anodic potentialfor 5 min, and then a negative-going sweep was recorded,where dissolution was observed. Similarly, Vesztergom et al.have also shown the existence of cathodic dissolution of goldusing an RRDE setup and a phase-shifted double cyclicvoltammetry method.11
Recently, Tsuru et al. applied a double electrode flow cell tostudy the dissolution of platinum,12,13 palladium14 and,particularly, gold.15 The amount of dissolved gold wascalculated using the currents recorded on the collectorelectrode when the potential on the generator electrode wasin the region 1.35–1.6 VSHE (during the positive-going scan)and 1.4–1.1 VSHE (during the negative-going scan). The authorsobserved that gold dissolves during both directions of the
Department of Interface Chemistry and Surface Engineering, Max-Planck-Institut fur
Eisenforschung GmbH, Max-Planck-Straße 1, 40237 Dusseldorf, Germany.
E-mail: [email protected]; [email protected]; Fax: +49 (211) 6792-218; Tel: +49
(211) 6792-160
RSC Advances
PAPER
16516 | RSC Adv., 2013, 3, 16516–16527 This journal is � The Royal Society of Chemistry 2013
Ope
n A
cces
s A
rtic
le. P
ublis
hed
on 0
8 Ju
ly 2
013.
Dow
nloa
ded
on 2
0/11
/201
3 02
:56:
54.
Thi
s ar
ticle
is li
cens
ed u
nder
a C
reat
ive
Com
mon
s A
ttrib
utio
n 3.
0 U
npor
ted
Lic
ence
.
View Article OnlineView Journal | View Issue

sweep, and the integration of the absolute currents recordedon the collector electrode yielded a charge of 4.2 mC cm22 percycle between +0.4 and +1.6 VSHE.
While most of the previous works were driven solely byscientific curiosity and aimed at a fundamental understandingof the gold dissolution process, nowadays our interest isextended and related to practical applications as well. The lackof knowledge on the electrochemical gold oxidation anddissolution may retard the expansion and exploitation of newindustrial applications. Gold was already proposed for severalcatalytic and sensor applications such as alcohol oxidation,16
especially in combination with platinum and palladium inalkaline media,17–19 CO oxidation20–22 and glucose oxidation.23
Gold-platinum alloys are also considered as active and stableoxygen reduction reaction (ORR) catalysts in proton exchangemembrane fuel cells (PEMFCs)24–31 or lithium-air bat-teries.32,33 Moreover, unlike platinum, such alloys are poorcatalysts for methanol oxidation, making them good candi-dates for methanol-tolerant cathodes in direct methanol fuelcells (DMFCs).34
For low-temperature fuel cell applications, the potential atthe cathode may reach values as high as +1.5 VRHE duringstart-up or shut-down of the cell.35–37 Under these conditions,several degradation mechanisms may take place38 includingthe dissolution of the noble metal39,40 This work includes acomprehensive study of the stability of gold under transientand steady state potential perturbations, using a novel setup inwhich a commercial inductively coupled plasma mass spectro-meter (ICP-MS) is utilized to detect the amount of golddissolved during electrochemical experiments in a scanningflow cell (SFC). The current study complements previous worksfrom our group on the rhodium,41 platinum39 and gold42
dissolution, aiming for a better understanding of the electro-chemical dissolution of gold and noble metals in general, andeventually for the design of more stable catalysts.
2. Experimental
Before each experiment, the electrode (foil or disk) waspolished with 1 and 0.3 mm alumina suspensions on apolishing cloth (Struers, MD Mol) followed by a shortsonication in water, extensive washing in ultrapure water(PureLab Plus system, Elga, 18 MV, TOC , 3 ppb) and dryingin a flow of argon. All potentials in this work are presentedwith respect to the reversible hydrogen electrode (RHE)potential, which was acquired against a Ag/AgCl electrodeusing a Pt disk electrode (5 mm diameter disk sealed inTeflon1, MaTeck, Germany) in the corresponding electrolyteafter hydrogen saturation. The electrolytes (0.1 M H2SO4) werefreshly prepared from superpure concentrated sulfuric acid(Merck, Germany) by dilution in ultrapure water. Thepotentiostat (Gamry Reference 600, USA), electrolyte, gas flow,and SFC components were automatically controlled using anin-house built LabVIEW software.43 Programmed measure-ment protocols were used to avoid any user interaction with
the setup during measurements and thus increase reliability ofthe results.
2.1. Experiments in the scanning flow cell coupled with onlineelemental analysis
A 0.1 mm thick 99.99% polycrystalline gold foil purchasedfrom Aldrich or a gold disk (5 mm diameter, MaTeck,Germany) was used as a working electrode. The workingelectrode was placed on an xyz-positioning table and atungsten needle was connected to the foil/disk to make anelectrical contact. All experiments were performed in an in-house-built flow cell similar to the one reported in ourprevious paper.41 During measurements, the electrolyte waspumped to/from the cell by a standard ICP-MS (NexION 300X,Perkin Elmer) pump with constant flow rate of 140–150 mLmin21 through Tygon1 tubing (380 mm inner diameter) froma reservoir of argon-saturated 0.1 M H2SO4 to the V-shapedchannels of the polycarbonate cell and further downstream.The electrolyte was mixed with an internal standard (187Re, 7.5mg L21, mixing ratio 1 : 1) in a Y-connector after the cell andwas introduced into the ICP-MS. Calibration of the ICP-MS wasmade on each experiment day. The exposed area on theworking electrode was ca. 1 6 1022 cm2. Data are normalizedto the exposed geometric area of the working electrode, unlessotherwise stated. A homemade Ag/AgCl micro-referenceelectrode or a commercial saturated Ag/AgCl electrode(Metrohm, Germany) and a graphitic rod were used as thereference and the counter electrode, respectively.Electrochemical cleaning/activation of gold was performed byrecording 30 cycles between 0 and +1.8 VRHE at 200 mV s21
with simultaneous detection of gold dissolution. Then, theelectrode was held at open circuit potential or a predefinedpotential in the double-layer region for 180–300 s to stabilizethe dissolution signal on the background level. More detailson the cell design, the setup and on the ICP-MS measurementscan be found in the experimental part of a previous report.41
2.2. Experiments in a conventional three-electrode cell
A conventional three-electrode cell made of Teflon1 with allelectrode compartments separated by Nafion1 membranes(Tschurl modification)44 was used in additional measure-ments. The working electrode was a gold disk of 5 mm indiameter (MaTeck, Germany) embedded in a Teflon1cylinder. The gold activation procedure was the same asdescribed above for the SFC setup, with the only differencethat dissolution products were not recorded. A saturated Ag/AgCl electrode and a graphite rod served as the reference andthe counter electrode, respectively.
3. Results
3.1. System validation
To make sure that the chosen electrode preparation procedureis appropriate, gold voltammograms in deaerated solutionwere recorded using both the SFC and a conventional three-electrode setup (see Fig. 1). The curves obtained with the twodifferent techniques match each other well in the region of
This journal is � The Royal Society of Chemistry 2013 RSC Adv., 2013, 3, 16516–16527 | 16517
RSC Advances Paper
Ope
n A
cces
s A
rtic
le. P
ublis
hed
on 0
8 Ju
ly 2
013.
Dow
nloa
ded
on 2
0/11
/201
3 02
:56:
54.
Thi
s ar
ticle
is li
cens
ed u
nder
a C
reat
ive
Com
mon
s A
ttrib
utio
n 3.
0 U
npor
ted
Lic
ence
.View Article Online

gold oxidation and oxide reduction. The small difference inthe oxide formation region may be attributed to the differencein hydrodynamic conditions in the two setups, which mayhave an effect on the electrochemical cleaning step, e.g.presence/absence of re-deposition of dissolved gold. It shouldbe noted that one may find different cyclic voltammogram(CV) profiles of gold/gold oxide system in various reports.Reasons of such diversity is the difference in electrodepreparation (influence of grain size, exposed surface orienta-tions, purity, etc.), electrode history (polishing and cleaningprocedure), affinity of gold to poisoning by impurities, surfacereconstruction during potential excursions, etc.
The voltammograms recorded in both setups display similarcharacteristics as described in literature;7,11 which can beexplained following the most established mechanism of goldoxidation proposed by the Conway school.45–48 In the positive-going sweep, in the so-called double-layer region (i.e. below ca.+1.2 to +1.3 VRHE), the surface of gold is covered by adsorbedsupporting electrolyte anions (e.g. HSO4
2 and/or SO422), while
the coverage with OHads/Oads species is relatively low. Beyond+1.2–1.3 VRHE the adsorbed anions of the supporting electro-lyte are gradually displaced by OHads/Oads, and even Au–OH/Oplace-exchange, i.e. incorporation of O into the sub-surfacelayers, occurs. At even higher potentials and longer times, theformation of bulk phase oxide(s)/hydroxide(s) or hydrousoxide(s) takes place.49–51 It should be noted, that there isuncertainty about the exact nature of the adsorbed oxygenatedspecies such as OHads/Oads or oxide(s)/hydrous oxide(s). Forthe sake of convenience, only the term oxide will be used in thetext below, still bearing in mind that it may consist of severalforms of oxides, hydroxides or hydrous oxides. Only when thenature of the oxide state is crucial to the discussion, adistinction between oxides will be emphasized, particularlybetween adsorbed and place-exchanged oxygen.
The CVs were recorded up to a potential close to theBurshtein minimum, corresponding to the onset of oxygenevolution reaction (OER).52 The negative potential limit in themeasurements with the SFC setup was limited to the onset forthe ORR, because in this setup (contrary to the conventionalcell) residual oxygen was still present even after prolongedpurging.41 The roughness factors (ratio of real to geometricsurface area) of the two electrodes were estimated byintegration of the oxide reduction peaks in the negative-going
scan from +1.3 V to +0.95 V, and were ca. 1.4 (Au disk) and ca.1.5 (Au foil). Here, the assumption was made that at theBurshtein minimum, the electrode is covered by one mono-layer of adsorbed oxygen with a transferred charge of 400 mCcm22.53 In all other measurements described hereinafter, theroughness factor was used as a fingerprint of the electrodepreparation procedure, in order to ensure good reproducibilityof the results.
3.2. Potentiodynamic dissolution of gold–the effect of upperpotential limit
The cyclic voltammogram on gold in 0.1 M H2SO4 electrolytetogether with the dissolution profile recorded online in Fig. 2ashows that there is a concurrency of the gold dissolution andgold oxidation. Due to the presence of planes with differentcrystal orientation as well as crystal defects of lower coordina-tion number, however, the exact determination of an onsetpotential for the dissolution on a polycrystalline gold electrodeduring the positive-going sweep is not straightforward.Therefore, rather than discussing a single potential value itis better to consider a potential range for the onset ofdissolution. At potentials ca. 100–150 mV below the onsetpotential for significant OHads/Oads adsorption (ca. +1.3 VRHE),some small, almost negligible amount of gold dissolves inparallel to a minor increase in the current at ca. +1.1 VRHE
most likely due to oxidation of defects (data not shown). Acorrelation between magnitude of anodic current in thispotential region and amount of surface defects was indeedobserved by Kolb et al.54 Very recently Compton et al. haveshown that due to higher density of surface defects goldnanoparticles show more significant oxidation currentscompared to a bulk gold electrode.55 Thus, oxidation ofnanoparticles at much lower potentials and, as a result,dissolution should be taken into account, for instance, indegradation studies on platinum nanoparticles during oxygenreduction.38 Alternatively, the possibility of OH/O adsorptionwithin the surface pattern of adsorbed (bi-)sulfate ions wasreported by Conway et al.48 Higher amounts of dissolved goldare detected when the upper potential limit (UPL) duringcycling exceeds the onset for gold oxidation (E . ca. +1.3 VRHE,as highlighted in the inset in the Fig. 2a). Above this potential,gold dissolves both anodically and cathodically, as can be seen
Fig. 1 CVs taken on a gold foil electrode in the SFC setup (thick black line) andon a gold disk electrode in a conventional three-electrode cell setup (thin grayline) in 0.1 M H2SO4, showing double layer charging, formation of gold oxideand oxide reduction. Scan rate: 50 mV s21.
Fig. 2 (a) Dissolution profile shown in line with cyclic voltammogram. The insetshows a magnified view of the area corresponding to the onset of dissolution.(b) Dependence of dissolved gold per cycle on the upper potential limits (UPL) ofapplied cycles. Open squares present data obtained from the experiments withincreasing UPL and open triangles show results with decreasing UPL. The insetshows the same data presented in log scale. Electrolyte: 0.1 M H2SO4; scan rate:10 mV s21.
16518 | RSC Adv., 2013, 3, 16516–16527 This journal is � The Royal Society of Chemistry 2013
Paper RSC Advances
Ope
n A
cces
s A
rtic
le. P
ublis
hed
on 0
8 Ju
ly 2
013.
Dow
nloa
ded
on 2
0/11
/201
3 02
:56:
54.
Thi
s ar
ticle
is li
cens
ed u
nder
a C
reat
ive
Com
mon
s A
ttrib
utio
n 3.
0 U
npor
ted
Lic
ence
.View Article Online

by the sharp increase of detected amount of gold in thepositive-going sweep, and the peak in the dissolution signalupon reduction of the oxide (i.e. below ca. +1.2 VRHE), in thenegative-going sweep (in this work we also use the term‘‘cathodic dissolution’’, bearing in mind that this is a processduring cathodic reduction of gold oxide).
In a previous work42 we showed that the reductivedissolution of gold dominates when the UPL is kept in arelatively low potential region (,ca. +1.6 VRHE), similarly toPt39 and Rh.41 However, at higher potentials (.ca. +1.6 VRHE),anodic gold dissolution is the main cause of gold loss. Thusthe rate of dissolution increases rapidly in the oxygenevolution region, and the total amount of gold dissolvedduring one cycle increases with the increase of the UPL, as canbe seen in Fig. 2b. When the same electrode location is usedfor repetitive investigations using different UPLs, there issome ambiguity on whether there is any effect of the electrodehistory, since morphological changes may occur duringconsecutive cycles. To reject this hypothesis, an experimentalseries with decreasing UPL was performed. While generally thesame trend for Au dissolution was obtained (see Fig. 2b andinset, where dissolution is shown in log scale), slightly higheramounts of Au dissolved at the same UPL especially in thehigh potential region. Interestingly, a similar difference in theexact dissolution amounts upon increasing and decreasing theUPL was also reported by Kolotyrkin et al. for platinumdissolution in an acetate electrolyte, which was attributed tothe non-stationary nature of platinum dissolution at suffi-ciently low time scales.9
3.3. Potentiodynamic dissolution of gold–the effect of the scanrate
To study whether the time scale of the experiment besides thepotential value itself affects gold dissolution, the effect of thescan rate using a fixed potential window (+0.4 to +1.8 VRHE)was studied and the results are presented in Fig. 3. Given thatthe time at which gold is prone to dissolution is shorter athigher scan rates, it is not surprising that an increase in thescan rate results in decreased quantities of dissolved gold percycle. However, it is particularly interesting that such a declineis almost linear with the square root of the scan rate, as theslope of the log[Au] vs. log v diagram (Fig. 3b) is 20.56 ¡ 0.09(R2 = 0.998). This may be an indication of a single diffusion-controlled Faradaic reaction of gold dissolution, similarly towhat was proposed by Conway et al.2 for observations in thepresence of complexing Cl2 or Br2 anions.
The simple relation found between dissolution quantity andscan rate, allows correlating and comparing literature dataobtained with different scan rates. A re-calculation of the dataof Rand and Woods7 and of Tsuru et al.15 to the main scan rateused in the current work (i.e. 10 mV s21), yields a dissolutionamount of ca. 5 and 4 ng cm22 cycle21, respectively, which areclose to the value of 5–7 ng cm22 cycle21 observed here forsimilar UPLs. It should be noted that a decrease in thedissolution amount with scan rate was also observed on Rhand Pt,39,41 without, however, following such a simpledependence as for Au. This is most likely related to the factthat, contrary to gold, the dissolution during oxide reduction
is the dominant dissolution process for those metals in thewhole potential range.
3.4. Gold dissolution during formation/reduction of bulkoxide. It is generally accepted that gold forms bulk oxides athigh anodic potentials (ca. above +1.8 to +2 VRHE) and that theformed phases are hydrous oxides with a varying, complexnature of hydration.49 In order to study the effect of bulk oxideformation and reduction on gold dissolution, a constantpotential of +2.0 VRHE was applied for different times andalways followed by a reduction ramp. The reduction peakshifts to more negative potentials for longer polarizationtimes, indicating that the formation/reduction of such oxidesis a highly irreversible process (Fig. 4a). Unlike the compactlayer, whose thickness is limited by 2–3 layers only, bulk oxidemay grow in virtually unlimited number of layers, dependingon the potential and time of polarization.50,51 In our case,formation of a total of 4.5 MLs was achieved for an oxidationperiod of 105 s.
While the anodic dissolution is enhanced at longerpolarization times, the amount of gold dissolved during thereduction of the oxide does not show any significant increase.This suggests that the reduction of the complete bulk hydrousoxide is not associated with gold dissolution, but that thereduction of the compact oxide is dominating the cathodicgold dissolution. This is rather surprising, considering thesurface roughening introduced by the formation of hydrousand porous bulk oxide.45,49,56
3.5. Potentiodynamic dissolution of gold–the effect of the re-deposition
Among the possible reasons for the decrease of the dissolvedamount of Au with scan rate and for the independence from
Fig. 3 (a) Effect of scan rate on dissolution of gold during potential cyclingbetween +0.4 and +1.8 VRHE. (a) Dissolution profile is presented together withpotential transients (potential cycles followed by potential steps in case of highscan rates). (b) Dependence of gold dissolution amount on the scan ratepresented on the log–log scale. Electrolyte: 0.1 M H2SO4.
This journal is � The Royal Society of Chemistry 2013 RSC Adv., 2013, 3, 16516–16527 | 16519
RSC Advances Paper
Ope
n A
cces
s A
rtic
le. P
ublis
hed
on 0
8 Ju
ly 2
013.
Dow
nloa
ded
on 2
0/11
/201
3 02
:56:
54.
Thi
s ar
ticle
is li
cens
ed u
nder
a C
reat
ive
Com
mon
s A
ttrib
utio
n 3.
0 U
npor
ted
Lic
ence
.View Article Online

the formation/reduction of bulk oxide, one may consider atime effect and possible re-deposition of dissolved gold. Toestimate the effect of re-deposition, additional experimentswere carried out, where the cycle was interrupted during thebackward scan and the potential was held at different values(ESTEP), as it is shown in Fig. 5a.
As we do not know the exact nature of the dissolved Auspecies and their activity at the vicinity of the electrode as afunction of the potential and scan rate, it is impossible tocalculate the deposition potential of the dissolved species.However, we can make the assumption that re-deposition canbe possible only at potentials lower than those of the onset ofgold oxidation. This sounds reasonable, if one considers thatdissolved gold species do not deposit at potential of +0.8VSHE
15 (much lower than the maximum ESTEP of +1.26 VRHE
applied in the current work). As one can see from the Fig. 1, atthis potential, the surface is still covered by oxide, and re-deposition of gold on the oxide is not likely to happen. If re-deposition was taking place at the lower potentials in thisexperiment, one should expect a decreased amount of golddetected downstream. However, the amount of dissolved golddetected in the ICP-MS was almost the same (deviation iswithin 1%) regardless of the value of ESTEP. Thus, even if somere-deposition takes place microscopically, its effect must benegligible for the scan rates utilized in the current work. Basedon this, the results presented in section 3.4 on theindependence of cathodic dissolution on the bulk oxideformation cannot be attributed to re-deposition of dissolvedgold.
3.6. Potentiostatic dissolution of gold
Fig. 6a presents dissolution profiles of gold during potentialhold experiments at different potentials. At potentials belowthe onset of gold oxidation (ca. +1.3 VRHE) the dissolution rateremains below the detection limit. However, as soon as thepotential is stepped to a value where gold oxidation takesplace, continuous dissolution starts to appear. An initialdissolution peak right after the potential step is followed by agradual decrease in the dissolution rate until an almost stablevalue is achieved after ca. 1000 s of polarization (Fig. 6a). Inthis respect, gold behaves differently to platinum andrhodium, the dissolution of which is suppressed to belowthe detection limit after the same timeframe.39,41 In order toobtain the amount of dissolved gold at different potentials, theintegral over the area below the corresponding dissolutionprofiles was taken and plotted as a function of the appliedpotential (inset in Fig. 6a). Taking into account that onemonolayer of gold corresponds to ca. 410 ng cm22,42 theestimated number of dissolved layers gradually increases withthe polarization potential, similarly to what was observed inexperiments where the UPL was varied (inset on the Fig. 2b).
The small peaks on the dissolution profiles at around 8500 scorrespond to dissolution during cathodic ramps that wereapplied after the constant potential step, to get information onthe amount of gold oxide(s) formed during each potential step.The corresponding voltammetric profiles are shown in Fig. 6b.Again, with increase of the polarization potential, more oxideforms on the surface of gold, while the reduction peakpotentials shift to more negative values due to the formationof more stable oxides. The presence of at least two different
Fig. 4 (a) Negative linear potential scans showing the reduction of gold oxidesformed during anodization over various times. Charges obtained by integrationof the cathodic peaks and corresponding number of gold oxide monolayers(assuming that one monolayer charge is 400 mC cm22 and taking into accountthe roughness factor of the electrode of 1.45) are indicated in the table. (b)Corresponding dissolution profile, wherein the dotted lines correspond to theonset of gold oxide reduction. Scan rate during ramps: 10 mV s21.
Fig. 5 (a) Potential-time programs which consist of a positive-going sweep, anincomplete negative-going sweep and a potential step. (b) Dependence of thedissolved gold quantity on the lower potential limit of potential scans (steppotentials ESTEP) shown in (a). Scan rate: 20 mV s21.
16520 | RSC Adv., 2013, 3, 16516–16527 This journal is � The Royal Society of Chemistry 2013
Paper RSC Advances
Ope
n A
cces
s A
rtic
le. P
ublis
hed
on 0
8 Ju
ly 2
013.
Dow
nloa
ded
on 2
0/11
/201
3 02
:56:
54.
Thi
s ar
ticle
is li
cens
ed u
nder
a C
reat
ive
Com
mon
s A
ttrib
utio
n 3.
0 U
npor
ted
Lic
ence
.View Article Online

oxide states is clearly seen by the small shoulder on thedescending section of the peaks. The number of formed oxidelayers increases from 0.75 (at +1.5 VRHE) to 3 monolayers (at+1.95 VRHE), indicating the qualitative analogy between thedissolution curve and the oxide isotherm in this region.
According to the classical theory of corrosion of metals, aconstant dissolution rate should correspond to equal rates ofoxide formation and metal dissolution.57 To verify thisstatement, the gold electrode was oxidized over differenttimes and each step was followed by a cathodic ramp.Afterwards, CVs with 50 mV s21 with UPL corresponding tothe Burshtein minimum52 were taken to exclude any sig-nificant surface area change. The dissolution signal wasrecorded continuously as shown in Fig. 7a for three differentapplied polarization potentials. The dissolution rate changes
with time for all studied potentials, and no complete steadystate of dissolution is reached even after 3600 s of polarization.The amount of dissolved gold during each step (open symbols)and the dissolution rate at the end of each step (filled symbols)are plotted in Fig. 7b for E = 1.9 VRHE.
The charge associated to the oxidation of gold, which iscorresponding to oxide coverage, depends linearly on thelogarithm of the polarization time, as shown in Fig. 7c (left axis).Conway et al. suggested that such a relationship is indicative ofan activation-limited reaction, in which the Gibbs free energy ofactivation increases linearly with time.58 The growth of gold oxidehowever follows also the q21 vs. log(t) law (see Fig. 7c, rightaxis),50,59 indicating that the oxide growth is governed by thehigh-field-strength raised between metal and electrolyte fronts –known as the Cabrera–Mott model.60 The same tendency wasalso found for E = 1.5 VRHE and E = 1.7 VRHE (data are not shown).Thus the gold oxide growth may be explained by both kineticslaws – i.e. a direct logarithmic law for AuO thickness up to 2 MLsand an inverse logarithmic law when the oxide thicknessbecomes higher than 2–3 MLs,51 so that solid conclusionscannot be drawn. However, while the high field strength mayonly emerge when the two interfaces are separated by a relativelythin and insulating oxide, Conway’s model is also applicable forthe case of partially covered surfaces. Therefore, particularly inthe studied potential range and experimental time scale wherethe oxide coverage is relatively low, the gold oxidation is likely tobe governed by the electrochemical surface potential change withO/OH adsorption and Au–O/OH place-exchange. It should beadditionally noted that for all applied potentials, a constantgrowth of gold oxide was found, however we did not find anysignificant increase in the electrode surface area (roughnessfactor) due to oxidation/dissolution. Thus, the obtained oxida-tion law is an intrinsic property of gold rather than an artifact dueto surface area increase.
3.7. Effect of pH
The electrochemical oxidation and electrochemical dissolu-tion of Au possess quite similar standard potentials, howevercan eventually be distinguished by the fact that protons areinvolved only in the former one, while the latter is governed bythe concentration of gold ions only. The electrochemicaloxidation of gold can be expressed as61
2Au + 3H2O A Au2O2 + 6H+ + 6e2
Eo = 1.457 + 0.0591 log[H+] (1)
or
Au + 3H2O A Au(OH)2 + 3H+ + 3e2
Eo = 1.511 + 0.0591 log[H+] (2)
and the electrochemical dissolution of Au and formation ofAu3+ ions can be described as:61
Au A Au3+ + 3e2
Eo = 1.498 + 0.0197 log[Au3+] (3)
Assuming that the discharge of water and the adsorption ofOH or O are fast processes and always in equilibrium for thescan rates employed in the current work, an effect of the pH
Fig. 6 Potentiostatic dissolution of gold. (a) Dissolution of gold at differentapplied potentials (for potential values, see legend in 6b). For the sake ofclearness, the initial section corresponding to the dissolution of gold duringelectrochemical cleaning is not shown. The total amount of dissolved gold andthe corresponding number of lost gold monolayers against the step potential isshown in the inset. (b) Corresponding gold oxide reduction profiles followingpolarization at different potentials for 7200 s. The inset shows the dependenceof the reduction charge and the number of gold oxide monolayers on theapplied potential.
This journal is � The Royal Society of Chemistry 2013 RSC Adv., 2013, 3, 16516–16527 | 16521
RSC Advances Paper
Ope
n A
cces
s A
rtic
le. P
ublis
hed
on 0
8 Ju
ly 2
013.
Dow
nloa
ded
on 2
0/11
/201
3 02
:56:
54.
Thi
s ar
ticle
is li
cens
ed u
nder
a C
reat
ive
Com
mon
s A
ttrib
utio
n 3.
0 U
npor
ted
Lic
ence
.View Article Online

should reveal whether dissolution is controlled by metaloxidation or by gold ionization.
Fig. 8 shows the variation of the CVs and the dissolutionsignals for different concentrations of sulfuric acid electrolyte.It should be noted, that the change of the pH was alwaysaccompanied with an unavoidable change in the concentra-tion of (bi-)sulfate anions. The use of high concentrations ofsulfate salts (such as Na2SO4) to keep the concentration ofelectrolyte anions the same for all measurements, is notfeasible since a high concentration of alkali metal cationscause complications in the ICP-MS measurements.Nevertheless, it will be shown below that the impact of theproton and of the (bi-)sulfate concentration can be sufficientlydecoupled.
When the CVs are plotted versus the pH-corrected RHE scale,they coincide relatively well (Fig. 8a), due to the fact that
oxidation/reduction are indeed processes with protonsinvolved in the corresponding rate-determining steps (RDS).The slight shift of the onset potential for gold oxidation tomore positive values with increasing H2SO4 concentration isdue to the competition between the adsorption of OH/O and(bi-)sulfate anions, i.e. a more positive potential is required foroxygenated species to displace (bi-)sulfate adsorbed species, asshown by Angerstein-Kozlowska et al.48
The dissolution signal together with the potential profile isshown in Fig. 8b. The signal corresponding to gold dissolutionduring the initial cleaning step is also included, to highlightthat the dissolution signal increases almost exponentially withH+ concentration during these fast scans (200 mV s21). Thedissolution rate also grows with H+ concentration in the caseof a slow scan rate of 2 mV s21. Particularly, while the rate ofanodic dissolution scales linearly with proton concentration,
Fig. 7 Time scale effect on gold dissolution and oxidation. (a) Dissolution profiles of gold vs. time under different polarization potential (see figure legend). (b)Corresponding dependence of the total amount of dissolved gold (open symbols) and rate of dissolution at the end of each step (filled symbols) on polarization time.(c) Charge associated to the oxidation of gold as a function of polarization time. For the sake of clearness, only data for E = 1.9 VRHE are presented in (b) and (c).
16522 | RSC Adv., 2013, 3, 16516–16527 This journal is � The Royal Society of Chemistry 2013
Paper RSC Advances
Ope
n A
cces
s A
rtic
le. P
ublis
hed
on 0
8 Ju
ly 2
013.
Dow
nloa
ded
on 2
0/11
/201
3 02
:56:
54.
Thi
s ar
ticle
is li
cens
ed u
nder
a C
reat
ive
Com
mon
s A
ttrib
utio
n 3.
0 U
npor
ted
Lic
ence
.View Article Online

the rate of cathodic dissolution rather follows an exponentialdependence, identical to that observed during the fast initialpotential scans.
A similar effect of the dependence of gold dissolution on pHduring anodic and cathodic process is seen for a prolongedconstant potential step, followed by a cathodic ramp (Fig. 9a).The rate of anodic dissolution drops to an almost constantvalue after ca. 1000 s, with the ratio between dissolution ratesin different electrolytes remaining stable. On the other hand,the dissolution rate during oxide reduction massivelyincreases with pH decrease, as shown in the Fig. 9b, whilethe charge during oxide reduction (and thus the oxidecoverage) is almost the same for all electrolytes (inset inFig. 9a).
4. Discussion
Below, we will first summarize the most important experi-mental findings:
(a) During a positive-going sweep, the onset of golddissolution coincides with the onset of massive OH/O
adsorption and, most likely, Au–OH/O place-exchange.During the negative going sweep, the rate of gold dissolutionincreases when gold oxide reduction starts;
(b) When the potential cycling at sweep rate of 10 mV s21
does not exceed ca. +1.6 VRHE, dissolution during oxidereduction is the dominating dissolution process; for cycleswith higher upper potential limits gold dissolves mainlyanodically;
(c) The total amount of dissolved gold within a cycledecreases with increase in scan rate;
(d) Gold ions dissolve and diffuse away from the vicinity ofthe electrode, so that gold re-deposition is negligible withinthe time scale of the experiments;
(e) During anodic polarization experiments, a constant rateof gold dissolution is not achieved even after 7200 s at allstudied potentials apart from E = +1.95 VRHE;
(f) The dissolved amount vs. potential graph follows roughlythe same trend as the formed oxide amount vs. potential;
(g) The oxide growth kinetics can be described with both a qvs. log(t) and a q21 vs. log(t) dependence, while the dissolution
Fig. 8 Effect of the electrolyte on gold dissolution during potential cycling. (a)CV curves recorded in three different electrolyte concentrations. The insetpresents a magnified view of the onset of gold oxidation. (b) Dissolution of goldin three electrolytes during potentiodynamic conditions.
Fig. 9 (a) Dissolution of gold in three electrolytes during potentiodynamicconditions. Corresponding reductive linear-sweep voltammograms are shown inthe inset. (b) The magnified views of the dissolution profile at last minutes of thesteady-state dissolution and during dissolution in the cathodic route. Highermagnification of the area highlighted with a gray box is shown in the inset.
This journal is � The Royal Society of Chemistry 2013 RSC Adv., 2013, 3, 16516–16527 | 16523
RSC Advances Paper
Ope
n A
cces
s A
rtic
le. P
ublis
hed
on 0
8 Ju
ly 2
013.
Dow
nloa
ded
on 2
0/11
/201
3 02
:56:
54.
Thi
s ar
ticle
is li
cens
ed u
nder
a C
reat
ive
Com
mon
s A
ttrib
utio
n 3.
0 U
npor
ted
Lic
ence
.View Article Online

rate decreases much slower (approximately it obeys log(Au) vs.log(t) law);
(h) The onset potential of dissolution, expressed in the RHEscale, is almost the same for electrolytes of different pH; smalldifferences are attributed to the different concentration ofcounterions HSO4
2 and/or SO422;
(i) The amount of dissolved gold during anodic andcathodic dissolution increases with increasing acidity; achange in the pH has a more pronounced effect on thedissolution during oxide reduction;
(j) The reduction of bulk hydrous gold oxide does not have asignificant effect on gold dissolution.
The consistency between the onset of gold oxidation andtransient dissolution in all experiments implies that bothprocesses are closely linked to each other. Particularly, theobserved shift of the dissolution onset potential with pH onthe SHE scale reveals that one proton is involved in the ratedetermining step (RDS) of gold dissolution. Since the directelectrochemical dissolution does not involve protons (eqn (3)),gold dissolution at these potentials is governed by the kineticsof oxide formation. The increase in the dissolution rate withincreasing acidity is then a sign of the shift of the waterdissociation equilibrium, resulting in depressed amounts ofhydroxyl ions in the vicinity of the electrode.
While the exact nature of the oxide still remains unre-solved, the oxidation process of gold can tentatively beascribed to OH/O adsorption and place-exchange betweengold and oxygen ions, which commence in parallel.45,47,48
Interestingly, Au3+ ions, which are the thermodynamicallystable species in acidic solution formed at sufficiently positive
potentials according to the Pourbaix diagram,61 do notdissolve massively at such positive potentials due to passiva-tion of the surface by gold oxide. During place-exchange,however, this passivity is probably disturbed either duringsurface reconstruction or during possible migration of goldions from the gold matrix through the thin layer of gold oxideto the oxide/electrolyte interface. This leads to the exposure ofgold ions to the electrolyte, which then experience a competi-tion between two processes: (i) water discharge and conse-quent adsorption of OH/O that leads to re-passivation, and (ii)gold ion diffusion away from the electrode vicinity to thesolution that leads to macroscopically observed dissolution.The extent of dissolution generally depends on the extent ofthe competition between these two processes, in particular forincreasing acidity the re-passivation of the surface after place-exchange becomes less efficient. It is worth noting that thekinetics of the water discharge and OH/O adsorption is veryfacile in all cases, so that the observed rate of dissolution isoverall relatively low.
Even though more work is required to derive an exactmodel for gold dissolution during transient conditions, it isstill possible to consider a scheme that is consistent with theexperimental observations. This tentative microscopic model(Scheme 1) of transient dissolution of gold includes processestaking place on the electrode during formation of oxide (a–c)and its reduction (c–e). As can be seen from the scheme, themain precursor of dissolved gold ion is the de-passivated ionformed anodically or cathodically as a result of place-exchangebetween O/OH and Au. It seems that the mechanism of thetransient dissolution of gold at low potentials is similar to that
Scheme 1 Proposed model of the transient dissolution of gold. For simplicity, gold in all valences is presented as ‘‘Au’’ and oxygenated species are shown as ‘‘O’’. (a)Gold in the double-layer potential range. (b) Reversibly adsorbed O/OH ions on the surface of gold at potentials less than, or close to, ca. +1.3 V. Presence of O/OHions on the surface protects gold from dissolution (passivation). Almost at the same potential place-exchange between O/OH and Au ions take place (de-passivation).After a simple act of the switch between the O/OH and Au ions, the two possibilities of the dissolution of Au and stabilization (re-passivation) are highlighted (c).During gold reduction, desorption of reversibly adsorbed O/OH causes de-passivation and gold dissolution (d). Reduced roughened surface is shown in (e).
16524 | RSC Adv., 2013, 3, 16516–16527 This journal is � The Royal Society of Chemistry 2013
Paper RSC Advances
Ope
n A
cces
s A
rtic
le. P
ublis
hed
on 0
8 Ju
ly 2
013.
Dow
nloa
ded
on 2
0/11
/201
3 02
:56:
54.
Thi
s ar
ticle
is li
cens
ed u
nder
a C
reat
ive
Com
mon
s A
ttrib
utio
n 3.
0 U
npor
ted
Lic
ence
.View Article Online
of other noble metals which are prone to the formation ofpassivating oxides, i.e. Pt and, to less extent, Rh. Ourobservation that dissolution during the negative-going sweepis the main origin of dissolution, suggests that more exposedAu ions and thus more dissolution occur during the surfacereduction on those metals.
If the dissolution of gold was entirely driven by place-exchange in the entire potential region studied, one wouldexpect a decrease in the dissolution rate approaching zero withtime, regardless of the model the oxide growth follows. Whilethis situation was indeed observed for platinum,39 golddissolves almost at a constant rate at highly positivepotentials. In addition, if dissolution was only due to place-exchange, one should expect proportionality between thecharge associated with oxide formation and the amount ofgold dissolving. However, for potentials above ca. +1.5 VRHE, itevolves from Fig. 7b and c that such a relationship does notexist (note that the dissolution amount is proportional to timein the log–log scale in Fig. 7b, but the charge corresponding tothe formed oxide is linearly dependent to the time on thesemi-log scale in Fig. 7c). The above observations indicate thatthere must be another process besides the place-exchangewhich contributes to additional gold corrosion at steady highpotentials.
In a very recent work by the group of Koper62 it has beenshown that the oxygen evolved during OER on gold is formedfrom oxygen ions in the oxide, the so-called ‘‘surface route’’ or‘‘oxide route’’.63 In this case one might expect a temporal localloss of passivation of the surface and thus an enhanced metaldissolution due to the same competition between (i) re-passivation and (ii) dissolution described above for the effectof place-exchange. In addition, the authors proposed thatalready at a potential as low as +1.54 VRHE some oxygen startsevolving as a result of the formation of Au2O3 from AuOOH,which is well in line with the observation for continuous golddissolution starting already at that potential. The contributionbecomes more dominating at higher potentials, when the OERrate is steadily increasing. It is worth mentioning that incontrast the enhanced stability of platinum in the OERregion42 may thus be related to the fact that the reaction onplatinum is going through a ‘‘solution route’’.64
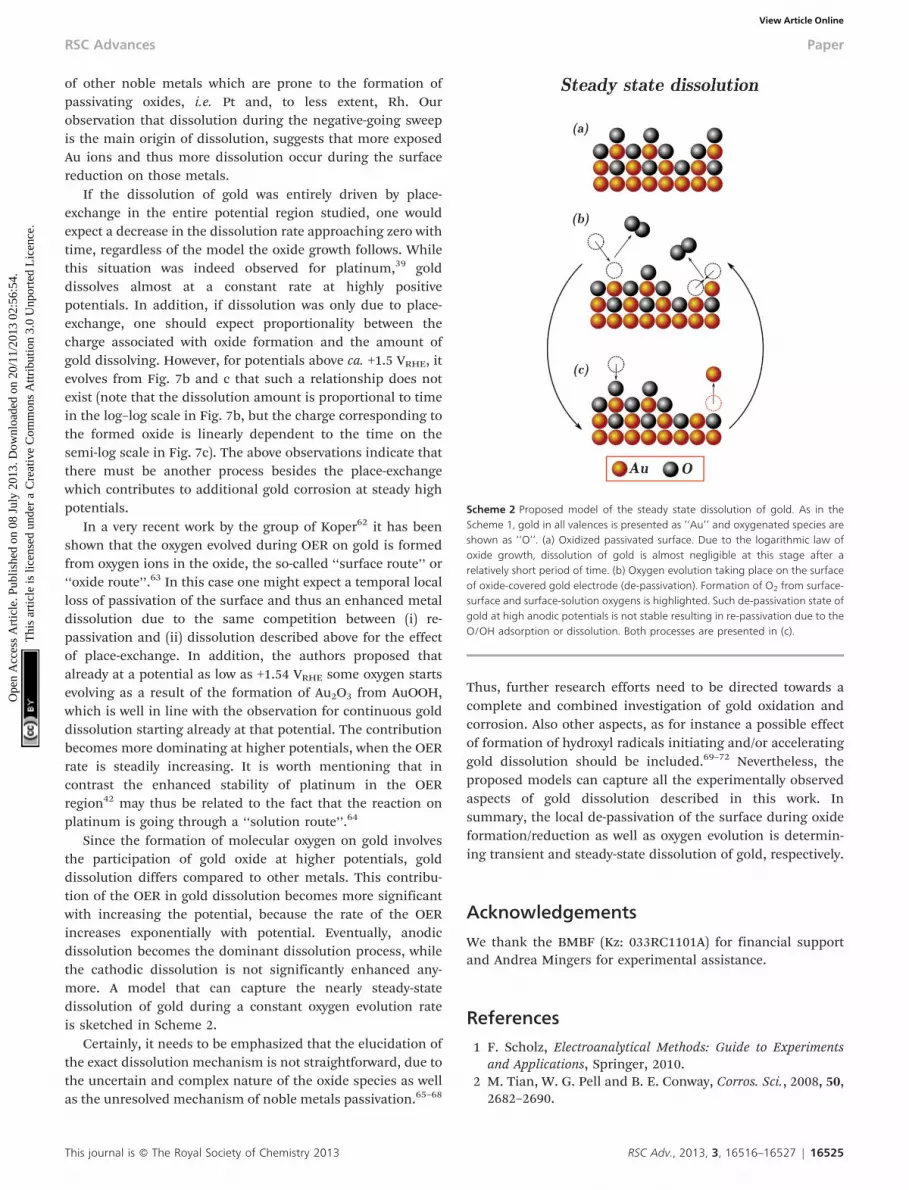
Since the formation of molecular oxygen on gold involvesthe participation of gold oxide at higher potentials, golddissolution differs compared to other metals. This contribu-tion of the OER in gold dissolution becomes more significantwith increasing the potential, because the rate of the OERincreases exponentially with potential. Eventually, anodicdissolution becomes the dominant dissolution process, whilethe cathodic dissolution is not significantly enhanced any-more. A model that can capture the nearly steady-statedissolution of gold during a constant oxygen evolution rateis sketched in Scheme 2.
Certainly, it needs to be emphasized that the elucidation ofthe exact dissolution mechanism is not straightforward, due tothe uncertain and complex nature of the oxide species as wellas the unresolved mechanism of noble metals passivation.65–68
Thus, further research efforts need to be directed towards acomplete and combined investigation of gold oxidation andcorrosion. Also other aspects, as for instance a possible effectof formation of hydroxyl radicals initiating and/or acceleratinggold dissolution should be included.69–72 Nevertheless, theproposed models can capture all the experimentally observedaspects of gold dissolution described in this work. Insummary, the local de-passivation of the surface during oxideformation/reduction as well as oxygen evolution is determin-ing transient and steady-state dissolution of gold, respectively.
Acknowledgements
We thank the BMBF (Kz: 033RC1101A) for financial supportand Andrea Mingers for experimental assistance.
References
1 F. Scholz, Electroanalytical Methods: Guide to Experimentsand Applications, Springer, 2010.
2 M. Tian, W. G. Pell and B. E. Conway, Corros. Sci., 2008, 50,2682–2690.
Scheme 2 Proposed model of the steady state dissolution of gold. As in theScheme 1, gold in all valences is presented as ‘‘Au’’ and oxygenated species areshown as ‘‘O’’. (a) Oxidized passivated surface. Due to the logarithmic law ofoxide growth, dissolution of gold is almost negligible at this stage after arelatively short period of time. (b) Oxygen evolution taking place on the surfaceof oxide-covered gold electrode (de-passivation). Formation of O2 from surface-surface and surface-solution oxygens is highlighted. Such de-passivation state ofgold at high anodic potentials is not stable resulting in re-passivation due to theO/OH adsorption or dissolution. Both processes are presented in (c).
This journal is � The Royal Society of Chemistry 2013 RSC Adv., 2013, 3, 16516–16527 | 16525
RSC Advances Paper
Ope
n A
cces
s A
rtic
le. P
ublis
hed
on 0
8 Ju
ly 2
013.
Dow
nloa
ded
on 2
0/11
/201
3 02
:56:
54.
Thi
s ar
ticle
is li
cens
ed u
nder
a C
reat
ive
Com
mon
s A
ttrib
utio
n 3.
0 U
npor
ted
Lic
ence
.View Article Online

3 S. Ye, C. Ishibashi, K. Shimazu and K. Uosaki, J.Electrochem. Soc., 1998, 145, 1614–1623.
4 D. W. Kirk, F. R. Foulkes and W. F. Graydon, J. Electrochem.Soc., 1978, 125, 1436–1443.
5 F. H. Campbell, Trans. Faraday Soc., 1907, 3, 103–113.6 K. J. Vetter and D. Berndt, Zeitschrift fur Elektrochemie,
Berichte der Bunsengesellschaft fur physikalische Chemie,1958, 62, 378–386.
7 D. A. J. Rand and R. Woods, J. Electroanal. Chem., 1972, 35,209–218.
8 Y. M. Kolotyrkin, Electrochim. Acta, 1973, 18, 593–606.9 Y. M. Kolotyrkin, V. V. Losev and A. N. Chemodanov, Mater.
Chem. Phys., 1988, 19, 1–95.10 S. H. Cadle and S. Bruckenstein, Anal. Chem., 1974, 46,
16–20.11 S. Vesztergom, M. Ujvari and G. G. Lang, Electrochem.
Commun., 2011, 13, 378–381.12 A. P. Yadav, A. Nishikata and T. Tsuru, J. Electrochem. Soc.,
2009, 156, C253–C258.13 B. R. Shrestha, A. P. Yadav, A. Nishikata and T. Tsuru,
Electrochim. Acta, 2011, 56, 9714–9720.14 B. R. Shrestha, A. Nishikata and T. Tsuru, Electrochim. Acta,
2012, 70, 42–49.15 B. R. Shrestha, A. Nishikata and T. Tsuru, J. Electroanal.
Chem., 2012, 665, 33–37.16 A. Wittstock, V. Zielasek, J. Biener, C. M. Friend and
M. Baumer, Science, 2010, 327, 319–322.17 S. Cherevko, X. Xing and C.-H. Chung, Electrochim. Acta,
2011, 56, 5771–5775.18 S. Cherevko, N. Kulyk and C.-H. Chung, Langmuir, 2012, 28,
3306–3315.19 S. Cherevko, N. Kulyk and C.-H. Chung, Electrochim. Acta,
2012, 69, 190–196.20 M. Haruta, T. Kobayashi, H. Sano and N. Yamada, Chem.
Lett., 1987, 16, 405–408.21 C. T. Campbell, Science, 2004, 306, 234–235.22 M. S. Chen and D. W. Goodman, Science, 2004, 306,
252–255.23 S. Cherevko and C.-H. Chung, Sens. Actuators, B, 2009, 142,
216–223.24 S. V. Selvaganesh, G. Selvarani, P. Sridhar, S. Pitchumani
and A. K. Shukla, Phys. Chem. Chem. Phys., 2011, 13,12623–12634.
25 J. Zhang, K. Sasaki, E. Sutter and R. R. Adzic, Science, 2007,315, 220–222.
26 Y. Zhang, Q. Huang, Z. Zou, J. Yang, W. Vogel and H. Yang,J. Phys. Chem. C, 2010, 114, 6860–6868.
27 Y.-H. Fang and Z.-P. Liu, J. Phys. Chem. C, 2011, 115,17508–17515.
28 M. S. El-Deab and T. Ohsaka, J. Electroanal. Chem., 2003,553, 107–115.
29 B. Du, O. Zaluzhna and Y. J. Tong, Phys. Chem. Chem. Phys.,2011, 13, 11568–11574.
30 F. Ye, H. Liu, W. Hu, J. Zhong, Y. Chen, H. Cao and J. Yang,Dalton Trans., 2012, 41, 2898–2903.
31 E. Higuchi, K. Hayashi, M. Chiku and H. Inoue,Electrocatalysis, 2012, 3, 274–283.
32 F. Cheng and J. Chen, Chem. Soc. Rev., 2012, 41, 2172–2192.33 Y.-C. Lu, Z. Xu, H. A. Gasteiger, S. Chen, K. Hamad-
Schifferli and Y. Shao-Horn, J. Am. Chem. Soc., 2010, 132,12170–12171.
34 J. B. Xu, T. S. Zhao, W. W. Yang and S. Y. Shen, Int. J.Hydrogen Energy, 2010, 35, 8699–8706.
35 A. Rabis, P. Rodriguez and T. J. Schmidt, ACS Catal., 2012,2, 864–890.
36 H. Tang, Z. Qi, M. Ramani and J. F. Elter, J. Power Sources,2006, 158, 1306–1312.
37 C. A. Reiser, L. Bregoli, T. W. Patterson, J. S. Yi, J. D. Yang,M. L. Perry and T. D. Jarvi, Electrochem. Solid-State Lett.,2005, 8, A273–A276.
38 J. C. Meier, C. Galeano, I. Katsounaros, A. A. Topalov,A. Kostka, F. Schuth and K. J. J. Mayrhofer, ACS Catal.,2012, 2, 832–843.
39 A. A. Topalov, I. Katsounaros, M. Auinger, S. Cherevko, J.C. Meier, S. O. Klemm and K. J. J. Mayrhofer, Angew. Chem.,Int. Ed., 2012, 51, 12613–12615.
40 A. A. Topalov, S. Cherevko, A. Zeradjanin, J. Meier,I. Katsounaros and K. J. J. Mayrhofer, Submitted.
41 S. O. Klemm, A. Karschin, A. K. Schuppert, A. A. Topalov, A.M. Mingers, I. Katsounaros and K. J. J. Mayrhofer, J.Electroanal. Chem., 2012, 677–680, 50–55.
42 S. Cherevko, A. A. Topalov, I. Katsounaros and K. J.J. Mayrhofer, Electrochem. Commun., 2013, 28, 44–46.
43 A. A. Topalov, I. Katsounaros, J. C. Meier, S. O. Klemm andK. J. J. Mayrhofer, Rev. Sci. Instrum., 2011, 82, 114103.
44 K. J. J. Mayrhofer, S. J. Ashton, J. Kreuzer and M. Arenz, Int.J. Electrochem. Sci., 2009, 4, 1–8.
45 B. E. Conway, Prog. Surf. Sci., 1995, 49, 331–452.46 M. Tian, W. G. Pell and B. E. Conway, Electrochim. Acta,
2003, 48, 2675–2689.47 H. Angerstein-Kozlowska, B. E. Conway, A. Hamelin and
L. Stoicoviciu, Electrochim. Acta, 1986, 31, 1051–1061.48 H. Angerstein-Kozlowska, B. E. Conway, A. Hamelin and
L. Stoicoviciu, J. Electroanal. Chem., 1987, 228, 429–453.49 D. Burke and M. E. G. Lyons, in Modern Aspects of
Electrochemistry 28, ed. J. O. M. Bockris, B. E. Conwayand R. E. White, Plenum Press, 1996.
50 G. Tremiliosi-Filho, L. H. Dall’Antonia and G. Jerkiewicz, J.Electroanal. Chem., 1997, 422, 149–159.
51 G. Tremiliosi-Filho, L. H. Dall’Antonia and G. Jerkiewicz, J.Electroanal. Chem., 2005, 578, 1–8.
52 A. A. Michri, A. G. Pshenichnikov and R. K. Burshtein,Elektrokhimiya, 1972, 8, 364–365.
53 R. Woods, in Electroanalytical chemistry, ed. A. J. Bard,Marcel Dekker, INC., New York, 1976, vol. 9.
54 D. M. Kolb, Electrochim. Acta, 2000, 45, 2387–2402.55 Y. Wang, E. Laborda, A. Crossley and R. G. Compton, Phys.
Chem. Chem. Phys., 2013, 15, 3133–3136.56 L. D. Burke and P. F. Nugent, J. Electroanal. Chem., 1998,
444, 19–29.57 K. J. Vetter and F. Gorn, Electrochim. Acta, 1973, 18,
321–326.58 B. E. Conway, B. Barnett, H. Angerstein-Kozlowska and B.
V. Tilak, J. Chem. Phys., 1990, 93, 8361–8373.59 M. M. Lohrengel and J. W. Schultze, Electrochim. Acta, 1976,
21, 957–965.60 N. Cabrera and N. F. Mott, Rep. Prog. Phys., 1949, 12, 163.61 M. Pourbaix, Atlas of electrochemical equilibria in aqueous
solutions, National Association of Corrosion Engineers,1974.
62 O. Diaz-Morales, F. Calle-Vallejo, C. de Munck and M. T.M. Koper, Chem. Sci., 2013, 4, 2334–2343.
16526 | RSC Adv., 2013, 3, 16516–16527 This journal is � The Royal Society of Chemistry 2013
Paper RSC Advances
Ope
n A
cces
s A
rtic
le. P
ublis
hed
on 0
8 Ju
ly 2
013.
Dow
nloa
ded
on 2
0/11
/201
3 02
:56:
54.
Thi
s ar
ticle
is li
cens
ed u
nder
a C
reat
ive
Com
mon
s A
ttrib
utio
n 3.
0 U
npor
ted
Lic
ence
.View Article Online

63 M. Wohlfahrt-Mehrens and J. Heitbaum, J. Electroanal.Chem., 1987, 237, 251–260.
64 J. Willsau, O. Wolter and J. Heitbaum, J. Electroanal. Chem.,1985, 195, 299–306.
65 B. V. Ershler, Dokl. Akad. Nauk SSSR, 1942, 37, 258–261.66 B. V. Ershler, Dokl. Akad. Nauk SSSR, 1942, 37, 262–264.67 V. M. Byakov, M. L. Ezerskii, A. M. Skundin and G.
V. Steinberg, Russ. J. Electrochem., 2009, 45, 2–10.68 V. S. Bagotsky, Fundamentals of Electrochemistry, Wiley,
2005.
69 A. N. Chemodanov and I. M. July, Zashita metallov(Protection of metals), 1991, 27, 658–666.
70 A. M. Nowicka, U. Hasse, M. Hermes and F. Scholz, Angew.Chem., Int. Ed., 2010, 49, 1061–1063.
71 A. M. Nowicka, U. Hasse, G. Sievers, M. Donten, Z. Stojek,S. Fletcher and F. Scholz, Angew. Chem., Int. Ed., 2010, 49,3006–3009.
72 G. Sievers, U. Hasse and F. Scholz, J. Solid StateElectrochem., 2011, 16, 1663–1673.
This journal is � The Royal Society of Chemistry 2013 RSC Adv., 2013, 3, 16516–16527 | 16527
RSC Advances Paper
Ope
n A
cces
s A
rtic
le. P
ublis
hed
on 0
8 Ju
ly 2
013.
Dow
nloa
ded
on 2
0/11
/201
3 02
:56:
54.
Thi
s ar
ticle
is li
cens
ed u
nder
a C
reat
ive
Com
mon
s A
ttrib
utio
n 3.
0 U
npor
ted
Lic
ence
.View Article Online