Embed Size (px)
Citation preview

arX
iv:1
110.
4057
v3 [
astr
o-ph
.CO
] 1
4 A
ug 2
012
Accepted for publication in the Astrophysical JournalPreprint typeset using LATEX style emulateapj v. 5/2/11
GOODS-HERSCHEL AND CANDELS: THE MORPHOLOGIES OF ULTRALUMINOUS INFRARED GALAXIESAT Z ∼ 2 ⋆
Jeyhan S. Kartaltepe1,2, Mark Dickinson2, David M. Alexander3, Eric F. Bell4, Tomas Dahlen5, David Elbaz6,S. M. Faber7, Jennifer Lotz5, Daniel H. McIntosh8, Tommy Wiklind6, Bruno Altieri10, Herve Aussel7, MatthieuBethermin7, Frederic Bournaud7, Vassilis Charmandaris11,12,13, Christopher J. Conselice14, Asantha Cooray15,Helmut Dannerbauer7,16, Romeel Dave17, James Dunlop18, Avishai Dekel19 Henry C. Ferguson5, Norman A.Grogin5, Ho Seong Hwang7, Rob Ivison20, Dale Kocevski8, Anton Koekemoer5, David C. Koo8, Kamson Lai8,Roger Leiton7, Ray A. Lucas19, Dieter Lutz21, Georgios Magdis22, Benjamin Magnelli21, Glenn Morrison23,24,Mark Mozena8, James Mullaney7, Jeffrey Allen Newman25, Alexandra Pope26, Paola Popesso21, Arjen van
der Wel27, Benjamin Weiner17, Stijn Wuyts28
Accepted for publication in the Astrophysical Journal
ABSTRACT
Using deep 100 and 160µm observations in GOODS-South from GOODS-Herschel, combined withhigh resolution HST/WFC3 near-infrared imaging from CANDELS, we present the first detailed mor-phological analysis of a complete, far-infrared (FIR) selected sample of 52 Ultraluminous InfraredGalaxies (ULIRGs: LIR > 1012L⊙) at z ∼ 2. We also make use of a comparison sample of galaxieswith lower IR luminosities but with the same redshift and H-band magnitude distribution. Our vi-sual classifications of these two samples indicate that the fractions of objects with disk and spheroidmorphologies are roughly the same but that there are significantly more mergers, interactions, andirregular galaxies among the ULIRGs (72+5
−7% versus 32± 3%). The combination of disk and irregu-lar/interacting morphologies suggests that early stage interactions, minor mergers, and disk instabil-ities could play an important role in ULIRGs at z ∼ 2. We compare these fractions with those of az ∼ 1 sample selected from GOODS-H and COSMOS across a wide luminosity range and find thatthe fraction of disks decreases systematically with LIR while the fraction of mergers and interactionsincreases, as has been observed locally. At comparable luminosities, the fraction of ULIRGs withvarious morphological classifications is similar at z ∼ 2 and z ∼ 1, though there are slightly fewermergers and slightly more disks at higher redshift. We investigate the position of the z ∼ 2 ULIRGs,along with 70 z ∼ 2 LIRGs, on the specific star formation rate versus redshift plane, and find 52systems to be starbursts (i.e., they lie more than a factor of three above the main sequence relation).We find that many of these systems are clear interactions and mergers (∼ 50%) compared to only 24%of systems on the main sequence relation. If irregular disks are included as potential minor mergers,then we find that up to ∼ 73% of starbursts are involved in a merger or interaction at some level.Although the final coalescence of a major merger may not be required for the high luminosities ofULIRGs at z ∼ 2 as is the case locally, the large fraction (50 − 73%) of interactions at all stagesand potential minor mergers suggests that these processes contribute significantly to the high starformation rates of ULIRGs at z ∼ 2.Subject headings: Galaxies: evolution – Galaxies: active – Galaxies: starburst – Infrared: galaxies
⋆ Herschel is an ESA space observatory with science in-struments provided by European-led Principal Investigatorconsortia and with important participation from NASA.
1 Hubble Fellow, email: [email protected] National Optical Astronomy Observatory, 950 N. Cherry
Ave., Tucson, AZ, 857193 Department of Physics, Durham University, Durham DH1
3LE, UK4 Department of Astronomy, University of Michigan, 500
Church St., Ann Arbor, MI 481095 Space Telescope Science Institute, 3700 San Martin Drive,
Baltimore, MD 212186 Joing ALMA Observatory, ESO, Santiago, Chile7 Laboratoire AIM-Paris-Saclay, CEA/DSM/Irfu - CNRS -
Universite Paris Diderot, CE-Saclay, F-91191 Gif-sur-Yvette,France
8 University of California Observatories/Lick Observatory,University of California, Santa Cruz, CA 95064, USA
9 Department of Physics & Astronomy, University of Missouri-Kansas City, 5110 Rockhill Road, Kansas City, MO 64110, USA
10 Herschel Science Centre, European Space AstronomyCentre, Villanueva de la Canada, 28691 Madrid, Spain
11 Department of Physics and Institute of Theoretical &Computational Physics, University of Crete, GR-71003, Herak-
lion, Greece12 IESL/Foundation for Research & Technology-Hellas,
GR-71110, Heraklion, Greece13 Chercheur Associe, Observatoire de Paris, F-75014, Paris,
France14 School of Physics & Astronomy, University of Nottingham,
Nottingham NG7 2RD15 Department of Physics & Astronomy, University of Cali-
fornia, Irvine, CA 9269716 Universitat Wien, Institut fur Astrophysik,
Turkenschanzstraße 17, 1180 Wien, Austria17 Steward Observatory, University of Arizona, 933 North
Cherry Avenue, Tucson, AZ 8572118 University of Edinburgh, Institute for Astronomy19 Racah Institute of Physics, The Hebrew University,
Jerusalem 91904, Israel20 UK Astronomy Technology Centre, Science and Technology
Facilities Council, Royal Observatory, Blackford Hill, EdinburghEH9 3HJ
21 Max-Planck-Institut fur Extraterrestrische Physik (MPE),Postfach 1312, 85741, Garching, Germany
22 Department of Physics, University of Oxford, Keble Road,Oxford OX1 3RH

2 Kartaltepe et al.
1. INTRODUCTION
Since their initial discovery by IRAS, luminous andultraluminous infrared galaxies ((U)LIRGs: LIR >1011, 1012L⊙ – see review by Sanders & Mirabel (1996))have been considered an important transition stagebetween gas-rich spiral galaxies and massive ellipticalgalaxies and quasars (Sanders et al. 1988). Studies oftheir morphologies showed that the infrared luminosityof such systems is correlated with their merger stage,such that lower luminosity LIRGs (LIR . 1011.5L⊙) areordinary disks while higher luminosity LIRGs (LIR &1011.5L⊙) are interactions and the highest luminositysystems (ULIRGs) are at an advanced merging stage(Veilleux et al. 2002; Ishida 2004). Since then, inves-tigations at higher redshift with Spitzer and now Her-schel have shown that while rare locally, (U)LIRGs wereonce much more common and even dominated the cos-mic star formation rate at z > 1 (e.g., Floc’h et al. 2005;Caputi et al. 2007; Magnelli et al. 2009; Magnelli et al.2011; Bethermin et al. 2011; Murphy et al. 2011).How do these high redshift (U)LIRGs compare to
their local counterparts? Investigations at z ∼ 1 (e.g.,Zheng et al. 2004; Bell et al. 2005; Bridge et al. 2007;Shi et al. 2006, 2009; Kartaltepe et al. 2010b) have founda similar trend between galaxy morphology and totalinfrared luminosity, with sources at the highest lumi-nosities dominated by major mergers. Initial attemptsat even higher redshift (z ∼ 2), at the peak of galaxyassembly, have so far proven difficult and such studieshave been affected by small number statistics, morpho-logical k-corrections, different methods for identifyinggalaxy mergers, and various selection effects. Morpho-logical analyses at z > 1 are difficult for several rea-sons. The effects of surface brightness dimming makeobjects very faint and identifying low surface brightnessfeatures (such as tidal tails and debris) becomes problem-atic (e.g., Hibbard & Vacca 1997). In addition, at theseredshifts optical images probe the rest-frame ultraviolet(UV) light in galaxies, which traces regions of active starformation but not the older stellar populations neededto discern the true structure of these galaxies and is sub-ject to heavy dust obscuration. Indeed, studies of local(U)LIRGs from the GOALS survey have found that ob-scuration is more pronounced in ULIRGs and that manydouble nuclei are hidden even in the rest-frame optical(though they appear in the NIR - Haan et a. 2011).Ideally, near infrared imaging is needed for a direct com-parison of z ∼ 2 rest-frame optical morphologies withgalaxies at lower redshift. However, prior to WFC3 onHST, this has only been possible for small numbers of ob-jects using adaptive optics from the ground or NICMOSon HST.
23 Institute for Astronomy, University of Hawaii, Honolulu,HI, 96822, USA
24 Canada-France-Hawaii telescope corporation, 65-1238Mamalahoa Hwy, Kamuela, Hawaii 96743, USA
25 Department of Physics and Astronomy, University ofPittsburgh, 3941 OHara Street, Pittsburgh, PA 15260
26 Department of Astronomy, University of Massachusetts,Amherst, MA 01003, USA
27 Max-Planck Institut fur Astronomie, Konigstuhl 17,D-69117, Heidelberg, Germany
28 Max-Planck-Institut fur extraterrestrische Physik, Giessen-bachstrasse 1, D–85748 Garching bei Munchen, Germany
Such studies have found a wide range of results, frommergers being a dominant process (e.g., Dasyra et al.2008; Bussmann et al. 2011; Zamojski et al. 2011) tomergers playing a fairly minor role (e.g., Melbourne et al.2009; Targett et al. 2011). The latter results have beenintriguing because they suggest that there has been ashift in the driver of star formation in ULIRGs with red-shift. Such an idea has been supported by some nu-merical simulations that suggest that at high redshift,mergers are not necessary for the extreme luminositiesof these systems but that instead such high star forma-tion rates can be maintained by the steady-state accre-tion of cold gas onto star forming disks (e.g., Dekel et al.2009a,b; Dave et al. 2010). In such a scenario, the mor-phologies of high redshift ULIRGs would appear as or-dinary disk-dominated systems or possibly as irregular“clumpy” disks. However, other simulations do lendsupport to the idea that mergers play a crucial role inhigh-redshift ULIRGs (e.g., Chakrabarti et al. 2008;Narayanan et al. 2009, 2010; Hopkins et al. 2010). Astudy by Rujopakarn et al. (2011) found that the spa-tial extent of star formation in high redshift ULIRGsmore closely matches that of local LIRGs rather thanthe high concentrations observed in local ULIRGs, sup-porting the idea that the driver of these high star forma-tion rates evolves with redshift. To further complicatethis picture, kinematic studies of BzK selected galaxies(that span a wide range of LIR) have found evidence fordisk-like rotation and clumpy disks (e.g., Genzel et al.2008; Daddi et al. 2010) while similar studies of submil-limeter galaxies (typically more luminous than BzK se-lected galaxies) have found evidence for mergers (e.g.,Tacconi et al. 2008; Engel et al. 2010).While these early results have been intriguing, discrep-
ancies among the different studies have raised many ques-tions and a clear picture has not yet emerged. One rea-son for the differing results has been that each studyhas adopted a different definition and way of identifyinggalaxy mergers, including identifying separated pairs ofgalaxies based on redshift information (e.g., Bridge et al.2007), searching for merger signatures via visual classi-fication (e.g., Dasyra et al. 2008, Zamojski et al. 2011,Kartaltepe et al. 2010b), using various automated clas-sification methods (such as asymmetry [e.g., Conselice etal. 2003] and location on the Gini-M20 plane [e.g., Lotzet al. 2008]), and measures of galaxy kinematics (e.g.,Genzel et al. 2008, Melbourne et al. 2009). Other stud-ies use automated measures, such as a galaxy’s Sersicindex, to infer the lack of galaxy mergers (e.g., Targettet al. 2011). All of these different methods for identifyingmergers make the results from each of the various stud-ies difficult to directly compare to one another, at leastin part because each one is sensitive to different mergerstages and each has different levels of detectability as afunction of redshift. In order to put together a clear pic-ture, the same criteria for identifying galaxy mergers isneeded across a wide luminosity range for a large sampleof objects.Another difficulty has been the selection effects of the
various studies. In order to construct an unbiased sam-ple of ULIRGs at high redshift and therefore obtain acomplete picture of their properties, one would ideallyselect objects based on data in the far-infrared (FIR)near the peak of emission. This has been possible for

GOODS:H & CANDELS: z ∼ 2 ULIRGs 3
small samples using MIPS 70µm imaging with Spitzer(e.g., Symeonidis et al. 2008; Kartaltepe et al. 2010a),however, MIPS 70µm lacked the sensitivity and reso-lution to detect anything but the most extreme sys-tems at z ∼ 2, and by z ∼ 2, no longer probes thepeak of emission. Submillimeter surveys have also beenused (e.g., Conselice et al. 2003; Tacconi et al. 2008;Swinbank et al. 2010), but tend to pick out extreme sys-tems at high redshift with a bias toward cold dust emis-sion (Pope et al. 2006). With a lack of deep FIR data,most of these previous studies have had to rely on either24µm selection (e.g., Dasyra et al. 2008; Zamojski et al.2011), known to be biased toward obscured AGN (e.g.,Sajina et al. 2007) or various color selection techniques(BzK selection: Daddi et al. 2004; DOGs: Dey et al.2008, etc.), which identify objects over a wide range ofinfrared luminosities, resulting in a muddled picture ofthe nature of high redshift ULIRGs.Without the addition of far-infrared data to the SED,
it is difficult to determine an accurate total infrared lu-minosity. Several studies have shown that using 24µmdata alone and determining a total infrared luminositybased on locally-calibrated SED templates results in anover estimate (e.g., Papovich et al. 2007; Nordon et al.2010; Elbaz et al. 2010, 2011; Kartaltepe et al. 2010a) atz ∼ 2. Obtaining FIR-submillimeter data points for largesamples of objects has previously been difficult and timeconsuming or has required the use of stacking.New surveys have completely changed this situa-
tion. Deep far-infrared imaging is now availableat 70–500µm from the Herschel Space Observatory(Pilbratt et al. 2010). In particular, the GOODS-Herschel survey (Elbaz et al. 2011) has obtained thedeepest 100 and 160µm imaging with the PACS instru-ment (Poglitsch et al. 2010) over the central region ofthe GOODS-S field. These data have allowed us to con-struct a complete, flux-limited sample of ULIRGs outto z ∼ 3 with accurate total infrared luminosities forthe first time. In addition, many LIRGs, though incom-plete, are detected over this redshift range. This field hasbeen imaged in its entirety (along with several other deepfields) in the near-infrared using WFC3 on HST by theCANDELS survey (Grogin et al. 2011; Koekemoer et al.2011), providing deep, high resolution, rest-frame opticalimaging for our entire sample of high-redshift ULIRGs.Here, we analyze the morphologies of this complete sam-ple and discuss how the role of galaxy mergers in the for-mation of massive galaxies and their stars has changedover cosmic time.This paper is organized as follows: Section 2 introduces
the two surveys used here and describes our sample se-lection. In Section 3 we present our comparison samplesand Section 4 presents our visual classification scheme.We present our results in Section 5 and discuss their im-plications in Section 6. We summarize our findings inSection 7. Throughout this paper we assume a ΛCDMcosmology with H0 = 70km s−1 Mpc−1, ΩΛ = 0.7, andΩm = 0.3. All magnitudes are in the AB system unlessotherwise stated.
2. OBSERVATIONS AND SAMPLE SELECTION
2.1. GOODS-Herschel
The sample of high-redshift ULIRGs analyzed in thispaper comes from observations of the Great Observato-ries Origins Deep Survey (GOODS) Southern field takenwith the Herschel Space Observatory as a part of theGOODS-Herschel open time key program (GOODS-H:PI Elbaz). These observations cover a total area of10′ × 10′ with the deepest region (down to depths of 0.8and 2.4mJy (3σ) at 100 and 160µm, respectively) cover-ing 64′2. These observations are the deepest undertakenby Herschel to date. In addition, we use the GOODS-Hobservations of the GOODS-N field for the z ∼ 1 compar-ison sample (see §3). These observations cover an areaof 10′ × 16′ down to depths of 1.1 and 2.7mJy (3 σ). Acatalog of the flux densities and their uncertainties wereobtained from point source fitting based on the knownprior positions of MIPS 24µm sources in the field, whichwere in turn extracted based on IRAC prior positions.For a detailed description of GOODS-H, the source ex-traction, and photometry, see Elbaz et al. (2011).In addition to the GOODS-Herschel data, we make
use of the full multiwavelength data set available forGOODS-S, including optical HST-ACS images andphotometry (Giavalisco et al. 2004), ground-based NIRphotometry (Retzlaff et al. 2010), and IRAC (3.6–8.0µm) and MIPS (24–70µm) photometry from Spitzer(Magnelli et al. 2011). We use a catalog of z-band se-lected objects with photometry in all of the optical-NIRbands measured using TFIT (Laidler et al. 2007). Foreach object detected at either 100 or 160µm, we matchedthe IRAC position from the prior-based catalog to an op-tical counterpart in the TFIT catalog. For each source,we used a spectroscopic redshift if available (for 73%of the sources) and a photometric redshift derived us-ing SED template fits to the UV-IR TFIT photometryfor the rest (cf. Dahlen et al. 2010). We derived stel-lar masses for each (U)LIRG in our sample by fittingBruzual & Charlot (2003) models to the observed data,fixing the redshift to either the spectroscopic or photo-metric redshift. The SED models span a large parame-ter space in terms of age, extinction, star formation his-tory, and metallicity. The masses were derived using aChabrier (2003) initial mass function.We determined the total infrared luminosity, LIR
(rest-frame 8–1000µm), for each source by fittingthe MIR-FIR SED (using the MIPS 24µm, 70µm[where available], PACS 100µm and 160µm pho-tometry) with several different template libraries(Chary & Elbaz 2001; Dale & Helou 2002; Lagache et al.2003; Siebenmorgen & Krugel 2007) using the SED fit-ting code Le Phare30 written by S. Arnouts and O. Il-bert. For each template library, the best fit model waschosen by finding the one with the lowest χ2 value andallowing for rescaling of the templates. Each of thedata points was weighted equally to avoid overweight-ing points with the smallest error bars (typically 24µm).The total infrared luminosity was then calculated fromthe best fit template by integrating from 8–1000µm.The vast majority of the sources were best fit using theSiebenmorgen & Krugel (2007) library, which is based onradiative transfer models and spans a wide range of tem-plate shapes. We note that the value of LIR determined
30 http: //www.cfht.hawaii.edu/∼arnouts/LEPHARE/cfht lephare/lephare.html

4 Kartaltepe et al.
Figure 1. Total infrared luminosity (LIR) as a function of redshiftfor all of the 100 and 160 µm detected galaxies in GOODS-S fromthe GOODS-Herschel survey. The dividing luminosities for LIRGs(LIR > 1011 L⊙) and ULIRGs (LIR > 1012 L⊙) are shown as thehorizontal dashed lines and the dash-dot vertical lines highlight theredshift range of our sample (1.5 < z < 3.0).
from the Siebenmorgen & Krugel (2007) library agreeswell (within the associated error bars) with the value ob-tained using the other template libraries when allowingfor rescaling (see discussion in Kartaltepe et al. 2010a).The final value of LIR is shown in Figure 1 as a func-
tion of redshift with the LIRG and ULIRG luminositylimits highlighted. We selected an upper limit of z = 3since beyond this redshift, the ULIRG sample becomesincomplete and to ensure that the NIR imaging sam-ples the rest-frame optical light. The lower limit ofz = 1.5 was chosen since there are very few ULIRGsat lower redshifts and to distinguish from our z ∼ 1comparison sample. These limits select a complete sam-ple of 52 ULIRGs with 〈LIR〉 = 1012.3L⊙ and 〈z〉 =2.2. Spectroscopic redshifts are available for 45% of thesample in this redshift range (from Szokoly et al. 2004;Kriek et al. 2008; Vanzella et al. 2008; Balestra et al.2010; Silverman et al. 2010; Fadda et al. 2010; Wuyts etal. 2009; Kurk et al., submitted). In addition to theULIRG sample, there are 70 LIRGs over this same red-shift range with 〈LIR〉 = 1011.7L⊙ and 〈z〉 = 1.8. TheLIRG sample is incomplete and includes only the mostluminous LIRGs at the high redshift end.
2.2. CANDELS
The Cosmic Assembly Near-Infrared Dark EnergyLegacy Survey (CANDELS: PIs Faber & Ferguson; seeGrogin et al. 2011 and Koekemoer et al. 2011) is an HSTMulti-Cycle Treasury Program to image portions of fivedifferent legacy fields (GOODS-N, GOODS-S, COSMOS,UDS, and EGS) with the Wide Field Camera 3 (WFC3)in the NIR. The survey is observing all five fields to 2-orbit depth in F125W (J-band, 2/3 orbit) and F160W(H-band, 4/3 orbits) and the central regions of GOODS-N and GOODS-S to 13 orbit depth in these bands aswell as F105W (Y-band). For details on the full CAN-DELS survey, see Grogin et al. (2011). In addition to theCANDELS observations, a portion of GOODS-S was also
observed as a part of the Early Release Science (ERS)campaign in J and H. In this paper, we focus on the full(CANDELS+ERS) data set in GOODS-S.The CANDELS GOODS-S observations began in Oct.
2010 and were completed in Feb. 2012. For this paper,we use the 2-orbit depth observations over the entire fieldfor uniformity. The images were reduced and drizzled toa 0.06′′ pixel scale to create a full 2-orbit depth mosaic.The details of the data reduction pipeline are describedin Koekemoer et al. (2011). The WFC3 photometry inboth J and H bands were measured using SExtractorversion 2.5.0 (Bertin & Arnouts 1996) in a ‘cold mode’setup (see, for example, Rix et al. 2004) found to workbest for extracting z ∼ 2 galaxies. All but one of theLIRGs and ULIRGs in our sample are detected in theCANDELS mosaics (one of the ULIRGs falls just off theedge so we remove it from our final sample).
3. COMPARISON SAMPLES
In order to put our results in an evolutionary context,we constructed two different comparison samples. Oneis a sample of less luminous galaxies at z ∼ 2 and theother is a sample of LIRGs and ULIRGs at z ∼ 1. Usingthe H-band selected SExtractor catalog, matched to thez-band selected TFIT and photometric redshift catalog,we selected a sample of objects with the same redshiftand H-band magnitude distribution as the z ∼ 2 ULIRGpopulation. These objects are meant to sample the lessluminous general z ∼ 2 galaxy population. We excludedall Herschel detected galaxies from this comparison sam-ple to ensure that we are excluding ULIRGs and lumi-nous LIRGs down to the flux limits of the GOODS-Hdata (LIR . 1011.5L⊙). We selected five galaxies foreach ULIRG in our sample giving us a final comparisonsample of 260 galaxies. The redshift and H magnitudedistributions of the ULIRG and comparison samples areshown in Figure 2. It is important to note that this com-parison sample is not matched to the stellar mass distri-bution of the ULIRG sample since the ULIRGs dominateat the high mass end. There are not enough high massgalaxies at z ∼ 2 that are not ULIRGs since most mas-sive galaxies at z ∼ 2 are ULIRGs (see, e.g., Daddi et al.2005). The median stellar mass of the ULIRG sampleis 1010.8M⊙ while the comparison sample has a medianstellar mass of 1010.4M⊙.For the sample of z ∼ 1 (U)LIRGs, we combined the
GOODS-H observations with a sample of MIPS 70µm se-lected galaxies from the COSMOS survey (Scoville et al.2007; Frayer et al. 2009). The 70µm selected samplecontains 1503 galaxies across the entire COSMOS fieldwith LIR measured using the same procedure as theGOODS-H galaxies (Kartaltepe et al. 2010a). For thez ∼ 1 comparison, we selected all galaxies from thesethree fields (GOODS-N, GOODS-S, and COSMOS) with0.8 < z < 1.2, as illustrated in Figure 3. Since theGOODS-H data are deep but cover a small field and theCOSMOS-70µm data are shallow but cover the largeCOSMOS field, by combining these data sets, we areable to sample over two orders of magnitude in luminos-ity, log(LIR/L⊙) = 10.6− 12.9. This comparison sampleallows us to look for trends across this full range in lu-minosity at a fixed redshift to compare with our resultsat z ∼ 2. This sample contains a total of 569 galaxies,all with HST/ACS optical imaging.
GOODS:H & CANDELS: z ∼ 2 ULIRGs 5
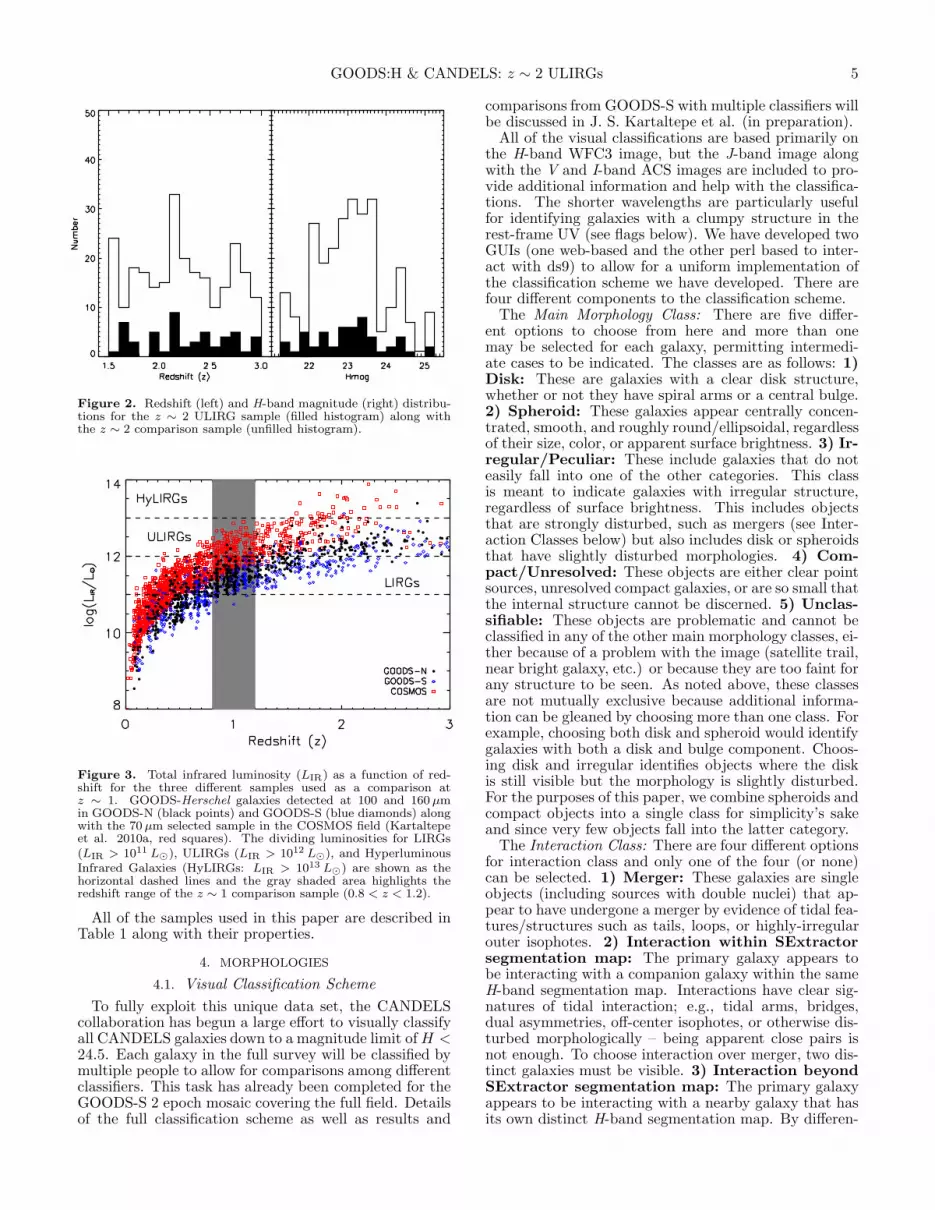
Figure 2. Redshift (left) and H-band magnitude (right) distribu-tions for the z ∼ 2 ULIRG sample (filled histogram) along withthe z ∼ 2 comparison sample (unfilled histogram).
Figure 3. Total infrared luminosity (LIR) as a function of red-shift for the three different samples used as a comparison atz ∼ 1. GOODS-Herschel galaxies detected at 100 and 160 µmin GOODS-N (black points) and GOODS-S (blue diamonds) alongwith the 70µm selected sample in the COSMOS field (Kartaltepeet al. 2010a, red squares). The dividing luminosities for LIRGs(LIR > 1011 L⊙), ULIRGs (LIR > 1012 L⊙), and HyperluminousInfrared Galaxies (HyLIRGs: LIR > 1013 L⊙) are shown as thehorizontal dashed lines and the gray shaded area highlights theredshift range of the z ∼ 1 comparison sample (0.8 < z < 1.2).
All of the samples used in this paper are described inTable 1 along with their properties.
4. MORPHOLOGIES
4.1. Visual Classification Scheme
To fully exploit this unique data set, the CANDELScollaboration has begun a large effort to visually classifyall CANDELS galaxies down to a magnitude limit ofH <24.5. Each galaxy in the full survey will be classified bymultiple people to allow for comparisons among differentclassifiers. This task has already been completed for theGOODS-S 2 epoch mosaic covering the full field. Detailsof the full classification scheme as well as results and
comparisons from GOODS-S with multiple classifiers willbe discussed in J. S. Kartaltepe et al. (in preparation).All of the visual classifications are based primarily on
the H-band WFC3 image, but the J-band image alongwith the V and I-band ACS images are included to pro-vide additional information and help with the classifica-tions. The shorter wavelengths are particularly usefulfor identifying galaxies with a clumpy structure in therest-frame UV (see flags below). We have developed twoGUIs (one web-based and the other perl based to inter-act with ds9) to allow for a uniform implementation ofthe classification scheme we have developed. There arefour different components to the classification scheme.The Main Morphology Class: There are five differ-
ent options to choose from here and more than onemay be selected for each galaxy, permitting intermedi-ate cases to be indicated. The classes are as follows: 1)Disk: These are galaxies with a clear disk structure,whether or not they have spiral arms or a central bulge.2) Spheroid: These galaxies appear centrally concen-trated, smooth, and roughly round/ellipsoidal, regardlessof their size, color, or apparent surface brightness. 3) Ir-regular/Peculiar: These include galaxies that do noteasily fall into one of the other categories. This classis meant to indicate galaxies with irregular structure,regardless of surface brightness. This includes objectsthat are strongly disturbed, such as mergers (see Inter-action Classes below) but also includes disk or spheroidsthat have slightly disturbed morphologies. 4) Com-pact/Unresolved: These objects are either clear pointsources, unresolved compact galaxies, or are so small thatthe internal structure cannot be discerned. 5) Unclas-sifiable: These objects are problematic and cannot beclassified in any of the other main morphology classes, ei-ther because of a problem with the image (satellite trail,near bright galaxy, etc.) or because they are too faint forany structure to be seen. As noted above, these classesare not mutually exclusive because additional informa-tion can be gleaned by choosing more than one class. Forexample, choosing both disk and spheroid would identifygalaxies with both a disk and bulge component. Choos-ing disk and irregular identifies objects where the diskis still visible but the morphology is slightly disturbed.For the purposes of this paper, we combine spheroids andcompact objects into a single class for simplicity’s sakeand since very few objects fall into the latter category.The Interaction Class: There are four different options
for interaction class and only one of the four (or none)can be selected. 1) Merger: These galaxies are singleobjects (including sources with double nuclei) that ap-pear to have undergone a merger by evidence of tidal fea-tures/structures such as tails, loops, or highly-irregularouter isophotes. 2) Interaction within SExtractorsegmentation map: The primary galaxy appears tobe interacting with a companion galaxy within the sameH-band segmentation map. Interactions have clear sig-natures of tidal interaction; e.g., tidal arms, bridges,dual asymmetries, off-center isophotes, or otherwise dis-turbed morphologically – being apparent close pairs isnot enough. To choose interaction over merger, two dis-tinct galaxies must be visible. 3) Interaction beyondSExtractor segmentation map: The primary galaxyappears to be interacting with a nearby galaxy that hasits own distinct H-band segmentation map. By differen-

6 Kartaltepe et al.
Disk Spheroid Disk+Spheroid
Irregular Disk + Irr Spheroid+Irr
Interaction Disk + Inter. Merger
Figure 4. Sample HST-WFC3 F160W postage stamps of z ∼ 2galaxies in each of the visual morphology classes.
tiating between interactions within and beyond the seg-mentation map we can identify galaxies with possible de-blending problems. 4) Non-interacting companion:These galaxies have a close companion (in projection),yet no evidence of tidal interaction or disturbed mor-phology is apparent. For the purposes of this paper, wecombine the two interaction categories into one and donot use the Non-interacting companion category. There-fore, the two interaction classes of interest are mergerand interaction.In addition to the above, there are also Structural Flags
and Clumpiness Flags. Classifiers noted objects with thefollowing properties that are relevant to the discussionin this paper: Tidal tails, double nuclei, asymmetric ob-jects, and degree of clumpiness. Further details on theseflags and others will be discussed in J. S. Kartaltepe etal. (in preparation).All of the galaxies in the LIRG, ULIRG, and compar-
ison samples (i.e., all of the samples discussed in thispaper) were classified by JSK using the above scheme.Figure 4 shows a sample z ∼ 2 object in each of themorphological categories. For the z ∼ 2 galaxies, allof the (U)LIRGs and comparison sample galaxies wererandomized before being classified, to avoid any poten-tial bias in the classifications. In addition, classificationswere obtained for the z ∼ 2 galaxies from the CANDELSteam visual classification effort (for both the (U)LIRGand comparison sample), resulting in a total of 3 − 5classifications per galaxy (for galaxies with H < 24.5).For the z ∼ 1 COSMOS (U)LIRGs, the classificationsof Kartaltepe et al. (2010b), based on the F814W im-ages, were used and transformed to the above scheme,while the I-band ACS images of the GOODS-H z ∼ 1(U)LIRGs were classified separately by JSK. By usingthe I-band images at z ∼ 1 and the H-band images atz ∼ 2, we ensure that we are probing each galaxy’s struc-ture at approximately the same rest-frame wavelength.
4.2. GALFIT
In addition to the visual classifications for each galaxy,we also made quantitative measures of the galaxy mor-phology using the GALFIT routine (Peng et al. 2002).GALFIT fits the two-dimensional galaxy light profile inan image using a χ2 minimization routine to estimate thebest-fit Sersic profile of the galaxy. We used the H-bandWFC3 image and a single PSF generated with TinyTim(Krist & Hook 2011) for all objects. Reliable fits (objectsin noisy areas of the mosaic were not fit and we excludedobjects with unrealistic parameters) were obtained for47/52 of the z ∼ 2 ULIRGs and 201 galaxies in the com-parison sample. For all of these objects, we obtainedmeasurements of the Sersic index (n, where n = 0.5 cor-responds to a Gaussian profile, n = 1 to an exponentialprofile, and n = 4 to a de Vaucouleurs profile) and theeffective radius.
5. RESULTS
We compared the results of the different classifiers foreach object in the ULIRG and comparison sample. Forthe most part, there is good agreement among the clas-sifiers. In particular, the classifiers agree whether some-thing is “normal” (i.e., a disk or a spheroid), or “dis-turbed” (irregular, or a merger/interaction). The highestlevel of disagreement appears to exist between whetheran object is a disk, spheroid, or both. This disagreementoccurs for low surface-brightness galaxies where the disk,if present, is very hard to see and distinguish from thebulge component. To understand these differences, wecompared the visual classifications of JSK to the Ser-sic index measured using GALFIT for all of the objectsin both the (U)LIRG and z ∼ 2 comparison samples(Figure 5). We find that objects classified as only diskstend to have lower Sersic indices (〈n〉 = 1.3± 1.2) whilethose classified as only spheroids have higher indices(〈n〉 = 3.4± 1.8). Objects classified as both a disk and aspheroid have Sersic indices that match those classifiedonly as spheroids (〈n〉 = 3.4± 0.9) while those classifiedas irregulars tend to match the disks (〈n〉 = 1.1±0.8). Inorder to test how well various classifiers agree and inter-pret the morphological scheme, we had everyone classifythe same set of 200 galaxies so that we could identifyoutliers. We find that nearly all of the classifiers, includ-ing JSK, identify roughly the same number of objects asbelonging to a particular morphological class, i.e., JSKis as likely as all of the others to classify an object as agiven type. For the discussion and figures in this paper,we use the visual classifications of JSK and will discussmorphological comparisons among multiple classifiers inmore detail in a future paper (J. S. Kartaltepe et al., inpreparation). One advantage here is that by using theclassifications by the same classifier for all of the samplesin this paper, for CANDELS as well as the COSMOSz ∼ 1 sources, we ensure that the all of the galaxies areclassified in a uniform way.The main results of the visual classifications are shown
in Figure 6 and a montage of H-band postage stamp im-ages of all of the z ∼ 2 ULIRGs is shown in Figure 7.Plotted in Figure 6 is the percentage of objects in theULIRG sample as well as the z ∼ 2 comparison sam-ple in each morphological class. Since the morphologicalclasses are not mutually exclusive, the totals do not addup to 100%. The fractions of objects in both the ULIRGand comparison samples that are classified as disks or

GOODS:H & CANDELS: z ∼ 2 ULIRGs 7
Figure 5. Distribution of Sersic indices for the z ∼ 2 ULIRG andcomparison samples as measured using GALFIT on the F160WHST/WFC3 image. The histogram is color-coded by the mainmorphological class, divided by whether or not a spheroid or diskcomponent is present. The objects classified as disks only have amean Sersic index, 〈n〉 = 1.3±1.2 while those classified as spheroidsonly have a mean Sersic index, 〈n〉 = 3.4 ± 1.8, indicating thatthe visual classifications agree well with the results from GALFIT.Objects classified visually as having both a disk and a spheroidcomponent have a Sersic index that is consistent with that of thespheroid only objects, 〈n〉 = 3.4 ± 1.9. The objects classified asirregulars have a mean Sersic index of 〈n〉 = 1.1 ± 0.8, closer tothat of the disks.
spheroids are approximately the same. At first glance,this would seem to indicate that at z ∼ 2, ULIRGs arethe same morphologically as galaxies with lower infraredluminosities. However, there are significant differencesin the other categories, most strikingly in the ‘Irregular’class (64+6
−7% vs. 30±3%). The fraction of ULIRGs clas-sified as mergers is larger than in the comparison sample(15+6
−4% vs. 9+2−1%) but this difference may not be sig-
nificant given the small number of objects. The fractionof ULIRGs classified as interactions (32+7
−6%) is greater
than the fraction of comparison galaxies (5+2−1%) by a fac-
tor of six. The last category, ‘Combined’, encompassesall galaxies that could possibly be involved in an interac-tion or merger (the combination of mergers, interactions,and irregulars). In principle, all mergers and interactionswould be classified as irregular as well, but in practicethis does not always happen, particularly when the ob-ject is also classified as a disk or a spheroid. This is whythe final ’combined’ category contains a few more ob-jects than the ’Irregular’ category. Here, the differenceis quite large, 72+5
−7% for the ULIRGs versus 32 ± 3%for the comparison sample. It is intriguing that the dif-ference between the fractions classified as irregulars andinteractions is large while the fraction classified as disksis roughly the same. This is an indication that many ofthe ULIRGs were classified as both, and that while an in-teraction or merger might be taking place, the disk is stillpresent. This suggests that the role of minor and earlystage mergers could play an important role in ULIRGsat z ∼ 2.The effective radii determined from GALFIT for the
ULIRGs and z ∼ 2 comparison sample are shown inFigure 8. The ULIRGs have radii which range from0.9 − 9.5kpc with a median value of 3.3 kpc while the
Figure 6. Percentage of z ∼ 2 ULIRGs and comparison samplegalaxies (260 lower luminosity systems at the same redshift) ineach of the visual morphology classes. Note that since the classesare not mutually exclusive, the percentages do not sum to 100%.The combined category includes all objects classified as mergers,interactions, or irregulars. While the fraction of objects classifiedas disk or spheroid is about the same between the ULIRGs andcomparison sample, the fraction of objects classified as irregular orinteractions is significantly higher among the ULIRG sample. Theerror bars on each point reflect the 1σ binomial confidence limitsgiven the number of objects in each category, following the methodof Cameron et al. (2011).
comparison sample ranges from 0.3− 9.2 kpc with a me-dian of 2.5 kpc. A KS-test of the distributions shownin Figure 8 indicates that these two are not likely to bedrawn from the same distribution (P = 0.006). Thismeans that the ULIRGs are significantly more extendedthan the typical z ∼ 2 galaxy population. A similar anal-ysis of the distribution of Sersic indices finds that theULIRGs range from n = 0.2 − 6.8 with 〈n〉 = 1.8 ± 1.5and a median value of 1.4 while the comparison sampleranges from n = 0.2 − 7.8 with 〈n〉 = 2.2 ± 1.9 and amedian of 1.4. A KS test of these two samples indicatesthat they are consistent with being drawn from the samepopulation (P = 0.20). So while the ULIRGs are morespatially extended on average than the rest of the z ∼ 2population, they have similar profiles and bulge to diskratios. This result is consistent with the ULIRGs beingmore massive on average (and therefore larger) than thegalaxies in the z ∼ 2 comparison sample.
6. DISCUSSION
6.1. Evolution of ULIRG Morphology
In the local universe, the merger fraction among IRgalaxies increases systematically from ∼ 10% for objectswith log(LIR/L⊙) = 10.5 − 11.0 to 100% for ULIRGs,with objects in between, LIRGs, presenting a widerange of morphologies from star-forming disks, to minorand major interacting systems, to more advanced merg-ers (e.g., Ishida 2004; Veilleux et al. 2002; Hwang et al.2010; Haan et al. 2011). Most local ULIRGs are ad-vanced stage mergers with a single nucleus and thisfraction is nearly 100% for the most luminous ULIRGs(Veilleux et al. 2002). From this, it appears that the ex-treme environment of the final coalescence of a mergeris necessary to produce these high luminosities in the

8 Kartaltepe et al.
Figure 7. HST-WFC3 F160W postage stamps of our sample of 52 z ∼ 2 ULIRGs. Each stamp is 5′′ × 5′′.

GOODS:H & CANDELS: z ∼ 2 ULIRGs 9
Figure 8. Distribution of the H-band effective radii in kpc for thez ∼ 2 ULIRG sample (shaded region) and the comparison sample(unshaded). The mean value for the ULIRGs is 3.7 ± 1.7 kpc and2.8 ± 2.0 kpc for the comparison sample. A KS-test of the twosamples indicates that they are not likely to be drawn from thesame distribution (P = 0.006).
local universe. This is supported by numerical simu-lations that show that a galaxy’s star formation ratepeaks during the final coalescence of a merger (e.g.,Mihos & Hernquist 1996; Hopkins et al. 2006). Whilethe overall trend between merger fraction and infrared lu-minosity is similar at higher redshifts, ULIRGs at z ∼ 1span a wider range of interaction stages, with roughlyhalf at pre-coalescence (Kartaltepe et al. 2010b). Fromour results at z ∼ 2, this trend seems to continue. Forthese objects, we have seen that only ∼ 15% appear tobe late stage mergers, while 57% are comprised of inter-actions and irregular morphologies. The large fractionof interactions implies that the first passage of a mergeris sufficient to produce ULIRG luminosities, though notnecessary since many show no signs of major mergersor interactions. In addition, given the large fraction ofdisks with irregular morphologies, it is possible that evenminor mergers play a significant role in increasing the lu-minosity at z ∼ 2.A comparison of z ∼ 2 and z ∼ 1 morphologies is
shown in Figure 9. Plotted is the fraction of objectsin various morphological classes as a function of LIR.The dotted points connected by colored lines come fromthe full z ∼ 1 comparison sample and the stars repre-sent the z ∼ 2 ULIRGs. Here, the visual morphologiesare divided into mutually exclusive categories to identifytrends. These categories are Non-interacting disks, con-taining all objects classified as disks but not as mergers orinteractions, Pure Spheroids, containing all objects clas-sified as a spheroid but not as a disk (all objects classifiedas both are in the disk category), Irregular only, contain-ing all objects classified as irregular, but not as a disk,merger, or interaction, and All mergers and interactions,containing all objects classified as a merger or an inter-action. In addition, shown in black is the total fractionof objects classified as a merger, interaction, or irregular.A few trends in the z ∼ 1 sample are clear. The frac-
tion of non-interacting disks (shown in blue) decreasesdramatically with infrared luminosity while the fractionof mergers and interactions increases. The fraction of
Figure 9. Fraction of objects in each morphological class as afunction of LIR for the z ∼ 2 ULIRGs (stars) and the z ∼ 1 com-parison sample (points). The fraction of objects classified as non-interacting disks decreases with LIR while the fraction of mergersand interactions increases. The fraction of spheroids and irregularonly objects remains the same over the full luminosity range. Thez ∼ 2 ULIRGs have nearly the same fractions as the ULIRGs atz ∼ 1, indicating that little evolution has occurred between thesetwo redshifts.
mergers and interactions among the z ∼ 2 ULIRGs isslightly lower than at z ∼ 1 while the fraction of non-interacting disks is slightly higher (at the ∼ 2σ level)at the same IR luminosity. This suggests that there isslight evolution between z ∼ 2 and z ∼ 1, in terms of thetotal fraction of objects involved in a merger or interac-tion, consistent with the evolution of the zero-point ofthe star-forming main sequence (see §6.3) between theseredshifts.The fraction of objects classified as pure spheroids or
irregular only is small, and remains roughly constantacross the full luminosity/redshift range. It is interest-ing to note that the difference between the mergers andinteractions trend (green) and the mergers, interactions,and irregular trend (black) is about the same across theentire luminosity range. The difference between thesetwo represents objects that are classified as both disksand irregular, which possibly represent the contributionfrom minor mergers. If so, we note that their contribu-tion appears to be the same at all infrared luminosities.Within error, this difference also seems to be the samefor z ∼ 2 ULIRGs, although, as noted before, they seemto contribute less to the z ∼ 2 comparison sample (withLIR . 1011.5). An alternative possibility is that theseirregular disks represent the ‘clumpy’ disks predicted bynumerical simulations of cold flows (e.g., Bournaud &Elmegreen 2009; Dekel et al. 2009b). We note, how-ever, that although we cannot distinguish between thesetwo possibilities using morphology alone, these irregulardisks are more likely to be asymmetric than clumpy, asindicated by our structural flags described in §4.
6.2. Comparison with Previous Results
Early work on the light profiles of local ULIRGs sug-gested that they followed an elliptical-like r1/4 pro-file (e.g., Wright et al. 1990). A detailed analysis ofthe surface brightness profiles of all the single nucleus

10 Kartaltepe et al.
systems from the IRAS 1 Jy Survey of ULIRGs byVeilleux et al. (2002) found that they are best fit by r1/4
profiles and have mean half-light radii of 4.80± 1.37kpc.Veilleux et al. (2006) found similar results with a NIC-MOS survey of 33 nearby ULIRGs – single nucleus sys-tems have elliptical-like radial profiles, though a few ob-jects have extended exponential disks. Since the single-nucleus systems in the local studies are all advanced stagemergers and have elliptical-like profiles, it follows thatthese are massive elliptical galaxies in formation. Ourz ∼ 2 ULIRG sample encompasses a range of morpholo-gies, however, and the GALFIT Sersic index measure-ments indicate that most of these systems have surfacebrightness profiles that more closely match exponentialdisks (n ∼ 1). However, there is a tail of objects thatextend to higher Sersic indices and are closer to beingbulge-dominated. Four objects have n > 4.Since these z ∼ 2 ULIRGs have a wide range of mor-
phologies and include many early stage mergers, perhapsa better analog for comparison would be local LIRGs.LIRGs in the local universe span the full range of mor-phologies we see in the z ∼ 2 ULIRG sample, includingisolated disks, minor merger systems, and early stageinteractions along with some more advanced stage merg-ers and elliptical-like systems. An analysis of the LIRGsfrom the IRAS Bright Galaxy Sample (BGS: Soifer et al.1989) found that most LIRGs can be fit by a n = 1 pro-file (Ishida 2004) and that the light profiles can increaseat large radii due to nearby companions. Other studiesof objects from the Great Observatories All-Sky LIRGSurvey (GOALS: Armus et al. 2009) find that the Sersicindices of local LIRGs cover a wide range of values, fromn ∼ 1 to n ∼ 4 (e.g., Haan et al. 2011; D. C. Kim et al.,in preparation). This result is similar to what we see forour z ∼ 2 ULIRG sample.One of the first studies of ULIRG morphology at high
redshift was conducted by Dasyra et al. (2008) usingNICMOS imaging of 33 z ∼ 2 ULIRGs selected froma 24µm sample with additional color criteria to ensurethey were at high redshift. They found that half of thesesystems were interactions and that they had disklike pro-files, consistent with the results found for our sample.These objects have a mean effective radius of 2.5 kpc andSersic indices n < 1.35. Zamojski et al. (2011) expandedupon this sample of 33 by investigating the morphologyof these plus an additional 101 flux-limited (f24 > 0.9mJy and mR > 20) LIRGs and ULIRGs at 0.5 < z < 2.8observed with IRS (Dasyra et al. 2009), using NIC-MOS imaging. For direct comparison with our z ∼ 2ULIRG sample, we focus on their z > 1.5 subsample.This subsample contains 54 objects over a similar red-shift range but with higher luminosities than our sample(LIR > 1012.5L⊙, including a significant number withLIR > 1013L⊙). They find that 50% of this sampleare pairs or early stage mergers, 33% are advanced stagemergers, and 16% are merger remnants (including ellip-tical and point sources). That they find nearly all ofthe objects in this sample to be involved in a mergeror interaction is striking, though perhaps not surprisingconsidering the more extreme luminosity range coveredby this sample, and the inclusion of ellipticals and pointsources as merger remnants. Since we do not include el-lipticals and point sources, the 83% of objects classified
as mergers represent a better comparison to our results.This fraction is larger than what we find for our sam-ple, but is consistent given the higher luminosity of theobjects. They find that their sample typically has lowSersic indices (n . 2, though a mean value is not given)and that even during coalescence the mergers in theirsample remain disk-dominated, possibly due to a highergas fraction at z ∼ 2. This is consistent with what wefind for our z ∼ 2 ULIRG sample, which also has a lowmean Sersic index.Another selection of ULIRGs that has been studied at
high redshift in the literature are the color selected DustObscured Galaxies (DOGs: fν(24µm)/fν(R) ≥ 1000),Dey et al. 2008). Bussmann et al. (2009, 2011) con-ducted a detailed analysis of NICMOS images of 31‘Power-law’ DOGs (thought to be AGN dominated) and22 ‘Bump’ DOGs (star formation dominated), respec-tively. They find that the Bump DOGs are larger thanPower-law DOGs and tend to have more diffuse andirregular morphologies. The Power-law DOGs appearmore relaxed than local ULIRGs and are split morpho-logically – half have regular and half have irregular mor-phologies. They have a mean Sersic index of 〈n〉 = 0.9with a range of 0.1 − 2.2, somewhat lower than in ourz ∼ 2 sample. The Bump DOG sample has a mean Sersicindex of 〈n〉 = 0.8, consistent with their being more dif-fuse and irregular than the Power-law DOGs, but again,lower than in our z ∼ 2 ULIRG sample. Melbourne et al.(2009) used ground-based AO imaging of 15 z ∼ 2 DOGsto investigate their morphology and found that eightwere disks, four were ellipticals, two were unresolved,and one was diffuse. They found Sersic indices n < 2for nine of the objects and n > 3 for five of them. Theyfound little evidence for merger activity among this sam-ple and concluded that the merger fraction among DOGsis lower than the general z ∼ 2 ULIRG population. Forcomparison, if we look at the subset of our z ∼ 2 ULIRGsthat meet the DOG selection criteria (14 objects, see §6.4for more details), we find that 12 are classified as a disk,two as irregular, and one as a spheroid. Four of the disksare classified as having a spheroid as well, indicating asignificant bulge component. Only two DOGs are clas-sified as interactions and none as mergers. The DOGsubsample of our z ∼ 2 ULIRGs does appear to have alower merger fraction than the full ULIRG population,highlighting the selection effects present in color-selectiontechniques. The mean Sersic index of our DOG subsam-ple is 〈n〉 = 2.0, a bit higher than for the full sample. Wenote, however, that the DOGs studied by Bussmann etal. (2009, 2011) and Melbourne et al. (2009) have higherluminosities than the sub-set of our ULIRGs that meetthe DOG criteria since they were selected from the wide,but relatively shallow, Bootes field.Using submillimeter surveys, Swinbank et al. (2010)
studied the morphologies of 25 SMGs with NICMOSimaging over the redshift range (0.7 < z < 3.4) and founda mean Sersic index of 〈n〉 = 1.4 ± 0.8, similar to thevalue for our z ∼ 2 ULIRG sample. Targett et al. (2011)looked at a sample of 15 SMGs using ground-based K-band imaging (above the 4000A break out to z = 4) andfound little evidence for interactions among their sam-ple. They found that the morphology of their samplewas closer to that of exponential disks with 〈n〉 = 1.44

GOODS:H & CANDELS: z ∼ 2 ULIRGs 11
with a median value of 1.08. On the other hand, stud-ies of the preponderance of close radio doubles amongstSMGs, and their gas dymamics, have found evidence forboth early-stage and major mergers (e.g.; Ivison et al.2007; Tacconi et al. 2008; Engel et al. 2010). Addition-ally, a quantitative morphological analysis of 11 SMGsby Conselice et al. (2003) found that 61 ± 21% of themare major mergers. One possible explanation for the dis-crepancy among these different studies of SMGs is thedifficulty in identifying signatures of interactions at highredshift from ground-based (non-AO) images. Also, thepresence of an exponential disk light profile does not pre-clude the presence of mergers – indeed, our results showthat many galaxies with merger morphologies have lowSersic indices. Though the LIR range covered by thesestudies is not given, SMGs in general tend to have moreextreme luminosities than typical ULIRG samples. It islikely that our sample of z ∼ 2 ULIRGs is a populationthat falls in between more extreme sources like SMGsand the samples of Dasyra et al. (2008) and Zamojskiet al. (2011) and more moderate luminosity samples,such as those selected via the BzK color selection tech-nique typically studied at high redshift (e.g., Genzel etal. 2008).All of the previous studies at z ∼ 2 described in
this subsection have attempted to quantify the role ofgalaxy mergers among high redshift ULIRGs, and thewide range of results they have found has lead to someconfusion about the nature of z ∼ 2 ULIRGs. By com-paring these various studies to our z ∼ 2 ULIRGs withan understanding of the different redshift and luminosityranges sampled, we highlight some of the pitfalls of at-tributing properties of subsets of objects (such as DOGsor BzK selected galaxies) to the entire ULIRG popula-tion. This comparison has also highlighted some of thedifferences that arise from identifying mergers in differ-ent ways and using data of varying quality. All of thesefactors can make a direct comparison difficult. In gen-eral, the results from our morphological study of z ∼ 2ULIRGs are consistent with these studies when compar-ing objects at the same luminosity, with the same color-selections and morphological properties, where possible.Although our ULIRG sample does not reach the sameextreme luminosities that some of the previous studiesdo, it does sample more typical z ∼ 2 ULIRGs that werecommon at that epoch. Our sample is the first complete,FIR selected sample of ULIRGs at z ∼ 2 and is thereforeunaffected by the biases of the previous studies.
6.3. Role of Mergers Among Starbursts
Many recent studies have found that a galaxy’s starformation rate (SFR) and its stellar mass (M⋆) aretightly correlated and that the bulk of star form-ing galaxies follow a “main sequence” relation thatevolves with redshift (e.g., Brinchmann et al. 2004;Noeske et al. 2007; Daddi et al. 2007; Elbaz et al. 2007,2011; Rodighiero et al. 2011; Wuyts et al. 2011). Galax-ies with SFRs elevated significantly above this relationare considered to be starbursts. Here, we investigatethe positions of z ∼ 2 (U)LIRGs relative to the mainsequence and look for differences among main sequence(U)LIRGs and starburst (U)LIRGs. We use the relationbetween a galaxy’s specific star formation rate (sSFR)and redshift determined by Elbaz et al. (2011) to divide
our sample into main sequence and starburst galaxies.Figure 10 plots the sSFR as a function of redshift in
the left panels for the z ∼ 2 (U)LIRGs, with their visualclassifications split in different ways. We include the 70LIRGs in addition to the 52 ULIRGs in this analysis tospan a wider range of SFR. We derive the star formationrate from the total infrared luminosity that we deter-mined from the template fitting in §2.1. The panels onthe right show histograms of the ‘starburstiness’ param-eter, or the ratio between its sSFR and the sSFR valueof the main sequence at that redshift, for each class. Thetop row includes all of the (U)LIRGs color coded in thesame way as Figure 9. The galaxies are split into non-interacting disks, pure spheroids, irregular only, and allmergers and interactions. The color-coding is the same inthe left and right hand panels. Here, we define starburstgalaxies as those with sSFR greater than a factor of threeabove the main sequence (as indicated by the dashedlines). This results in 70 main sequence galaxies and 52starbursts among our z ∼ 2 (U)LIRG sample. For the 52ULIRGs specifically, there are 28 main sequence galaxiesand 24 starbursts. The exact dividing value used to sep-arate starburst from main sequence galaxies is somewhatarbitrary (factors of two and four have both been usedin the literature). Here we are interested in trends inmorphology as a function of the distance from the mainsequence and adopt a factor of three for this comparison.The fractions of main sequence and starburst galaxies
in each morphological class are given in Table 2. Non-interacting disks make up 57% of (U)LIRGs on the mainsequence and 42% of those that are starbursts (note how-ever, that 50% of the starburst non-interacting disks arealso irregular). On the other hand, mergers and interac-tions make up 24% of objects on the main sequence and50% of starbursts. All but one of the objects classifiedas only irregular are on the main sequence. The galaxiesclassified as pure spheroids are split between 11% of ob-jects on the main sequence and 6% of starbursts. We notethat these numbers do not change significantly if we usea dividing value of a factor of four instead. In Table 2we also list the mean and median values of the ‘star-burstiness’ for each morphological classification. Boththe mean and median values for the mergers and inter-actions are elevated above the values for the other classes(with means of 6.6 for the mergers and interactions ver-sus 3.7 for the disks, 3.6 for the spheroids, and 1.7 forthe irregulars). This shows that as a whole, the merg-ers and interactions have significantly elevated specificstar formation rates relative to the other morphologicalclasses.More can be learned by splitting up the visual clas-
sifications in other ways. The middle row of Figure 10shows only those objects classified as disks or spheroidsdivided into three classes: pure disk, pure spheroid, ordisk and spheroid, regardless of whether the objects arealso classified as irregular, mergers, or interactions. Thisincludes a total of 96 sources, 59 of which are main se-quence galaxies and 37 are starbursts. The remaining26 sources not included here are classified as irregular,merging, or interacting, but not as disks or spheroids.The fraction of objects classified as a pure disk is roughlythe same for the main sequence and starburst galaxies(61 versus 75%). Spheroids make up 15% of the mainsequence and 14% of the starbursts. Objects classified

12 Kartaltepe et al.
Figure 10. Left Panels: Specific star formation rate (sSFR) as a function of redshift for the z ∼ 2 (U)LIRGs coded by their visualmorphology. The solid line indicates the position of the star-forming main sequence (Elbaz et al. 2011) and the dashed lines indicate valuesof a factor of three above and below the main sequence. Galaxies with sSFR a factor of 3 above the main sequence are considered to be“starburst galaxies.” Right Panels: Stacked histogram of the ‘starburstiness’ parameter: the ratio between the sSFR rate and the mainsequence relation, color coded by visual morphology. The dashed line divides objects that are a factor of three above the main sequencerelation and therefore starbursts. The three rows highlight various features of the morphological classifications.

GOODS:H & CANDELS: z ∼ 2 ULIRGs 13
as both disks and spheroids make up 14% of the mainsequence and 11% of starbursts. These numbers indi-cate that the presence of a bulge is not correlated withwhether or not a galaxy is on the main sequence – allthree distributions are roughly the same.The bottom row of Figure 10 shows only those objects
classified as interactions, mergers, or irregular. If thissubsample of objects is interpreted as the collection ofall potentially merging systems, then dividing these ob-jects up in various ways will allow us to investigate therole of different kinds of mergers (e.g., minor versus ma-jor) among starburst and main sequence galaxies. Allobjects classified as disks or spheroids, but not irregu-lar, mergers, or interactions are excluded from this plot.These irregular/merging/interacting objects are then di-vided based on whether or not they are classified as adisk at all. Those without a disk are then divided intointeractions, mergers, irregular, or spheroid+irregular.Those that are classified as disks in this subsample arealso classified as interactions, mergers, or irregular, butstill show signs of the presence of a disk. We have sep-arated the objects based on the presence of a disk toexamine the role that minor and early stage interactionsmight play. Of this subsample of objects (74 objects intotal), only 11% of those on the main sequence are classi-fied as interactions (where the disk is no longer visible),a fraction which increases to 26% for starbursts galax-ies. Likewise, only 8% of the main sequence galaxies aremergers while in starbursts we identify 16%. This fac-tor of two difference between interactions and mergers onthe main sequence versus starburst systems suggests thatthese potential major merger systems have an importantimpact on the energy output of starburst systems.Objects that are potential minor mergers or
early stage interactions (i.e., disks AND irregu-lar/interactions/mergers) make up 61% of this subsam-ple on the main sequence and 53% of starbursts. Thismeans that even minor and early stage interactionsplay an important role in starburst systems (thoughalso important for galaxies on the main sequence). Tounderstand the relative role of these two processes, earlystage interactions (objects classified as interactions anddisks) and possible minor mergers (objects classified asirregulars and disks, but not mergers or interactions)are shown separately in the bottom section of Table 2.Each of these categories has roughly equal numbers (22and 19, respectively) and each has roughly the samenumber in the main sequence (10 and 12, respectively)and starburst (9 and 10, respectively) categories. Onlyone object was classified as a disk and a merger andit is in the starburst category. Only three objects areclassified as both spheroid and irregular. These arepotential merger remnants and make up 6% and 3% ofthe main sequence and starburst categories, respectively.To summarize, 50% of starbursting (U)LIRGs are clear
mergers and interactions. If all galaxies with irregu-lar classifications are included, this means up to 73%of starbursts are potentially involved in a merger or in-teraction at some level. Half of these objects are majorinteractions/mergers where the disk has been destroyed,while the other half are either minor mergers or earlystage interactions where the disk is still present. Thisimplies that both of these processes play an importantrole in starburst galaxies at z ∼ 2. It is important to
Figure 11. Specific star formation rate (sSFR) as a function ofredshift for the 17 (U)LIRGs that meet the DOG selection criteria,color coded by their visual morphology. The solid and dashed linesindicate the range of the star-forming main sequence and starburstgalaxies as in Fig. 10. Only four of these objects are consideredstarbursts. The DOG subsample of (U)LIRGs is dominated by diskmorphologies.
note that mergers and interactions make up a significantfraction of main sequence galaxies as well. This is notsurprising since the transition of a galaxy into a starburstsystem depends on several factors, including the mergertimescale, progenitor mass ratios, and gas masses. Nu-merical simulations (e.g., Mihos & Hernquist 1996; Hop-kins et al. 2006) have shown that a during a merger, agalaxy’s star formation rate is only expected to be sig-nificantly enhanced at particular phases of the merger(i.e., first passage and final coalescence). For the remain-der of the time, a galaxy undergoing a merger would beexpected to lie on the main sequence. This would beconsistent with the results of Hwang et al. (2011) whofind that a galaxy’s sSFR increases as it approaches alate-type neighbor.
6.4. DOGs and AGN
Here, we analyze the properties of (U)LIRGs inour sample that meet the DOG selection criteria(fν(24µm)/fν(R) ≥ 1000)). Seventeen objects in oursample are DOGs and all but three of them are ULIRGs(see discussion of 14 ULIRG DOGs in §6.2). These ob-jects have 〈LIR〉 = 1012.2L⊙ and 〈z〉 = 2.10. The posi-tion of these objects on the sSFR versus redshift diagramis plotted in Figure 11, color coded by their morpholo-gies. Almost all of these objects fall on the main sequence– only four can be considered starbursts – and for themost part, they consist of disk morphologies. One of theobjects is a spheroid, two are irregular and three are in-teractions. The mean starburstiness value for the DOGsis 2.5.We also cross-matched our (U)LIRG sample to the
Chandra 4MS catalog (Xue et al. 2011) to investigatethe role of AGN among this sample. Figure 12 plotsall of the (U)LIRGs with detections in the X-ray (30sources in total) coded by morphology on the left andX-ray luminosity on the right. Half of the objects areclassified as disks while one quarter are classified eachas spheroids and mergers/interactions. Almost all ofthe X-ray AGN lie on the main sequence, as seen for

14 Kartaltepe et al.
Figure 12. Specific star formation rate (sSFR) as a function ofredshift for the 30 X-ray detected (U)LIRGs, color coded by theirvisual morphology (left) and X-ray luminosity (right). The objectsmarked by boxes in the right panel are galaxies classified as star-forming only (non-AGN). The solid and dashed lines indicate therange of the star-forming main sequence and starburst galaxies asin Fig. 10. Five of the X-ray detected (U)LIRGs are starburstsystems, four AGN (one spheroid and three interactions/mergers)and one non-AGN (an interaction/merger).the full X-ray selected population (Mullaney et al. 2011),with a mean starburstiness of 2.2. Two X-ray detectedsources are classified as non-AGN, based on their x-ray emission being consistent with levels that can arisepurely from star formation (following the method ofAlexander et al. 2005), rather than AGN in the Chan-dra 4MS catalog and these are highlighted in the rightpanel. Of the five X-ray detected starburst systems(sSFR/sSFRMS > 3), one is classified as a non-AGN(and is morphologically an interaction/merger), three areAGN with 42.5 < log(LX/erg s−1cm−2) < 43.0, and oneis an AGN with 43.5 < log(LX/erg s−1cm−2) < 44.0.Four of the five starbursts are mergers or interactions.The mean starburstiness for the AGN classified as merg-ers or interactions is 3.4, which is significantly elevatedabove the value for the disks, 1.7. From this result, itwould appear that AGN play a minor role in starburst-ing systems, but those AGN that are starbursts are dom-inated by mergers and interactions. While there are fewAGN that appear to be starbursts, it is possible thatstarbursts host more obscured AGN that would not bedetected in X-ray surveys.
7. SUMMARY
We have presented a complete volume limited sampleof 52 z ∼ 2 ULIRGs selected from the GOODS-Herschelsurvey with CANDELS WFC3 F160W imaging. Theseobjects span a luminosity range of 1012.0L⊙ < LIR <1012.9L⊙ with a median luminosity of 1012.3L⊙ over theredshift range, 1.5 < z < 3.0. This is the first completesample of high-redshift far-infrared selected ULIRGswith high resolution near-infrared imaging. We have con-ducted a detailed morphological analysis of these objectsalong with high luminosity LIRGs (LIR > 1011.3L⊙) atthe same redshift, a z ∼ 2 comparison sample withoutHerschel emission and with the same redshift and H-bandmagnitude distribution as the ULIRGs, and a z ∼ 1 com-parison sample spanning over two orders of magnitude inluminosity 1010.7 < LIR/L⊙ < 1012.9. From an investi-gation of the properties of these samples, the followingconclusions can be drawn:
1. Visual morphological classifications of the ULIRGsample using high resolution NIR imaging indi-cate that they have roughly the same fractions ofdisks and spheroids as the z ∼ 2 comparison sam-ple (57% and 30%, respectively). However, there
are significantly more ULIRGs classified as irreg-ular (72%) or interacting (32%). Over 70% of theULIRG sample is classified as a merger, interaction,or irregular, compared to 32% of the comparisonsample. Clear mergers and interactions make up47% of the sample – we consider this to be a lowerlimit since clear signatures are difficult to identifyat this high redshift.
2. At z ∼ 1, galaxy morphology is tightly correlatedwith LIR, as has been observed locally. The frac-tion of objects classified as disks declines system-atically with luminosity while the fraction of merg-ers and interactions increases. The morphologiesof the z ∼ 2 ULIRGs have very similar fractionsto objects at z ∼ 1 with comparable luminosity atthe same rest-frame wavelength, though there areslightly fewer mergers and interactions and slightlymore disks at z ∼ 2. This suggests that therehas been a slight evolution in the morphology ofULIRGs between these two redshifts.
3. We identify 52 z ∼ 2 LIRGs and ULIRGs as star-bursts based on their elevated specific star forma-tion rates relative to the main sequence. Many ofthese starbursts are clear mergers and interactions(50%) while disks make up only 42%. Among thesedisks, many have irregular morphologies. It is pos-sible that the combination of objects classified asboth disks and either irregular or interactions rep-resent early stage interactions and minor mergers.Taken together, up to 73% of starbursts could beinteracting or merging at some level, with a signif-icant contribution from minor mergers.
4. (U)LIRGs on the main sequence are dominated bynon-interacting disks (57%) but a significant frac-tion are mergers or interactions (24%). This re-sult is expected, since simulations have shown thatmany mergers may never reach a starburst phase(especially if they lack the required gas densities)and those that do are only true starbursts for a frac-tion of the merger process. Many of the mergersand interactions we observe on the main sequencemay be at an early stage and have not yet reachedthe starburst phase.
Support for this work was provided by NASA throughHubble Fellowship grant # HST-HF-51292.01A awardedby the Space Telescope Science Institute, which is op-erated by the Association of Universities for Researchin Astronomy, Inc., for NASA, under contract NAS 5-26555. This work is based in part on observations madewith Herschel, a European Space Agency CornerstoneMission with significant participation by NASA. Supportfor this work was provided by NASA through an awardissued by JPL/Caltech. Support for Program numberHST-GO-12060 was provided by NASA through a grantfrom the Space Telescope Science Institute, which is op-erated by the Association of Universities for Research inAstronomy, Incorporated, under NASA contract NAS5-26555.Facilities: HST (WFC3), Herschel (PACS)

GOODS:H & CANDELS: z ∼ 2 ULIRGs 15
REFERENCES
Alexander, D. M., Bauer, F. E., Chapman, S. C., Smail, I., Blain,A. W., Brandt, W. N., & Ivison, R. J. 2005, ApJ, 632, 736
Armus, L., et al. 2009, PASP, 121, 559Balestra, I., et al. 2010, A&A, 512, A12+Bell, E. F., et al. 2005, ApJ, 625, 23Bertin, E., & Arnouts, S. 1996, A&AS, 117, 393Bethermin, M., Dole, H., Lagache, G., Le Borgne, D., & Penin,
A. 2011, A&A, 529, A4+Bournaud, F. and Elmegreen, B. G., 2009, ApJ, 694L, 158Bridge, C. R., et al. 2007, ApJ, 659, 931Brinchmann, J., Charlot, S., White, S. D. M., Tremonti, C.,
Kauffmann, G., Heckman, T., & Brinkmann, J. 2004, MNRAS,351, 1151
Bruzual, G., & Charlot, S. 2003, MNRAS, 344, 1000Bussmann, R., S. et al. 2009, 693, 750Bussmann, R. S., et al. 2011, ApJ, 733, 21Cameron, E. 2011, PASA, 28, 128Caputi, K. I., et al. 2007, ApJ, 660, 97Chabrier, G. 2003, PASP, 115, 763Chary, R., & Elbaz, D. 2001, ApJ, 556, 562Chakrabarti, S., Fenner, Y., Cox., T.J., Hernquist, L., Whitney,
B.A., 2008, ApJ, 688, 972Conselice, C. J., Chapman, S. C., & Windhorst, R. A. 2003, ApJ,
596, L5Daddi, E., et al. 2010, ApJ, 713, 686Daddi, E., Cimatti, A., Renzini, A., Fontana, A., Mignoli, M.,
Pozzetti, L., Tozzi, P., & Zamorani, G. 2004, ApJ, 617, 746Daddi, E., et al. 2005, ApJ, 631, L13—. 2007, ApJ, 670, 156Dahlen, T., et al. 2010, ApJ, 724, 425Dale, D. A., & Helou, G. 2002, ApJ, 576, 159Dasyra, K. M., Yan, L., Helou, G., Surace, J., Sajina, A., &
Colbert, J. 2008, ApJ, 680, 232Dasyra, K. M., et al. 2009, ApJ, 701, 1123Dave, R., Finlator, K., Oppenheimer, B. D., Fardal, M., Katz, N.,
Keres, D., & Weinberg, D. H. 2010, MNRAS, 404, 1355Dekel, A., et al. 2009a, Nature, 457, 451Dekel, A., Sari, R., & Ceverino, D. 2009b, ApJ, 703, 785Dey, A., et al. 2008, ApJ, 677, 943Elbaz, D., et al. 2007, A&A, 468, 33—. 2011, A&A, 533, A119+—. 2010, A&A, 518, L29+Engel, H., et al. 2010, ApJ, 724, 233Fadda, D., et al. 2010, ApJ, 719, 425Floc’h, E. L., et al. 2005, ApJ, 632, 169Frayer, D. T., et al. 2009, AJ, 138, 1261Genzel, R., et al. 2008, ApJ, 687, 59Giavalisco, M., et al. 2004, ApJ, 600, L93Grogin, N. A., et al. 2011, ApJS, 197, 35Haan, S., et al. 2011, AJ, 141, 100Hibbard, J. E., & Vacca, W. D. 1997, AJ, 114, 1741Hopkins, P. F., Hernquist, L., Cox, T. J., Di Matteo, T.,
Robertson, B., & Springel, V. 2006, ApJS, 163, 1Hopkins, P., Younger, J.D., Hayward, C.C., Narayanan, D.,
Hernquist, L., 2010, MNRAS, 402, 1693Hwang, H. S. et al. 2012, A&A, 535, 60Hwang, H. S., Elbaz, D., Lee, J. C., Jeong, W.-S., Park, C., Lee,
M. G., & Lee, H. M. 2010, A&A, 522, A33+Ishida, C. M. 2004, Thesis (PhD). UNIVERSITY OF HAWAI’I,
18Ivison, R. J., et al. 2007, MNRAS, 380, 199Kartaltepe, J. S., et al. 2010a, ApJ, 709, 572—. 2010b, ApJ, 721, 98Koekemoer, A. M. et al. 2011, ApJS, 197, 36
Kriek, M., et al. 2008, ApJ, 677, 219Krist, J., E., Hook, R. N., and Stoehr, F. 2011, SPIE, 8127, 16Lagache, G., Dole, H., & Puget, J.-L. 2003, MNRAS, 338, 555Laidler, V. G., et al. 2007, PASP, 119, 1325Lotz, J. et al. 2008, ApJ, 672, 177Magnelli, B., Elbaz, D., Chary, R. R., Dickinson, M., Borgne,
D. L., Frayer, D. T., & Willmer, C. N. A. 2009, A&A, 496, 57Magnelli, B., Elbaz, D., Chary, R. R., Dickinson, M., Le Borgne,
D., Frayer, D. T., & Willmer, C. N. A. 2011, A&A, 528, A35+Melbourne, J., et al. 2009, AJ, 137, 4854
Mihos, J. C., & Hernquist, L. 1996, ApJ v.464, 464, 641Mullaney, J. R., et al. 2012, MNRAS, 419, 95Murphy, E. J., Chary, R.-R., Dickinson, M., Pope, A., Frayer,
D. T., & Lin, L. 2011, ApJ, 732, 126Narayanan, D. , Cox, T. J., Hayward, C.C., Younger, J.D.,
Hernquist, L., 2009, MNRAS, 400, 1919Narayanan, D., Hayward, C.C., Cox, T. J., Hernquist, L.,
Jonsson, P. Younger, J.D., Groves, B. , 2010, MNRAS, 401,1613
Noeske, K. G., et al. 2007, ApJ, 660, L43Nordon, R., et al. 2010, A&A, 518, L24+Papovich, C., et al. 2007, ApJ, 668, 45Peng, C. Y., Ho, L. C., Impey, C. D., & Rix, H.-W. 2002, AJ,
124, 266Pilbratt, G. L., et al. 2010, A&A, 518, L1+Poglitsch, A., et al. 2010, A&A, 518, L2+Pope, A., et al. 2006, MNRAS, 370, 1185Retzlaff, J., Rosati, P., Dickinson, M., Vandame, B., Rite, C.,
Nonino, M., Cesarsky, C., & GOODS Team. 2010, A&A, 511,A50+
Rix, H.-W., et al. 2004, ApJS, 152, 163Rodighiero, G., et al. 2011, ApJ, 739, L40+Rujopakarn, W., Rieke, G. H., Eisenstein, D. J., & Juneau, S.
2011, ApJ, 726, 93Sajina, A., Yan, L., Lee, A., Choi, P., Fadda, D., Helou, G.,
Spoon, H., 2007, ApJ, 664, 713Sanders, D. B., & Mirabel, I. F. 1996, ARAA, 34, 749Sanders, D. B., Soifer, B. T., Elias, J. H., Neugebauer, G., &
Matthews, K. 1988, ApJ, 328, L35Scoville, N., et al. 2007, ApJS, 172, 1Shi, Y., Rieke, G., Lotz, J., & Perez-Gonzalez, P. G. 2009, ApJ,
697, 1764Shi, Y., Rieke, G. H., Papovich, C., Perez-Gonzalez, P. G., &
Floc’h, E. L. 2006, ApJ, 645, 199Siebenmorgen, R., & Krugel, E. 2007, A&A, 461, 445Silverman, J. D., et al. 2010, ApJS, 191, 124Soifer, B. T., Boehmer, L., Neugebauer, G., & Sanders, D. B.
1989, AJ, 98, 766Swinbank, A. M., et al. 2010, MNRAS, 405, 234Symeonidis, M., Willner, S. P., Rigopoulou, D., Huang, J.-S.,
Fazio, G. G., & Jarvis, M. J. 2008, MNRAS, 385, 1015Szokoly, G. P., et al. 2004, ApJS, 155, 271Tacconi, L. J., et al. 2008, ApJ, 680, 246Targett, T. A., Dunlop, J. S., McLure, R. J., Best, P. N.,
Cirasuolo, M., & Almaini, O. 2011, MNRAS, 412, 295Vanzella, E., et al. 2008, A&A, 478, 83Veilleux, S., et al. 2006, ApJ, 643, 707Veilleux, S., Kim, D.-C., & Sanders, D. B. 2002, ApJS, 143, 315Wright, G. S., James, P. A., Joseph, R. D., & McLean, I. S. 1990,
Nature, 344, 417Wuyts, S. et al., 2009, ApJ, 706, 885Wuyts, S. et al., 2011, ApJ, 742, 96WXue, Y. Q., et al. 2011, ApJS, 195, 10Zamojski, M., Yan, L., Dasyra, K., Sajina, A., Surace, J.,
Heckman, T., & Helou, G. 2011, ApJ, 730, 125Zheng, X. Z., Hammer, F., Flores, H., Assemat, F., & Pelat, D.
2004, A&A, 421, 847

16 Kartaltepe et al.
Table 1Samples Discussed in This Paper
Name # Redshift Range log(LIR/L⊙) Relevant Figures
GOODS-H + CANDELS Samples
ULIRGs 52 1.5− 3.0 12.0− 12.8 1, 2, 5-12LIRGs 70 1.5− 3.0 11.3− 11.9 1, 10-12(U)LIRGsa 122 1.5− 3.0 11.3− 12.8 1, 10-12
Comparison Samples
z ∼ 2 Comparison Sample 260 1.5− 3.0 . 11.5 2, 5, 8z ∼ 1 Comparison Sample 569 0.8− 1.2 10.6− 12.9 3, 9
a This is a combination of the LIRG and ULIRG samples and are collectively referredto as (U)LIRGs throughout the paper.
Table 2Percentage of (U)LIRGs in Each Morphological Class
Morphological Classification Main Sequence Starbursts 〈sSFR/sSFRMS〉 med(sSFR/sSFRMS)# % # %
All (U)LIRGs – 122 objects
Non-interacting Disks 40 57 22 42 3.7 2.4Non-interacting Spheroids 8 11 3 6 3.6 1.4Irregular Only 5 7 1 2 1.7 1.3All Mergers and Interactions 17 24 26 50 6.6 3.8
All (U)LIRGs classified as disks or spheroids – 96 objects
Pure Disk 42 71 28 75 4.5 2.6Pure Spheroid 9 15 5 14 8.0 2.3Disk and Spheroid 8 14 4 11 2.0 1.5
All (U)LIRGs classified as irregular, mergers, or interactions – 74 objects
Interactions, no disk 4 11 10 26 6.6 3.8Mergers, no disk 3 8 6 16 4.3 4.4Irregular Only 5 14 1 3 1.6 1.3Disk+Irr/Int/Mer 22 61 20 53 4.4 2.8Spheroid+Irregular 2 6 1 3 5.9 0.9
All (U)LIRGs classified as irregular, mergers, or interactions AND disks – 42 objects
Irregular Disks 12 55 10 50 3.9 2.8Interacting Disks 10 45 9 45 4.7 2.6Disk+Merger 0 0 1 5 9.2 · · ·


![Herschel-PACS observations of [OI] and H2O in Chamaeleon II](https://img.pdfslide.net/doc/110x75/6350f28b7d280cdb4306f416/herschel-pacs-observations-of-oi-and-h2o-in-chamaeleon-ii.jpg)


