Embed Size (px)
Citation preview

Gravity-wave-induced variations in exothermic heatingin the low-latitude, equinox mesophere and lowerthermosphere region
Tai-Yin Huang1 and Michael Hickey2
Received 9 September 2011; revised 16 November 2011; accepted 13 December 2011; published 14 February 2012.
[1] We investigate gravity-wave-induced variations in exothermic heating in the OHnightglow region at a latitude of 18° in the Northern and Southern Hemispheres duringMarch. An OH nightglow chemistry model with gravity wavefields from a spectral full-wave model is used for the investigation. Our simulation results show that the wave packetinduces a large secular increase in the number densities of the minor species involved in theOH chemistry, a 50% increase in O3, 42% in O, and 29% in OH (v = 8), and the ultimatedriver for these increases is the wave-driven downward transport of O. We find that the totalexothermic heating rates have increased by �44.2% for 18°S and �30.9% for 18°N by theend of the simulation time. Also, the peak values of the mean wave-induced total exothermicheating rates are significant,�2.0 K d�1 at the peak altitude of 88 km and�2.2 K d�1 at 89km for 18°S and 18°N, respectively. The major reactions contributing to exothermic heatingrates are the three-body recombination O + O +M and the H + O3 reaction. The hemisphericasymmetry in the heating rates is mainly due to the different atmospheric conditions at 18°Nand 18°S since the same wavefields are used in the numerical simulations.
Citation: Huang, T.-Y., and M. Hickey (2012), Gravity-wave-induced variations in exothermic heating in the low-latitude,equinox mesophere and lower thermosphere region, J. Geophys. Res., 117, A02307, doi:10.1029/2011JA017148.
1. Introduction
[2] Gravity wave forcing has been an intense researchtopic in the field of aeronomy since 1960 when Hines [1960]established that gravity waves were responsible for iono-spheric disturbances. Gravity waves are important becausethey can transport energy and momentum to higher altitudes,deposit energy and momentum through wave-mean flowinteractions, alter gas concentration distributions by the com-bined effects of vertical transport of species and chemistry,and induce exothermic heating variations. They play animportant role in the dynamics and energy budget in themesosphere and lower thermosphere (MLT) region. It haslong been recognized that gravity wave effects in the MLTregion are significant. Therefore, it is important that weunderstand gravity waves and their effects on our atmosphere.[3] In addition to gravity waves, the airglow in the MLT
region is another important research topic in our scientificcommunity. It is important because variations in airglowbrightness can oftentimes be used to deduce characteristicsof gravity waves or other types of waves that cause thevariations. Observations of airglow brightness have shownthat gravity waves are a ubiquitous feature in the upperatmosphere. The presence of wave-like patterns in the
airglow imagery, a manifestation of wave modulation of theunderlying minor species’ densities involved in the airglowchemistry, arises from the coupling of wave dynamics andchemistry in that region. Gravity waves can also manifestthemselves in the ionosphere as fluctuations in electrondensity (so-called traveling ionospheric disturbances), and inthe upper mesosphere they can also lead to structure observedin noctilucent clouds. Furthermore, a transient and dissipa-tive wave packet propagating through an airglow layer canlead to a secular change in the airglow brightness [Hickeyand Walterscheid, 2001; Huang and Hickey, 2008].[4] In recent years, airglow observations and theoretical
studies have significantly advanced our understanding ofgravity waves and their interactions with the airglow layers[Walterscheid et al., 1987; Hecht and Walterscheid, 1991;Schubert et al., 1991; Taylor et al., 1995; Liu and Swenson,2003; Huang and Hickey, 2008; Taori et al., 2007]. In par-ticular, a 2-D, time-dependent, OH nightglow chemistry-dynamics model developed by Huang and Hickey [Hickeyet al., 2003; Huang and Hickey, 2007, 2008] is capable ofsimulating the interaction of a dissipative, transient gravitywave packet with the OH nightglow layer. Importantly, someof the chemical reactions considered in the 2-D OH night-glow chemistry-dynamics model are exothermic, and thusthe model also simulates how a gravity wave packet affectsthe exothermic heating rates in the OH nightglow region[Hickey et al., 2003]. In addition to simulating wave-inducedexothermic heating fluctuations [Hickey et al., 2003], themodel can simulate secular variations of minor species[Huang and Hickey, 2007] and secular variations of OHairglow brightness [Huang and Hickey, 2008]. These studies
1Department of Physics, Pennsylvania State University-Lehigh Valley,Center Valley, Pennsylvania, USA.
2Department of Physical Sciences, Embry-Riddle Aeronautical University,Daytona Beach, Florida, USA.
Copyright 2012 by the American Geophysical Union.0148-0227/12/2011JA017148
JOURNAL OF GEOPHYSICAL RESEARCH, VOL. 117, A02307, doi:10.1029/2011JA017148, 2012
A02307 1 of 11

using the 2-D OH nightglow chemistry-dynamics modelhave shown that a transient dissipating gravity wave packetcan induce a significant secular increase in the concentrationsof minor species and in the OH airglow brightness. Sinceheating rates are proportional to the product of gas species’number densities, we can expect the wave packet to have asignificant effect on the exothermic heating rates. The studieselucidate the role of a gravity wave packet in the airglowintensity variations and show that the ultimate driver for theincreases is the gravity-wave-driven downward transport ofO. These time-dependent studies also show rather differentgravity wave effects when compared with the results fromprevious steady state studies.[5] Chemical heating from exothermic chemical reactions
contributes significantly to the energy budget of the MLTregion [Kellogg, 1961;Mlynczak and Solomon, 1991]. It wasshown that exothermic chemical reactions are the singlelargest heat source near the mesopause [Mlynczak, 1996].Gravity waves can affect minor species’ concentrations in theregion, which will consequently affect the exothermic heat-ing generated from the chemical reactions involving thesespecies. Therefore, studying the wave effects on the exo-thermic heating rates is important in understanding the rolegravity waves play in the thermal budget in this region.Hickey et al. [2003] used the aforementioned model toinvestigate the wave effects on exothermic heating. Theirresults show that a 20 min, 30 km (horizontal wavelength ofthe forcing wave) wave packet could induce a substantialincrease in the total exothermic heating rates at a latitude of82°N. The average wave-induced total exothermic heatingrate was found to be �1.8 K d�1 or a �22% increase. Con-trary to the previous steady state model predictions thatgravity waves mitigate exothermic heating [Hickey andWalterscheid, 1994; Xu et al., 2000], the results using the2-D, time-dependent model indicate that the wave packetoverall acts to raise the heating rates, increasing thermalenergy in this region. In this study, we use the same 2-D OHchemistry-dynamics model to investigate wave-inducedexothermic heating rate variations at 18°S and 18°N and weinvestigate in detail the respective contribution of each exo-thermic chemical reaction to the thermal energy budget inthis region. The 18°N and 18°S regions were chosen for thesimulations because there are relatively more gravity wave
and OH airglow observations at low latitudes. A separatepaper on airglow simulation results compared with airglowobservations is planned for a future study.[6] The paper is arranged as follows. We discuss exo-
thermic heating reactions in section 2 and present resultsin section 3. Discussion and conclusions are provided insections 4 and 5, respectively.
2. The 2-D OH Nightglow Chemistry-DynamicsModel and Exothermic Heating
[7] The 2-D, time-dependent, nonlinear OH nightglowchemistry-dynamics model consists of a spectral full-wavemodel (SFWM) and a 2-D, OH nightglow chemistry model.Figure 1 shows the schematic flowchart of the 2-D OHmodel. The SFWM [Hickey et al., 2000] is used to provide atransient, dissipative, linear gravity wave packet comprisingwave periods from 5 min to 40 h, and it solves for andoutputs wave-perturbed quantities: u′ (horizontal velocity),w′ (vertical velocity), T ′ (temperature), and r′ (major gasdensity). The wave packet is damped by eddy and moleculardiffusions. The wave solution as a function of time andaltitude is then input to the two-dimensional nonlinear time-dependent OH chemistry model to study the interaction ofthe gravity wave packet with the chemically reacting speciesin the OH nightglow region. Flux terms and horizontaladvection terms appearing in the minor species’ continuityequations are solved with the explicit finite difference Lax-Wendroff scheme [Burstein, 1967] while P (chemical pro-duction), L (chemical loss rate), and the vertical advectionterms are solved by an implicit global Newton’s method.Minor species are assumed to be in diffusive equilibriumat the upper boundary and remain constant at the lowerboundary. Periodic lateral boundary conditions are appliedat the lateral boundaries, which are spaced one horizontalwavelength apart. A source height at 10 km altitude aboveground is specified to provide the wave forcing. A time stepof 3 s is used along with a 0.1 km vertical grid and a 0.5 kmlateral grid in the model. The time domain of the simulationis from 120 to 540 min.[8] A wave packet of a 20 min forcing-wave period and a
30 km horizontal wavelength is simulated with the SFWM.The envelope of the wave packet amplitude grows with alti-tude until it reaches a maximum value near 105 km alti-tude after which it starts to decrease. Figure 2 displays theamplitude of the wave packet at 90 km altitude as a functionof time. The wave packet forces the major gas species N2
to oscillate, and at 90 km altitude the maximum amplitudeis �1.2% of the N2 number density occurring at around320–340 min.[9] Table 1 lists the reactions considered for the OH(8,3)
nightglow chemistry, the enthalpies, the heating rates, andthe heating efficiencies for the exothermic reactions. Thereaction rates and the enthalpies are the same as those usedby Huang and Hickey [2007, 2008] and Hickey et al. [2003],respectively. The references for these quantities can be foundtherein. Note that reaction R7 in Table 1 was considered byHickey et al. [2003] but not listed in their paper. In addition,the ordering of the reactions in their paper is different fromthe ordering in the later papers that used the same model. TheH + O3 reaction has a heating efficiency of 0.6 (constant withaltitude) while all other reactions have unit heating efficiency
Figure 1. Schematic diagram of the 2-D OH airglowchemistry-dynamics model.
HUANG AND HICKEY: WAVE-INDUCED VARIATIONS IN HEATING A02307A02307
2 of 11

[Mlynczak and Solomon, 1993]. Mlynczak and Solomon[1993, Figure 17] calculated heating efficiencies for theH + O3 reaction using four different kinetic models, and thecalculated values show a large uncertainty. The 0.6 value isapproximately midway between the calculated highest and thelowest heating efficiency limits, and its use is recommendedfor it minimizes the error in the calculated heating rate.[10] Six species are considered in the OH nightglow
chemistry: O, O3, H, HO2, OH (v = 0), and OH* (v = 8).Initial number densities of O and H in March at 18°S and18°N are taken from Garcia and Solomon [1985] and sup-plied by R. R. Garcia (private communication, 1990). Majorgas densities of N2 and O2 and the temperature profiles aretaken from MSIS-90 [Hedin, 1991]. The initial profiles forthe rest of the species (O3, HO2, OH (v = 0), and OH*(v = 8))are calculated by assuming that they are initially in chemicalbalance. Therefore, the whole initial background profilesform a self-consistent system.
[11] For a chemical reaction A + B → C + D, the heatingrate Q is equal to ɛER[A][B], where ɛ is heating efficiency,E is enthalpy, R is the reaction rate, and [A] and [B] areconcentrations of reactants A and B. We can see that heatingrate depends on the gas concentrations of the reactants, theenthalpy, the heating efficiency, and the reaction rate of theexothermic heating reaction. Heating rates Q1 through Q7 arelisted in Table 1. Since gravity waves can induce variations inthe gas concentrations and temperature-dependent rate coef-ficients, wave-induced variations in the heating rates areexpected. To isolate the wave-induced variations, we firstfind the average values for the accumulative heating rates,and then subtract the initial wave-free heating rates from themean values. The mathematical formulation is
QAVG ¼ 1
N
XN
i¼0
QðtiÞ � Qðt0Þ; ð1Þ
Figure 2. The gravity wave packet with a forcing-wave period of 20 min and horizontal wavelength of30 km. It shows the wave packet amplitudes at 90 km altitude as functions of time.
Table 1. OH(8,3) Nightglow Chemistry, Enthalpies, Exothermic Heating Rates, and Heating Efficiencies
Reaction Enthalpy E (kcal mol�1) Heating Rate Q Heating Efficiency ɛ
R1 O + OH (v = 0) → H + O2 E1 = �16.77 Q1 = ɛ1*R1*E1*[O][OH] 1R2 H + O2 + M → HO2 + M E2 = �49.10 Q2 = ɛ2*R2*E2*[H][O2][M] 1R3 O+HO2 → OH (v = 0) + O2 E3 = �53.27 Q3 = ɛ3*R3*E3*[O][HO2] 1R4 O + O + M → O2 + M E4 = �119.4 Q4 = ɛ4*R4*E4*[O]
2[M] 1R5 O + O2 + M → O3 + M E5 = �25.47 Q5 = ɛ5*R5*E5*[O][O2][M] 1R6 H + O3 → OH* (v = 8) + O2 E6 = �76.90 Q6 = ɛ6*(R6+R7)*E6*[H][O3] 0.6R7 H + O3 → OH (v = 0) + O2
R8 OH* (v = 8) → OH (v = 3) + hR9 OH* (v = 8) + O → H + O2 E7 = �16.77 Q7 = ɛ7*R9*E7*[OH*(v = 8)][O] 1R10 OH* (v = 8) + O2 → OH (v � 1) + O2
R11 OH* (v = 8) + N2 → OH (v � 1) + N2
HUANG AND HICKEY: WAVE-INDUCED VARIATIONS IN HEATING A02307A02307
3 of 11

where QAVG is the average wave-induced heating rate andN is the number of iterations.
3. Results
[12] In this section, we present the simulation results fortwo latitudes (18°N and 18°S) using the same gravity wavepacket with a forcing wave period of 20 min and a horizontalwavelength of 30 km. The wave source is located in thetroposphere, with the resulting wave amplitude growingexponentially and reaching a maximum near 105 km altitude,beyond which the amplitude decreases because of dissipa-tion. Since gravity waves induce variations in the gas spe-cies’ number densities, we first study how the numberdensities vary under the influence of the wave packet. Wefocus on the species (O, O3, and OH*) appearing in reactionsR4 and R6 because these reactions have larger enthalpies thanthe rest.[13] Figure 3 shows the secular variations of O, O3, and
OH* (v = 8) number densities at 90 km altitude as a functionof time at 18°S (solid curves) and 18°N (dashed curves): bluefor O3, black for O, and red for OH*. The secular variationsof the number densities are obtained by performing a runningaverage, with the window size equal to the forcing-waveperiod T = 20 min. This procedure separates the numberdensity variations into two parts: the fluctuating part thatoscillates at the forcing-wave period and the secular part thatsurvives this averaging [see Huang and Hickey, 2007]. FromFigure 3, we can identify that strong secular variations occurapproximately around the time when the forcing waveamplitude is about to reach the peak value. A steep increasein the secular variations starts at around 300 min and lasts forabout 100 min. After that, the variations seem to reach a
plateau, with smaller variations occurring until the end of thesimulation time. It is interesting to note that the slopes of thenumber density increase are somewhat similar to the slopeof the wave amplitude growth. The small oscillations seen inthe secular variations are due to the fact that performing arunning average at the forcing-wave period will not removeoscillations occurring at all periods comprising the wavepacket. Nevertheless, aside from the small oscillations, thesesecular variations of the three species show a common fea-ture: a small increase in the beginning followed by a steepincrease when the wave amplitude reaches the peak value;then the variations remain comparable for the remainderof the simulation time. Of the three species, O3 shows thelargest secular increase of �50%, followed by O (�42%),and then OH (v = 8) (�29%) at the end of the simulation.These results indicate that the gravity wave packet inducessignificant secular variations in the gas species’ numberdensities. Since heating rates are proportional to the productof gas species’ number densities, we can expect the wavepacket to have a significant effect on the exothermic heatingrates. Note that the variations at 18°S are smaller than, butsimilar to, those at 18°N.[14] To understand how the gravity wave packet affects the
exothermic heating rates in the OH nightglow region, weplotted the initial and the final heating rates for each exo-thermic reaction for 18°S in Figures 4a and 4b, respectively.These heating rates are presented in units of K d�1, but itshould be borne in mind that they only represent the night-time heating rates since we consider nighttime chemistry.From inspecting Figure 4, we can see that Q4 is the majorheat contributor and peaks at a much higher altitude than theother heating rates. It has the largest enthalpy (�119.4 kcalmol�1) and is proportional to the product of [M] and [O]2.
Figure 3. Secular variations of O, O3, and OH* (v = 8) number densities at 90 km altitude at 18°S and18°N. The solid lines are for 18°S and the dashed lines are for 18°N. Steep increases occur at �300 minand last for �80 min.
HUANG AND HICKEY: WAVE-INDUCED VARIATIONS IN HEATING A02307A02307
4 of 11

The initial peak height for Q4 is located at 101 km altitudewith a peak value of 5.64 K d�1, while the final peak heightfor Q4 is located near 97 km altitude with a peak value of6.8 K d�1. At a time of 420 min the wave activity has causedQ4 to increase by 1.16 K d�1 (�21%) and the peak altitude tobe displaced downward by 4 km. It is not surprising that Q4
peaks at a relatively high altitude because it is proportionalto the square of the atomic oxygen number density. Previousstudies have shown that the gravity wave packet can induce asignificant downward flux of O [Hickey and Walterscheid,2001; Huang and Hickey, 2007, 2008]. The lower peakheight of the Q4 final heating rate is largely due to thedownward transport of O.[15] The second major heat contributor isQ6, with the peak
altitude remaining at the same height of 90 km for the initialand the final heating rates.Q6 has the second largest enthalpy(�76.9 kcal mol�1) and is proportional to the product of[H] and [O3]. The initial peak value is 3.64 K d�1, and thefinal peak value is 5.08 K d�1, representing a�40% increase.The third major heat contributor is Q5, with an initial peakheight at 90 km altitude and a peak value of 2.01 K d�1. Thefinal peak height remains at 90 km altitude, and the peakvalue is increased to 2.84 K d�1 (�41% increase). As for Q1,the initial peak value is 1.31 K d�1 and the final peak valueis 1.83 K d�1 (�40% increase) while the peak height alsoremains at 90 km altitude. The rest of the heating rates (the
initial and the final values) are either close to or less than1 K d�1.[16] We plotted the initial and the final exothermic heating
rates for each exothermic reaction for 18°N in Figures 5aand 5b, respectively. Figure 5 shows features very similarto those shown in Figure 4 but with larger heating rates. Q4
remains the largest heating rate followed by Q6, then Q5. Thepeak altitude for Q4 lies a few kilometers above the peakaltitudes for the rest of the heating rates. The initial peakaltitude for Q4 is at 100 km, and the final peak altitude is at97 km at the end of the simulation. The peak value changesfrom 7.38 to 8.83 K d�1, representing an �20% heating rateincrease. Q6 initially peaks at 92 km altitude with a valueof 4.8 K d�1; then it moves down to 91 km with a value of6.79 K d�1, indicating a �42% heating rate increase. Theinitial and final peak altitudes for Q5 are the same as thosefor Q6. The initial peak value for Q5 is 2.65 K d�1, and thefinal peak value is 3.63 K d�1, showing a 37% increase inthe heating rate. The initial and the final peak values for Q1
are 1.64 and 2.31 K d�1, respectively, and it represents a�41% increase.[17] The previous two figures show the individual heating
rates. Next we show the initial and final total heating rates at18°S in Figure 6a and at 18°N in Figure 6b. The black solidcurve denotes the initial total heating rate, and the red dashedcurve denotes the final total heating rate. From Figure 6 and
Figure 4. (a) Initial and (b) final exothermic heating rates Q1 through Q7 for 18°S. The black curve withopen circles denotes Q1, the blue curve with open triangles denotes Q2, the orange curve with open squaresdenotes Q3, the blue curve with solid diamonds denotes Q4, the green curve with solid circles denotes Q5,the red curve with solid triangles denotesQ6, and, finally, the black curve with solid squares denotesQ7.Q4
and Q6 are the major heating rates. The initial heating rate Q4 peaks at 101 km altitude with a peak value of5.64 K d�1 while the final Q4 peaks at 97 km with a value of 6.8 K d�1.
HUANG AND HICKEY: WAVE-INDUCED VARIATIONS IN HEATING A02307A02307
5 of 11

Figure 5. (a) Initial and (b) final exothermic heating rates Q1 through Q7 for 18°N. Again, Q4 and Q6 arethe major heating rates. The initial heating rate Q4 peaks at 100 km altitude with a peak value of 7.38 K d�1
while the final Q4 peaks at 97 km with a value of 8.83 K d�1.
Figure 6. Initial and final total heating rates Qtotal for (a) 18°S and (b) 18°N. The total heating rates at18°N are larger than those at 18°S. The wave-like structure is apparent in the final heating rates.
HUANG AND HICKEY: WAVE-INDUCED VARIATIONS IN HEATING A02307A02307
6 of 11

Figures 4b and 5b, we can see wave-like structures in thefinal total heating rates at both latitudes. This is expectedsince these data are not the running average values and sothey retain the wave signatures. The initial total heating ratesdisplay a single prominent peak at both latitudes while thefinal total heating rates display a double-peak-like featurethat is due to the presence of the wave packet. The initialtotal heating rate at 18°S peaks at 92 km with a value of9.26 K d�1, and the final total heating rate peaks at 91 kmwith a value of 13.35 K d�1. The initial total heating rateat 18°N peaks at a higher altitude at 96 km with a value of13.08 K d�1, while the final total heating rate peaks at twolocations, �96 and 92 km, with roughly the same value of17.12 K d�1. Comparing the peak values of the initial andfinal heating rates, we see that the heating rates are increasedby 4.09 K d�1 (�44%) at 18°S and 4.04 K d�1 (�31%) at18°N by the end of the simulation. We note that the overallfinal total heating rates increase between 77 and 99 km anddecrease above 99 km altitude when they are compared withthe initial heating rate values for both latitudes. The percentchange of Qtotal at 18°S is larger than that at 18°N mainlybecause the Qtotal changes are roughly the same for 18°S and18°N but the initial value of Qtotal at 18°N is considerablygreater than that at 18°S. The peak altitudes and magnitudesof the initial and final heating rates at 18°S and 18°N aretabulated in Tables 2 and 3, respectively. We also include inthe tables the heating rate percent changes and the altitudechanges for easier inspection.[18] Figures 4–6 show a direct comparison of the final
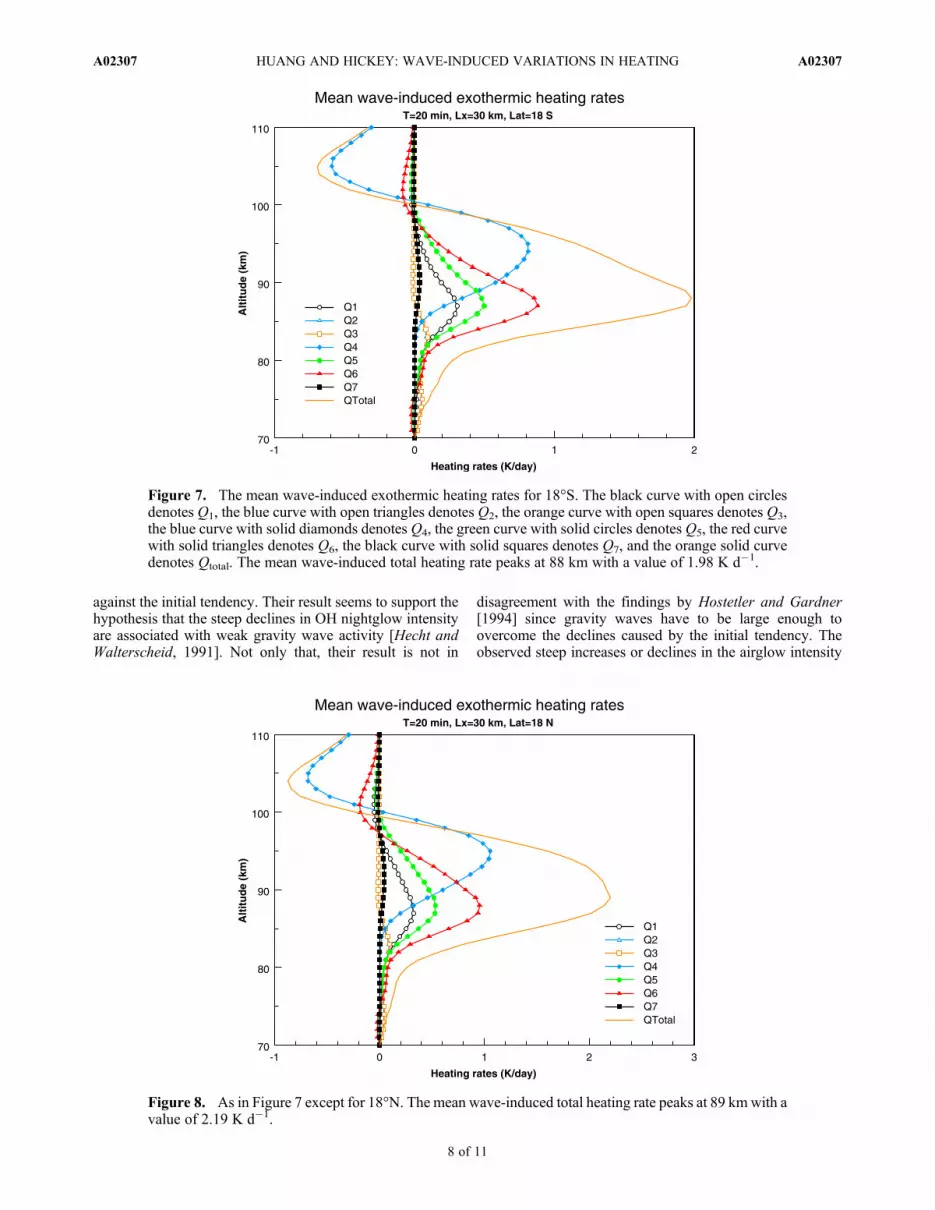
heating rate values to the initial heating rate values. To findthe average wave-induced variations in the exothermicheating rates, we use equation (1). Figures 7 and 8 show thevertical profiles of mean wave-induced heating rate varia-tions for Q1 through Qtotal at 18°S and 18°N, respectively.The largest mean wave-induced total exothermic heating rateQtotal is 1.98 K d�1 at 88 km altitude at 18°S and 2.19 K d�1
at 89 km altitude at 18°N. Comparing these mean wave-induced heating rates with the initial heating rates at the samealtitude shows that the wave packet can induce a mean 28.3%(24.4%) increase in the total exothermic heating rate at 18°S(at 18°N). The gravity wave packet induces larger heatingrates in Q4 and Q6 followed by Q5 and Q1 for both latitudes.The peak value of the mean wave-induced heating rate forQ4
is 0.81 (1.06) K d�1 and for Q6 is 0.88 (0.95) K d�1 at 18°S(18°N). The peak values and the peak altitudes of the meanwave-induced heating rates are listed in Table 4. Figures 7and 8 also show that the overall effects of the gravity wavepacket are to increase exothermic heating rates below 100 km(99 km) altitude for 18°S (18°N) and to decrease exothermic
heating rates above that altitude. The largest decrease occursat 105 km (104 km) altitude at 18°S (18°N) with a value of�0.69 K d�1 (�0.87 K d�1), and the single largest decreasecomes from the contribution of reaction R4, the three-bodyrecombination. This result is not surprising since it is con-sistent with the depletion of atomic O at higher altitudes (e.g.,downward flux of O to lower altitudes) and Q4 is propor-tional to [O]2. These results show that the gravity wavepacket not only modulates the distribution of gas concen-trations but also causes rather significant variations in theheating rates and alters the vertical distribution of the heatingregion.
4. Discussion
[19] Hecht et al. [1995] reported an observation thatshowed a steep increase in OH airglow intensity without anappreciable increase in OH temperature. They suggested thatthe intensity enhancement might be caused by a nonperiodicchange in atmospheric composition, specifically, a rapidwave-induced downward flux of ozone in the airglow layer.Our simulations of OH nightglow intensity and the intensity-weighted temperature in the presence of a gravity wavepacket (not shown) display a steep increase in the night-glow intensity without a noticeable change in the tempera-ture. Our simulation results are very similar to what Hechtet al. observed. Our Figure 3 shows a steep increase in the O3,O, and OH* number densities, which seems to support thesuggested mechanism by Hecht et al. The studies by Hickeyand Walterscheid [2001] and Huang and Hickey [2007,2008] have shown that it is the wave-induced downward fluxof O in the airglow region that increases the atomic oxygennumber density in the reactions that produce O3 and OH* andthat eventually leads to a steep increase in the airglowintensity. Their studies elucidate the role of the gravity wavepacket in the airglow intensity variations and show that theultimate driver for the increases is the gravity-wave-drivendownward transport of O. The O3 increase is a consequenceof the combination of the enhanced O number density inchemical reactions and wave dynamics. Their studies alsoindicate that the onset of the airglow intensity increase occursafter the wave packet has passed the maximum amplitude bya few wave cycles. One of the results discussed by Huangand Hickey [2008] is that background diffusion and chem-istry (the initial tendency) tends to cause a steep declinein OH nightglow intensity [see Huang and Hickey, 2008,Figure 7] until a steady state is reached. When an upwardpropagating gravity wave is present, the wave acts to increasethe airglow intensity. Huang and Hickey [2008, Figure 4]shows the simulation result of the wave packet competing
Table 2. Initial and Final Peak Values (K d�1) and Peak Altitudes(km) at 18°S
Qi Qf Percent Zi Zf DZ
Q1 1.31 1.83 39.7 90 90 –Q2 1.04 1.11 6.7 76 76 –Q3 1.12 1.2 7.1 76 76 –Q4 5.64 6.8 20.6 101 97 �4Q5 2.01 2.84 41.3 90 90 –Q6 3.64 5.08 39.6 90 90 –Q7 0.16 0.22 37.5 94–95 92 �2 � �3Qtotal 9.26 13.35 44.2 92 91 �1
Table 3. Initial and Final Peak Values (K d�1) and Peak Altitudes(km) at 18°N
Qi Qf Percent Zi Zf DZ
Q1 1.64 2.31 40.9 90 90 –Q2 0.99 1.06 7.1 74 74 –Q3 1.08 1.15 6.5 74 74 –Q4 7.38 8.83 19.6 100 97 �3Q5 2.65 3.63 37 92 91 �1Q6 4.8 6.79 41.5 92 91 �1Q7 0.24 0.31 29.2 96 96 –Qtotal 13.08 17.12 30.9 96 96 –
HUANG AND HICKEY: WAVE-INDUCED VARIATIONS IN HEATING A02307A02307
7 of 11
against the initial tendency. Their result seems to support thehypothesis that the steep declines in OH nightglow intensityare associated with weak gravity wave activity [Hecht andWalterscheid, 1991]. Not only that, their result is not in
disagreement with the findings by Hostetler and Gardner[1994] since gravity waves have to be large enough toovercome the declines caused by the initial tendency. Theobserved steep increases or declines in the airglow intensity
Figure 7. The mean wave-induced exothermic heating rates for 18°S. The black curve with open circlesdenotes Q1, the blue curve with open triangles denotes Q2, the orange curve with open squares denotes Q3,the blue curve with solid diamonds denotes Q4, the green curve with solid circles denotes Q5, the red curvewith solid triangles denotes Q6, the black curve with solid squares denotes Q7, and the orange solid curvedenotes Qtotal. The mean wave-induced total heating rate peaks at 88 km with a value of 1.98 K d�1.
Figure 8. As in Figure 7 except for 18°N. The mean wave-induced total heating rate peaks at 89 kmwith avalue of 2.19 K d�1.
HUANG AND HICKEY: WAVE-INDUCED VARIATIONS IN HEATING A02307A02307
8 of 11

and other observed features can be quite accurately simu-lated by our 2-D nonlinear, time-dependent OH nightglowchemistry-dynamics model.[20] From Table 1, we can see that the OH nightglow
chemiluminescence is determined in part by the numberdensity of OH* (v = 8) in reaction R8. A larger numberdensity of OH* (v = 8) leads to a larger OH nightglowintensity if it radiates faster than it reacts with O or otherspecies. Although OH*(v = 8) also contributes to heating,e.g., Q7 from reaction R9, we can see from Figures 4 and 5that heating from Q7 is very small (less than 2% of the totalheating). If other higher vibrational modes were considered,the combined number densities of the OH in higher vibra-tional modes would be larger (reaction R6), which would leadto more OH* (v > 0) available for chemiluminescencethrough reaction R8 and fewer OH* to react with O to gen-erate heat. Nevertheless, as mentioned above, the heat con-tribution from Q7 is not significant. Our model considers onesingle vibrational mode, v = 8. Some might argue that ourcalculated heating rates might be an overestimate since otherOH vibrational modes were not considered. As discussed byMlynczak and Solomon [1993], there is a large uncertainty inthe heating efficiency associated with the H + O3 reaction,and one of the uncertainties comes from not knowing theexact nascent distribution of exothermicity within the OHvibrational modes. Given the large uncertainty in the heatingefficiency, a 0.6 is recommended for the H + O3 reaction. Inour model, we used the recommended heating efficiency, andhence our simulation results can be deemed reasonable.[21] The initial and final exothermic heating rates and the
mean wave-induced exothermic heating rates at 18°S and18°N were presented. It is found that the wave packet hassimilar effects on the exothermic heating rates at both lati-tudes. Since the model uses the same wave packet for bothlatitudes, the only difference comes from the different initialprofiles of gas species and temperatures (figures not shown).The initial profiles of N2 and O2 at 18°N are larger than thoseat 18°S while the initial temperature profiles in the region ofinterest show that the temperature at 18°N is smaller above89 km and larger below that altitude than the temperature at18°S. The larger major gas species concentrations combinedwith the temperature structure at 18°N gives rise to higherheating rates.[22] We compare our current results with the earlier results
of a 30 km wave packet at 82°N found by Hickey et al.[2003]. Since the only different inputs in both studies arethe initial basic states, it is found that they share similar fea-tures. The initial H + O3 heating rate peaks at 92 km altitude
with a value of�3.5 K d�1 at 82°N, whereas at 18°N it peaksat the same altitude but with a larger value 4.8 K d�1, and itpeaks at 90 km altitude with a value of 3.64 K d�1 at 18°S.The final H + O3 heating rate at 82°N peaks at �91 kmaltitude with a value of 4.8 K d�1. Our results show that itpeaks at 91 km altitude with a value of 6.79 K d�1 at 18°Nand at 90 km altitude with a value of 5.08 K d�1 at 18°S.Their initial total exothermic heating rate peaks at �94 kmaltitude with a value of �10.4 K d�1, and their final totalexothermic heating rate peaks at �91 km with a value of�13.8 K d�1. Comparing these numbers with our resultslisted in Table 2 (for 18°S) and Table 3 (for 18°N), it is foundthat their initial total heating rate at 82°N is smaller than ourvalue at 18°N (13.08 K d�1) and slightly larger than the valueat 18°S (9.26 K d�1). The final total heating rate shows thatthe value at 18°N (17.12 K d�1) is the largest, followed by thevalue at 82°N (13.8 K d�1), and last by the value at 18°S(13.35 K d�1). The initial peak altitude occurs at a higheraltitude of 96 km at 18°N followed by 94 km altitude at 82°Nand then 92 km altitude at 18°S. The final peak altitude isdisplaced downward by 3 km at 82°N, and by 1 km at 18 S,while no change occurs at 18°N. The peak value of the meanwave-induced heating rate is 1.8 K d�1 located �90 kmaltitude at 82°N. Our study shows that it is 1.98 K d�1 at88 km altitude at 18°S and 2.19 K d�1 at 89 km altitude at18°N. These comparisons seem to suggest that the H + O3
heating rate, the total heating rate, and the mean wave-induced heating rate at 82°N are closer to those at 18°S, whilethe peak altitudes of the heating rates at 82°N lie somewhatin between the peak altitudes occurring at 18°N and 18°S.[23] Previous steady state studies of gravity wave effects
on exothermic heating rates show that gravity waves act tomitigate heating [Hickey and Walterscheid, 1994; Xu et al.,2000]. However, a recent study using a time-dependent,nonlinear OH chemistry-dynamics model shows that a dis-sipative, transient gravity wave packet can in fact induce amean heating in the OH nightglow region and a mean coolingabove the nightglow region [Hickey et al., 2003]. Their studywas for a latitude of 82°N, and they focused on the meanwave-induced heating rates. We focus our study on therespective contribution of each exothermic reaction at lowerlatitudes and on the mean wave-induced variations in eachheating rate. Our study also shows similar features: The wavepacket induces enhanced chemical exothermic heating in theOH airglow region and diminishes chemical exothermicheating above it. Further, our study indicates that the majorheat contributor is the three-body recombination followedby the H + O3 reaction. These two reactions are also the twoleading cooling reactions above �100 km.[24] Mlynczak and Solomon [1991] calculated the H + O3
heating rates and showed them in contour plots. Mlynczakand Solomon [1991, Figure 1] show the results using thecollisional quenching rates taken from the sudden-deathmodel of McDade and Llewellyn [1987], and their Figure 2shows the results using the collisional quenching rates takenfrom the single-quantum-step model of Lopez-Moreno et al.[1987]. From inspection of the contour plots of Mlynczakand Solomon [1991], the H + O3 heating rates are around2.5 to 5 K d�1 at 18°S and 2 to 4 K d�1 at 18°N. Comparingthose numbers with our initial H + O3 heating rates (Q6 inTables 2 and 3) shows that our values at 18°S (3.64 K d�1)and at 18°N (4.8 K d�1) are similar to their values. We use
Table 4. The Peak Values (K d�1) and the Peak Altitudes (km) ofthe Mean Wave-Induced Heating Rates at 18°S and 18°N
18°S 18°N
Qavg Zpeak Qavg Zpeak
Q1 0.30 87 0.32 87Q2 0.08 83 0.08 83Q3 0.09 83 0.09 83Q4 0.81 94 1.05 95Q5 0.49 87 0.53 88Q6 0.88 87 0.95 88Q7 0.03 90 0.04 92Qtotal 1.98 88 2.19 89
HUANG AND HICKEY: WAVE-INDUCED VARIATIONS IN HEATING A02307A02307
9 of 11

our initial values to compare with their calculations sincetheir calculations did not include dynamics and thus werebased solely on chemistry. Exothermic heating rates, usingan extended set of exothermic reactions assuming nochemiluminescent loss and no dynamics, were calculated byMlynczak and Solomon [1993]. The first seven exothermicheating reactions appearing in the work by Mlynczak andSolomon [1993, Table 4] were identified to make the mostsignificant contributions to the total heating rates. Mlynczakand Solomon [1993, Figure 12] show the nighttime heatingrates, obtained by summing the heating rates of the first sevenreactions, to be�8–9 K d�1 at 18°N and� 13 K d�1 at 18°S.Again, since they did not include dynamics in their calcula-tions, we use our initial values for comparison. We obtainvalues of�13 K d�1 at 18°N and�9 K d�1 at 18°S. We notethat their value at 18°N is similar to our value at 18°S, andvice versa. The differences might result from the differentchemical reactions considered in each study. We did notinclude the O + O3 reaction in our study. However, as pointedout byMlynczak and Solomon [1993], the O + O3 reaction isonly a minor source of heat in the lower thermosphere. Ourmodel included four additional reactions to allow for radia-tion loss and quenching by O, O2, and N2, which was notconsidered by Mlynczak and Solomon [1993].[25] In addition to causing irreversible changes in the
chemical exothermic heating, gravity waves also cause irre-versible dynamical heating that is directly due to the diver-gence of the wave-driven sensible heat flux [Walterscheid,1981]. Hickey and Walterscheid [1994] compared thewave-driven exothermic heating with the dynamical heatingand found that the latter exceeded the former by a factor of�20 near 85 km altitude for a 1 h, 140 m s�1 wave. We havecalculated the dynamical heating for our 20 min, 25 m s�1
wave (not shown) and compared it with the wave-drivenexothermic heating at an altitude of 90 km (which is theapproximate height of maximum wave effects on the exo-thermic heating). We find that the dynamical heating rate is�0.05 K d�1, which is significantly smaller than the wave-driven exothermic heating rate of �2.2 K d�1 (see Figure 8)at this height. However, the dynamical heating continues togrow with increasing altitude, reaching values of �1.5 and11 K d�1 at altitudes of 100 and 105 km, respectively, whichexceeds the wave-driven exothermic heating rates at thesealtitudes. Note that the wave we are studying is muchslower than the wave of Hickey and Walterscheid [1994],and the earlier study used a steady state model to evaluatethe wave effects on the chemical exothermic heating whilewe have used a time-dependent model. Hence a direct com-parison between these two model results should be madewith caution.
5. Conclusions
[26] We investigate gravity wave effects on exothermicheating rates at 18°S and 18°N with a 2-D, time-dependent,nonlinear OH nightglow chemistry-dynamics model. Oursimulation results show that the wave packet can induce thelargest secular increase of �50% in O3, followed by O(�42%) and then OH (v = 8) (�29%) at the end of the sim-ulation. These results indicate that significant secular varia-tions in the gas species’ number densities can be induced by apassage of a transient, dissipative gravity wave packet. With
the large secular variations in the number densities, it isexpected that there are large heating rate variations inducedby the wave packet since the heating rates are proportional tothe product of gas species’ number densities. The wave-induced downward flux of O in the airglow region playsa significant role in the secular increases in the number den-sities and hence the heating rates. The increase of O in theairglow region increases the atomic oxygen number densityin the reactions that produce O3 and OH*, which eventuallyleads to a steep increase in the airglow intensity. The O3
increase is a consequence of the combination of the enhancedO number density in chemical reactions and wave dynamics.These results elucidate the role of the gravity wave packet inthe airglow intensity variations and show that the ultimatedriver for the increases is the gravity-wave-driven downwardtransport of O. The largest heating of the exothermic chemicalreactions is from the three-body recombination O + O + M,and the second largest is from the H + O3 reaction. Exothermicheating is the single largest heat source in the OH nightglowregion and with a dissipative gravity wave packet propagat-ing through that region exothermic heating can be increasedsignificantly. Further, the heating region can be altered anddisplaced downward. Our simulation results show that thewave packet overall acts to increase heating in the OH air-glow region and to decrease the heating above the region.The peak values and peak altitudes of the total mean wave-induced exothermic heating rates are 1.98 K d�1 (28.3%) at88 km for 18°S and 2.19 K d�1 (24.4%) at 89 km for 18°N,respectively. Our simulation results show that gravity wavesnot only alter the vertical distribution of gas species’ con-centrations through combined effect of wave transport andchemistry but also induce significant variations in the exo-thermic heating rates in the MLT region.
[27] Acknowledgments. T.-Y. Huang acknowledges support fromU.S. NSF grant AGS-0836920 to The Pennsylvania State University.M. P. Hickey was supported by the National Science Foundation under grantATM-0639293.[28] Robert Lysak thanks the reviewers for their assistance in evaluating
this paper.
ReferencesBurstein, S. Z. (1967), Finite-difference calculations for hydrodynamicflows containing discontinuities, J. Comput. Phys., 2, 198–222,doi:10.1016/0021-9991(66)90003-9.
Garcia, R. R., and S. Solomon (1985), The effect of breaking gravitywaves on the dynamics and chemical composition of mesosphere andlower thermosphere, J. Geophys. Res., 90, 3850–3868, doi:10.1029/JD090iD02p03850.
Hecht, J. H., and R. L. Walterscheid (1991), Observations of the OHMeinel(6,2) and O2 atmospheric (0,1) Nightglow emissions from Maui duringthe ALOHA-90 campaign, Geophys. Res. Lett., 18, 1341–1344,doi:10.1029/91GL01152.
Hecht, J. H., S. K. Ramsay-Howat, R. L. Walterscheid, and J. R.Isler (1995), Observations of variations in airglow emissions duringALOHA-93, Geophys. Res. Lett., 22, 2817–2820, doi:10.1029/95GL03019.
Hedin, A. E. (1991), Extension of the MSIS thermosphere model intothe middle and lower thermosphere, J. Geophys. Res., 96, 1159–1172,doi:10.1029/90JA02125.
Hickey, M. P., and R. L. Walterscheid (1994), Wave-modified meanexothermic heating in the mesopause region, Geophys. Res. Lett., 21,2413–2416, doi:10.1029/94GL02504.
Hickey, M. P., and R. L.Walterscheid (2001), Secular variations of OI 5577 Åairglow in the mesopause region induced by transient gravity wave packets,Geophys. Res. Lett., 28, 701–704, doi:10.1029/2000GL012099.
Hickey, M. P., R. L. Walterscheid, and P. G. Richards (2000), Secular var-iations of atomic oxygen in the mesopause region induced by transient
HUANG AND HICKEY: WAVE-INDUCED VARIATIONS IN HEATING A02307A02307
10 of 11

gravity wave packets, Geophys. Res. Lett., 27, 3599–3602, doi:10.1029/2000GL011953.
Hickey, M. P., T.-Y. Huang, and R. Walterscheid (2003), Gravity wavepacket effects on chemical exothermic heating in the mesopause region,J. Geophys. Res., 108(A12), 1448, doi:10.1029/2002JA009363.
Hines, C. O. (1960), Internal atmospheric gravity waves at ionosphericheights, Can. J. Phys., 38, 1441–1481, doi:10.1139/p60-150.
Hostetler, C. A., and C. S. Gardner (1994), Observations of horizontal andvertical wave number spectra of gravity wave motions in the stratosphereand mesosphere over the mid-Pacific, J. Geophys. Res., 99, 1283–1302,doi:10.1029/93JD02927.
Huang, T.-Y., and M. P. Hickey (2007), On the latitudinal variations of thenon-periodic response of minor species induced by a dissipative gravity-wave packet in the MLT region, J. Atmos. Sol. Terr. Phys., 69, 741–757,doi:10.1016/j.jastp.2007.01.011.
Huang, T.-Y., and M. P. Hickey (2008), Secular variations of OHnightglow emission and of the OH intensity-weighted temperatureinduced by gravity-wave forcing in the MLT region, Adv. Space Res.,41, 1478–1487, doi:10.1016/j.asr.2007.10.020.
Kellogg, W. W. (1961), Chemical heating above the polar mesopausein winter, J. Meteorol., 18, 373–381, doi:10.1175/1520-0469(1961)018<0373:CHATPM>2.0.CO;2.
Liu, A. Z., and G. R. Swenson (2003), A modeling study of O2 and OHairglow perturbations induced by atmospheric gravity waves, J. Geophys.Res., 108(D4), 4151, doi:10.1029/2002JD002474.
Lopez-Moreno, J. J., R. Rodrigo, F. Moreno, M. Lopez-Puertas, andA. Molina (1987), Altitude distribution of vibrationally excited statesof atmospheric hydroxyl at levels v = 2 to v = 7, Planet. Space Sci., 35,1029–1038, doi:10.1016/0032-0633(87)90007-9.
McDade, I. C., and E. J. Llewellyn (1987), Kinetic parameters relatedto sources and sinks of vibrationally excited OH in the nightglow,J. Geophys. Res., 92, 7643–7650, doi:10.1029/JA092iA07p07643.
Mlynczak, M. G. (1996), Energetics of the middle atmosphere: Theory andobservation requirements, Adv. Space Res., 17(11), 117–126, doi:10.1016/0273-1177(95)00739-2.
Mlynczak, M. G., and S. Solomon (1991), Middle atmosphere heating byexothermic chemical reactions involving odd-hydrogen species, Geophys.Res. Lett., 18, 37–40, doi:10.1029/90GL02672.
Mlynczak, M. G., and S. Solomon (1993), A detailed evaluation of theheating efficiency in the middle atmosphere, J. Geophys. Res., 98,10,517–10,541, doi:10.1029/93JD00315.
Schubert, G., R. L. Walterscheid, and M. P. Hickey (1991), Gravitywave-driven fluctuations in OH nightglow from an extended, dissipativeemission region, J. Geophys. Res., 96, 13,869–13,880, doi:10.1029/91JA00562.
Taori, A., A. Guharay, and M. J. Taylor (2007), On the use of simultaneousmeasurements of OH and O2 emissions to investigate wave growth anddissipation, Ann. Geophys., 25, 639–643, doi:10.5194/angeo-25-639-2007.
Taylor, M. J., M. B. Bishop, and V. Taylor (1995), All-sky measurementsof short period waves imaged in the OI(557.7 nm), Na(589.2 nm) andnear infrared OH and O2(0,1) nightglow emissions during the ALOHA-93campaign, Geophys. Res. Lett., 22, 2833–2836, doi:10.1029/95GL02946.
Walterscheid, R. L. (1981), Dynamical cooling induced by dissipatinginternal gravity waves, Geophys. Res. Lett., 8, 1235–1238, doi:10.1029/GL008i012p01235.
Walterscheid, R. L., G. Schubert, and J. M. Straus (1987), A dynamical-chemical model of wave-driven fluctuations in the OH nightglow,J. Geophys. Res., 92, 1241–1254, doi:10.1029/JA092iA02p01241.
Xu, J., Y. Wang, and Y. Wang (2000), The loss of photochemical heatingcaused by gravity waves in the mesopause region, J. Atmos. Sol. Terr.Phys., 62, 37–45, doi:10.1016/S1364-6826(99)00091-7.
M. Hickey, Department of Physical Sciences, Embry-Riddle AeronauticalUniversity, 600 S. Clyde Morris Blvd., Daytona Beach, FL 32114, USA.T.-Y. Huang, Department of Physics, Pennsylvania State University-
Lehigh Valley, 2809 E. Saucon Valley Rd., Center Valley, PA 18034,USA. ([email protected])
HUANG AND HICKEY: WAVE-INDUCED VARIATIONS IN HEATING A02307A02307
11 of 11


