Embed Size (px)
Citation preview

Greater Giyani Local Municipality
Annual Financial Statements for the year ended 30 June 2016
Greater Giyani Local Municipality Annual Financial Statements for the year ended 30 June 2016
General Information
1
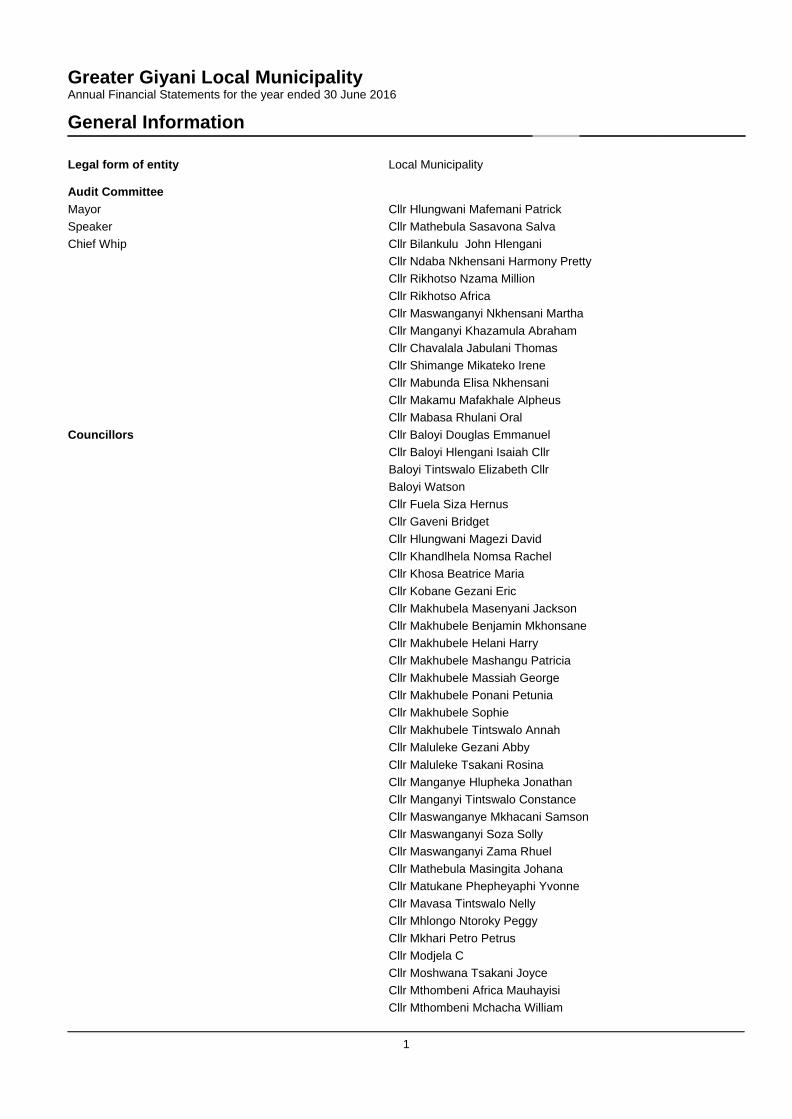
Legal form of entity Local Municipality
Audit Committee Mayor Cllr Hlungwani Mafemani Patrick Speaker Cllr Mathebula Sasavona Salva Chief Whip Cllr Bilankulu John Hlengani
Cllr Ndaba Nkhensani Harmony Pretty Cllr Rikhotso Nzama Million Cllr Rikhotso Africa Cllr Maswanganyi Nkhensani Martha Cllr Manganyi Khazamula Abraham Cllr Chavalala Jabulani Thomas Cllr Shimange Mikateko Irene Cllr Mabunda Elisa Nkhensani Cllr Makamu Mafakhale Alpheus Cllr Mabasa Rhulani Oral
Councillors Cllr Baloyi Douglas Emmanuel Cllr Baloyi Hlengani Isaiah Cllr Baloyi Tintswalo Elizabeth Cllr Baloyi Watson Cllr Fuela Siza Hernus Cllr Gaveni Bridget Cllr Hlungwani Magezi David Cllr Khandlhela Nomsa Rachel Cllr Khosa Beatrice Maria Cllr Kobane Gezani Eric Cllr Makhubela Masenyani Jackson Cllr Makhubele Benjamin Mkhonsane Cllr Makhubele Helani Harry Cllr Makhubele Mashangu Patricia Cllr Makhubele Massiah George Cllr Makhubele Ponani Petunia Cllr Makhubele Sophie Cllr Makhubele Tintswalo Annah Cllr Maluleke Gezani Abby Cllr Maluleke Tsakani Rosina Cllr Manganye Hlupheka Jonathan Cllr Manganyi Tintswalo Constance Cllr Maswanganye Mkhacani Samson Cllr Maswanganyi Soza Solly Cllr Maswanganyi Zama Rhuel Cllr Mathebula Masingita Johana Cllr Matukane Phepheyaphi Yvonne Cllr Mavasa Tintswalo Nelly Cllr Mhlongo Ntoroky Peggy Cllr Mkhari Petro Petrus Cllr Modjela C Cllr Moshwana Tsakani Joyce Cllr Mthombeni Africa Mauhayisi Cllr Mthombeni Mchacha William
Greater Giyani Local Municipality Annual Financial Statements for the year ended 30 June 2016
General Information
2
Audit Committee
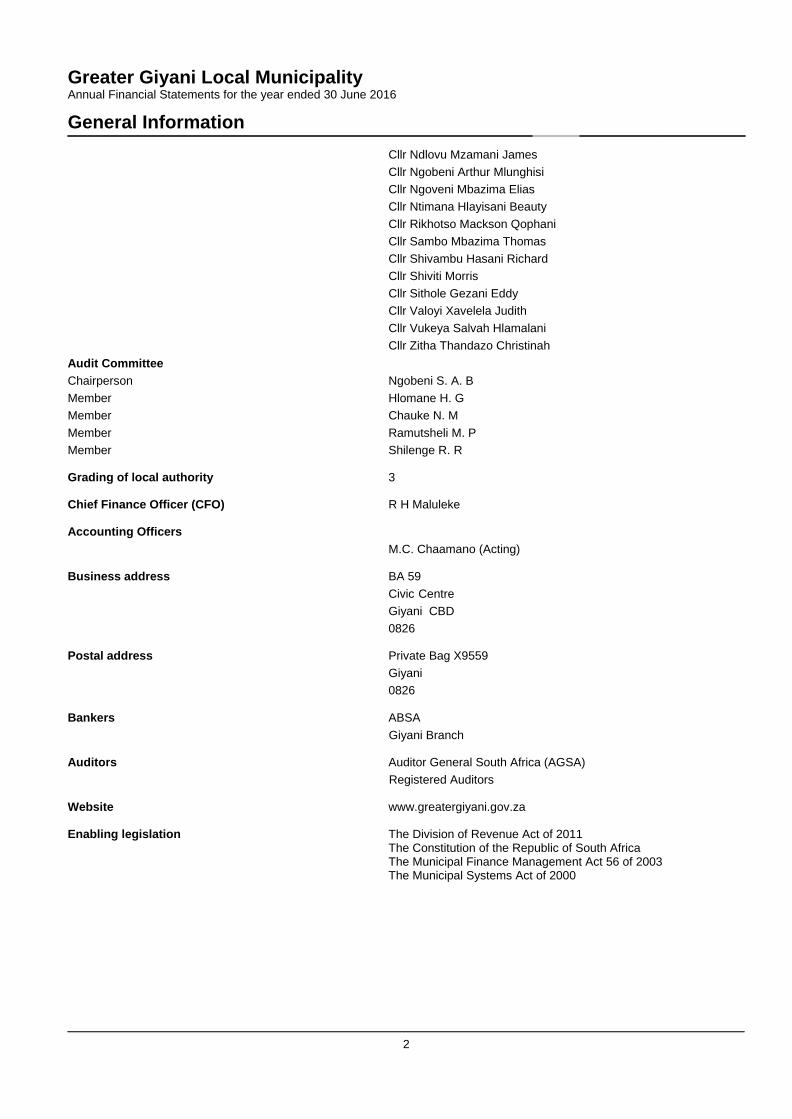
Cllr Ndlovu Mzamani James Cllr Ngobeni Arthur Mlunghisi Cllr Ngoveni Mbazima Elias Cllr Ntimana Hlayisani Beauty Cllr Rikhotso Mackson Qophani Cllr Sambo Mbazima Thomas Cllr Shivambu Hasani Richard Cllr Shiviti Morris Cllr Sithole Gezani Eddy Cllr Valoyi Xavelela Judith Cllr Vukeya Salvah Hlamalani Cllr Zitha Thandazo Christinah
Chairperson Ngobeni S. A. B Member Hlomane H. G Member Chauke N. M Member Ramutsheli M. P Member Shilenge R. R
Grading of local authority 3
Chief Finance Officer (CFO) R H Maluleke
Accounting Officers M.C. Chaamano (Acting)
Business address BA 59
Civic Centre Giyani CBD 0826
Postal address Private Bag X9559 Giyani 0826
Bankers ABSA Giyani Branch
Auditors Auditor General South Africa (AGSA)
Registered Auditors
Website www.greatergiyani.gov.za
Enabling legislation The Division of Revenue Act of 2011 The Constitution of the Republic of South Africa The Municipal Finance Management Act 56 of 2003 The Municipal Systems Act of 2000
3
Greater Giyani Local Municipality Annual Financial Statements for the year ended 30 June 2016
Index
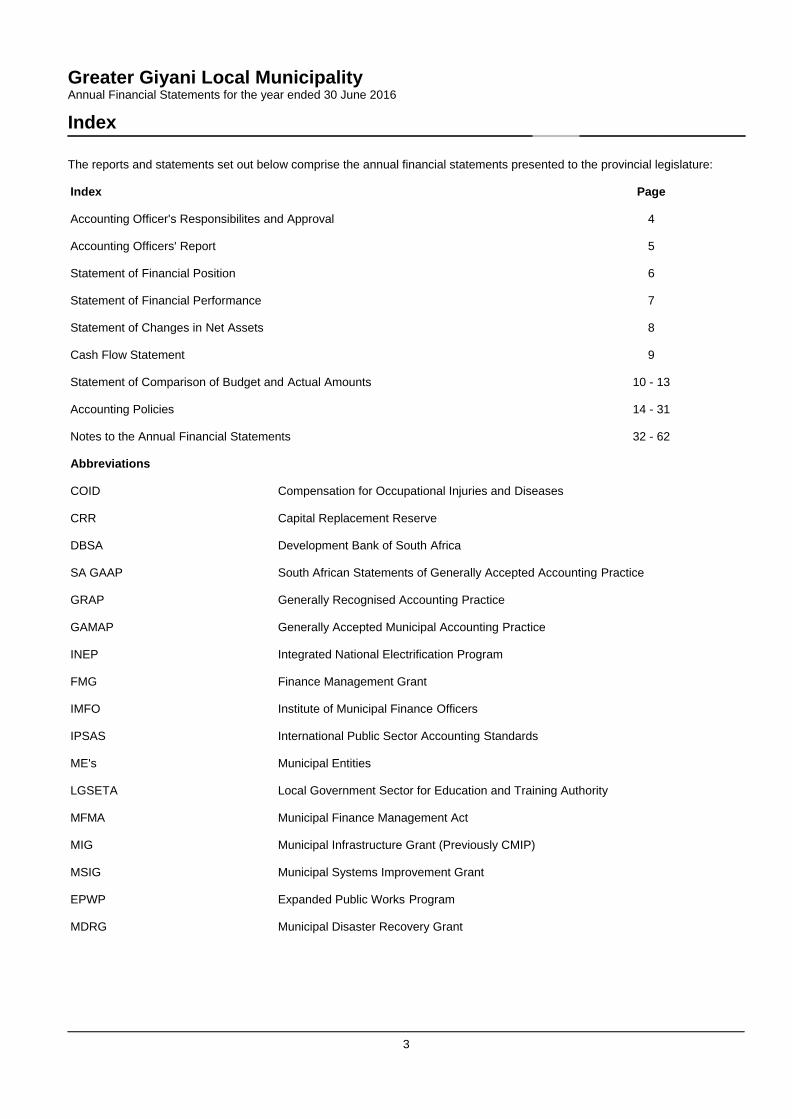
The reports and statements set out below comprise the annual financial statements presented to the provincial legislature:
Index Page
Accounting Officer's Responsibilites and Approval 4
Accounting Officers' Report 5
Statement of Financial Position 6
Statement of Financial Performance 7
Statement of Changes in Net Assets 8
Cash Flow Statement 9
Statement of Comparison of Budget and Actual Amounts 10 - 13
Accounting Policies 14 - 31
Notes to the Annual Financial Statements 32 - 62
Abbreviations
COID Compensation for Occupational Injuries and Diseases
CRR Capital Replacement Reserve
DBSA Development Bank of South Africa
SA GAAP South African Statements of Generally Accepted Accounting Practice
GRAP Generally Recognised Accounting Practice
GAMAP Generally Accepted Municipal Accounting Practice
INEP Integrated National Electrification Program
FMG Finance Management Grant
IMFO Institute of Municipal Finance Officers
IPSAS International Public Sector Accounting Standards
ME's Municipal Entities
LGSETA Local Government Sector for Education and Training Authority
MFMA Municipal Finance Management Act
MIG Municipal Infrastructure Grant (Previously CMIP)
MSIG Municipal Systems Improvement Grant
EPWP Expanded Public Works Program
MDRG Municipal Disaster Recovery Grant

4
Greater Giyani Local Municipality Annual Financial Statements for the year ended 30 June 2016
Accounting Officer's Responsibilites and Approval
The Accounting Officer is required by the Municipal Finance Management Act 56 of 2003, to maintain adequate accounting records and is responsible for the content and integrity of the Annual Financial Statements and related financial information included in this report. It is the responsibility of the accounting officer to ensure that the Annual Financial Statements fairly present the state of affairs of the municipality as at the end of the financial year and the results of its operations and cash flows for the period then ended. The external auditors are engaged to express an independent opinion of the Financial Statements and are given unrestricted access to all financial records and related data.
The Annual Financial Statements have been prepared in accordance with Standards of Generally Recognised Accounting Practice (GRAP) including any interpretations, guidelines and directives issued by the Accounting Standard Board.
The Annual Financial Statements are based upon appropriate accounting policies consistently applied and supported by reasonable and prudent judgements and estimate.
The Accounting Officer acknowledge that he is ultimately responsible for the system of internal financial control established by the municipality and place considerable importance of maintaining a strong control environment. To enable the accounting officer to meet these requirements, the Accounting Officer sets standards for internal control aimed at reducing the risk of error or deficit in a cost effective manner. The standards include the proper delegations of responsibilities within a clearly defined framework, effective accounting procedures and adequate segregation of duties to ensure an acceptable level of risk. These controls are monitored throughout the municipality and all employees are required to maintain the highest ethical standards in ensuring the municipality’s business is conducted in a manner that in all reasonable circumstances is above reproach. The focus of risk management in the municipality is on identifying, assessing, managing and monitoring all known forms of risk across the municipality. While operating risk cannot be fully eliminated, the municipality endeavours to minimise it by ensuring that appropriate infrastructure, controls, systems and ethical behaviour are applied and managed within predetermined procedures and constraints.
The Accounting Officer is of the opinion, based on the information and explanations given by management, that the system of internal control provides reasonable assurance that the financial records may be relied on for the preparation of the financial Statements. However, any system of internal financial control can provide only reasonable, and not absolute, assurance against material misstatement.
The Accounting Officer has reviewed the Municipality’s cash flow forecast for the year to 30 June 2017 and, in the light of this review and the current Financial Position, he is satisfied that the Municipality has or has access to adequate resources to continue in operational existence for the foreseeable future.
The Accounting Officer certifies that the salaries, allowances and benefits of councillors as disclosed in note 19 of these Annual Financial Statements are within the upper limits of the framework envisaged in section 219 of the constitution, read with the Remuneration of Public Officer Bearers Act (Act no 20 on 1998) and the Minister of Provincial and Local Government.
The external Auditors are responsible for independently reviewing and reporting on the Municipality’s Annual Financial Statements. The Annual Financial Statements are examined by the Municipality’s external Auditors and their report is presented to the council upon completion.
The Annual Financial Statements set out on pages 6 to 52, which have been prepared on the going concern basis, were approved on August 31 2016 and signed by:
M C CHAAMANO Accounting Officer Greater Giyani Municipality
31 August 2016
5
Greater Giyani Local Municipality Annual Financial Statements for the year ended 30 June 2016
Accounting Officers' Report
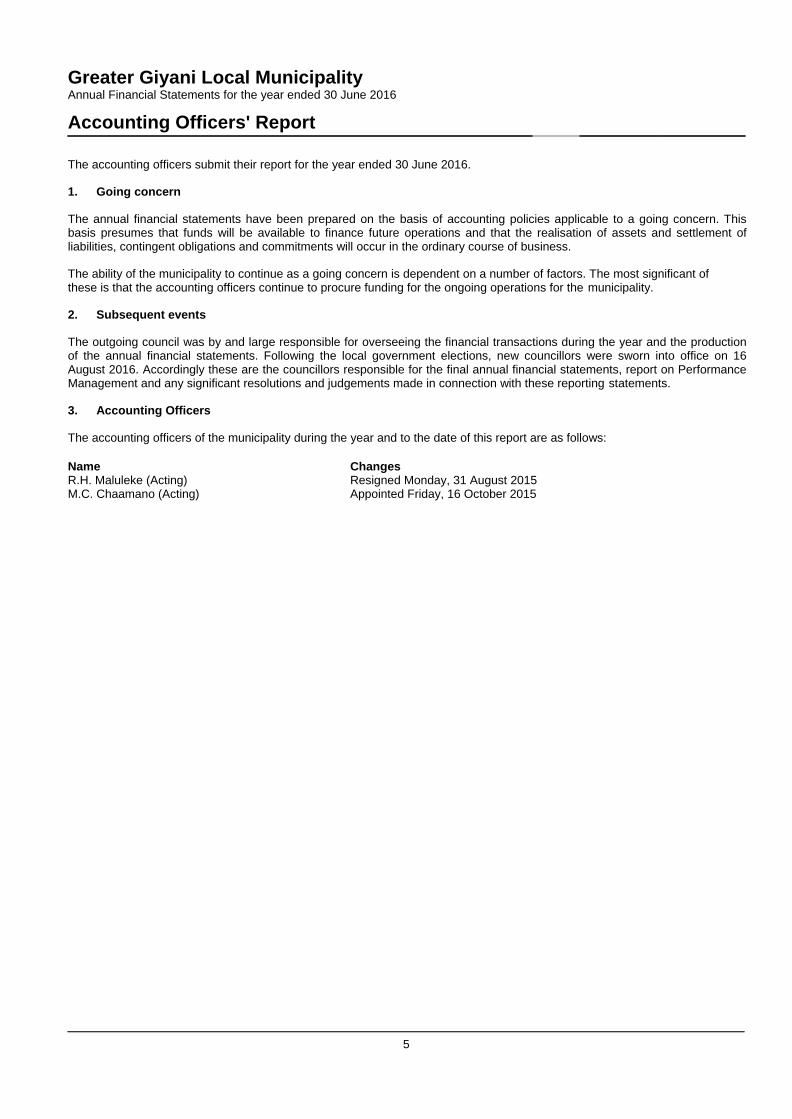
The accounting officers submit their report for the year ended 30 June 2016.
1. Going concern
The annual financial statements have been prepared on the basis of accounting policies applicable to a going concern. This basis presumes that funds will be available to finance future operations and that the realisation of assets and settlement of liabilities, contingent obligations and commitments will occur in the ordinary course of business.
The ability of the municipality to continue as a going concern is dependent on a number of factors. The most significant of these is that the accounting officers continue to procure funding for the ongoing operations for the municipality.
2. Subsequent events
The outgoing council was by and large responsible for overseeing the financial transactions during the year and the production of the annual financial statements. Following the local government elections, new councillors were sworn into office on 16 August 2016. Accordingly these are the councillors responsible for the final annual financial statements, report on Performance Management and any significant resolutions and judgements made in connection with these reporting statements.
3. Accounting Officers
The accounting officers of the municipality during the year and to the date of this report are as follows:
Name Changes R.H. Maluleke (Acting) Resigned Monday, 31 August 2015 M.C. Chaamano (Acting) Appointed Friday, 16 October 2015
Greater Giyani Local Municipality Annual Financial Statements for the year ended 30 June 2016
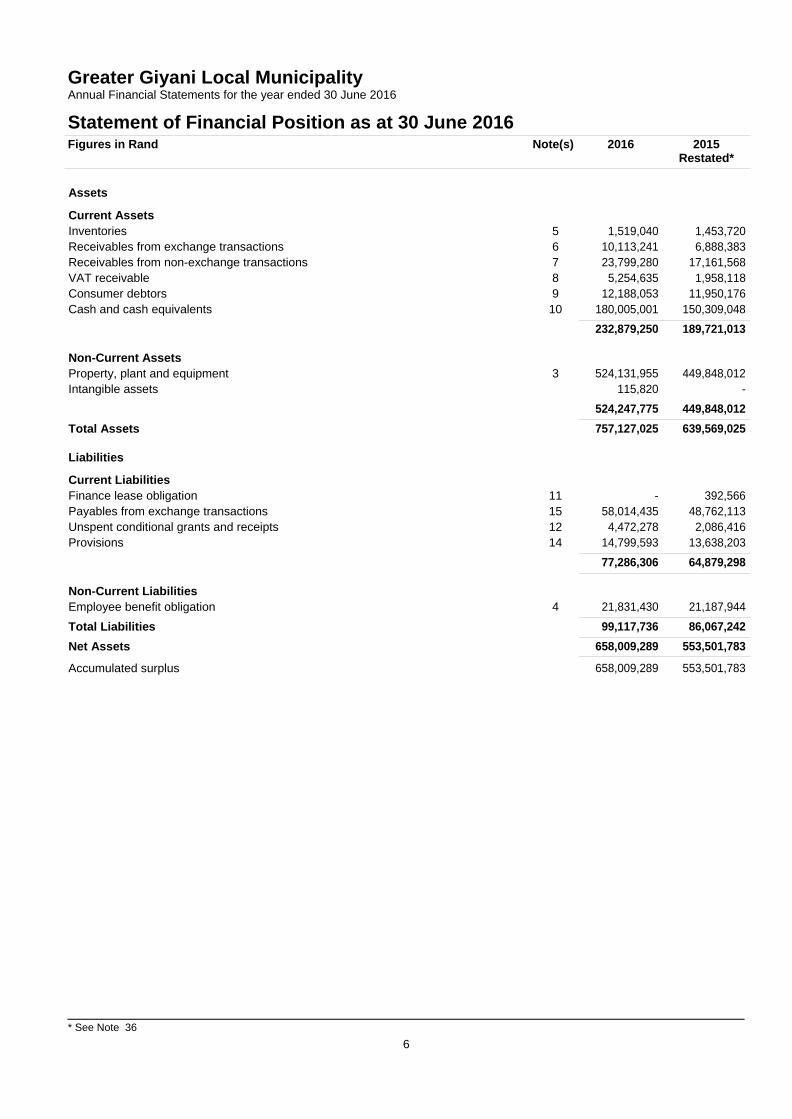
Statement of Financial Position as at 30 June 2016
* See Note 36 6
Figures in Rand Note(s) 2016 2015 Restated*
Assets
Current Assets Inventories
5
1,519,040
1,453,720
Receivables from exchange transactions 6 10,113,241 6,888,383 Receivables from non-exchange transactions 7 23,799,280 17,161,568 VAT receivable 8 5,254,635 1,958,118 Consumer debtors 9 12,188,053 11,950,176 Cash and cash equivalents 10 180,005,001 150,309,048
232,879,250 189,721,013
Non-Current Assets Property, plant and equipment
3
524,131,955
449,848,012 Intangible assets 115,820 -
524,247,775 449,848,012 Total Assets 757,127,025 639,569,025
Liabilities
Current Liabilities Finance lease obligation
11
-
392,566
Payables from exchange transactions 15 58,014,435 48,762,113 Unspent conditional grants and receipts 12 4,472,278 2,086,416 Provisions 14 14,799,593 13,638,203
77,286,306 64,879,298
Non-Current Liabilities Employee benefit obligation
4
21,831,430
21,187,944 Total Liabilities 99,117,736 86,067,242 Net Assets 658,009,289 553,501,783
Accumulated surplus 658,009,289 553,501,783
* See Note 36 7
Greater Giyani Local Municipality Annual Financial Statements for the year ended 30 June 2016
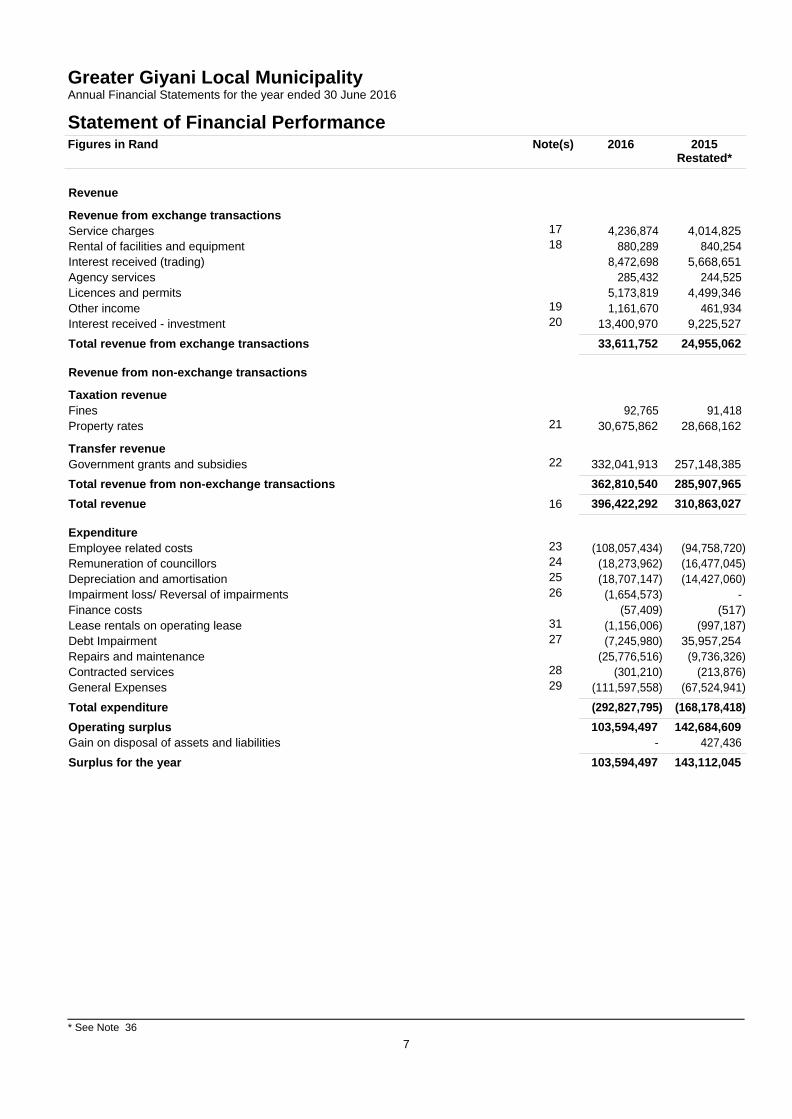
Statement of Financial Performance
Figures in Rand Note(s) 2016 2015 Restated*
Revenue
Revenue from exchange transactions Service charges
17
4,236,874
4,014,825
Rental of facilities and equipment 18 880,289 840,254 Interest received (trading) 8,472,698 5,668,651 Agency services 285,432 244,525 Licences and permits 5,173,819 4,499,346 Other income 19 1,161,670 461,934 Interest received - investment 20 13,400,970 9,225,527 Total revenue from exchange transactions 33,611,752 24,955,062
Revenue from non-exchange transactions
Taxation revenue Fines 92,765 91,418 Property rates 21 30,675,862 28,668,162
Transfer revenue Government grants and subsidies
22
332,041,913
257,148,385
Total revenue from non-exchange transactions 362,810,540 285,907,965 Total revenue 16 396,422,292 310,863,027
Expenditure Employee related costs
23
(108,057,434)
(94,758,720) Remuneration of councillors 24 (18,273,962) (16,477,045) Depreciation and amortisation 25 (18,707,147) (14,427,060) Impairment loss/ Reversal of impairments 26 (1,654,573) - Finance costs (57,409) (517) Lease rentals on operating lease 31 (1,156,006) (997,187) Debt Impairment 27 (7,245,980) 35,957,254 Repairs and maintenance (25,776,516) (9,736,326) Contracted services 28 (301,210) (213,876) General Expenses 29 (111,597,558) (67,524,941) Total expenditure (292,827,795) (168,178,418) Operating surplus 103,594,497 142,684,609 Gain on disposal of assets and liabilities - 427,436 Surplus for the year 103,594,497 143,112,045
* See Note 36 8
Greater Giyani Local Municipality Annual Financial Statements for the year ended 30 June 2016
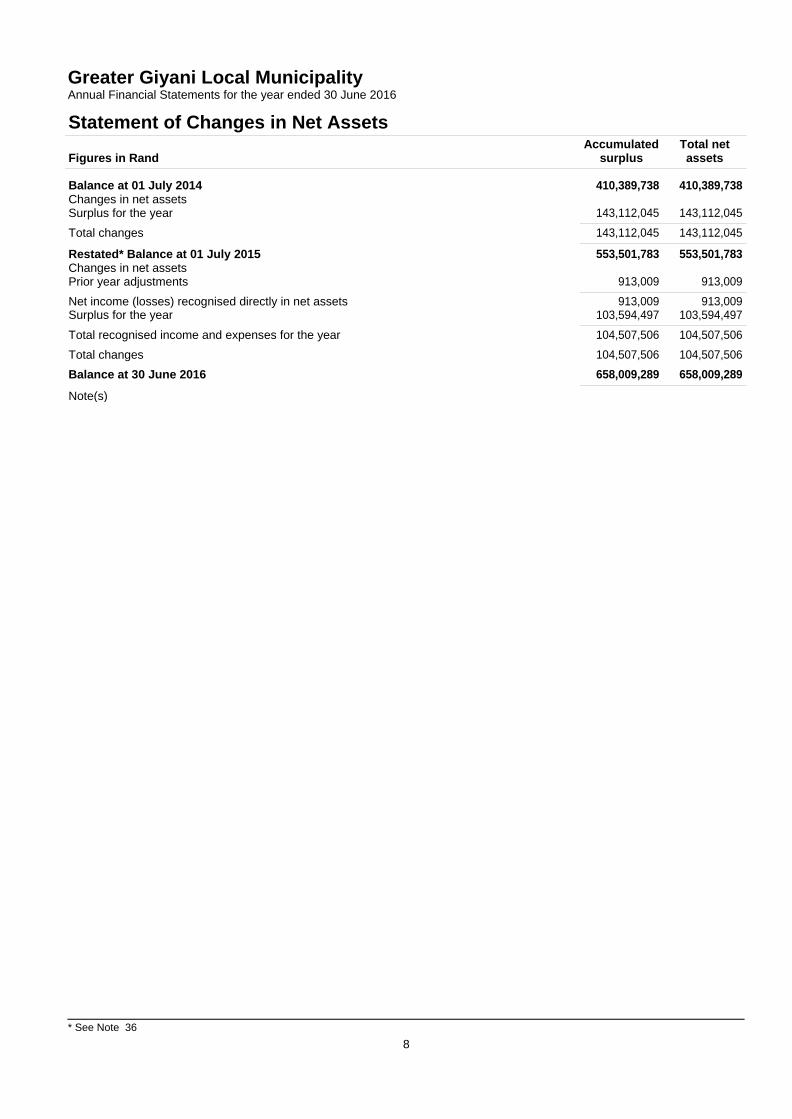
Statement of Changes in Net Assets
Figures in Rand
Accumulated surplus
Total net assets
Balance at 01 July 2014 410,389,738 410,389,738 Changes in net assets Surplus for the year
143,112,045
143,112,045
Total changes 143,112,045 143,112,045
Restated* Balance at 01 July 2015 553,501,783 553,501,783 Changes in net assets Prior year adjustments
913,009
913,009
Net income (losses) recognised directly in net assets 913,009 913,009 Surplus for the year 103,594,497 103,594,497
Total recognised income and expenses for the year 104,507,506 104,507,506 Total changes 104,507,506 104,507,506 Balance at 30 June 2016 658,009,289 658,009,289
Note(s)

* See Note 36 9
Greater Giyani Local Municipality Annual Financial Statements for the year ended 30 June 2016
Cash Flow Statement
Figures in Rand Note(s) 2016 2015 Restated*
Cash flows from operating activities
Receipts Taxation 31,927,637 18,769,969 Sale of goods and services 9,458,682 11,737,497 Grants 330,623,901 256,589,000 Interest income 13,400,970 9,225,527
385,411,190 296,321,993
Payments
Employee costs (125,687,910) (108,240,038) Suppliers (128,482,895) (65,301,220) Finance costs (57,409) (517)
(254,228,214) (173,541,775)
Net cash flows from operating activities 32 131,182,976 122,780,218 Cash flows from investing activities
Purchase of property, plant and equipment 3 (100,952,372) (60,499,785) Proceeds from sale of property, plant and equipment 3 - 1,776,608 Purchase of other intangible assets (142,085) -
Net cash flows from investing activities (101,094,457) (58,723,177) Cash flows from financing activities
Finance lease payments (392,566) (391,605)
Net increase/(decrease) in cash and cash equivalents
29,695,953
63,665,436
Cash and cash equivalents at the beginning of the year 150,309,048 86,643,612
Cash and cash equivalents at the end of the year 10 180,005,001 150,309,048
Greater Giyani Local Municipality Annual Financial Statements for the year ended 30 June 2016
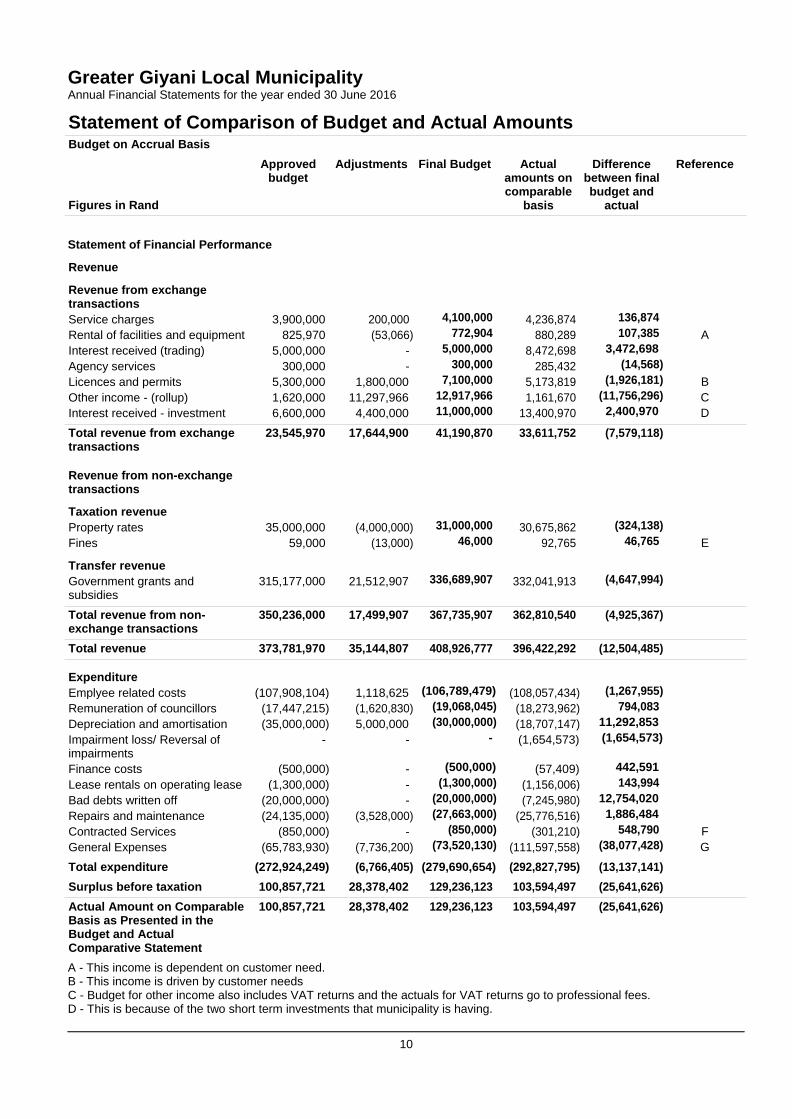
Statement of Comparison of Budget and Actual Amounts
10
Budget on Accrual Basis Approved
budget Figures in Rand
Adjustments Final Budget Actual amounts on comparable
basis
Difference between final budget and
actual
Reference
Statement of Financial Performance
Revenue
Revenue from exchange transactions Service charges 3,900,000
200,000
4,100,000
4,236,874
136,874
Rental of facilities and equipment 825,970 (53,066) 772,904 880,289 107,385 A Interest received (trading) 5,000,000 - 5,000,000 8,472,698 3,472,698 Agency services 300,000 - 300,000 285,432 (14,568) Licences and permits 5,300,000 1,800,000 7,100,000 5,173,819 (1,926,181) B Other income - (rollup) 1,620,000 11,297,966 12,917,966 1,161,670 (11,756,296) C Interest received - investment 6,600,000 4,400,000 11,000,000 13,400,970 2,400,970 D
Total revenue from exchange 23,545,970 transactions
17,644,900 41,190,870 33,611,752 (7,579,118)
Revenue from non-exchange transactions
Taxation revenue Property rates 35,000,000
(4,000,000)
31,000,000
30,675,862
(324,138)
Fines 59,000 (13,000) 46,000 92,765 46,765 E
Transfer revenue Government grants and 315,177,000
21,512,907
336,689,907
332,041,913
(4,647,994)
subsidies Total revenue from non- 350,236,000 exchange transactions
17,499,907 367,735,907 362,810,540 (4,925,367)
Total revenue 373,781,970 35,144,807 408,926,777 396,422,292 (12,504,485)
Expenditure Emplyee related costs (107,908,104)
1,118,625
(106,789,479)
(108,057,434)
(1,267,955)
Remuneration of councillors (17,447,215) (1,620,830) (19,068,045) (18,273,962) 794,083 Depreciation and amortisation (35,000,000) 5,000,000 (30,000,000) (18,707,147) 11,292,853 Impairment loss/ Reversal of - impairments Finance costs (500,000)
-
-
-
(500,000)
(1,654,573)
(57,409)
(1,654,573)
442,591
Lease rentals on operating lease (1,300,000) - (1,300,000) (1,156,006) 143,994 Bad debts written off (20,000,000) - (20,000,000) (7,245,980) 12,754,020 Repairs and maintenance (24,135,000) (3,528,000) (27,663,000) (25,776,516) 1,886,484 Contracted Services (850,000) - (850,000) (301,210) 548,790 F General Expenses (65,783,930) (7,736,200) (73,520,130) (111,597,558) (38,077,428) G Total expenditure (272,924,249) (6,766,405) (279,690,654) (292,827,795) (13,137,141) Surplus before taxation 100,857,721 28,378,402 129,236,123 103,594,497 (25,641,626) Actual Amount on Comparable 100,857,721 Basis as Presented in the Budget and Actual Comparative Statement
28,378,402 129,236,123 103,594,497 (25,641,626)
A - This income is dependent on customer need. B - This income is driven by customer needs C - Budget for other income also includes VAT returns and the actuals for VAT returns go to professional fees. D - This is because of the two short term investments that municipality is having.
Greater Giyani Local Municipality Annual Financial Statements for the year ended 30 June 2016
Statement of Comparison of Budget and Actual Amounts
11
Budget on Accrual Basis
Figures in Rand
Approved budget
Adjustments Final Budget Actual amounts on comparable
basis
Difference between final budget and
actual
Reference
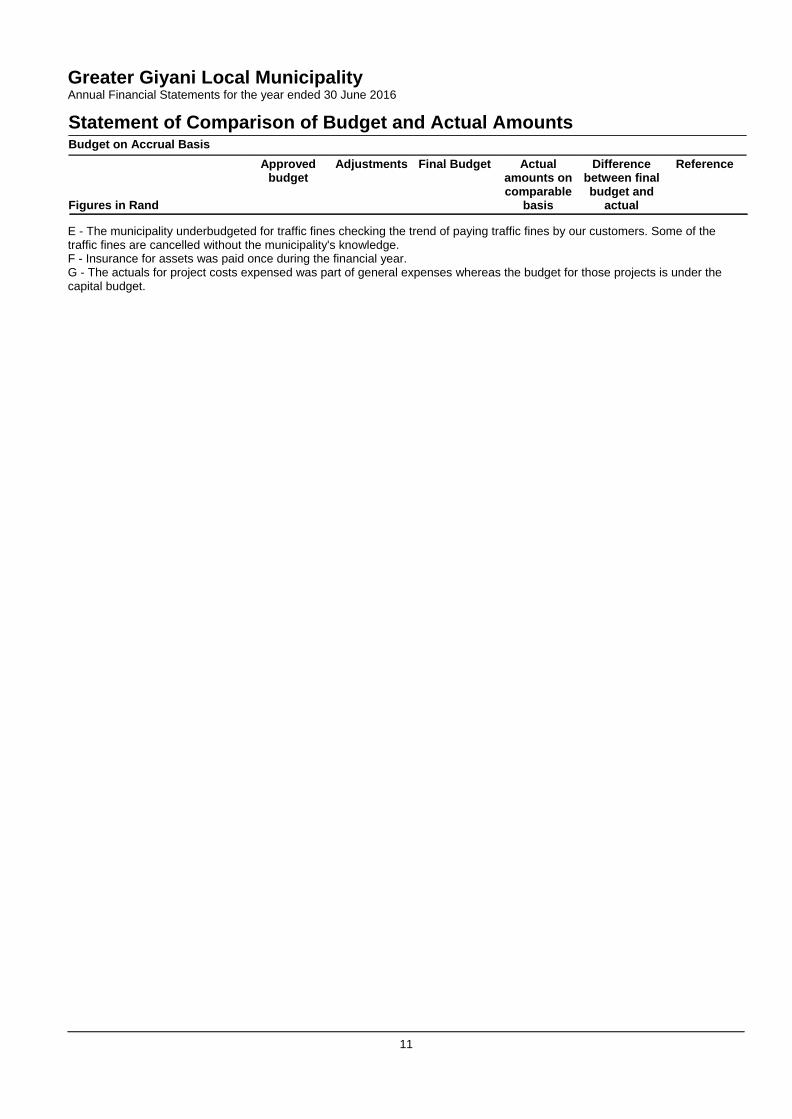
E - The municipality underbudgeted for traffic fines checking the trend of paying traffic fines by our customers. Some of the traffic fines are cancelled without the municipality's knowledge. F - Insurance for assets was paid once during the financial year. G - The actuals for project costs expensed was part of general expenses whereas the budget for those projects is under the capital budget.

Greater Giyani Local Municipality Annual Financial Statements for the year ended 30 June 2016
Statement of Comparison of Budget and Actual Amounts
12
Budget on Accrual Basis Figures in Rand
Approved budget
Adjustments Final Budget Actual amounts on comparable
basis
Difference between final budget and
actual
Reference
Statement of Financial Position
Assets
Current Assets Inventories
2,550,000
- 2,550,000
1,519,040
(1,030,960)
Receivables from exchange transactions Receivables from non-exchange
745,365
15,792,498
- 745,365
- 15,792,498
10,113,241
15,790,704
9,367,876
(1,794)
transactions VAT receivable
3,892,137
- 3,892,137
5,254,635
1,362,498
Consumer debtors 34,763,000 - 34,763,000 20,196,629 (14,566,371) Cash and cash equivalents 48,960,000 - 48,960,000 180,005,001 131,045,001 106,703,000 - 106,703,000 232,879,250 126,176,250
Non-Current Assets Property, plant and equipment
382,346,000
- 382,346,000
524,131,955
141,785,955
Intangible assets 115,820 - 115,820 115,820 - 382,461,820 - 382,461,820 524,247,775 141,785,955 Total Assets 489,164,820 - 489,164,820 757,127,025 267,962,205
Liabilities
Current Liabilities Payables from exchange
57,739,000
- 57,739,000
58,014,435
275,435
transactions Unspent conditional grants and
-
- -
4,472,278
4,472,278
receipts Provisions
-
- -
14,799,593
14,799,593
57,739,000 - 57,739,000 77,286,306 19,547,306
Non-Current Liabilities Employee benefit obligation
-
- -
21,831,430
21,831,430
Total Liabilities 57,739,000 - 57,739,000 99,117,736 41,378,736 Net Assets 431,425,820 - 431,425,820 658,009,289 226,583,469
Net Assets
Net Assets Attributable to Owners of Controlling Entity
Reserves Accumulated surplus
431,425,820
- 431,425,820
658,009,290
226,583,470
Greater Giyani Local Municipality Annual Financial Statements for the year ended 30 June 2016
Statement of Comparison of Budget and Actual Amounts
13
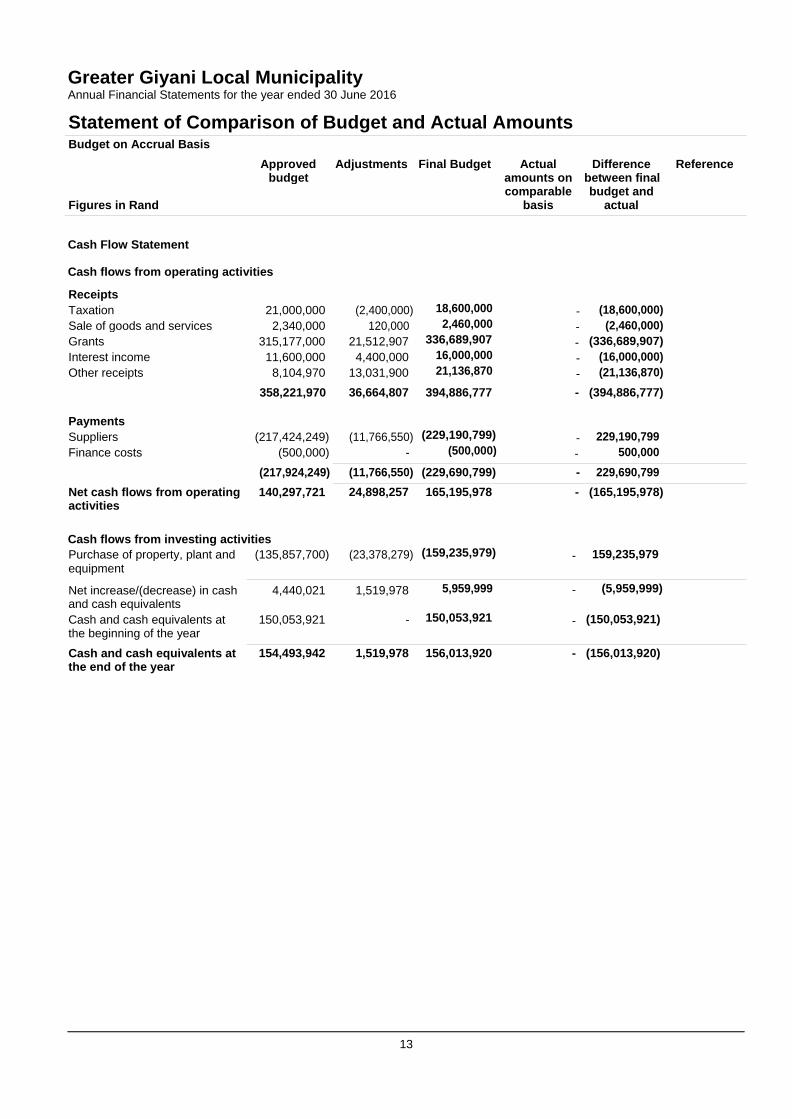
Budget on Accrual Basis Approved Adjustments Final Budget Actual Difference Reference
budget amounts on between final comparable budget and Figures in Rand basis actual Cash Flow Statement
Cash flows from operating activities
Receipts Taxation 21,000,000 (2,400,000) 18,600,000 - (18,600,000) Sale of goods and services 2,340,000 120,000 2,460,000 - (2,460,000) Grants 315,177,000 21,512,907 336,689,907 - (336,689,907) Interest income 11,600,000 4,400,000 16,000,000 - (16,000,000) Other receipts 8,104,970 13,031,900 21,136,870 - (21,136,870)
358,221,970 36,664,807 394,886,777 - (394,886,777)
Payments Suppliers (217,424,249) (11,766,550) (229,190,799) - 229,190,799 Finance costs (500,000) - (500,000) - 500,000
(217,924,249) (11,766,550) (229,690,799) - 229,690,799 Net cash flows from operating 140,297,721 24,898,257 165,195,978 - (165,195,978) activities
Cash flows from investing activities
Purchase of property, plant and (135,857,700) (23,378,279) (159,235,979) - 159,235,979 equipment Net increase/(decrease) in cash 4,440,021 1,519,978 5,959,999 - (5,959,999) and cash equivalents Cash and cash equivalents at 150,053,921 - 150,053,921 - (150,053,921) the beginning of the year Cash and cash equivalents at 154,493,942 1,519,978 156,013,920 - (156,013,920) the end of the year
14
Greater Giyani Local Municipality Annual Financial Statements for the year ended 30 June 2016
Accounting Policies
1. Presentation of Annual Financial Statements
The annual financial statements have been prepared in accordance with the Standards of Generally Recognised Accounting Practice (GRAP), issued by the Accounting Standards Board in accordance with Section 122(3) of the Municipal Finance Management Act (Act 56 of 2003).
These annual financial statements have been prepared on an accrual basis of accounting and are in accordance with historical cost convention as the basis of measurement, unless specified otherwise. They are presented in South African Rand.
The cashflow statement has has been prepared in accordance with the direct method.
Assets, liabilities, revenues and expenses were not offset, except where offsetting is either required or permitted by a Standard of GRAP.
A summary of the significant accounting policies, which have been consistently applied in the preparation of these annual financial statements, are disclosed below.
These accounting policies are consistent with the previous period.
1.1 Going concern assumption
These annual financial statements have been prepared based on the expectation that the municipality will continue to operate as a going concern for at least the next 12 months.
1.2 Significant judgements and sources of estimation uncertainty
In preparing the annual financial statements, management is required to make estimates and assumptions that affect the amounts represented in the annual financial statements and related disclosures. Use of available information and the application of judgement is inherent in the formation of estimates. Actual results in the future could differ from these estimates which may be material to the annual financial statements. Significant judgements include:
Loans and receivables
The municipality assesses its trade receivables, held to maturity investments and loans and receivables for impairment at the end of each reporting period. In determining whether an impairment loss should be recorded in surplus or deficit, the municipality makes judgements as to whether there is observable data indicating a measurable decrease in the estimated future cash flows from a financial asset.
Fair value estimation
The carrying value less impairment provision of trade receivables and payables are assumed to approximate their fair values. The fair value of financial liabilities for disclosure purposes is estimated by discounting the future contractual cash flows at the current market interest rate that is available to the municipality for similar financial instruments.
Impairment testing
The recoverable amounts of cash-generating units and individual assets have been determined based on the higher of value- in-use calculations and fair values less costs to sell. These calculations require the use of estimates and assumptions.
The municipality reviews and tests the carrying value of assets when events or changes in circumstances suggest that the carrying amount may not be recoverable. Assets are grouped at the lowest level for which identifiable cash flows are largely independent of cash flows of other assets and liabilities. If there are indications that impairment may have occurred, estimates are prepared of expected future cash flows for each group of assets. Expected future cash flows used to determine the value in use of goodwill and tangible assets are inherently uncertain and could materially change over time.
Useful lives of property, plant and equipment
The municipality's management determines the estimated useful lives and related depreciation charges for the waste water and water networks. This estimate is based on industry norm. Management will increase the depreciation charge where useful lives are less than previously estimated useful lives.
15
Greater Giyani Local Municipality Annual Financial Statements for the year ended 30 June 2016
Accounting Policies
1.2 Significant judgements and sources of estimation uncertainty (continued)
Post retirement benefits
The present value of the post retirement obligation depends on a number of factors that are determined on an actuarial basis using a number of assumptions. The assumptions used in determining the net cost (income) include the discount rate. Any changes in these assumptions will impact on the carrying amount of post retirement obligations.
Other key assumptions for pension obligations are based on current market conditions. Additional information is disclosed in Note 4.
Effective interest rate
The municipality used the prime interest rate to discount future cash flows.
Debtors impairment
The provision for impairment is measured with reference to historical data and payment trend analysis per group of consumers and/or category. An impairment loss is recognised in surplus and deficit when there is objective evidence that it is impaired. Provisions Provisions are recognized when the Municipality has a present legal or constructive obligation as a result of a past event, it is probable that an outflow of resources will be required to settle the obligation and the amount can be reasonably estimated.
1.3 Property, plant and equipment
Property, plant and equipment are tangible non-current assets (including infrastructure assets) that are held for use in the production or supply of goods or services, rental to others, or for administrative purposes, and are expected to be used during more than one period.
The cost of an item of property, plant and equipment is recognised as an asset when:
it is probable that future economic benefits or service potential associated with the item will flow to the municipality; and
the cost of the item can be measured reliably.
Property, plant and equipment is initially measured at cost.
The cost of an item of property, plant and equipment is the purchase price and other costs attributable to bring the asset to the location and condition necessary for it to be capable of operating in the manner intended by management. Trade discounts and rebates are deducted in arriving at the cost.
Where an asset is acquired through a non-exchange transaction, its cost is its fair value as at date of acquisition.
Where an item of property, plant and equipment is acquired in exchange for a non-monetary asset or monetary assets, or a combination of monetary and non-monetary assets, the asset acquired is initially measured at fair value (the cost). If the acquired item's fair value was not determinable, it's deemed cost is the carrying amount of the asset(s) given up.
When significant components of an item of property, plant and equipment have different useful lives, they are accounted for as separate items (major components) of property, plant and equipment.
Costs include costs incurred initially to acquire or construct an item of property, plant and equipment and costs incurred subsequently to add to, replace part of, or service it. If a replacement cost is recognised in the carrying amount of an item of property, plant and equipment, the carrying amount of the replaced part is derecognised.
Recognition of costs in the carrying amount of an item of property, plant and equipment ceases when the item is in the location and condition necessary for it to be capable of operating in the manner intended by management.
Property, plant and equipment is carried at cost less accumulated depreciation and any impairment losses.
Property, plant and equipment are depreciated on the straight line basis over their expected useful lives to their estimated residual value.
The useful lives of items of property, plant and equipment have been assessed as follows:
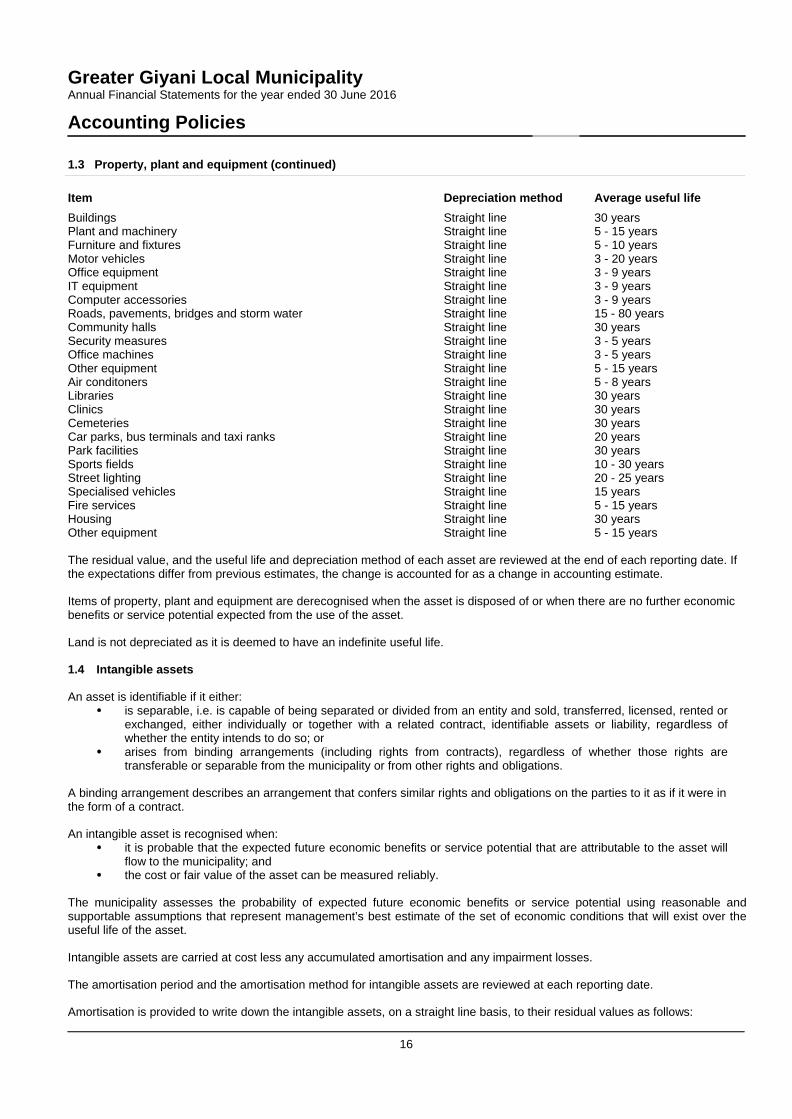
16
Greater Giyani Local Municipality Annual Financial Statements for the year ended 30 June 2016
Accounting Policies
1.3 Property, plant and equipment (continued) Item
Depreciation method
Average useful life
Buildings Straight line 30 years Plant and machinery Straight line 5 - 15 years Furniture and fixtures Straight line 5 - 10 years Motor vehicles Straight line 3 - 20 years Office equipment Straight line 3 - 9 years IT equipment Straight line 3 - 9 years Computer accessories Straight line 3 - 9 years Roads, pavements, bridges and storm water Straight line 15 - 80 years Community halls Straight line 30 years Security measures Straight line 3 - 5 years Office machines Straight line 3 - 5 years Other equipment Straight line 5 - 15 years Air conditoners Straight line 5 - 8 years Libraries Straight line 30 years Clinics Straight line 30 years Cemeteries Straight line 30 years Car parks, bus terminals and taxi ranks Straight line 20 years Park facilities Straight line 30 years Sports fields Straight line 10 - 30 years Street lighting Straight line 20 - 25 years Specialised vehicles Straight line 15 years Fire services Straight line 5 - 15 years Housing Straight line 30 years Other equipment Straight line 5 - 15 years
The residual value, and the useful life and depreciation method of each asset are reviewed at the end of each reporting date. If the expectations differ from previous estimates, the change is accounted for as a change in accounting estimate.
Items of property, plant and equipment are derecognised when the asset is disposed of or when there are no further economic benefits or service potential expected from the use of the asset.
Land is not depreciated as it is deemed to have an indefinite useful life.
1.4 Intangible assets
An asset is identifiable if it either:
is separable, i.e. is capable of being separated or divided from an entity and sold, transferred, licensed, rented or exchanged, either individually or together with a related contract, identifiable assets or liability, regardless of whether the entity intends to do so; or
arises from binding arrangements (including rights from contracts), regardless of whether those rights are transferable or separable from the municipality or from other rights and obligations.
A binding arrangement describes an arrangement that confers similar rights and obligations on the parties to it as if it were in the form of a contract.
An intangible asset is recognised when:
it is probable that the expected future economic benefits or service potential that are attributable to the asset will flow to the municipality; and
the cost or fair value of the asset can be measured reliably.
The municipality assesses the probability of expected future economic benefits or service potential using reasonable and supportable assumptions that represent management’s best estimate of the set of economic conditions that will exist over the useful life of the asset.
Intangible assets are carried at cost less any accumulated amortisation and any impairment losses.
The amortisation period and the amortisation method for intangible assets are reviewed at each reporting date.
Amortisation is provided to write down the intangible assets, on a straight line basis, to their residual values as follows:
17
Greater Giyani Local Municipality Annual Financial Statements for the year ended 30 June 2016
Accounting Policies
1.4 Intangible assets (continued)
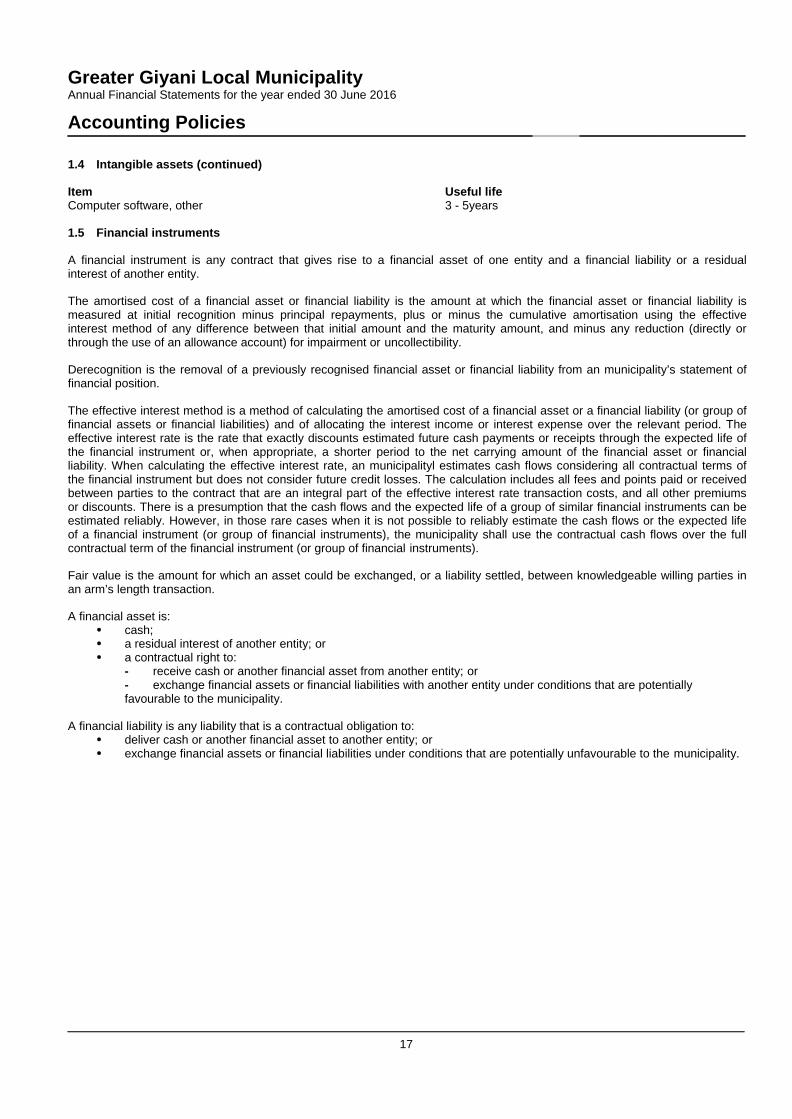
Item Useful life Computer software, other 3 - 5years
1.5 Financial instruments
A financial instrument is any contract that gives rise to a financial asset of one entity and a financial liability or a residual interest of another entity.
The amortised cost of a financial asset or financial liability is the amount at which the financial asset or financial liability is measured at initial recognition minus principal repayments, plus or minus the cumulative amortisation using the effective interest method of any difference between that initial amount and the maturity amount, and minus any reduction (directly or through the use of an allowance account) for impairment or uncollectibility.
Derecognition is the removal of a previously recognised financial asset or financial liability from an municipality’s statement of financial position.
The effective interest method is a method of calculating the amortised cost of a financial asset or a financial liability (or group of financial assets or financial liabilities) and of allocating the interest income or interest expense over the relevant period. The effective interest rate is the rate that exactly discounts estimated future cash payments or receipts through the expected life of the financial instrument or, when appropriate, a shorter period to the net carrying amount of the financial asset or financial liability. When calculating the effective interest rate, an municipalityl estimates cash flows considering all contractual terms of the financial instrument but does not consider future credit losses. The calculation includes all fees and points paid or received between parties to the contract that are an integral part of the effective interest rate transaction costs, and all other premiums or discounts. There is a presumption that the cash flows and the expected life of a group of similar financial instruments can be estimated reliably. However, in those rare cases when it is not possible to reliably estimate the cash flows or the expected life of a financial instrument (or group of financial instruments), the municipality shall use the contractual cash flows over the full contractual term of the financial instrument (or group of financial instruments).
Fair value is the amount for which an asset could be exchanged, or a liability settled, between knowledgeable willing parties in an arm’s length transaction.
A financial asset is:
cash; a residual interest of another entity; or a contractual right to:
- receive cash or another financial asset from another entity; or - exchange financial assets or financial liabilities with another entity under conditions that are potentially favourable to the municipality.
A financial liability is any liability that is a contractual obligation to:
deliver cash or another financial asset to another entity; or exchange financial assets or financial liabilities under conditions that are potentially unfavourable to the municipality.
18
Greater Giyani Local Municipality Annual Financial Statements for the year ended 30 June 2016
Accounting Policies
1.5 Investments in associates (continued)
Classification
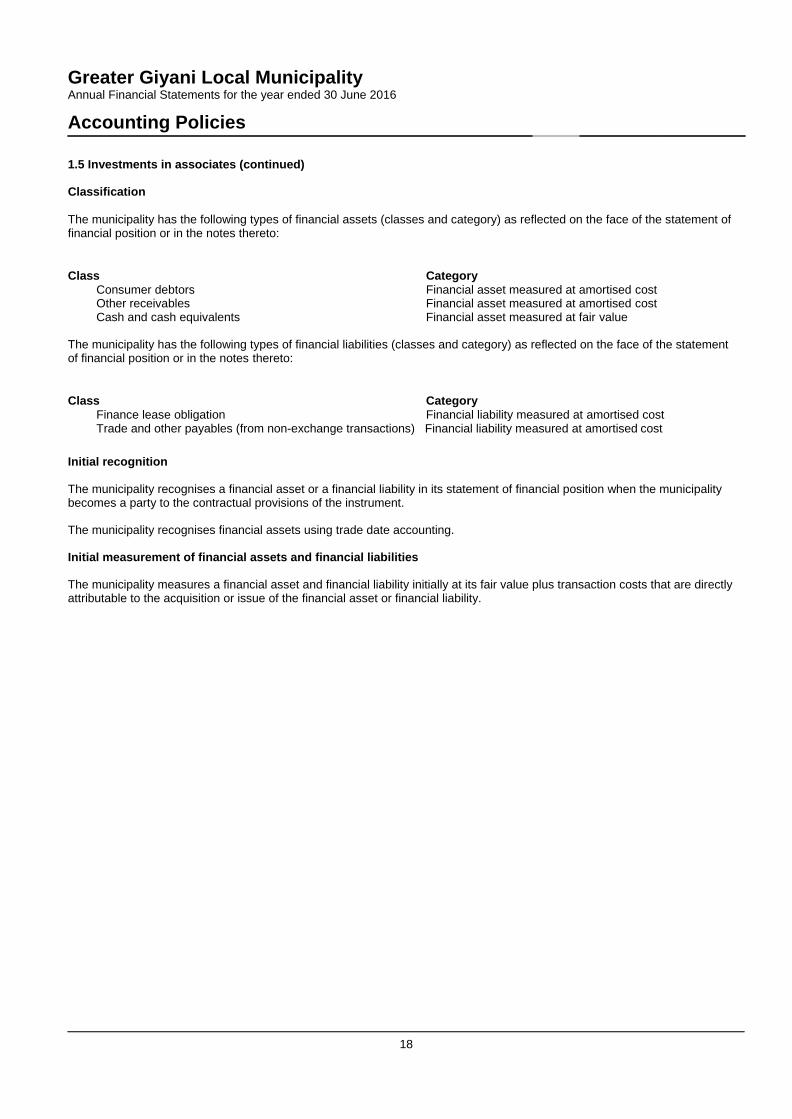
The municipality has the following types of financial assets (classes and category) as reflected on the face of the statement of financial position or in the notes thereto:
`
Class Category Consumer debtors Financial asset measured at amortised cost Other receivables Financial asset measured at amortised cost Cash and cash equivalents Financial asset measured at fair value
The municipality has the following types of financial liabilities (classes and category) as reflected on the face of the statement of financial position or in the notes thereto:
`
Class Category Finance lease obligation Financial liability measured at amortised cost Trade and other payables (from non-exchange transactions) Financial liability measured at amortised cost
Initial recognition
The municipality recognises a financial asset or a financial liability in its statement of financial position when the municipality becomes a party to the contractual provisions of the instrument.
The municipality recognises financial assets using trade date accounting.
Initial measurement of financial assets and financial liabilities
The municipality measures a financial asset and financial liability initially at its fair value plus transaction costs that are directly attributable to the acquisition or issue of the financial asset or financial liability.
19
Greater Giyani Local Municipality Annual Financial Statements for the year ended 30 June 2016
Accounting Policies
1.5 Investments in associates (continued)
Subsequent measurement of financial assets and financial liabilities
The municipality measures all financial assets and financial liabilities after initial recognition using the following categories:
Financial instruments at amortised cost.
All financial assets measured at amortised cost, or cost, are subject to an impairment review.
Fair value measurement considerations
The best evidence of fair value is quoted prices in an active market. If the market for a financial instrument is not active, the municipality establishes fair value by using a valuation technique. The objective of using a valuation technique is to establish what the transaction price would have been on the measurement date in an arm’s length exchange motivated by normal operating considerations. Valuation techniques include using recent arm’s length market transactions between knowledgeable, willing parties, if available, reference to the current fair value of another instrument that is substantially the same, discounted cash flow analysis and option pricing models. If there is a valuation technique commonly used by market participants to price the instrument and that technique has been demonstrated to provide reliable estimates of prices obtained in actual market transactions, the municipality uses that technique. The chosen valuation technique makes maximum use of market inputs and relies as little as possible on entity-specific inputs. It incorporates all factors that market participants would consider in setting a price and is consistent with accepted economic methodologies for pricing financial instruments. Periodically, the municipality calibrates the valuation technique and tests it for validity using prices from any observable current market transactions in the same instrument (i.e. without modification or repackaging) or based on any available observable market data.
Reclassification
The municipality does not reclassify a financial instrument while it is issued or held unless it is:
combined instrument that is required to be measured at fair value; or an investment in a residual interest that meets the requirements for reclassification.
If fair value can no longer be measured reliably for an investment in a residual interest measured at fair value, the municipality reclassifies the investment from fair value to cost. The carrying amount at the date that fair value is no longer available becomes the cost.
If a reliable measure becomes available for an investment in a residual interest for which a measure was previously not available, and the instrument would have been required to be measured at fair value, the entity reclassifies the instrument from cost to fair value.
Gains and losses
A gain or loss arising from a change in the fair value of a financial asset or financial liability measured at fair value is recognised in surplus or deficit.
For financial assets and financial liabilities measured at amortised cost or cost, a gain or loss is recognised in surplus or deficit when the financial asset or financial liability is derecognised or impaired, or through the amortisation process.
Impairment and uncollectibility of financial assets
The municipality assess at the end of each reporting period whether there is any objective evidence that a financial asset or group of financial assets is impaired.
Financial assets measured at amortised cost:
If there is objective evidence that an impairment loss on financial assets measured at amortised cost has been incurred, the amount of the loss is measured as the difference between the asset’s carrying amount and the present value of estimated future cash flows (excluding future credit losses that have not been incurred) discounted at the financial asset’s original effective interest rate. The carrying amount of the asset is reduced directly OR through the use of an allowance account. The amount of the loss is recognised in surplus or deficit.
20
Greater Giyani Local Municipality Annual Financial Statements for the year ended 30 June 2016
Accounting Policies
1.5 Investments in associates (continued)
If, in a subsequent period, the amount of the impairment loss decreases and the decrease can be related objectively to an event occurring after the impairment was recognised, the previously recognised impairment loss is reversed directly OR by adjusting an allowance account. The reversal does not result in a carrying amount of the financial asset that exceeds what the amortised cost would have been had the impairment not been recognised at the date the impairment is reversed. The amount of the reversal is recognised in surplus or deficit.
Financial assets measured at cost:
If there is objective evidence that an impairment loss has been incurred on an investment in a residual interest that is not measured at fair value because its fair value cannot be measured reliably, the amount of the impairment loss is measured as the difference between the carrying amount of the financial asset and the present value of estimated future cash flows discounted at the current market rate of return for a similar financial asset. Such impairment losses are not reversed.
1.6 Leases
A lease is classified as a finance lease if it transfers substantially all the risks and rewards incidental to ownership. A lease is classified as an operating lease if it does not transfer substantially all the risks and rewards incidental to ownership.
When a lease includes both land and buildings elements, the entity assesses the classification of each element separately.
Finance leases - lessor
Under a finance lease, the municipality recognises the lease payments to be received in terms of a lease agreement as an asset (receivable). The receivable is calculated as the sum of all the minimum lease payments to be received, plus any unguaranteed residual accruing to the municipality, discounted at the interest rate implicit in the lease. The receivable is reduced by the capital portion of the lease instalments received, with the interest portion being recognised as interest revenue on a time proportionate basis. The accounting policies relating to derecognition and impairment of financial instruments are applied to lease receivables.
Finance leases - lessee
Leases are classified as finance leases where substantially all the risks and rewards associated with ownership of an asset are transferred to the municipality. Property, plant and equipment or intangible assets subject to finance lease agreements are initially recognised at the lower of the asset's fair value and the present value of the minimum lease payments. The corresponding liabilities are initially recognised at the inception of the lease and are measured as the sum of the minimum lease payments due in terms of the lease agreement, discounted for the effect of interest. In discounting the lease payments, the municipality uses the interest rate that exactly discounts the lease payments and unguaranteed residual value to the fair value of the asset plus any direct costs incurred.
Subsequent to initial recognition, the leased assets are accounted for in accordance with the stated accounting policies applicable to property, plant, equipment or intangibles. The lease liability is reduced by the lease payments, which are allocated between the lease finance cost and the capital repayment using the effective interest rate method. Lease finance costs are expensed when incurred. The accounting policies relating to derecognition of financial instruments are applied to lease payables. The lease asset is depreciated over the shorter of the asset's useful life or the lease term.
Operating leases - lessee
Operating lease payments are recognised as an expense on a straight-line basis over the lease term. The difference between the amounts recognised as an expense and the contractual payments are recognised as an operating lease asset or liability.
21
Greater Giyani Local Municipality Annual Financial Statements for the year ended 30 June 2016
Accounting Policies
1.7 Inventories
Inventories comprise current assets held for sale, consumption or distribution during the ordinary course of business.
Inventories are initially recognised at cost. Cost generally refers to the purchase price, plus taxes, transport costs and any other costs in bringing the inventories to their current location and condition.
Where inventory is acquired by the municipality for no or nominal consideration (i.e. a non-exchange transaction), the cost is deemed to be equal to the fair value of the item on the date acquired.
Inventories consisting of consumables stores, raw materials, work in progress and finished goods, are valued at the lower of cost and net realisable value unless they are to be distributed at no or nominal charge, in which case they are measured at the lower of cost and current replacement cost.
Redundant and slow-moving inventories are identified and written down in this way. Differences arising on the valuation of inventory are recognised in the Statement of Financial Performance in the year in which they arose. The amount of any reversal of any write-down of inventories arising from an increase in net realisable value or current replacement cost is recognised as a reduction in the amount of inventories recognised as an expense in the period in which the reversal occurs.
The carrying amount of inventories is recognised as an expense in the period that the inventory was sold, distributed, written off or consumed, unless that cost qualifies for capitalisation to the cost of another asset.
Unsold properties are valued at the lower of cost and net realisable value on a specific identification cost basis. Direct costs are accumulated for each separately identifiable development. Costs also include a proportion of overhead costs.
The cost of inventories is assigned using the weighted average cost formula. The same cost formula is used for all inventories having a similar nature and use to the municipality.
1.8 Impairment of cash-generating assets
Cash-generating assets are assets managed with the objective of generating a commercial return. An asset generates a commercial return when it is deployed in a manner consistent with that adopted by a profit-oriented municipality.
Identification
When the carrying amount of a cash-generating asset exceeds its recoverable amount, it is impaired.
The municipality assesses at each reporting date whether there is any indication that a cash-generating asset may be impaired. If any such indication exists, the municipality estimates the recoverable amount of the asset.
Value in use
Value in use of a cash-generating asset is the present value of the estimated future cash flows expected to be derived from the continuing use of an asset and from its disposal at the end of its useful life.
When estimating the value in use of an asset, the municipality estimates the future cash inflows and outflows to be derived from continuing use of the asset and from its ultimate disposal and the municipality applies the appropriate discount rate to those future cash flows.
22
Greater Giyani Local Municipality Annual Financial Statements for the year ended 30 June 2016
Accounting Policies
1.8 Impairment of cash-generating assets (continued)
Basis for estimates of future cash flows
In measuring value in use the municipality: base cash flow projections on reasonable and supportable assumptions that represent management's best estimate
of the range of economic conditions that will exist over the remaining useful life of the asset. Greater weight is given to external evidence;
base cash flow projections on the most recent approved financial budgets/forecasts, but excludes any estimated future cash inflows or outflows expected to arise from future restructuring's or from improving or enhancing the asset's performance. Projections based on these budgets/forecasts covers a maximum period of five years, unless a longer period can be justified; and
estimate cash flow projections beyond the period covered by the most recent budgets/forecasts by extrapolating the projections based on the budgets/forecasts using a steady or declining growth rate for subsequent years, unless an increasing rate can be justified. This growth rate does not exceed the long-term average growth rate for the products, industries, or country or countries in which the municipality operates, or for the market in which the asset is used, unless a higher rate can be justified.
Composition of estimates of future cash flows
Estimates of future cash flows include:
projections of cash inflows from the continuing use of the asset; projections of cash outflows that are necessarily incurred to generate the cash inflows from continuing use of the
asset (including cash outflows to prepare the asset for use) and can be directly attributed, or allocated on a reasonable and consistent basis, to the asset; and
net cash flows, if any, to be received (or paid) for the disposal of the asset at the end of its useful life.
Estimates of future cash flows exclude: cash inflows or outflows from financing activities; and income tax receipts or payments.
The estimate of net cash flows to be received (or paid) for the disposal of an asset at the end of its useful life is the amount that the municipality expects to obtain from the disposal of the asset in an arm's length transaction between knowledgeable, willing parties, after deducting the estimated costs of disposal.
Discount rate
The discount rate is a pre-tax rate that reflects current market assessments of the time value of money, represented by the current risk-free rate of interest and the risks specific to the asset for which the future cash flow estimates have not been adjusted.
Recognition and measurement (individual asset)
If the recoverable amount of a cash-generating asset is less than its carrying amount, the carrying amount of the asset is reduced to its recoverable amount. This reduction is an impairment loss.
An impairment loss is recognised immediately in surplus or deficit.
Any impairment loss of a revalued cash-generating asset is treated as a revaluation decrease.
When the amount estimated for an impairment loss is greater than the carrying amount of the cash-generating asset to which it relates, the municipality recognises a liability only to the extent that is a requirement in the Standard of GRAP.
After the recognition of an impairment loss, the depreciation (amortisation) charge for the cash-generating asset is adjusted in future periods to allocate the cash-generating asset’s revised carrying amount, less its residual value (if any), on a systematic basis over its remaining useful life.
23
Greater Giyani Local Municipality Annual Financial Statements for the year ended 30 June 2016
Accounting Policies
1.8 Impairment of cash-generating assets (continued)
Cash-generating units
If there is any indication that an asset may be impaired, the recoverable amount is estimated for the individual asset. If it is not possible to estimate the recoverable amount of the individual asset, the municipality determines the recoverable amount of the cash-generating unit to which the asset belongs (the asset's cash-generating unit).
If an active market exists for the output produced by an asset or group of assets, that asset or group of assets is identified as a cash-generating unit, even if some or all of the output is used internally. If the cash inflows generated by any asset or cash- generating unit are affected by internal transfer pricing, the municipality use management's best estimate of future price(s) that could be achieved in arm's length transactions in estimating:
the future cash inflows used to determine the asset's or cash-generating unit's value in use; and the future cash outflows used to determine the value in use of any other assets or cash-generating units that are
affected by the internal transfer pricing.
Cash-generating units are identified consistently from period to period for the same asset or types of assets, unless a change is justified.
The carrying amount of a cash-generating unit is determined on a basis consistent with the way the recoverable amount of the cash-generating unit is determined.
An impairment loss is recognised for a cash-generating unit if the recoverable amount of the unit is less than the carrying amount of the unit. The impairment is allocated to reduce the carrying amount of the cash-generating assets of the unit on a pro rata basis, based on the carrying amount of each asset in the unit. These reductions in carrying amounts are treated as impairment losses on individual assets.
In allocating an impairment loss, the entity does not reduce the carrying amount of an asset below the highest of:
its fair value less costs to sell (if determinable); its value in use (if determinable); and zero.
The amount of the impairment loss that would otherwise have been allocated to the asset is allocated pro rata to the other cash-generating assets of the unit.
Where a non-cash-generating asset contributes to a cash-generating unit, a proportion of the carrying amount of that non- cash-generating asset is allocated to the carrying amount of the cash-generating unit prior to estimation of the recoverable amount of the cash-generating unit.
24
Greater Giyani Local Municipality Annual Financial Statements for the year ended 30 June 2016
Accounting Policies
1.8 Impairment of cash-generating assets (continued)
Reversal of impairment loss
The municipality assess at each reporting date whether there is any indication that an impairment loss recognised in prior periods for a cash-generating asset may no longer exist or may have decreased. If any such indication exists, the municipality estimates the recoverable amount of that asset.
An impairment loss recognised in prior periods for a cash-generating asset is reversed if there has been a change in the estimates used to determine the asset’s recoverable amount since the last impairment loss was recognised. The carrying amount of the asset is increased to its recoverable amount. The increase is a reversal of an impairment loss. The increased carrying amount of an asset attributable to a reversal of an impairment loss does not exceed the carrying amount that would have been determined (net of depreciation or amortisation) had no impairment loss been recognised for the asset in prior periods.
A reversal of an impairment loss for a cash-generating asset is recognised immediately in surplus or deficit.
Any reversal of an impairment loss of a revalued cash-generating asset is treated as a revaluation increase.
After a reversal of an impairment loss is recognised, the depreciation (amortisation) charge for the cash-generating asset is adjusted in future periods to allocate the cash-generating asset’s revised carrying amount, less its residual value (if any), on a systematic basis over its remaining useful life.
A reversal of an impairment loss for a cash-generating unit is allocated to the cash-generating assets of the unit pro rata with the carrying amounts of those assets. These increases in carrying amounts are treated as reversals of impairment losses for individual assets. No part of the amount of such a reversal is allocated to a non-cash-generating asset contributing service potential to a cash-generating unit.
In allocating a reversal of an impairment loss for a cash-generating unit, the carrying amount of an asset is not increased above the lower of:
its recoverable amount (if determinable); and the carrying amount that would have been determined (net of amortisation or depreciation) had no impairment loss
been recognised for the asset in prior periods.
The amount of the reversal of the impairment loss that would otherwise have been allocated to the asset is allocated pro rata to the other assets of the unit.
Redesignation
The redesignation of assets from a cash-generating asset to a non-cash-generating asset or from a non-cash-generating asset to a cash-generating asset only occur when there is clear evidence that such a redesignation is appropriate.
1.9 Impairment of non-cash-generating assets
Non-cash-generating assets are assets other than cash-generating assets.
25
Greater Giyani Local Municipality Annual Financial Statements for the year ended 30 June 2016
Accounting Policies
1.9 Impairment of non-cash-generating assets (continued)
Value in use
Value in use of non-cash-generating assets is the present value of the non-cash-generating assets remaining service potential.
The present value of the remaining service potential of a non-cash-generating assets is determined using the following approach:
Depreciated replacement cost approach
The present value of the remaining service potential of a non-cash-generating asset is determined as the depreciated replacement cost of the asset. The replacement cost of an asset is the cost to replace the asset’s gross service potential. This cost is depreciated to reflect the asset in its used condition. An asset may be replaced either through reproduction (replication) of the existing asset or through replacement of its gross service potential. The depreciated replacement cost is measured as the reproduction or replacement cost of the asset, whichever is lower, less accumulated depreciation calculated on the basis of such cost, to reflect the already consumed or expired service potential of the asset.
The replacement cost and reproduction cost of an asset is determined on an “optimised” basis. The rationale is that the municipality would not replace or reproduce the asset with a like asset if the asset to be replaced or reproduced is an overdesigned or overcapacity asset. Overdesigned assets contain features which are unnecessary for the goods or services the asset provides. Overcapacity assets are assets that have a greater capacity than is necessary to meet the demand for goods or services the asset provides. The determination of the replacement cost or reproduction cost of an asset on an optimised basis thus reflects the service potential required of the asset.
Recognition and measurement
If the recoverable service amount of a non-cash-generating asset is less than its carrying amount, the carrying amount of the asset is reduced to its recoverable service amount. This reduction is an impairment loss.
An impairment loss is recognised immediately in surplus or deficit.
Any impairment loss of a revalued non-cash-generating asset is treated as a revaluation decrease.
When the amount estimated for an impairment loss is greater than the carrying amount of the non-cash-generating asset to which it relates, the municipality recognises a liability only to the extent that is a requirement in the Standards of GRAP.
After the recognition of an impairment loss, the depreciation (amortisation) charge for the non-cash-generating asset is adjusted in future periods to allocate the non-cash-generating asset’s revised carrying amount, less its residual value (if any), on a systematic basis over its remaining useful life.
Reversal of an impairment loss
The municipality assess at each reporting date whether there is any indication that an impairment loss recognised in prior periods for a non-cash-generating asset may no longer exist or may have decreased. If any such indication exists, the municipality estimates the recoverable service amount of that asset.
An impairment loss recognised in prior periods for a non-cash-generating asset is reversed if there has been a change in the estimates used to determine the asset’s recoverable service amount since the last impairment loss was recognised. The carrying amount of the asset is increased to its recoverable service amount. The increase is a reversal of an impairment loss. The increased carrying amount of an asset attributable to a reversal of an impairment loss does not exceed the carrying amount that would have been determined (net of depreciation or amortisation) had no impairment loss been recognised for the asset in prior periods.
A reversal of an impairment loss for a non-cash-generating asset is recognised immediately in surplus or deficit.
After a reversal of an impairment loss is recognised, the depreciation (amortisation) charge for the non-cash-generating asset is adjusted in future periods to allocate the non-cash-generating asset’s revised carrying amount, less its residual value (if any), on a systematic basis over its remaining useful life.
26
Greater Giyani Local Municipality Annual Financial Statements for the year ended 30 June 2016
Accounting Policies
1.9 Impairment of non-cash-generating assets (continued)
Redesignation
The redesignation of assets from a cash-generating asset to a non-cash-generating asset or from a non-cash-generating asset to a cash-generating asset only occur when there is clear evidence that such a redesignation is appropriate.
1.10 Employee benefits
Employee benefits are all forms of consideration given by the municipality in exchange for service rendered by employees.
Other long-term employee benefits are employee benefits (other than post-employment benefits and termination benefits) that are not due to be settled within twelve months after the end of the period in which the employees render the related service.
Short-term employee benefits
Short-term employee benefits include items such as:
wages, salaries and social security contributions; short-term compensated absences (such as paid annual leave and paid sick leave) where the compensation for the
absences is due to be settled within twelve months after the end of the reporting period in which the employees render the related employee service;
bonus, incentive and performance related payments payable within twelve months after the end of the reporting period in which the employees render the related service; and
non-monetary benefits (for example, medical care, and free or subsidised goods or services such as housing, cars and cellphones) for current employees.
When an employee has rendered service to the municipality during a reporting period, the entity recognise the undiscounted amount of short-term employee benefits expected to be paid in exchange for that service:
as a liability (accrued expense), after deducting any amount already paid. If the amount already paid exceeds the undiscounted amount of the benefits, the municipality recognise that excess as an asset (prepaid expense) to the extent that the prepayment will lead to, for example, a reduction in future payments or a cash refund; and
as an expense, unless another Standard requires or permits the inclusion of the benefits in the cost of an asset.
The expected cost of compensated absences is recognised as an expense as the employees render services that increase their entitlement or, in the case of non-accumulating absences, when the absence occurs. The municipality measure the expected cost of accumulating compensated absences as the additional amount that the entity expects to pay as a result of the unused entitlement that has accumulated at the reporting date.
The municipality recognise the expected cost of bonus, incentive and performance related payments when the municipality has a present legal or constructive obligation to make such payments as a result of past events and a reliable estimate of the obligation can be made. A present obligation exists when the entity has no realistic alternative but to make the payments.
Retirement benefits
Post-employment benefit plans are formal or informal arrangements under which an entity provides post-employment benefits for one or more employees.
27
Greater Giyani Local Municipality Annual Financial Statements for the year ended 30 June 2016
Accounting Policies
1.10 Employee benefits (continued)
Post-employment benefits: Defined contribution plans
Defined contribution plans are post-employment benefit plans under which the municipality pays fixed contributions into a separate municipality (a fund) and will have no legal or constructive obligation to pay further contributions if the fund does not hold sufficient assets to pay all employee benefits relating to employee service in the current and prior periods.
When an employee has rendered service to the municipality during a reporting period, the municipality recognise the contribution payable to a defined contribution plan in exchange for that service:
as a liability (accrued expense), after deducting any contribution already paid. If the contribution already paid exceeds the contribution due for service before the reporting date, an municipality recognise that excess as an asset (prepaid expense) to the extent that the prepayment will lead to, for example, a reduction in future payments or a cash refund; and
as an expense, unless another Standard requires or permits the inclusion of the contribution in the cost of an asset.
Where contributions to a defined contribution plan do not fall due wholly within twelve months after the end of the reporting period in which the employees render the related service, they are discounted. The rate used to discount reflects the time value of money. The currency and term of the financial instrument selected to reflect the time value of money is consistent with the currency and estimated term of the obligation.
Post-employment benefits: Defined benefit plans
Defined benefit plans are post-employment benefit plans other than defined contribution plans.
The municipality recognises the net total of the following amounts in surplus or deficit, except to the extent that another Standard requires or permits their inclusion in the cost of an asset:
current service cost; interest cost; actuarial gains and losses;
The municipality uses the Projected Unit Credit Method to determine the present value of its defined benefit obligations and the related current service cost and, where applicable, past service cost. The Projected Unit Credit Method (sometimes known as the accrued benefit method pro-rated on service or as the benefit/years of service method) sees each period of service as giving rise to an additional unit of benefit entitlement and measures each unit separately to build up the final obligation.
Actuarial valuations are conducted on an annual basis by independent actuaries separately for each plan. The results of the valuation are updated for any material transactions and other material changes in circumstances (including changes in market prices and interest rates) up to the reporting date.
Actuarial assumptions
Actuarial assumptions are unbiased and mutually compatible.
Financial assumptions are based on market expectations, at the reporting date, for the period over which the obligations are to be settled.
The rate used to discount post-employment benefit obligations (both funded and unfunded) reflect the time value of money. The currency and term of the financial instrument selected to reflect the time value of money is consistent with the currency and estimated term of the post-employment benefit obligations.
Post-employment benefit obligations are measured on a basis that reflects:
estimated future salary increases; the benefits set out in the terms of the plan (or resulting from any constructive obligation that goes beyond those
terms) at the reporting date; and estimated future changes in the level of any state benefits that affect the benefits payable under a defined benefit
plan, if, and only if, either: those changes were enacted before the reporting date; or past history, or other reliable evidence, indicates that those state benefits will change in some predictable manner,
for example, in line with future changes in general price levels or general salary levels.
Assumptions about medical costs take account of estimated future changes in the cost of medical services, resulting from both inflation and specific changes in medical costs.
28
Greater Giyani Local Municipality Annual Financial Statements for the year ended 30 June 2016
Accounting Policies
1.10 Employee benefits (continued)
Other post retirement obligations
The municipality offers various types of long service awards to its employees. The provision is to recognise the present value of the obligation as at the reporting date.
1.11 Provisions and contingencies
Provisions are recognised when:
the municipality has a present obligation as a result of a past event; it is probable that an outflow of resources embodying economic benefits or service potential will be required to
settle the obligation; and a reliable estimate can be made of the obligation.
Provisions are reviewed at each reporting date and adjusted to reflect the current best estimate. Where the effect is material, non-current provisions are discounted to their present value using a pre-tax discount rate that reflect the market's current assessment of the time value of money, adjusted for risks specific to the liability (for example in the case of obligations for the rehabilitation of land). Provisions are reversed if it is no longer probable that an outflow of resources embodying economic benefits or service potential will be required, to settle the obligation.
Contingent assets and contingent liabilities are not recognised. Contingencies are disclosed in note 34.
1.12 Revenue from exchange transactions
Revenue is the gross inflow of economic benefits or service potential during the reporting period when those inflows result in an increase in net assets, other than increases relating to contributions from owners.
Measurement
Revenue is measured at the fair value of the consideration received or receivable, net of trade discounts and volume rebates.
Service charges
Meters are read on a monthly basis and are recognised as revenue when invoiced. Provisional estimates of consumptions are made monthly when meter readings have not been performed and are recognised as revenue when invoiced. Adjustments to provisional estimates of consumption are made then recognised in the statement of financial performance in the invoicing period which the meters have been read.
Service charges relating to refuse removal are recognised on a monthly basis by applying the approved tariff to each property that has improvements. Tariffs are determined per category of property usage and are levied monthly based on the number of refuse containers on each property, regardless of whether or not containers are emptied during the month.
Interest
Interest is recognised on a time proportionate basis that takes into account the effective yield on the asset.
1.13 Revenue from non-exchange transactions
Revenue from non-exchange transactions refers to transactions where the municipality received revenue from another entity without directly giving approximately equal value in exchange. Revenue from non-exchange transactions is generally recognised to the extent that the the related receipt or receivable qualifies for recognition as an asset and there is no liability to repay the amount.

29
Greater Giyani Local Municipality Annual Financial Statements for the year ended 30 June 2016
Accounting Policies
1.13 Revenue from non-exchange transactions (continued)
Rates, including collection charges and penalties interest
Revenue from property rates is recognised when the legal entitlement to this revenue arises. Collection charges are recognised when such amounts are legally enforceable. Penalty interest on unpaid rates is recognised on a time proportionate basis.
Rebates are respectively granted, to owners of land on which not more than two dwelling units are erected provided that such dwelling units are solely used for residential purposes. Additional relief is granted to needy, aged and/or disabled owners, based on income.
Assessment rates income is recognised once a rates account has been issued to ratepayers. Adjustments or interim rates are recognised once the municipal valuer has valued the change to properties.
Government grants, transfers and donations
Government Grants can be in the form of grants to acquire or construct fixed assets (capital grants), grants for the furtherance of national and provincial government policy objectives and general grants to subsidise the cost incurred by municipalities rendering services.
Capital grants and general grants for the furtherance of government policy objectives are usually restricted revenue in that stipulations are imposed in their use.
Conditional grants, donations and funding are recognised as revenue in the Statement of Financial Performance to the extent that the Municipality has complied with any criteria, conditions or obligations embodied in the agreement/arrangement. To the extent that the criteria, conditions and obligations have not been met a liability is raised in the Statement of Financial Position. Unconditional grants, donations and funding are recognised as revenue in the Statement of Financial Position at the earlier of the date of receipt or when the amount is receivable.
Stipulations can either be in the form of conditions or in the form of restrictions. For both conditions and restrictions a recipient may be required to use the transferred asset for a particular purpose. However the difference between a restriction and a condition is that a condition has an additional requirement which states that the asset or its future economic benefits or service potential should be returned to the transferor should the recipient not use the asset for the particular purpose stipulated.
When conditions are attached to a transferred asset, the municipality incurs a liability. The municipality has a present obligation to comply with the conditions of the asset or to return the economic benefits or service potential of the asset to the transferor when the conditions are not met. Therefore, when a recipient initially recognises an asset that is subject to a condition, the recipient also incurs a liability
Restrictions on transferred assets arise when there is an expectation and/or understanding about the particular way that the assets will be used. However, there is no requirement that the transferred asset, or future economic benefits or service potential are to be returned to the transferor if the assets are not used as per the expectation or understanding. Thus, initially gaining control of an asset with restrictions does not impose a present obligation on the recipient and consequently no liability is recognised.
Contributed assets are recognised at fair value when the risks and rewards associated with such asset transfer to the Municipality.
Fines
Fines are recognised as revenue when the receivable meets the definition of an asset and satisfies the criteria for recognition as an asset. Assets arising from fines are measured at the best estimate of the inflow of resources to the municipality. Where the municipality collects fines in the capacity of an agent, the fine will not be revenue of the collecting entity.
Other
Revenue from the recovery of unauthorised, irregular, fruitless and wasteful expenditure is based on legislated procedures, including those set out in the Municipal Finance Management Act (Act No. 56 of 2003) and is recognised when the recovery thereof from the responsible councillors or officials is virtually certain.
Revenue from the rental of facilities and equipment is recognised on a straight-line basis over the term of the lease agreement.
30
Greater Giyani Local Municipality Annual Financial Statements for the year ended 30 June 2016
Accounting Policies
1.14 Borrowing costs
Borrowing costs are interest and other expenses incurred by an entity in connection with the borrowing of funds.
Qualifying asset is an asset that necessarily takes a substantial period of time to get ready for its intended use of sale.
All other borrowing costs are recognised as an expense in the period in which they are incurred.
1.15 Comparative figures
Where necessary, comparative figures have been reclassified to conform to changes in presentation in the current year.
When the presentation or classification of items in the annual financial statement is amended, prior period comparative amounts are restated. The nature and reason for the reclassification is disclosed. Where accounting errors have been identified in the current year, the correction is made retrospectively as far as is practicable, and the prior year comparatives are restated accordingly. Where there has been a change in accounting policy in the current year, the adjustment is made retrospectively as far as is practicable, and the prior year comparatives are rested accordingly.
1.16 Unauthorised expenditure
Unauthorised expenditure is expenditure that has not been budgeted, expenditure that is not in terms of the conditions of an allocation received from another sphere of government, municipality or organ of state and expenditure in the form of a grant that is not permitted in terms of the Municipal Finance Management Act (Act No. 56 of 2003). Unauthorised expenditure is accounted for as an expense in the Statement of Financial Performance and where recovered, it is subsequently accounted for as revenue in the Statement of Financial Performance.
1.17 Fruitless and wasteful expenditure
Fruitless expenditure means expenditure which was made in vain and would have been avoided had reasonable care been exercised.
All expenditure relating to fruitless and wasteful expenditure is recognised as an expense in the statement of financial performance in the year that the expenditure was incurred. The expenditure is classified in accordance with the nature of the expense, and where recovered, it is subsequently accounted for as revenue in the statement of financial performance.
1.18 Irregular expenditure
Irregular expenditure is expenditure that is contrary to the Municipal Finance Management Act (Act No.56 of 2003), the Municipal Systems Act (Act No. 32 of 2000), and the Public Office Bearers Act (Act No. 20 of 1998) or is in contravention of the economic entity’s supply chain management policy. Irregular expenditure excludes unauthorised expenditure. Irregular expenditure is accounted for as expenditure in the Statement of Financial Performance and where recovered, it is subsequently accounted for as revenue in the Statement of Financial Performance.
1.19 Offsetting
Assets, liabilities, revenue and expenses are not offset.
1.20 Events after the reporting date
Events after the reporting date that are classified as adjusting events have been accounted for in the Annual Financial Statements. The events after the reporting date that are classified as non-adjusting events after the reporting date have been disclosed in the notes to the Annual Financial Statements.
1.21 Budget information
Municipality are typically subject to budgetary limits in the form of appropriations or budget authorisations (or equivalent), which is given effect through authorising legislation, appropriation or similar.
General purpose financial reporting by municipality shall provide information on whether resources were obtained and used in accordance with the legally adopted budget.
The approved budget is prepared on a accrual basis and presented by economic classification linked to performance outcome objectives.
31
Greater Giyani Local Municipality Annual Financial Statements for the year ended 30 June 2016
Accounting Policies
1.21 Budget information (continued)
The approved budget covers the fiscal period from 1/7/2015 to 30/6/2016.
The annual financial statements and the budget are on the same basis of accounting therefore a comparison with the budgeted amounts for the reporting period have been included in the Statement of comparison of budget and actual amounts.
Comparative information is not required.
1.22 Related parties
Individuals as well as their close family members, and/or entities are related parties if one party has the ability, directly or indirectly, to control or jointly control the other party or exercise significant influence over the other party in making financial and/or operating decisions. Key management personnel is defined as the Municipal Manager, Chief Financial Officer and all other managers reporting directly to the Municipal Manager or as designated by the Municipal Manager as well as the Mayor and Councillors.
1.23 Value added tax
The municipality accounts for Value Added Tax on the payments basis.
1.24 Conditional grants and receipts
Revenue received from conditional grants, donations and fundign are recognised as revenue to the extent that the municipality has complied with any of the criteria, conditions or obligations embodied in the agreement. To the extent that the criteria, conditions or obligations have not been met a liability is raised.
32
Greater Giyani Local Municipality Annual Financial Statements for the year ended 30 June 2016
Notes to the Annual Financial Statements
Figures in Rand 2016 2015
2. New standards and interpretations
2.1 Standards and interpretations issued, but not yet effective
The municipality has not applied the following standards and interpretations, which have been published and are mandatory for the municipality’s accounting periods beginning on or after 01 July 2016 or later periods:
Standard/ Interpretation: Effective date: Years beginning on or after
GRAP 18: Segment Reporting 01 April 2017 GRAP 20: Related parties 01 April 2017 GRAP 32: Service Concession Arrangements: Grantor 01 April 2016 GRAP 108: Statutory Receivables 01 April 2016
Expected impact:
IGRAP 17: Service Concession Arrangements where a Grantor Controls a Significant Residual Interest in an Asset
01 April 2016
GRAP 16 (as amended 2015): Investment Property 01 April 2016 GRAP 17 (as amended 2015): Property, Plant and
Equipment 01 April 2016
GRAP 109: Accounting by Principals and Agents 01 April 2017 GRAP 21 (as amended 2015): Impairment of non-cash-
generating assets GRAP 26 (as amended 2015): Impairment of cash-
generating assets Directive 12: The Selection of an Appropriate Reporting
Framework by Public Entities
01 April 2017 01 April 2017
01 April 2018
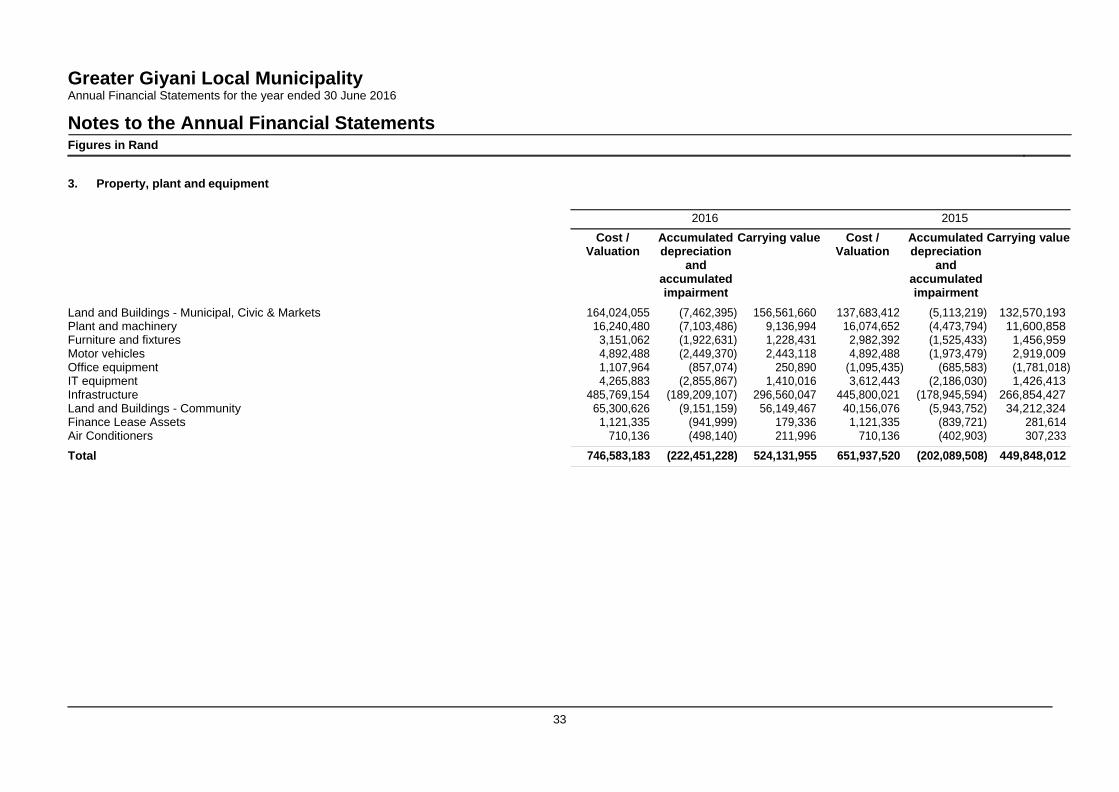
Greater Giyani Local Municipality Annual Financial Statements for the year ended 30 June 2016
Notes to the Annual Financial Statements
33
Figures in Rand
3. Property, plant and equipment
2016 2015 Cost / Accumulated Carrying value Cost / Accumulated Carrying value
Valuation depreciation and
accumulated impairment
Valuation depreciation and
accumulated impairment
Land and Buildings - Municipal, Civic & Markets 164,024,055 (7,462,395) 156,561,660 137,683,412 (5,113,219) 132,570,193 Plant and machinery 16,240,480 (7,103,486) 9,136,994 16,074,652 (4,473,794) 11,600,858 Furniture and fixtures 3,151,062 (1,922,631) 1,228,431 2,982,392 (1,525,433) 1,456,959 Motor vehicles 4,892,488 (2,449,370) 2,443,118 4,892,488 (1,973,479) 2,919,009 Office equipment 1,107,964 (857,074) 250,890 (1,095,435) (685,583) (1,781,018) IT equipment 4,265,883 (2,855,867) 1,410,016 3,612,443 (2,186,030) 1,426,413 Infrastructure 485,769,154 (189,209,107) 296,560,047 445,800,021 (178,945,594) 266,854,427 Land and Buildings - Community 65,300,626 (9,151,159) 56,149,467 40,156,076 (5,943,752) 34,212,324 Finance Lease Assets 1,121,335 (941,999) 179,336 1,121,335 (839,721) 281,614 Air Conditioners 710,136 (498,140) 211,996 710,136 (402,903) 307,233
Total 746,583,183 (222,451,228) 524,131,955 651,937,520 (202,089,508) 449,848,012
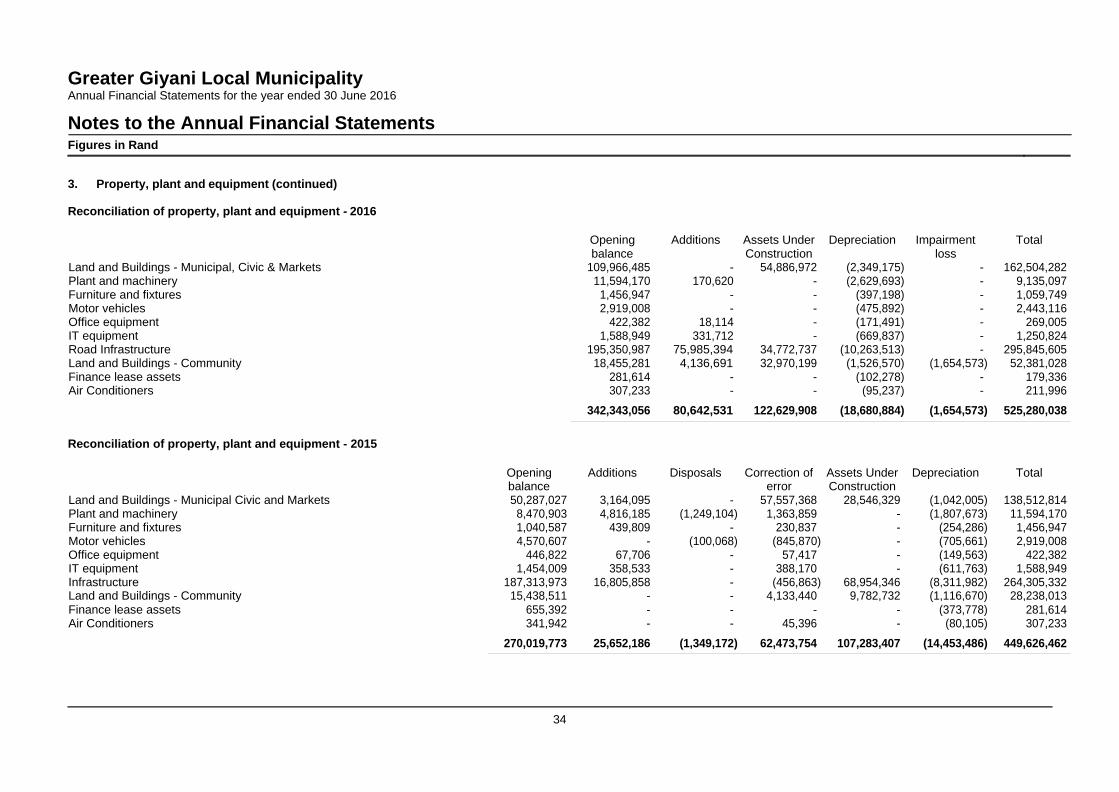
Greater Giyani Local Municipality Annual Financial Statements for the year ended 30 June 2016
Notes to the Annual Financial Statements
34
Figures in Rand
3. Property, plant and equipment (continued)
Reconciliation of property, plant and equipment - 2016
Opening balance
Additions
Assets Under Construction
Depreciation
Impairment loss
Total
Land and Buildings - Municipal, Civic & Markets 109,966,485 - 54,886,972 (2,349,175) - 162,504,282 Plant and machinery 11,594,170 170,620 - (2,629,693) - 9,135,097 Furniture and fixtures 1,456,947 - - (397,198) - 1,059,749 Motor vehicles 2,919,008 - - (475,892) - 2,443,116 Office equipment 422,382 18,114 - (171,491) - 269,005 IT equipment 1,588,949 331,712 - (669,837) - 1,250,824 Road Infrastructure 195,350,987 75,985,394 34,772,737 (10,263,513) - 295,845,605 Land and Buildings - Community 18,455,281 4,136,691 32,970,199 (1,526,570) (1,654,573) 52,381,028 Finance lease assets 281,614 - - (102,278) - 179,336 Air Conditioners 307,233 - - (95,237) - 211,996
342,343,056 80,642,531 122,629,908 (18,680,884) (1,654,573) 525,280,038 Reconciliation of property, plant and equipment - 2015
Opening Additions Disposals Correction of Assets Under Depreciation Total balance error Construction Land and Buildings - Municipal Civic and Markets 50,287,027 3,164,095 - 57,557,368 28,546,329 (1,042,005) 138,512,814 Plant and machinery 8,470,903 4,816,185 (1,249,104) 1,363,859 - (1,807,673) 11,594,170 Furniture and fixtures 1,040,587 439,809 - 230,837 - (254,286) 1,456,947 Motor vehicles 4,570,607 - (100,068) (845,870) - (705,661) 2,919,008 Office equipment 446,822 67,706 - 57,417 - (149,563) 422,382 IT equipment 1,454,009 358,533 - 388,170 - (611,763) 1,588,949 Infrastructure 187,313,973 16,805,858 - (456,863) 68,954,346 (8,311,982) 264,305,332 Land and Buildings - Community 15,438,511 - - 4,133,440 9,782,732 (1,116,670) 28,238,013 Finance lease assets 655,392 - - - - (373,778) 281,614 Air Conditioners 341,942 - - 45,396 - (80,105) 307,233
270,019,773 25,652,186 (1,349,172) 62,473,754 107,283,407 (14,453,486) 449,626,462
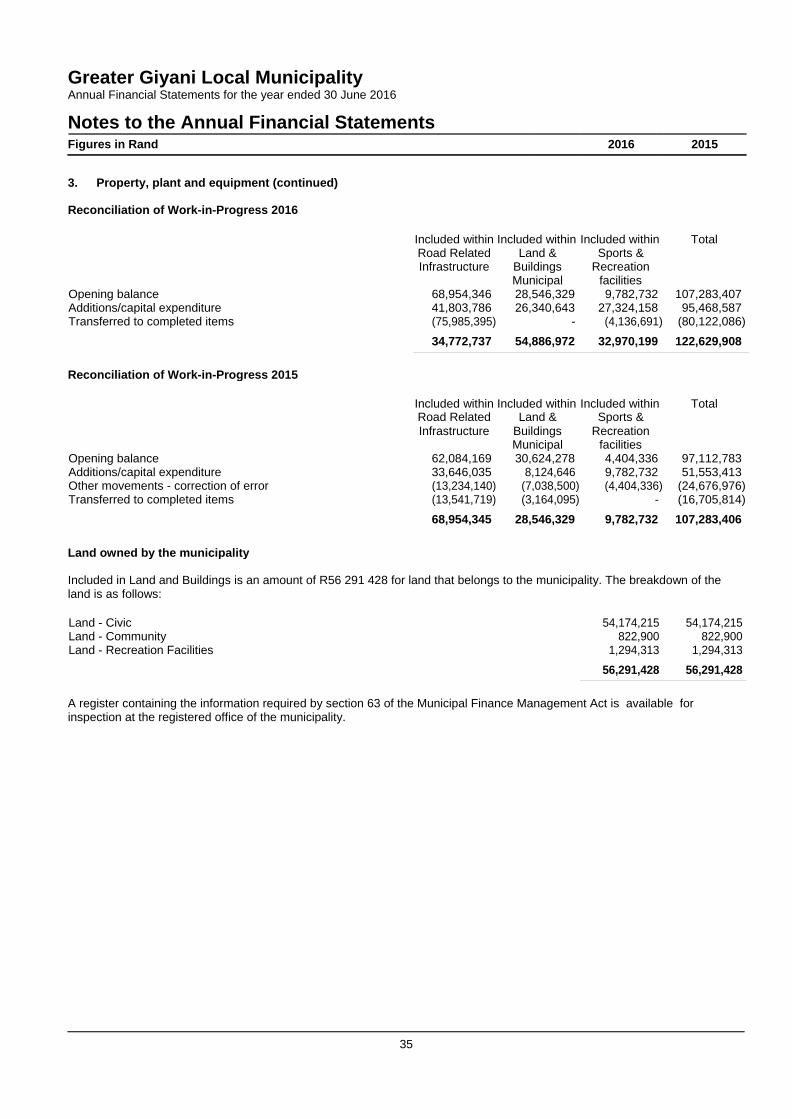
Greater Giyani Local Municipality Annual Financial Statements for the year ended 30 June 2016
Notes to the Annual Financial Statements
35
Figures in Rand 2016 2015
3. Property, plant and equipment (continued)
Reconciliation of Work-in-Progress 2016
Included within Included within Included within Total Road Related Land & Sports & Infrastructure Buildings Recreation Municipal facilities Opening balance 68,954,346 28,546,329 9,782,732 107,283,407 Additions/capital expenditure 41,803,786 26,340,643 27,324,158 95,468,587 Transferred to completed items (75,985,395) - (4,136,691) (80,122,086)
34,772,737 54,886,972 32,970,199 122,629,908 Reconciliation of Work-in-Progress 2015
Included within Included within Included within Total
Road Related Land & Sports & Infrastructure Buildings Recreation Municipal facilities Opening balance 62,084,169 30,624,278 4,404,336 97,112,783 Additions/capital expenditure 33,646,035 8,124,646 9,782,732 51,553,413 Other movements - correction of error (13,234,140) (7,038,500) (4,404,336) (24,676,976) Transferred to completed items (13,541,719) (3,164,095) - (16,705,814)
68,954,345 28,546,329 9,782,732 107,283,406 Land owned by the municipality
Included in Land and Buildings is an amount of R56 291 428 for land that belongs to the municipality. The breakdown of the land is as follows:
Land - Civic 54,174,215 54,174,215 Land - Community 822,900 822,900 Land - Recreation Facilities 1,294,313 1,294,313
56,291,428 56,291,428
A register containing the information required by section 63 of the Municipal Finance Management Act is available for inspection at the registered office of the municipality.
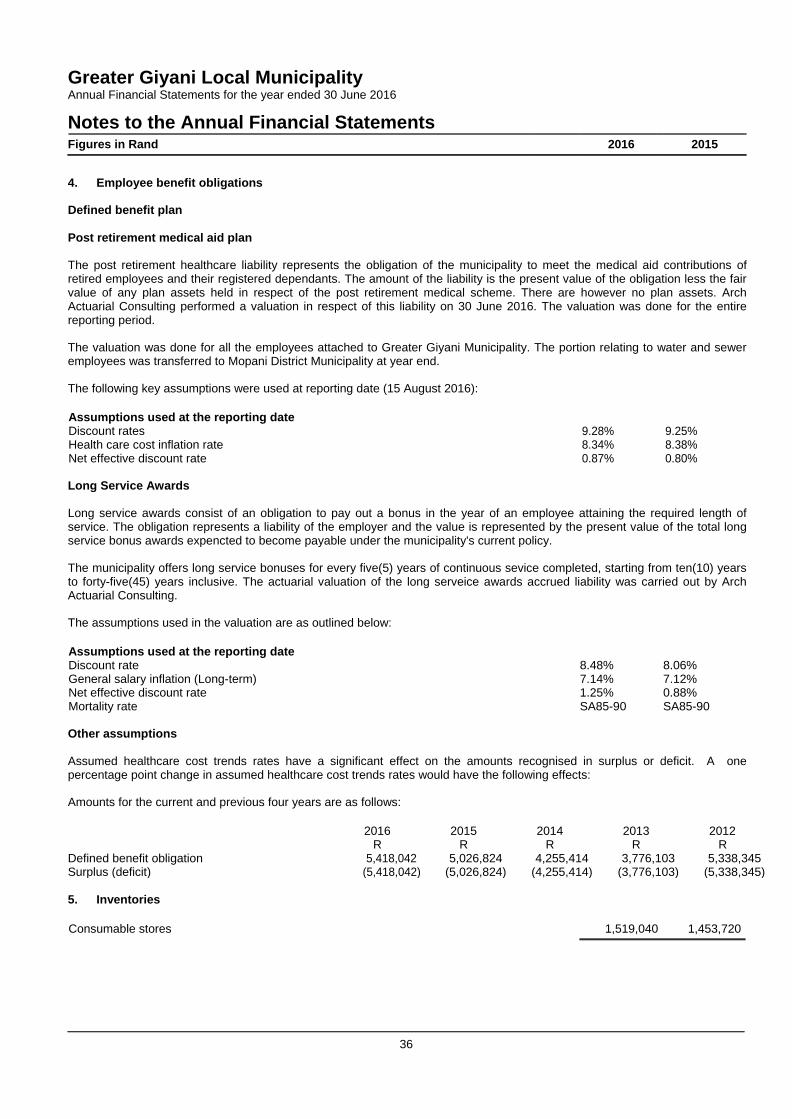
Greater Giyani Local Municipality Annual Financial Statements for the year ended 30 June 2016
Notes to the Annual Financial Statements
36
Figures in Rand 2016 2015
4. Employee benefit obligations
Defined benefit plan
Post retirement medical aid plan
The post retirement healthcare liability represents the obligation of the municipality to meet the medical aid contributions of retired employees and their registered dependants. The amount of the liability is the present value of the obligation less the fair value of any plan assets held in respect of the post retirement medical scheme. There are however no plan assets. Arch Actuarial Consulting performed a valuation in respect of this liability on 30 June 2016. The valuation was done for the entire reporting period.
The valuation was done for all the employees attached to Greater Giyani Municipality. The portion relating to water and sewer employees was transferred to Mopani District Municipality at year end.
The following key assumptions were used at reporting date (15 August 2016):
Assumptions used at the reporting date Discount rates
9.28%
9.25%
Health care cost inflation rate 8.34% 8.38% Net effective discount rate 0.87% 0.80%
Long Service Awards
Long service awards consist of an obligation to pay out a bonus in the year of an employee attaining the required length of service. The obligation represents a liability of the employer and the value is represented by the present value of the total long service bonus awards expencted to become payable under the municipality's current policy.
The municipality offers long service bonuses for every five(5) years of continuous sevice completed, starting from ten(10) years to forty-five(45) years inclusive. The actuarial valuation of the long serveice awards accrued liability was carried out by Arch Actuarial Consulting.
The assumptions used in the valuation are as outlined below:
Assumptions used at the reporting date Discount rate
8.48%
8.06%
General salary inflation (Long-term) 7.14% 7.12% Net effective discount rate 1.25% 0.88% Mortality rate SA85-90 SA85-90
Other assumptions
Assumed healthcare cost trends rates have a significant effect on the amounts recognised in surplus or deficit. A one percentage point change in assumed healthcare cost trends rates would have the following effects:
Amounts for the current and previous four years are as follows:
`
2016 2015 2014 2013 2012 R R R R R
Defined benefit obligation 5,418,042 5,026,824 4,255,414 3,776,103 5,338,345 Surplus (deficit) (5,418,042) (5,026,824) (4,255,414) (3,776,103) (5,338,345)
5. Inventories
Consumable stores 1,519,040 1,453,720
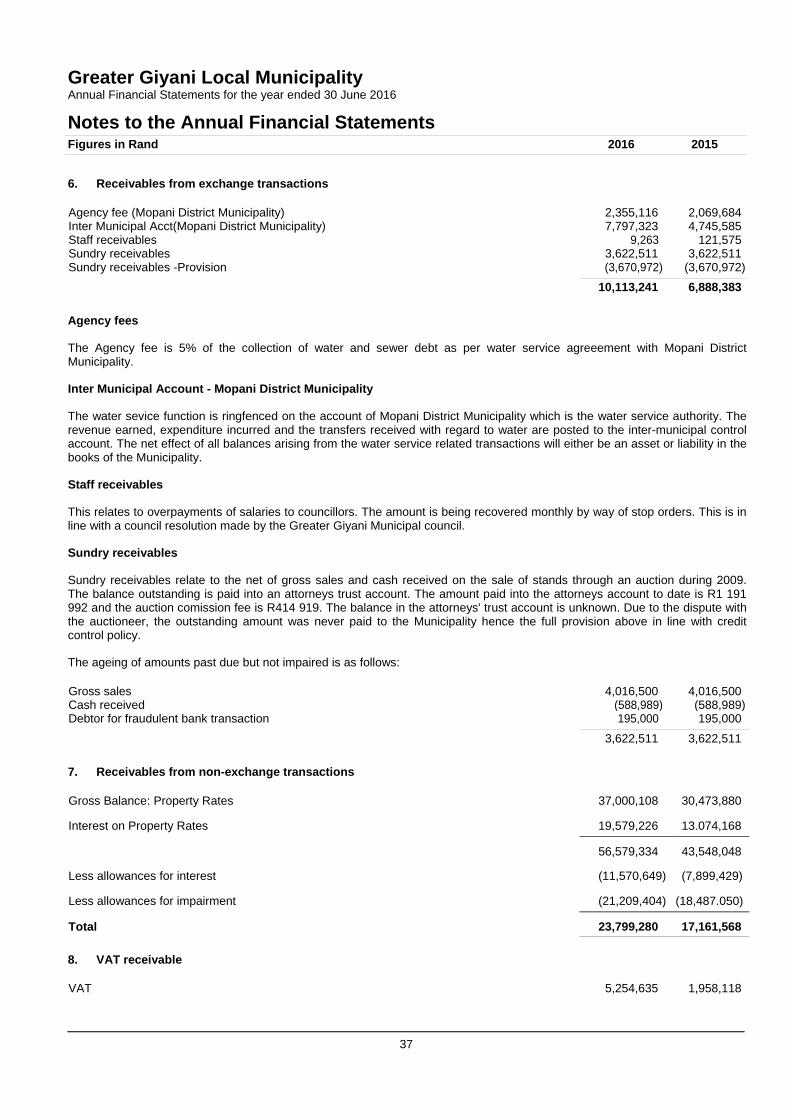
Greater Giyani Local Municipality Annual Financial Statements for the year ended 30 June 2016
Notes to the Annual Financial Statements
37
Figures in Rand 2016 2015
6. Receivables from exchange transactions
Agency fee (Mopani District Municipality) 2,355,116 2,069,684 Inter Municipal Acct(Mopani District Municipality) 7,797,323 4,745,585 Staff receivables 9,263 121,575 Sundry receivables 3,622,511 3,622,511 Sundry receivables -Provision (3,670,972) (3,670,972)
10,113,241 6,888,383 Agency fees
The Agency fee is 5% of the collection of water and sewer debt as per water service agreeement with Mopani District Municipality.
Inter Municipal Account - Mopani District Municipality
The water sevice function is ringfenced on the account of Mopani District Municipality which is the water service authority. The revenue earned, expenditure incurred and the transfers received with regard to water are posted to the inter-municipal control account. The net effect of all balances arising from the water service related transactions will either be an asset or liability in the books of the Municipality.
Staff receivables
This relates to overpayments of salaries to councillors. The amount is being recovered monthly by way of stop orders. This is in line with a council resolution made by the Greater Giyani Municipal council.
Sundry receivables
Sundry receivables relate to the net of gross sales and cash received on the sale of stands through an auction during 2009. The balance outstanding is paid into an attorneys trust account. The amount paid into the attorneys account to date is R1 191 992 and the auction comission fee is R414 919. The balance in the attorneys' trust account is unknown. Due to the dispute with the auctioneer, the outstanding amount was never paid to the Municipality hence the full provision above in line with credit control policy.
The ageing of amounts past due but not impaired is as follows:
Gross sales 4,016,500 4,016,500 Cash received (588,989) (588,989) Debtor for fraudulent bank transaction 195,000 195,000
3,622,511 3,622,511 7. Receivables from non-exchange transactions
Gross Balance: Property Rates
37,000,108 30,473,880
Interest on Property Rates 19,579,226 13.074,168
56,579,334 43,548,048
Less allowances for interest (11,570,649) (7,899,429)
Less allowances for impairment (21,209,404) (18,487.050)
Total 23,799,280 17,161,568 8. VAT receivable
VAT 5,254,635 1,958,118
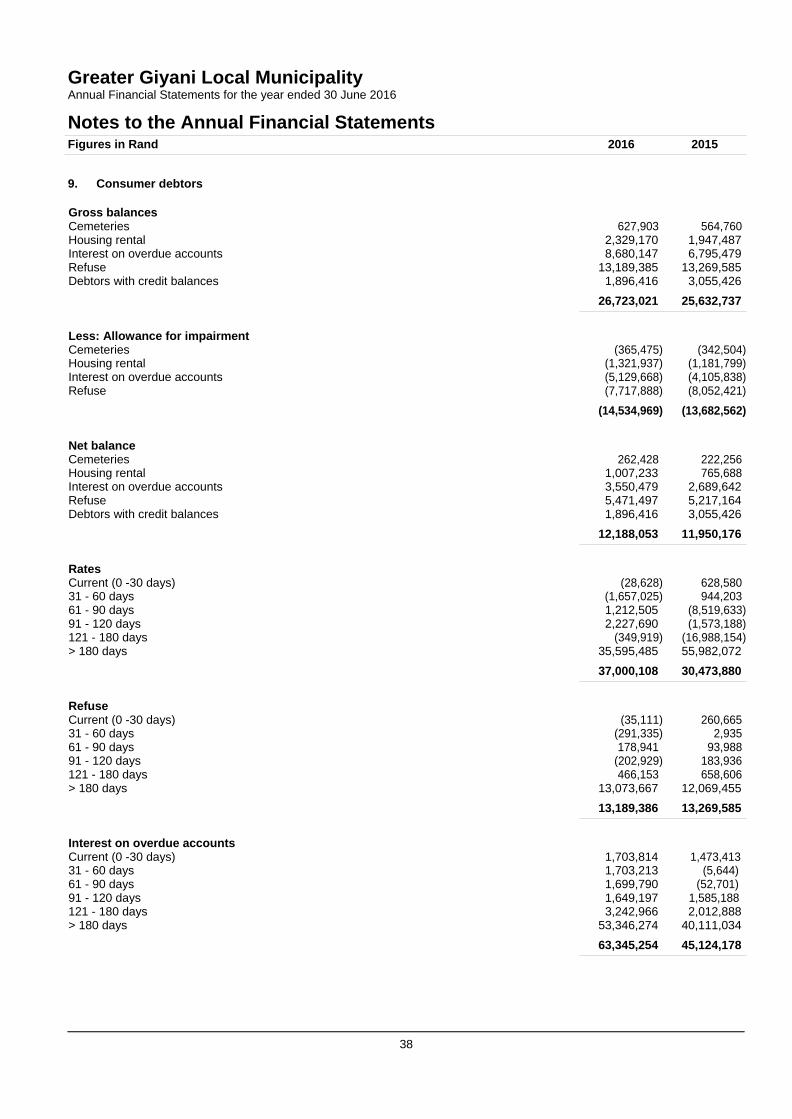
Greater Giyani Local Municipality Annual Financial Statements for the year ended 30 June 2016
Notes to the Annual Financial Statements
38
Figures in Rand 2016 2015
9. Consumer debtors
Gross balances Cemeteries
627,903
564,760
Housing rental 2,329,170 1,947,487 Interest on overdue accounts 8,680,147 6,795,479 Refuse 13,189,385 13,269,585 Debtors with credit balances 1,896,416 3,055,426
26,723,021 25,632,737 Less: Allowance for impairment Cemeteries
(365,475)
(342,504) Housing rental (1,321,937) (1,181,799) Interest on overdue accounts (5,129,668) (4,105,838) Refuse (7,717,888) (8,052,421)
(14,534,969) (13,682,562) Net balance Cemeteries
262,428
222,256 Housing rental 1,007,233 765,688 Interest on overdue accounts 3,550,479 2,689,642 Refuse 5,471,497 5,217,164 Debtors with credit balances 1,896,416 3,055,426
12,188,053 11,950,176 Rates Current (0 -30 days)
(28,628)
628,580 31 - 60 days (1,657,025) 944,203 61 - 90 days 1,212,505 (8,519,633) 91 - 120 days 2,227,690 (1,573,188) 121 - 180 days (349,919) (16,988,154) > 180 days 35,595,485 55,982,072
37,000,108 30,473,880 Refuse Current (0 -30 days)
(35,111)
260,665 31 - 60 days (291,335) 2,935 61 - 90 days 178,941 93,988 91 - 120 days (202,929) 183,936 121 - 180 days 466,153 658,606 > 180 days 13,073,667 12,069,455
13,189,386 13,269,585 Interest on overdue accounts Current (0 -30 days)
1,703,814
1,473,413
31 - 60 days 1,703,213 (5,644) 61 - 90 days 1,699,790 (52,701) 91 - 120 days 1,649,197 1,585,188 121 - 180 days 3,242,966 2,012,888 > 180 days 53,346,274 40,111,034
63,345,254 45,124,178
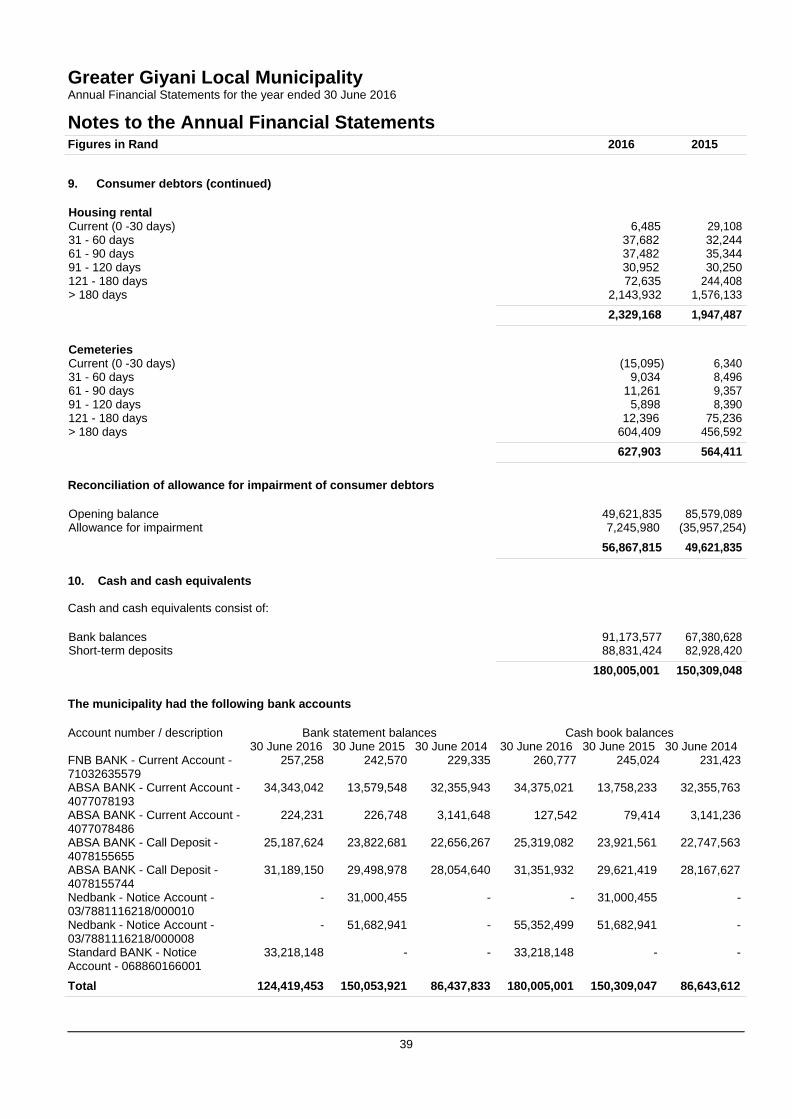
Greater Giyani Local Municipality Annual Financial Statements for the year ended 30 June 2016
Notes to the Annual Financial Statements
39
Figures in Rand 2016 2015
9. Consumer debtors (continued)
Housing rental Current (0 -30 days)
6,485 29,108
31 - 60 days 37,682 32,244 61 - 90 days 37,482 35,344 91 - 120 days 30,952 30,250 121 - 180 days 72,635 244,408 > 180 days 2,143,932 1,576,133
2,329,168 1,947,487 Cemeteries Current (0 -30 days)
(15,095) 6,340 31 - 60 days 9,034 8,496 61 - 90 days 11,261 9,357 91 - 120 days 5,898 8,390 121 - 180 days 12,396 75,236 > 180 days 604,409 456,592
627,903 564,411 Reconciliation of allowance for impairment of consumer debtors
Opening balance 49,621,835 85,579,089 Allowance for impairment 7,245,980 (35,957,254)
56,867,815 49,621,835 10. Cash and cash equivalents
Cash and cash equivalents consist of:
Bank balances 91,173,577 67,380,628 Short-term deposits 88,831,424 82,928,420
180,005,001 150,309,048 The municipality had the following bank accounts
`
Account number / description Bank statement balances Cash book balances 30 June 2016 30 June 2015 30 June 2014 30 June 2016 30 June 2015 30 June 2014
FNB BANK - Current Account - 257,258 242,570 229,335 260,777 245,024 231,423 71032635579 ABSA BANK - Current Account - 34,343,042 13,579,548 32,355,943
34,375,021 13,758,233 32,355,763
4077078193 ABSA BANK - Current Account - 224,231 226,748 3,141,648
127,542 79,414 3,141,236
4077078486 ABSA BANK - Call Deposit - 25,187,624 23,822,681 22,656,267
25,319,082 23,921,561 22,747,563
4078155655 ABSA BANK - Call Deposit - 31,189,150 29,498,978 28,054,640
31,351,932 29,621,419 28,167,627
4078155744 Nedbank - Notice Account - - 31,000,455 -
- 31,000,455 -
03/7881116218/000010 Nedbank - Notice Account - - 51,682,941 -
55,352,499 51,682,941 -
03/7881116218/000008 Standard BANK - Notice 33,218,148 - -
33,218,148 - -
Account - 068860166001 Total 124,419,453 150,053,921 86,437,833 180,005,001 150,309,047 86,643,612
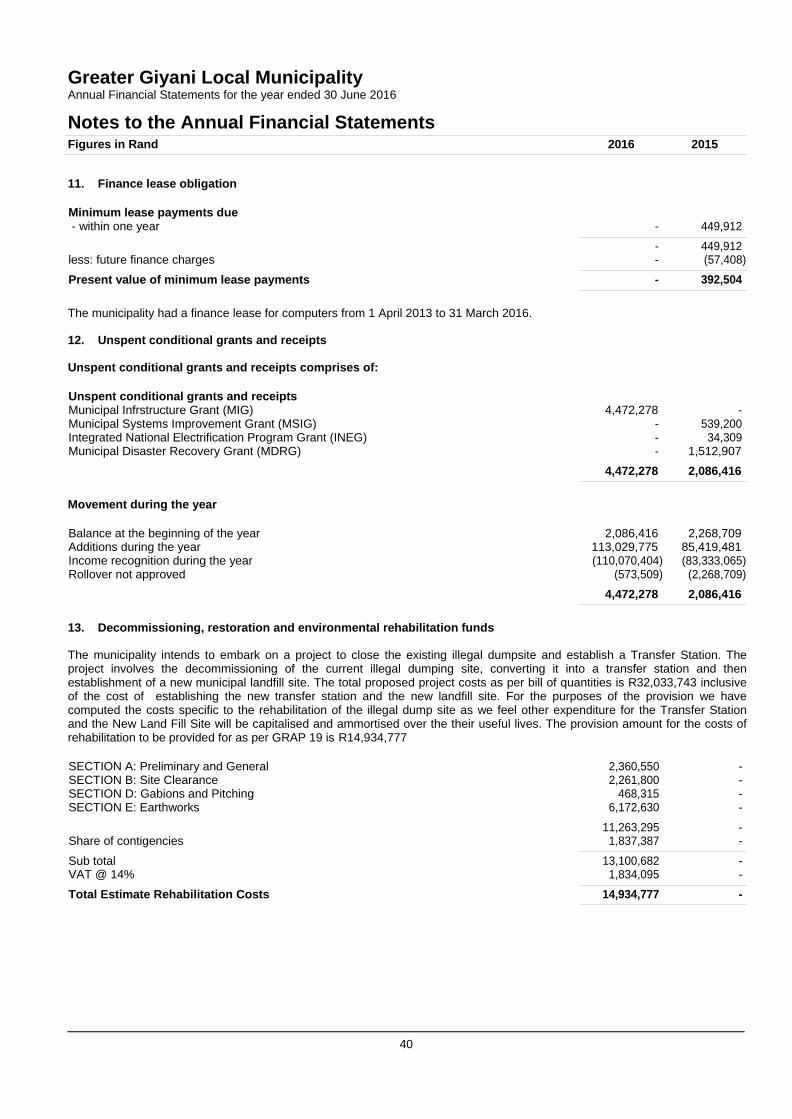
Greater Giyani Local Municipality Annual Financial Statements for the year ended 30 June 2016
Notes to the Annual Financial Statements
40
Figures in Rand 2016 2015
11. Finance lease obligation
Minimum lease payments due - within one year
-
449,912
- 449,912 less: future finance charges - (57,408)
Present value of minimum lease payments - 392,504 The municipality had a finance lease for computers from 1 April 2013 to 31 March 2016.
12. Unspent conditional grants and receipts
Unspent conditional grants and receipts comprises of:
Unspent conditional grants and receipts Municipal Infrstructure Grant (MIG)
4,472,278
-
Municipal Systems Improvement Grant (MSIG) - 539,200 Integrated National Electrification Program Grant (INEG) - 34,309 Municipal Disaster Recovery Grant (MDRG) - 1,512,907
4,472,278 2,086,416 Movement during the year
Balance at the beginning of the year 2,086,416 2,268,709 Additions during the year 113,029,775 85,419,481 Income recognition during the year (110,070,404) (83,333,065) Rollover not approved (573,509) (2,268,709)
4,472,278 2,086,416 13. Decommissioning, restoration and environmental rehabilitation funds
The municipality intends to embark on a project to close the existing illegal dumpsite and establish a Transfer Station. The project involves the decommissioning of the current illegal dumping site, converting it into a transfer station and then establishment of a new municipal landfill site. The total proposed project costs as per bill of quantities is R32,033,743 inclusive of the cost of establishing the new transfer station and the new landfill site. For the purposes of the provision we have computed the costs specific to the rehabilitation of the illegal dump site as we feel other expenditure for the Transfer Station and the New Land Fill Site will be capitalised and ammortised over the their useful lives. The provision amount for the costs of rehabilitation to be provided for as per GRAP 19 is R14,934,777
SECTION A: Preliminary and General 2,360,550 - SECTION B: Site Clearance 2,261,800 - SECTION D: Gabions and Pitching 468,315 - SECTION E: Earthworks 6,172,630 -
11,263,295 - Share of contigencies 1,837,387 -
Sub total 13,100,682 - VAT @ 14% 1,834,095 -
Total Estimate Rehabilitation Costs 14,934,777 -

Greater Giyani Local Municipality Annual Financial Statements for the year ended 30 June 2016
Notes to the Annual Financial Statements
41
Figures in Rand 2016 2015
14. Provisions
Reconciliation of provisions - 2016
Environmental rehabilitation
Opening Balance 13,638,203
Additions
1,161,390
Total
14,799,593 Reconciliation of provisions - 2015
Environmental rehabilitation
Opening Balance 12,572,610
Additions
1,065,593
Total
13,638,203 Environmental rehabilitation provision
The obligation arose from the Municipality operating an illegal dumping site and the expected cost to the municipality is for rehabilitation of the site.
The provision amount of R14,799,593(2015: R13,638,203) was determined from the bill of quantities computed by a quantity surveyor for the rehabilitation work to be done on the illegal landfill site. There is no uncertainity with regards to this provision as a contract for the works to be done has been signed based on the bill of quantities. Management expects the rehabilitation work to be finalised in the ensuing year.
15. Payables from exchange transactions
Trade payables 40,937,211 35,773,112 Other payables 33,963 714,998 Accrued leave pay 13,723,047 10,501,881 Accrued bonus 2,618,357 1,345,714 Payroll creditors 148,638 176,014 Unspecified direct deposits 553,219 250,394
58,014,435 48,762,113 Inter Municipal Account - Mopani District Municipality
Gross revenue - Water 84,108,560 72,220,808 Gross revenue - Sewerage 15,716,311 13,150,133 Gross revenue - Interest 30,556,449 20,037,119 Overheads - Water (121,167,275) (97,590,327) Overheads - Sewerage (12,438,400) (10,710,596) Water debtors exGGM - Water (55,305,919) (46,163,799) Water debtors exGGM - Sewerage (10,682,952) (8,782,394) Water debtors exGGM - Interest (35,085,880) (24,524,362) Trade creditors 14,500 610,960 Inventory (996,429) (1,145,914) Accrued leave 617,245 560,877 Accrued bonus 115,860 105,335 Long service award 485,072 392,261 Post retirement medical contribution debts 1,090,111 908,171 Provision for doubtful debts 95,175,424 76,094,125
(7,797,323) (4,837,603)
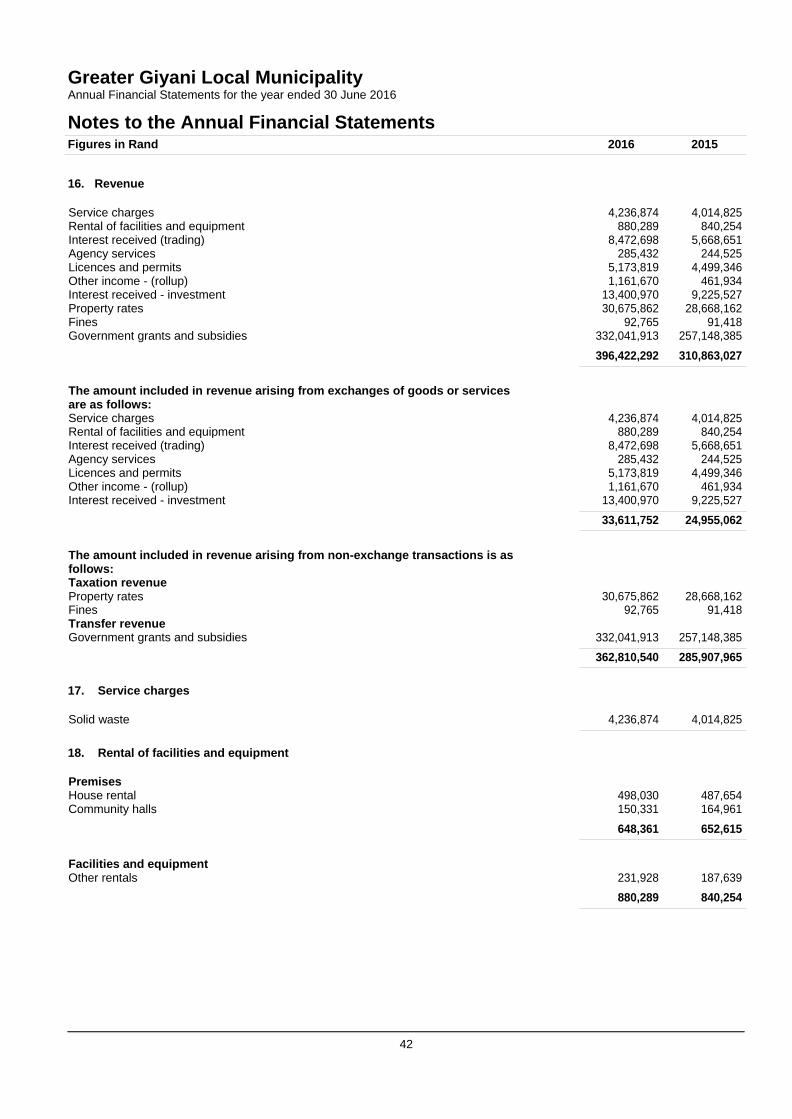
Greater Giyani Local Municipality Annual Financial Statements for the year ended 30 June 2016
Notes to the Annual Financial Statements
42
Figures in Rand 2016 2015
16. Revenue
Service charges 4,236,874 4,014,825 Rental of facilities and equipment 880,289 840,254 Interest received (trading) 8,472,698 5,668,651 Agency services 285,432 244,525 Licences and permits 5,173,819 4,499,346 Other income - (rollup) 1,161,670 461,934 Interest received - investment 13,400,970 9,225,527 Property rates 30,675,862 28,668,162 Fines 92,765 91,418 Government grants and subsidies 332,041,913 257,148,385
396,422,292 310,863,027 The amount included in revenue arising from exchanges of goods or services are as follows: Service charges
4,236,874
4,014,825 Rental of facilities and equipment 880,289 840,254 Interest received (trading) 8,472,698 5,668,651 Agency services 285,432 244,525 Licences and permits 5,173,819 4,499,346 Other income - (rollup) 1,161,670 461,934 Interest received - investment 13,400,970 9,225,527
33,611,752 24,955,062 The amount included in revenue arising from non-exchange transactions is as follows: Taxation revenue Property rates
30,675,862
28,668,162 Fines 92,765 91,418 Transfer revenue Government grants and subsidies
332,041,913
257,148,385
362,810,540 285,907,965 17. Service charges
Solid waste 4,236,874 4,014,825 18. Rental of facilities and equipment
Premises House rental
498,030
487,654
Community halls 150,331 164,961
648,361 652,615 Facilities and equipment Other rentals
231,928
187,639
880,289 840,254
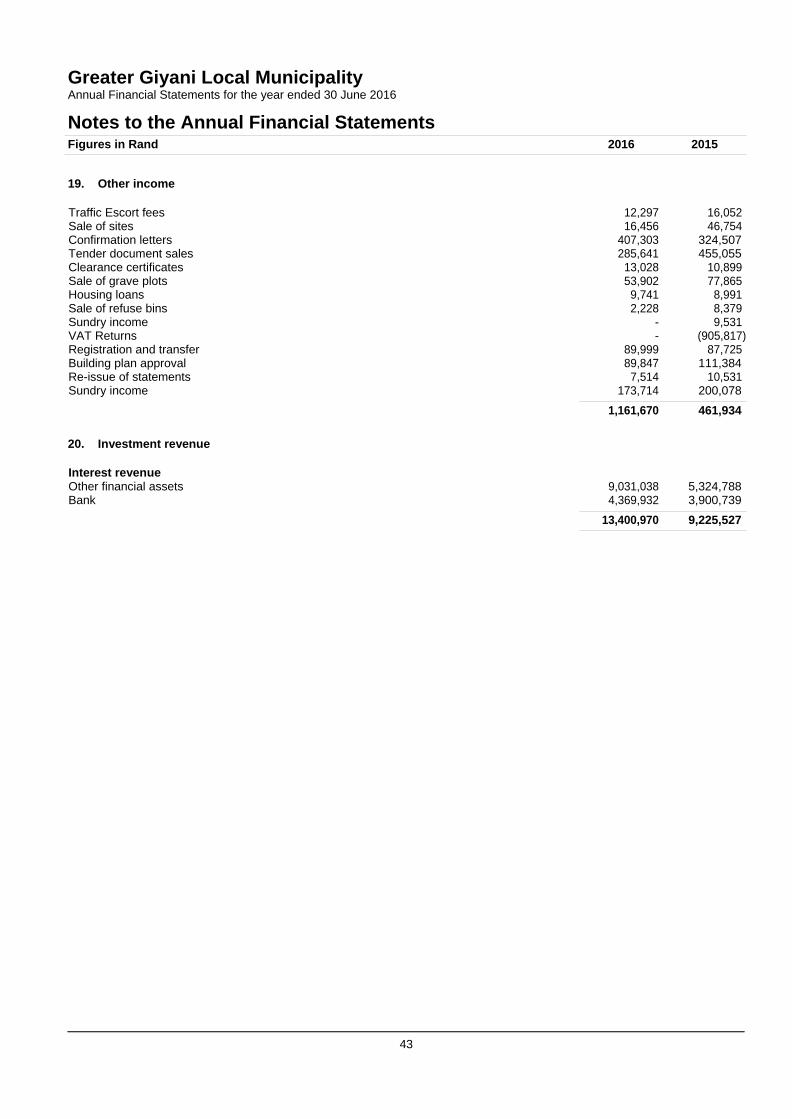
Greater Giyani Local Municipality Annual Financial Statements for the year ended 30 June 2016
Notes to the Annual Financial Statements
43
Figures in Rand 2016 2015
19. Other income
Traffic Escort fees 12,297 16,052 Sale of sites 16,456 46,754 Confirmation letters 407,303 324,507 Tender document sales 285,641 455,055 Clearance certificates 13,028 10,899 Sale of grave plots 53,902 77,865 Housing loans 9,741 8,991 Sale of refuse bins 2,228 8,379 Sundry income - 9,531 VAT Returns - (905,817) Registration and transfer 89,999 87,725 Building plan approval 89,847 111,384 Re-issue of statements 7,514 10,531 Sundry income 173,714 200,078
1,161,670 461,934 20. Investment revenue
Interest revenue Other financial assets
9,031,038
5,324,788
Bank 4,369,932 3,900,739
13,400,970 9,225,527
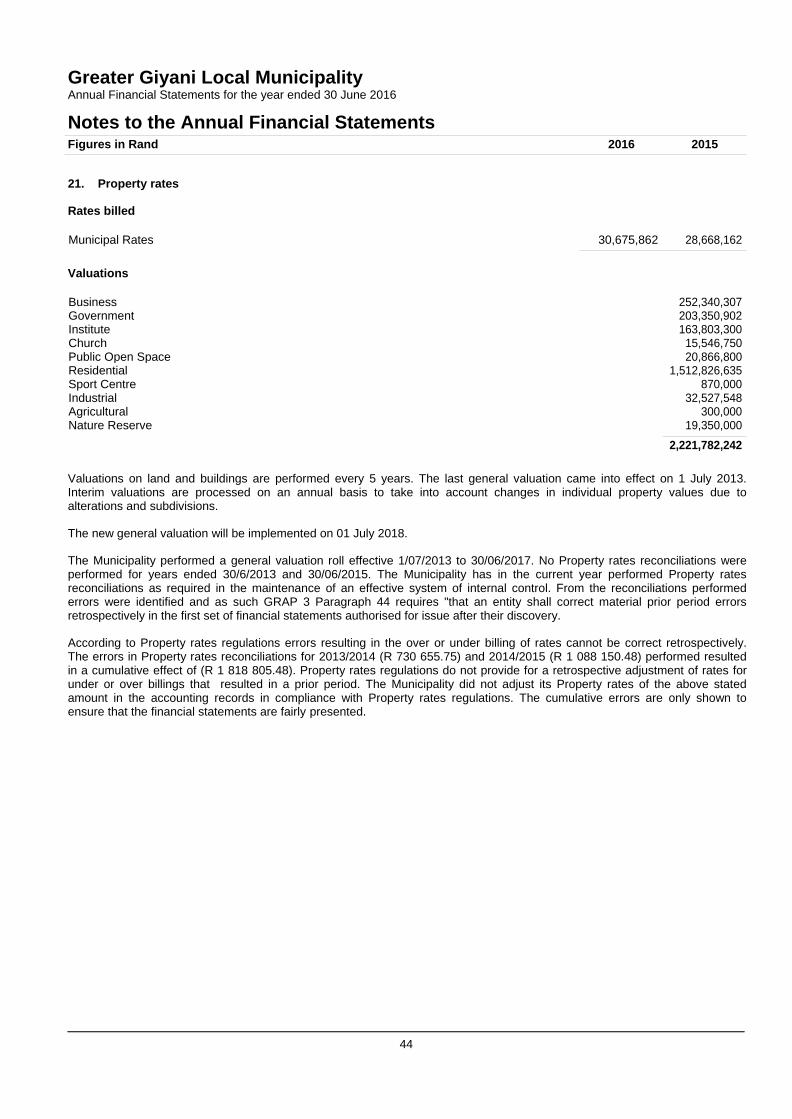
Greater Giyani Local Municipality Annual Financial Statements for the year ended 30 June 2016
Notes to the Annual Financial Statements
44
Figures in Rand 2016 2015
21. Property rates
Rates billed
Municipal Rates 30,675,862 28,668,162 Valuations
Business 252,340,307 Government 203,350,902 Institute 163,803,300 Church 15,546,750 Public Open Space 20,866,800 Residential 1,512,826,635 Sport Centre 870,000 Industrial 32,527,548 Agricultural 300,000 Nature Reserve 19,350,000
2,221,782,242
Valuations on land and buildings are performed every 5 years. The last general valuation came into effect on 1 July 2013. Interim valuations are processed on an annual basis to take into account changes in individual property values due to alterations and subdivisions.
The new general valuation will be implemented on 01 July 2018.
The Municipality performed a general valuation roll effective 1/07/2013 to 30/06/2017. No Property rates reconciliations were performed for years ended 30/6/2013 and 30/06/2015. The Municipality has in the current year performed Property rates reconciliations as required in the maintenance of an effective system of internal control. From the reconciliations performed errors were identified and as such GRAP 3 Paragraph 44 requires "that an entity shall correct material prior period errors retrospectively in the first set of financial statements authorised for issue after their discovery.
According to Property rates regulations errors resulting in the over or under billing of rates cannot be correct retrospectively. The errors in Property rates reconciliations for 2013/2014 (R 730 655.75) and 2014/2015 (R 1 088 150.48) performed resulted in a cumulative effect of (R 1 818 805.48). Property rates regulations do not provide for a retrospective adjustment of rates for under or over billings that resulted in a prior period. The Municipality did not adjust its Property rates of the above stated amount in the accounting records in compliance with Property rates regulations. The cumulative errors are only shown to ensure that the financial statements are fairly presented.
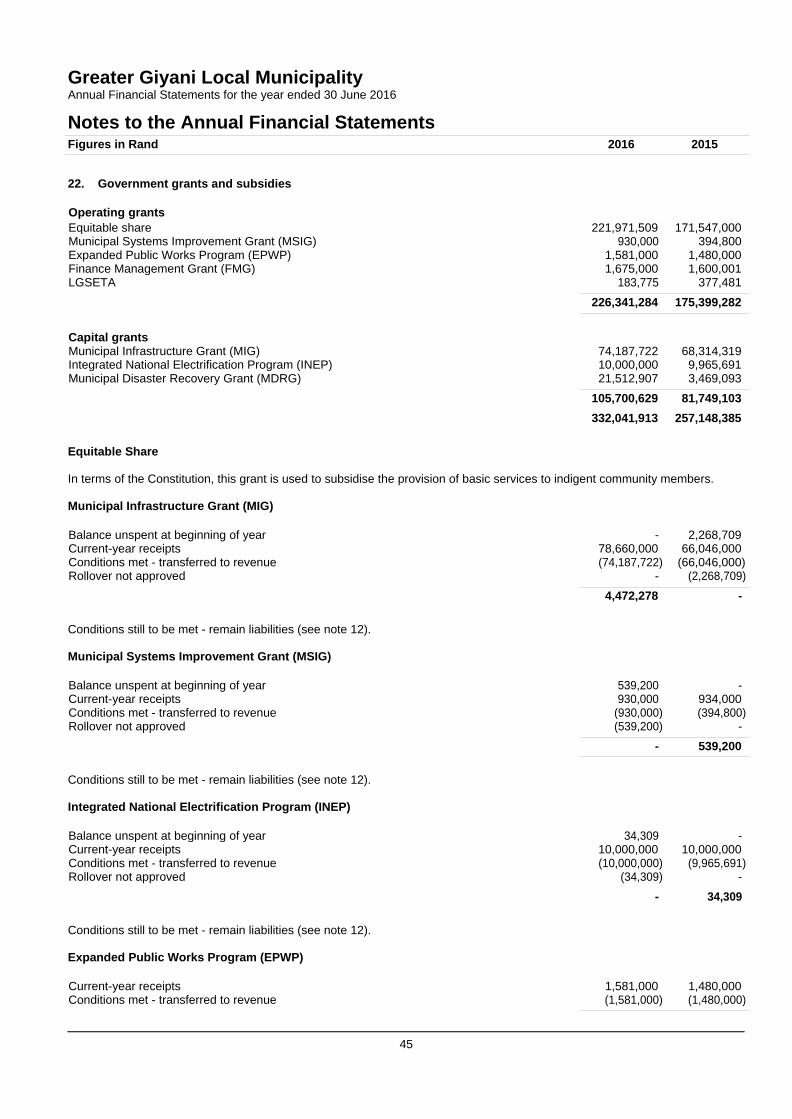
Greater Giyani Local Municipality Annual Financial Statements for the year ended 30 June 2016
Notes to the Annual Financial Statements
45
Figures in Rand 2016 2015
22. Government grants and subsidies
Operating grants Equitable share 221,971,509 171,547,000 Municipal Systems Improvement Grant (MSIG) 930,000 394,800 Expanded Public Works Program (EPWP) 1,581,000 1,480,000 Finance Management Grant (FMG) 1,675,000 1,600,001 LGSETA 183,775 377,481
226,341,284 175,399,282 Capital grants Municipal Infrastructure Grant (MIG)
74,187,722
68,314,319 Integrated National Electrification Program (INEP) 10,000,000 9,965,691 Municipal Disaster Recovery Grant (MDRG) 21,512,907 3,469,093
105,700,629 81,749,103 332,041,913 257,148,385 Equitable Share
In terms of the Constitution, this grant is used to subsidise the provision of basic services to indigent community members.
Municipal Infrastructure Grant (MIG)
Balance unspent at beginning of year - 2,268,709 Current-year receipts 78,660,000 66,046,000 Conditions met - transferred to revenue (74,187,722) (66,046,000) Rollover not approved - (2,268,709)
4,472,278 - Conditions still to be met - remain liabilities (see note 12).
Municipal Systems Improvement Grant (MSIG)
Balance unspent at beginning of year 539,200 - Current-year receipts 930,000 934,000 Conditions met - transferred to revenue (930,000) (394,800) Rollover not approved (539,200) -
- 539,200 Conditions still to be met - remain liabilities (see note 12).
Integrated National Electrification Program (INEP)
Balance unspent at beginning of year 34,309 - Current-year receipts 10,000,000 10,000,000 Conditions met - transferred to revenue (10,000,000) (9,965,691) Rollover not approved (34,309) -
- 34,309 Conditions still to be met - remain liabilities (see note 12).
Expanded Public Works Program (EPWP)
Current-year receipts 1,581,000 1,480,000 Conditions met - transferred to revenue (1,581,000) (1,480,000)
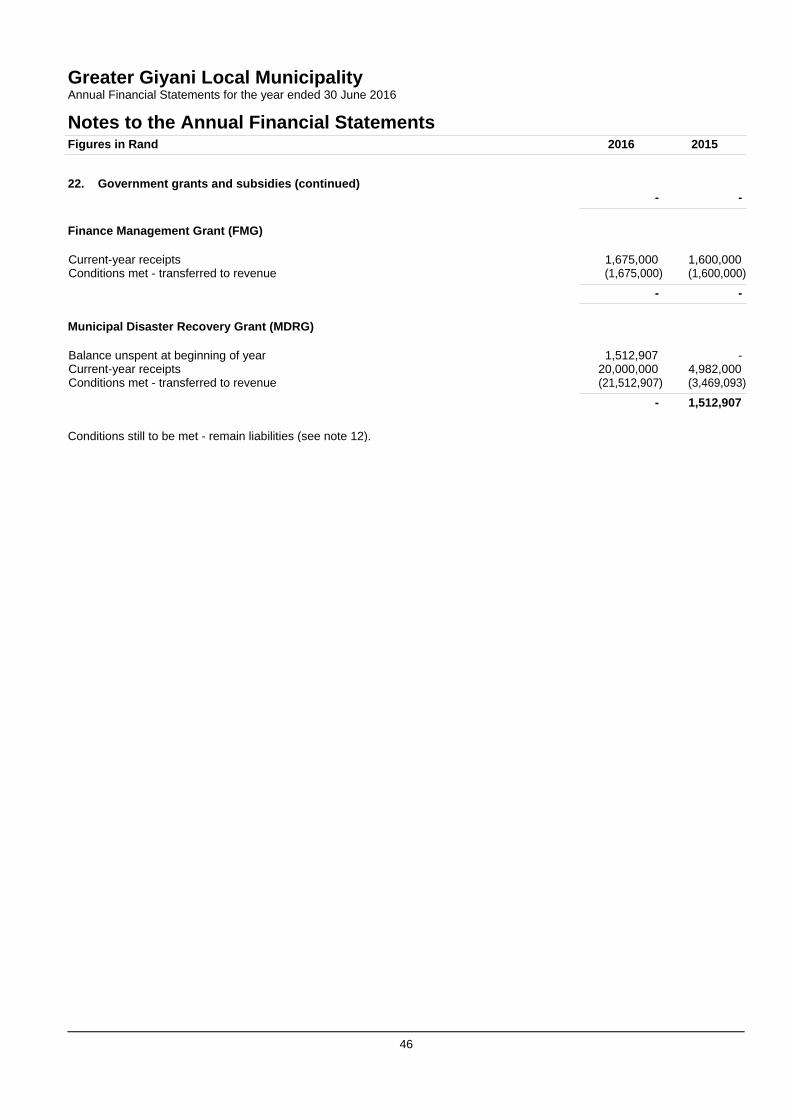
Greater Giyani Local Municipality Annual Financial Statements for the year ended 30 June 2016
Notes to the Annual Financial Statements
46
Figures in Rand 2016 2015
22. Government grants and subsidies (continued)
-
- Finance Management Grant (FMG)
Current-year receipts 1,675,000 1,600,000 Conditions met - transferred to revenue (1,675,000) (1,600,000)
- - Municipal Disaster Recovery Grant (MDRG)
Balance unspent at beginning of year 1,512,907 - Current-year receipts 20,000,000 4,982,000 Conditions met - transferred to revenue (21,512,907) (3,469,093)
- 1,512,907 Conditions still to be met - remain liabilities (see note 12).
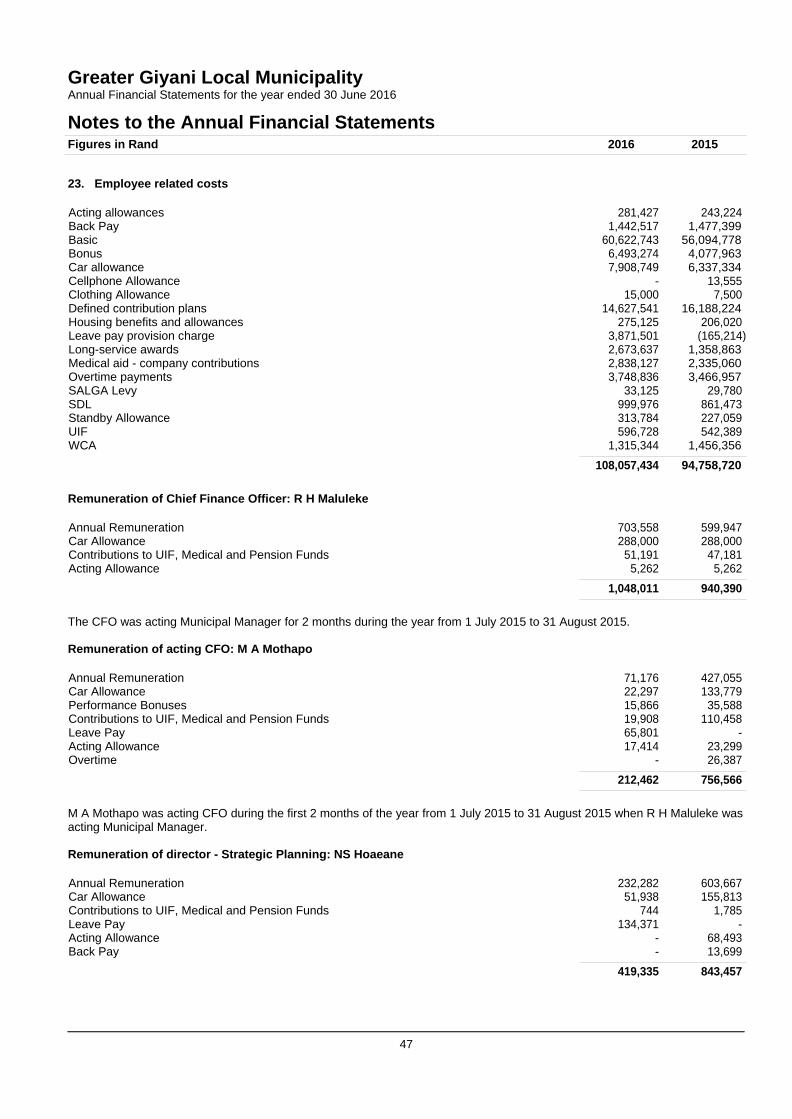
Greater Giyani Local Municipality Annual Financial Statements for the year ended 30 June 2016
Notes to the Annual Financial Statements
47
Figures in Rand 2016 2015
23. Employee related costs
Acting allowances 281,427 243,224 Back Pay 1,442,517 1,477,399 Basic 60,622,743 56,094,778 Bonus 6,493,274 4,077,963 Car allowance 7,908,749 6,337,334 Cellphone Allowance - 13,555 Clothing Allowance 15,000 7,500 Defined contribution plans 14,627,541 16,188,224 Housing benefits and allowances 275,125 206,020 Leave pay provision charge 3,871,501 (165,214) Long-service awards 2,673,637 1,358,863 Medical aid - company contributions 2,838,127 2,335,060 Overtime payments 3,748,836 3,466,957 SALGA Levy 33,125 29,780 SDL 999,976 861,473 Standby Allowance 313,784 227,059 UIF 596,728 542,389 WCA 1,315,344 1,456,356
108,057,434 94,758,720 Remuneration of Chief Finance Officer: R H Maluleke
Annual Remuneration 703,558 599,947 Car Allowance 288,000 288,000 Contributions to UIF, Medical and Pension Funds 51,191 47,181 Acting Allowance 5,262 5,262
1,048,011 940,390
The CFO was acting Municipal Manager for 2 months during the year from 1 July 2015 to 31 August 2015.
Remuneration of acting CFO: M A Mothapo
Annual Remuneration 71,176 427,055 Car Allowance 22,297 133,779 Performance Bonuses 15,866 35,588 Contributions to UIF, Medical and Pension Funds 19,908 110,458 Leave Pay 65,801 - Acting Allowance 17,414 23,299 Overtime - 26,387
212,462 756,566
M A Mothapo was acting CFO during the first 2 months of the year from 1 July 2015 to 31 August 2015 when R H Maluleke was acting Municipal Manager.
Remuneration of director - Strategic Planning: NS Hoaeane Annual Remuneration
232,282
603,667 Car Allowance 51,938 155,813 Contributions to UIF, Medical and Pension Funds 744 1,785 Leave Pay 134,371 - Acting Allowance - 68,493 Back Pay - 13,699
419,335 843,457
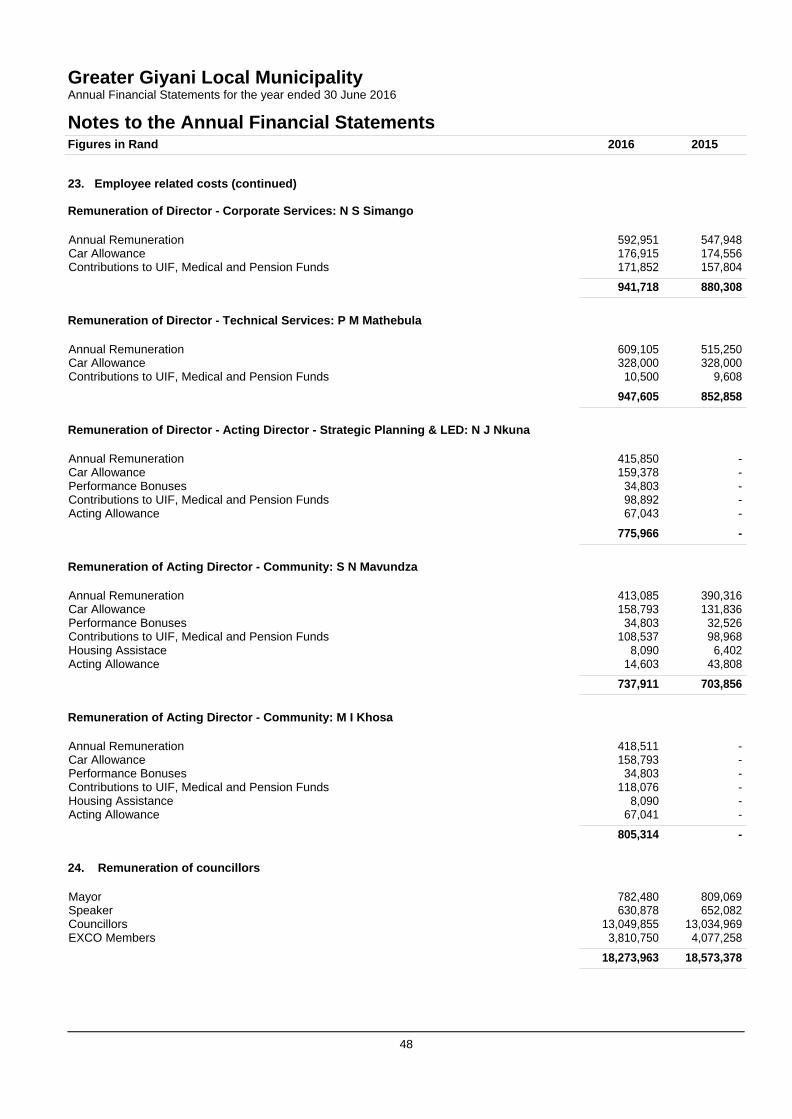
Greater Giyani Local Municipality Annual Financial Statements for the year ended 30 June 2016
Notes to the Annual Financial Statements
48
Figures in Rand 2016 2015
23. Employee related costs (continued)
Remuneration of Director - Corporate Services: N S Simango
Annual Remuneration 592,951 547,948 Car Allowance 176,915 174,556 Contributions to UIF, Medical and Pension Funds 171,852 157,804
941,718 880,308 Remuneration of Director - Technical Services: P M Mathebula
Annual Remuneration 609,105 515,250 Car Allowance 328,000 328,000 Contributions to UIF, Medical and Pension Funds 10,500 9,608
947,605 852,858 Remuneration of Director - Acting Director - Strategic Planning & LED: N J Nkuna
Annual Remuneration 415,850 - Car Allowance 159,378 - Performance Bonuses 34,803 - Contributions to UIF, Medical and Pension Funds 98,892 - Acting Allowance 67,043 -
775,966 - Remuneration of Acting Director - Community: S N Mavundza
Annual Remuneration 413,085 390,316 Car Allowance 158,793 131,836 Performance Bonuses 34,803 32,526 Contributions to UIF, Medical and Pension Funds 108,537 98,968 Housing Assistace 8,090 6,402 Acting Allowance 14,603 43,808
737,911 703,856 Remuneration of Acting Director - Community: M I Khosa
Annual Remuneration 418,511 - Car Allowance 158,793 - Performance Bonuses 34,803 - Contributions to UIF, Medical and Pension Funds 118,076 - Housing Assistance 8,090 - Acting Allowance 67,041 -
805,314 - 24. Remuneration of councillors
Mayor 782,480 809,069 Speaker 630,878 652,082 Councillors 13,049,855 13,034,969 EXCO Members 3,810,750 4,077,258
18,273,963 18,573,378
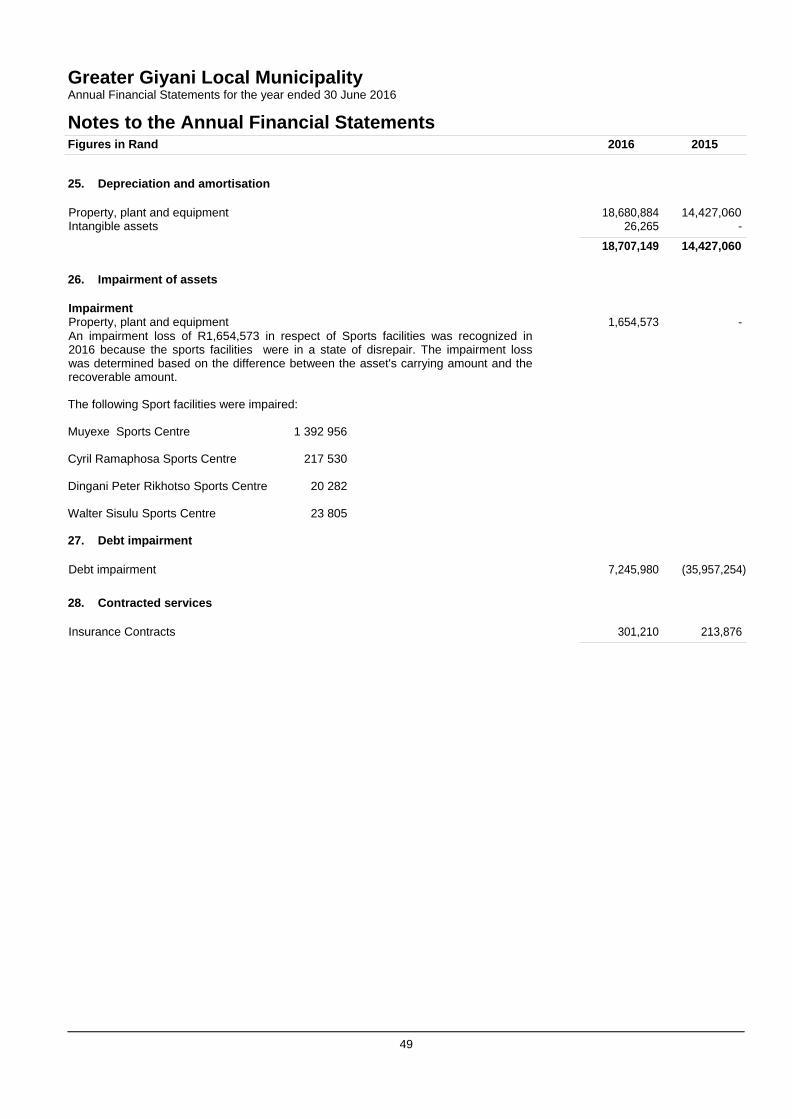
Greater Giyani Local Municipality Annual Financial Statements for the year ended 30 June 2016
Notes to the Annual Financial Statements
49
Figures in Rand 2016 2015
25. Depreciation and amortisation
Property, plant and equipment 18,680,884 14,427,060 Intangible assets 26,265 -
18,707,149 14,427,060 26. Impairment of assets
Impairment Property, plant and equipment
1,654,573
-
An impairment loss of R1,654,573 in respect of Sports facilities was recognized in 2016 because the sports facilities were in a state of disrepair. The impairment loss was determined based on the difference between the asset's carrying amount and the recoverable amount.
The following Sport facilities were impaired:
Muyexe Sports Centre 1 392 956
Cyril Ramaphosa Sports Centre 217 530
Dingani Peter Rikhotso Sports Centre 20 282
Walter Sisulu Sports Centre 23 805
27. Debt impairment
Debt impairment 7,245,980 (35,957,254) 28. Contracted services
Insurance Contracts 301,210 213,876
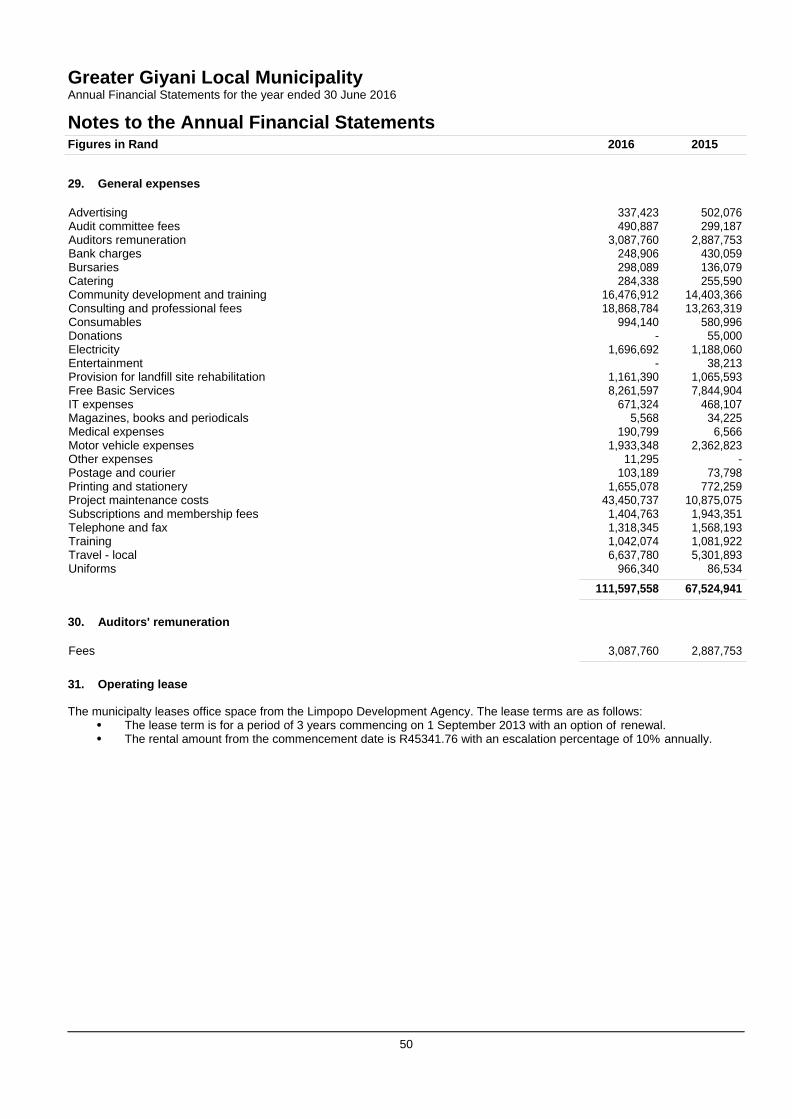
Greater Giyani Local Municipality Annual Financial Statements for the year ended 30 June 2016
Notes to the Annual Financial Statements
50
Figures in Rand 2016 2015
29. General expenses
Advertising 337,423 502,076 Audit committee fees 490,887 299,187 Auditors remuneration 3,087,760 2,887,753 Bank charges 248,906 430,059 Bursaries 298,089 136,079 Catering 284,338 255,590 Community development and training 16,476,912 14,403,366 Consulting and professional fees 18,868,784 13,263,319 Consumables 994,140 580,996 Donations - 55,000 Electricity 1,696,692 1,188,060 Entertainment - 38,213 Provision for landfill site rehabilitation 1,161,390 1,065,593 Free Basic Services 8,261,597 7,844,904 IT expenses 671,324 468,107 Magazines, books and periodicals 5,568 34,225 Medical expenses 190,799 6,566 Motor vehicle expenses 1,933,348 2,362,823 Other expenses 11,295 - Postage and courier 103,189 73,798 Printing and stationery 1,655,078 772,259 Project maintenance costs 43,450,737 10,875,075 Subscriptions and membership fees 1,404,763 1,943,351 Telephone and fax 1,318,345 1,568,193 Training 1,042,074 1,081,922 Travel - local 6,637,780 5,301,893 Uniforms 966,340 86,534
111,597,558 67,524,941 30. Auditors' remuneration
Fees 3,087,760 2,887,753 31. Operating lease
The municipalty leases office space from the Limpopo Development Agency. The lease terms are as follows: The lease term is for a period of 3 years commencing on 1 September 2013 with an option of renewal. The rental amount from the commencement date is R45341.76 with an escalation percentage of 10% annually.
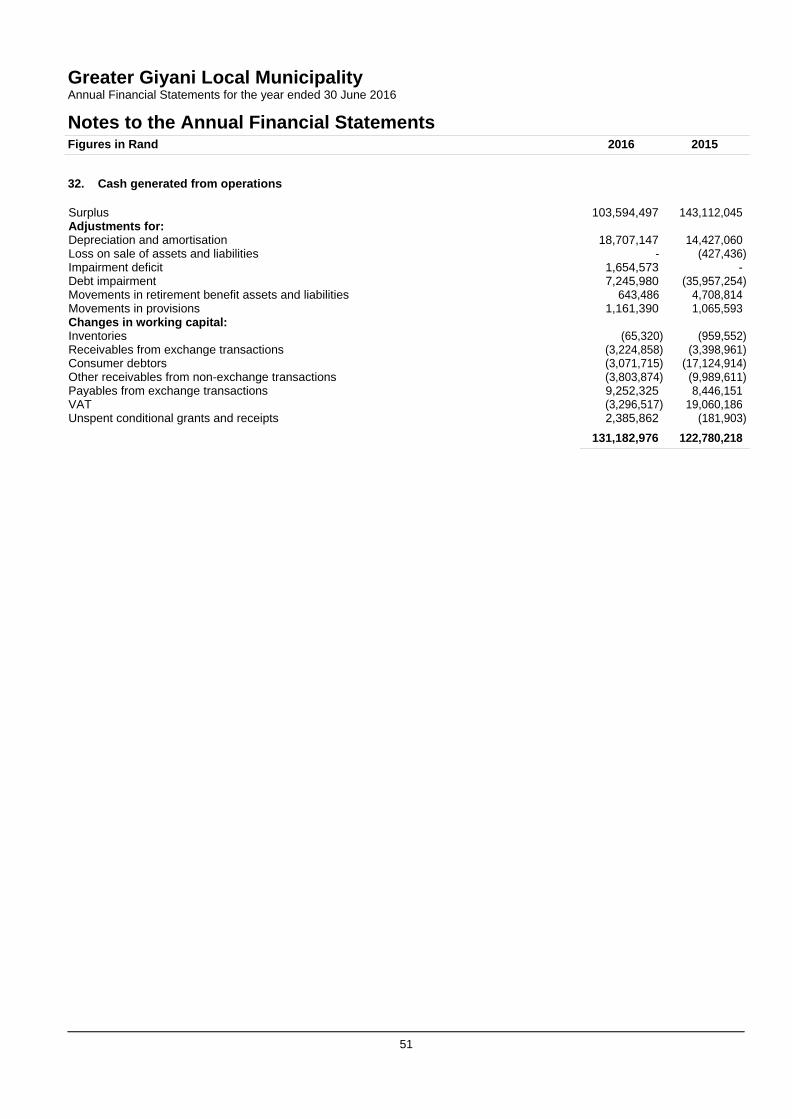
Greater Giyani Local Municipality Annual Financial Statements for the year ended 30 June 2016
Notes to the Annual Financial Statements
51
Figures in Rand 2016 2015
32. Cash generated from operations
Surplus 103,594,497 143,112,045 Adjustments for: Depreciation and amortisation
18,707,147
14,427,060
Loss on sale of assets and liabilities - (427,436) Impairment deficit 1,654,573 - Debt impairment 7,245,980 (35,957,254) Movements in retirement benefit assets and liabilities 643,486 4,708,814 Movements in provisions 1,161,390 1,065,593 Changes in working capital: Inventories
(65,320)
(959,552)
Receivables from exchange transactions (3,224,858) (3,398,961) Consumer debtors (3,071,715) (17,124,914) Other receivables from non-exchange transactions (3,803,874) (9,989,611) Payables from exchange transactions 9,252,325 8,446,151 VAT (3,296,517) 19,060,186 Unspent conditional grants and receipts 2,385,862 (181,903)
131,182,976 122,780,218
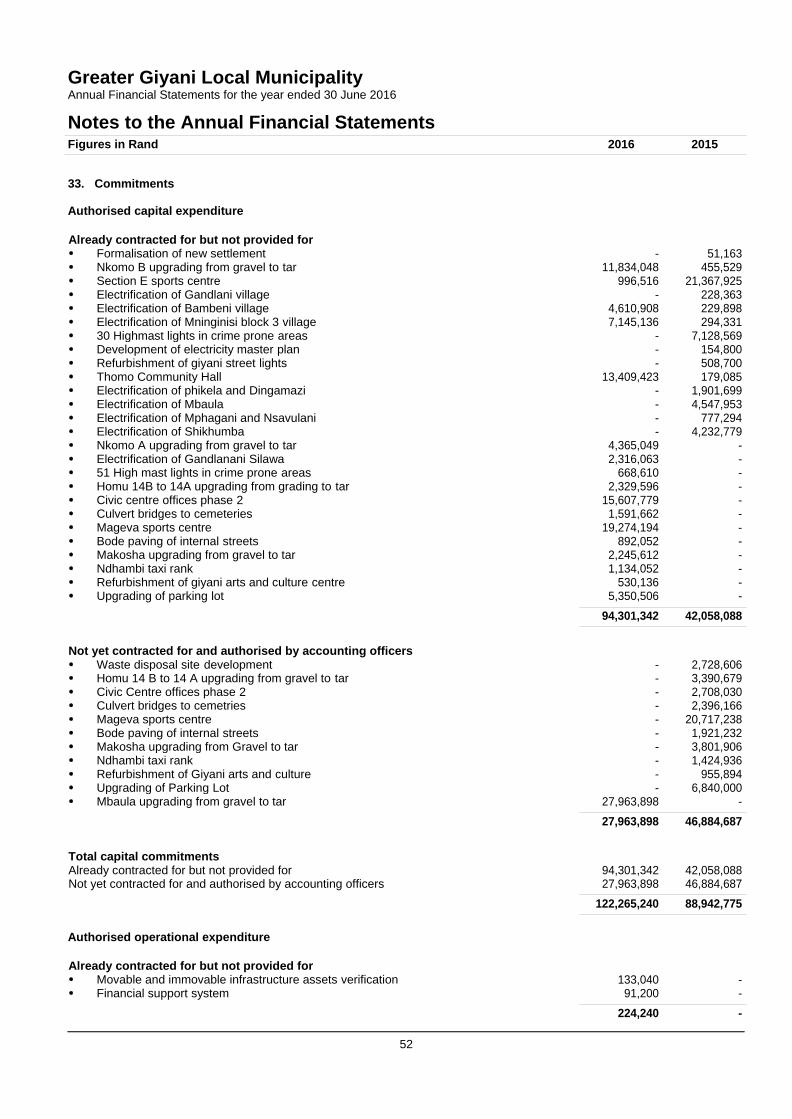
Greater Giyani Local Municipality Annual Financial Statements for the year ended 30 June 2016
Notes to the Annual Financial Statements
52
Figures in Rand 2016 2015
33. Commitments
Authorised capital expenditure
Already contracted for but not provided for Formalisation of new settlement
-
51,163
Nkomo B upgrading from gravel to tar 11,834,048 455,529 Section E sports centre 996,516 21,367,925 Electrification of Gandlani village - 228,363 Electrification of Bambeni village 4,610,908 229,898 Electrification of Mninginisi block 3 village 7,145,136 294,331 30 Highmast lights in crime prone areas - 7,128,569 Development of electricity master plan - 154,800 Refurbishment of giyani street lights - 508,700 Thomo Community Hall 13,409,423 179,085 Electrification of phikela and Dingamazi - 1,901,699 Electrification of Mbaula - 4,547,953 Electrification of Mphagani and Nsavulani - 777,294 Electrification of Shikhumba - 4,232,779 Nkomo A upgrading from gravel to tar 4,365,049 - Electrification of Gandlanani Silawa 2,316,063 - 51 High mast lights in crime prone areas 668,610 - Homu 14B to 14A upgrading from grading to tar 2,329,596 - Civic centre offices phase 2 15,607,779 - Culvert bridges to cemeteries 1,591,662 - Mageva sports centre 19,274,194 - Bode paving of internal streets 892,052 - Makosha upgrading from gravel to tar 2,245,612 - Ndhambi taxi rank 1,134,052 - Refurbishment of giyani arts and culture centre 530,136 - Upgrading of parking lot 5,350,506 -
94,301,342 42,058,088 Not yet contracted for and authorised by accounting officers Waste disposal site development
-
2,728,606 Homu 14 B to 14 A upgrading from gravel to tar - 3,390,679 Civic Centre offices phase 2 - 2,708,030 Culvert bridges to cemetries - 2,396,166 Mageva sports centre - 20,717,238 Bode paving of internal streets - 1,921,232 Makosha upgrading from Gravel to tar - 3,801,906 Ndhambi taxi rank - 1,424,936 Refurbishment of Giyani arts and culture - 955,894 Upgrading of Parking Lot - 6,840,000 Mbaula upgrading from gravel to tar 27,963,898 -
27,963,898 46,884,687 Total capital commitments Already contracted for but not provided for
94,301,342
42,058,088 Not yet contracted for and authorised by accounting officers 27,963,898 46,884,687
122,265,240 88,942,775 Authorised operational expenditure
Already contracted for but not provided for Movable and immovable infrastructure assets verification
133,040
-
Financial support system 91,200 -
224,240 -
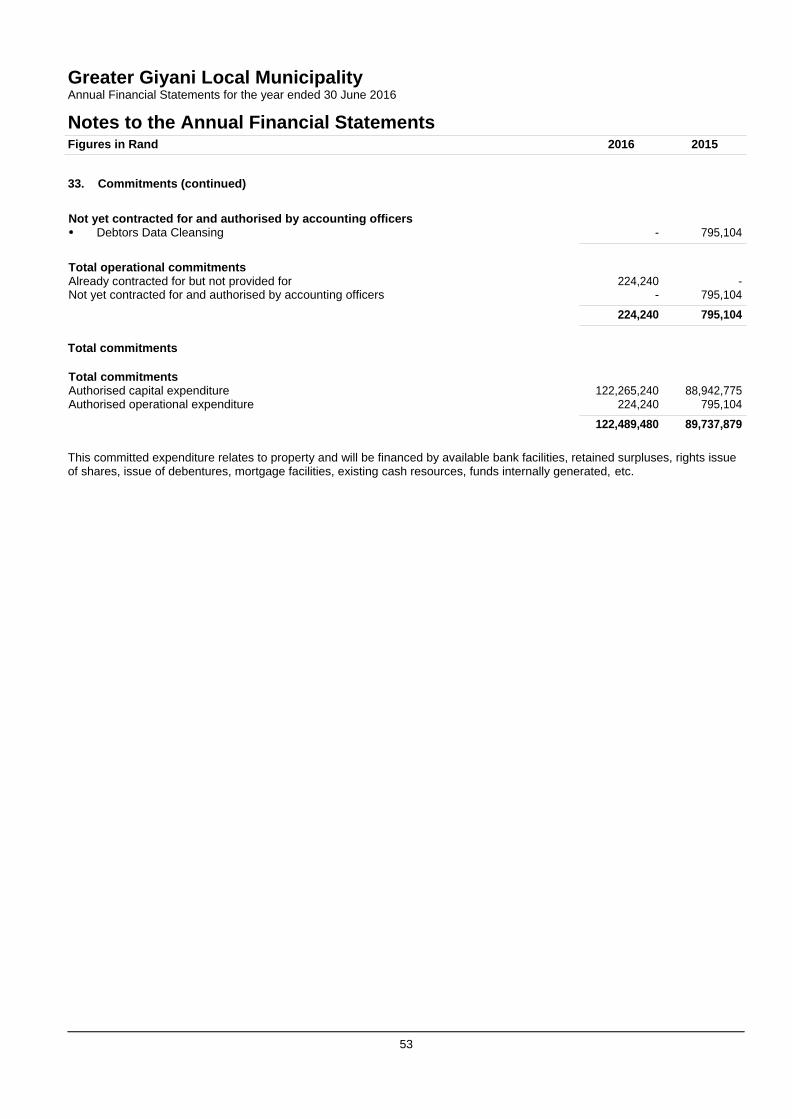
Greater Giyani Local Municipality Annual Financial Statements for the year ended 30 June 2016
Notes to the Annual Financial Statements
53
Figures in Rand 2016 2015
33. Commitments (continued)
Not yet contracted for and authorised by accounting officers Debtors Data Cleansing
-
795,104
Total operational commitments Already contracted for but not provided for
224,240
- Not yet contracted for and authorised by accounting officers - 795,104
224,240 795,104 Total commitments
Total commitments Authorised capital expenditure
122,265,240
88,942,775
Authorised operational expenditure 224,240 795,104
122,489,480 89,737,879
This committed expenditure relates to property and will be financed by available bank facilities, retained surpluses, rights issue of shares, issue of debentures, mortgage facilities, existing cash resources, funds internally generated, etc.
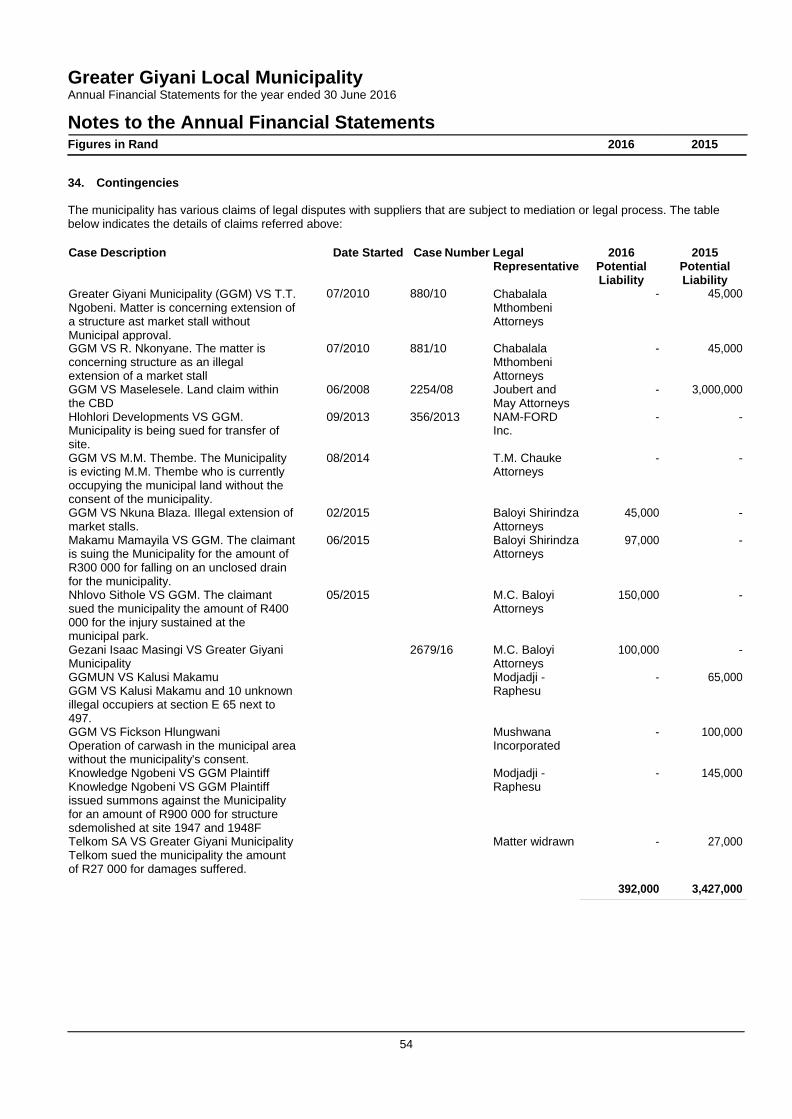
Greater Giyani Local Municipality Annual Financial Statements for the year ended 30 June 2016
Notes to the Annual Financial Statements
54
Figures in Rand 2016 2015
34. Contingencies
The municipality has various claims of legal disputes with suppliers that are subject to mediation or legal process. The table below indicates the details of claims referred above:
Case Description Date Started Case Number Legal Representative
2016 Potential Liability
2015 Potential Liability
Greater Giyani Municipality (GGM) VS T.T. Ngobeni. Matter is concerning extension of a structure ast market stall without Municipal approval.
07/2010 880/10 Chabalala Mthombeni Attorneys
- 45,000
GGM VS R. Nkonyane. The matter is 07/2010 881/10 Chabalala - 45,000 concerning structure as an illegal Mthombeni extension of a market stall Attorneys GGM VS Maselesele. Land claim within 06/2008 2254/08 Joubert and - 3,000,000 the CBD May Attorneys Hlohlori Developments VS GGM. 09/2013 356/2013 NAM-FORD - - Municipality is being sued for transfer of Inc. site. GGM VS M.M. Thembe. The Municipality 08/2014 T.M. Chauke - - is evicting M.M. Thembe who is currently Attorneys occupying the municipal land without the consent of the municipality. GGM VS Nkuna Blaza. Illegal extension of 02/2015 Baloyi Shirindza 45,000 - market stalls. Attorneys Makamu Mamayila VS GGM. The claimant 06/2015 Baloyi Shirindza 97,000 - is suing the Municipality for the amount of Attorneys R300 000 for falling on an unclosed drain for the municipality. Nhlovo Sithole VS GGM. The claimant 05/2015 M.C. Baloyi 150,000 - sued the municipality the amount of R400 Attorneys 000 for the injury sustained at the municipal park. Gezani Isaac Masingi VS Greater Giyani 2679/16 M.C. Baloyi 100,000 - Municipality Attorneys GGMUN VS Kalusi Makamu Modjadji - - 65,000 GGM VS Kalusi Makamu and 10 unknown Raphesu illegal occupiers at section E 65 next to 497. GGM VS Fickson Hlungwani Mushwana - 100,000 Operation of carwash in the municipal area Incorporated without the municipality's consent. Knowledge Ngobeni VS GGM Plaintiff Modjadji - - 145,000 Knowledge Ngobeni VS GGM Plaintiff Raphesu issued summons against the Municipality for an amount of R900 000 for structure sdemolished at site 1947 and 1948F Telkom SA VS Greater Giyani Municipality Matter widrawn - 27,000 Telkom sued the municipality the amount of R27 000 for damages suffered. 392,000 3,427,000
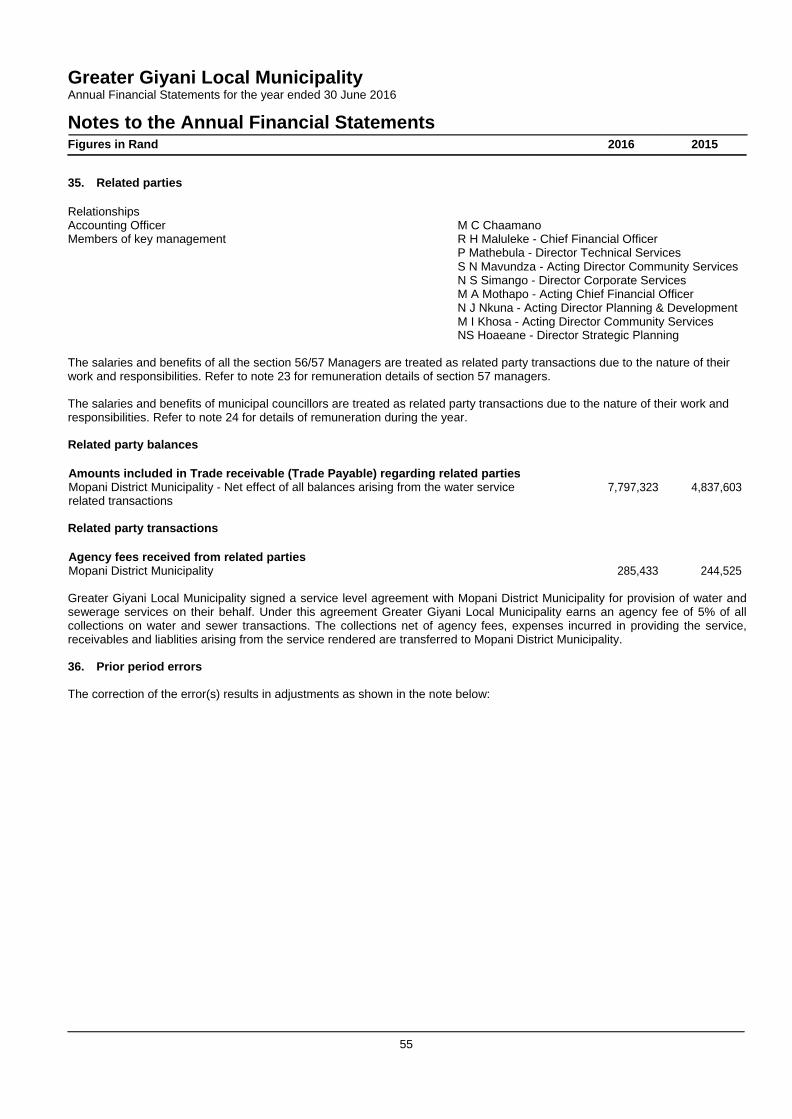
Greater Giyani Local Municipality Annual Financial Statements for the year ended 30 June 2016
Notes to the Annual Financial Statements
55
Figures in Rand 2016 2015
35. Related parties
`
Relationships Accounting Officer M C Chaamano Members of key management R H Maluleke - Chief Financial Officer
P Mathebula - Director Technical Services S N Mavundza - Acting Director Community Services N S Simango - Director Corporate Services M A Mothapo - Acting Chief Financial Officer N J Nkuna - Acting Director Planning & Development M I Khosa - Acting Director Community Services NS Hoaeane - Director Strategic Planning
The salaries and benefits of all the section 56/57 Managers are treated as related party transactions due to the nature of their work and responsibilities. Refer to note 23 for remuneration details of section 57 managers.
The salaries and benefits of municipal councillors are treated as related party transactions due to the nature of their work and responsibilities. Refer to note 24 for details of remuneration during the year.
Related party balances
Amounts included in Trade receivable (Trade Payable) regarding related parties Mopani District Municipality - Net effect of all balances arising from the water service
7,797,323
4,837,603
related transactions
Related party transactions
Agency fees received from related parties Mopani District Municipality
285,433
244,525
Greater Giyani Local Municipality signed a service level agreement with Mopani District Municipality for provision of water and sewerage services on their behalf. Under this agreement Greater Giyani Local Municipality earns an agency fee of 5% of all collections on water and sewer transactions. The collections net of agency fees, expenses incurred in providing the service, receivables and liablities arising from the service rendered are transferred to Mopani District Municipality.
36. Prior period errors
The correction of the error(s) results in adjustments as shown in the note below:
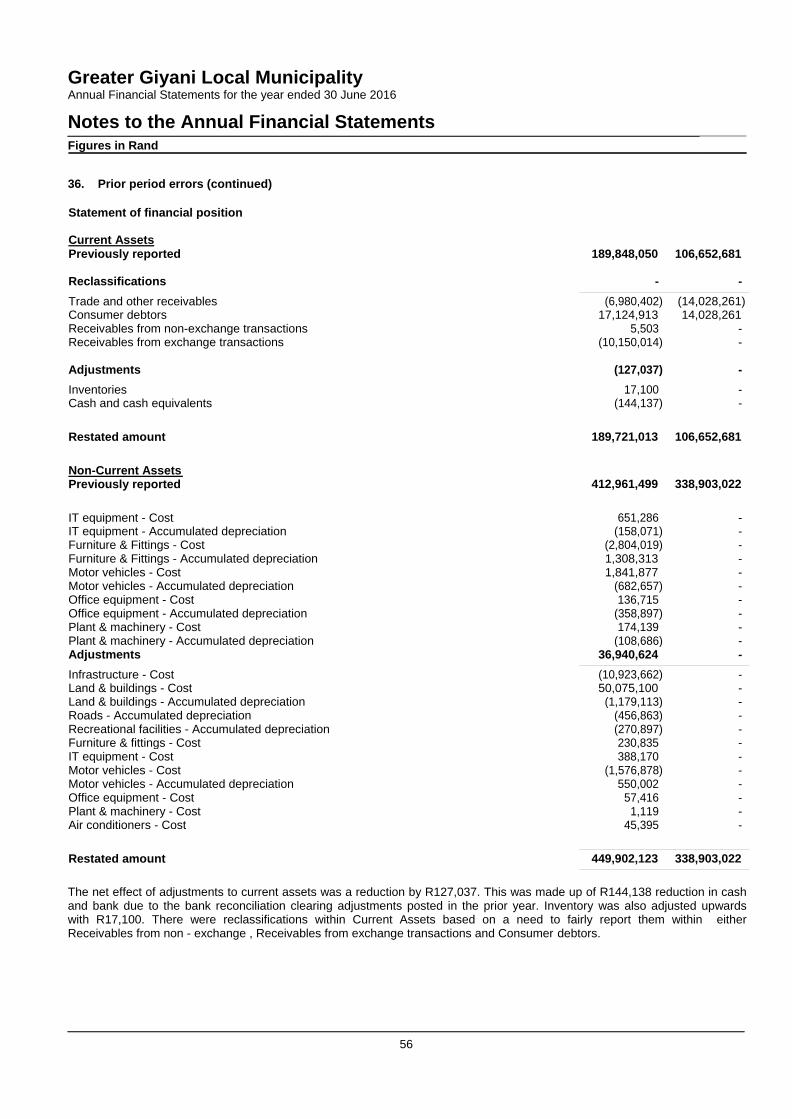
56
Greater Giyani Local Municipality Annual Financial Statements for the year ended 30 June 2016
Notes to the Annual Financial Statements Figures in Rand
36. Prior period errors (continued)
Statement of financial position
Current Assets
Previously reported 189,848,050 106,652,681
Reclassifications - - Trade and other receivables (6,980,402) (14,028,261) Consumer debtors 17,124,913 14,028,261 Receivables from non-exchange transactions 5,503 - Receivables from exchange transactions (10,150,014) -
Adjustments (127,037) - Inventories 17,100 - Cash and cash equivalents (144,137) -
Restated amount 189,721,013 106,652,681 Non-Current Assets Previously reported
412,961,499
338,903,022
IT equipment - Cost 651,286 - IT equipment - Accumulated depreciation (158,071) - Furniture & Fittings - Cost (2,804,019) - Furniture & Fittings - Accumulated depreciation 1,308,313 - Motor vehicles - Cost 1,841,877 - Motor vehicles - Accumulated depreciation (682,657) - Office equipment - Cost 136,715 - Office equipment - Accumulated depreciation (358,897) - Plant & machinery - Cost 174,139 - Plant & machinery - Accumulated depreciation (108,686) - Adjustments 36,940,624 - Infrastructure - Cost (10,923,662) - Land & buildings - Cost 50,075,100 - Land & buildings - Accumulated depreciation (1,179,113) - Roads - Accumulated depreciation (456,863) - Recreational facilities - Accumulated depreciation (270,897) - Furniture & fittings - Cost 230,835 - IT equipment - Cost 388,170 - Motor vehicles - Cost (1,576,878) - Motor vehicles - Accumulated depreciation 550,002 - Office equipment - Cost 57,416 - Plant & machinery - Cost 1,119 - Air conditioners - Cost 45,395 -
Restated amount 449,902,123 338,903,022
The net effect of adjustments to current assets was a reduction by R127,037. This was made up of R144,138 reduction in cash and bank due to the bank reconciliation clearing adjustments posted in the prior year. Inventory was also adjusted upwards with R17,100. There were reclassifications within Current Assets based on a need to fairly report them within either Receivables from non - exchange , Receivables from exchange transactions and Consumer debtors.
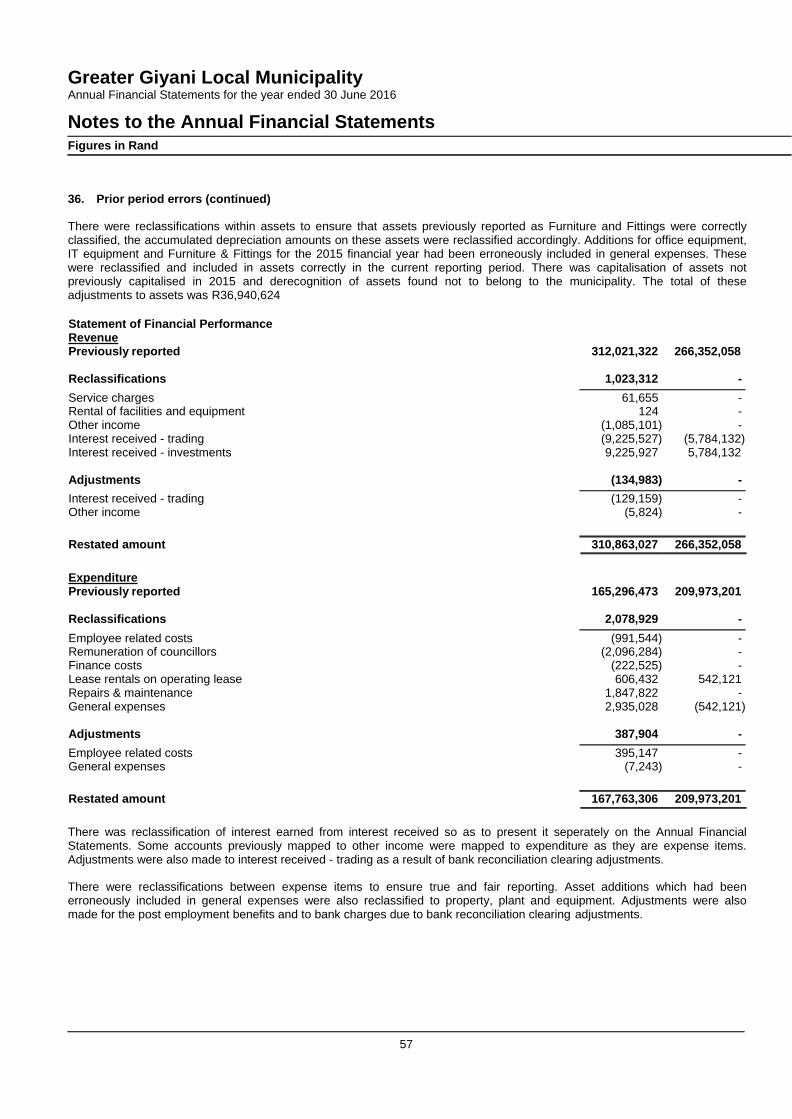
57
Greater Giyani Local Municipality Annual Financial Statements for the year ended 30 June 2016
Notes to the Annual Financial Statements Figures in Rand
36. Prior period errors (continued)
There were reclassifications within assets to ensure that assets previously reported as Furniture and Fittings were correctly classified, the accumulated depreciation amounts on these assets were reclassified accordingly. Additions for office equipment, IT equipment and Furniture & Fittings for the 2015 financial year had been erroneously included in general expenses. These were reclassified and included in assets correctly in the current reporting period. There was capitalisation of assets not previously capitalised in 2015 and derecognition of assets found not to belong to the municipality. The total of these adjustments to assets was R36,940,624
Statement of Financial Performance Revenue Previously reported 312,021,322 266,352,058
Reclassifications 1,023,312 - Service charges 61,655 - Rental of facilities and equipment 124 - Other income (1,085,101) - Interest received - trading (9,225,527) (5,784,132) Interest received - investments 9,225,927 5,784,132
Adjustments (134,983) - Interest received - trading (129,159) - Other income (5,824) -
Restated amount 310,863,027 266,352,058
Expenditure Previously reported 165,296,473 209,973,201
Reclassifications 2,078,929 - Employee related costs (991,544) - Remuneration of councillors (2,096,284) - Finance costs (222,525) - Lease rentals on operating lease 606,432 542,121 Repairs & maintenance 1,847,822 - General expenses 2,935,028 (542,121)
Adjustments 387,904 - Employee related costs 395,147 - General expenses (7,243) -
Restated amount 167,763,306 209,973,201
There was reclassification of interest earned from interest received so as to present it seperately on the Annual Financial Statements. Some accounts previously mapped to other income were mapped to expenditure as they are expense items. Adjustments were also made to interest received - trading as a result of bank reconciliation clearing adjustments.
There were reclassifications between expense items to ensure true and fair reporting. Asset additions which had been erroneously included in general expenses were also reclassified to property, plant and equipment. Adjustments were also made for the post employment benefits and to bank charges due to bank reconciliation clearing adjustments.
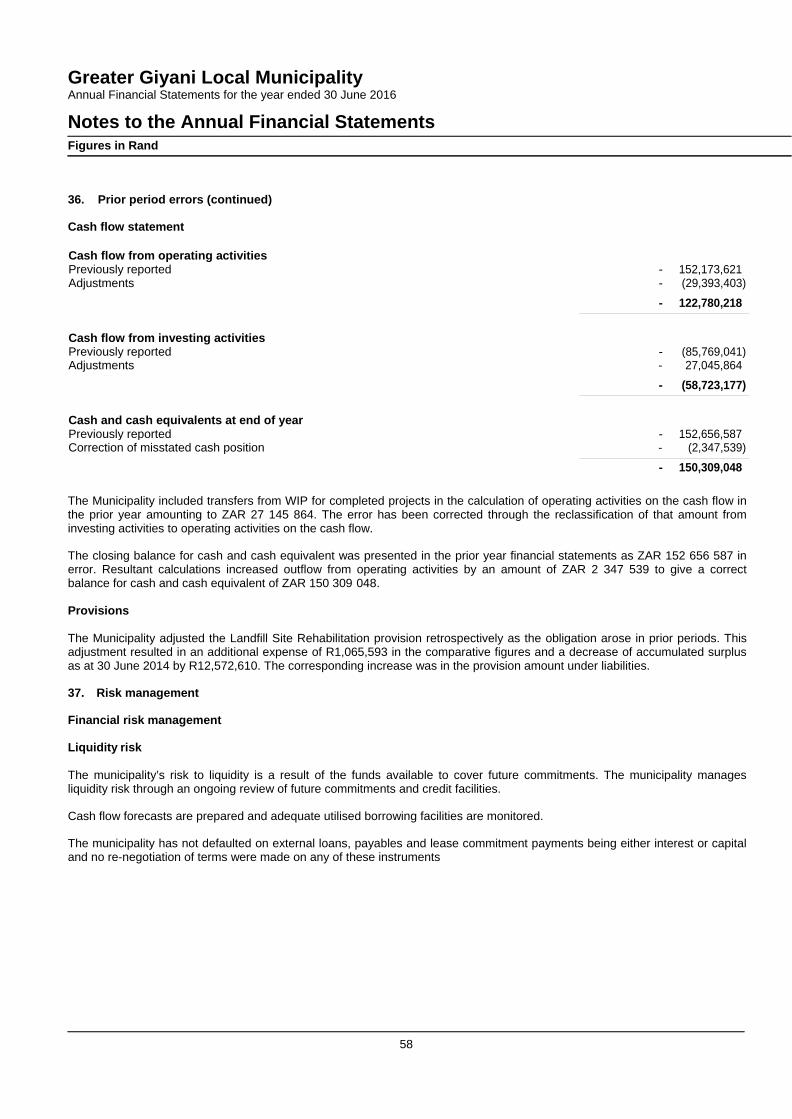
58
Greater Giyani Local Municipality Annual Financial Statements for the year ended 30 June 2016
Notes to the Annual Financial Statements Figures in Rand
36. Prior period errors (continued)
Cash flow statement
Cash flow from operating activities Previously reported
- 152,173,621
Adjustments - (29,393,403)
- 122,780,218 Cash flow from investing activities Previously reported
- (85,769,041) Adjustments - 27,045,864
- (58,723,177) Cash and cash equivalents at end of year Previously reported
- 152,656,587 Correction of misstated cash position - (2,347,539)
- 150,309,048
The Municipality included transfers from WIP for completed projects in the calculation of operating activities on the cash flow in the prior year amounting to ZAR 27 145 864. The error has been corrected through the reclassification of that amount from investing activities to operating activities on the cash flow.
The closing balance for cash and cash equivalent was presented in the prior year financial statements as ZAR 152 656 587 in error. Resultant calculations increased outflow from operating activities by an amount of ZAR 2 347 539 to give a correct balance for cash and cash equivalent of ZAR 150 309 048. Provisions The Municipality adjusted the Landfill Site Rehabilitation provision retrospectively as the obligation arose in prior periods. This adjustment resulted in an additional expense of R1,065,593 in the comparative figures and a decrease of accumulated surplus as at 30 June 2014 by R12,572,610. The corresponding increase was in the provision amount under liabilities.
37. Risk management
Financial risk management
Liquidity risk
The municipality’s risk to liquidity is a result of the funds available to cover future commitments. The municipality manages liquidity risk through an ongoing review of future commitments and credit facilities.
Cash flow forecasts are prepared and adequate utilised borrowing facilities are monitored.
The municipality has not defaulted on external loans, payables and lease commitment payments being either interest or capital and no re-negotiation of terms were made on any of these instruments
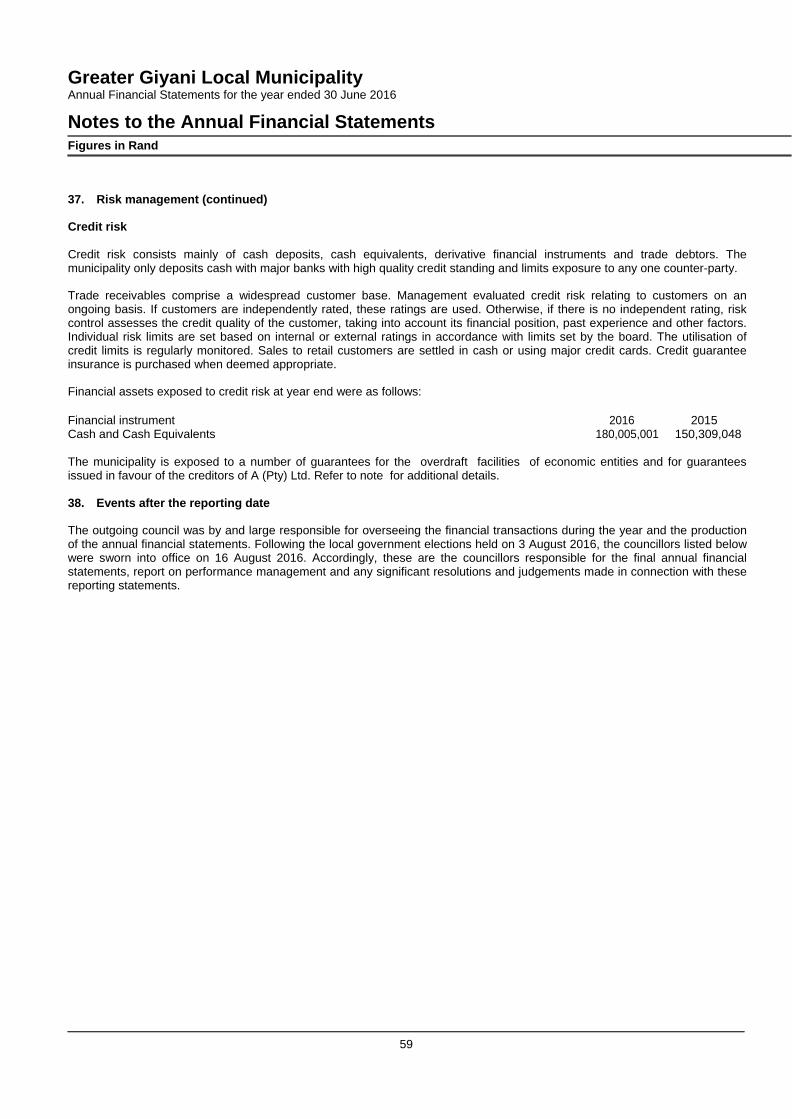
59
Greater Giyani Local Municipality Annual Financial Statements for the year ended 30 June 2016
Notes to the Annual Financial Statements Figures in Rand
37. Risk management (continued)
Credit risk
Credit risk consists mainly of cash deposits, cash equivalents, derivative financial instruments and trade debtors. The municipality only deposits cash with major banks with high quality credit standing and limits exposure to any one counter-party.
Trade receivables comprise a widespread customer base. Management evaluated credit risk relating to customers on an ongoing basis. If customers are independently rated, these ratings are used. Otherwise, if there is no independent rating, risk control assesses the credit quality of the customer, taking into account its financial position, past experience and other factors. Individual risk limits are set based on internal or external ratings in accordance with limits set by the board. The utilisation of credit limits is regularly monitored. Sales to retail customers are settled in cash or using major credit cards. Credit guarantee insurance is purchased when deemed appropriate.
Financial assets exposed to credit risk at year end were as follows:
`
The municipality is exposed to a number of guarantees for the overdraft facilities of economic entities and for guarantees issued in favour of the creditors of A (Pty) Ltd. Refer to note for additional details.
38. Events after the reporting date
The outgoing council was by and large responsible for overseeing the financial transactions during the year and the production of the annual financial statements. Following the local government elections held on 3 August 2016, the councillors listed below were sworn into office on 16 August 2016. Accordingly, these are the councillors responsible for the final annual financial statements, report on performance management and any significant resolutions and judgements made in connection with these reporting statements.
Financial instrument 2016 2015 Cash and Cash Equivalents 180,005,001 150,309,048
60
Greater Giyani Local Municipality Annual Financial Statements for the year ended 30 June 2016
Notes to the Annual Financial Statements Figures in Rand
38. Events after the reporting date (continued)
Councillor's Name Cllr Baloyi Nyiko Nyumisani
Swearing in Date
16 Aug 2016 Cllr Chauke Masenyani Thomas Cllr Chauke Mukhacani Juring Cllr Hlungwani Mabandla Patrick Cllr Khosa Jabulani Samuel Cllr Khosa Masenyani Adoph Cllr Khosa Ringeta Sally Cllr Kubayi Seva Solomon Cllr Mabasa Gezani Noel Cllr Mabulana Peter Sello Cllr Madzunye Nhlamulo Mavis Cllr Mahlawule Soyaphi Calvin Cllr Makhubela Thandy Cllr Makhubele Hlupheka Winnie Cllr Makhubele Thankyou Mbhizo Cllr Maluleke Noel Cllr Maluleke Tinyiko Rose Cllr Malungana Elia Cllr Manganye Sevha Vusi Cllr Mashale Masenyani Richard Cllr Mashele Basani Ivy Cllr Mashimbye Dzuni Calvin Cllr Mashimbye Tiyani Loyd Cllr Mathevula Mthakathi Prince Cllr Mboweni Agrey Ernest Cllr Mhlongo Mashau Calvin Cllr Mkansi Xigiya Ben Cllr Mokgobi Phillip Thomane Cllr Mokoseni Fumani Clarence Cllr Mthombeni Amukelani Florah Cllr Mthombeni Siseka George Cllr Mthombeni Tsakani Noria Cllr Ndlovu Tiyani Lawrence Cllr Ngoveni Risimati Edward Cllr Rikhotso Hlayiseka Roger Cllr Rikhotso Risimati Christopher Cllr Sekgobela Reginah Ntsako Cllr Shibambu Basani Agnes Cllr Shimange Fazi Mikateko Irene Cllr Shivuri Daison Tinyiko Cllr Siweya Cynthia Masingita
16 Aug 2016 16 Aug 2016 16 Aug 2016 16 Aug 2016 16 Aug 2016 16 Aug 2016 16 Aug 2016 16 Aug 2016 16 Aug 2016 16 Aug 2016 16 Aug 2016 16 Aug 2016 16 Aug 2016 16 Aug 2016 16 Aug 2016 16 Aug 2016 16 Aug 2016 16 Aug 2016 16 Aug 2016 16 Aug 2016 16 Aug 2016 16 Aug 2016 16 Aug 2016 16 Aug 2016 16 Aug 2016 16 Aug 2016 16 Aug 2016 16 Aug 2016 16 Aug 2016 16 Aug 2016 16 Aug 2016 16 Aug 2016 16 Aug 2016 16 Aug 2016 16 Aug 2016 16 Aug 2016 16 Aug 2016 16 Aug 2016 16 Aug 2016 16 Aug 2016
39. Unauthorised expenditure
Unauthorised expenditure 13,137,141 - 40. Fruitless and wasteful expenditure
Fruitless and wasteful expenditure 7,574 73,370
The amount for fruitless and wasteful expenditure disclosed is composed of interest and penalties for late payment on Eskom, Telkom, SARS, Auditor General and a contractor for the construction of the Homu Sports Centre.
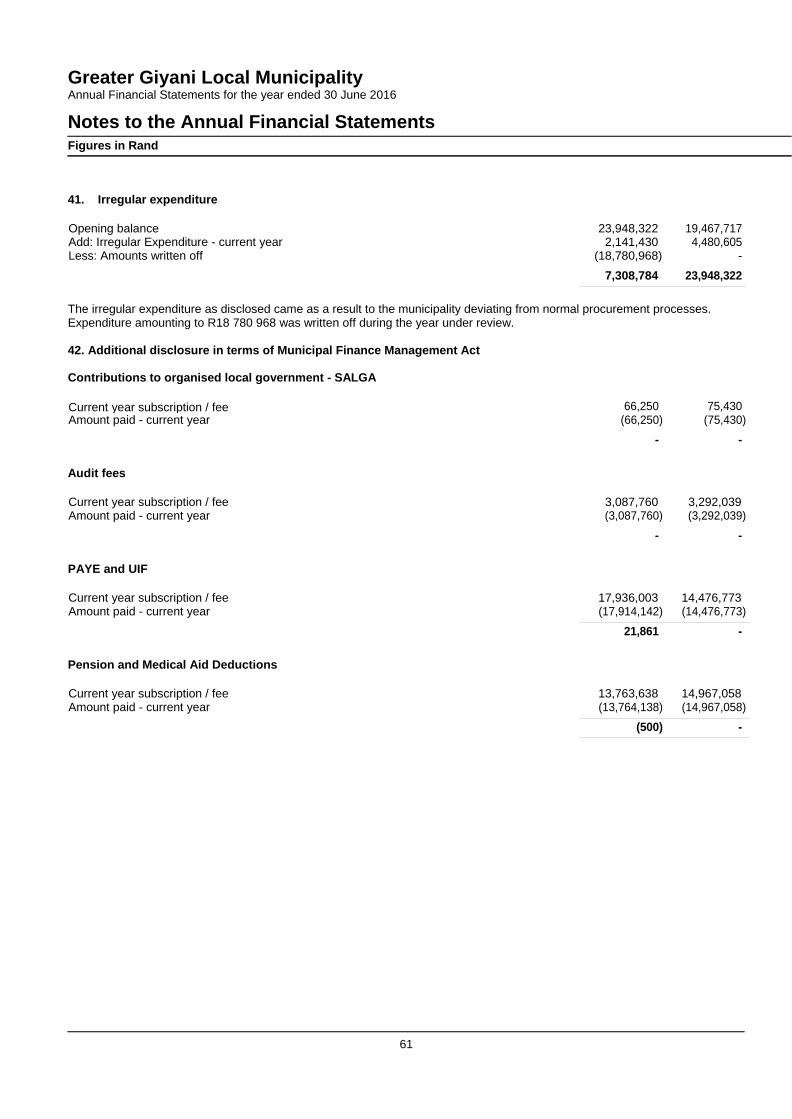
61
Greater Giyani Local Municipality Annual Financial Statements for the year ended 30 June 2016
Notes to the Annual Financial Statements Figures in Rand
41. Irregular expenditure
Opening balance 23,948,322 19,467,717 Add: Irregular Expenditure - current year 2,141,430 4,480,605 Less: Amounts written off (18,780,968) -
7,308,784 23,948,322
The irregular expenditure as disclosed came as a result to the municipality deviating from normal procurement processes. Expenditure amounting to R18 780 968 was written off during the year under review.
42. Additional disclosure in terms of Municipal Finance Management Act
Contributions to organised local government - SALGA
Current year subscription / fee
66,250
75,430 Amount paid - current year (66,250) (75,430)
- - Audit fees
Current year subscription / fee 3,087,760 3,292,039 Amount paid - current year (3,087,760) (3,292,039)
- - PAYE and UIF
Current year subscription / fee 17,936,003 14,476,773 Amount paid - current year (17,914,142) (14,476,773)
21,861 - Pension and Medical Aid Deductions
Current year subscription / fee 13,763,638 14,967,058 Amount paid - current year (13,764,138) (14,967,058)
(500) -
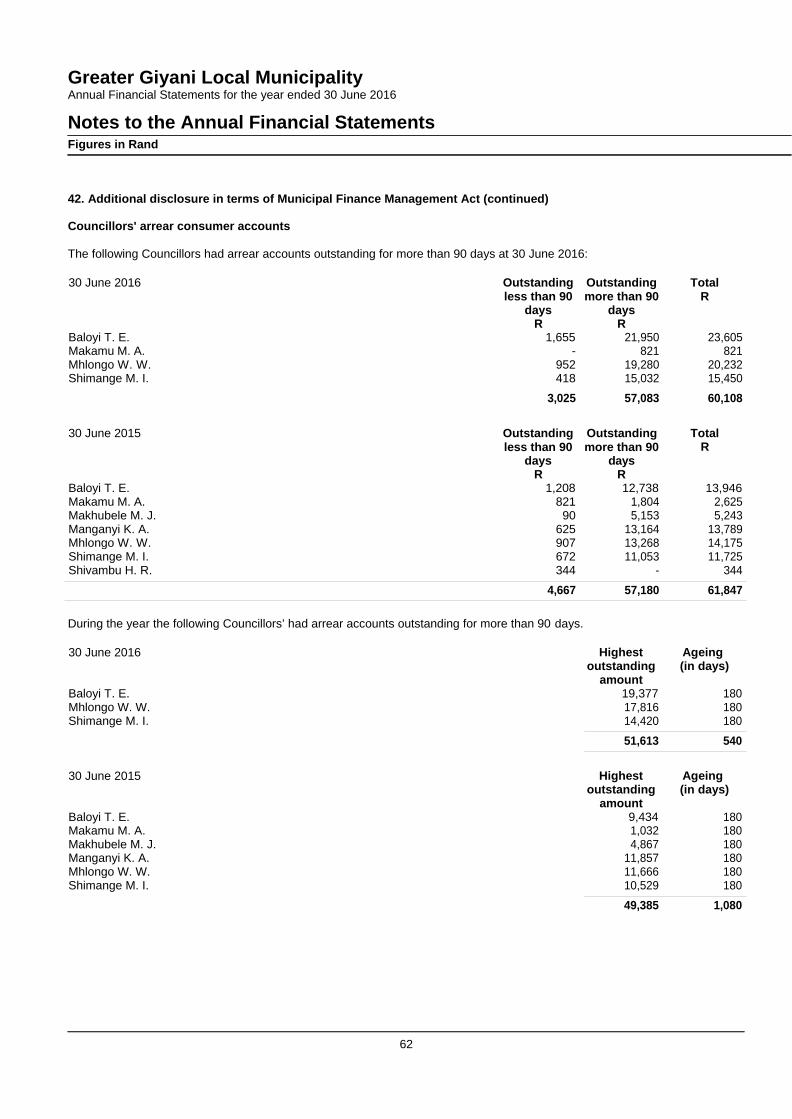
62
Greater Giyani Local Municipality Annual Financial Statements for the year ended 30 June 2016
Notes to the Annual Financial Statements
Figures in Rand
42. Additional disclosure in terms of Municipal Finance Management Act (continued)
Councillors' arrear consumer accounts
The following Councillors had arrear accounts outstanding for more than 90 days at 30 June 2016:
30 June 2016 Outstanding less than 90
days R
Outstanding more than 90
days R
Total R
Baloyi T. E. 1,655 21,950 23,605 Makamu M. A. - 821 821 Mhlongo W. W. 952 19,280 20,232 Shimange M. I. 418 15,032 15,450
3,025 57,083 60,108 30 June 2015 Outstanding
Outstanding
Total
less than 90 days
R Baloyi T. E. 1,208
more than 90 days
R 12,738
R
13,946 Makamu M. A. 821 1,804 2,625 Makhubele M. J. 90 5,153 5,243 Manganyi K. A. 625 13,164 13,789 Mhlongo W. W. 907 13,268 14,175 Shimange M. I. 672 11,053 11,725 Shivambu H. R. 344 - 344
4,667 57,180 61,847 During the year the following Councillors’ had arrear accounts outstanding for more than 90 days.
30 June 2016 Baloyi T. E.
Highest outstanding
amount 19,377
Ageing (in days)
180
Mhlongo W. W. 17,816 180 Shimange M. I. 14,420 180
51,613 540 30 June 2015
Baloyi T. E.
Highest
outstanding amount
9,434
Ageing (in days)
180
Makamu M. A. 1,032 180 Makhubele M. J. 4,867 180 Manganyi K. A. 11,857 180 Mhlongo W. W. 11,666 180 Shimange M. I. 10,529 180
49,385 1,080


