Embed Size (px)
Citation preview
Methodology Note Greenhouse Gas Emissions of India
Subnational Estimates 2005 to 2015 series
September 2019
Industry Sector
Sector Lead
Authors Vaibhav Gupta Tirtha Biswas Deepa Janakiraman Karthik Ganesan
Usage Policy Any re-production or re-distribution of the material(s) and information displayed and published on the GHG Platform India and other digital/print mediums shall be accompanied by appropriate citation and due acknowledgment to the Council on Energy, Environment and Water (CEEW) and the GHG Platform India for such material(s) and information. You must give appropriate credit, provide a link, and indicate if changes were made. You may do so in any reasonable manner, but not in any way that suggests the GHG Platform India endorses you or your use. Data sheets may be revised or updated from time to time. The latest version of each data sheet will be posted on the website. To keep abreast of these changes, please email us at [email protected] so that we may inform you when data sheets have been updated.
Citation Gupta, V., Biswas, T., Janakiraman, D., Ganesan, K., (2019). Greenhouse Gases Emissions of India (subnational estimates): Manufacturing Sector (2005-2015 series) dated September 25, 2019, Retrieved from: http://ghgplatform-india.org/data-and-emissions/industry.html In instances where economywide estimates have been used from the GHG Platform India website, the recommended citation is “GHG platform India 2005-2015 Sub-National Estimates: 2005-2015 Series”
Disclaimer The data used for arriving at the results of this study is from published, secondary sources, or wholly or in part from official sources that have been duly acknowledged. The veracity of the data has been corroborated to the maximum extent possible. However, GHG Platform India shall not be held liable and responsible to establish the veracity of or corroborate such content or data and shall not be responsible or liable for any consequences that arise from and/or any harm or loss caused by way of placing reliance on the material(s) and information displayed and published on the website or by further use and analysis of the results of this study. During peer review, inquiries and analytical procedures were followed to ascertain whether any or no material modifications to the findings are necessary and whether the methods followed are in conformity with generally accepted guidance and GHG accounting principles. The findings and conclusions in this methodology note are those of the author(s) and do not necessarily represent the views of the peer reviewers or WRI India.
Version information / Revision history
Version Date Brief description on changes from previous version
1.0 25 September 2019
This methodology note includes an estimation and analysis of India’s annual state-level GHG emissions from the Manufacturing Industries in India: 2005 to 2015, prepared by CEEW under the GHG Platform India initiative (www.ghgplatform-india.org). This document is undergoing a peer review process, however, any changes that may be made further will not have an impact on the figures and estimates. Once the review process is completed, the final document will be uploaded and the same shall be updated in this section.
Foreword On December 2015, the international community took a significant step to address the global challenge of climate change by endorsing the Paris Agreement at the 21st session of the Conference of Parties (COP) to the United Nations Framework Convention on Climate Change. The milestone Paris Agreement will serve as a foundation for concerted international action to address the threat posed by climate change. It is now more than evident that climate change is not the responsibility of national governments only. It impacts every aspect of society, and therefore, and thus comes into focus the role of non-state actors. Non-state actors like civil society organizations and research organizations can inform and help national governments devise robust climate actions and strategies. The first step in this is to generate greenhouse gas (GHG) emission estimates of all relevant economic sectors from recent years. To generate these estimates a few research organizations came together to form the GHG Platform - India. It is a civil society initiative providing independent estimation and analysis of India’s GHG emissions. The platform’s intention to assist the national government by helping address existing data gaps and data accessibility issues that extend beyond the scope of national inventories, and increasing the volume of analytics and policy dialogue on India’s GHG emission sources, profile, and related policies. The platform hosted GHG estimates for all key economic sectors for the period of 2005 – 2013 accounting for carbon dioxide, methane and nitrous oxide emissions at the national and subnational. In the present edition, the time series has been extended and the methodology note now presents GHG estimates for the period 2005 – 2015/16 across all key economic sectors. The note also highlights the trend in GHG emissions across the sectors and transparently documents all the assumptions, activity data and emission factors that were used to arrive at the estimates. The GHG estimates presented in the note follow 2006 Intergovernmental Panel on Climate Change (IPCC) guidelines for national GHG inventories and associated good practice guidance. Further, the note has been through a rigorous peer review and independent technical review process to ensure accuracy, transparency, consistency, completeness and relevance. On behalf of the platform, we hope that the note will be useful to all relevant stakeholders.
Credits
Led and coordinated by Vaibhav Gupta Tirtha Biswas Deepa Janakiraman Karthik Ganesan
Peer reviewer The authors would like to express their sincere gratitude to Mr. Subrata Chakrabarty and Mr. Chirag Gajjar from World Resources Institute India (WRII) for their valuable contribution towards comprehensive review of the methodology note.
Funder Special thanks to Shakti Sustainable Energy Foundation (SSEF) for providing financial support towards this endeavour.
Editing & design Designed and formatted by Priya Kalia – Communications, Vasudha Foundation. Design reviewed by Communications Team (All partner Organizations), GHG Platform India Cover Image Photo by rawpixel.com from Pexels
Contributors Manufacturing sector GHG emissions Vaibhav Gupta (CEEW) Tirtha Biswas (CEEW) Deepa Janakiraman (CEEW) Karthik Ganesan (CEEW) Compilation of report Samiksha Dhingra (Vasudha Foundation) Deepshikha Singh (Vasudha Foundation) Reviewers Chirag Gajjar (WRI India) Subrata Chakrabarty (WRI India) Editorial work Priya (Vasudha Foundation)
Acknowledgements At the outset, Council on Energy Environment and Water (CEEW) would like to thank the GHG Platform India for recognizing the need for such studies – especially for an informed debate on climate change concerns. The study would not have been possible without generous grant support from the Shakti Sustainable Energy Foundation. We would like to acknowledge the constant feedback and critical inputs received from the partner institutes at the GHG Platform India, during all the review meetings hosted by the Secretariat, Vasudha Foundation. We thank the Ministry of Statistics and Programme Implementation (MoSPI) for promptly responding to our feedback and queries on their Annual Survey of India (ASI) statistics, which is a cornerstone of our estimation methodology. We would also want to thank the Indian Bureau of Mines (IBM) for providing us with relevant information. CEEW would like to recognize the cooperation of several individuals, organizations, and government departments in providing useful insights and information that, helped us in arriving at meaningful estimates. We deeply appreciate the time they have spent to share their knowledge, experience, and perspectives with the research team. Last, but not the least, we express our appreciation to WRI India for a comprehensive review of this study at par with standard IPCC guidelines.
Contents Executive summary .................................................................................................................................................... 6
Key Highlights ......................................................................................................................................................... 6
ES 1. Background information of GHG emission estimates ............................................................................ 6
ES 2. Summary of GHG sources and sinks ....................................................................................................... 7
ES 3. Summary of GHG trend .............................................................................................................................. 8
1. Introduction and background .......................................................................................................................... 10
1.1 Context ................................................................................................................................................. 10
1.2 GHG coverage ..................................................................................................................................... 10
1.3 Key economic sectors covered ......................................................................................................... 11
1.4 Boundary of GHG estimates ............................................................................................................. 11
1.5 Reporting period .................................................................................................................................. 11
1.6 Outline of GHG estimates .................................................................................................................. 11
1.7 Institutional information ...................................................................................................................... 12
1.8 Data collection process and Storage ............................................................................................... 12
1.9 Quality control (QC) and quality assurance (QA) ........................................................................... 13
1.10 General assessment of completeness ............................................................................................. 14
2. Trends in GHG emissions ............................................................................................................................... 15
2.1 Trend in aggregated GHG emissions (energy use and IPPU) ..................................................... 15
2.2 Trend in GHG emissions by type of GHG ....................................................................................... 16
2.3 Key drivers of the emission trends in various sectors ................................................................... 17
3. Industrial energy-use and IPPU ..................................................................................................................... 18
3.1 Overview of the sector ........................................................................................................................ 18
3.2 Analysis of sectoral emissions .......................................................................................................... 19
3.3 Sectoral quality control (QC) and quality assurance (QA) ............................................................ 23
3.4 Key source category [1A1b, 1A1c, 2A: energy-use emissions] ................................................... 24
3.4.1 Category description ........................................................................................................................... 24
3.4.2 Methodology ........................................................................................................................................ 25
Methodology .......................................................................................................................................................... 28
Proxies, assumptions and correction measures .............................................................................................. 29
3.4.3 Recalculation ....................................................................................................................................... 31
3.5 Key source category [2A, 2B, 2C, 2D: Industrial Process and Product Use emissions] .......... 32
3.5.1 Category description ........................................................................................................................... 32
3.5.2 Methodology ........................................................................................................................................ 35
Methodology .......................................................................................................................................................... 37
3.5.3 Recalculation ....................................................................................................................................... 40
3.6 Uncertainty ........................................................................................................................................... 40
3.7 Recommended improvements .......................................................................................................... 42
4. Comparison with national inventories ........................................................................................................... 44
References ................................................................................................................................................................. 46
List of Abbreviations ................................................................................................................................................. 49
List of Tables ............................................................................................................................................................. 50
List of Figures ............................................................................................................................................................ 51
Annexures .................................................................................................................................................................. 52
Executive summary Key Highlights ▪ The manufacturing sector (energy-use and IPPU) emissions grew at a CAGR of 6.4%
between 2005 and 2015. In absolute terms, manufacturing emissions rose from 341 million tonnes (MT) of carbon dioxide equivalent (CO2e) in 2005 to 635 MTCO2e in 2015. The emissions from energy use constituted ~ 70% of total emissions during the period.
▪ CO2 is the major contributor to manufacturing emissions (energy-use and IPPU), representing a share of nearly 98%. The other greenhouse gases are (CH4 and N2O).
▪ Over the same period, the manufacturing sector’s Gross Value Added at basic prices (at 2011-12 constant prices) grew at a CAGR of 8% (MOSPI 2018), thus indicating an emissions intensity reduction of 14% when compared to 2005 levels (refer to Annexure 1).
▪ Iron and steel, non-metallic minerals, petroleum refining and non-ferrous metal sectors together represent a share of 80% in total energy use emissions for 2015. Odisha, Gujarat, Chhattisgarh, Karnataka and Jharkhand were among top five emitters representing more than 50% of the fuel derived emissions in 2015. Coal and lignite continue to drive 75% to 80% of the overall energy-use emissions.
▪ IPPU emissions increased from 101 MTCO2e to 175 MTCO2e at a CAGR of about 5.6% between 2005 and 2015. Cement, ammonia and iron & steel production together contributed to more than 80% of process emissions in 2015. Gujarat, Rajasthan, Andhra, Uttar Pradesh and Maharashtra were among the leading emitters at the sub-national level in 2015. Cement production alone represents 60% of the total IPPU emissions throughout the time series.
ES 1. Background information of GHG emission estimates
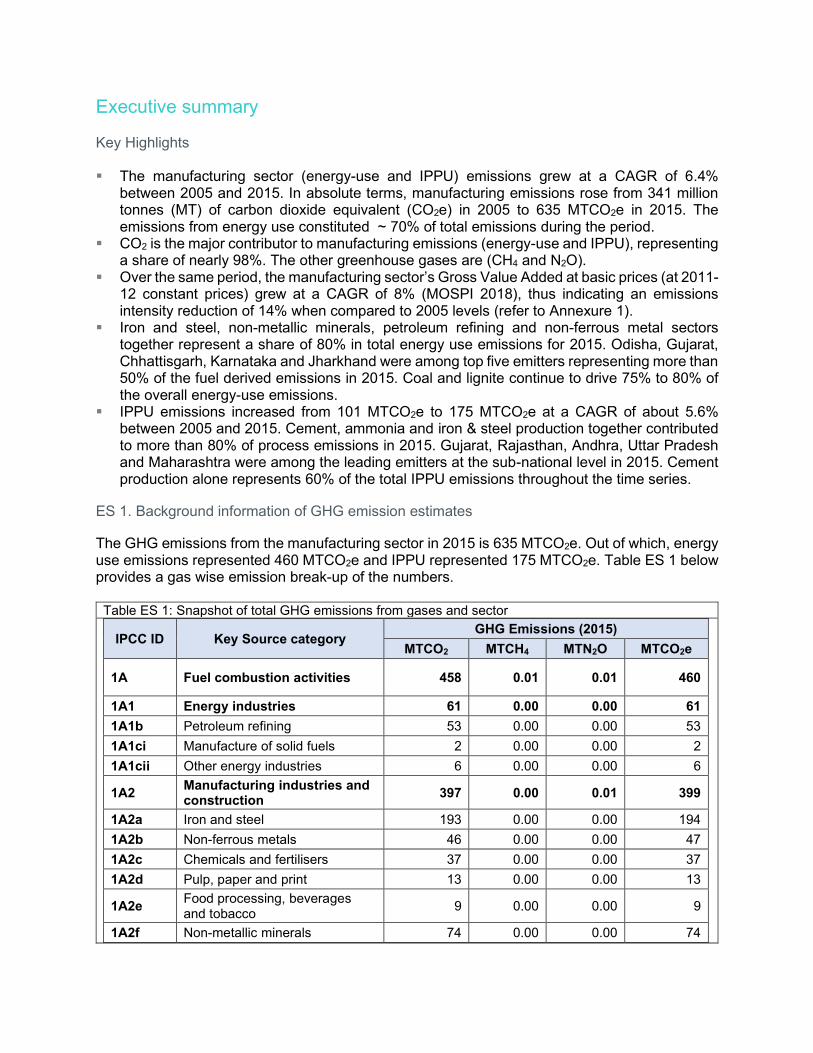
The GHG emissions from the manufacturing sector in 2015 is 635 MTCO2e. Out of which, energy use emissions represented 460 MTCO2e and IPPU represented 175 MTCO2e. Table ES 1 below provides a gas wise emission break-up of the numbers.
Table ES 1: Snapshot of total GHG emissions from gases and sector
IPCC ID Key Source category GHG Emissions (2015)
MTCO2 MTCH4 MTN2O MTCO2e
1A Fuel combustion activities 458 0.01 0.01 460
1A1 Energy industries 61 0.00 0.00 61
1A1b Petroleum refining 53 0.00 0.00 53
1A1ci Manufacture of solid fuels 2 0.00 0.00 2
1A1cii Other energy industries 6 0.00 0.00 6
1A2 Manufacturing industries and construction
397 0.00 0.01 399
1A2a Iron and steel 193 0.00 0.00 194
1A2b Non-ferrous metals 46 0.00 0.00 47
1A2c Chemicals and fertilisers 37 0.00 0.00 37
1A2d Pulp, paper and print 13 0.00 0.00 13
1A2e Food processing, beverages and tobacco
9 0.00 0.00 9
1A2f Non-metallic minerals 74 0.00 0.00 74
1A2g Transport equipment 2 0.00 0.00 2
1A2h Machinery 3 0.00 0.00 3
1A2i Mining and quarrying 0 0.00 0.00 0
1A2j Wood and wood products 0 0.00 0.00 0
1A2k Construction 0 0.00 0.00 0
1A2l Textile and leather 16 0.00 0.00 17
1A2m Non-specified industry 3 0.00 0.00 3
2 IPPU 167 0.38 0.00 175
2A Mineral industry 116 0.00 0.00 116
2B Chemical industry 33 0.38 0.00 41
2C Metal industry 12 0.00 0.00 12
2D Non-energy products from fuels and solvent use
6 0.00 0.00 6
Source: Authors’ analysis
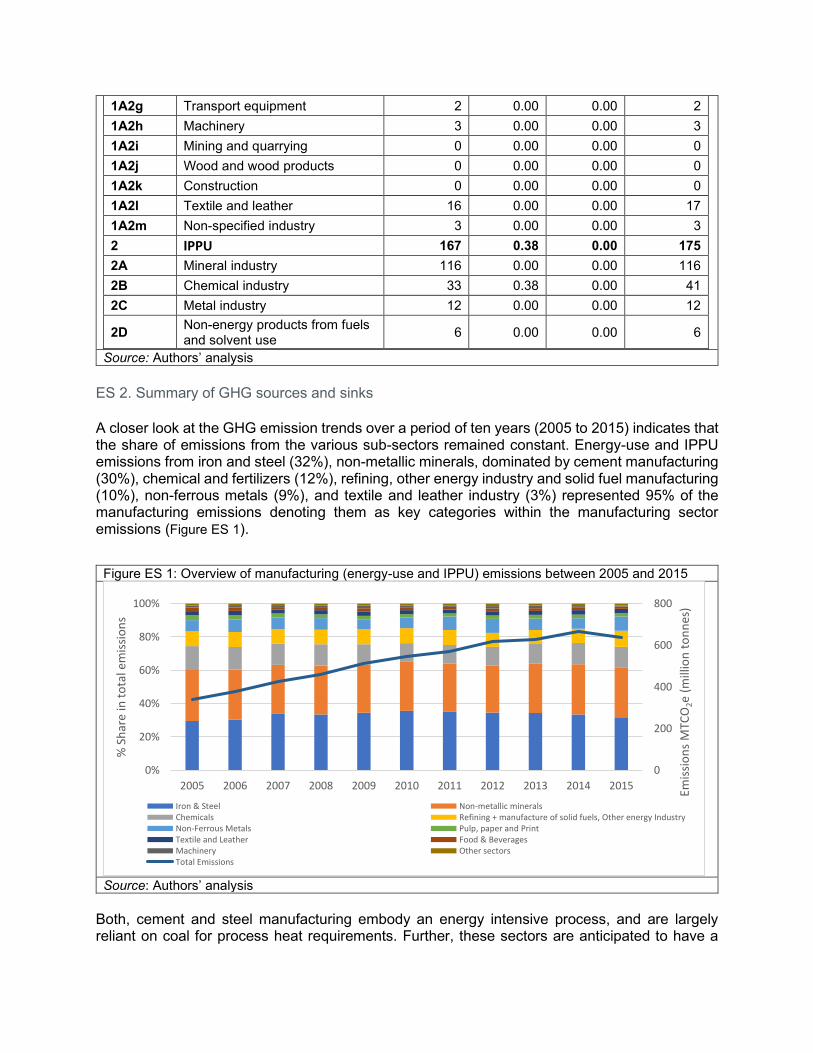
ES 2. Summary of GHG sources and sinks
A closer look at the GHG emission trends over a period of ten years (2005 to 2015) indicates that the share of emissions from the various sub-sectors remained constant. Energy-use and IPPU emissions from iron and steel (32%), non-metallic minerals, dominated by cement manufacturing (30%), chemical and fertilizers (12%), refining, other energy industry and solid fuel manufacturing (10%), non-ferrous metals (9%), and textile and leather industry (3%) represented 95% of the manufacturing emissions denoting them as key categories within the manufacturing sector emissions (Figure ES 1).
Figure ES 1: Overview of manufacturing (energy-use and IPPU) emissions between 2005 and 2015
Source: Authors’ analysis
Both, cement and steel manufacturing embody an energy intensive process, and are largely reliant on coal for process heat requirements. Further, these sectors are anticipated to have a
0
200
400
600
800
0%
20%
40%
60%
80%
100%
2005 2006 2007 2008 2009 2010 2011 2012 2013 2014 2015
Emis
sio
ns
MTC
O2e
(m
illio
n t
on
nes
)
% S
har
e in
to
tal e
mis
sio
ns
Iron & Steel Non-metallic mineralsChemicals Refining + manufacture of solid fuels, Other energy IndustryNon-Ferrous Metals Pulp, paper and PrintTextile and Leather Food & BeveragesMachinery Other sectorsTotal Emissions
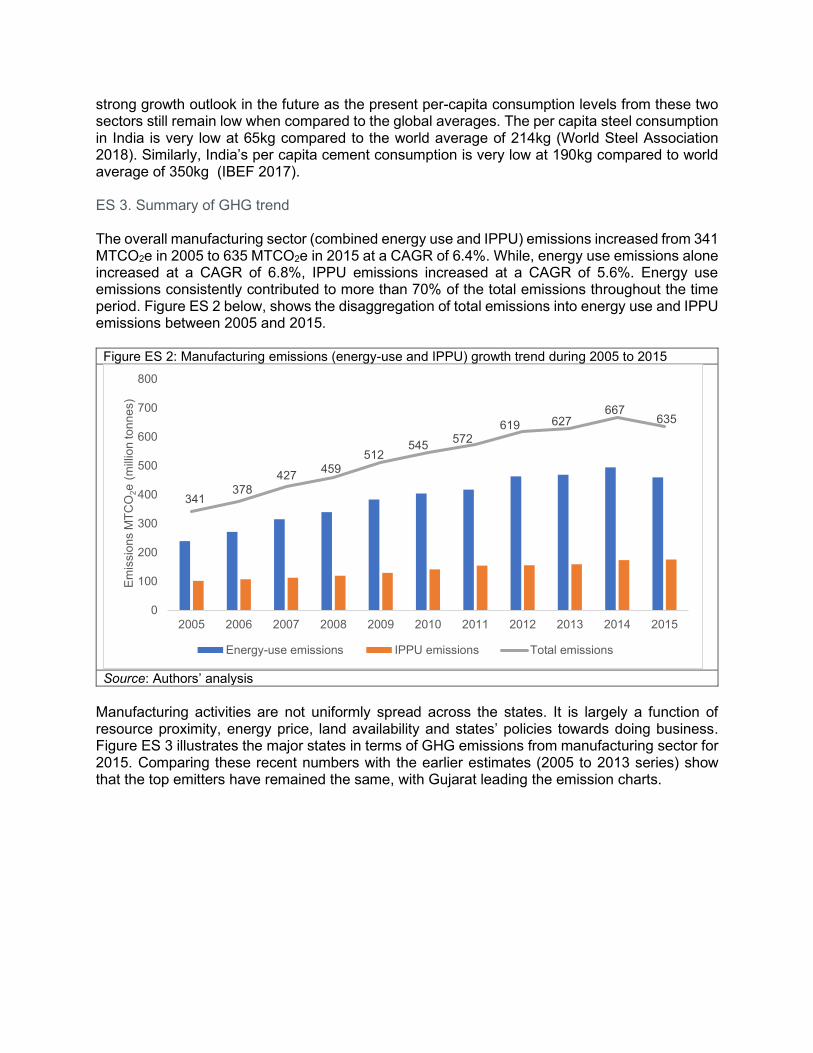
strong growth outlook in the future as the present per-capita consumption levels from these two sectors still remain low when compared to the global averages. The per capita steel consumption in India is very low at 65kg compared to the world average of 214kg (World Steel Association 2018). Similarly, India’s per capita cement consumption is very low at 190kg compared to world average of 350kg (IBEF 2017). ES 3. Summary of GHG trend The overall manufacturing sector (combined energy use and IPPU) emissions increased from 341 MTCO2e in 2005 to 635 MTCO2e in 2015 at a CAGR of 6.4%. While, energy use emissions alone increased at a CAGR of 6.8%, IPPU emissions increased at a CAGR of 5.6%. Energy use emissions consistently contributed to more than 70% of the total emissions throughout the time period. Figure ES 2 below, shows the disaggregation of total emissions into energy use and IPPU emissions between 2005 and 2015.
Figure ES 2: Manufacturing emissions (energy-use and IPPU) growth trend during 2005 to 2015
Source: Authors’ analysis
Manufacturing activities are not uniformly spread across the states. It is largely a function of resource proximity, energy price, land availability and states’ policies towards doing business. Figure ES 3 illustrates the major states in terms of GHG emissions from manufacturing sector for 2015. Comparing these recent numbers with the earlier estimates (2005 to 2013 series) show that the top emitters have remained the same, with Gujarat leading the emission charts.
341378
427459
512545
572619 627
667635
0
100
200
300
400
500
600
700
800
2005 2006 2007 2008 2009 2010 2011 2012 2013 2014 2015
Em
issio
ns M
TC
O2e
(m
illio
n to
nn
es)
Energy-use emissions IPPU emissions Total emissions
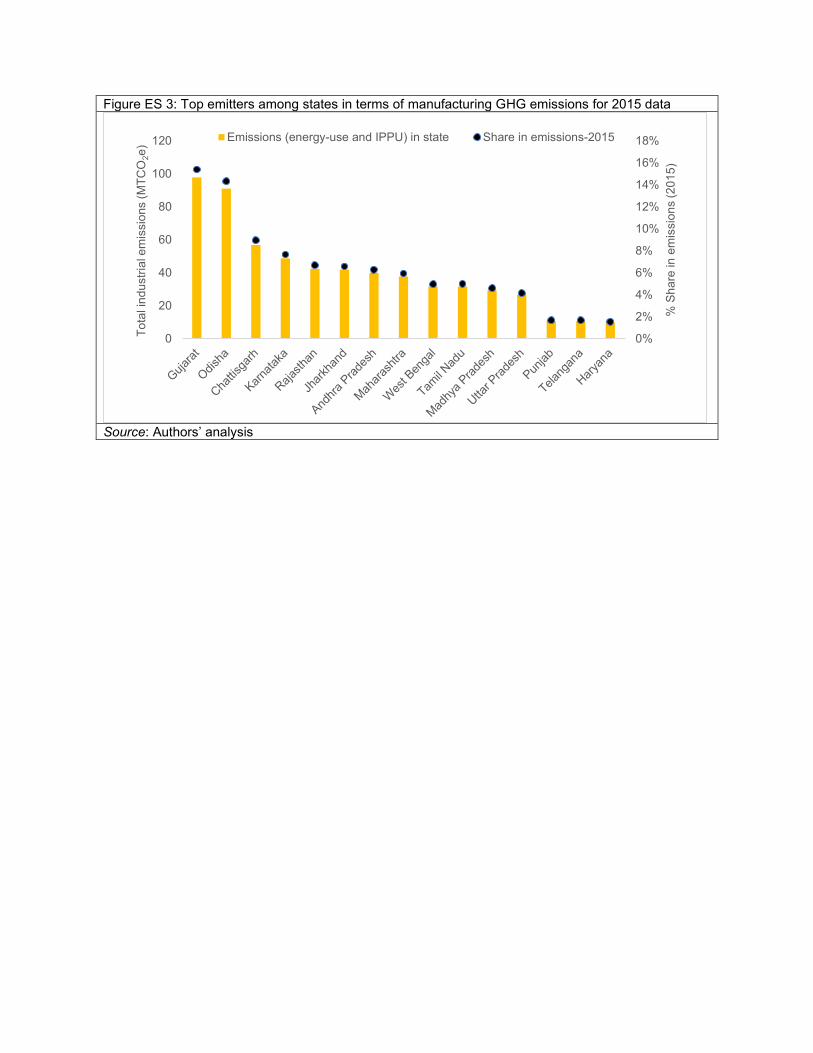
Figure ES 3: Top emitters among states in terms of manufacturing GHG emissions for 2015 data
Source: Authors’ analysis
0%
2%
4%
6%
8%
10%
12%
14%
16%
18%
0
20
40
60
80
100
120
% S
ha
re in
em
issio
ns (
20
15
)
To
tal in
du
str
ial e
mis
sio
ns (
MT
CO
2e
)Emissions (energy-use and IPPU) in state Share in emissions-2015
1. Introduction and background
1.1 Context
The objective of this methodology note – in continuation to our previous estimates (2005 to 2013 series)1 – is to provide an updated and improved analysis of India’s GHG emissions arising out of manufacturing sector. This study contributes to the broader mission of the GHG Platform India, a civil society-led initiative, of presenting independent research and analysis on India’s GHG emissions and inform the policy discourse around it. The ultimate vision is to establish a transparent and independent source of credible information which would assist policy planners in identifying and optimizing efforts to mitigate GHG emissions across economic activities. The reported estimates communicate annual manufacturing emissions starting from 2005 till 2015 on a calendar year basis. Appropriate improvements have been introduced in the present assessment approach, including an update in emission factors for key categories sourced from India’s second Biennial Update Report (BUR). Hence, recalculations for the previously reported phase has been performed and reported through this update. This methodology note, in continuation of its previous versions provides the most comprehensive and detailed outline of emission trends over a period of time across the states and sub-sectors within the manufacturing sector. 1.2 GHG coverage This study covers three key greenhouse gases, namely - carbon dioxide (CO2), methane (CH4), and nitrous oxide (N2O). These three gases collectively account for a large share of anthropogenic emissions from India. 2006 IPCC guidelines for the national GHG inventories cover many more gases (or group of gases) having relatively very high global-warming potential (GWP), such as: hydrofluorocarbons (HFCs), perfluorocarbons (PFCs), sulphur hexafluoride (SF6), etc. (collectively known as F-gases). This study does not cover F-gases, as their total contribution is known to be very small (or unmeasured) in India for the period under investigation. The Global Warming Potential (GWP) of the above-mentioned gases have been taken from IPCC’s second assessment (SAR) and fifth assessment (AR5) reports. Table 1.2 A below lists the GWP values as per the two reports used for our analysis.
Table 1.2 A: Global warming potential as per IPCC assessment reports
Name of the gas Formula
Global Warming Potential (GWP)
SAR AR5
Carbon dioxide CO2 1 1
Methane CH4 21 28
Nitrous oxide N2O 310 265
Source: (IPCC-AR5 2018) (IPCC-SAR 2018)
1 Refer GHG Platform India for previous versions at: http://www.ghgplatform-india.org/industry-sector
1.3 Key economic sectors covered Majority of GHG emissions from manufacturing is from combustion of fuels, both for process heating, as well as power generation for self-consumption (captive power production). Non-energy use of fuels (as feedstock or raw material) can also result in GHG emissions from specific manufacturing processes. Here, chemical or physical transformation of materials, result in the emission of GHGs. Such emission sources are commonly referred to as ‘Industrial Process and Product Use (IPPU)’. The entire reporting on manufacturing emissions follows the hierarchy as reported in IPCC 2006 guidelines for national GHG inventories barring few limitations that arises from the lack of, or access to adequate information on activity data. The overall scope of this study covers - manufacturing industries and construction (1A2)2; energy industries for petroleum refining and manufacturing of solid fuels (1A1b & 1A1ci); mining and hydrocarbon extraction (1A1cii); and, industrial process and product-use emissions (2A, 2B, 2C, 2D)3. IPPU emissions arising from 2B9, 2B10, 2D3, 2E, 2F, 2G, and 2H categories4 from the IPCC classification have been excluded from the scope as little or no information is publicly available for such manufacturing activities, many of which has not even existed in India until 2010-11. 1.4 Boundary of GHG estimates This note illustrates a bottom-up accounting approach, providing a detailed overview of manufacturing emissions at the sub-national as well as sub-sectoral level. The Annual Survey of Industries (ASI) unit level database is the primary source of information that is maintained and disseminated by the Ministry of Statistics and Programme Implementation (MoSPI). ASI reportedly covers only the formal sector manufacturing activity in India, as defined under the Factory Act, 1948 and represents about 75% of the energy consumption in the entire manufacturing sector. This represents all states and union territories in India except Mizoram and Lakshadweep due to unavailability of underlying industrial activity data. All forms of primary energy (including both direct thermal application and further conversion) are considered for energy-use emission estimates. Similarly, carbonaceous materials’ consumption and production output (in physical units) as reported by the factories, are considered for IPPU estimates.
1.5 Reporting Period
The reported estimates communicate annual manufacturing emissions starting from 2005 till 2015 on a calendar year basis. 2005 is the base year identified by India in its first Nationally Determined Contributions (NDC) for post 2020 emission reduction targets; whereas, 2015 was the latest year for which activity data is available from the annual survey of industries database during the time of the study.
1.6 Outline of GHG estimates
This study provides an in-depth assessment of greenhouse gas (GHG) emissions from the manufacturing sector (including construction) in India. Manufacturing here refers to the firms coming from the formal sector only, i.e. registered under sections 2m(i) and 2m(ii) of the Factories Act, 1948. This methodology note provides information on activity data collection sources and
2 The representation within parentheses refers to the IPCC classification of these sectors and emissions categories 3 2A: Mineral Industry, 2B: Chemical Industry, 2C: Metal Industry, 2D: Non-Energy Products from Fuels and Solvent Use; No information is available on industryspecific solvent use (2D3), hence not accounted 4 2E: Electronics Industry, 2F: Product Uses as Substitutes for Ozone Depleting Substances, 2G: Other Product Manufacture and Use, 2H: others.
proxies, assumptions and correction measures undertaken on the activity data to improve its quality. Further, it lists the tier approach followed for every IPCC category depending on the availability of emission factors. It provides a detailed methodology used to arrive at emissions estimates. The study lists the source and quality of the activity data for every IPCC category. It further details the uncertainties, if any, in the estimation processes; measures undertaken for quality control; details on difference in calculation of emission estimates as compared to previous (Phase 2) estimates; recommendations for policy-makers on improving the quality of data; and finally, a comparison with available national level emission estimates.
1.7 Institutional information The Council on Energy, Environment and Water (CEEW) (https://www.ceew.in/industrial-sustainability-competitiveness) leads the estimation and reporting of the manufacturing sector
emission estimates. A team of four researchers at CEEW, alongside support staff, were responsible for the entire effort behind estimating manufacturing-sector emissions. A brief description of their roles and responsibilities is provided below: Vaibhav Gupta Vaibhav is an environmental engineer and policy specialist, who examines and analyses the manufacturing sector via the lens of climate change, energy, and resource security. He was the principle investigator for the industry sector emissions and developed the bottom-up estimation approach in consultation with other team members. Tirtha Biswas Tirtha is a policy analyst, working on the development of sustainable and competitive pathways for Indian industries to support its low-carbon growth aspirations. In this effort, he played a very crucial role of translating the approach into feasible outcomes by testing out several scenarios and logics using statistical tools and excel based models. Deepa Janakiraman Deepa works as a research analyst at CEEW. She is an economist by training. In this research, she assisted the team with data analysis and drawing emission trends across sectors and states for valuable policy insights. Karthik Ganesan An engineer by training, Karthik leads The Council’s work on the Power Sector and Industrial Sustainability and Competitiveness in his capacity of Research Fellow. In this research, he supervised the entire set of activities, managed resources and ensured quality of final outcomes through an internal review and assessment process. 1.8 Data collection process and storage Annual Survey of Industries (ASI) conducted by the Ministry of Statistics and Programme Implementation (MoSPI) forms the core activity data of this research. It is a mix of census (for large firms) and sample survey covering the formal manufacturing sector in India. It is by-far the most exhaustive and periodic data set available for Indian manufacturing on a yearly basis. The prime objective of the ASI data set is to provide insights into the economic aspects of the manufacturing sector by capturing attributes of factories/ units such as value addition, employment, capital investments, etc. However, it also captures information on energy-use by industries, though not in a manner that is entirely suitable for the purposes of this study. The data
has been procured from MoSPI by paying an administrative fee. Annexure 2 provides a quick view of the activity-wise data sources availed for presented estimates. A transparent inventory process requires an effective data management process to enable users to reproduce emission estimates from the scratch. This needs a systematic data-archiving system. In this case, ASI datasets form the backbone of the entire estimation procedure as an underlying activity data. MoSPI follows a sound practice of recordkeeping and archiving, which makes data available, from early as the 1980s at any point of time upon request to the ministry. All the other sources of information, such as Indian Bureau of Mines (IBM), Cement Manufacturers Association (CMA), Ministry of Coal (MoC), etc. also provide archived information through the publications available on their website. Further, CEEW has a robust archiving and version control process for the estimates made using the activity data. We maintain a separate directory having separate folders and additional backups for each year covered in the analysis. The updates made to the methodology and estimates are done using a version control to enable tracking of the updates or a roll back to a previous version. As mentioned earlier a comprehensive disclosure on the correction measures made by CEEW through this publication and supporting datasheets to enable reproduction of this analysis independently by the users.
1.9 Quality control (QC) and quality assurance (QA) Since the estimation of GHG emissions from economywide sectors is undertaken by different partners at the platform, ensuring quality control becomes one of the key factors to make the published datasets reusable. The aim of the platform is to provide activity data as well as emission estimates in a form that can be interpreted and used by audiences fairly easily. For this purpose, the platform undertakes certain quality control measures. Some of them are as follows:
• Standardized worksheets containing emission estimates and activity data across the sectors.
• Transparency in reporting all conversion factors used to arrive at emission estimates.
• Uniform abidance to the IPCC 2006 guidelines for the estimation of emissions.
• Citation of all external data used along with source links.
• Providing estimates using GWP numbers from both SAR as well as AR5.
• Multiple checks of activity data to ensure consistency of results.
• Providing detailed methodology to facilitate recalculation of emissions by end user.
• Ensuring consistency in units of reporting across fuel categories throughout the process of estimation.
• Transparent disclosure of recalculations (from previous estimates) and reasons for variation in estimates.
• Proper archiving of all estimates to keep the data accessible.
• Making the data easily accessible through distinct sector pages on the platform’s website. Quality Assurance is maintained through a thorough peer review process undertaken by the platform. This review is done by personnel not involved in the estimation process. The review analyses the entire estimation process and reverts with improvements and suggestions that are then addressed by the relevant partners. Further, the platform meets at regular intervals to ensure communication and information sharing among all partners. In continuation to previous efforts, authors of this methodology note have standardized a process incorporating suitable checks and correction measures in the raw (unit level) data obtained from the Ministry. As quality check, all such correction measures have been duly discussed with renowned statisticians and MoSPI officials over the past two years.
Where necessary, alternative sources of information (activity data) were used to substantiate the assumptions and fill information gaps within the ASI datasets. For most years, IPPU related activity data was found to be sparsely available from the ASI, especially with cement, construction and ferro-alloys production activities.
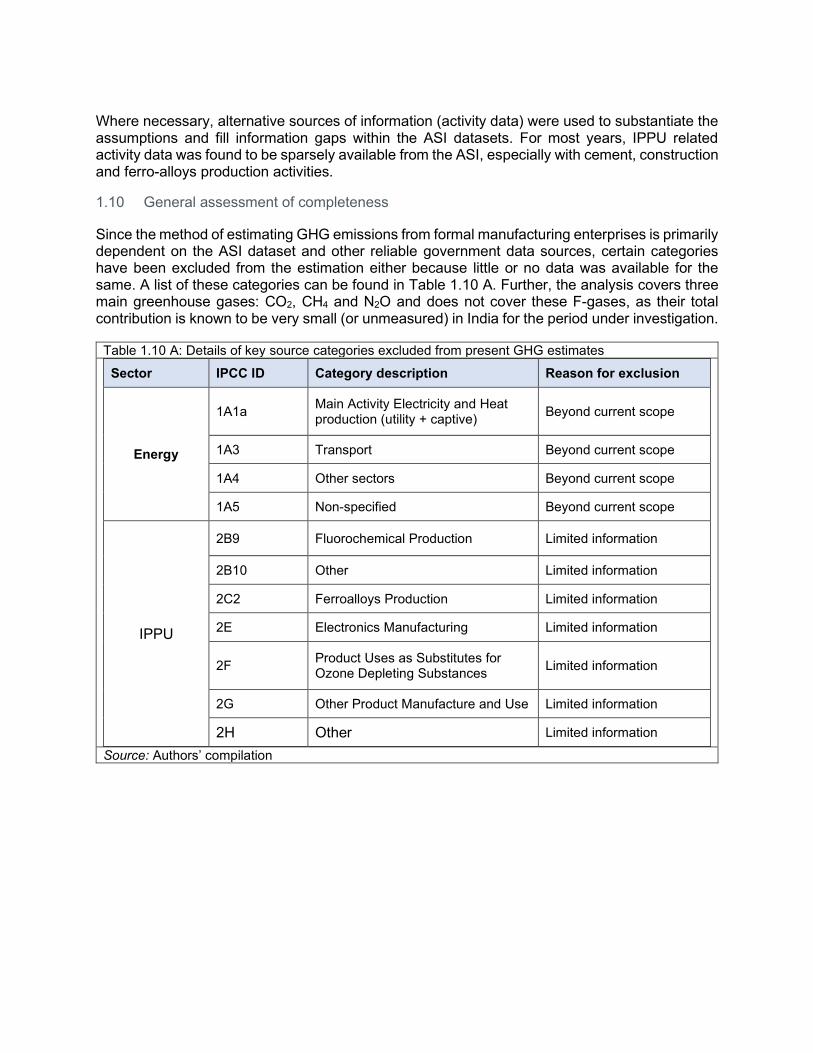
1.10 General assessment of completeness
Since the method of estimating GHG emissions from formal manufacturing enterprises is primarily dependent on the ASI dataset and other reliable government data sources, certain categories have been excluded from the estimation either because little or no data was available for the same. A list of these categories can be found in Table 1.10 A. Further, the analysis covers three main greenhouse gases: CO2, CH4 and N2O and does not cover these F-gases, as their total contribution is known to be very small (or unmeasured) in India for the period under investigation.
Table 1.10 A: Details of key source categories excluded from present GHG estimates
Sector IPCC ID Category description Reason for exclusion
Energy
1A1a Main Activity Electricity and Heat production (utility + captive)
Beyond current scope
1A3 Transport Beyond current scope
1A4 Other sectors Beyond current scope
1A5 Non-specified Beyond current scope
IPPU
2B9 Fluorochemical Production Limited information
2B10 Other Limited information
2C2 Ferroalloys Production Limited information
2E Electronics Manufacturing Limited information
2F Product Uses as Substitutes for Ozone Depleting Substances
Limited information
2G Other Product Manufacture and Use Limited information
2H Other Limited information
Source: Authors’ compilation
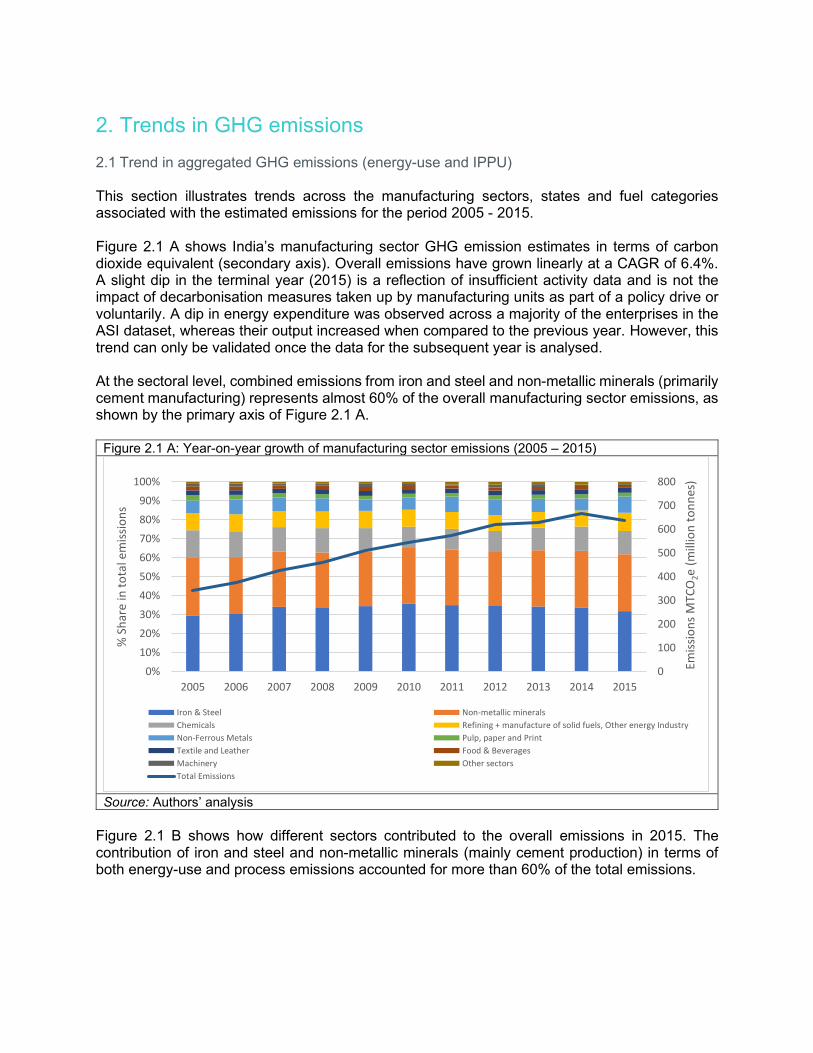
2. Trends in GHG emissions 2.1 Trend in aggregated GHG emissions (energy-use and IPPU) This section illustrates trends across the manufacturing sectors, states and fuel categories associated with the estimated emissions for the period 2005 - 2015. Figure 2.1 A shows India’s manufacturing sector GHG emission estimates in terms of carbon dioxide equivalent (secondary axis). Overall emissions have grown linearly at a CAGR of 6.4%. A slight dip in the terminal year (2015) is a reflection of insufficient activity data and is not the impact of decarbonisation measures taken up by manufacturing units as part of a policy drive or voluntarily. A dip in energy expenditure was observed across a majority of the enterprises in the ASI dataset, whereas their output increased when compared to the previous year. However, this trend can only be validated once the data for the subsequent year is analysed. At the sectoral level, combined emissions from iron and steel and non-metallic minerals (primarily cement manufacturing) represents almost 60% of the overall manufacturing sector emissions, as shown by the primary axis of Figure 2.1 A.
Figure 2.1 A: Year-on-year growth of manufacturing sector emissions (2005 – 2015)
Source: Authors’ analysis
Figure 2.1 B shows how different sectors contributed to the overall emissions in 2015. The contribution of iron and steel and non-metallic minerals (mainly cement production) in terms of both energy-use and process emissions accounted for more than 60% of the total emissions.
0
100
200
300
400
500
600
700
800
0%
10%
20%
30%
40%
50%
60%
70%
80%
90%
100%
2005 2006 2007 2008 2009 2010 2011 2012 2013 2014 2015Em
issi
on
s M
TCO
2e (
mill
ion
to
nn
es)
% S
har
e in
to
tal e
mis
sio
ns
Iron & Steel Non-metallic minerals
Chemicals Refining + manufacture of solid fuels, Other energy Industry
Non-Ferrous Metals Pulp, paper and Print
Textile and Leather Food & Beverages
Machinery Other sectors
Total Emissions
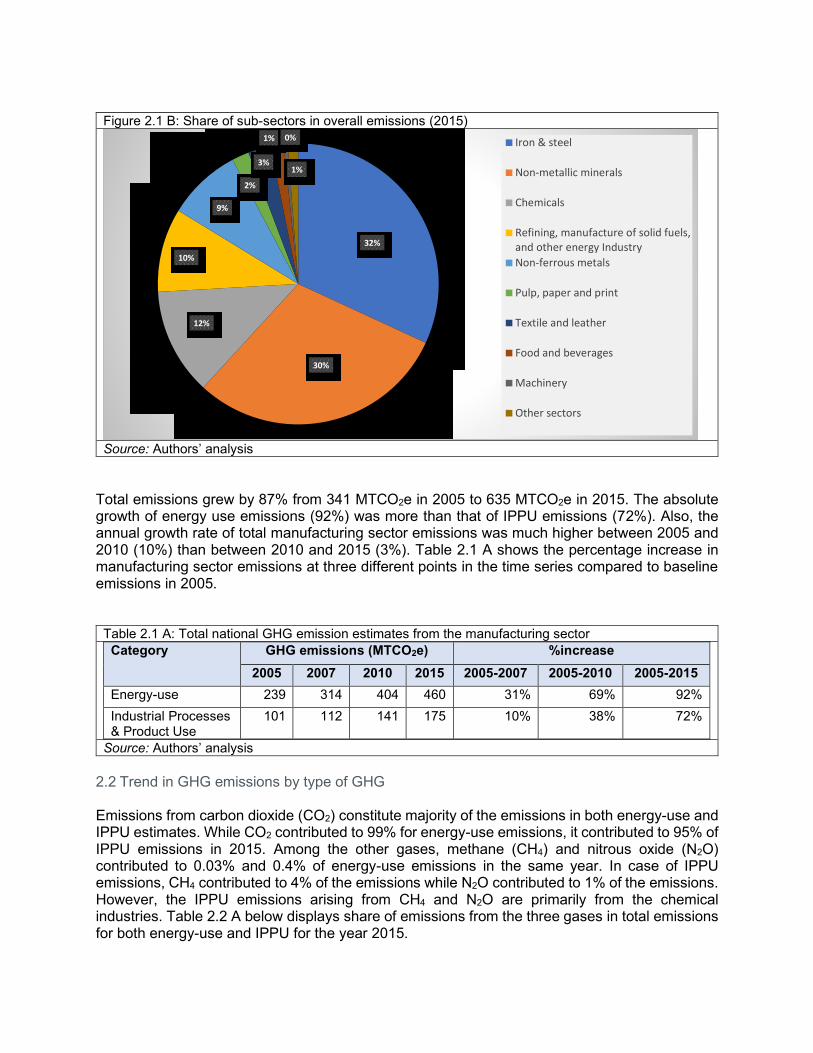
Figure 2.1 B: Share of sub-sectors in overall emissions (2015)
Source: Authors’ analysis
Total emissions grew by 87% from 341 MTCO2e in 2005 to 635 MTCO2e in 2015. The absolute growth of energy use emissions (92%) was more than that of IPPU emissions (72%). Also, the annual growth rate of total manufacturing sector emissions was much higher between 2005 and 2010 (10%) than between 2010 and 2015 (3%). Table 2.1 A shows the percentage increase in manufacturing sector emissions at three different points in the time series compared to baseline emissions in 2005.
Table 2.1 A: Total national GHG emission estimates from the manufacturing sector
Category GHG emissions (MTCO2e) %increase
2005 2007 2010 2015 2005-2007 2005-2010 2005-2015
Energy-use 239 314 404 460 31% 69% 92%
Industrial Processes & Product Use
101 112 141 175 10% 38% 72%
Source: Authors’ analysis
2.2 Trend in GHG emissions by type of GHG Emissions from carbon dioxide (CO2) constitute majority of the emissions in both energy-use and IPPU estimates. While CO2 contributed to 99% for energy-use emissions, it contributed to 95% of IPPU emissions in 2015. Among the other gases, methane (CH4) and nitrous oxide (N2O) contributed to 0.03% and 0.4% of energy-use emissions in the same year. In case of IPPU emissions, CH4 contributed to 4% of the emissions while N2O contributed to 1% of the emissions. However, the IPPU emissions arising from CH4 and N2O are primarily from the chemical industries. Table 2.2 A below displays share of emissions from the three gases in total emissions for both energy-use and IPPU for the year 2015.
32%
30%
12%
10%
9%
2%
3%
1% 0%
1%
Iron & steel
Non-metallic minerals
Chemicals
Refining, manufacture of solid fuels,and other energy Industry
Non-ferrous metals
Pulp, paper and print
Textile and leather
Food and beverages
Machinery
Other sectors
Table 2.2 A: Distribution of GHG emissions (energy-use and IPPU) contribution from major gases (2015)
Category Without AFOLU
%CO2 %CH4 %N2O
1. Energy use 99.57 0.03 0.40
2. Industrial Processes & Product Use 95.28 4.58 0.14
Source: Authors’ analysis
2.3 Key drivers of the emission trends in various sectors Energy-use:
• The major sectoral drivers for energy emissions are from iron and steel, non-metallic minerals, petroleum refining and non-ferrous metals. Together they contributed to about 80% of the emissions in 2015, with iron and steel alone representing a share of 42%. The emissions from the sub-sector has more than doubled in the time period from 95 MTCO2e to 194 MTCO2e.
• At the national level, coal (use) continues to be the dominant source of energy across the sectors. Hence, its share in the energy derived emissions grew from 180 MTCO2e in 2005 to 366 MTCO2e in 2015; i.e. nearly 80% of the total energy-use emissions.
IPPU:
• The major driver for industrial processes and product use is the emissions arising from cement production. It has consistently contributed to about 60% of the total IPPU emissions between 2005 and 2015. It has increased from 58 MTCO2e to 113 MTCO2e, representing an absolute increase by 95% during the period.
• The other drivers of IPPU emissions are ammonia production and iron and steel production.
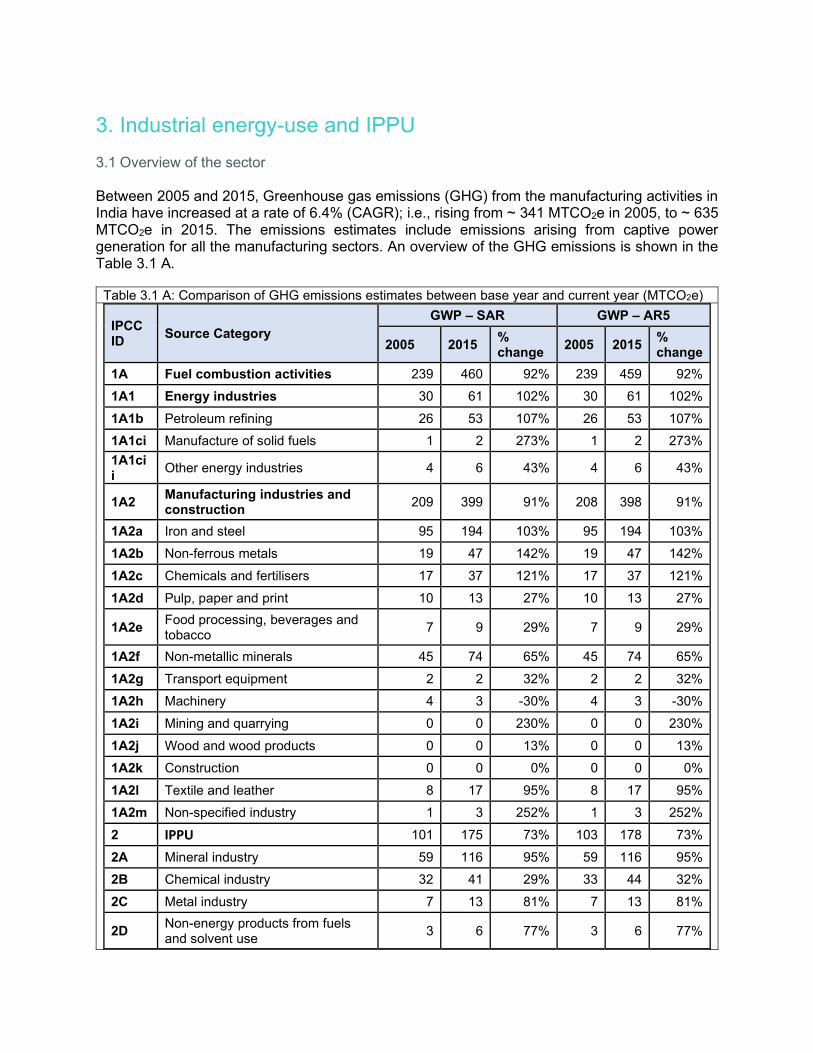
3. Industrial energy-use and IPPU 3.1 Overview of the sector Between 2005 and 2015, Greenhouse gas emissions (GHG) from the manufacturing activities in India have increased at a rate of 6.4% (CAGR); i.e., rising from ~ 341 MTCO2e in 2005, to ~ 635 MTCO2e in 2015. The emissions estimates include emissions arising from captive power generation for all the manufacturing sectors. An overview of the GHG emissions is shown in the Table 3.1 A.
Table 3.1 A: Comparison of GHG emissions estimates between base year and current year (MTCO2e)
IPCC ID
Source Category
GWP – SAR GWP – AR5
2005 2015 % change
2005 2015 % change
1A Fuel combustion activities 239 460 92% 239 459 92%
1A1 Energy industries 30 61 102% 30 61 102%
1A1b Petroleum refining 26 53 107% 26 53 107%
1A1ci Manufacture of solid fuels 1 2 273% 1 2 273%
1A1cii
Other energy industries 4 6 43% 4 6 43%
1A2 Manufacturing industries and construction
209 399 91% 208 398 91%
1A2a Iron and steel 95 194 103% 95 194 103%
1A2b Non-ferrous metals 19 47 142% 19 47 142%
1A2c Chemicals and fertilisers 17 37 121% 17 37 121%
1A2d Pulp, paper and print 10 13 27% 10 13 27%
1A2e Food processing, beverages and tobacco
7 9 29% 7 9 29%
1A2f Non-metallic minerals 45 74 65% 45 74 65%
1A2g Transport equipment 2 2 32% 2 2 32%
1A2h Machinery 4 3 -30% 4 3 -30%
1A2i Mining and quarrying 0 0 230% 0 0 230%
1A2j Wood and wood products 0 0 13% 0 0 13%
1A2k Construction 0 0 0% 0 0 0%
1A2l Textile and leather 8 17 95% 8 17 95%
1A2m Non-specified industry 1 3 252% 1 3 252%
2 IPPU 101 175 73% 103 178 73%
2A Mineral industry 59 116 95% 59 116 95%
2B Chemical industry 32 41 29% 33 44 32%
2C Metal industry 7 13 81% 7 13 81%
2D Non-energy products from fuels and solvent use
3 6 77% 3 6 77%
Source: Authors’ analysis
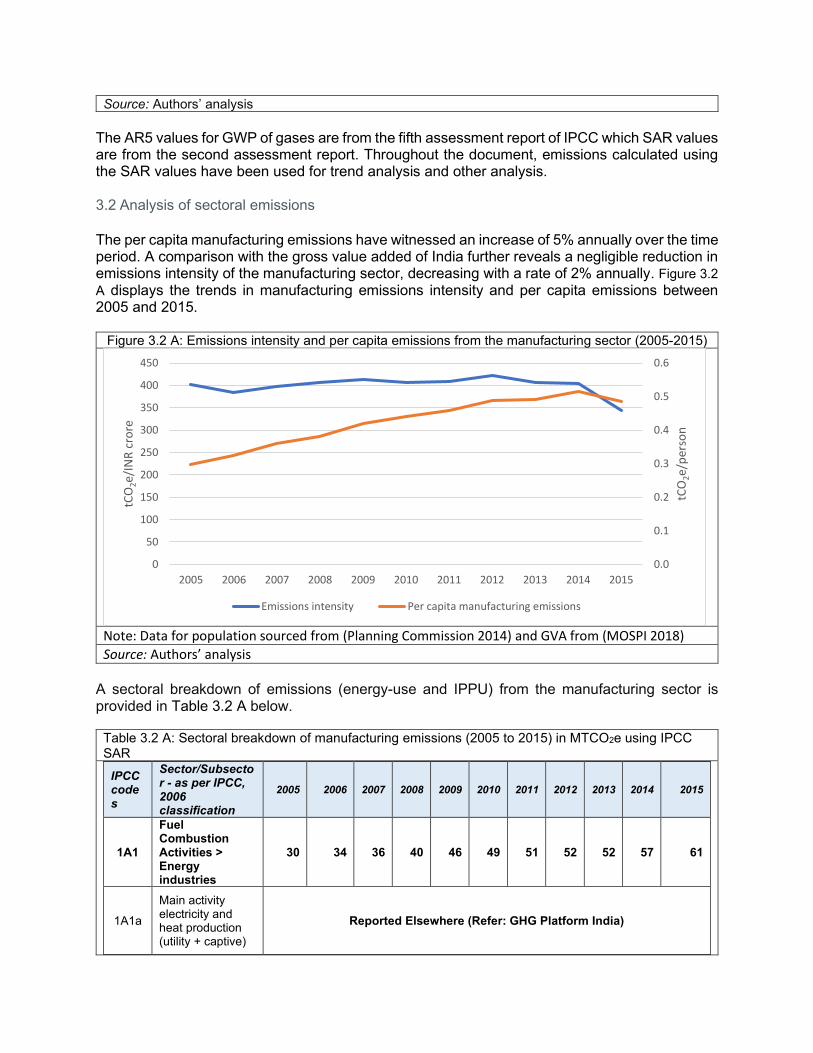
The AR5 values for GWP of gases are from the fifth assessment report of IPCC which SAR values are from the second assessment report. Throughout the document, emissions calculated using the SAR values have been used for trend analysis and other analysis. 3.2 Analysis of sectoral emissions The per capita manufacturing emissions have witnessed an increase of 5% annually over the time period. A comparison with the gross value added of India further reveals a negligible reduction in emissions intensity of the manufacturing sector, decreasing with a rate of 2% annually. Figure 3.2
A displays the trends in manufacturing emissions intensity and per capita emissions between 2005 and 2015.
Figure 3.2 A: Emissions intensity and per capita emissions from the manufacturing sector (2005-2015)
Note: Data for population sourced from (Planning Commission 2014) and GVA from (MOSPI 2018)
Source: Authors’ analysis A sectoral breakdown of emissions (energy-use and IPPU) from the manufacturing sector is provided in Table 3.2 A below.
Table 3.2 A: Sectoral breakdown of manufacturing emissions (2005 to 2015) in MTCO2e using IPCC SAR
IPCC codes
Sector/Subsector - as per IPCC, 2006 classification
2005 2006 2007 2008 2009 2010 2011 2012 2013 2014 2015
1A1
Fuel Combustion Activities > Energy industries
30 34 36 40 46 49 51 52 52 57 61
1A1a
Main activity electricity and heat production (utility + captive)
Reported Elsewhere (Refer: GHG Platform India)
0.0
0.1
0.2
0.3
0.4
0.5
0.6
0
50
100
150
200
250
300
350
400
450
2005 2006 2007 2008 2009 2010 2011 2012 2013 2014 2015
tCO
2e/p
erso
n
tCO
2e/I
NR
cro
re
Emissions intensity Per capita manufacturing emissions
1A1b Petroleum refining
26 30 32 36 41 43 46 45 45 50 53
1A1ci Manufacture of solid fuel
1 0 1 1 1 1 1 1 2 2 2
1A1cii Other energy industry
4 4 4 4 4 5 5 5 5 5 6
1A2
1A2: Manufacturing industries and construction
209 237 278 299 337 355 366 412 417 437 399
1A2a Iron and steel 95 109 140 147 170 187 186 201 207 216 194
1A2b Non-ferrous metals
19 24 26 27 25 29 40 46 38 36 47
1A2c Chemicals and fertilisers
17 19 22 27 29 24 24 30 36 46 37
1A2d Pulp, paper and print
10 10 10 10 10 11 11 12 14 15 13
1A2e Food processing, beverages and tobacco
7 8 7 8 11 9 9 10 10 12 9
1A2f Non-metallic minerals
45 50 56 60 66 71 74 81 82 84 74
1A2g Transport equipment
2 1 2 2 2 2 3 4 3 3 2
1A2h Machinery 4 5 5 5 9 5 4 9 9 5 3
1A2i Mining (excluding fuels) and quarrying
0 0 0 0 0 0 0 0 0 0 0
1A2j Wood and wood products
0 0 0 0 0 0 0 0 0 0 0
1A2k Construction 0 0 0 1 0 0 0 0 0 0 0
1A2l Textile and leather
8 9 10 12 13 13 13 16 15 17 17
1A2m Non-specified industry
1 1 1 1 2 2 2 3 3 3 3
2A Mineral industry 59 64 68 74 82 90 93 95 104 116 116
2B Chemical industry
32 32 33 33 35 37 39 39 39 39 41
2C Metal industry 9 10 10 12 12 12 20 20 14 14 16
2D
Non-energy products from fuels and solvent use
1 1 1 1 1 2 2 2 2 4 3
Emissions (energy-use and IPPU, excluding electricity) 341 378 427 459 512 545 572 619 627 667 635
Source: Authors’ analysis
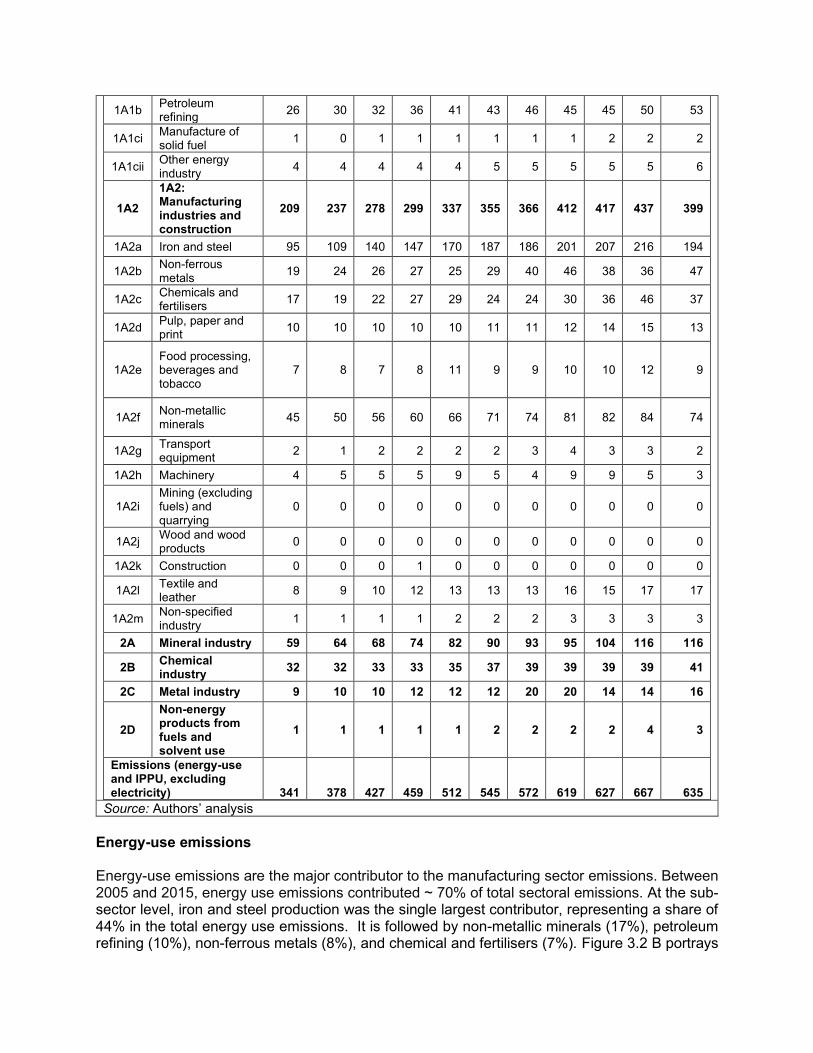
Energy-use emissions Energy-use emissions are the major contributor to the manufacturing sector emissions. Between 2005 and 2015, energy use emissions contributed ~ 70% of total sectoral emissions. At the sub-sector level, iron and steel production was the single largest contributor, representing a share of 44% in the total energy use emissions. It is followed by non-metallic minerals (17%), petroleum refining (10%), non-ferrous metals (8%), and chemical and fertilisers (7%). Figure 3.2 B portrays
sector wise split across energy use emissions, which has remained almost constant (in terms of sectoral share) over the assessment period.
Figure 3.2 B: Trend of energy-use emissions across end-use manufacturing sectors (2005 – 2015)
Source: Authors’ analysis
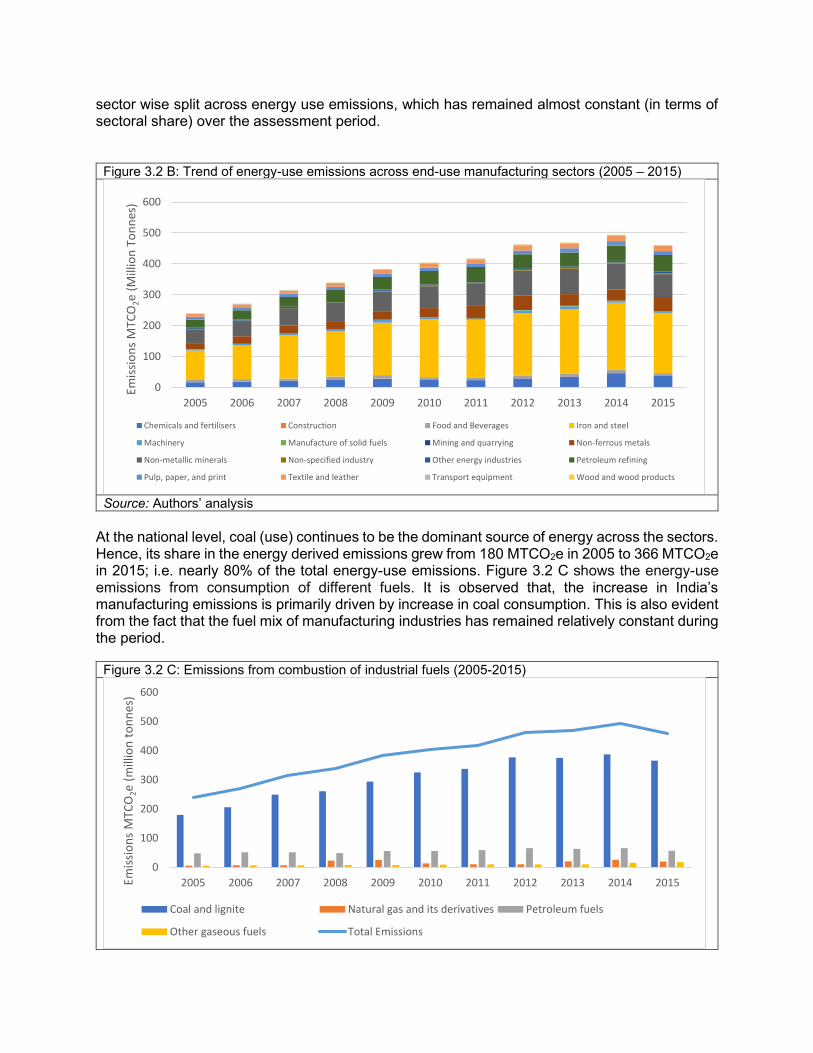
At the national level, coal (use) continues to be the dominant source of energy across the sectors. Hence, its share in the energy derived emissions grew from 180 MTCO2e in 2005 to 366 MTCO2e in 2015; i.e. nearly 80% of the total energy-use emissions. Figure 3.2 C shows the energy-use emissions from consumption of different fuels. It is observed that, the increase in India’s manufacturing emissions is primarily driven by increase in coal consumption. This is also evident from the fact that the fuel mix of manufacturing industries has remained relatively constant during the period.
Figure 3.2 C: Emissions from combustion of industrial fuels (2005-2015)
0
100
200
300
400
500
600
2005 2006 2007 2008 2009 2010 2011 2012 2013 2014 2015
Emis
sio
ns
MTC
O2e
(M
illio
n T
on
nes
)
Chemicals and fertilisers Construction Food and Beverages Iron and steel
Machinery Manufacture of solid fuels Mining and quarrying Non-ferrous metals
Non-metallic minerals Non-specified industry Other energy industries Petroleum refining
Pulp, paper, and print Textile and leather Transport equipment Wood and wood products
0
100
200
300
400
500
600
2005 2006 2007 2008 2009 2010 2011 2012 2013 2014 2015Emis
sio
ns
MTC
O2e
(mill
ion
to
nn
es)
Coal and lignite Natural gas and its derivatives Petroleum fuels
Other gaseous fuels Total Emissions
Source: Authors’ analysis
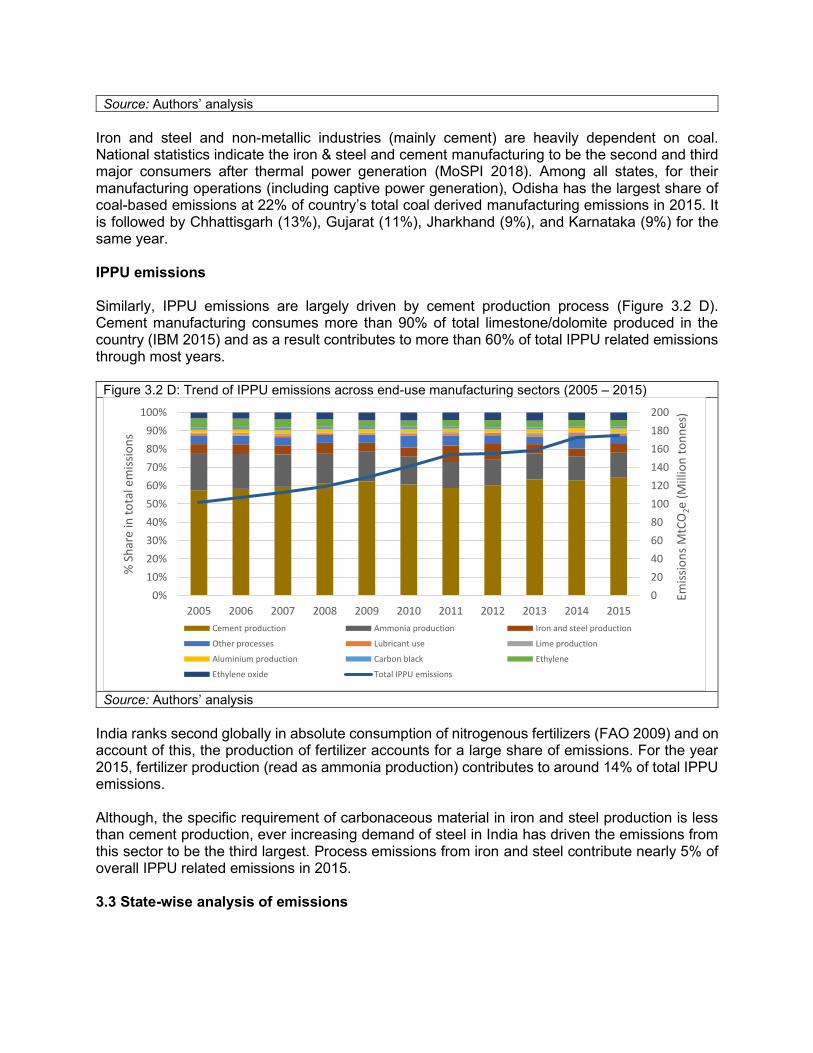
Iron and steel and non-metallic industries (mainly cement) are heavily dependent on coal. National statistics indicate the iron & steel and cement manufacturing to be the second and third major consumers after thermal power generation (MoSPI 2018). Among all states, for their manufacturing operations (including captive power generation), Odisha has the largest share of coal-based emissions at 22% of country’s total coal derived manufacturing emissions in 2015. It is followed by Chhattisgarh (13%), Gujarat (11%), Jharkhand (9%), and Karnataka (9%) for the same year. IPPU emissions Similarly, IPPU emissions are largely driven by cement production process (Figure 3.2 D). Cement manufacturing consumes more than 90% of total limestone/dolomite produced in the country (IBM 2015) and as a result contributes to more than 60% of total IPPU related emissions through most years.
Figure 3.2 D: Trend of IPPU emissions across end-use manufacturing sectors (2005 – 2015)
Source: Authors’ analysis
India ranks second globally in absolute consumption of nitrogenous fertilizers (FAO 2009) and on account of this, the production of fertilizer accounts for a large share of emissions. For the year 2015, fertilizer production (read as ammonia production) contributes to around 14% of total IPPU emissions. Although, the specific requirement of carbonaceous material in iron and steel production is less than cement production, ever increasing demand of steel in India has driven the emissions from this sector to be the third largest. Process emissions from iron and steel contribute nearly 5% of overall IPPU related emissions in 2015. 3.3 State-wise analysis of emissions
0
20
40
60
80
100
120
140
160
180
200
0%
10%
20%
30%
40%
50%
60%
70%
80%
90%
100%
2005 2006 2007 2008 2009 2010 2011 2012 2013 2014 2015
Emis
sio
ns
MtC
O2e
(M
illio
n t
on
nes
)
% S
har
e in
to
tal e
mis
sio
ns
Cement production Ammonia production Iron and steel production
Other processes Lubricant use Lime production
Aluminium production Carbon black Ethylene
Ethylene oxide Total IPPU emissions
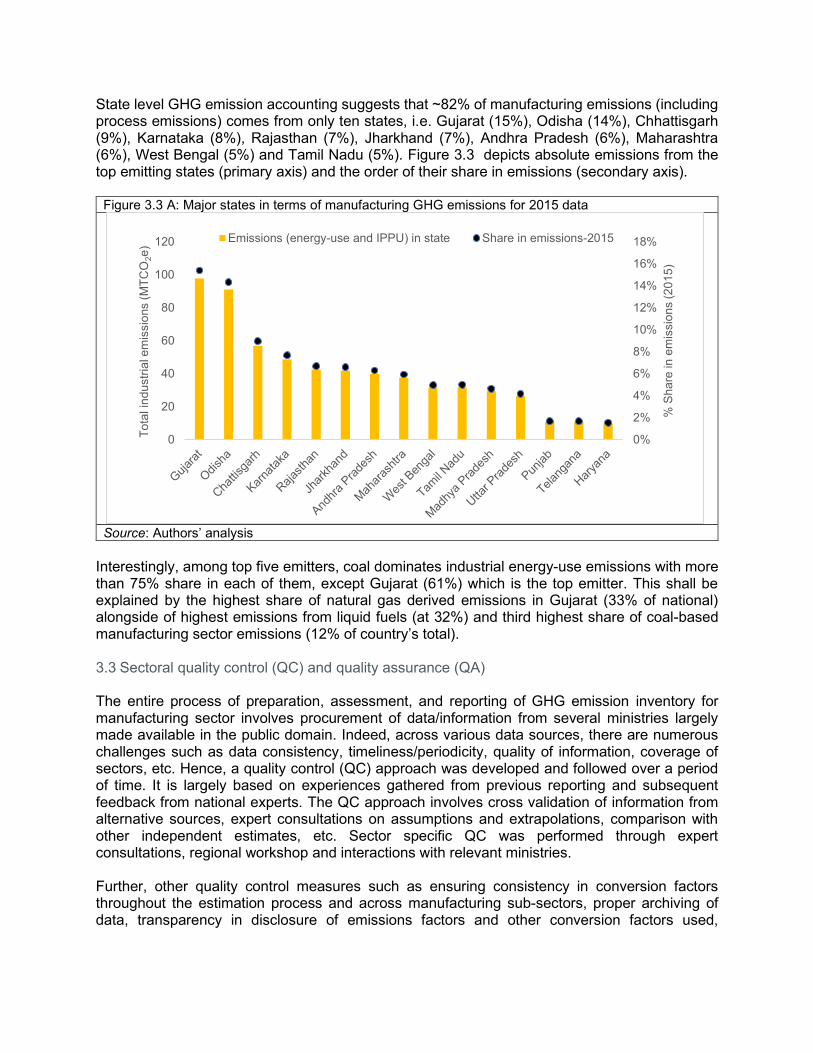
State level GHG emission accounting suggests that ~82% of manufacturing emissions (including process emissions) comes from only ten states, i.e. Gujarat (15%), Odisha (14%), Chhattisgarh (9%), Karnataka (8%), Rajasthan (7%), Jharkhand (7%), Andhra Pradesh (6%), Maharashtra (6%), West Bengal (5%) and Tamil Nadu (5%). Figure 3.3 depicts absolute emissions from the top emitting states (primary axis) and the order of their share in emissions (secondary axis).
Figure 3.3 A: Major states in terms of manufacturing GHG emissions for 2015 data
Source: Authors’ analysis
Interestingly, among top five emitters, coal dominates industrial energy-use emissions with more than 75% share in each of them, except Gujarat (61%) which is the top emitter. This shall be explained by the highest share of natural gas derived emissions in Gujarat (33% of national) alongside of highest emissions from liquid fuels (at 32%) and third highest share of coal-based manufacturing sector emissions (12% of country’s total). 3.3 Sectoral quality control (QC) and quality assurance (QA) The entire process of preparation, assessment, and reporting of GHG emission inventory for manufacturing sector involves procurement of data/information from several ministries largely made available in the public domain. Indeed, across various data sources, there are numerous challenges such as data consistency, timeliness/periodicity, quality of information, coverage of sectors, etc. Hence, a quality control (QC) approach was developed and followed over a period of time. It is largely based on experiences gathered from previous reporting and subsequent feedback from national experts. The QC approach involves cross validation of information from alternative sources, expert consultations on assumptions and extrapolations, comparison with other independent estimates, etc. Sector specific QC was performed through expert consultations, regional workshop and interactions with relevant ministries. Further, other quality control measures such as ensuring consistency in conversion factors throughout the estimation process and across manufacturing sub-sectors, proper archiving of data, transparency in disclosure of emissions factors and other conversion factors used,
0%
2%
4%
6%
8%
10%
12%
14%
16%
18%
0
20
40
60
80
100
120
% S
ha
re in
em
issio
ns (
20
15
)
To
tal in
du
str
ial e
mis
sio
ns (
MT
CO
2e
)
Emissions (energy-use and IPPU) in state Share in emissions-2015
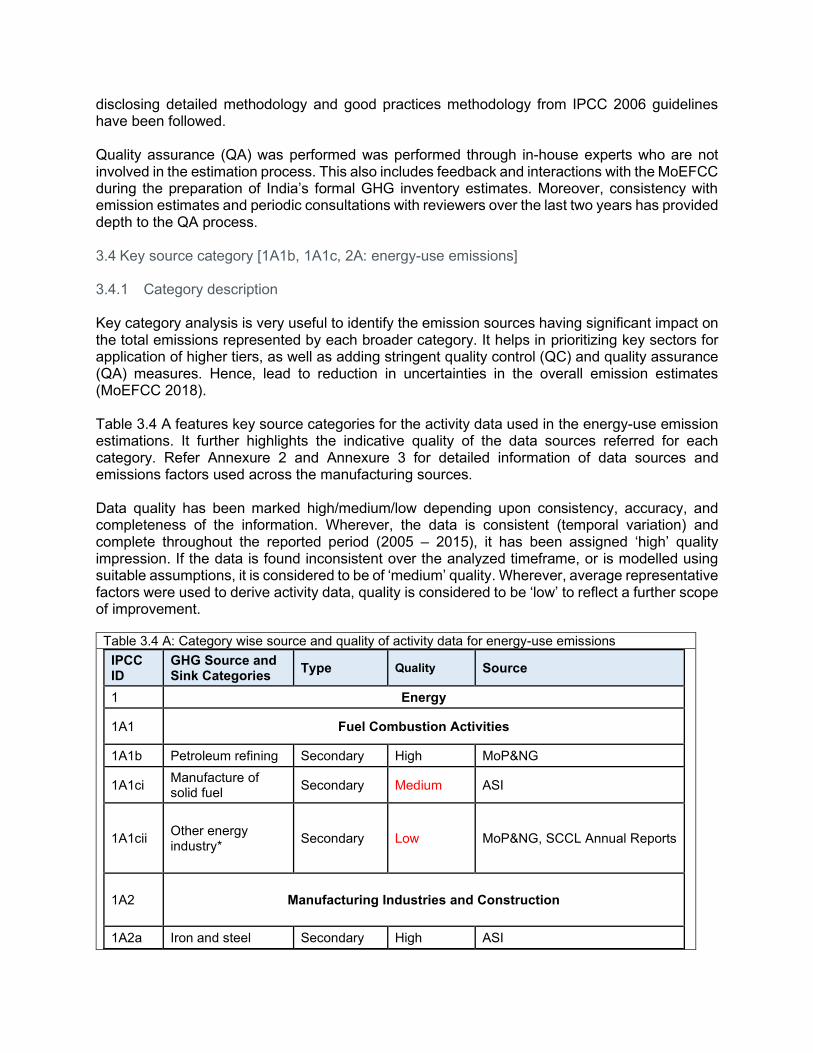
disclosing detailed methodology and good practices methodology from IPCC 2006 guidelines have been followed. Quality assurance (QA) was performed was performed through in-house experts who are not involved in the estimation process. This also includes feedback and interactions with the MoEFCC during the preparation of India’s formal GHG inventory estimates. Moreover, consistency with emission estimates and periodic consultations with reviewers over the last two years has provided depth to the QA process. 3.4 Key source category [1A1b, 1A1c, 2A: energy-use emissions] 3.4.1 Category description Key category analysis is very useful to identify the emission sources having significant impact on the total emissions represented by each broader category. It helps in prioritizing key sectors for application of higher tiers, as well as adding stringent quality control (QC) and quality assurance (QA) measures. Hence, lead to reduction in uncertainties in the overall emission estimates (MoEFCC 2018). Table 3.4 A features key source categories for the activity data used in the energy-use emission estimations. It further highlights the indicative quality of the data sources referred for each category. Refer Annexure 2 and Annexure 3 for detailed information of data sources and emissions factors used across the manufacturing sources. Data quality has been marked high/medium/low depending upon consistency, accuracy, and completeness of the information. Wherever, the data is consistent (temporal variation) and complete throughout the reported period (2005 – 2015), it has been assigned ‘high’ quality impression. If the data is found inconsistent over the analyzed timeframe, or is modelled using suitable assumptions, it is considered to be of ‘medium’ quality. Wherever, average representative factors were used to derive activity data, quality is considered to be ‘low’ to reflect a further scope of improvement.
Table 3.4 A: Category wise source and quality of activity data for energy-use emissions
IPCC ID
GHG Source and Sink Categories
Type Quality Source
1 Energy
1A1 Fuel Combustion Activities
1A1b Petroleum refining Secondary High MoP&NG
1A1ci Manufacture of solid fuel
Secondary Medium ASI
1A1cii Other energy industry*
Secondary Low MoP&NG, SCCL Annual Reports
1A2 Manufacturing Industries and Construction
1A2a Iron and steel Secondary High ASI
1A2b Non-ferrous metals Secondary High ASI
1A2c Chemicals and fertilisers
Secondary High ASI
1A2d Pulp, paper and print
Secondary Low ASI
1A2e Food processing, beverages and tobacco
Secondary Medium ASI
1A2f Non-metallic minerals
Secondary High ASI
1A2g Transport equipment
Secondary High ASI
1A2h Machinery Secondary High ASI
1A2i Mining (excluding fuels) and quarrying
Secondary Low ASI
1A2j Wood and wood products
Secondary Medium ASI
1A2k Construction ---- ----- ASI
1A2l Textile and leather Secondary High ASI
1A2m Non-specified industry
Secondary Medium ASI
*: Includes emissions from energy use in coal mining and oil & gas extraction
Source: Authors’ analysis
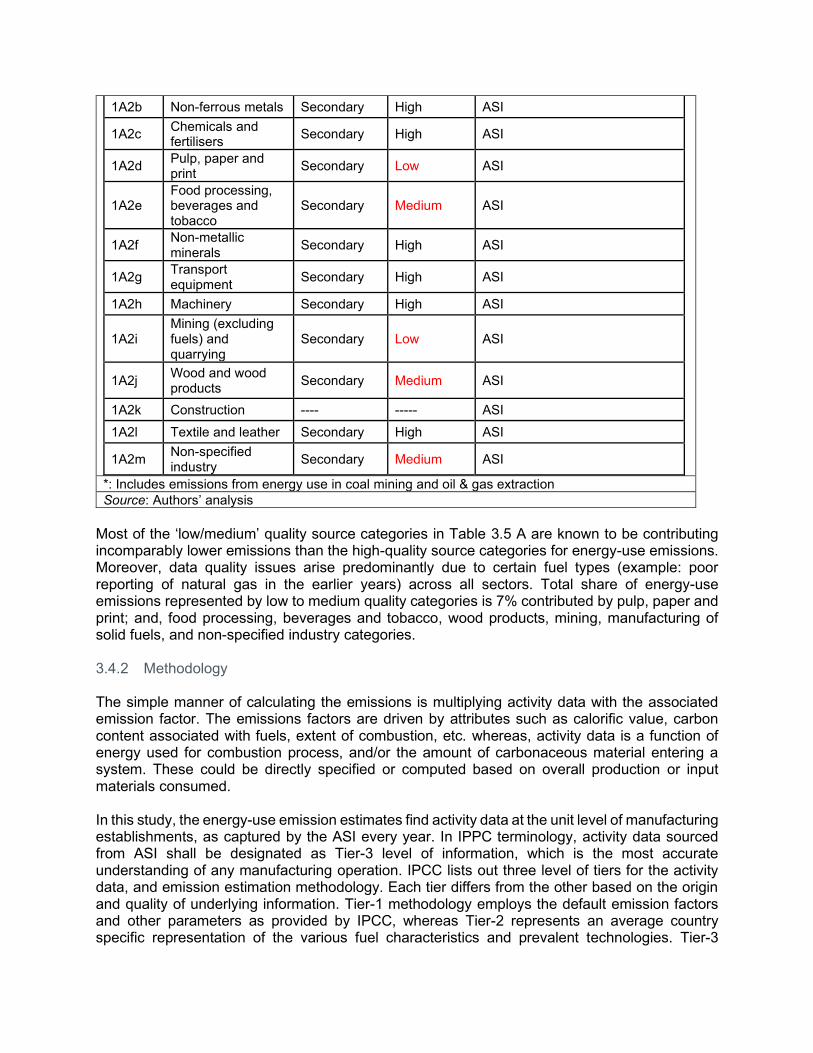
Most of the ‘low/medium’ quality source categories in Table 3.5 A are known to be contributing incomparably lower emissions than the high-quality source categories for energy-use emissions. Moreover, data quality issues arise predominantly due to certain fuel types (example: poor reporting of natural gas in the earlier years) across all sectors. Total share of energy-use emissions represented by low to medium quality categories is 7% contributed by pulp, paper and print; and, food processing, beverages and tobacco, wood products, mining, manufacturing of solid fuels, and non-specified industry categories. 3.4.2 Methodology The simple manner of calculating the emissions is multiplying activity data with the associated emission factor. The emissions factors are driven by attributes such as calorific value, carbon content associated with fuels, extent of combustion, etc. whereas, activity data is a function of energy used for combustion process, and/or the amount of carbonaceous material entering a system. These could be directly specified or computed based on overall production or input materials consumed. In this study, the energy-use emission estimates find activity data at the unit level of manufacturing establishments, as captured by the ASI every year. In IPPC terminology, activity data sourced from ASI shall be designated as Tier-3 level of information, which is the most accurate understanding of any manufacturing operation. IPCC lists out three level of tiers for the activity data, and emission estimation methodology. Each tier differs from the other based on the origin and quality of underlying information. Tier-1 methodology employs the default emission factors and other parameters as provided by IPCC, whereas Tier-2 represents an average country specific representation of the various fuel characteristics and prevalent technologies. Tier-3
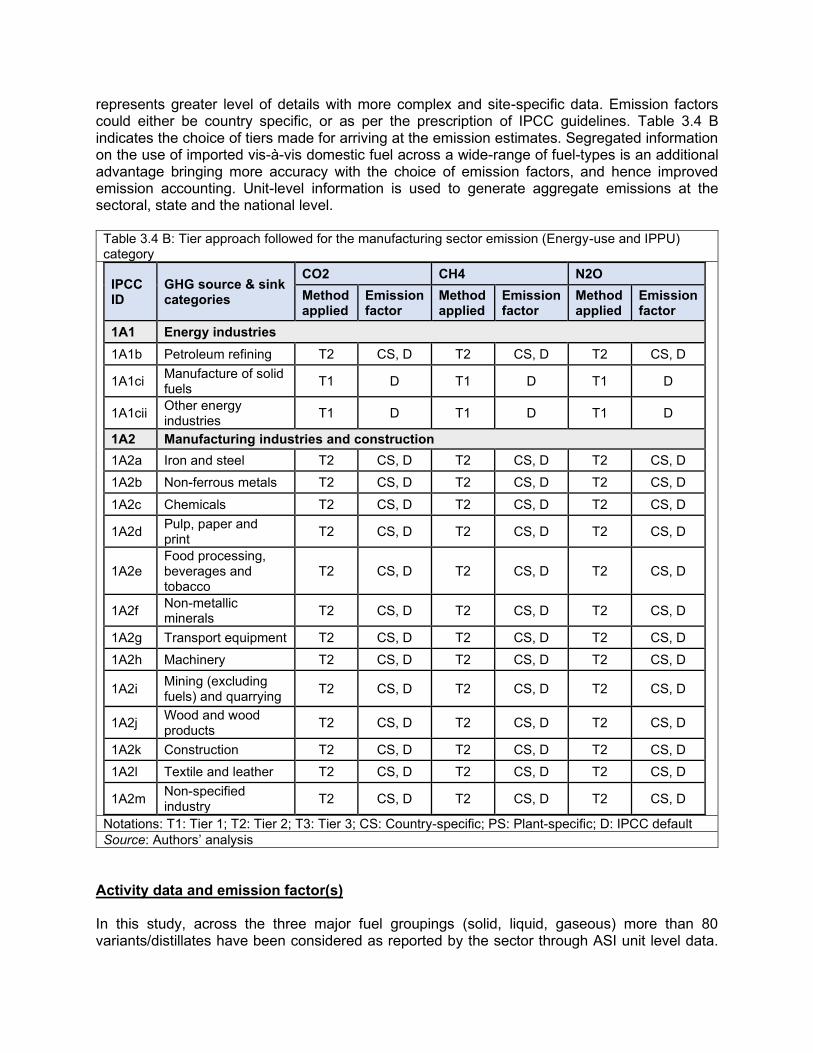
represents greater level of details with more complex and site-specific data. Emission factors could either be country specific, or as per the prescription of IPCC guidelines. Table 3.4 B indicates the choice of tiers made for arriving at the emission estimates. Segregated information on the use of imported vis-à-vis domestic fuel across a wide-range of fuel-types is an additional advantage bringing more accuracy with the choice of emission factors, and hence improved emission accounting. Unit-level information is used to generate aggregate emissions at the sectoral, state and the national level.
Table 3.4 B: Tier approach followed for the manufacturing sector emission (Energy-use and IPPU) category
IPCC ID
GHG source & sink categories
CO2 CH4 N2O
Method applied
Emission factor
Method applied
Emission factor
Method applied
Emission factor
1A1 Energy industries
1A1b Petroleum refining T2 CS, D T2 CS, D T2 CS, D
1A1ci Manufacture of solid fuels
T1 D T1 D T1 D
1A1cii Other energy industries
T1 D T1 D T1 D
1A2 Manufacturing industries and construction
1A2a Iron and steel T2 CS, D T2 CS, D T2 CS, D
1A2b Non-ferrous metals T2 CS, D T2 CS, D T2 CS, D
1A2c Chemicals T2 CS, D T2 CS, D T2 CS, D
1A2d Pulp, paper and print
T2 CS, D T2 CS, D T2 CS, D
1A2e Food processing, beverages and tobacco
T2 CS, D T2 CS, D T2 CS, D
1A2f Non-metallic minerals
T2 CS, D T2 CS, D T2 CS, D
1A2g Transport equipment T2 CS, D T2 CS, D T2 CS, D
1A2h Machinery T2 CS, D T2 CS, D T2 CS, D
1A2i Mining (excluding fuels) and quarrying
T2 CS, D T2 CS, D T2 CS, D
1A2j Wood and wood products
T2 CS, D T2 CS, D T2 CS, D
1A2k Construction T2 CS, D T2 CS, D T2 CS, D
1A2l Textile and leather T2 CS, D T2 CS, D T2 CS, D
1A2m Non-specified industry
T2 CS, D T2 CS, D T2 CS, D
Notations: T1: Tier 1; T2: Tier 2; T3: Tier 3; CS: Country-specific; PS: Plant-specific; D: IPCC default
Source: Authors’ analysis
Activity data and emission factor(s) In this study, across the three major fuel groupings (solid, liquid, gaseous) more than 80 variants/distillates have been considered as reported by the sector through ASI unit level data.
Annexure 3 depicts each and every fuel variant considered for the emission estimates. ASI allows industries to report ‘biomass’ within the ‘other fuel’ category, unless they choose to specify its reporting in the major fuel categories. Any use of biomass is considered to be commercial in nature and hence carbon-neutral due to offsetting properties. All the ‘material transit’ related fuel is considered beyond the scope of industry reporting, as it shall be considered elsewhere as per the IPCC guidelines.
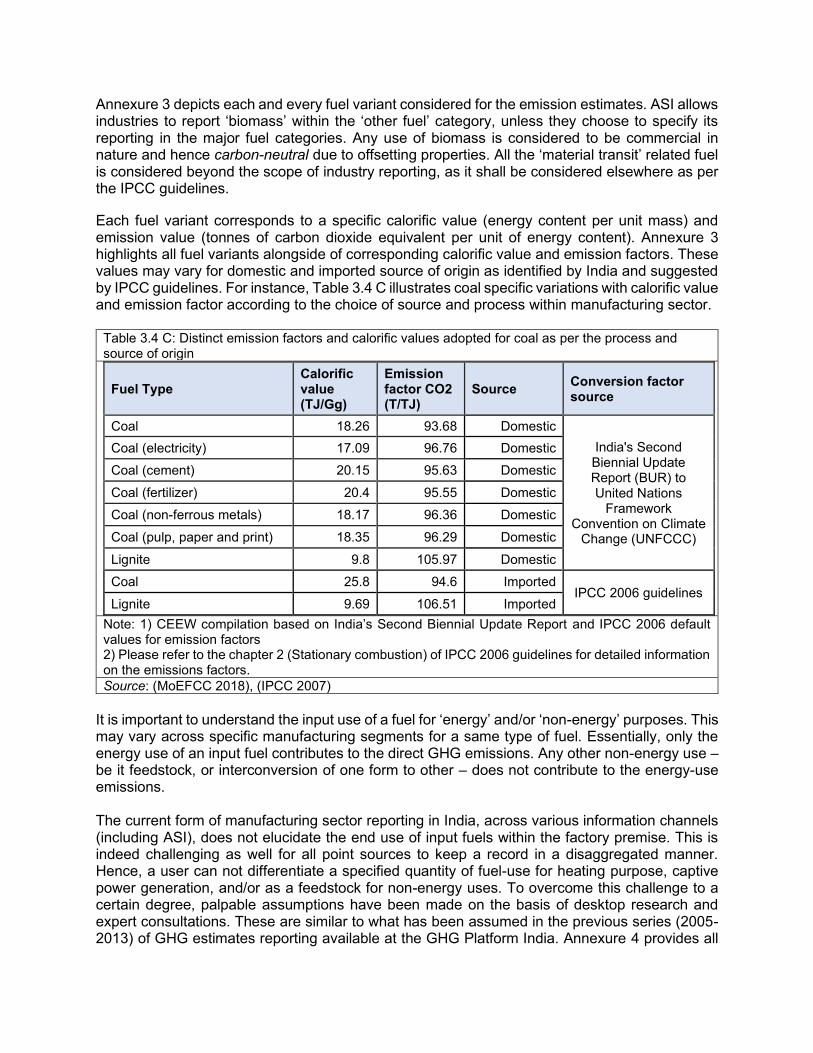
Each fuel variant corresponds to a specific calorific value (energy content per unit mass) and emission value (tonnes of carbon dioxide equivalent per unit of energy content). Annexure 3 highlights all fuel variants alongside of corresponding calorific value and emission factors. These values may vary for domestic and imported source of origin as identified by India and suggested by IPCC guidelines. For instance, Table 3.4 C illustrates coal specific variations with calorific value and emission factor according to the choice of source and process within manufacturing sector.
Table 3.4 C: Distinct emission factors and calorific values adopted for coal as per the process and source of origin
Fuel Type Calorific value (TJ/Gg)
Emission factor CO2 (T/TJ)
Source Conversion factor source
Coal 18.26 93.68 Domestic
India's Second Biennial Update Report (BUR) to United Nations
Framework Convention on Climate
Change (UNFCCC)
Coal (electricity) 17.09 96.76 Domestic
Coal (cement) 20.15 95.63 Domestic
Coal (fertilizer) 20.4 95.55 Domestic
Coal (non-ferrous metals) 18.17 96.36 Domestic
Coal (pulp, paper and print) 18.35 96.29 Domestic
Lignite 9.8 105.97 Domestic
Coal 25.8 94.6 Imported IPCC 2006 guidelines
Lignite 9.69 106.51 Imported
Note: 1) CEEW compilation based on India’s Second Biennial Update Report and IPCC 2006 default values for emission factors 2) Please refer to the chapter 2 (Stationary combustion) of IPCC 2006 guidelines for detailed information on the emissions factors.
Source: (MoEFCC 2018), (IPCC 2007)
It is important to understand the input use of a fuel for ‘energy’ and/or ‘non-energy’ purposes. This may vary across specific manufacturing segments for a same type of fuel. Essentially, only the energy use of an input fuel contributes to the direct GHG emissions. Any other non-energy use – be it feedstock, or interconversion of one form to other – does not contribute to the energy-use emissions. The current form of manufacturing sector reporting in India, across various information channels (including ASI), does not elucidate the end use of input fuels within the factory premise. This is indeed challenging as well for all point sources to keep a record in a disaggregated manner. Hence, a user can not differentiate a specified quantity of fuel-use for heating purpose, captive power generation, and/or as a feedstock for non-energy uses. To overcome this challenge to a certain degree, palpable assumptions have been made on the basis of desktop research and expert consultations. These are similar to what has been assumed in the previous series (2005-2013) of GHG estimates reporting available at the GHG Platform India. Annexure 4 provides all
such assumptions on non-energy use of input fuels adopted for certain manufacturing activities. For example: a) Coal transformation into coking coal, especially within coke manufacturing units of integrated
steel plants, is considered as a non-energy practice to avoid under-estimation or over-estimation of emissions within the manufacturing operation. In such event, emissions are directly attributed to use of secondary forms (coke) by manufacturing units, and any sale of coke outside the premises has been deducted from the emissions accounting.
b) Similarly, transformation of crude oil into refined petroleum products has not been considered
for emissions, except for ‘energy used’ to carry out such activity. This is to avoid double-
accounting of liquid fuel emissions from refined products and to ensure appropriate
distribution of emissions into diverse manufacturing sub-sectors.
c) Natural gas and/or naphtha is notably known for its non-energy use in fertilizer manufacturing (for urea manufacturing). Hence no emissions considered from such use.
d) Certain manufacturing products use forms of fuel as an ingredient for its physical and chemical
properties, hence does not necessarily results in emissions due to combustion. For instance, kerosene is used as solvent by paints, dying and varnishing industries. Any such kind of fuel consumption is treated as a feedstock and hence dropped from energy-use and emission accounting.
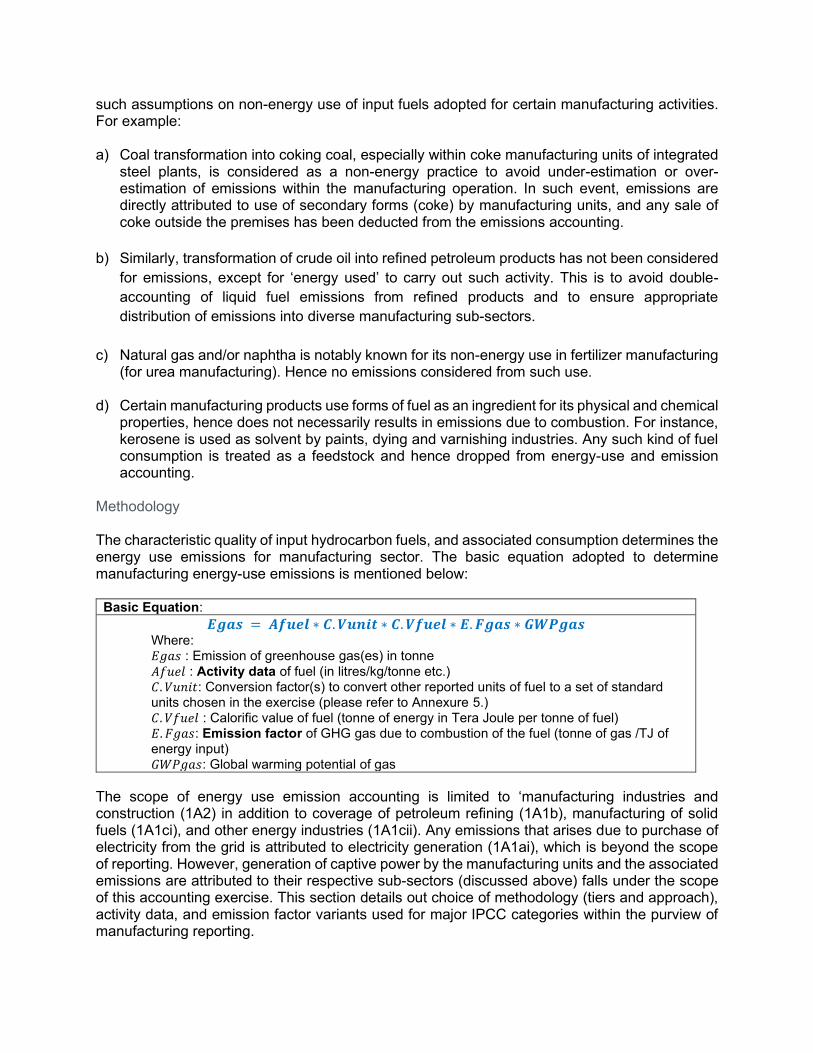
Methodology The characteristic quality of input hydrocarbon fuels, and associated consumption determines the energy use emissions for manufacturing sector. The basic equation adopted to determine manufacturing energy-use emissions is mentioned below:
Basic Equation:
𝑬𝒈𝒂𝒔 = 𝑨𝒇𝒖𝒆𝒍 ∗ 𝑪. 𝑽𝒖𝒏𝒊𝒕 ∗ 𝑪. 𝑽𝒇𝒖𝒆𝒍 ∗ 𝑬. 𝑭𝒈𝒂𝒔 ∗ 𝑮𝑾𝑷𝒈𝒂𝒔 Where: 𝐸𝑔𝑎𝑠 : Emission of greenhouse gas(es) in tonne
𝐴𝑓𝑢𝑒𝑙 : Activity data of fuel (in litres/kg/tonne etc.) 𝐶. 𝑉𝑢𝑛𝑖𝑡: Conversion factor(s) to convert other reported units of fuel to a set of standard units chosen in the exercise (please refer to Annexure 5.) 𝐶. 𝑉𝑓𝑢𝑒𝑙 : Calorific value of fuel (tonne of energy in Tera Joule per tonne of fuel) 𝐸. 𝐹𝑔𝑎𝑠: Emission factor of GHG gas due to combustion of the fuel (tonne of gas /TJ of energy input) 𝐺𝑊𝑃𝑔𝑎𝑠: Global warming potential of gas
The scope of energy use emission accounting is limited to ‘manufacturing industries and construction (1A2) in addition to coverage of petroleum refining (1A1b), manufacturing of solid fuels (1A1ci), and other energy industries (1A1cii). Any emissions that arises due to purchase of electricity from the grid is attributed to electricity generation (1A1ai), which is beyond the scope of reporting. However, generation of captive power by the manufacturing units and the associated emissions are attributed to their respective sub-sectors (discussed above) falls under the scope of this accounting exercise. This section details out choice of methodology (tiers and approach), activity data, and emission factor variants used for major IPCC categories within the purview of manufacturing reporting.
Manufacturing industries and construction (IPCC 1A2) This category further includes almost the entire range of manufacturing activities, as highlighted in Error! Reference source not found. (from 1A2a to 1A2m). ASI is the prime source of activity data for each of the sub-category where the fuel-use information is available at the unit level (Tier-3). However, emission factors for the input fuels represents national average for the major fuel, measured and updated by India for domestic sources. All the imported fuel types reflect IPCC default emission factor values. Hence, the study reports emissions at Tier 2 level for this category.
Petroleum refining (IPCC 1A1b) The choice of methodology for this sector is Tier-2 using both country specific and default calorific values and emission factors of fuels consumed. There is a paucity of quality information on activity data from petroleum refineries. The Ministry of Petroleum and Natural Gas (MoPNG) provides total energy consumption by the refinery enterprises (at sub-national level), without any clarity on various fuel types associated as energy inputs. Assuming that most refineries operate with similar basket of fuels for crude transformation, fuel-wise activity data from Indian Oil Corporation Limited (IOCL) is extrapolated for the entire sector, which has remained constant over time. Country specific emission factors were used for specific fuel-types (wherever available), while default values were used for the others. Manufacturing of solid fuels (IPCC 1A1ci) This category involves reporting of emissions that arises from conversion of coal into coke, barring non-energy use of coal for this transformation process. Steel sector is the biggest consumer of coke as a reducing agent as well as source of energy in its blast furnaces. Hence, majority of coke production is integrated within steel units, which is difficult to separate out for reporting purpose. Thus, a major share of emissions from this category is included within manufacturing of steel (IPCC 1A2a), while the standalone coke manufacturing plants have been reported for their limited share in total emissions. It follows Tier 2 level of reporting. Other energy industries (1A1cii) This category involves a wide range of activities. In this methodology note, scope is limited to upstream oil and gas extraction activities alongside of emissions from coal mining activities. Consumption of diesel constitute activity data for coal mining activities, which is derived on the basis of ‘specific consumption statistics (diesel per unit of coal produced) made available by Central Coalfields Limited (CCL) for its operations. Total emissions in terms of CO2 equivalent (CO2e) are reported at Tier 2 level with country specific emission factors (wherever reportedly available from public sources).
Proxies, assumptions and correction measures 1. Unspecified fuel reporting in ASI
Several manufacturing units report a sizable amount of fuel-use only in terms of expenditure, not as quantity. In certain cases, manufacturing units provide only a generic description of fuel (as solid, liquid, gaseous) instead of specific form or distillate. This poses considerable challenges in arriving representative calorific value and emission factors for such reporting, especially with liquid fuels where the emission factor ranges between 63.1 Tonnes CO2/TJ to as high as 107 Tonnes CO2/TJ.
Measures adopted
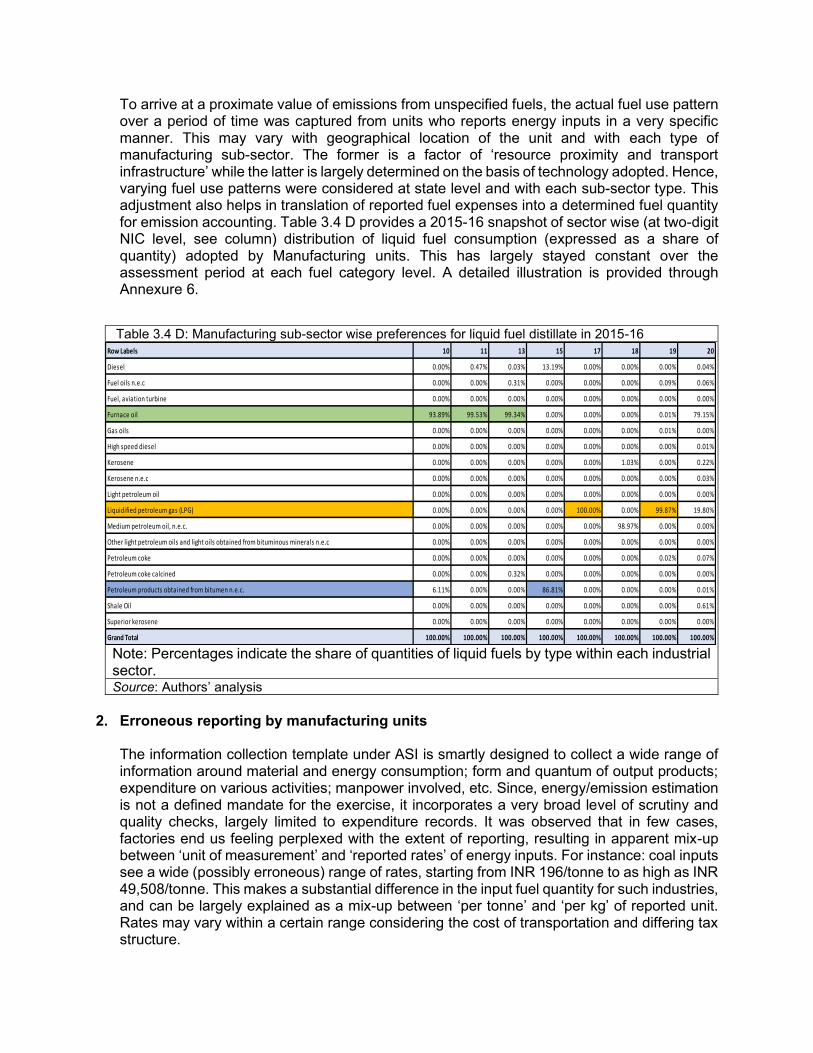
To arrive at a proximate value of emissions from unspecified fuels, the actual fuel use pattern over a period of time was captured from units who reports energy inputs in a very specific manner. This may vary with geographical location of the unit and with each type of manufacturing sub-sector. The former is a factor of ‘resource proximity and transport infrastructure’ while the latter is largely determined on the basis of technology adopted. Hence, varying fuel use patterns were considered at state level and with each sub-sector type. This adjustment also helps in translation of reported fuel expenses into a determined fuel quantity for emission accounting. Table 3.4 D provides a 2015-16 snapshot of sector wise (at two-digit NIC level, see column) distribution of liquid fuel consumption (expressed as a share of quantity) adopted by Manufacturing units. This has largely stayed constant over the assessment period at each fuel category level. A detailed illustration is provided through Annexure 6.
Table 3.4 D: Manufacturing sub-sector wise preferences for liquid fuel distillate in 2015-16
Note: Percentages indicate the share of quantities of liquid fuels by type within each industrial sector. Source: Authors’ analysis
2. Erroneous reporting by manufacturing units
The information collection template under ASI is smartly designed to collect a wide range of information around material and energy consumption; form and quantum of output products; expenditure on various activities; manpower involved, etc. Since, energy/emission estimation is not a defined mandate for the exercise, it incorporates a very broad level of scrutiny and quality checks, largely limited to expenditure records. It was observed that in few cases, factories end us feeling perplexed with the extent of reporting, resulting in apparent mix-up between ‘unit of measurement’ and ‘reported rates’ of energy inputs. For instance: coal inputs see a wide (possibly erroneous) range of rates, starting from INR 196/tonne to as high as INR 49,508/tonne. This makes a substantial difference in the input fuel quantity for such industries, and can be largely explained as a mix-up between ‘per tonne’ and ‘per kg’ of reported unit. Rates may vary within a certain range considering the cost of transportation and differing tax structure.
Row Labels 10 11 13 15 17 18 19 20
Diesel 0.00% 0.47% 0.03% 13.19% 0.00% 0.00% 0.00% 0.04%
Fuel oils n.e.c 0.00% 0.00% 0.31% 0.00% 0.00% 0.00% 0.09% 0.06%
Fuel, aviation turbine 0.00% 0.00% 0.00% 0.00% 0.00% 0.00% 0.00% 0.00%
Furnace oil 93.89% 99.53% 99.34% 0.00% 0.00% 0.00% 0.01% 79.15%
Gas oils 0.00% 0.00% 0.00% 0.00% 0.00% 0.00% 0.01% 0.00%
High speed diesel 0.00% 0.00% 0.00% 0.00% 0.00% 0.00% 0.00% 0.01%
Kerosene 0.00% 0.00% 0.00% 0.00% 0.00% 1.03% 0.00% 0.22%
Kerosene n.e.c 0.00% 0.00% 0.00% 0.00% 0.00% 0.00% 0.00% 0.03%
Light petroleum oil 0.00% 0.00% 0.00% 0.00% 0.00% 0.00% 0.00% 0.00%
Liquidified petroleum gas (LPG) 0.00% 0.00% 0.00% 0.00% 100.00% 0.00% 99.87% 19.80%
Medium petroleum oil, n.e.c. 0.00% 0.00% 0.00% 0.00% 0.00% 98.97% 0.00% 0.00%
Other light petroleum oils and light oils obtained from bituminous minerals n.e.c 0.00% 0.00% 0.00% 0.00% 0.00% 0.00% 0.00% 0.00%
Petroleum coke 0.00% 0.00% 0.00% 0.00% 0.00% 0.00% 0.02% 0.07%
Petroleum coke calcined 0.00% 0.00% 0.32% 0.00% 0.00% 0.00% 0.00% 0.00%
Petroleum products obtained from bitumen n.e.c. 6.11% 0.00% 0.00% 86.81% 0.00% 0.00% 0.00% 0.01%
Shale Oil 0.00% 0.00% 0.00% 0.00% 0.00% 0.00% 0.00% 0.61%
Superior kerosene 0.00% 0.00% 0.00% 0.00% 0.00% 0.00% 0.00% 0.00%
Grand Total 100.00% 100.00% 100.00% 100.00% 100.00% 100.00% 100.00% 100.00%
Measures adopted
• As a primary step, different units of measurement (UoM) adopted by certain factories has been standardized to a common UoM for each fuel type across industries over the assessment period.
• Factories which are common over a period of time, mostly the bigger operations, and are consistent with reported rates and UoMs have been considered to arrive at a median rate for each fuel type. These median rates are further used to define permissible bounds for the outlier values when the entire dataset is analysed. Common factories within two different time frames (2004-05 to 2009-10, and, 2010-11 to 2015-16) were considered for defining median rates to ensure any new additions, closure or expansion of manufacturing activities.
• To mimic the heterogeneity with manufacturing process across the country, median rates were defined considering three distinct layers: (a) median rates at a sector level; (b) median rates at state level; and, (c) median rates at the national level. The choice of defining bounds is suitably made after considering adequate number of representative industries within each state.
• A generous variation of 50% (in either side) is allowed between the reported rate and the representative median value for each fuel type as a scrutiny measure. This is to accommodate higher costs incurred on transporting fuels for certain geographic locations.
3.4.3 Recalculation
GHG Platform India adopts a process of publishing independent and most recent inventory estimates for each economic sector on a periodic basis. It is natural that any such effort undergoes systemic changes over time due to improvements in capacity of information providers and assessors; data quality and availability; methodological change; refinement in assumptions, etc. All such changes are important and brings accuracy with the estimates. In order to draw trends for measuring improvements over time, it is necessary that user follows similar (preferably most recent) approach for the entire time-series to ensure comparability and completeness. IPCC recommends ‘Recalculation’ of emission estimates through its good practice guidelines for such purpose. In case of energy use emissions, this version follows a few advancements with methodology and assumptions, as described below: Revision of calorific values and emissions factors In December 2018, MoEFCC issued an update on country specific emission factor for selected fuels and key processes through its second BUR (please refer to Table 3.4 C). Hence, the present analysis (2005 – 2015 series) is based on updated emission factors including recalculation for previous years. Inclusion of emissions from captive power generation In this series, emissions attributed to captive power generation (within manufacturing sector) are being reported alongside manufacturing emissions. This is a significant improvement in the methodology as it follows IPCC guidelines for auto-producers. In the previous series, captive emissions were part of ‘electricity sector emissions,’ which is now being shifted rightfully to manufacturing sector reporting. Hence, appropriate recalculation has been performed for the previous estimates as well.
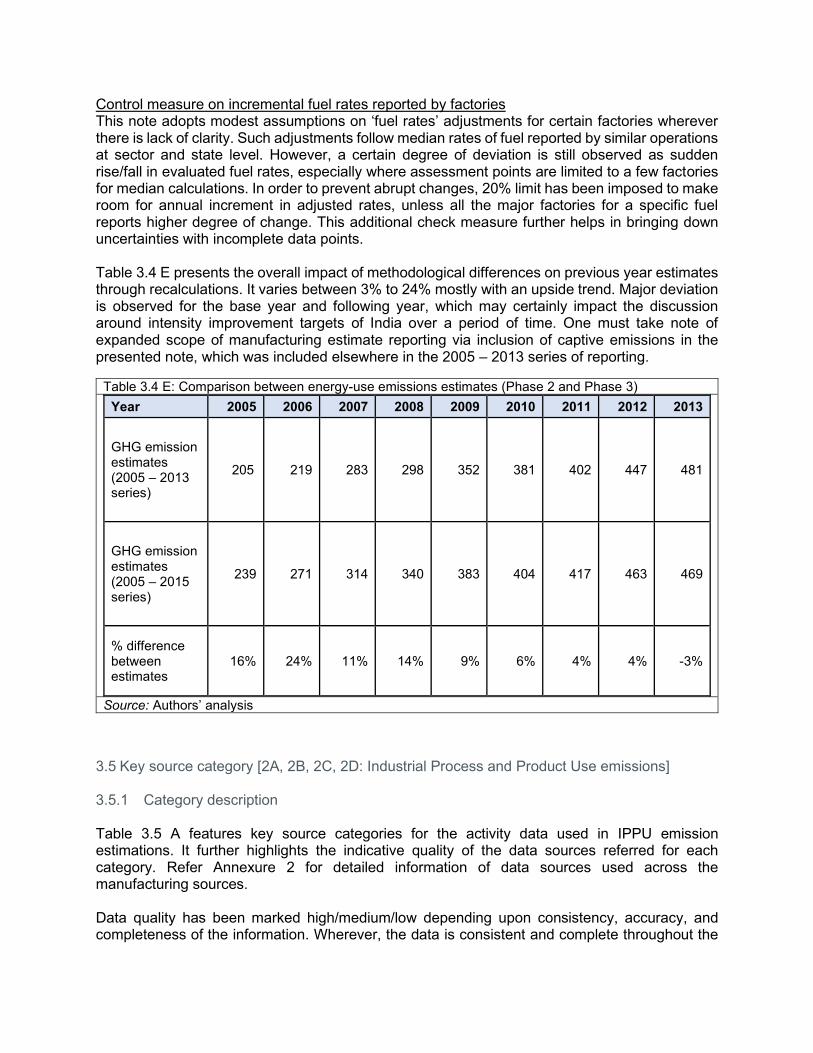
Control measure on incremental fuel rates reported by factories This note adopts modest assumptions on ‘fuel rates’ adjustments for certain factories wherever there is lack of clarity. Such adjustments follow median rates of fuel reported by similar operations at sector and state level. However, a certain degree of deviation is still observed as sudden rise/fall in evaluated fuel rates, especially where assessment points are limited to a few factories for median calculations. In order to prevent abrupt changes, 20% limit has been imposed to make room for annual increment in adjusted rates, unless all the major factories for a specific fuel reports higher degree of change. This additional check measure further helps in bringing down uncertainties with incomplete data points. Table 3.4 E presents the overall impact of methodological differences on previous year estimates through recalculations. It varies between 3% to 24% mostly with an upside trend. Major deviation is observed for the base year and following year, which may certainly impact the discussion around intensity improvement targets of India over a period of time. One must take note of expanded scope of manufacturing estimate reporting via inclusion of captive emissions in the presented note, which was included elsewhere in the 2005 – 2013 series of reporting.
Table 3.4 E: Comparison between energy-use emissions estimates (Phase 2 and Phase 3)
Year 2005 2006 2007 2008 2009 2010 2011 2012 2013
GHG emission estimates (2005 – 2013 series)
205 219 283 298 352 381 402 447 481
GHG emission estimates (2005 – 2015 series)
239 271 314 340 383 404 417 463 469
% difference between estimates
16% 24% 11% 14% 9% 6% 4% 4% -3%
Source: Authors’ analysis
3.5 Key source category [2A, 2B, 2C, 2D: Industrial Process and Product Use emissions] 3.5.1 Category description Table 3.5 A features key source categories for the activity data used in IPPU emission estimations. It further highlights the indicative quality of the data sources referred for each category. Refer Annexure 2 for detailed information of data sources used across the manufacturing sources. Data quality has been marked high/medium/low depending upon consistency, accuracy, and completeness of the information. Wherever, the data is consistent and complete throughout the
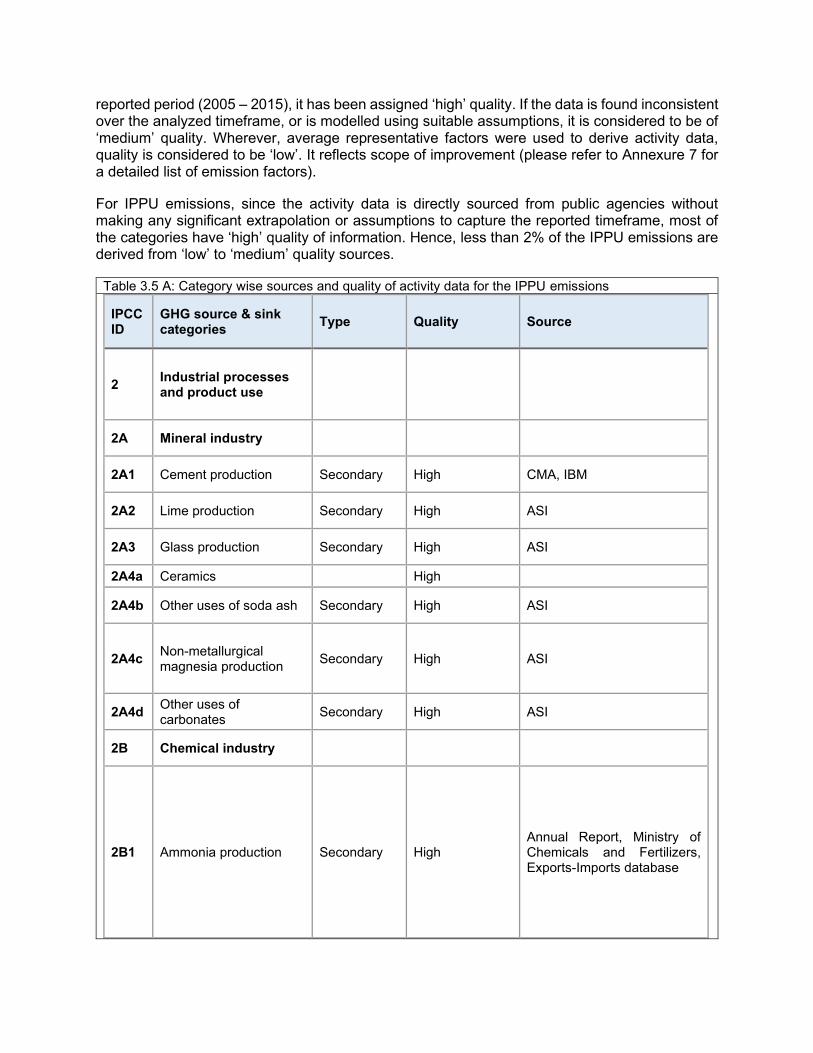
reported period (2005 – 2015), it has been assigned ‘high’ quality. If the data is found inconsistent over the analyzed timeframe, or is modelled using suitable assumptions, it is considered to be of ‘medium’ quality. Wherever, average representative factors were used to derive activity data, quality is considered to be ‘low’. It reflects scope of improvement (please refer to Annexure 7 for a detailed list of emission factors).
For IPPU emissions, since the activity data is directly sourced from public agencies without making any significant extrapolation or assumptions to capture the reported timeframe, most of the categories have ‘high’ quality of information. Hence, less than 2% of the IPPU emissions are derived from ‘low’ to ‘medium’ quality sources.
Table 3.5 A: Category wise sources and quality of activity data for the IPPU emissions
IPCC ID
GHG source & sink categories
Type Quality Source
2 Industrial processes and product use
2A Mineral industry
2A1 Cement production Secondary High CMA, IBM
2A2 Lime production Secondary High ASI
2A3 Glass production Secondary High ASI
2A4a Ceramics High
2A4b Other uses of soda ash Secondary High ASI
2A4c Non-metallurgical magnesia production
Secondary High ASI
2A4d Other uses of carbonates
Secondary High ASI
2B Chemical industry
2B1 Ammonia production Secondary High Annual Report, Ministry of Chemicals and Fertilizers, Exports-Imports database
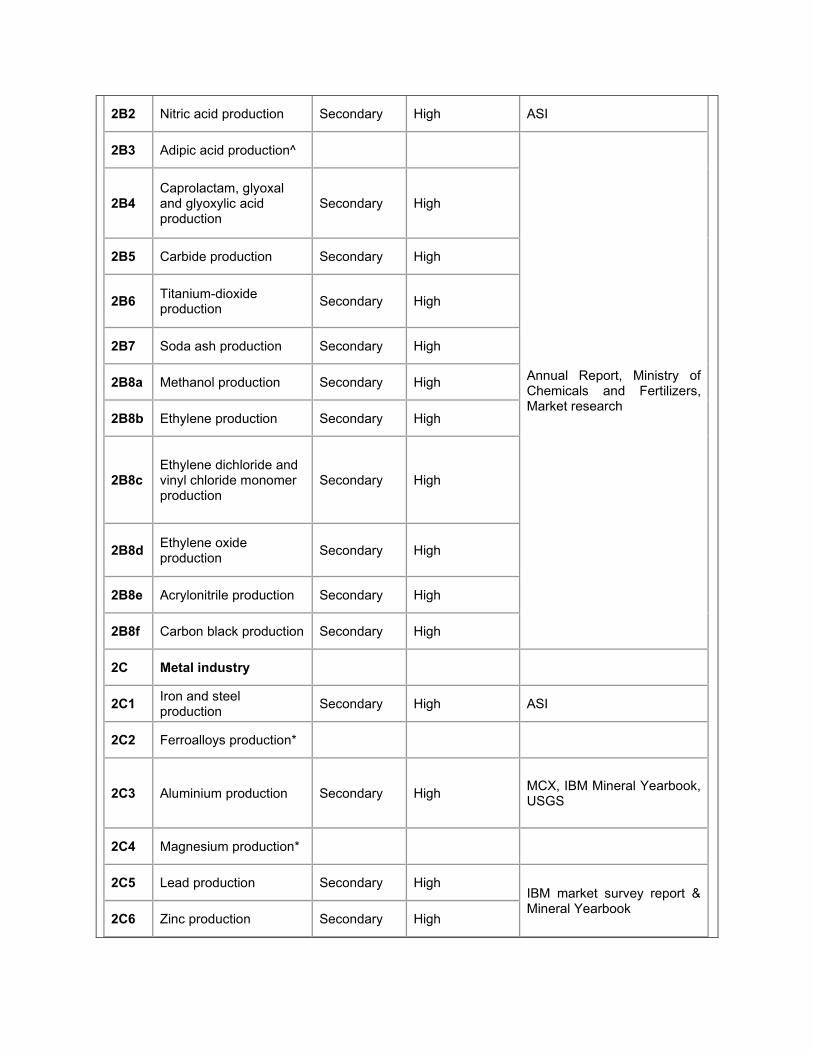
2B2 Nitric acid production Secondary High ASI
2B3 Adipic acid production^
Annual Report, Ministry of Chemicals and Fertilizers, Market research
2B4 Caprolactam, glyoxal and glyoxylic acid production
Secondary High
2B5 Carbide production Secondary High
2B6 Titanium-dioxide production
Secondary High
2B7 Soda ash production Secondary High
2B8a Methanol production Secondary High
2B8b Ethylene production Secondary High
2B8c Ethylene dichloride and vinyl chloride monomer production
Secondary High
2B8d Ethylene oxide production
Secondary High
2B8e Acrylonitrile production Secondary High
2B8f Carbon black production Secondary High
2C Metal industry
2C1 Iron and steel production
Secondary High ASI
2C2 Ferroalloys production*
2C3 Aluminium production Secondary High MCX, IBM Mineral Yearbook, USGS
2C4 Magnesium production*
2C5 Lead production Secondary High IBM market survey report & Mineral Yearbook
2C6 Zinc production Secondary High
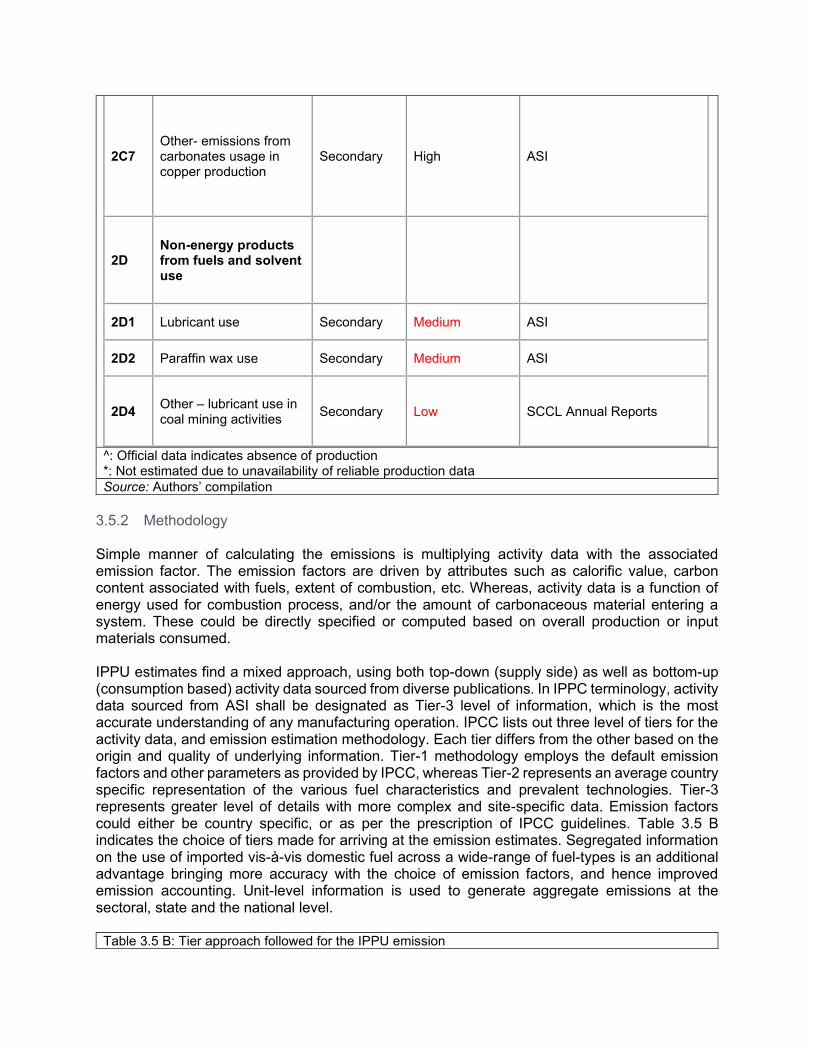
2C7 Other- emissions from carbonates usage in copper production
Secondary High ASI
2D Non-energy products from fuels and solvent use
2D1 Lubricant use Secondary Medium ASI
2D2 Paraffin wax use Secondary Medium ASI
2D4 Other – lubricant use in coal mining activities
Secondary Low SCCL Annual Reports
^: Official data indicates absence of production *: Not estimated due to unavailability of reliable production data
Source: Authors’ compilation
3.5.2 Methodology Simple manner of calculating the emissions is multiplying activity data with the associated emission factor. The emission factors are driven by attributes such as calorific value, carbon content associated with fuels, extent of combustion, etc. Whereas, activity data is a function of energy used for combustion process, and/or the amount of carbonaceous material entering a system. These could be directly specified or computed based on overall production or input materials consumed. IPPU estimates find a mixed approach, using both top-down (supply side) as well as bottom-up (consumption based) activity data sourced from diverse publications. In IPPC terminology, activity data sourced from ASI shall be designated as Tier-3 level of information, which is the most accurate understanding of any manufacturing operation. IPCC lists out three level of tiers for the activity data, and emission estimation methodology. Each tier differs from the other based on the origin and quality of underlying information. Tier-1 methodology employs the default emission factors and other parameters as provided by IPCC, whereas Tier-2 represents an average country specific representation of the various fuel characteristics and prevalent technologies. Tier-3 represents greater level of details with more complex and site-specific data. Emission factors could either be country specific, or as per the prescription of IPCC guidelines. Table 3.5 B indicates the choice of tiers made for arriving at the emission estimates. Segregated information on the use of imported vis-à-vis domestic fuel across a wide-range of fuel-types is an additional advantage bringing more accuracy with the choice of emission factors, and hence improved emission accounting. Unit-level information is used to generate aggregate emissions at the sectoral, state and the national level.
Table 3.5 B: Tier approach followed for the IPPU emission
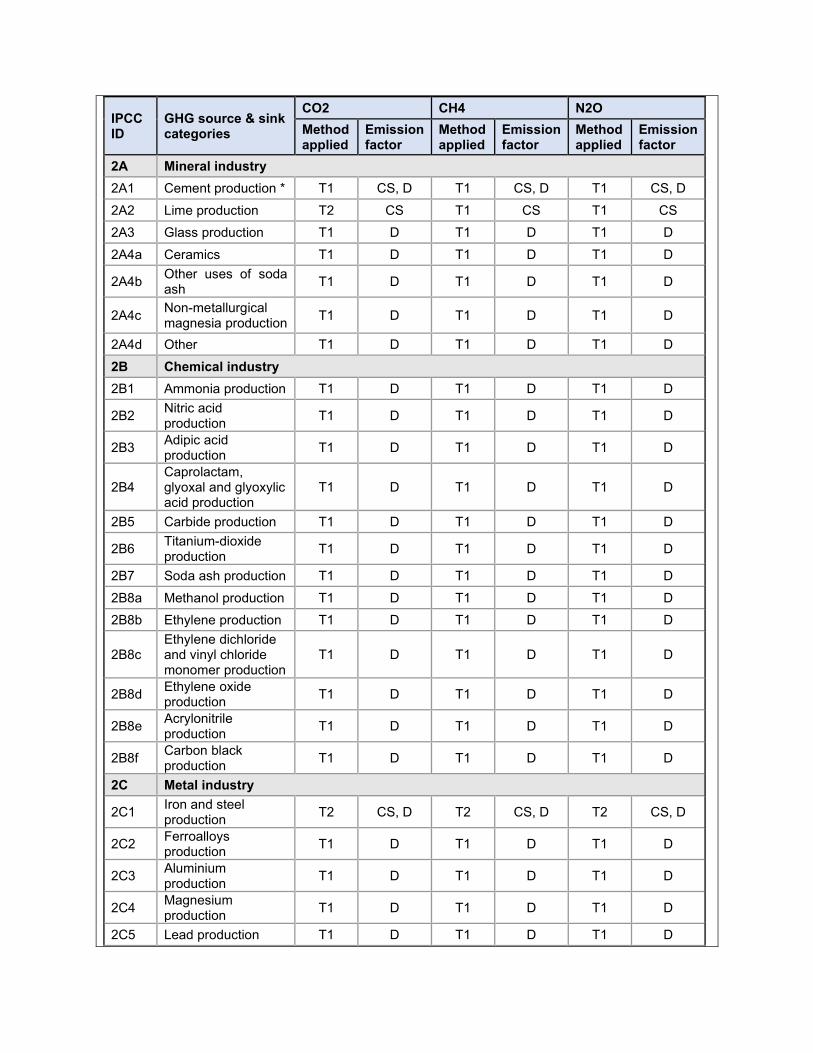
IPCC ID
GHG source & sink categories
CO2 CH4 N2O
Method applied
Emission factor
Method applied
Emission factor
Method applied
Emission factor
2A Mineral industry
2A1 Cement production * T1 CS, D T1 CS, D T1 CS, D
2A2 Lime production T2 CS T1 CS T1 CS
2A3 Glass production T1 D T1 D T1 D
2A4a Ceramics T1 D T1 D T1 D
2A4b Other uses of soda ash
T1 D T1 D T1 D
2A4c Non-metallurgical magnesia production
T1 D T1 D T1 D
2A4d Other T1 D T1 D T1 D
2B Chemical industry
2B1 Ammonia production T1 D T1 D T1 D
2B2 Nitric acid production
T1 D T1 D T1 D
2B3 Adipic acid production
T1 D T1 D T1 D
2B4 Caprolactam, glyoxal and glyoxylic acid production
T1 D T1 D T1 D
2B5 Carbide production T1 D T1 D T1 D
2B6 Titanium-dioxide production
T1 D T1 D T1 D
2B7 Soda ash production T1 D T1 D T1 D
2B8a Methanol production T1 D T1 D T1 D
2B8b Ethylene production T1 D T1 D T1 D
2B8c Ethylene dichloride and vinyl chloride monomer production
T1 D T1 D T1 D
2B8d Ethylene oxide production
T1 D T1 D T1 D
2B8e Acrylonitrile production
T1 D T1 D T1 D
2B8f Carbon black production
T1 D T1 D T1 D
2C Metal industry
2C1 Iron and steel production
T2 CS, D T2 CS, D T2 CS, D
2C2 Ferroalloys production
T1 D T1 D T1 D
2C3 Aluminium production
T1 D T1 D T1 D
2C4 Magnesium production
T1 D T1 D T1 D
2C5 Lead production T1 D T1 D T1 D
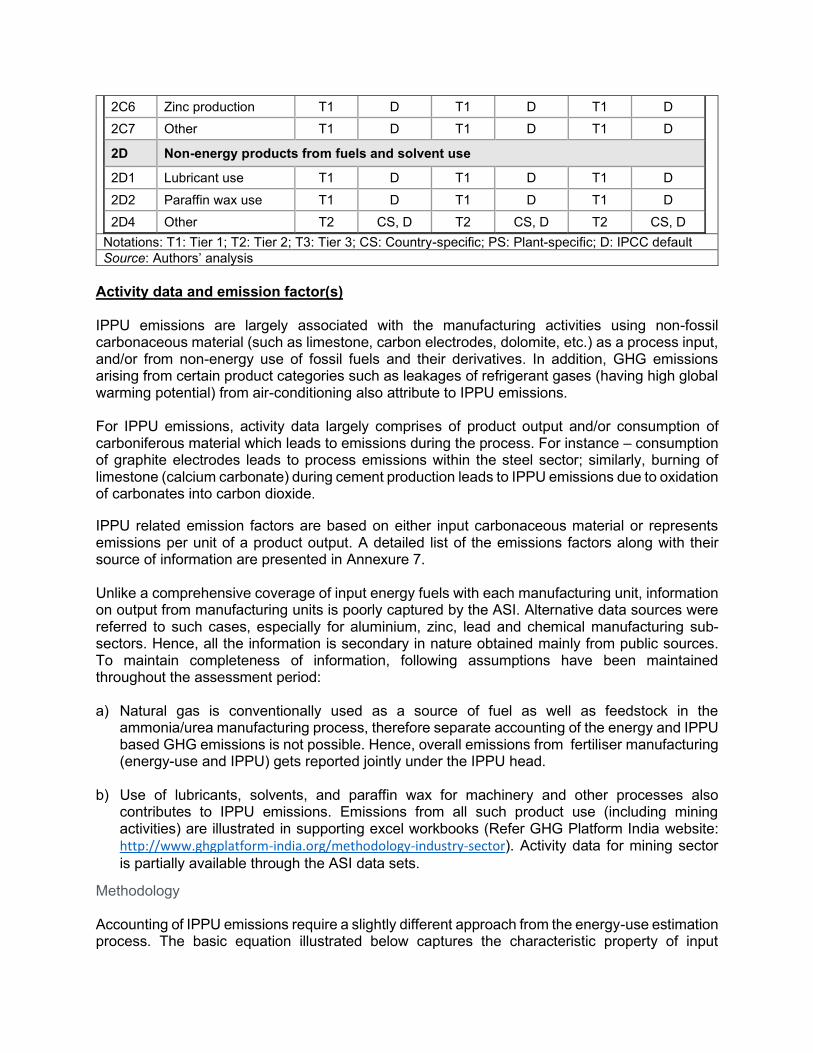
2C6 Zinc production T1 D T1 D T1 D
2C7 Other T1 D T1 D T1 D
2D Non-energy products from fuels and solvent use
2D1 Lubricant use T1 D T1 D T1 D
2D2 Paraffin wax use T1 D T1 D T1 D
2D4 Other T2 CS, D T2 CS, D T2 CS, D
Notations: T1: Tier 1; T2: Tier 2; T3: Tier 3; CS: Country-specific; PS: Plant-specific; D: IPCC default
Source: Authors’ analysis
Activity data and emission factor(s) IPPU emissions are largely associated with the manufacturing activities using non-fossil carbonaceous material (such as limestone, carbon electrodes, dolomite, etc.) as a process input, and/or from non-energy use of fossil fuels and their derivatives. In addition, GHG emissions arising from certain product categories such as leakages of refrigerant gases (having high global warming potential) from air-conditioning also attribute to IPPU emissions. For IPPU emissions, activity data largely comprises of product output and/or consumption of carboniferous material which leads to emissions during the process. For instance – consumption of graphite electrodes leads to process emissions within the steel sector; similarly, burning of limestone (calcium carbonate) during cement production leads to IPPU emissions due to oxidation of carbonates into carbon dioxide.
IPPU related emission factors are based on either input carbonaceous material or represents emissions per unit of a product output. A detailed list of the emissions factors along with their source of information are presented in Annexure 7. Unlike a comprehensive coverage of input energy fuels with each manufacturing unit, information on output from manufacturing units is poorly captured by the ASI. Alternative data sources were referred to such cases, especially for aluminium, zinc, lead and chemical manufacturing sub-sectors. Hence, all the information is secondary in nature obtained mainly from public sources. To maintain completeness of information, following assumptions have been maintained throughout the assessment period: a) Natural gas is conventionally used as a source of fuel as well as feedstock in the
ammonia/urea manufacturing process, therefore separate accounting of the energy and IPPU based GHG emissions is not possible. Hence, overall emissions from fertiliser manufacturing (energy-use and IPPU) gets reported jointly under the IPPU head.
b) Use of lubricants, solvents, and paraffin wax for machinery and other processes also
contributes to IPPU emissions. Emissions from all such product use (including mining activities) are illustrated in supporting excel workbooks (Refer GHG Platform India website: http://www.ghgplatform-india.org/methodology-industry-sector). Activity data for mining sector
is partially available through the ASI data sets.
Methodology Accounting of IPPU emissions require a slightly different approach from the energy-use estimation process. The basic equation illustrated below captures the characteristic property of input
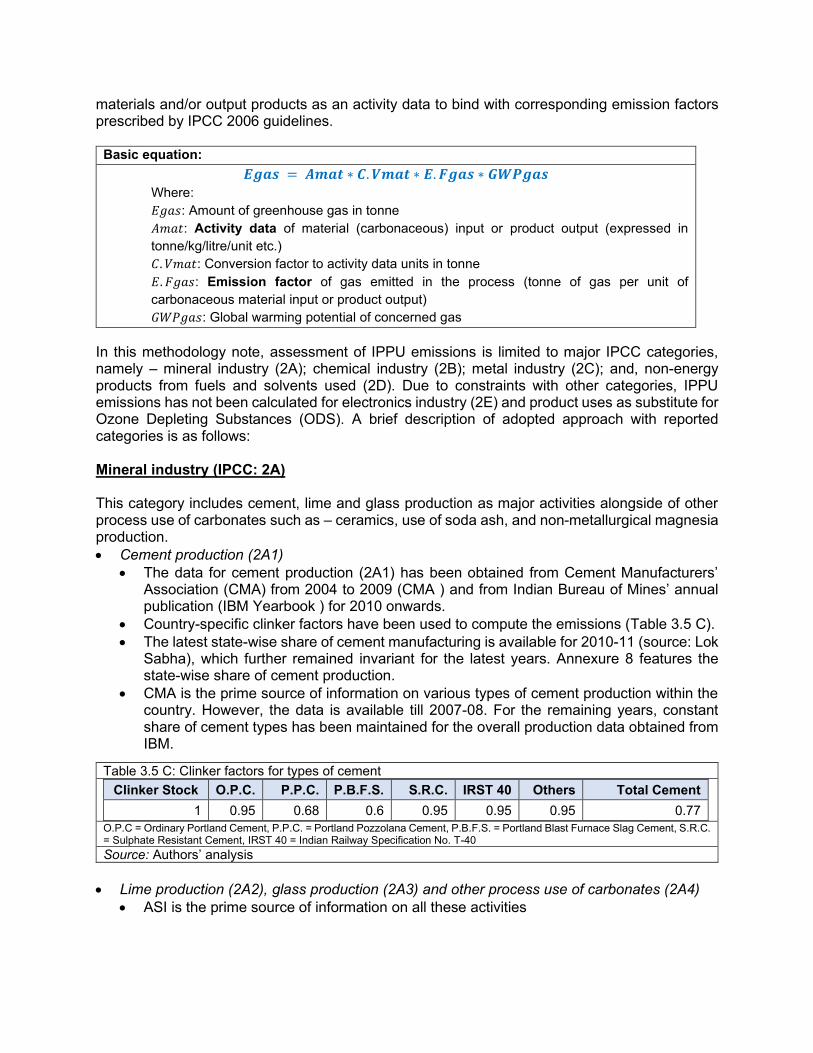
materials and/or output products as an activity data to bind with corresponding emission factors prescribed by IPCC 2006 guidelines.
Basic equation:
𝑬𝒈𝒂𝒔 = 𝑨𝒎𝒂𝒕 ∗ 𝑪. 𝑽𝒎𝒂𝒕 ∗ 𝑬. 𝑭𝒈𝒂𝒔 ∗ 𝑮𝑾𝑷𝒈𝒂𝒔
Where:
𝐸𝑔𝑎𝑠: Amount of greenhouse gas in tonne
𝐴𝑚𝑎𝑡: Activity data of material (carbonaceous) input or product output (expressed in
tonne/kg/litre/unit etc.)
𝐶. 𝑉𝑚𝑎𝑡: Conversion factor to activity data units in tonne
𝐸. 𝐹𝑔𝑎𝑠: Emission factor of gas emitted in the process (tonne of gas per unit of
carbonaceous material input or product output)
𝐺𝑊𝑃𝑔𝑎𝑠: Global warming potential of concerned gas
In this methodology note, assessment of IPPU emissions is limited to major IPCC categories, namely – mineral industry (2A); chemical industry (2B); metal industry (2C); and, non-energy products from fuels and solvents used (2D). Due to constraints with other categories, IPPU emissions has not been calculated for electronics industry (2E) and product uses as substitute for Ozone Depleting Substances (ODS). A brief description of adopted approach with reported categories is as follows: Mineral industry (IPCC: 2A) This category includes cement, lime and glass production as major activities alongside of other process use of carbonates such as – ceramics, use of soda ash, and non-metallurgical magnesia production.
• Cement production (2A1)
• The data for cement production (2A1) has been obtained from Cement Manufacturers’ Association (CMA) from 2004 to 2009 (CMA ) and from Indian Bureau of Mines’ annual publication (IBM Yearbook ) for 2010 onwards.
• Country-specific clinker factors have been used to compute the emissions (Table 3.5 C).
• The latest state-wise share of cement manufacturing is available for 2010-11 (source: Lok Sabha), which further remained invariant for the latest years. Annexure 8 features the state-wise share of cement production.
• CMA is the prime source of information on various types of cement production within the country. However, the data is available till 2007-08. For the remaining years, constant share of cement types has been maintained for the overall production data obtained from IBM.
Table 3.5 C: Clinker factors for types of cement
Clinker Stock O.P.C. P.P.C. P.B.F.S. S.R.C. IRST 40 Others Total Cement
1 0.95 0.68 0.6 0.95 0.95 0.95 0.77
O.P.C = Ordinary Portland Cement, P.P.C. = Portland Pozzolana Cement, P.B.F.S. = Portland Blast Furnace Slag Cement, S.R.C. = Sulphate Resistant Cement, IRST 40 = Indian Railway Specification No. T-40
Source: Authors’ analysis
• Lime production (2A2), glass production (2A3) and other process use of carbonates (2A4)
• ASI is the prime source of information on all these activities
• The Amat for this category is the total production number, the C.Vmat is the conversion factor based on the unit of reporting of the mineral and E.Fgas is the emission factor for the mineral.
Example: In the year 2015-16, certain factories in Andhra Pradesh reported lime production of 29385 tonnes. The conversion factor is 1 and the emission factor is 0.75 tCO2/tonne of product. Hence the emissions CO2 will be multiplication of emission factor with quantity which gives us 22,039 tonnes of CO2 and CO2e (since GWP of CO2 is 1 as per SAR).
• Country-specific emission factor of CO2 is used in case of lime production. The emission factor has been estimated based on stoichiometric equation using the grade as reported by Indian Bureau of Mines (IBM 2016).
• For all the other categories under the sector, default IPCC conversion factors are used for calculation of emissions. A detailed list of emission factors can be found in the Annexure 7.
Chemical industry (2B) This category covers manufacturing of a wide range of chemical products, namely – ammonia, nitric acid, adipic acid, caprolactam, glyoxal, glyoxylic acid, carbide, titanium dioxide, soda ash, petrochemicals, carbon black, etc.
• IPCC default emission factors have been used for all the sub-categories under this category (refer Annexure 7)
• 'Chemical and Petrochemical statistics at a Glance’ released by the Ministry of Chemicals and Fertilizers (Department of Chemicals and Petrochemicals 2019) is the prime source of activity data.
• Export-import database (EXIM database 2019) is used for information on net ammonia imports, whereas domestic information is derived from urea production statistics obtained from the Ministry of Chemicals and Fertilizers.
• The state-wise production of various chemicals has been estimated by using secondary literature, plant level capacity installation data and official reports. A detailed list of all chemicals under this manufacturing category, with their state shares can be found in Annexure 9.
• Information on activity data associated with fluorochemical production is barely available and hence has been kept out of coverage from this report.
Metal industry (2C) This category is mainly represented through the production of iron and steel; ferroalloys; aluminium; magnesium; lead; zinc; etc.
• Tier 2 methodology is adopted for iron and steel due to advantage with country specific emission factors. Rest of the sub-categories follows Tier 1 method by using IPCC default emission factors.
• ASI is the prime source of information on input carbonaceous material within iron and steel and other metal production.
• The data for aluminium (2C3), zinc (2C5) and lead (2C6) production has been taken from IBM data. (IBM 2017)
• The data for aluminium production for the initial years was collected from United States Geological Survey (USGS 2019) and Aluminium MCX India (Aluminium - MCX India 2019)
• The state-wise share of production for aluminium, zinc and lead have been taken from the Indian Bureau of Mines’ Minerals Yearbook, as represented in Annexures 10, 11 and 12.
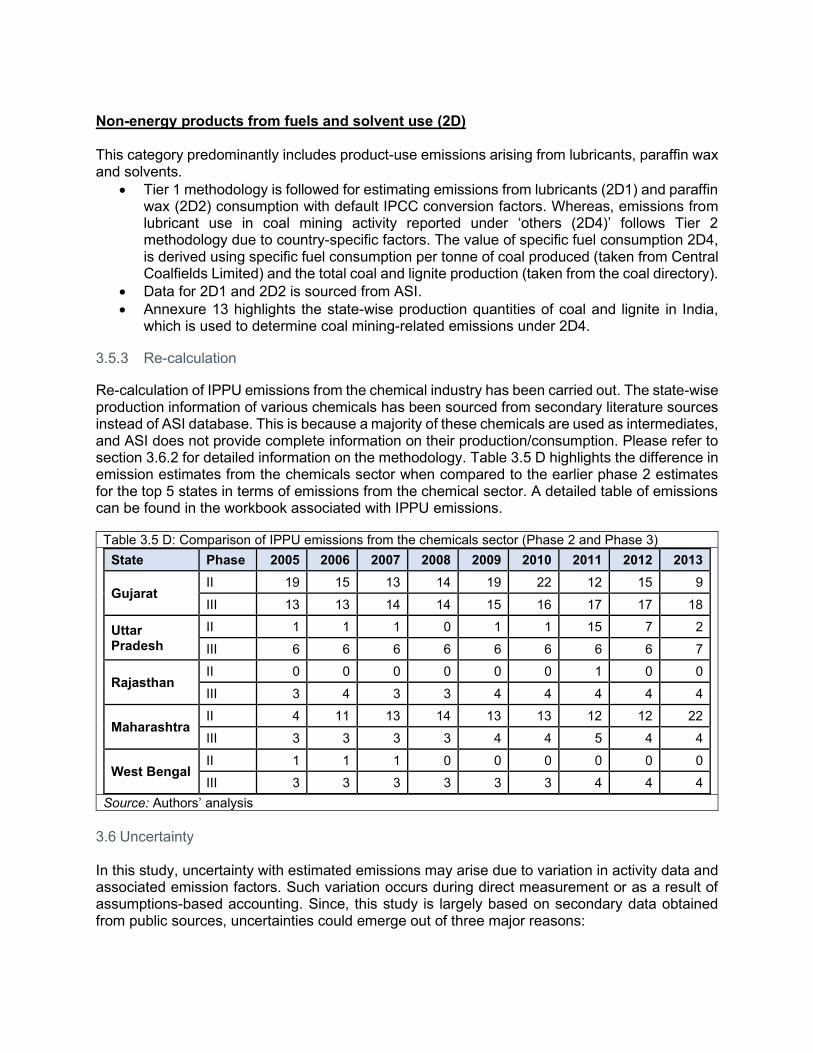
Non-energy products from fuels and solvent use (2D) This category predominantly includes product-use emissions arising from lubricants, paraffin wax and solvents.
• Tier 1 methodology is followed for estimating emissions from lubricants (2D1) and paraffin wax (2D2) consumption with default IPCC conversion factors. Whereas, emissions from lubricant use in coal mining activity reported under ‘others (2D4)’ follows Tier 2 methodology due to country-specific factors. The value of specific fuel consumption 2D4, is derived using specific fuel consumption per tonne of coal produced (taken from Central Coalfields Limited) and the total coal and lignite production (taken from the coal directory).
• Data for 2D1 and 2D2 is sourced from ASI.
• Annexure 13 highlights the state-wise production quantities of coal and lignite in India, which is used to determine coal mining-related emissions under 2D4.
3.5.3 Re-calculation
Re-calculation of IPPU emissions from the chemical industry has been carried out. The state-wise production information of various chemicals has been sourced from secondary literature sources instead of ASI database. This is because a majority of these chemicals are used as intermediates, and ASI does not provide complete information on their production/consumption. Please refer to section 3.6.2 for detailed information on the methodology. Table 3.5 D highlights the difference in emission estimates from the chemicals sector when compared to the earlier phase 2 estimates for the top 5 states in terms of emissions from the chemical sector. A detailed table of emissions can be found in the workbook associated with IPPU emissions.
Table 3.5 D: Comparison of IPPU emissions from the chemicals sector (Phase 2 and Phase 3)
State Phase 2005 2006 2007 2008 2009 2010 2011 2012 2013
Gujarat II 19 15 13 14 19 22 12 15 9
III 13 13 14 14 15 16 17 17 18
Uttar Pradesh
II 1 1 1 0 1 1 15 7 2
III 6 6 6 6 6 6 6 6 7
Rajasthan II 0 0 0 0 0 0 1 0 0
III 3 4 3 3 4 4 4 4 4
Maharashtra II 4 11 13 14 13 13 12 12 22
III 3 3 3 3 4 4 5 4 4
West Bengal II 1 1 1 0 0 0 0 0 0
III 3 3 3 3 3 3 4 4 4
Source: Authors’ analysis
3.6 Uncertainty In this study, uncertainty with estimated emissions may arise due to variation in activity data and associated emission factors. Such variation occurs during direct measurement or as a result of assumptions-based accounting. Since, this study is largely based on secondary data obtained from public sources, uncertainties could emerge out of three major reasons:
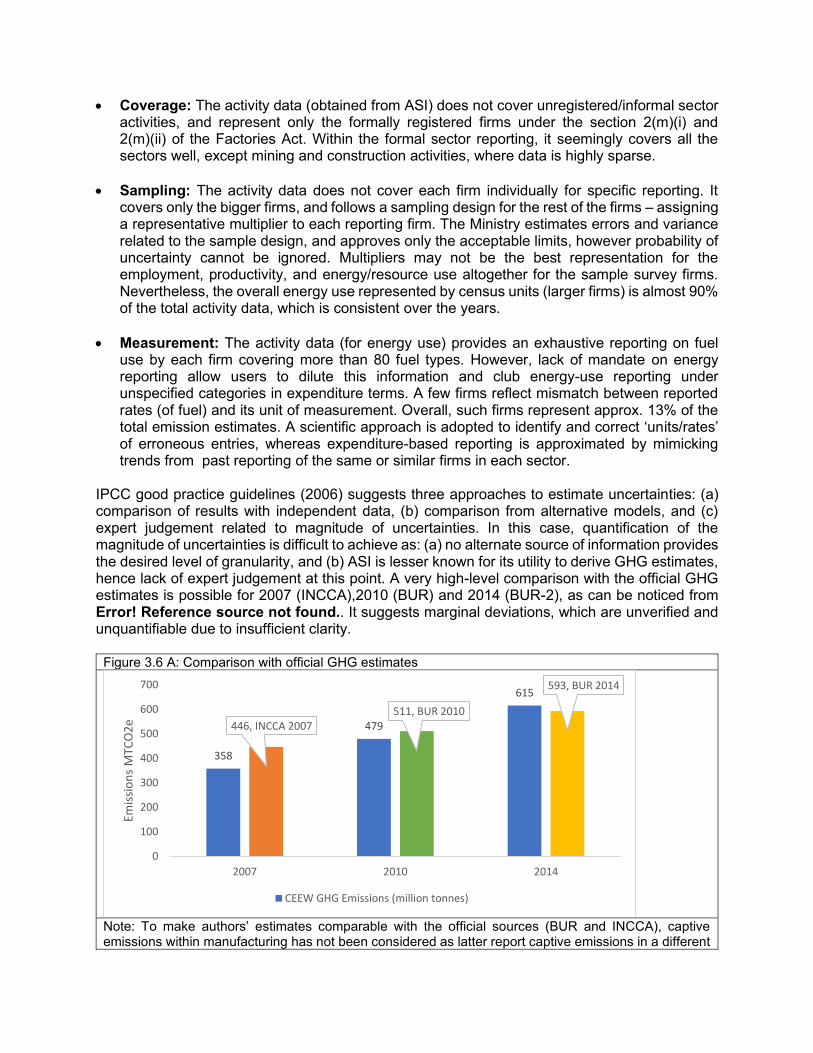
• Coverage: The activity data (obtained from ASI) does not cover unregistered/informal sector activities, and represent only the formally registered firms under the section 2(m)(i) and 2(m)(ii) of the Factories Act. Within the formal sector reporting, it seemingly covers all the sectors well, except mining and construction activities, where data is highly sparse.
• Sampling: The activity data does not cover each firm individually for specific reporting. It covers only the bigger firms, and follows a sampling design for the rest of the firms – assigning a representative multiplier to each reporting firm. The Ministry estimates errors and variance related to the sample design, and approves only the acceptable limits, however probability of uncertainty cannot be ignored. Multipliers may not be the best representation for the employment, productivity, and energy/resource use altogether for the sample survey firms. Nevertheless, the overall energy use represented by census units (larger firms) is almost 90% of the total activity data, which is consistent over the years.
• Measurement: The activity data (for energy use) provides an exhaustive reporting on fuel use by each firm covering more than 80 fuel types. However, lack of mandate on energy reporting allow users to dilute this information and club energy-use reporting under unspecified categories in expenditure terms. A few firms reflect mismatch between reported rates (of fuel) and its unit of measurement. Overall, such firms represent approx. 13% of the total emission estimates. A scientific approach is adopted to identify and correct ‘units/rates’ of erroneous entries, whereas expenditure-based reporting is approximated by mimicking trends from past reporting of the same or similar firms in each sector.
IPCC good practice guidelines (2006) suggests three approaches to estimate uncertainties: (a) comparison of results with independent data, (b) comparison from alternative models, and (c) expert judgement related to magnitude of uncertainties. In this case, quantification of the magnitude of uncertainties is difficult to achieve as: (a) no alternate source of information provides the desired level of granularity, and (b) ASI is lesser known for its utility to derive GHG estimates, hence lack of expert judgement at this point. A very high-level comparison with the official GHG estimates is possible for 2007 (INCCA),2010 (BUR) and 2014 (BUR-2), as can be noticed from Error! Reference source not found.. It suggests marginal deviations, which are unverified and unquantifiable due to insufficient clarity.
Figure 3.6 A: Comparison with official GHG estimates
Note: To make authors’ estimates comparable with the official sources (BUR and INCCA), captive emissions within manufacturing has not been considered as latter report captive emissions in a different
358
479
615
446, INCCA 2007511, BUR 2010
593, BUR 2014
0
100
200
300
400
500
600
700
2007 2010 2014
Emis
sio
ns
MTC
O2
e
CEEW GHG Emissions (million tonnes)
category. For 2014 comparison, CEEW estimates includes captive emissions for the Iron and Steel sector only, so as to match the scope and coverage of BUR-2 estimates.
Source: Authors’ analysis
Figure 3.6 A shows that except the comparison between INCCA (2007) and CEEW estimates, where INCCA is not an official submission by the Government of India; overall deviation between CEEW estimates and the official numbers from BURs is under 5%. This confirms a low uncertainty in the presented estimates. Further to this, few representations of ‘low’ and ‘medium’ activity data quality in ‘key category analysis’ (in the following section) also supports this conclusion. 3.7 Recommended improvements
This exercise has resulted from continual improvements through expert consultations, enhanced capacity and improved data quality for the recent years. This section recommends further improvements, and identifies how the published information could be used by a wide range of stakeholders including policy planners from state and central government(s); industry and their associations; research community; academicians, etc. Proposed improvements
• Frequency of energy data published by the government agencies needs to be improved over time. Currently there is a lag of at least three to four years between the published date and reported year for energy statistics.
• Lack of quality of information is another barrier for improved understanding on GHG emissions. Most agencies do not collect (or publish) energy consumption records from industry units due to administrative challenges. This dilutes our understanding of the supply side perspective.
• In most cases, activity data information is made available by central agencies at an aggregated level. It is recommended that states plan for their own statistics to understand and address local level policy issues in a more scientific manner.
• Coverage of reported information is also a prominent area of improvement. For instance, ASI covers only the registered/formally operating units within the country. By excluding the informal/unregistered sector, often leaves an open space for interpretation and assumptions on the left out unregistered economy of the country. General perceptions suggest that the unregistered sector is highly energy inefficient due to lack of scale and sophisticated equipment. Thus far, not focusing on this sector is certainly a missed opportunity for India’s policy planners to roll out measures towards decarbonisation.
Recently, NITI Aayog has constituted a working group on ‘Energy Data Management’ in India to address such challenges along with other prominent issues. Recommended use of these estimates
• This effort is already assisting the MoEFCC, Government of India in reconciling their official estimates and seeking consultations with the authors and other experts as a quality control process. Continuation of such arrangement would be a strong indicator of success for this reporting under the collaborative effort of GHG Platform India.
• In India, each state government and Union territory has received a mandate to come up with their own State Action Plans on Climate Change (SAPCC). Thus far, 34 SAPCCs have been

received by the MoEFCC and further revision is in process to establish this as a periodic exercise. Since this reporting is a first-of-its-kind of independent effort attempted by civil society organizations to arrive at a sub-national understanding of emissions, it opens doors for extensive deliberations with state policy planning units to strengthen their climate planning and monitor the impact of such measures. At present, GHG Platform India is collectively assisting the state of Madhya Pradesh with their SAPCC revision exercise.
• Industry and their associations must take note of granular information provided in this methodology note to understand the scope and opportunities of decarbonisation before making long-term capital investments into existing and inefficient processes of manufacturing.
• Academicians and the research community could take forward this exercise for further improvements. Disaggregated information on industry estimates should be a perfect nudge to the research community to come up with more process and state-focused research outcomes.
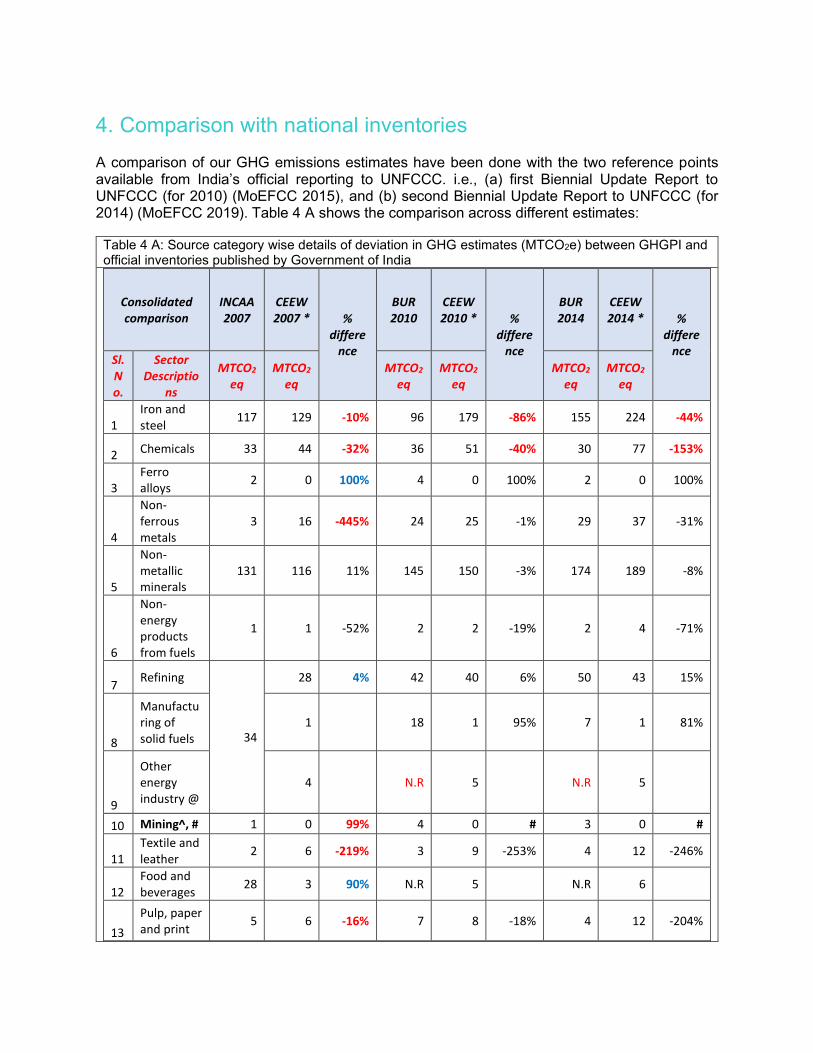
4. Comparison with national inventories A comparison of our GHG emissions estimates have been done with the two reference points available from India’s official reporting to UNFCCC. i.e., (a) first Biennial Update Report to UNFCCC (for 2010) (MoEFCC 2015), and (b) second Biennial Update Report to UNFCCC (for 2014) (MoEFCC 2019). Table 4 A shows the comparison across different estimates:
Table 4 A: Source category wise details of deviation in GHG estimates (MTCO2e) between GHGPI and official inventories published by Government of India
Consolidated comparison
INCAA 2007
CEEW 2007 * %
difference
BUR 2010
CEEW 2010 * %
difference
BUR 2014
CEEW 2014 * %
difference
Sl. No.
Sector Descriptio
ns
MTCO2
eq MTCO2
eq MTCO2
eq MTCO2
eq MTCO2
eq MTCO2
eq
1 Iron and steel
117 129 -10% 96 179 -86% 155 224 -44%
2 Chemicals 33 44 -32% 36 51 -40% 30 77 -153%
3 Ferro alloys
2 0 100% 4 0 100% 2 0 100%
4
Non-ferrous metals
3 16 -445% 24 25 -1% 29 37 -31%
5
Non-metallic minerals
131 116 11% 145 150 -3% 174 189 -8%
6
Non-energy products from fuels
1 1 -52% 2 2 -19% 2 4 -71%
7 Refining
34
28 4% 42 40 6% 50 43 15%
8
Manufacturing of solid fuels
1 18 1 95% 7 1 81%
9
Other energy industry @
4 N.R 5 N.R 5
10 Mining^, # 1 0 99% 4 0 # 3 0 #
11 Textile and leather
2 6 -219% 3 9 -253% 4 12 -246%
12 Food and beverages
28 3 90% N.R 5 N.R 6
13
Pulp, paper and print
5 6 -16% 7 8 -18% 4 12 -204%
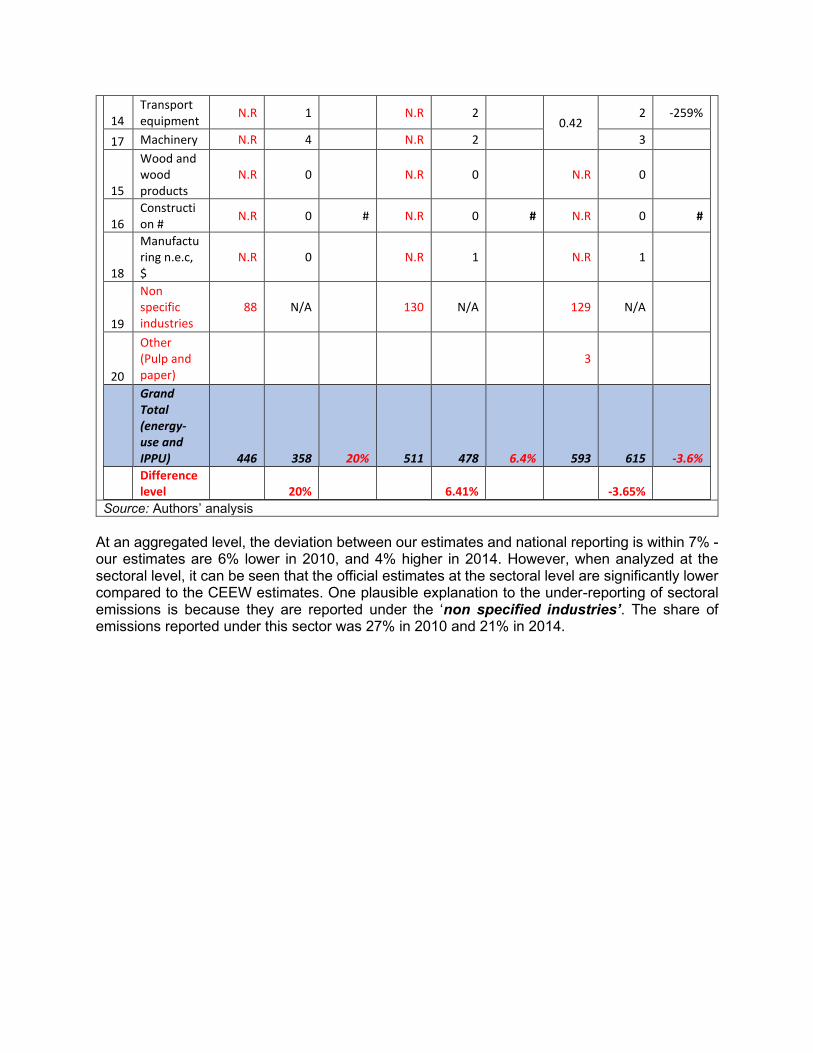
14 Transport equipment
N.R 1 N.R 2 0.42
2 -259%
17 Machinery N.R 4 N.R 2 3
15
Wood and wood products
N.R 0 N.R 0 N.R 0
16 Construction #
N.R 0 # N.R 0 # N.R 0 #
18
Manufacturing n.e.c, $
N.R 0 N.R 1 N.R 1
19
Non specific industries
88 N/A 130 N/A 129 N/A
20
Other (Pulp and paper)
3
Grand Total (energy-use and IPPU) 446 358 20% 511 478 6.4% 593 615 -3.6%
Difference level 20% 6.41% -3.65%
Source: Authors’ analysis
At an aggregated level, the deviation between our estimates and national reporting is within 7% - our estimates are 6% lower in 2010, and 4% higher in 2014. However, when analyzed at the sectoral level, it can be seen that the official estimates at the sectoral level are significantly lower compared to the CEEW estimates. One plausible explanation to the under-reporting of sectoral emissions is because they are reported under the ‘non specified industries’. The share of emissions reported under this sector was 27% in 2010 and 21% in 2014.
References 2019. World Steel. https://www.worldsteel.org/en/dam/jcr:96d7a585-e6b2-4d63-b943-
4cd9ab621a91/World%2520Steel%2520in%2520Figures%25202019.pdf. 2019. Aluminium - MCX India. Accessed 03 18, 2019.
https://www.mcxindia.com/products/metals/aluminium. Argelwar, Rahul P., and B. S. Dani. 2017. "Captive Power Generation System." Journal of Network
Communications and Emerging Technologies (JNCET) 7 (1). http://www.cercind.gov.in/oper2.htm.
2018. CCL. http://www.centralcoalfields.in/prfnc/anulrpt.php. Census of India. 2014. Population Statistics. 12 22. Accessed July 25, 2019.
http://planningcommission.nic.in/data/datatable/data_2312/DatabookDec2014%20307.pdf. Choudhury, A, J Roy, S Biswas, C C Chakraborty, and K Sen. 2004. "Determination of carbon dioxide
emission factors from coal combustion." In In Climate Change and India: Uncertainty Reduction in Greenhouse Gas Inventory Estimates, edited by A P Mitra. Hyderabad: Universities Press.
. CMA. . http://cmaindia.org/annual-report.html. 2019. Department of Chemicals and Petrochemicals. Accessed 03 19, 2019.
https://chemicals.nic.in/document-report/reports. 2019. EXIM database. Accessed 03 2019, 19. http://commerce-app.gov.in/eidb/. FAO. 2009. Livestock's Long Shadow: Environmental Issues and Options. Rome: United Nations.
Accessed 10 14, 2016. ftp://ftp.fao.org/docrep/fao/010/a0701e/a0701e03.pdf. FAO. 2009. Livestock's Long Shadow: Environmental Issues and Options. Rome: United Nations.
Accessed 10 14, 2016. http://www.fao.org/3/a0701e/a0701e04.pdf. 2017. IBEF. . https://www.ibef.org/industry/cement-presentation. IBEF. 2019. "Indian Cement Industry Analysis." India Brand Equity Foundation. February.
https://www.ibef.org/industry/cement-presentation. IBM. 2015. "Indian Minerals Yearbook 2013." Indian Bureau of Mines. 3 1. Accessed 4 22, 2016.
https://ibm.gov.in/writereaddata/files/08012016122133Limestone%20and%20Other%20Calcareous%20Materials-2015-Final.pdf.
IBM. 2017. "Mineral Yearbook." https://ibm.gov.in/index.php?c=pages&m=index&id=1007. IBM. 2016. Minerals Yearbook - Limestone and other calcareous materials. Report, Nagpur: Indian
Bureau of Mines. https://ibm.gov.in/writereaddata/files/01082019100709Limestone%20_%20Other%20Calc%20Materials%202016.pdf.
. IBM Yearbook. . https://ibm.gov.in/index.php?c=pages&m=index&id=1008. INCCA. 2010. India: Greenhouse Gas Emissions 2007. New Delhi: INCCA. IOCL. 2012-13. Sustainability Report. Corporate Sustainability Report, New Delhi: Indian Oil Corporation
Limited. https://www.iocl.com/download/Sustainability_Report_2012-13.pdf. IPCC. 2007. 2006 IPCC Guidelines for National Greenhouse Gas Inventories. Kanagawa, Japan: Task
Force on National Greenhouse Gas Inventories. https://www.ipcc-nggip.iges.or.jp/public/2006gl/pdf/2_Volume2/V2_2_Ch2_Stationary_Combustion.pdf.
2018. IPCC-AR5. https://www.ipcc.ch/site/assets/uploads/2018/02/AR5_SYR_FINAL_SPM.pdf. 2018. IPCC-SAR. https://www.ipcc.ch/site/assets/uploads/2018/06/2nd-assessment-en.pdf. MoEFCC. 2018. India - Second Biennial Update Report to the United Nations Framework Convention on
Climate Change. New Delhi: Government of India. https://unfccc.int/sites/default/files/resource/INDIA%20SECOND%20BUR%20High%20Res.pdf.
MOEFCC. 2015. India: First Biennial Update Report to the United Nations Framework Convention on Climate Change. New Delhi: Government of India.
MOEFCC. 2018. India: Second Biennial Update Report to the United Nations Framework Convention on Climate Change. New Delhi: MOEFCC, 20. Accessed April 07, 2019. https://unfccc.int/sites/default/files/resource/INDIA%20SECOND%20BUR%20High%20Res.pdf.
2017. MoPNG. http://petroleum.nic.in/more/indian-png-statistics. MOSPI. 2018. http://mospi.nic.in/sites/default/files/publication_reports/Energy_Statistics_2018.pdf.
MOSPI. 2015. Energy Statistics 2015. New Delhi: Central Statistics Office, Ministry of Statistics and Programme Implementation, Government of India.
—. 2018. MOSPI. Accessed July 2019. http://pibphoto.nic.in/documents/rlink/2018/nov/p2018112801.pdf. MOSPI. 2018. National Account Statistics. Background note, New Delhi: Government of India.
http://pibphoto.nic.in/documents/rlink/2018/nov/p2018112801.pdf. —. 2016b. National Industries Classification. Accessed 2016.
http://mospi.nic.in/Mospi_New/site/inner.aspx?status=2&menu_id=129. —. 2016c. National product classification. Accessed 2016.
http://mospi.nic.in/Mospi_New/site/inner.aspx?status=2&menu_id=158. . MOSPI, 2018. . http://mospi.nic.in/sites/default/files/publication_reports/Energy_Statistics_2018.pdf. RBI. 2015. Handbook of Statistics on Indian Economy. 9. Accessed 4 12, 2016.
https://www.rbi.org.in/Scripts/AnnualPublications.aspx?head=Handbook%20of%20Statistics%20on%20Indian%20Economy.
2019. USGS. Accessed 03 18, 2019. https://www.usgs.gov/. World Bank. 2017. World Bank Data Bank - India. April 19. http://data.worldbank.org/country/india. . World Bank, 2014. . https://data.worldbank.org/indicator/EN.ATM.CO2E.PC?locations=IN. World Steel Association. 2018. World Steel in Figures. Brussels: World Steel Association.
https://www.worldsteel.org/en/dam/jcr:f9359dff-9546-4d6b-bed0-996201185b12/World+Steel+in+Figures+2018.pdf.
List of Abbreviations ATF Aviation Turbine Fuel BESCOM Bangalore Electricity Supply Company Limited BMTC Bangalore Metropolitan Transport Corporation CAGR Compounded Annual Growth Rate CEA Central Electricity Authority CEEW Council on Energy, Environment and Water CH4 Methane CNG Compressed Natural Gas CO2 Carbon dioxide EF Emission Factor FO Furnace Oil GAIL Gas (India) Limited GDP Gross Domestic Product GGGI Global Green Growth Initiative GHG Greenhouse Gas GoI Government of India kT Kilo Tonnes HSDO High Speed Diesel Oil IISD International Institute for Sustainable Development INCCA Indian Network on Climate Change Assessment IPCC Intergovernmental Panel on Climate Change LDO Light Diesel Oil LPG Liquefied Petroleum Gas LSHS MTCO2e MOSPI
Low Sulphur Heavy Stock Million tonnes of Carbon dioxide equivalent Ministry of Statistics and Programme Implementation
N2O Nitrous Oxide NDC Nationally Determined Contribution NSSO National Sample Survey Office OC Open Cast PCMC Per Capita Monthly Consumption PNG Piped Natural Gas SAPCC State Action Plan on Climate Change T Tonnes TJ Tera Joule TCO2e Tonnes of Carbon dioxide equivalent
List of Tables Table ES 1: Snapshot of total GHG emissions from gases and sector ............................................. 6 Table 1.2 A: Global warming potential as per IPCC assessment reports ....................................... 10 Table 1.10 A: Details of key source categories excluded from present GHG estimates .............. 14 Table 2.1 A: Total national GHG emission estimates by sector ....................................................... 16 Table 2.2 A: Distribution of emission contribution (2015) .................................................................. 17 Table 3.1 A: GHG estimates for base year and current year (MTCO2e) ......................................... 18 Table 3.2 A: Sectoral breakdown of manufacturing emissions (2005 to 2015) in MTCO2e using IPCC SAR .................................................................................................................................................. 19 Table 3.4 A: Category wise source and quality of activity data for energy-use emissions ........... 24 Table 3.4 B: Tier approach followed for the manufacturing sector emission (energy-use and IPPU) category ..................................................................................................................................................... 26 Table 3.4 C: Distinct emission factors and calorific values adopted for coal as per the process and source of origin ......................................................................................................................................... 27 Table 3.4 D: Manufacturing wise preferences for liquid fuel distillate in 2015-16 .......................... 30 Table 3.4 E: Comparison between energy-use emission estimates (Phase 2 and Phase 3) ...... 32 Table 3.5 A: Category wise sources and quality of activity data for the IPPU emissions ............. 33 Table 3.5 B: Tier approach followed for the IPPU emission .............................................................. 35 Table 3.5 C: Clinker factors for types of cement ................................................................................. 38 Table 3.5 D: Comparison of IPPU emissions from the chemicals sector (Phase 2 and Phase 3) .................................................................................................................................................................... 40 Table 4 A: Source category wise details of deviation in GHG estimates (MTCO2e) between GHGPI and official inventories published by Government of India ................................................................ 44
List of Figures
Figure ES 1: Overview of manufacturing (energy-use and IPPU) emissions between 2005 and 2015 .............................................................................................................................................................. 7 Figure ES 2: Manufacturing emissions (energy use and IPPU) growth trend during 2005 to 2015 ...................................................................................................................................................................... 8 Figure ES 3: Top emitters among states in terms of manufacturing GHG emissions for 2015 data ...................................................................................................................................................................... 9 Figure 1.7 A: Institutional arrangement at GHG Platform India ........... Error! Bookmark not defined. Figure 2.1 A: Year-on-year growth of manufacturing emissions (2005 – 2015) ............................. 15 Figure 2.1 B: Share of sub-sectors in overall emissions (2015) ....................................................... 16 Figure 3.2 A: Emissions intensity and per capita emissions (2005-2015) ....................................... 19 Figure 3.2 B: Trend of energy use emissions across end-use manufacturing sectors (2005 – 2015) .................................................................................................................................................................... 21 Figure 3.2 C: Emissions from combustion of industrial fuels (2005-2015) ...................................... 21 Figure 3.2 D: Trend of IPPU emissions across end-use manufacturing sectors (2005 – 2015) .. 22 Figure 3.6 A: Comparison with official GHG estimates ...................................................................... 41
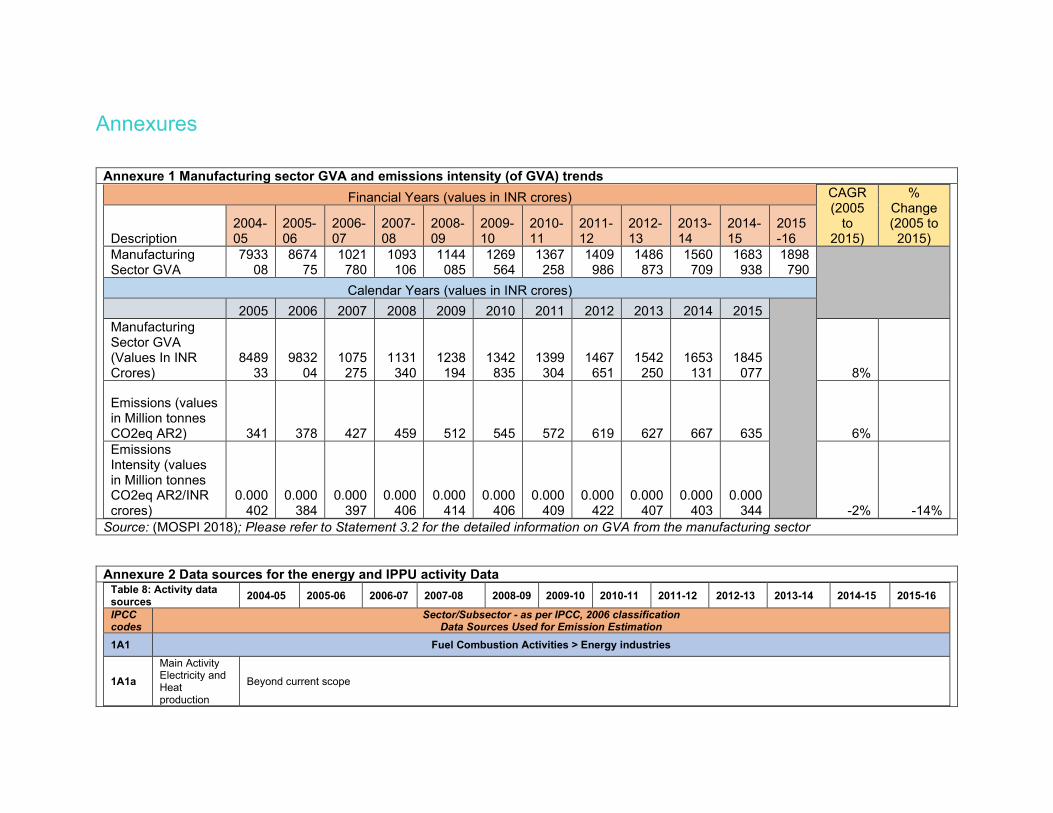
Annexures
Annexure 1 Manufacturing sector GVA and emissions intensity (of GVA) trends
Financial Years (values in INR crores) CAGR (2005
to 2015)
% Change (2005 to 2015) Description
2004-05
2005-06
2006-07
2007-08
2008-09
2009-10
2010-11
2011-12
2012-13
2013-14
2014-15
2015-16
Manufacturing Sector GVA
793308
867475
1021780
1093106
1144085
1269564
1367258
1409986
1486873
1560709
1683938
1898790
Calendar Years (values in INR crores)
2005 2006 2007 2008 2009 2010 2011 2012 2013 2014 2015
Manufacturing Sector GVA (Values In INR Crores)
848933
983204
1075275
1131340
1238194
1342835
1399304
1467651
1542250
1653131
1845077 8%
Emissions (values in Million tonnes CO2eq AR2) 341 378 427 459 512 545 572 619 627 667 635 6%
Emissions Intensity (values in Million tonnes CO2eq AR2/INR crores)
0.000402
0.000384
0.000397
0.000406
0.000414
0.000406
0.000409
0.000422
0.000407
0.000403
0.000344 -2% -14%
Source: (MOSPI 2018); Please refer to Statement 3.2 for the detailed information on GVA from the manufacturing sector
Annexure 2 Data sources for the energy and IPPU activity Data Table 8: Activity data sources
2004-05 2005-06 2006-07 2007-08 2008-09 2009-10 2010-11 2011-12 2012-13 2013-14 2014-15 2015-16
IPCC codes
Sector/Subsector - as per IPCC, 2006 classification Data Sources Used for Emission Estimation
1A1 Fuel Combustion Activities > Energy industries
1A1a
Main Activity Electricity and Heat production
Beyond current scope
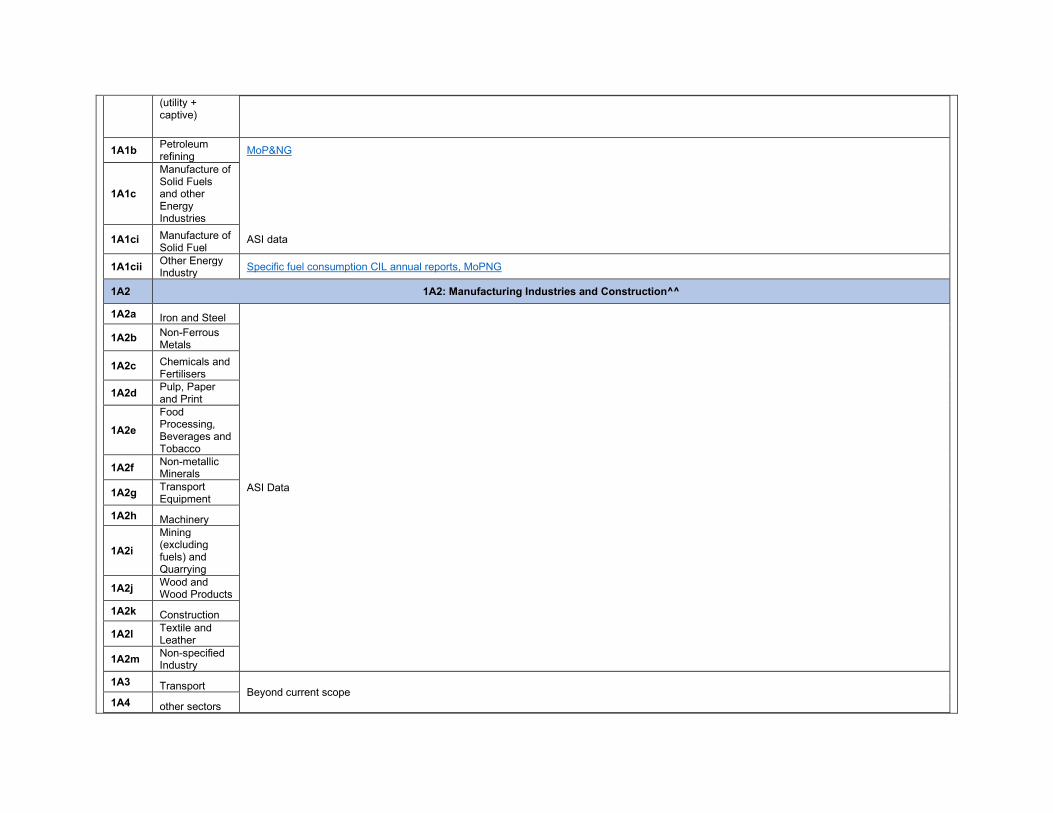
(utility + captive)
1A1b Petroleum refining
MoP&NG
1A1c
Manufacture of Solid Fuels and other Energy Industries
1A1ci Manufacture of Solid Fuel
ASI data
1A1cii Other Energy Industry
Specific fuel consumption CIL annual reports, MoPNG
1A2 1A2: Manufacturing Industries and Construction^^
1A2a Iron and Steel
ASI Data
1A2b Non-Ferrous Metals
1A2c Chemicals and Fertilisers
1A2d Pulp, Paper and Print
1A2e
Food Processing, Beverages and Tobacco
1A2f Non-metallic Minerals
1A2g Transport Equipment
1A2h Machinery
1A2i
Mining (excluding fuels) and Quarrying
1A2j Wood and Wood Products
1A2k Construction
1A2l Textile and Leather
1A2m Non-specified Industry
1A3 Transport Beyond current scope
1A4 other sectors
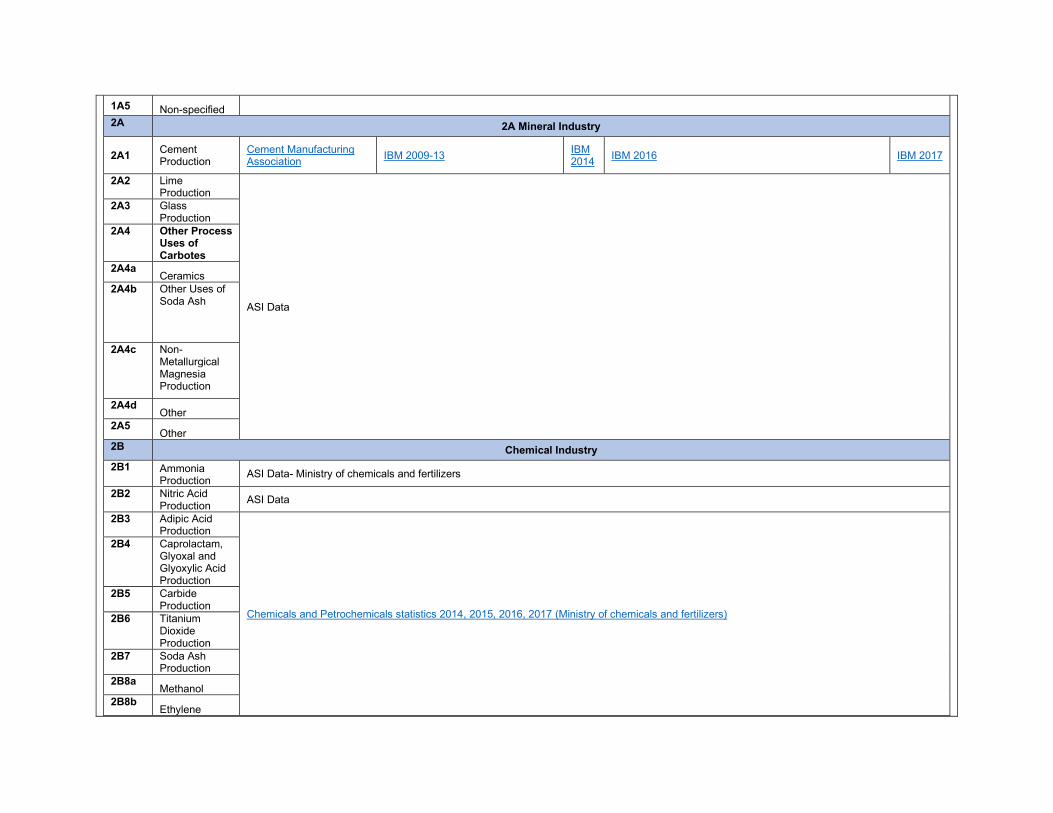
1A5 Non-specified
2A 2A Mineral Industry
2A1 Cement Production
Cement Manufacturing Association
IBM 2009-13 IBM 2014
IBM 2016 IBM 2017
2A2 Lime Production
ASI Data
2A3 Glass Production
2A4 Other Process Uses of Carbotes
2A4a Ceramics
2A4b Other Uses of Soda Ash
2A4c Non-Metallurgical Magnesia Production
2A4d Other
2A5 Other
2B Chemical Industry
2B1 Ammonia Production
ASI Data- Ministry of chemicals and fertilizers
2B2 Nitric Acid Production
ASI Data
2B3 Adipic Acid Production
Chemicals and Petrochemicals statistics 2014, 2015, 2016, 2017 (Ministry of chemicals and fertilizers)
2B4 Caprolactam, Glyoxal and Glyoxylic Acid Production
2B5 Carbide Production
2B6 Titanium Dioxide Production
2B7 Soda Ash Production
2B8a Methanol
2B8b Ethylene
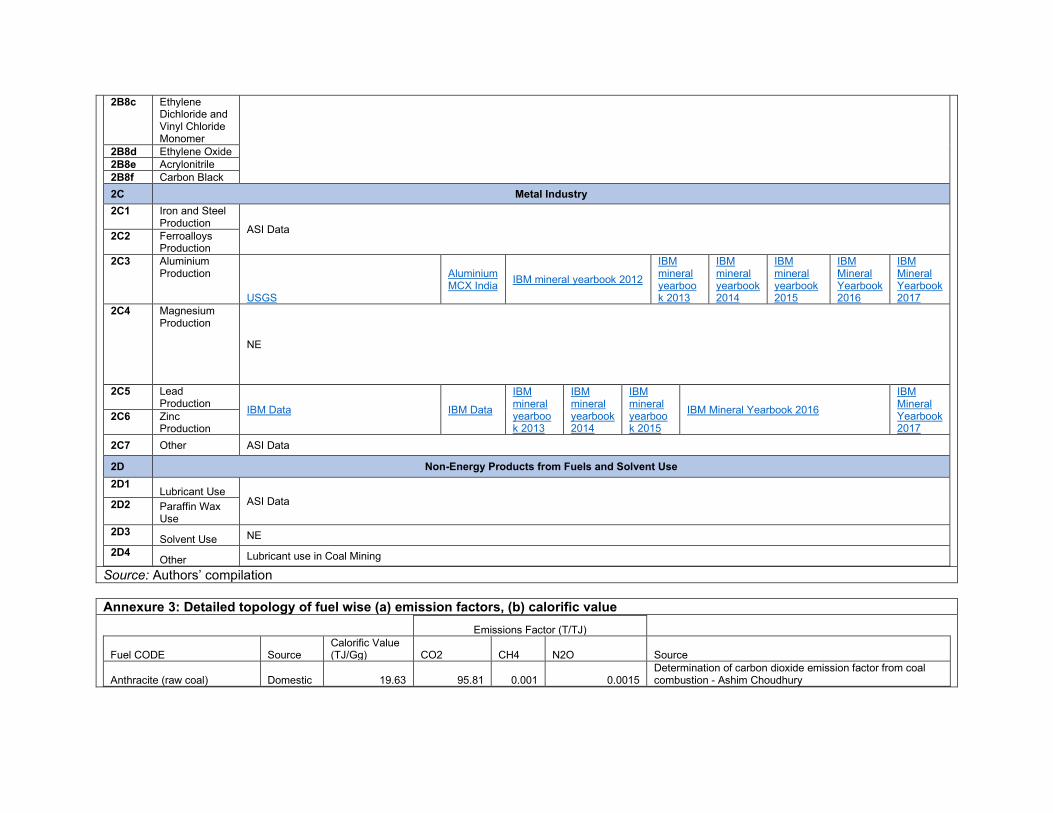
2B8c Ethylene Dichloride and Vinyl Chloride Monomer
2B8d Ethylene Oxide
2B8e Acrylonitrile
2B8f Carbon Black
2C Metal Industry
2C1 Iron and Steel Production
ASI Data 2C2 Ferroalloys
Production
2C3 Aluminium Production
USGS
Aluminium MCX India
IBM mineral yearbook 2012
IBM mineral yearbook 2013
IBM mineral yearbook 2014
IBM mineral yearbook 2015
IBM Mineral Yearbook 2016
IBM Mineral Yearbook 2017
2C4 Magnesium Production
NE
2C5 Lead Production
IBM Data IBM Data
IBM mineral yearbook 2013
IBM mineral yearbook 2014
IBM mineral yearbook 2015
IBM Mineral Yearbook 2016
IBM Mineral Yearbook 2017
2C6 Zinc Production
2C7 Other ASI Data
2D Non-Energy Products from Fuels and Solvent Use
2D1 Lubricant Use
ASI Data 2D2 Paraffin Wax Use
2D3 Solvent Use NE
2D4 Other Lubricant use in Coal Mining
Source: Authors’ compilation
Annexure 3: Detailed topology of fuel wise (a) emission factors, (b) calorific value
Emissions Factor (T/TJ)
Fuel CODE Source Calorific Value (TJ/Gg) CO2 CH4 N2O Source
Anthracite (raw coal) Domestic 19.63 95.81 0.001 0.0015 Determination of carbon dioxide emission factor from coal combustion - Ashim Choudhury
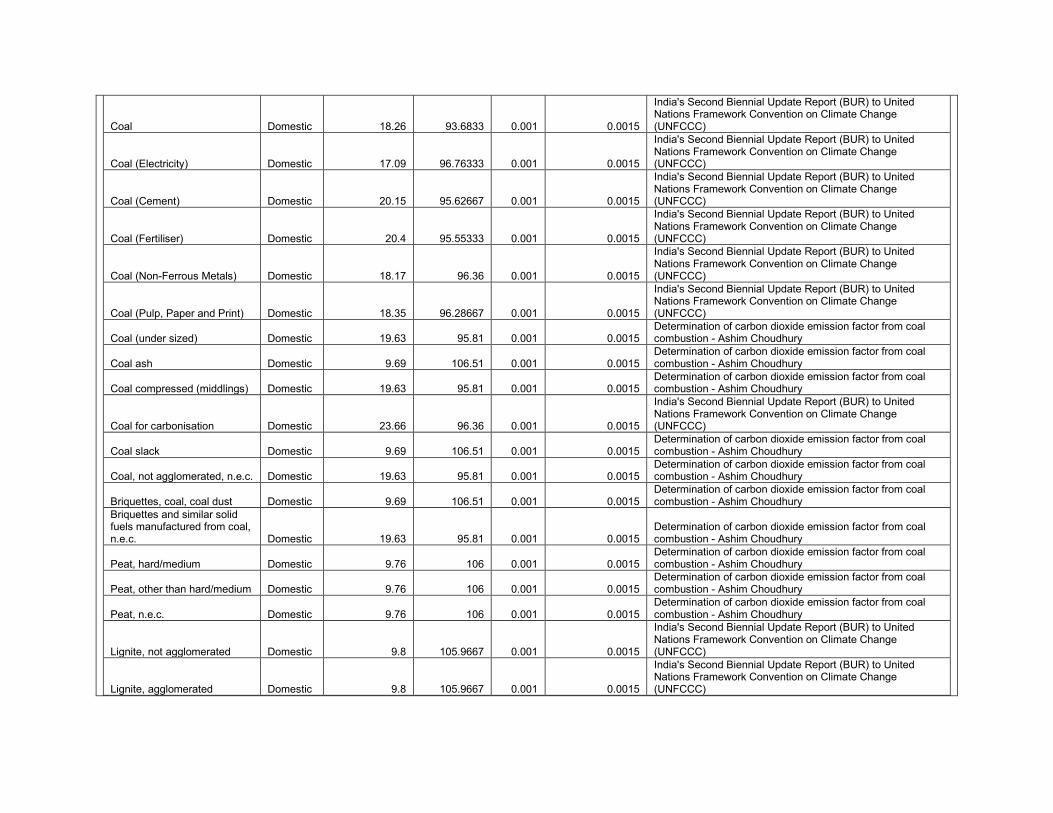
Coal Domestic 18.26 93.6833 0.001 0.0015
India's Second Biennial Update Report (BUR) to United Nations Framework Convention on Climate Change (UNFCCC)
Coal (Electricity) Domestic 17.09 96.76333 0.001 0.0015
India's Second Biennial Update Report (BUR) to United Nations Framework Convention on Climate Change (UNFCCC)
Coal (Cement) Domestic 20.15 95.62667 0.001 0.0015
India's Second Biennial Update Report (BUR) to United Nations Framework Convention on Climate Change (UNFCCC)
Coal (Fertiliser) Domestic 20.4 95.55333 0.001 0.0015
India's Second Biennial Update Report (BUR) to United Nations Framework Convention on Climate Change (UNFCCC)
Coal (Non-Ferrous Metals) Domestic 18.17 96.36 0.001 0.0015
India's Second Biennial Update Report (BUR) to United Nations Framework Convention on Climate Change (UNFCCC)
Coal (Pulp, Paper and Print) Domestic 18.35 96.28667 0.001 0.0015
India's Second Biennial Update Report (BUR) to United Nations Framework Convention on Climate Change (UNFCCC)
Coal (under sized) Domestic 19.63 95.81 0.001 0.0015 Determination of carbon dioxide emission factor from coal combustion - Ashim Choudhury
Coal ash Domestic 9.69 106.51 0.001 0.0015 Determination of carbon dioxide emission factor from coal combustion - Ashim Choudhury
Coal compressed (middlings) Domestic 19.63 95.81 0.001 0.0015 Determination of carbon dioxide emission factor from coal combustion - Ashim Choudhury
Coal for carbonisation Domestic 23.66 96.36 0.001 0.0015
India's Second Biennial Update Report (BUR) to United Nations Framework Convention on Climate Change (UNFCCC)
Coal slack Domestic 9.69 106.51 0.001 0.0015 Determination of carbon dioxide emission factor from coal combustion - Ashim Choudhury
Coal, not agglomerated, n.e.c. Domestic 19.63 95.81 0.001 0.0015 Determination of carbon dioxide emission factor from coal combustion - Ashim Choudhury
Briquettes, coal, coal dust Domestic 9.69 106.51 0.001 0.0015 Determination of carbon dioxide emission factor from coal combustion - Ashim Choudhury
Briquettes and similar solid fuels manufactured from coal, n.e.c. Domestic 19.63 95.81 0.001 0.0015
Determination of carbon dioxide emission factor from coal combustion - Ashim Choudhury
Peat, hard/medium Domestic 9.76 106 0.001 0.0015 Determination of carbon dioxide emission factor from coal combustion - Ashim Choudhury
Peat, other than hard/medium Domestic 9.76 106 0.001 0.0015 Determination of carbon dioxide emission factor from coal combustion - Ashim Choudhury
Peat, n.e.c. Domestic 9.76 106 0.001 0.0015 Determination of carbon dioxide emission factor from coal combustion - Ashim Choudhury
Lignite, not agglomerated Domestic 9.8 105.9667 0.001 0.0015
India's Second Biennial Update Report (BUR) to United Nations Framework Convention on Climate Change (UNFCCC)
Lignite, agglomerated Domestic 9.8 105.9667 0.001 0.0015
India's Second Biennial Update Report (BUR) to United Nations Framework Convention on Climate Change (UNFCCC)
Petroleum oils and oils obtained from bituminous minerals, crude Domestic 42.3 73.3 0.003 0.0006 IPCC 2006 Guidelines
Fryon Gas Domestic IPCC 2006 Guidelines
Gas compressed natural Domestic 48 56.1 0.001 0.0001 IPCC 2006 Guidelines
liquified petroleum gas Domestic 47.3 63.1 0.001 0.0001 IPCC 2006 Guidelines
natural gas Domestic 48 56.1 0.001 0.0001 IPCC 2006 Guidelines
Gas, n.e.c Domestic 48 56.1 0.001 0.0001 IPCC 2006 Guidelines
Asphalt (Gilsonite) Domestic IPCC 2006 Guidelines
Glancepitch Domestic 38.1 73.3 0.003 0.0006 IPCC 2006 Guidelines
Shale Oil Domestic 38.1 73.3 0.003 0.0006 IPCC 2006 Guidelines
Bituminous or oil shale and tar sands n.e.c Domestic 8.9 107 0.001 0.0015 IPCC 2006 Guidelines
Asphalt natural Domestic IPCC 2006 Guidelines
Asphalt Rock Domestic IPCC 2006 Guidelines
Bitumen Domestic IPCC 2006 Guidelines
Bitumen, blown Domestic IPCC 2006 Guidelines
Bitumen, h.g. Domestic IPCC 2006 Guidelines
Bitumen and asphalt, natural; asphaltites and asphaltic rock; n.e.c Domestic IPCC 2006 Guidelines
Crude mineral Domestic 42.3 73.3 0.003 0.0006 IPCC 2006 Guidelines
Lignite briquettes Domestic 9.69 106.51 0.001 0.0015 IPCC 2006 Guidelines
Atomic energy Domestic IPCC 2006 Guidelines
Biogas energy Domestic IPCC 2006 Guidelines
Hydro-electricity Domestic IPCC 2006 Guidelines
Kinetic energy Domestic IPCC 2006 Guidelines
Other non conventional electricity Domestic IPCC 2006 Guidelines
solar energy Domestic IPCC 2006 Guidelines
steam energy Domestic IPCC 2006 Guidelines
Thermal electricity Domestic IPCC 2006 Guidelines
Wind energy Domestic IPCC 2006 Guidelines
Electrical energy, n.e.c Domestic IPCC 2006 Guidelines
Coal gas Domestic 38.7 44.7 0.001 0.0001 IPCC 2006 Guidelines
Mafron gas Domestic IPCC 2006 Guidelines
Other gaseous hydrocarbons Domestic 38.7 44.7 0.001 0.0001 IPCC 2006 Guidelines
Other than petroleum gas Domestic 38.7 44.7 0.001 0.0001 IPCC 2006 Guidelines
Water gas Domestic 38.7 44.7 0.001 0.0001 IPCC 2006 Guidelines
Coal gas, water gas, producer gas and similar gases, other than petroleum gases and other gaseous hydrocarbons;n.e.c Domestic 38.7 44.7 0.001 0.0001 IPCC 2006 Guidelines
Briquettes, coke Domestic 28.2 107.06 0.001 0.0015 IPCC 2006 Guidelines
Coal rejects Domestic 9.69 106.51 0.001 0.0015 IPCC 2006 Guidelines
Coal washed Domestic 19.63 95.81 0.001 0.0015 IPCC 2006 Guidelines
Coke breeze Domestic 38.7 44.7 0.001 0.0001 IPCC 2006 Guidelines
Coke cp Domestic 28.2 107.06 0.001 0.0015 IPCC 2006 Guidelines
Coke dust Domestic 9.69 106.51 0.001 0.0015 IPCC 2006 Guidelines
Coke hard Domestic 28.2 106.51 0.001 0.0015 IPCC 2006 Guidelines
Coke mixed Domestic 28.2 106.51 0.001 0.0015 IPCC 2006 Guidelines
Coke peat Domestic 9.69 106.51 0.001 0.0015 IPCC 2006 Guidelines
Coke seme Domestic 9.69 106.51 0.001 0.0015 IPCC 2006 Guidelines
Coke soft Domestic 28.2 106.51 0.001 0.0015 IPCC 2006 Guidelines
Lignite briquettes Domestic 9.69 106.51 0.001 0.0015 IPCC 2006 Guidelines
Coke and semi-coke of coal, of lignite or of peat; retort carbon n.e.c Domestic 28.2 106.51 0.001 0.0015 IPCC 2006 Guidelines
Benzol Domestic 28 80.7 0.001 0.0015 IPCC 2006 Guidelines
Coal tar by-product Domestic 28 80.7 0.001 0.0015 IPCC 2006 Guidelines
Coal tar crude Domestic 28 80.7 0.001 0.0015 IPCC 2006 Guidelines
Coal tar Oil Domestic 28 80.7 0.001 0.0015 IPCC 2006 Guidelines
Coal tar peat Domestic 28 80.7 0.001 0.0015 IPCC 2006 Guidelines
Coal tar processed Domestic 28 80.7 0.001 0.0015 IPCC 2006 Guidelines
Coal tar product Domestic 28 80.7 0.001 0.0015 IPCC 2006 Guidelines
Tar from Coal or Lignite Domestic 28 80.7 0.001 0.0015 IPCC 2006 Guidelines
Fuel, aviation turbine Domestic 44.3 69.3 0.003 0.0006 IPCC 2006 Guidelines
Petrol / motor spirit/ gasoline Domestic 44.3 69.3 0.003 0.0006 IPCC 2006 Guidelines
Motor spirit (gasolene), including aviation spirit n.e.c Domestic 44.3 69.3 0.003 0.0006 IPCC 2006 Guidelines
Spirit type (gasolene type) jet fuel Domestic 44.3 69.3 0.003 0.0006 IPCC 2006 Guidelines
Light petroleum oil Domestic 42.3 73.3 0.003 0.0006 IPCC 2006 Guidelines
Other light petroleum oils and light oils obtained from bituminous minerals n.e.c Domestic 42.3 73.3 0.003 0.0006 IPCC 2006 Guidelines
Kerosene Domestic 43.8 71.9 0.003 0.0006 IPCC 2006 Guidelines
Superior kerosene Domestic 44.1 71.6 0.003 0.0006 IPCC 2006 Guidelines
Kerosene n.e.c Domestic 43.8 71.9 0.003 0.0006 IPCC 2006 Guidelines
Kerosene type jet fuel Domestic 44.1 71.6 0.003 0.0006 IPCC 2006 Guidelines
Diesel Domestic 43 74.1 0.003 0.0006 IPCC 2006 Guidelines
High speed diesel Domestic 43 74.1 0.003 0.0006 IPCC 2006 Guidelines
Medium petroleum oil, n.e.c. Domestic 42.3 73.3 0.003 0.0006 IPCC 2006 Guidelines
Gas oils Domestic 43 74.1 0.003 0.0006 IPCC 2006 Guidelines
Fuel oils n.e.c Domestic 40.4 77.4 0.003 0.0006 IPCC 2006 Guidelines
Furnace oil Domestic 40.4 77.4 0.003 0.0006 IPCC 2006 Guidelines
Grease, petroleum etc. Domestic 40.2 73.3 0.003 0.0006 IPCC 2006 Guidelines
Oil lubricating used in spindle/ spinnings the like Domestic 40.2 73.3 0.003 0.0006 IPCC 2006 Guidelines
Oil used for tempering Domestic 40.4 77.4 0.003 0.0006 IPCC 2006 Guidelines
Oil used in leather Domestic 40.4 77.4 0.003 0.0006 IPCC 2006 Guidelines
Oil used in transformer Domestic 40.4 77.4 0.003 0.0006 IPCC 2006 Guidelines
Oil, base Domestic 40.4 77.4 0.003 0.0006 IPCC 2006 Guidelines
Oil, c.p.w Domestic 40.4 77.4 0.003 0.0006 IPCC 2006 Guidelines
Oil, cuttings Domestic 40.4 77.4 0.003 0.0006 IPCC 2006 Guidelines
Oil, middle Domestic 40.4 77.4 0.003 0.0006 IPCC 2006 Guidelines
Oil, mineral white Domestic 40.4 73.3 0.003 0.0006 IPCC 2006 Guidelines
Oil, solvent Domestic 40.4 77.4 0.003 0.0006 IPCC 2006 Guidelines
Oil, used in hydrolic machine Domestic 40.4 77.4 0.003 0.0006 IPCC 2006 Guidelines
Para cresol Domestic 44.5 73.3 0.003 0.0006 IPCC 2006 Guidelines
Lubricating pet Domestic 40.2 73.3 0.003 0.0006 IPCC 2006 Guidelines
Compressed natural gas (CNG) Domestic 48 56.1 0.001 0.0001 IPCC 2006 Guidelines
Gas natural Domestic 48 56.1 0.001 0.0001 IPCC 2006 Guidelines
Liquid or liquid gas fuel for lighter Domestic 40.4 73.3 0.003 0.0006 IPCC 2006 Guidelines
Liquidified petroleum gas (LPG) Domestic 47.3 63.1 0.001 0.0001 IPCC 2006 Guidelines
Propane and butanes, liquefied, n.e.c. Domestic 47.3 63.1 0.001 0.0001 IPCC 2006 Guidelines
Butadiene Domestic IPCC 2006 Guidelines
Butylene Domestic IPCC 2006 Guidelines
C-4 Raffinate Domestic IPCC 2006 Guidelines
Ethylene Domestic IPCC 2006 Guidelines
Isobutylene Domestic IPCC 2006 Guidelines
N-butene Domestic IPCC 2006 Guidelines
Polyisobutylene, PIB Domestic IPCC 2006 Guidelines
Propylene Domestic IPCC 2006 Guidelines
all gases, except natural gas n.e.c Domestic IPCC 2006 Guidelines
Bituminous oil Domestic 8.9 107 0.001 0.0015 IPCC 2006 Guidelines
Paraffin incl wax Domestic 40.2 73.3 0.003 0.0006 IPCC 2006 Guidelines
Petroleum coke Domestic 32.5 97.5 0.003 0.0006 IPCC 2006 Guidelines
Petroleum coke calcined Domestic 32.5 97.5 0.003 0.0006 IPCC 2006 Guidelines
Petroleum jelly Domestic 40.2 73.3 0.003 0.0006 IPCC 2006 Guidelines
Tarfelt Domestic 40.2 73.3 0.003 0.0006 IPCC 2006 Guidelines
Wax chlorinated paraffin Domestic 40.2 73.3 0.003 0.0006 IPCC 2006 Guidelines
Wax polythene Domestic 40.2 73.3 0.003 0.0006 IPCC 2006 Guidelines
Petroleum products obtained from bitumen n.e.c. Domestic 8.9 107 0.003 0.0006 IPCC 2006 Guidelines
Ammonia gas Domestic IPCC 2006 Guidelines
Ammonia liquid Domestic IPCC 2006 Guidelines
Coal tar processed Domestic 28 80.7 0.001 0.0015 IPCC 2006 Guidelines
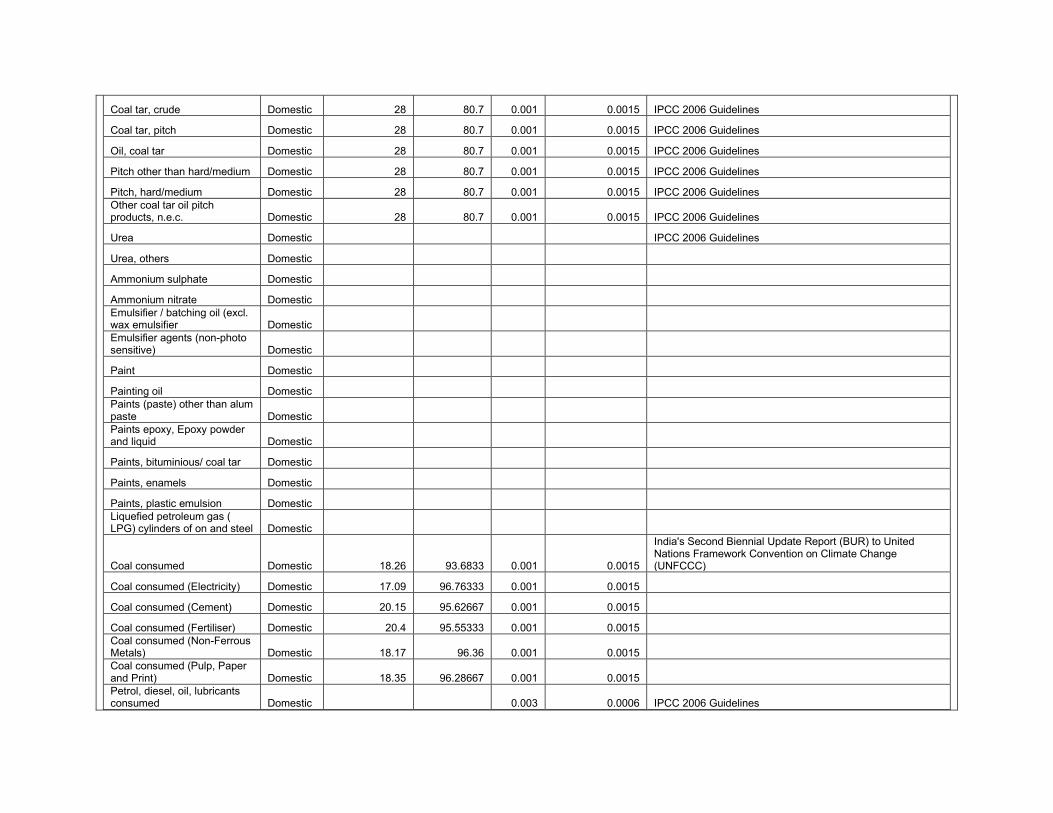
Coal tar, crude Domestic 28 80.7 0.001 0.0015 IPCC 2006 Guidelines
Coal tar, pitch Domestic 28 80.7 0.001 0.0015 IPCC 2006 Guidelines
Oil, coal tar Domestic 28 80.7 0.001 0.0015 IPCC 2006 Guidelines
Pitch other than hard/medium Domestic 28 80.7 0.001 0.0015 IPCC 2006 Guidelines
Pitch, hard/medium Domestic 28 80.7 0.001 0.0015 IPCC 2006 Guidelines
Other coal tar oil pitch products, n.e.c. Domestic 28 80.7 0.001 0.0015 IPCC 2006 Guidelines
Urea Domestic IPCC 2006 Guidelines
Urea, others Domestic
Ammonium sulphate Domestic
Ammonium nitrate Domestic
Emulsifier / batching oil (excl. wax emulsifier Domestic
Emulsifier agents (non-photo sensitive) Domestic
Paint Domestic
Painting oil Domestic
Paints (paste) other than alum paste Domestic
Paints epoxy, Epoxy powder and liquid Domestic
Paints, bituminious/ coal tar Domestic
Paints, enamels Domestic
Paints, plastic emulsion Domestic
Liquefied petroleum gas ( LPG) cylinders of on and steel Domestic
Coal consumed Domestic 18.26 93.6833 0.001 0.0015
India's Second Biennial Update Report (BUR) to United Nations Framework Convention on Climate Change (UNFCCC)
Coal consumed (Electricity) Domestic 17.09 96.76333 0.001 0.0015
Coal consumed (Cement) Domestic 20.15 95.62667 0.001 0.0015
Coal consumed (Fertiliser) Domestic 20.4 95.55333 0.001 0.0015
Coal consumed (Non-Ferrous Metals) Domestic 18.17 96.36 0.001 0.0015
Coal consumed (Pulp, Paper and Print) Domestic 18.35 96.28667 0.001 0.0015
Petrol, diesel, oil, lubricants consumed Domestic 0.003 0.0006 IPCC 2006 Guidelines
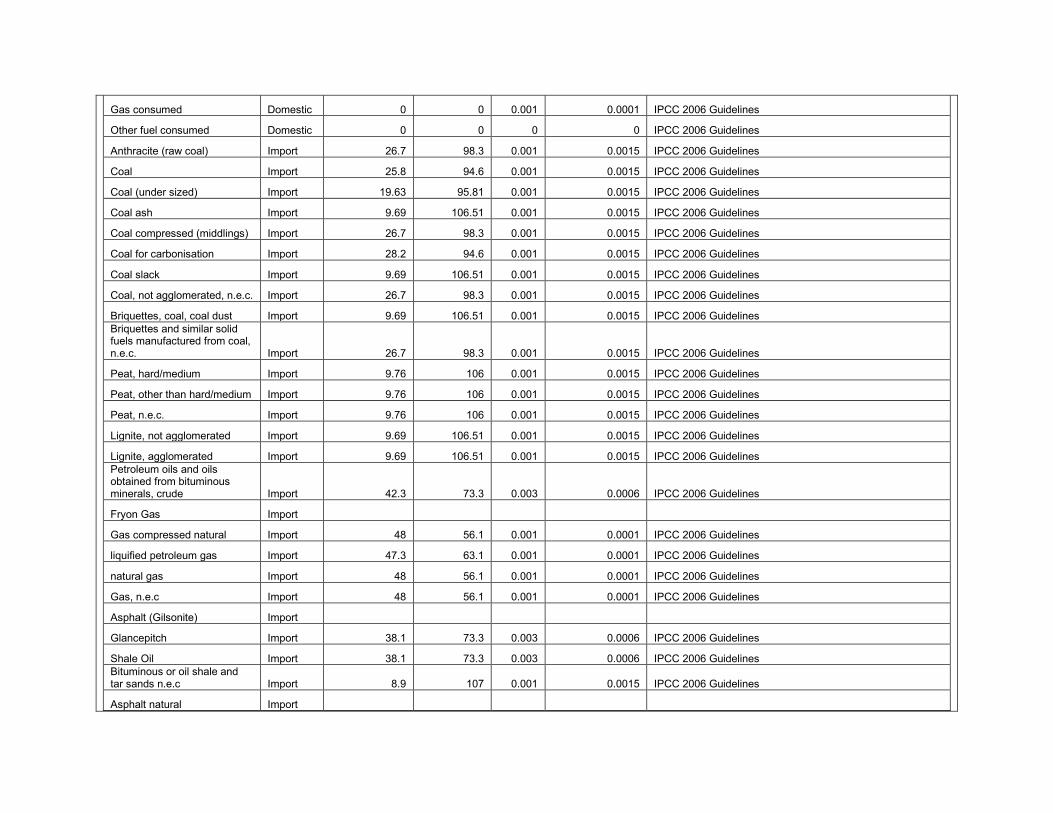
Gas consumed Domestic 0 0 0.001 0.0001 IPCC 2006 Guidelines
Other fuel consumed Domestic 0 0 0 0 IPCC 2006 Guidelines
Anthracite (raw coal) Import 26.7 98.3 0.001 0.0015 IPCC 2006 Guidelines
Coal Import 25.8 94.6 0.001 0.0015 IPCC 2006 Guidelines
Coal (under sized) Import 19.63 95.81 0.001 0.0015 IPCC 2006 Guidelines
Coal ash Import 9.69 106.51 0.001 0.0015 IPCC 2006 Guidelines
Coal compressed (middlings) Import 26.7 98.3 0.001 0.0015 IPCC 2006 Guidelines
Coal for carbonisation Import 28.2 94.6 0.001 0.0015 IPCC 2006 Guidelines
Coal slack Import 9.69 106.51 0.001 0.0015 IPCC 2006 Guidelines
Coal, not agglomerated, n.e.c. Import 26.7 98.3 0.001 0.0015 IPCC 2006 Guidelines
Briquettes, coal, coal dust Import 9.69 106.51 0.001 0.0015 IPCC 2006 Guidelines
Briquettes and similar solid fuels manufactured from coal, n.e.c. Import 26.7 98.3 0.001 0.0015 IPCC 2006 Guidelines
Peat, hard/medium Import 9.76 106 0.001 0.0015 IPCC 2006 Guidelines
Peat, other than hard/medium Import 9.76 106 0.001 0.0015 IPCC 2006 Guidelines
Peat, n.e.c. Import 9.76 106 0.001 0.0015 IPCC 2006 Guidelines
Lignite, not agglomerated Import 9.69 106.51 0.001 0.0015 IPCC 2006 Guidelines
Lignite, agglomerated Import 9.69 106.51 0.001 0.0015 IPCC 2006 Guidelines
Petroleum oils and oils obtained from bituminous minerals, crude Import 42.3 73.3 0.003 0.0006 IPCC 2006 Guidelines
Fryon Gas Import
Gas compressed natural Import 48 56.1 0.001 0.0001 IPCC 2006 Guidelines
liquified petroleum gas Import 47.3 63.1 0.001 0.0001 IPCC 2006 Guidelines
natural gas Import 48 56.1 0.001 0.0001 IPCC 2006 Guidelines
Gas, n.e.c Import 48 56.1 0.001 0.0001 IPCC 2006 Guidelines
Asphalt (Gilsonite) Import
Glancepitch Import 38.1 73.3 0.003 0.0006 IPCC 2006 Guidelines
Shale Oil Import 38.1 73.3 0.003 0.0006 IPCC 2006 Guidelines
Bituminous or oil shale and tar sands n.e.c Import 8.9 107 0.001 0.0015 IPCC 2006 Guidelines
Asphalt natural Import
Asphalt Rock Import
Bitumen Import
Bitumen, blown Import
Bitumen, h.g. Import
Bitumen and asphalt, natural; asphaltites and asphaltic rock; n.e.c Import
Crude mineral Import 0.003 0.0006 IPCC 2006 Guidelines
Lignite briquettes Import 0.001 0.0015 IPCC 2006 Guidelines
Atomic energy Import
Biogas energy Import
Hydro-electricity Import
Kinetic energy Import
Other non conventional electricity Import
solar energy Import
steam energy Import
Thermal electricity Import
Wind energy Import
Electrical energy, n.e.c Import
Coal gas Import 0.001 0.0001 IPCC 2006 Guidelines
Mafron gas Import
Other gaseous hydrocarbons Import 0.001 0.0001 IPCC 2006 Guidelines
Other than petroleum gas Import 0.001 0.0001 IPCC 2006 Guidelines
Water gas Import 0.001 0.0001 IPCC 2006 Guidelines
Coal gas, water gas, producer gas and similar gases, other than petroleum gases and other gaseous hydrocarbons;n.e.c Import 0.001 0.0001 IPCC 2006 Guidelines
Briquettes, coke Import 28.2 107.06 0.001 0.0015 IPCC 2006 Guidelines
Coal rejects Import 9.69 106.51 0.001 0.0015 IPCC 2006 Guidelines
Coal washed Import 25.8 94.6 0.001 0.0015 IPCC 2006 Guidelines
Coke breeze Import 38.7 44.7 0.001 0.0001 IPCC 2006 Guidelines
Coke cp Import 28.2 107.06 0.001 0.0015 IPCC 2006 Guidelines
Coke dust Import 9.69 106.51 0.001 0.0015 IPCC 2006 Guidelines
Coke hard Import 28.2 106.51 0.001 0.0015 IPCC 2006 Guidelines
Coke mixed Import 28.2 106.51 0.001 0.0015 IPCC 2006 Guidelines
Coke peat Import 9.69 106.51 0.001 0.0015 IPCC 2006 Guidelines
Coke seme Import 9.69 106.51 0.001 0.0015 IPCC 2006 Guidelines
Coke soft Import 28.2 106.51 0.001 0.0015 IPCC 2006 Guidelines
Lignite briquettes Import 9.69 106.51 0.001 0.0015 IPCC 2006 Guidelines
Coke and semi-coke of coal, of lignite or of peat; retort carbon n.e.c Import 28.2 106.51 0.001 0.0015 IPCC 2006 Guidelines
Benzol Import 28 80.7 0.001 0.0015 IPCC 2006 Guidelines
Coal tar by-product Import 28 80.7 0.001 0.0015 IPCC 2006 Guidelines
Coal tar crude Import 28 80.7 0.001 0.0015 IPCC 2006 Guidelines
Coal tar Oil Import 28 80.7 0.001 0.0015 IPCC 2006 Guidelines
Coal tar peat Import 28 80.7 0.001 0.0015 IPCC 2006 Guidelines
Coal tar processed Import 28 80.7 0.001 0.0015 IPCC 2006 Guidelines
Coal tar product Import 28 80.7 0.001 0.0015 IPCC 2006 Guidelines
Tar from Coal or Lignite Import 28 80.7 0.001 0.0015 IPCC 2006 Guidelines
Fuel, aviation turbine Import 44.3 69.3 0.003 0.0006 IPCC 2006 Guidelines
Petrol / motor spirit/ gasoline Import 44.3 69.3 0.003 0.0006 IPCC 2006 Guidelines
Motor spirit (gasolene), including aviation spirit n.e.c Import 44.3 69.3 0.003 0.0006 IPCC 2006 Guidelines
Spirit type (gasolene type) jet fuel Import 44.3 69.3 0.003 0.0006 IPCC 2006 Guidelines
Light petroleum oil Import 42.3 73.3 0.003 0.0006 IPCC 2006 Guidelines
Other light petroleum oils and light oils obtained from bituminous minerals n.e.c Import 42.3 73.3 0.003 0.0006 IPCC 2006 Guidelines
Kerosene Import 43.8 71.9 0.003 0.0006 IPCC 2006 Guidelines
Superior kerosene Import 44.1 71.6 0.003 0.0006 IPCC 2006 Guidelines
Kerosene n.e.c Import 43.8 71.9 0.003 0.0006 IPCC 2006 Guidelines
Kerosene type jet fuel Import 44.1 71.6 0.003 0.0006 IPCC 2006 Guidelines
Diesel Import 43 74.1 0.003 0.0006 IPCC 2006 Guidelines
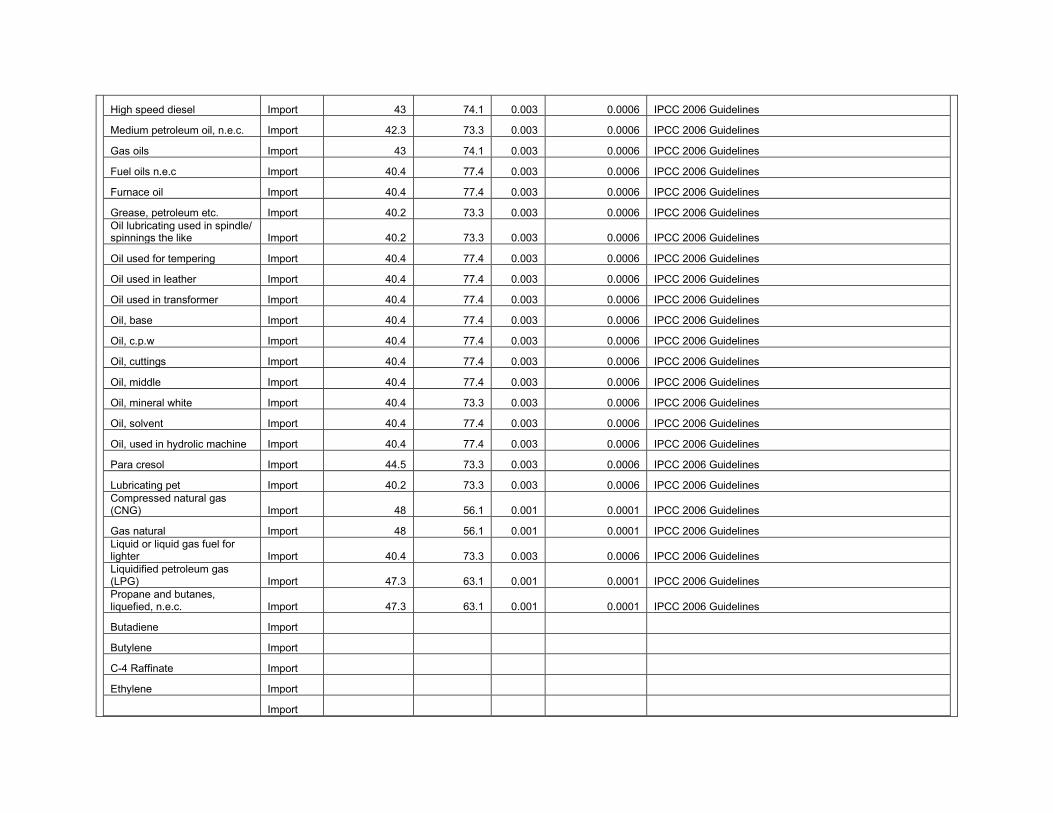
High speed diesel Import 43 74.1 0.003 0.0006 IPCC 2006 Guidelines
Medium petroleum oil, n.e.c. Import 42.3 73.3 0.003 0.0006 IPCC 2006 Guidelines
Gas oils Import 43 74.1 0.003 0.0006 IPCC 2006 Guidelines
Fuel oils n.e.c Import 40.4 77.4 0.003 0.0006 IPCC 2006 Guidelines
Furnace oil Import 40.4 77.4 0.003 0.0006 IPCC 2006 Guidelines
Grease, petroleum etc. Import 40.2 73.3 0.003 0.0006 IPCC 2006 Guidelines
Oil lubricating used in spindle/ spinnings the like Import 40.2 73.3 0.003 0.0006 IPCC 2006 Guidelines
Oil used for tempering Import 40.4 77.4 0.003 0.0006 IPCC 2006 Guidelines
Oil used in leather Import 40.4 77.4 0.003 0.0006 IPCC 2006 Guidelines
Oil used in transformer Import 40.4 77.4 0.003 0.0006 IPCC 2006 Guidelines
Oil, base Import 40.4 77.4 0.003 0.0006 IPCC 2006 Guidelines
Oil, c.p.w Import 40.4 77.4 0.003 0.0006 IPCC 2006 Guidelines
Oil, cuttings Import 40.4 77.4 0.003 0.0006 IPCC 2006 Guidelines
Oil, middle Import 40.4 77.4 0.003 0.0006 IPCC 2006 Guidelines
Oil, mineral white Import 40.4 73.3 0.003 0.0006 IPCC 2006 Guidelines
Oil, solvent Import 40.4 77.4 0.003 0.0006 IPCC 2006 Guidelines
Oil, used in hydrolic machine Import 40.4 77.4 0.003 0.0006 IPCC 2006 Guidelines
Para cresol Import 44.5 73.3 0.003 0.0006 IPCC 2006 Guidelines
Lubricating pet Import 40.2 73.3 0.003 0.0006 IPCC 2006 Guidelines
Compressed natural gas (CNG) Import 48 56.1 0.001 0.0001 IPCC 2006 Guidelines
Gas natural Import 48 56.1 0.001 0.0001 IPCC 2006 Guidelines
Liquid or liquid gas fuel for lighter Import 40.4 73.3 0.003 0.0006 IPCC 2006 Guidelines
Liquidified petroleum gas (LPG) Import 47.3 63.1 0.001 0.0001 IPCC 2006 Guidelines
Propane and butanes, liquefied, n.e.c. Import 47.3 63.1 0.001 0.0001 IPCC 2006 Guidelines
Butadiene Import
Butylene Import
C-4 Raffinate Import
Ethylene Import
Import
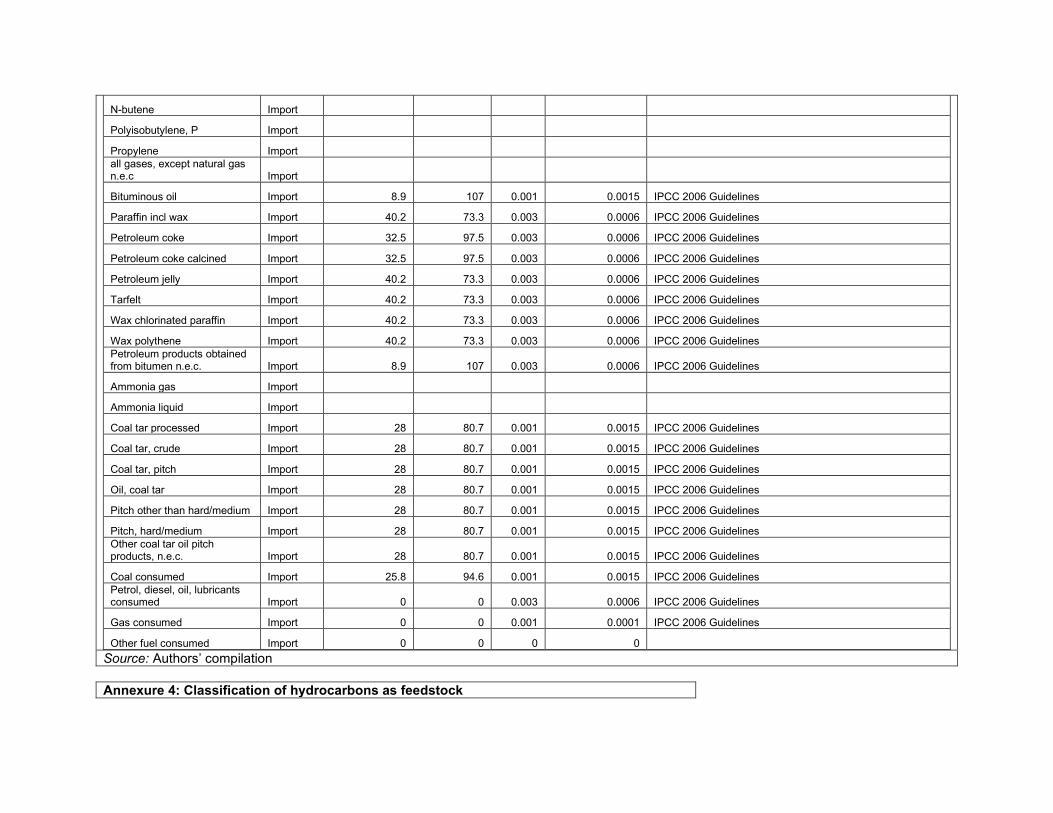
N-butene Import
Polyisobutylene, P Import
Propylene Import
all gases, except natural gas n.e.c Import
Bituminous oil Import 8.9 107 0.001 0.0015 IPCC 2006 Guidelines
Paraffin incl wax Import 40.2 73.3 0.003 0.0006 IPCC 2006 Guidelines
Petroleum coke Import 32.5 97.5 0.003 0.0006 IPCC 2006 Guidelines
Petroleum coke calcined Import 32.5 97.5 0.003 0.0006 IPCC 2006 Guidelines
Petroleum jelly Import 40.2 73.3 0.003 0.0006 IPCC 2006 Guidelines
Tarfelt Import 40.2 73.3 0.003 0.0006 IPCC 2006 Guidelines
Wax chlorinated paraffin Import 40.2 73.3 0.003 0.0006 IPCC 2006 Guidelines
Wax polythene Import 40.2 73.3 0.003 0.0006 IPCC 2006 Guidelines
Petroleum products obtained from bitumen n.e.c. Import 8.9 107 0.003 0.0006 IPCC 2006 Guidelines
Ammonia gas Import
Ammonia liquid Import
Coal tar processed Import 28 80.7 0.001 0.0015 IPCC 2006 Guidelines
Coal tar, crude Import 28 80.7 0.001 0.0015 IPCC 2006 Guidelines
Coal tar, pitch Import 28 80.7 0.001 0.0015 IPCC 2006 Guidelines
Oil, coal tar Import 28 80.7 0.001 0.0015 IPCC 2006 Guidelines
Pitch other than hard/medium Import 28 80.7 0.001 0.0015 IPCC 2006 Guidelines
Pitch, hard/medium Import 28 80.7 0.001 0.0015 IPCC 2006 Guidelines
Other coal tar oil pitch products, n.e.c. Import 28 80.7 0.001 0.0015 IPCC 2006 Guidelines
Coal consumed Import 25.8 94.6 0.001 0.0015 IPCC 2006 Guidelines
Petrol, diesel, oil, lubricants consumed Import 0 0 0.003 0.0006 IPCC 2006 Guidelines
Gas consumed Import 0 0 0.001 0.0001 IPCC 2006 Guidelines
Other fuel consumed Import 0 0 0 0
Source: Authors’ compilation
Annexure 4: Classification of hydrocarbons as feedstock
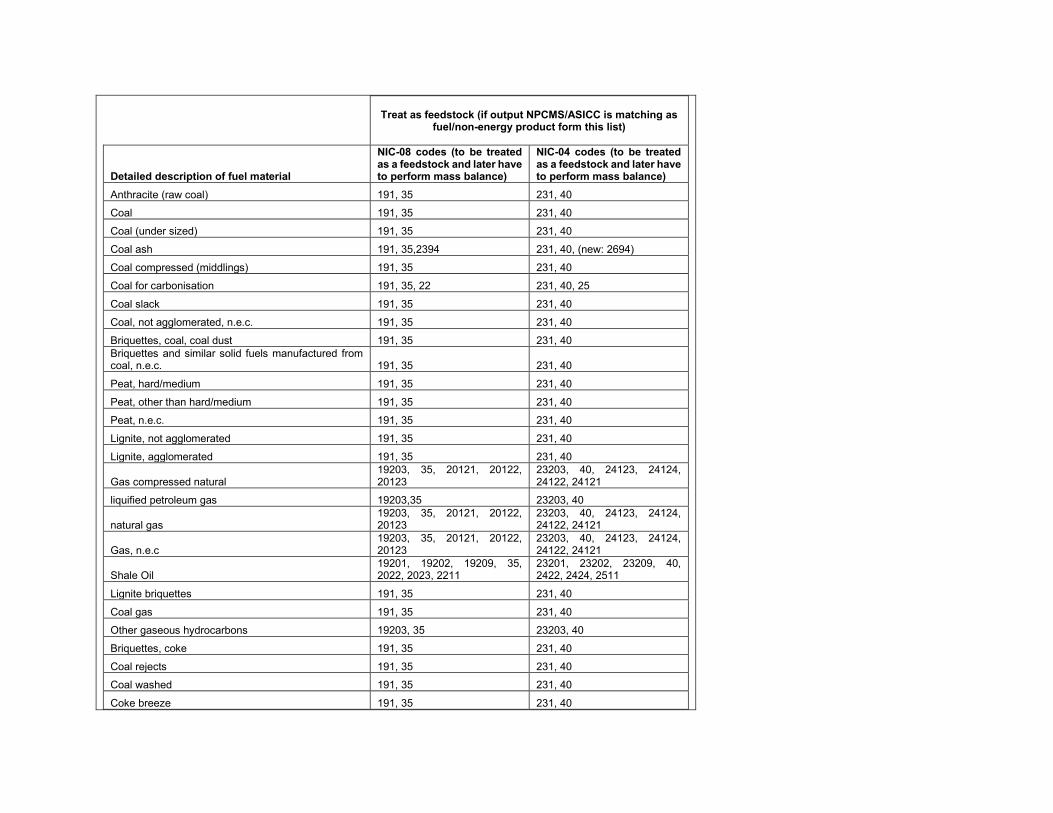
Treat as feedstock (if output NPCMS/ASICC is matching as fuel/non-energy product form this list)
Detailed description of fuel material
NIC-08 codes (to be treated as a feedstock and later have to perform mass balance)
NIC-04 codes (to be treated as a feedstock and later have to perform mass balance)
Anthracite (raw coal) 191, 35 231, 40
Coal 191, 35 231, 40
Coal (under sized) 191, 35 231, 40
Coal ash 191, 35,2394 231, 40, (new: 2694)
Coal compressed (middlings) 191, 35 231, 40
Coal for carbonisation 191, 35, 22 231, 40, 25
Coal slack 191, 35 231, 40
Coal, not agglomerated, n.e.c. 191, 35 231, 40
Briquettes, coal, coal dust 191, 35 231, 40
Briquettes and similar solid fuels manufactured from coal, n.e.c. 191, 35 231, 40
Peat, hard/medium 191, 35 231, 40
Peat, other than hard/medium 191, 35 231, 40
Peat, n.e.c. 191, 35 231, 40
Lignite, not agglomerated 191, 35 231, 40
Lignite, agglomerated 191, 35 231, 40
Gas compressed natural 19203, 35, 20121, 20122, 20123
23203, 40, 24123, 24124, 24122, 24121
liquified petroleum gas 19203,35 23203, 40
natural gas 19203, 35, 20121, 20122, 20123
23203, 40, 24123, 24124, 24122, 24121
Gas, n.e.c 19203, 35, 20121, 20122, 20123
23203, 40, 24123, 24124, 24122, 24121
Shale Oil 19201, 19202, 19209, 35, 2022, 2023, 2211
23201, 23202, 23209, 40, 2422, 2424, 2511
Lignite briquettes 191, 35 231, 40
Coal gas 191, 35 231, 40
Other gaseous hydrocarbons 19203, 35 23203, 40
Briquettes, coke 191, 35 231, 40
Coal rejects 191, 35 231, 40
Coal washed 191, 35 231, 40
Coke breeze 191, 35 231, 40
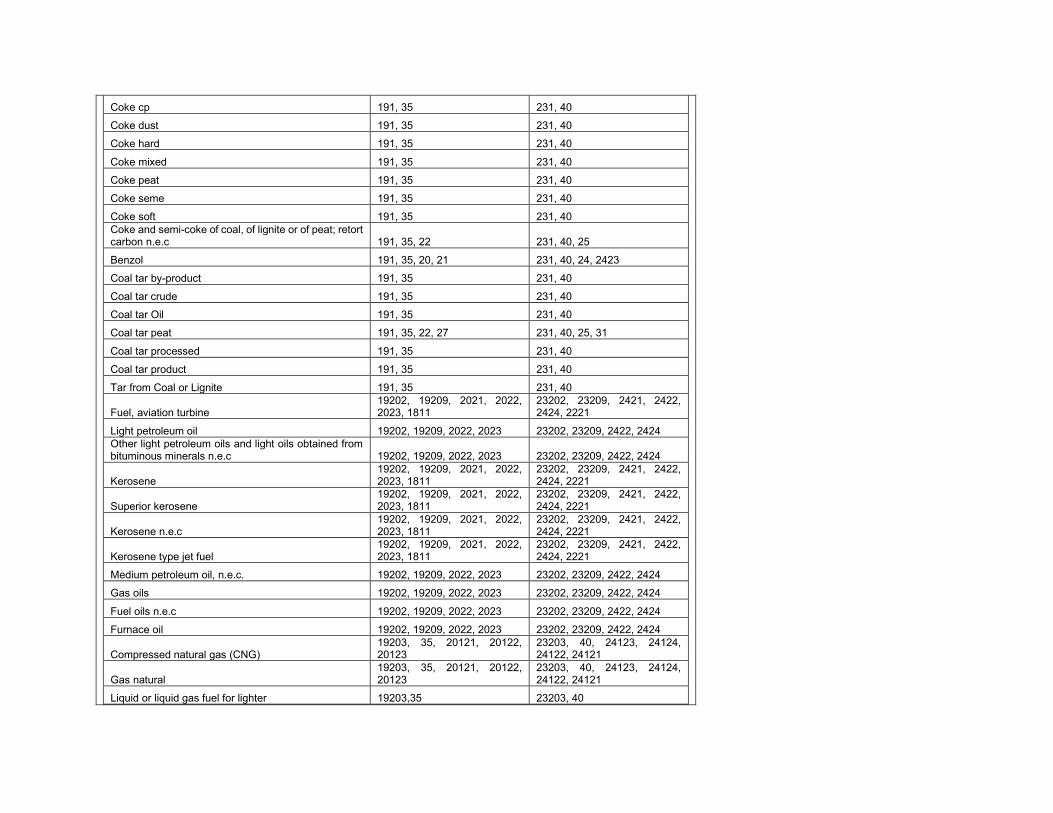
Coke cp 191, 35 231, 40
Coke dust 191, 35 231, 40
Coke hard 191, 35 231, 40
Coke mixed 191, 35 231, 40
Coke peat 191, 35 231, 40
Coke seme 191, 35 231, 40
Coke soft 191, 35 231, 40
Coke and semi-coke of coal, of lignite or of peat; retort carbon n.e.c 191, 35, 22 231, 40, 25
Benzol 191, 35, 20, 21 231, 40, 24, 2423
Coal tar by-product 191, 35 231, 40
Coal tar crude 191, 35 231, 40
Coal tar Oil 191, 35 231, 40
Coal tar peat 191, 35, 22, 27 231, 40, 25, 31
Coal tar processed 191, 35 231, 40
Coal tar product 191, 35 231, 40
Tar from Coal or Lignite 191, 35 231, 40
Fuel, aviation turbine 19202, 19209, 2021, 2022, 2023, 1811
23202, 23209, 2421, 2422, 2424, 2221
Light petroleum oil 19202, 19209, 2022, 2023 23202, 23209, 2422, 2424
Other light petroleum oils and light oils obtained from bituminous minerals n.e.c 19202, 19209, 2022, 2023 23202, 23209, 2422, 2424
Kerosene 19202, 19209, 2021, 2022, 2023, 1811
23202, 23209, 2421, 2422, 2424, 2221
Superior kerosene 19202, 19209, 2021, 2022, 2023, 1811
23202, 23209, 2421, 2422, 2424, 2221
Kerosene n.e.c 19202, 19209, 2021, 2022, 2023, 1811
23202, 23209, 2421, 2422, 2424, 2221
Kerosene type jet fuel 19202, 19209, 2021, 2022, 2023, 1811
23202, 23209, 2421, 2422, 2424, 2221
Medium petroleum oil, n.e.c. 19202, 19209, 2022, 2023 23202, 23209, 2422, 2424
Gas oils 19202, 19209, 2022, 2023 23202, 23209, 2422, 2424
Fuel oils n.e.c 19202, 19209, 2022, 2023 23202, 23209, 2422, 2424
Furnace oil 19202, 19209, 2022, 2023 23202, 23209, 2422, 2424
Compressed natural gas (CNG) 19203, 35, 20121, 20122, 20123
23203, 40, 24123, 24124, 24122, 24121
Gas natural 19203, 35, 20121, 20122, 20123
23203, 40, 24123, 24124, 24122, 24121
Liquid or liquid gas fuel for lighter 19203,35 23203, 40
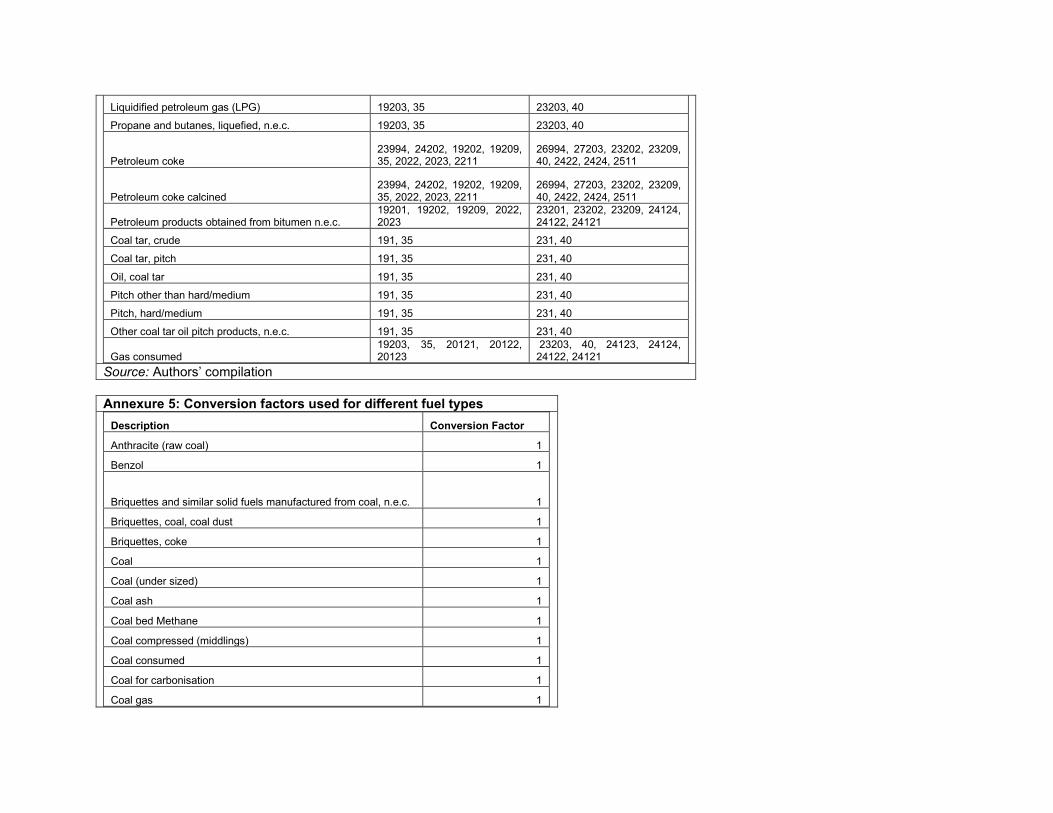
Liquidified petroleum gas (LPG) 19203, 35 23203, 40
Propane and butanes, liquefied, n.e.c. 19203, 35 23203, 40
Petroleum coke 23994, 24202, 19202, 19209, 35, 2022, 2023, 2211
26994, 27203, 23202, 23209, 40, 2422, 2424, 2511
Petroleum coke calcined 23994, 24202, 19202, 19209, 35, 2022, 2023, 2211
26994, 27203, 23202, 23209, 40, 2422, 2424, 2511
Petroleum products obtained from bitumen n.e.c. 19201, 19202, 19209, 2022, 2023
23201, 23202, 23209, 24124, 24122, 24121
Coal tar, crude 191, 35 231, 40
Coal tar, pitch 191, 35 231, 40
Oil, coal tar 191, 35 231, 40
Pitch other than hard/medium 191, 35 231, 40
Pitch, hard/medium 191, 35 231, 40
Other coal tar oil pitch products, n.e.c. 191, 35 231, 40
Gas consumed 19203, 35, 20121, 20122, 20123
23203, 40, 24123, 24124, 24122, 24121
Source: Authors’ compilation
Annexure 5: Conversion factors used for different fuel types
Description Conversion Factor
Anthracite (raw coal) 1
Benzol 1
Briquettes and similar solid fuels manufactured from coal, n.e.c. 1
Briquettes, coal, coal dust 1
Briquettes, coke 1
Coal 1
Coal (under sized) 1
Coal ash 1
Coal bed Methane 1
Coal compressed (middlings) 1
Coal consumed 1
Coal for carbonisation 1
Coal gas 1
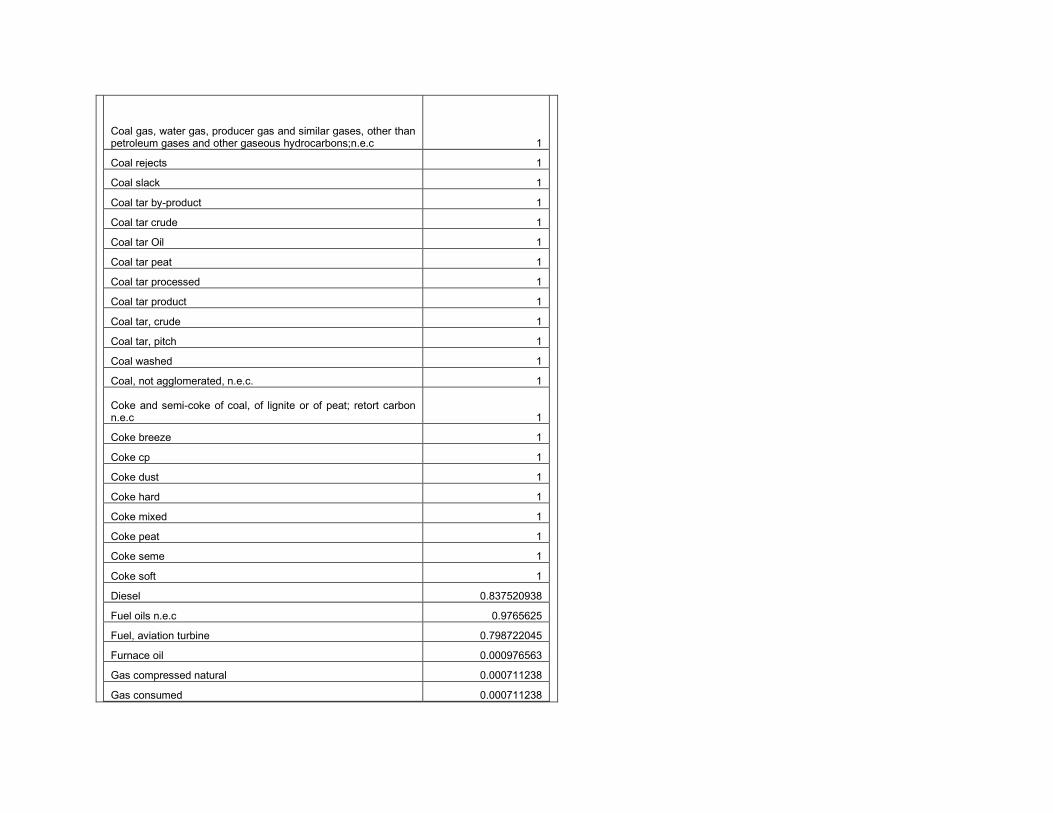
Coal gas, water gas, producer gas and similar gases, other than petroleum gases and other gaseous hydrocarbons;n.e.c 1
Coal rejects 1
Coal slack 1
Coal tar by-product 1
Coal tar crude 1
Coal tar Oil 1
Coal tar peat 1
Coal tar processed 1
Coal tar product 1
Coal tar, crude 1
Coal tar, pitch 1
Coal washed 1
Coal, not agglomerated, n.e.c. 1
Coke and semi-coke of coal, of lignite or of peat; retort carbon n.e.c 1
Coke breeze 1
Coke cp 1
Coke dust 1
Coke hard 1
Coke mixed 1
Coke peat 1
Coke seme 1
Coke soft 1
Diesel 0.837520938
Fuel oils n.e.c 0.9765625
Fuel, aviation turbine 0.798722045
Furnace oil 0.000976563
Gas compressed natural 0.000711238
Gas consumed 0.000711238
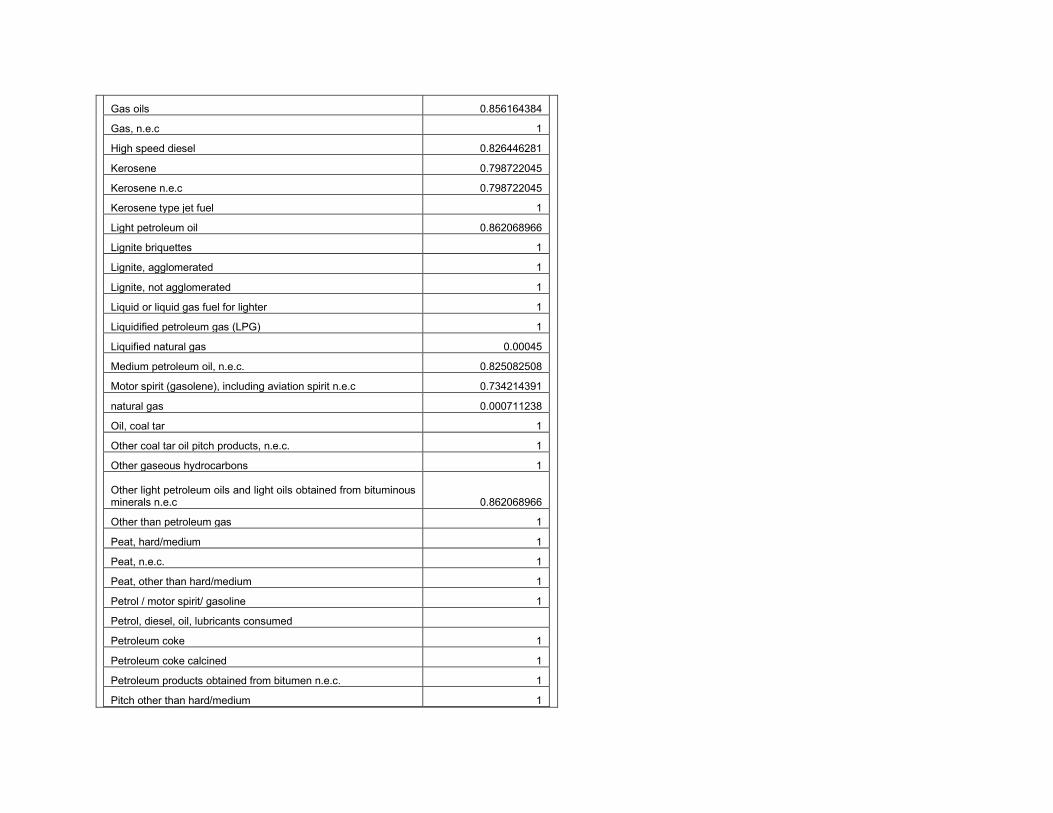
Gas oils 0.856164384
Gas, n.e.c 1
High speed diesel 0.826446281
Kerosene 0.798722045
Kerosene n.e.c 0.798722045
Kerosene type jet fuel 1
Light petroleum oil 0.862068966
Lignite briquettes 1
Lignite, agglomerated 1
Lignite, not agglomerated 1
Liquid or liquid gas fuel for lighter 1
Liquidified petroleum gas (LPG) 1
Liquified natural gas 0.00045
Medium petroleum oil, n.e.c. 0.825082508
Motor spirit (gasolene), including aviation spirit n.e.c 0.734214391
natural gas 0.000711238
Oil, coal tar 1
Other coal tar oil pitch products, n.e.c. 1
Other gaseous hydrocarbons 1
Other light petroleum oils and light oils obtained from bituminous minerals n.e.c 0.862068966
Other than petroleum gas 1
Peat, hard/medium 1
Peat, n.e.c. 1
Peat, other than hard/medium 1
Petrol / motor spirit/ gasoline 1
Petrol, diesel, oil, lubricants consumed
Petroleum coke 1
Petroleum coke calcined 1
Petroleum products obtained from bitumen n.e.c. 1
Pitch other than hard/medium 1
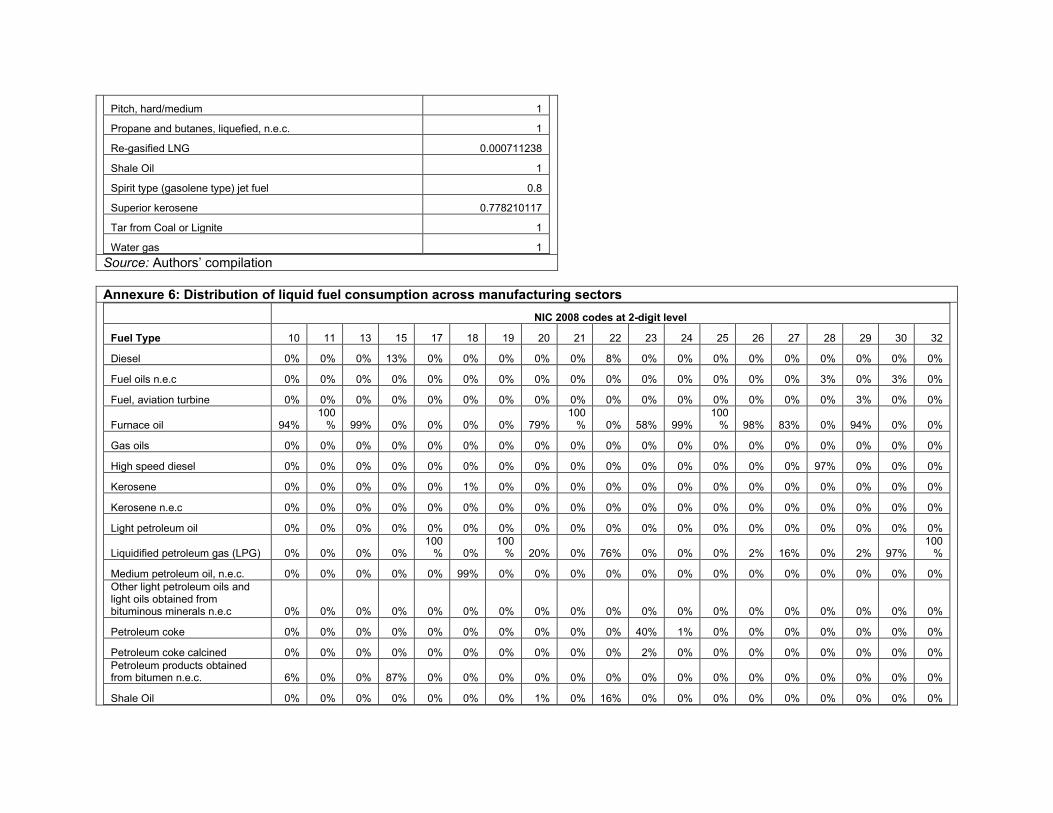
Pitch, hard/medium 1
Propane and butanes, liquefied, n.e.c. 1
Re-gasified LNG 0.000711238
Shale Oil 1
Spirit type (gasolene type) jet fuel 0.8
Superior kerosene 0.778210117
Tar from Coal or Lignite 1
Water gas 1
Source: Authors’ compilation
Annexure 6: Distribution of liquid fuel consumption across manufacturing sectors
NIC 2008 codes at 2-digit level
Fuel Type 10 11 13 15 17 18 19 20 21 22 23 24 25 26 27 28 29 30 32
Diesel 0% 0% 0% 13% 0% 0% 0% 0% 0% 8% 0% 0% 0% 0% 0% 0% 0% 0% 0%
Fuel oils n.e.c 0% 0% 0% 0% 0% 0% 0% 0% 0% 0% 0% 0% 0% 0% 0% 3% 0% 3% 0%
Fuel, aviation turbine 0% 0% 0% 0% 0% 0% 0% 0% 0% 0% 0% 0% 0% 0% 0% 0% 3% 0% 0%
Furnace oil 94% 100
% 99% 0% 0% 0% 0% 79% 100
% 0% 58% 99% 100
% 98% 83% 0% 94% 0% 0%
Gas oils 0% 0% 0% 0% 0% 0% 0% 0% 0% 0% 0% 0% 0% 0% 0% 0% 0% 0% 0%
High speed diesel 0% 0% 0% 0% 0% 0% 0% 0% 0% 0% 0% 0% 0% 0% 0% 97% 0% 0% 0%
Kerosene 0% 0% 0% 0% 0% 1% 0% 0% 0% 0% 0% 0% 0% 0% 0% 0% 0% 0% 0%
Kerosene n.e.c 0% 0% 0% 0% 0% 0% 0% 0% 0% 0% 0% 0% 0% 0% 0% 0% 0% 0% 0%
Light petroleum oil 0% 0% 0% 0% 0% 0% 0% 0% 0% 0% 0% 0% 0% 0% 0% 0% 0% 0% 0%
Liquidified petroleum gas (LPG) 0% 0% 0% 0% 100
% 0% 100
% 20% 0% 76% 0% 0% 0% 2% 16% 0% 2% 97% 100
%
Medium petroleum oil, n.e.c. 0% 0% 0% 0% 0% 99% 0% 0% 0% 0% 0% 0% 0% 0% 0% 0% 0% 0% 0%
Other light petroleum oils and light oils obtained from bituminous minerals n.e.c 0% 0% 0% 0% 0% 0% 0% 0% 0% 0% 0% 0% 0% 0% 0% 0% 0% 0% 0%
Petroleum coke 0% 0% 0% 0% 0% 0% 0% 0% 0% 0% 40% 1% 0% 0% 0% 0% 0% 0% 0%
Petroleum coke calcined 0% 0% 0% 0% 0% 0% 0% 0% 0% 0% 2% 0% 0% 0% 0% 0% 0% 0% 0%
Petroleum products obtained from bitumen n.e.c. 6% 0% 0% 87% 0% 0% 0% 0% 0% 0% 0% 0% 0% 0% 0% 0% 0% 0% 0%
Shale Oil 0% 0% 0% 0% 0% 0% 0% 1% 0% 16% 0% 0% 0% 0% 0% 0% 0% 0% 0%
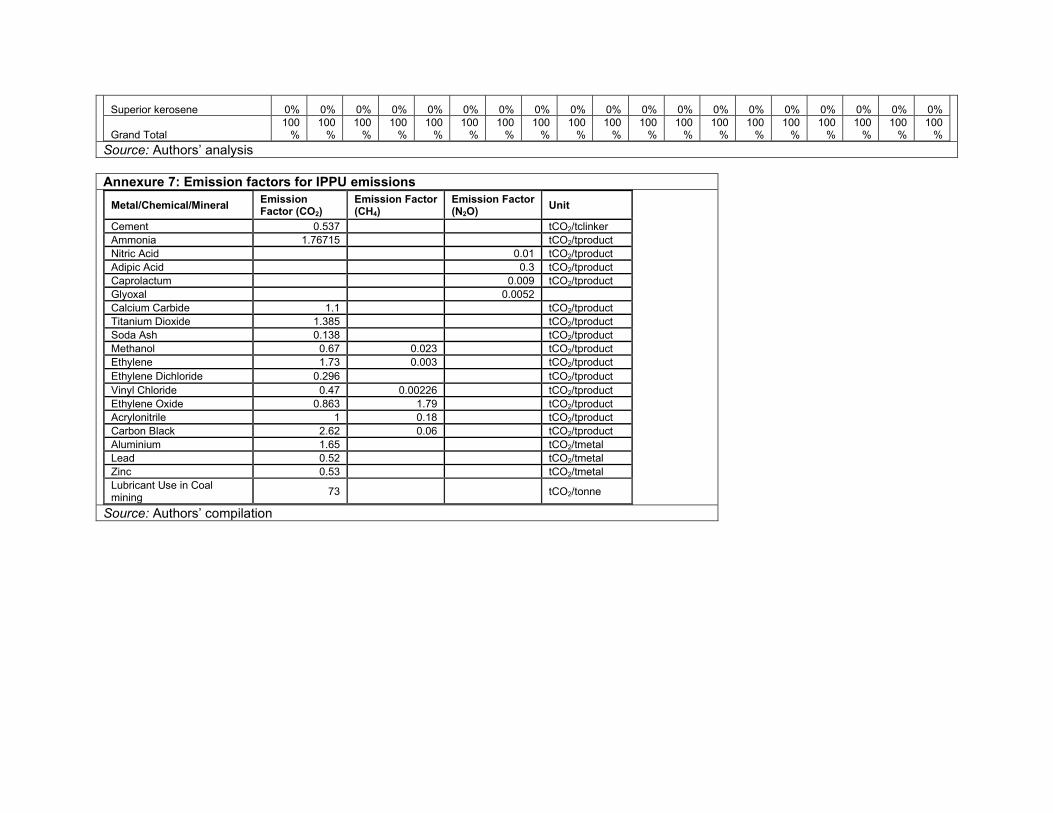
Superior kerosene 0% 0% 0% 0% 0% 0% 0% 0% 0% 0% 0% 0% 0% 0% 0% 0% 0% 0% 0%
Grand Total 100
% 100
% 100
% 100
% 100
% 100
% 100
% 100
% 100
% 100
% 100
% 100
% 100
% 100
% 100
% 100
% 100
% 100
% 100
%
Source: Authors’ analysis
Annexure 7: Emission factors for IPPU emissions
Metal/Chemical/Mineral Emission Factor (CO2)
Emission Factor (CH4)
Emission Factor (N2O)
Unit
Cement 0.537 tCO2/tclinker
Ammonia 1.76715 tCO2/tproduct
Nitric Acid 0.01 tCO2/tproduct
Adipic Acid 0.3 tCO2/tproduct
Caprolactum 0.009 tCO2/tproduct
Glyoxal 0.0052
Calcium Carbide 1.1 tCO2/tproduct
Titanium Dioxide 1.385 tCO2/tproduct
Soda Ash 0.138 tCO2/tproduct
Methanol 0.67 0.023 tCO2/tproduct
Ethylene 1.73 0.003 tCO2/tproduct
Ethylene Dichloride 0.296 tCO2/tproduct
Vinyl Chloride 0.47 0.00226 tCO2/tproduct
Ethylene Oxide 0.863 1.79 tCO2/tproduct
Acrylonitrile 1 0.18 tCO2/tproduct
Carbon Black 2.62 0.06 tCO2/tproduct
Aluminium 1.65 tCO2/tmetal
Lead 0.52 tCO2/tmetal
Zinc 0.53 tCO2/tmetal
Lubricant Use in Coal mining
73
tCO2/tonne
Source: Authors’ compilation
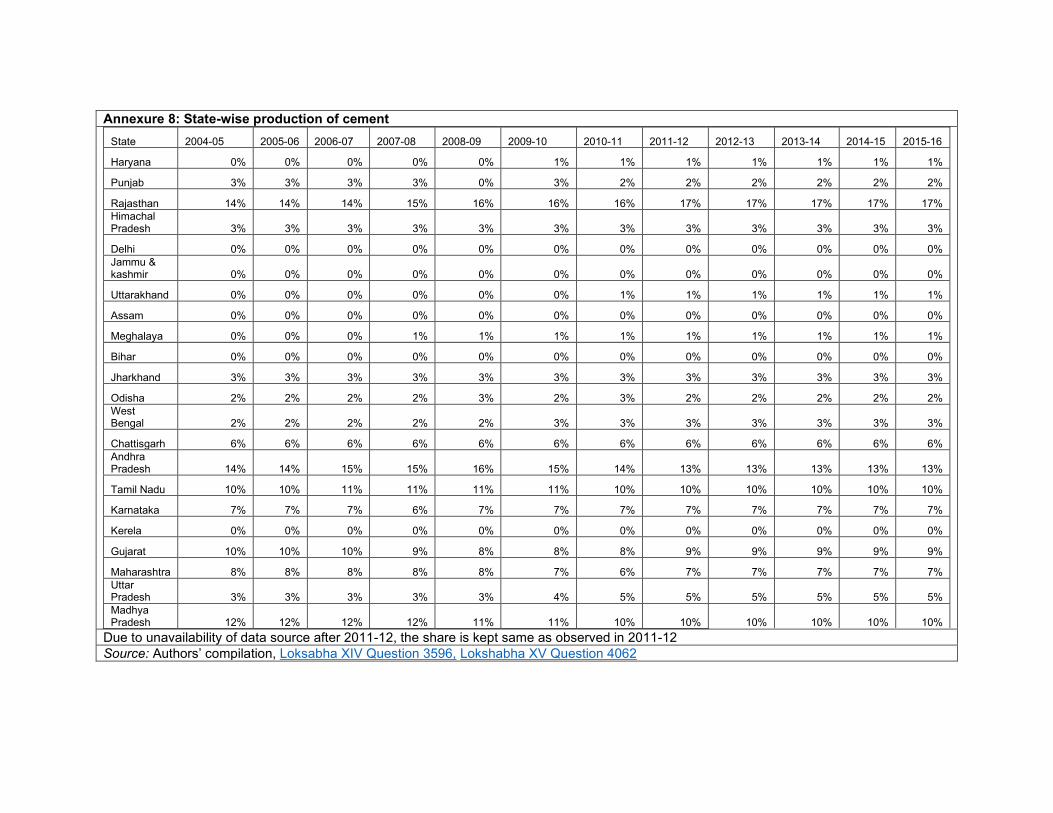
Annexure 8: State-wise production of cement
State 2004-05 2005-06 2006-07 2007-08 2008-09 2009-10 2010-11 2011-12 2012-13 2013-14 2014-15 2015-16
Haryana 0% 0% 0% 0% 0% 1% 1% 1% 1% 1% 1% 1%
Punjab 3% 3% 3% 3% 0% 3% 2% 2% 2% 2% 2% 2%
Rajasthan 14% 14% 14% 15% 16% 16% 16% 17% 17% 17% 17% 17%
Himachal Pradesh 3% 3% 3% 3% 3% 3% 3% 3% 3% 3% 3% 3%
Delhi 0% 0% 0% 0% 0% 0% 0% 0% 0% 0% 0% 0%
Jammu & kashmir 0% 0% 0% 0% 0% 0% 0% 0% 0% 0% 0% 0%
Uttarakhand 0% 0% 0% 0% 0% 0% 1% 1% 1% 1% 1% 1%
Assam 0% 0% 0% 0% 0% 0% 0% 0% 0% 0% 0% 0%
Meghalaya 0% 0% 0% 1% 1% 1% 1% 1% 1% 1% 1% 1%
Bihar 0% 0% 0% 0% 0% 0% 0% 0% 0% 0% 0% 0%
Jharkhand 3% 3% 3% 3% 3% 3% 3% 3% 3% 3% 3% 3%
Odisha 2% 2% 2% 2% 3% 2% 3% 2% 2% 2% 2% 2%
West Bengal 2% 2% 2% 2% 2% 3% 3% 3% 3% 3% 3% 3%
Chattisgarh 6% 6% 6% 6% 6% 6% 6% 6% 6% 6% 6% 6%
Andhra Pradesh 14% 14% 15% 15% 16% 15% 14% 13% 13% 13% 13% 13%
Tamil Nadu 10% 10% 11% 11% 11% 11% 10% 10% 10% 10% 10% 10%
Karnataka 7% 7% 7% 6% 7% 7% 7% 7% 7% 7% 7% 7%
Kerela 0% 0% 0% 0% 0% 0% 0% 0% 0% 0% 0% 0%
Gujarat 10% 10% 10% 9% 8% 8% 8% 9% 9% 9% 9% 9%
Maharashtra 8% 8% 8% 8% 8% 7% 6% 7% 7% 7% 7% 7%
Uttar Pradesh 3% 3% 3% 3% 3% 4% 5% 5% 5% 5% 5% 5%
Madhya Pradesh 12% 12% 12% 12% 11% 11% 10% 10% 10% 10% 10% 10%
Due to unavailability of data source after 2011-12, the share is kept same as observed in 2011-12
Source: Authors’ compilation, Loksabha XIV Question 3596, Lokshabha XV Question 4062
Annexure 9: State – wise production of chemicals covered under IPPU emissions IPCC Sector
Description
Production (000 MT)
2B Chemical Industry
2004-05 2005-06 2006-07 2007-08 2008-09 2009-10 2010-11 2011-12 2012-13 2013-14 2014-15 2015-16
2B1 Ammonia Production
Total Producti
on
11480.85
11387.35
11507.13
11252.34
11286.56
11961.50
12397.65
12455.14
12790.79
12869.88
12796.10
13866.98
Gujarat Prod. Capacity
32.64% 32.64% 32.64% 32.64% 32.64% 32.64% 32.64% 32.64% 32.64% 32.64% 32.64% 32.64%
Production
3747.35 3716.83 3755.93 3672.76 3683.93
3904.23 4046.59 4065.36 4174.91 4200.73 4176.65
4526.18
Uttar Pradesh
Prod. Capacity
25.19% 25.19% 25.19% 25.19% 25.19% 25.19% 25.19% 25.19% 25.19% 25.19% 25.19% 25.19%
Production
2892.03 2868.47 2898.65 2834.46 2843.08
3013.10 3122.97 3137.45 3222.00 3241.92 3223.34
3493.09
Rajasthan Prod. Capacity
16.95% 16.95% 16.95% 16.95% 16.95% 16.95% 16.95% 16.95% 16.95% 16.95% 16.95% 16.95%
Production
1946.00 1930.16 1950.46 1907.27 1913.07
2027.47 2101.40 2111.15 2168.04 2181.44 2168.94
2350.45
Andhra Pradesh
Prod. Capacity
3.34% 3.34% 3.34% 3.34% 3.34% 3.34% 3.34% 3.34% 3.34% 3.34% 3.34% 3.34%
Production
383.46 380.34 384.34 375.83 376.97 399.51 414.08 416.00 427.21 429.85 427.39 463.16
West Bengal
Prod. Capacity
10.24% 10.24% 10.24% 10.24% 10.24% 10.24% 10.24% 10.24% 10.24% 10.24% 10.24% 10.24%
Production
1175.64 1166.06 1178.33 1152.24 1155.74
1224.86 1269.52 1275.41 1309.78 1317.88 1310.32
1419.98
Maharashtra
Prod. Capacity
7.45% 7.45% 7.45% 7.45% 7.45% 7.45% 7.45% 7.45% 7.45% 7.45% 7.45% 7.45%
Production
855.32 848.36 857.28 838.30 840.85 891.13 923.63 927.91 952.91 958.81 953.31 1033.09
Kerala Prod. Capacity
4.19% 4.19% 4.19% 4.19% 4.19% 4.19% 4.19% 4.19% 4.19% 4.19% 4.19% 4.19%
Production
481.05 477.13 482.15 471.47 472.91 501.19 519.46 521.87 535.93 539.25 536.16 581.03
2B2 Nitric Acid Production
Total Producti
on
Not Available
2B3 Adipic Acid Production
Total Producti
on
Not Available
2B4 Caprolactam, Glyoxal and Glyoxylic Acid Production
Caprolactum
Total Producti
on
122 117 121 86 84 123 123 118 99 85 87 86
Kerala Prod. Capacity
41.70% 41.70% 41.70% 41.70% 41.70% 41.70% 41.70% 41.70% 41.70% 41.70% 41.70% 41.70%
Production
50.874 48.789 50.457 35.862 35.028 51.291 51.291 49.206 41.283 35.445 36.279 35.862
Gujarat Prod. Capacity
58.30% 58.30% 58.30% 58.30% 58.30% 58.30% 58.30% 58.30% 58.30% 58.30% 58.30% 58.30%
Production
71.126 68.211 70.543 50.138 48.972 71.709 71.709 68.794 57.717 49.555 50.721 50.138
Glyoxal Not Available
Glyoxalic Acid
2B5 Carbide Production
Calcium Carbide
Total Producti
on
52.73 64.64 91.95 97.41 66.55 22.02 44.7 66.39 70.98 78.78 87.18 83.47
Rajasthan Prod. Capacity
100% 100% 100% 100% 100% 100% 100% 100% 100% 100% 100% 100%
Production
52.73 64.64 91.95 97.41 66.55 22.02 44.7 66.39 70.98 78.78 87.18 83.47
2B6 Titanium Dioxide
Production
Total Producti
on
57.56 60.29 62.92 59.15 53.28 61.32 64.02 52.14 50.14 52.78 47.88 58.83
Kerala Prod. Capacity
77% 77% 77% 77% 77% 77% 77% 77% 77% 77% 82% 82%
Production
44.3212 46.4233 48.4484 45.5455 41.0256
47.2164 49.2954 40.1478 38.6078 40.6406 39.2616
48.2406
Tamil Nadu Prod. Capacity
23% 23% 23% 23% 23% 23% 23% 23% 23% 23% 18% 18%
Production
13.2388 13.8667 14.4716 13.6045 12.2544
14.1036 14.7246 11.9922 11.5322 12.1394 8.6184 10.5894
2B7 Soda Ash Production
Total Producti
on
2287.24 2298.24 2078.06 2005.51 1989.05
2058.34 2298.76 2410.82 2437.79 2392.17 2462 2583.01
Gujarat Prod. Capacity
96% 96% 96% 96% 96% 96% 96% 96% 96% 96% 96% 96%
Production
2195.7504
2206.3104
1994.9376
1925.2896
1909.488
1976.0064
2206.8096
2314.3872
2340.2784
2296.4832
2363.52
2479.6896
Kerala Prod. Capacity
4% 4% 4% 4% 4% 4% 4% 4% 4% 4% 4% 4%
Production
91.4896 91.9296 83.1224 80.2204 79.562 82.3336 91.9504 96.4328 97.5116 95.6868 98.48 103.3204
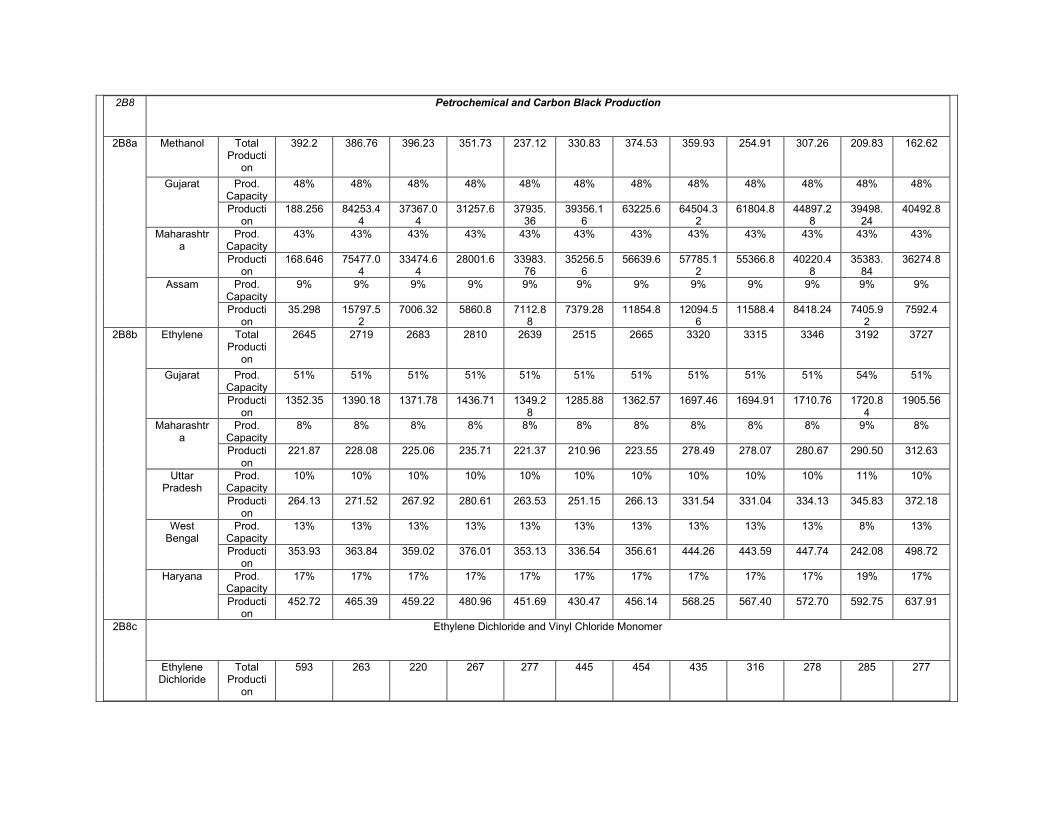
2B8 Petrochemical and Carbon Black Production
2B8a Methanol Total Producti
on
392.2 386.76 396.23 351.73 237.12 330.83 374.53 359.93 254.91 307.26 209.83 162.62
Gujarat Prod. Capacity
48% 48% 48% 48% 48% 48% 48% 48% 48% 48% 48% 48%
Production
188.256 84253.44
37367.04
31257.6 37935.36
39356.16
63225.6 64504.32
61804.8 44897.28
39498.24
40492.8
Maharashtra
Prod. Capacity
43% 43% 43% 43% 43% 43% 43% 43% 43% 43% 43% 43%
Production
168.646 75477.04
33474.64
28001.6 33983.76
35256.56
56639.6 57785.12
55366.8 40220.48
35383.84
36274.8
Assam Prod. Capacity
9% 9% 9% 9% 9% 9% 9% 9% 9% 9% 9% 9%
Production
35.298 15797.52
7006.32 5860.8 7112.88
7379.28 11854.8 12094.56
11588.4 8418.24 7405.92
7592.4
2B8b Ethylene Total Producti
on
2645 2719 2683 2810 2639 2515 2665 3320 3315 3346 3192 3727
Gujarat Prod. Capacity
51% 51% 51% 51% 51% 51% 51% 51% 51% 51% 54% 51%
Production
1352.35 1390.18 1371.78 1436.71 1349.28
1285.88 1362.57 1697.46 1694.91 1710.76 1720.84
1905.56
Maharashtra
Prod. Capacity
8% 8% 8% 8% 8% 8% 8% 8% 8% 8% 9% 8%
Production
221.87 228.08 225.06 235.71 221.37 210.96 223.55 278.49 278.07 280.67 290.50 312.63
Uttar Pradesh
Prod. Capacity
10% 10% 10% 10% 10% 10% 10% 10% 10% 10% 11% 10%
Production
264.13 271.52 267.92 280.61 263.53 251.15 266.13 331.54 331.04 334.13 345.83 372.18
West Bengal
Prod. Capacity
13% 13% 13% 13% 13% 13% 13% 13% 13% 13% 8% 13%
Production
353.93 363.84 359.02 376.01 353.13 336.54 356.61 444.26 443.59 447.74 242.08 498.72
Haryana Prod. Capacity
17% 17% 17% 17% 17% 17% 17% 17% 17% 17% 19% 17%
Production
452.72 465.39 459.22 480.96 451.69 430.47 456.14 568.25 567.40 572.70 592.75 637.91
2B8c Ethylene Dichloride and Vinyl Chloride Monomer
Ethylene Dichloride
Total Producti
on
593 263 220 267 277 445 454 435 316 278 285 277
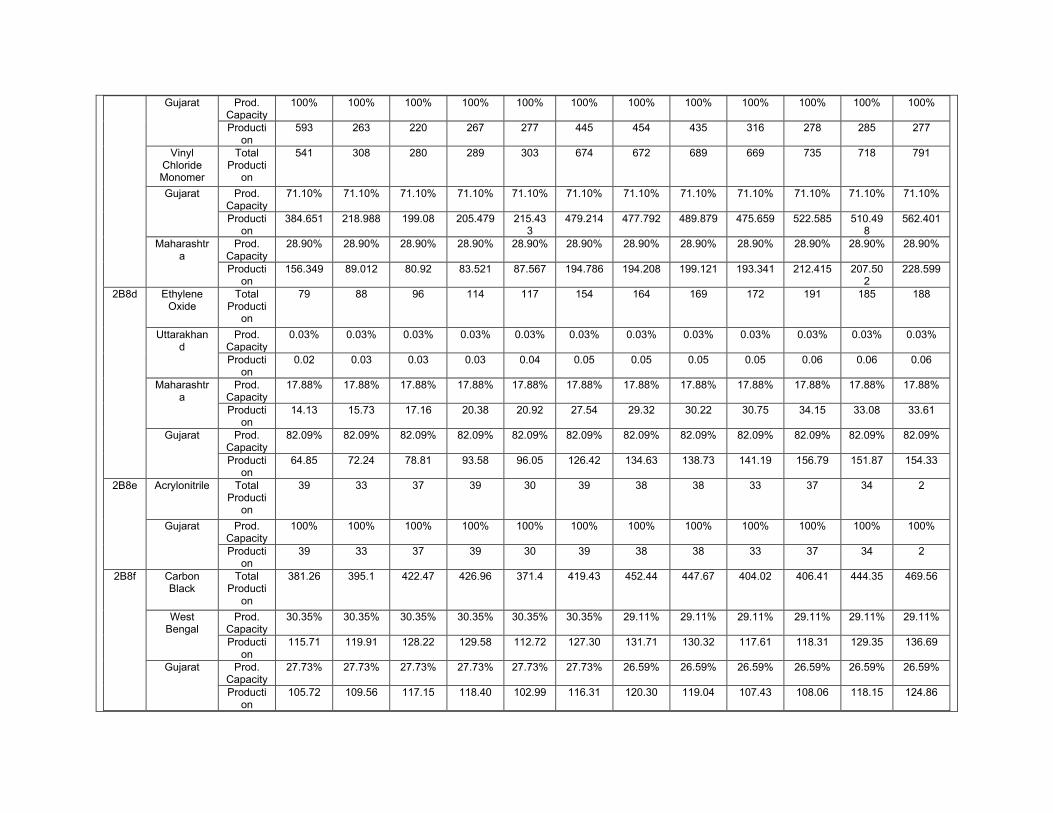
Gujarat Prod. Capacity
100% 100% 100% 100% 100% 100% 100% 100% 100% 100% 100% 100%
Production
593 263 220 267 277 445 454 435 316 278 285 277
Vinyl Chloride Monomer
Total Producti
on
541 308 280 289 303 674 672 689 669 735 718 791
Gujarat Prod. Capacity
71.10% 71.10% 71.10% 71.10% 71.10% 71.10% 71.10% 71.10% 71.10% 71.10% 71.10% 71.10%
Production
384.651 218.988 199.08 205.479 215.433
479.214 477.792 489.879 475.659 522.585 510.498
562.401
Maharashtra
Prod. Capacity
28.90% 28.90% 28.90% 28.90% 28.90% 28.90% 28.90% 28.90% 28.90% 28.90% 28.90% 28.90%
Production
156.349 89.012 80.92 83.521 87.567 194.786 194.208 199.121 193.341 212.415 207.502
228.599
2B8d Ethylene Oxide
Total Producti
on
79 88 96 114 117 154 164 169 172 191 185 188
Uttarakhand
Prod. Capacity
0.03% 0.03% 0.03% 0.03% 0.03% 0.03% 0.03% 0.03% 0.03% 0.03% 0.03% 0.03%
Production
0.02 0.03 0.03 0.03 0.04 0.05 0.05 0.05 0.05 0.06 0.06 0.06
Maharashtra
Prod. Capacity
17.88% 17.88% 17.88% 17.88% 17.88% 17.88% 17.88% 17.88% 17.88% 17.88% 17.88% 17.88%
Production
14.13 15.73 17.16 20.38 20.92 27.54 29.32 30.22 30.75 34.15 33.08 33.61
Gujarat Prod. Capacity
82.09% 82.09% 82.09% 82.09% 82.09% 82.09% 82.09% 82.09% 82.09% 82.09% 82.09% 82.09%
Production
64.85 72.24 78.81 93.58 96.05 126.42 134.63 138.73 141.19 156.79 151.87 154.33
2B8e Acrylonitrile Total Producti
on
39 33 37 39 30 39 38 38 33 37 34 2
Gujarat Prod. Capacity
100% 100% 100% 100% 100% 100% 100% 100% 100% 100% 100% 100%
Production
39 33 37 39 30 39 38 38 33 37 34 2
2B8f Carbon Black
Total Producti
on
381.26 395.1 422.47 426.96 371.4 419.43 452.44 447.67 404.02 406.41 444.35 469.56
West Bengal
Prod. Capacity
30.35% 30.35% 30.35% 30.35% 30.35% 30.35% 29.11% 29.11% 29.11% 29.11% 29.11% 29.11%
Production
115.71 119.91 128.22 129.58 112.72 127.30 131.71 130.32 117.61 118.31 129.35 136.69
Gujarat Prod. Capacity
27.73% 27.73% 27.73% 27.73% 27.73% 27.73% 26.59% 26.59% 26.59% 26.59% 26.59% 26.59%
Production
105.72 109.56 117.15 118.40 102.99 116.31 120.30 119.04 107.43 108.06 118.15 124.86
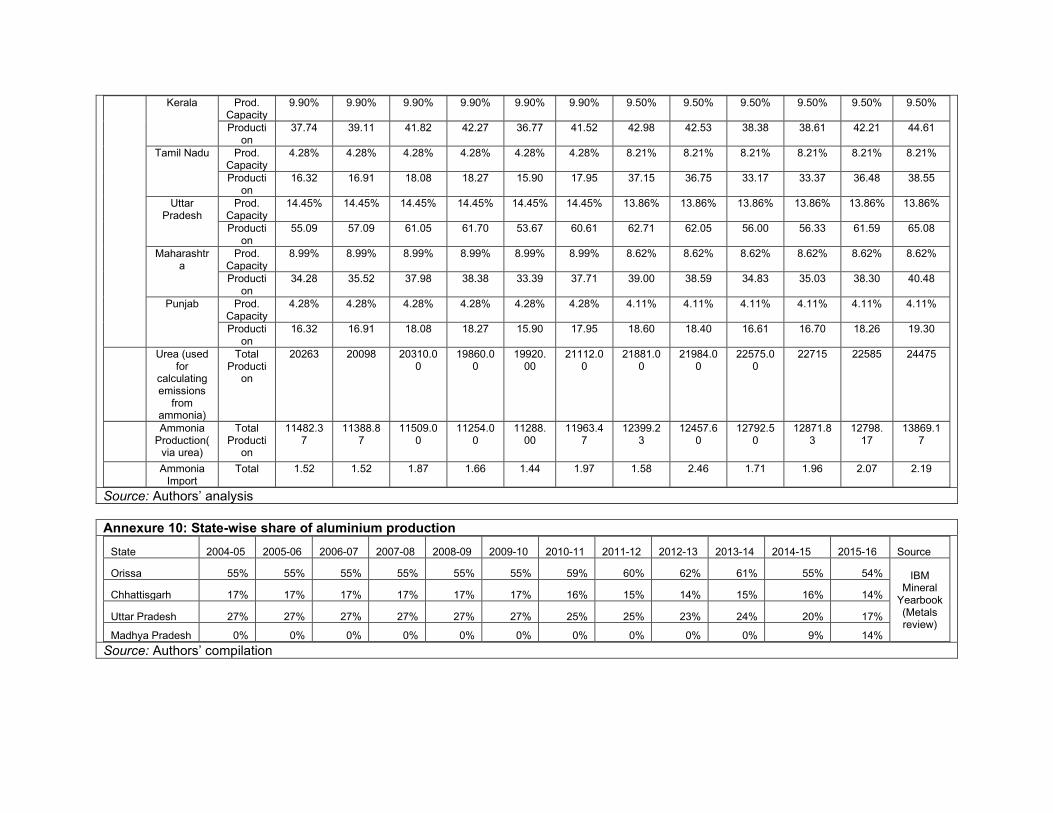
Kerala Prod. Capacity
9.90% 9.90% 9.90% 9.90% 9.90% 9.90% 9.50% 9.50% 9.50% 9.50% 9.50% 9.50%
Production
37.74 39.11 41.82 42.27 36.77 41.52 42.98 42.53 38.38 38.61 42.21 44.61
Tamil Nadu Prod. Capacity
4.28% 4.28% 4.28% 4.28% 4.28% 4.28% 8.21% 8.21% 8.21% 8.21% 8.21% 8.21%
Production
16.32 16.91 18.08 18.27 15.90 17.95 37.15 36.75 33.17 33.37 36.48 38.55
Uttar Pradesh
Prod. Capacity
14.45% 14.45% 14.45% 14.45% 14.45% 14.45% 13.86% 13.86% 13.86% 13.86% 13.86% 13.86%
Production
55.09 57.09 61.05 61.70 53.67 60.61 62.71 62.05 56.00 56.33 61.59 65.08
Maharashtra
Prod. Capacity
8.99% 8.99% 8.99% 8.99% 8.99% 8.99% 8.62% 8.62% 8.62% 8.62% 8.62% 8.62%
Production
34.28 35.52 37.98 38.38 33.39 37.71 39.00 38.59 34.83 35.03 38.30 40.48
Punjab Prod. Capacity
4.28% 4.28% 4.28% 4.28% 4.28% 4.28% 4.11% 4.11% 4.11% 4.11% 4.11% 4.11%
Production
16.32 16.91 18.08 18.27 15.90 17.95 18.60 18.40 16.61 16.70 18.26 19.30
Urea (used
for calculating emissions
from ammonia)
Total Producti
on
20263 20098 20310.00
19860.00
19920.00
21112.00
21881.00
21984.00
22575.00
22715 22585 24475
Ammonia
Production(via urea)
Total Producti
on
11482.37
11388.87
11509.00
11254.00
11288.00
11963.47
12399.23
12457.60
12792.50
12871.83
12798.17
13869.17
Ammonia
Import Total 1.52 1.52 1.87 1.66 1.44 1.97 1.58 2.46 1.71 1.96 2.07 2.19
Source: Authors’ analysis
Annexure 10: State-wise share of aluminium production
State 2004-05 2005-06 2006-07 2007-08 2008-09 2009-10 2010-11 2011-12 2012-13 2013-14 2014-15 2015-16 Source
Orissa 55% 55% 55% 55% 55% 55% 59% 60% 62% 61% 55% 54% IBM Mineral
Yearbook (Metals review)
Chhattisgarh 17% 17% 17% 17% 17% 17% 16% 15% 14% 15% 16% 14%
Uttar Pradesh 27% 27% 27% 27% 27% 27% 25% 25% 23% 24% 20% 17%
Madhya Pradesh 0% 0% 0% 0% 0% 0% 0% 0% 0% 0% 9% 14%
Source: Authors’ compilation
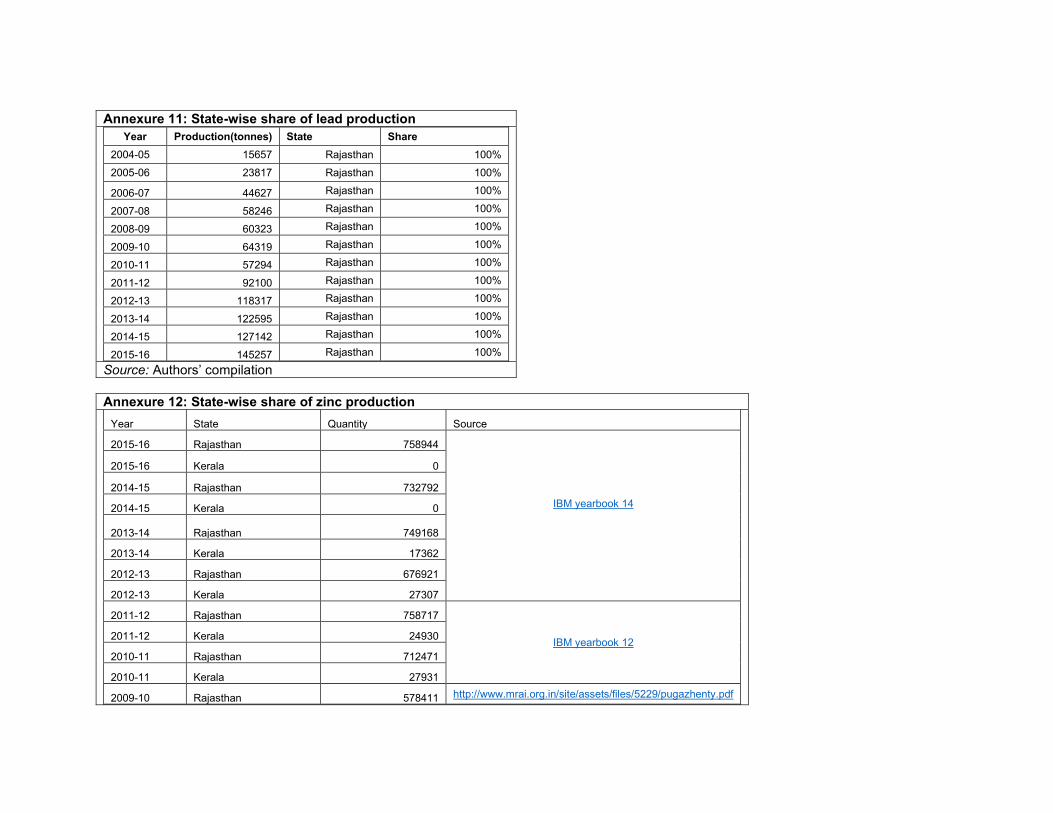
Annexure 11: State-wise share of lead production
Year Production(tonnes) State Share
2004-05 15657 Rajasthan 100%
2005-06 23817 Rajasthan 100%
2006-07 44627 Rajasthan 100%
2007-08 58246 Rajasthan 100%
2008-09 60323 Rajasthan 100%
2009-10 64319 Rajasthan 100%
2010-11 57294 Rajasthan 100%
2011-12 92100 Rajasthan 100%
2012-13 118317 Rajasthan 100%
2013-14 122595 Rajasthan 100%
2014-15 127142 Rajasthan 100%
2015-16 145257 Rajasthan 100%
Source: Authors’ compilation
Annexure 12: State-wise share of zinc production
Year State Quantity Source
2015-16 Rajasthan 758944
IBM yearbook 14
2015-16 Kerala 0
2014-15 Rajasthan 732792
2014-15 Kerala 0
2013-14 Rajasthan 749168
2013-14 Kerala 17362
2012-13 Rajasthan 676921
2012-13 Kerala 27307
2011-12 Rajasthan 758717
IBM yearbook 12
2011-12 Kerala 24930
2010-11 Rajasthan 712471
2010-11 Kerala 27931
2009-10 Rajasthan 578411 http://www.mrai.org.in/site/assets/files/5229/pugazhenty.pdf
2009-10 Kerala 35352
2008-09 Rajasthan 551724
2008-09 Kerala 30443
2007-08 Rajasthan 426323
2007-08 Kerala 31903
2006-07 Rajasthan 354423
lack of available literature; used the last available production shares
2006-07 Kerala 26522
2005-06 Rajasthan 275392
2005-06 Kerala 20608
2004-05 Rajasthan 222360
2004-05 Kerala 16640
Source: Authors’ compilation
Annexure 13: State-wise production of coal and lignite
Fuel States 2004-05 2005-06 2006-07 2007-08 2008-09 2009-10 2010-11 2011-12 2012-13 2013-14 2014-15 2015-16
Coal
Andhra Pradesh 9% 8% 8% 8% 8% 9% 9% 9% 9% 0% 0% 0%
Arunachal Pradesh 0% 0% 0% 0% 0% 0% 0% 0% 0% 0% 0% 0%
Assam 0% 0% 0% 0% 0% 0% 0% 0% 0% 0% 0% 0%
Chhattisgarh 17% 17% 18% 18% 19% 19% 20% 20% 20% 21% 20% 19%
Jammu & Kashmir 0% 0% 0% 0% 0% 0% 0% 0% 0% 0% 0% 0%
Jharkhand 19% 20% 19% 19% 18% 19% 19% 19% 18% 19% 19% 18%
Madhya Pradesh 13% 13% 13% 14% 14% 13% 12% 12% 13% 12% 13% 16%
Maharashtra 8% 8% 8% 7% 7% 7% 7% 7% 6% 6% 6% 6%
Meghalaya 1% 1% 1% 1% 1% 1% 1% 1% 1% 1% 0% 1%
Odisha 16% 16% 18% 18% 19% 19% 18% 18% 18% 19% 19% 20%
Telangana 8% 8% 9%
Uttar Pradesh 4% 4% 3% 2% 2% 2% 3% 3% 3% 2% 2% 2%
West Bengal 6% 6% 5% 5% 4% 4% 4% 4% 4% 5% 5% 4%
Lignite TamilNadu 5% 5% 5% 4% 4% 4% 4% 4% 4% 4% 4% 4%
Gujarat 2% 2% 2% 2% 2% 2% 2% 3% 2% 2% 2% 1%
Rajasthan 0% 0% 0% 0% 0% 0% 0% 1% 1% 1% 2% 1%
Source: Authors’ compilation


