Embed Size (px)
Citation preview

Working Paper.
March 31, 2022.
GLOBAL
AGRICULTURAL
GREENHOUSE
GAS EMISSIONS: Direct Fertilizer-Based
Emissions

Working Paper March 31, 2022 simpsoncentre.ca 1
GLOBAL AGRICULTURAL GREENHOUSE GAS EMISSIONS: DIRECT FERTILIZER-BASED EMISSIONS Direct Fertilizer-Based Emissions
Working Paper. March 31, 2022.
Joshua Bourassa*, Elena Vinco
Simpson Centre, The School of Public Policy, University of Calgary, Calgary, AB, Canada
* Corresponding author: [email protected]

Working Paper March 31, 2022 simpsoncentre.ca 2
ABSTRACT
Growing environmental, social, and political pressures has driven the development of policies surrounding emission
reductions. Nitrous oxide, a potent greenhouse gas, is emitted predominantly by the agricultural sector, most of which
is associated with crop production. Canada’s Strengthened Climate Plan, redefined Canadian emission targets under the
Paris Agreement, targeting the agricultural sector specifically to reduce fertilizer-based emissions. The methodology to
measure N2O emissions varies according to the International Panel on Climate Change (IPCC) varies, depending on the
use of a Tier 1, 2 or 3 approach, increasing data inclusion and resolution with Tiers. With the current methodology in
place, farmers have limited potential to reduce N2O emissions, as mitigation strategies predominantly hinge on
impractical and inaccessible options, such as reducing fertilizer application or changing location. Based on the current
measures, Canadian emissions are high relative to other major production regions. A model across IPCC Annex I parties
adjusting for average wheat yield as a benchmark and incorporating fertilizer application rate for different countries
demonstrated low-efficiency and yield in Canada. Multiple scenarios are tested to determine how an improved
Canadian efficiency measure, use of a disaggregated emission factors, and a combination of both, would influence the
model and benchmark values. Improving the methodology to measure N2O emissions would improve measurement
accuracy and support development of emission reduction policies for farmers to implement within operations
Keywords: Emission Reduction, IPCC, Fertilizer, Nitrous Oxide, Greenhouse Gas

Working Paper March 31, 2022 simpsoncentre.ca 3
Global Agricultural Greenhouse Gas Emissions:
Direct Fertilizer-Based Emissions
Canada's Strengthened Climate Plan was introduced in 2020 as an update to the Pan-Canadian Framework, with the
goal of exceeding the initial nationally determined contribution (NDC) under the Paris agreement1 (Environment and
Climate Change Canada, 2020). While the Pan-Canadian Framework left the agricultural sector relatively unaffected
(Environment and Climate Change Canada, 2016), the Strengthened Climate Plan proposed Canada’s first agricultural
sector-specific emission reduction target (Environment and Climate Change Canada, 2020, p. 45).
The proposed target sought to reduce fertilizer-based emission levels by 30 percent of 2020 levels by 2030
(Environment and Climate Change Canada, 2020, p. 45). However, at the time, no further information was included. On
February 25th, 2022, Agriculture and Agri-food Canada (AAFC) released a discussion document detailing several aspects
of the target and a pathway to emission reductions (Agriculture and Agri-Food Canada, 2022). The emission reduction
target only applies to synthetic fertilizer and covers direct N2O emissions and indirect emissions from leaching and
volatilization. Emissions from organic fertilizers, such as manure, compost, digestate, or emissions from fertilizer
production, are not explicitly covered in the reduction target. AAFC provided a list of potential short-term mitigation
options to meet the proposed target. The options primarily focused on different aspects of 4R Nutrient Stewardship2 ,
including conservation management practices and crop rotation changes.
Increasing adoption of 4R and other best management practices (BMP) poses a challenge to producers and
policymakers. This process is further complicated as Canada's methodology for estimating N2O emissions from
agricultural soils does not account for many of the proposed practices (Environment and Climate Change Canada, 2021c,
sec. A3.4.5.1). As a result, current adoption of BMPs is not reflected, possibly leading to inaccurate emission estimates.
Additionally, the current state of the methodology is a barrier to meeting reduction targets without a significant
reduction in fertilizer use. This outcome would be highly unlikely as many emission variables included in the model are
based on weather topography and soils characteristics which are outside the control of producers, see Table 1.
1 Canada’s initial NDC was to reduce greenhouse gasses by 30 percent of 2005 levels by 2030. The NDC has since been updated with the enhanced NDC setting a target to reduce greenhouse gasses by 40-45 percent of 2005 levels by 2030 (Environment and Climate Change Canada, 2021)
2 4R is a nutrient stewardship program which aims to improve fertilizer use efficiency by applying the right source at the right rate, right time, and right place (Fertilizer Canada, n.d.).

Working Paper March 31, 2022 simpsoncentre.ca 4
This report will focus on direct emissions from synthetic fertilizer, accounting for 83 percent of the total emissions
accounted within the proposed target3. It will provide a review of current emission measurements across 42 Annex I
parties to the United Nations Framework Convention on Climate Change (UNFCCC) and discuss policy implications
derived from the measurements. Additionally, international emission factors and emission intensity measures will be
compared using country-specific data from National Inventory Submissions.
DATA
Data for this report was collected from the 2021 National Inventory Submissions (NIS), including the National Inventory
Report and the Common Reporting Format (CRF) tables. The submissions were compiled from the UNFCCC NIS
repository, followed by manual data extraction. A total of 42 countries were included, comprising of all Annex I parties
to the UNFCCC (United Nations Framework Convention on Climate Change, 2022), with the exception of Monaco and
the European Union (EU). Monaco was excluded as it does not report any agricultural emissions (Direction de
l’Environnement, 2021), and the EU provides a limited summary of member states (European Environment Agency,
2021). The emission factor comparison section of this report uses data from Tables 3.d and 4.1 of each country's CRF
tables covering a period of 1990 to 2019. Table 3.d provides data on direct and indirect N2O emissions from agricultural
soils (both cropland and grasslands), while Table 4.1, provides total land area estimates for various land use categories.
Table 2 provides a list of all included countries and sources.
MEASUREMENTS
N2O is the third most emitted greenhouse gas in Canada, after CO2 and CH4, and accounts for approximately 5 percent
of total emissions, measured in CO2 equivalent (CO2e) (Environment and Climate Change Canada, 2021d, pp. 7–12).
Unique to agricultural production, roughly 80 percent of N2O originates from the agricultural sector, of which 73 percent
was attributed to crop production in 2019. Crop production N2O emissions can be divided into direct and indirect
emissions from agricultural soils, accounting for 83 and 17 percent of total N2O emissions, respectively (Environment
and Climate Change Canada, 2021d, p. 12). Direct emissions can be further subdivided by nitrogen source, the majority
being synthetic fertilizer, accounting for 52 percent of direct emissions and 43 percent of the total(Canada, 2021).
Biochemical reactions within the soil called nitrification and denitrification result in direct N2O emissions (United States
Environmental Protection Agency, 2021b, sec. 3.12). Nitrification occurs within the soil when microorganisms convert
3 Estimate based on 2019 data presented within the CRF tables and discussion document
Working Paper March 31, 2022 simpsoncentre.ca 5
ammonium (NH₄⁺) to nitrate (NO3-), a form of bioavailable nitrogen for plants. Denitrification is the conversion of nitrate
to nitrogen gas (N2). N2O is produced as an intermediate step in nitrification and denitrification processes. These
naturally occurring biological processes serve an essential role within the nitrogen cycle. However, high fertilization
application can result in excess nitrogen in soil, increasing emissions.
In Canada, agricultural soil emissions increased by 30 percent since 2005 to 82 kt N2O in 2019. This spike in emissions
appears to be driven primarily by the increased application of synthetic fertilizers, which has grown by 71 percent since
2005 (Environment and Climate Change Canada, 2021b). This growth is particularly prominent in Western Canada,
where Alberta, Saskatchewan, and Manitoba increased emissions by, 26, 47, and 57 percent, respectively (Environment
and Climate Change Canada, 2021d).
IPCC TIER 1 APPROACH
The IPCC methodology used in estimating emissions from synthetic fertilizer application can be found in Chapter 11.2 of
the 2006 Guidelines and the 2019 Refinement. Additionally, within the 2019 Refinement, a more detailed description of
the process used for estimating the emission factor can be found in Annex 11A.2.
Estimating nitrous oxide emissions originating from synthetic fertilizers is straightforward. Following an IPCC Tier 1
approach, the total quantity of fertilizer applied to managed agricultural soils is multiplied by an emission factor
converting nitrogen applied to N2O-N emitted. N2O-N is multiplied by 4428⁄ to convert to N2O (de Klein et al., 2006, p.
11.11). A single emission factor is used in the 2006 guidelines, equal to 0.01 kg N2O-N kg N-1, with an uncertainty range
of 0.003 to 0.03. The 2019 Refinement uses the same emission factor of 1 percent but additionally provides
disaggregated emission factors based on seasonal rainfall, irrigation, and fertilizer type (Hergoualc’h et al., 2019, p.
11.12). The emission factors range from 0.001 in non-irrigated dry regions to 0.016 in areas with high rainfall ( 𝑝
𝑃𝐸> 1)
and synthetic fertilizer use. While the default factor remained the same, the estimated uncertainty of the estimate
decreased to 0.001 to 0.018. A full list of emission factors within the 2019 Guidelines can be found in Table 3. Of the 42
countries included within this review, 36 use a Tier 1 approach, of which two use country-specific factors, see Table 3.
The use of the Tier 1 emissions factor poses challenges in emission reduction strategy development, as the factor is only
based on nitrogen application amount. Using disaggregated emission factors may improve estimate accuracy; however,
the default values provided have limited policy value as producers are unlikely to move production from wet regions to
dry regions or stop irrigating crops to reduce emissions. The remainder of this section covers the emission factors and
approaches used by each of the six countries that have developed country-specific factors.

Working Paper March 31, 2022 simpsoncentre.ca 6
COUNTRY-SPECIFIC TIER 1 APPROACHES
Ireland reports using a Tier 1 approach for estimating emissions from inorganic fertilizers (Duffy et al., 2021, sec. 5.5).
The emission factors used are dependent primarily on the fertilizer type. Different emission factors have been estimated
for fertilizer types and includes Calcium Ammonium Nitrate (CAN), Urea, and Urea + N-Butyl Thiophosphoric Triamide
(NBPT), a commonly used urease inhibitor. Changing fertilizers can reduce emissions while maintaining nitrogen
application levels. Switching from CAN to Urea or Urea+ NBPT could result in emission reductions, as the emission factor
for CAN is 5.6 times higher than Urea, and 3.5 times higher than Urea + NBPT4, see Table 3.
Like Ireland, the Netherlands reports using a Tier 1 approach for estimating emissions using country-specific emission
factors (Ruyssenaars et al., 2021, sec. 5.4). The factors can be found in Table 3 and are differentiated by land use
(grassland and arable) and soil type (mineral and mineral and organic). The limited dimensions of variables included in
the Tier 1 approach presents restrictions in emission reduction potential within applied policy. Under these conditions,
farmers are severely limited in emission reduction potentials as only reducing fertilizer applications or changing
locations would reduce estimated emission.
AUSTRALIA
Australia reports using a Tier 2 methodology, resembling a highly disaggregated Tier 1 approach, where the quantity of
fertilizer used in one of seven predefined productions systems is multiplied by its corresponding emission factor
(Australian Government Department of Industry Science Energy and Resources et al., 2021, p. 346). The production
systems are based on production types (Pasture, Crop, Sugar Cane, Cotton, Horticulture) and irrigation (Irrigated
Pasture, Irrigated Crop), and the values range from 0.002 N2O-N kg N-1 (non-irrigated crop production) to 0.019 (sugar
cane production). Australia's methodology results in major emission reductions compared to IPCC default factors.
However, the methodology has limited value in policy development, as emission reductions are only possible through
changes of production systems (e.g., crop to pasture) or reduction in fertilizer use.
CANADA
Canada's methodology is highly developed compared to other Tier 2 countries and uses an emission factor based on
climate, soil, topography, and management practices (Environment and Climate Change Canada, 2021c, sec. A3.4.5.1).
The estimates reflect a relatively high spatial resolution, estimating separate emission factors for each of the 405 Eco-
4 While on average urea has a lower emission factor than urea + NBPT this includes application on both arable and grasslands. When comparing across only arable land CAN = 0.0035, Urea =0.0027, and Urea + NBPT = 0.0020 (Duffy et al., 2021, p. 397).

Working Paper March 31, 2022 simpsoncentre.ca 7
districts where agricultural production occurs5. For each Eco-district, a base emission factor (𝐸𝐹𝑏𝑎𝑠𝑒) is estimated using
Equation 1 where 𝐹𝑡𝑜𝑝𝑜 is the fraction of the Eco-district identified as being likely regularly saturated or poorly drained,
𝐸𝐹𝐶𝑇 is the emission factor based on the Eco-district's precipitation to potential evaporation ratio (𝑃
𝑃𝐸), and 0.017 is the
emission factor for saturated soil, i.e. 𝑃
𝑃𝐸= 1 (Environment and Climate Change Canada, 2021c, p. 101).
𝐸𝐹𝐵𝑎𝑠𝑒 = 0.017 ∗ 𝐹𝑡𝑜𝑝𝑜 + 𝐸𝐹𝐶𝑇 ∗ (1 − 𝐹𝑡𝑜𝑝𝑜) (1)
The 𝑃
𝑃𝐸 ratio is based on long-term weather data collected by 958 weather stations across Canada and the United States,
measuring average rainfall and evaporation from May to October from 1971 to 2000 (Environment and Climate Change
Canada, 2021c, p. 102). The 𝑃
𝑃𝐸 ratio is used to estimate 𝐸𝐹𝐶𝑇, using Equation 2. The 𝐸𝐹𝐶𝑇 value is further multiplied by
1.4 to adjust for the spring thaw in Eastern Canada (Environment and Climate Change Canada, 2021c, p. 102).
𝐸𝐹𝐶𝑇 = 0.022 ∗𝑃
𝑃𝐸− 0.0048 (2)
N2O-N emissions from inorganic fertilizer use can be estimated at the Eco-district level by multiplying total fertilizer
usage, base emission, and soil texture factors (Environment and Climate Change Canada, 2021c, p. 101). Three soil
texture classes are used in the methodology, fine, medium, and coarse, and are assigned a value of 1.2, 1, and 0.8. The
soil texture factor is the weighted average of the soil texture classes. Given the dry conditions, the soil texture factors
are not used in western Eco-districts, with the factor assigned a value of 1.
The Canadian methodology further adjusts eco-district emission estimates to account for three specific practices:
adoption of no-till and reduced tillage (NT-RT), summer fallow, and irrigation (Environment and Climate Change Canada,
2021c, pp. 110–112). Adjusting N2O-N emissions to account for NT-RT uses a factor of -0.2 in Western Canada and 0.1 in
Eastern Canada6 (Environment and Climate Change Canada, 2021c, p. 110). As seen in table {}, conservation tillage is
viewed as a strategy for reducing emissions, however, the adoption of NT-RT will increase N2O-N emissions in Easter
Canada given Canada’s current methodology. The effect of summer fallow varies between regions and years, depending
5 Eco-districts are defined within Canada's ecological framework and comprise of areas with similar biological and climatic characteristics. Eco-district sizes vary but a minimum size requirement is set at 100,000 ha (1,000 km2) (Agriculture and Agri-Food Canada, 2013).
6 The included management practices are considered additional to the 𝐸𝐹𝐵𝑎𝑠𝑒 estimate. The equation used to estimate the additional emissions from NT-RT is as follows: 𝑁2𝑂𝑡𝑖𝑙𝑙 = (𝑁 ∗ (𝐸𝐹𝐵𝑎𝑠𝑒 ∗ 𝐹𝑟𝑎𝑐𝑁𝑇−𝑅𝑇 ∗ (𝐹𝑡𝑖𝑙𝑙 − 1))) ∗
44
28, where 𝑁 is the
total nitrogen applied, 𝐹𝑟𝑎𝑐𝑁𝑇−𝑅𝑇 is the share of land the Eco-district under NT-RT and 𝐹𝑡𝑖𝑙𝑙 is the factor (Environment and Climate Change Canada, 2021c, p. 110).

Working Paper March 31, 2022 simpsoncentre.ca 8
on crop rotation and estimated available nitrogen within the soil (Environment and Climate Change Canada, 2021c, p.
111). An adjustment factor for irrigated land is calculated by taking the difference of 0.017 (𝑃
𝑃𝐸= 1) and 𝐸𝐹𝐶𝑇 and then
multiplying it by the fraction of irrigated cropland in the Eco-district (Environment and Climate Change Canada, 2021c,
pp. 111–112). The difference between 0.017 and 𝐸𝐹𝐶𝑇 can be interpreted as the additional emissions resulting from
irrigation and implies an emission factor for irrigated land equal to 0.017 kg N2O-N kg N-1. As observed by David et al.
(2018) emissions from irrigated land are likely overestimated within the Canadian Prairies; this finding appears to be
supported when comparing emission factors from other dry regions, see Table 3 and 4.
Canada has a well-developed emission methodology for estimating direct N2O emission factors. While practices like NT-
RT and irrigation are considered, policy development remains limited by the methodology. The main variables used for
estimating the emission factor𝑃
𝑃𝐸 and topography, are outside of producers' control. While specific practices such as NT-
RT, summer fallow, and irrigation are accounted for, high-adoption rates for NT-RT, and a single emission factor for
irrigation limits their usefulness. The high spatial resolution use of base emission factors and factor modifiers such as
irrigation and NT-RT provides opportunities to improve methodology in the future.
JAPAN
The methodology used by Japan closely resembles a Tier 1 approach, where a series of set emission factors are
multiplied by their corresponding activity data (Ministry of the Environment & National Institute for Environmental Studies,
2021, sec. 5.5.1.1). Separate emission factors are used for different commodities; Paddy Rice, Tea, Other Crops, and
fertilizer type; Nitrogen fertilizer and Nitrogen Fertilizer treated with dicyandiamide (DCD). Nitrogen fertilizer treated
with DCD had a reported emission factor of 74 percent non-treated Nitrogen for Other Crops, and 72 percent for Tea.
This methodology provides opportunities to develop policy aimed at reducing emissions by promoting DCD adoption.
NEW ZEALAND
New Zealand's methodology for estimating direct emissions from inorganic fertilizer resembles a Tier 1 approach
(Ministry for the Environment, 2021, sec. 5.5.2). Emission factors are differentiated by fertilizer types; country-specific
factors are used for urea-based fertilizer (0.0059 kg N2O-N kg N-1), while all other fertilizers use the IPCC default factor.
New Zealand further differentiates nitrogen sources in estimating indirect emissions to include urea with urease
inhibitor but the Ministry for the Environment does not differentiate in direct emission methodology (Ministry for the
Environment, 2021, sec. 5.5.2).

Working Paper March 31, 2022 simpsoncentre.ca 9
RUSSIA
Russia's methodology resembles the Netherlands' approach with differentiated emission factors based on soil type
(Romanovskaya et al., 2021, sec. 5.7). The methodology applies separate emission factors to four soil types:
Chernozems, Soddy-Podzolic Soils, Other soil types, and Application Under Rice7. Except for reducing production on
Soddy-Podzolic Soils, which have a higher reported emission factor, see Table 3, the only option in reducing direct N2O
emissions is to reduce total fertilizer use as no additional management practice is included.
UNITED KINGDOM
The United Kingdom uses a country-specific Tier 2 model which estimates direct N2O emissions as a function of fertilizer
type, nitrogen application rate (𝑁), and in the case of emissions from other nitrogen fertilizers, average annual rainfall
(𝑅) (Brown et al., 2021, sec. 5.5.2). Cumulative annual N2O-N emissions (𝐶𝑢𝑚𝑁2𝑂), measured in g N2O-N ha-1 are
estimated using Equations 3 and 4. Equation 3 estimates cumulative emissions from urea-based fertilizers, while
Equation 4 is used for other fertilizer types (i.e., Ammonium Nitrate).
ln(𝐶𝑢𝑚𝑁2𝑂 + 1) = 0.494 + 0.002035 ∗ 𝑁 (3)
ln(𝐶𝑢𝑚𝑁2𝑂 + 1) = 0.1616 + 0.00000354 ∗ 𝑁 + 0.0005187 ∗ Rain + 0.00000354 ∗ R ∗ N (4)
To estimate the emission factor, the difference between 𝐶𝑢𝑚𝑁2𝑂 at application rate N and N=0 is first calculated and
divided by the fertilizer application rate; see Equation 5 (Brown et al., 2021, sec. 5.5.2). The difference between the
cumulative emissions at 𝑁 and 𝑁 = 0 can be interpreted as the emissions resulting from fertilizer application. Dividing
by application rate allows for a per-unit comparison.
𝐸𝐹 = (𝐶𝑢𝑚𝑁2𝑂𝑁−𝐶𝑢𝑚𝑁2𝑂𝑁=0)
𝑁 (5)
Emission factors are estimated at 100 km2 (10,000 ha) resolution (Brown et al., 2021, sec. 5.5.2), a substantially higher
resolution than in Canada, Eco-district level (min 100,000 ha), or other country-specific Tier-2 factors which appear to
use country level estimates. Given the granularity of the estimate, the methodology should effectively account for
production differences across regions and better explain weather effects compared with other Tier 2 methods.
However, the model fails to account for many practices which could significantly reduce emissions.
7 Categories are a direct translation of the original Russian (Черноземы, Дерново-подзоли-стые почвы, Другие типы почв, Внесение под рис)

Working Paper March 31, 2022 simpsoncentre.ca 10
UNITED STATES
The United States is currently the only country to use a Tier 3 approach for N2O emissions from agricultural soils (United
States Environmental Protection Agency, 2021b, sec. 3.12). The method uses a DayCent ecosystem model8 linking three
emission sources: N2O from agricultural soils, CH4 from rice cultivation, and soil organic carbon. The emission sources
are highly interdependent, given the interrelationship of the carbon, hydrological, and nutrient cycles. The model
simulates daily carbon, nutrient, and gas exchange between the atmosphere, soil, and plants, based on soil, climate, and
management characteristics.
The DayCent model accounts for numerous management practices, such as crop rotation, tillage, drainage, irrigation,
and the use of cover crops, and incorporates more detailed weather, soil, and crop data compared with other Annex I
countries (United States Environmental Protection Agency, 2021b, sec. 3.12). The model is currently the only dynamic
model used to estimate N2O emissions from agricultural soils, quantifying past producers' decisions on current emission
levels, resulting in a more accurate emission estimate.
Despite a more comprehensive methodology, the DayCent model and the Canadian approach have similar challenges.
First, the model does not account for enhanced efficiency fertilizers, inhibitors, or slow-released N sources, and may not
fully account for the other 4R practices or proposals within the discussion paper (United States Environmental
Protection Agency, 2021b, sec. 3.12). Second, irrigation is poorly defined, only differentiating between irrigated and
non-irrigated land, excluding actual water usage (United States Environmental Protection Agency, 2021b). Third, the
discrete emission factors in the Canadian model support development of transparent and straightforward policy and
mitigation efforts, whereas the DayCent approach convolutes future mitigation pathways.
COUNTRY COMPARISON
This section compares emissions originating from agricultural soils with a focus on emissions from synthetic fertilizers.
Data used in this comparison was collected from Tables 3.d and 4.1 and covered 1990 to 2019. The section also includes
land and production-based estimates. Summary statistics can be found in Table 5, which provides the mean value, min,
max, and a comparison with Canada across several productions, emission, and land-based dimensions.
8 The DayCent ecosystem model is a modified version of the Century model.
Working Paper March 31, 2022 simpsoncentre.ca 11
LAND AND FERTILIZER USE
A total of 42 countries are compared, covering a total of 1.9 billion hectares of agricultural land, comprising both
cropland and managed grassland9. The production scale varies considerably between countries, with total agricultural
land ranging from 6,000 hectares (ha) in Liechtenstein (Liechtenstein, 2021) to 562.3 million in Australia (Australia,
2021). Canada reported the 5th highest total agricultural land in 2019 with 53.7 million hectares (Environment and
Climate Change Canada, 2021a), see Figure 1. Cropland as a share of total agricultural land also varies considerably
between countries; Malta has the highest percentage of cropland at 100 percent (Malta, 2021), followed by Denmark,
94 percent (Denmark, 2021), Finland, 91 percent (Finland, 2021), and Canada, 88 percent (Canada, 2021). On the
opposite end of the scale, Iceland, New Zealand, and Australia report the lowest level of cropland as a share of total
agricultural land with values of 2 percent, 3 percent, and 7 percent respectively (Australia, 2021; Iceland, 2021; New
Zealand, 2021) , see Figure 2.
Total synthetic fertilizer use has decreased overall since 1990, falling from 35.4 million tonnes to 34.4 million10.
However, at the country level, values differ greatly. New Zealand has the largest growth in synthetic fertilizer use,
increasing by 662 percent since 1990 (New Zealand, 2021). Australia also increased synthetic fertilizer use by 205%
(Australia, 2021). Canada, in comparison, increased fertilizer uses by 120 percent over the same period (Canada, 2021).
Large decreases were observed in several former Soviet countries, including Kazakhstan, -85 percent, Russia, -59
percent, Estonia, -43 percent, and Slovakia, -42 percent, see Figure 3 (Estonia, 2021; Kazakhstan, 2021; Russian Federation,
2021; Slovakia, 2021).
The lack of disaggregated data between fertilizer applied to grassland and cropland is a challenge when comparing
implied fertilizer application rates between countries. For example, Canadian implied application rates, fertilizer divided
by land area, are between 49.1 and 55.7 kg N ha-1 when using total agricultural land and cropland. Using the same
method, the estimated implied application rate for New Zealand is between 30.0 and 949.1 kg N ha-1, See figure 4. As a
result, the intensity measures will be reported using total agricultural land instead of total cropland.
EMISSION FACTORS
As discussed in the methodology section, the emission factors are an estimate of the amount of nitrogen emitted as
N2O. In 2019, 32 of 42 countries reported a factor of 0.010 or 1 percent equivalent to the IPCC default value. Australia,
Japan, New Zealand, the United Kingdom, Canada, and Kazakhstan reported values below the IPCC default. The
9 Calculations made from data collected from CRF Table 4.1 10 Calculations made from data collected from CRF Table 3.d
Working Paper March 31, 2022 simpsoncentre.ca 12
Netherlands, the United States, Ireland, and Russia reported values above, see Figure 5 and 6. Canada reported a value
of 0.0085 in 2019 (Canada, 2021), reflective of the emission factors originating from the Canadian Prairies, see Table 4.
The average emission factors for Alberta, Saskatchewan, and Manitoba are 0.0082, 0.0076, and 0.0089, respectively
(Environment and Climate Change Canada, 2021c, sec. 6.4.4). Prairie province emission factors are well below Central
and Eastern Canadian provinces; in Ontario, the emission factor was estimated to be 0.0146. The reported estimate in
Quebec of 0.0165 was over twice as high as Alberta and Saskatchewan. Figure 6 demonstrates provincial-level emission
factors range from the some of the lowest to some of the highest across all countries within this review.
Alberta and Saskatchewan have relatively low average emission factors. However, they are noticeably higher than some
other country-specific Tier 2 factors. Emissions originating from non-irrigated dry land have a reported emission factor
of 0.002 in Australia, almost four times lower than in Saskatchewan (Australian Government Department of Industry
Science Energy and Resources et al., 2021, p. 346). Interestingly, if Canada were to use set emission factors, brown and
dark brown soil regions in Saskatchewan and Alberta would be comparable to Australia, with an emission factor of
0.0016 kg N2O-N kg N-1(Environment and Climate Change Canada, 2021c, p. 101).
Irrigation may also play a large role in higher average emission factors in Western Canada. The implied emission factor
for irrigated fields is 0.017 kg N2O-N kg N-1, over ten times higher than emissions from brown and dark brown soil
regions and approximately twice as high as the provincial average emission factor in Alberta and Saskatchewan
(Environment and Climate Change Canada, 2021c, p. 101). Research conducted by David et al., (2018) suggest that the
emission factors for irrigated land are overestimating emissions within the Canadian Prairies. The study conducted was
on a small scale (three field) over two years. However, the results were similar to that of the reported by Australia. In
year one, dry-land (non-irrigated) and irrigated emission factors were estimated with the values of 0.0054 and 0.0077 kg
N2O-N kg N-1. respectively, in year two the estimated emission factors were 0.0012 and 0.0055 kg N2O-N kg N-1.
Lack of differentiation between fertilizer types also contributes to Canada’s relatively high emission factor. Harty et al.
(2016) found that by switching from calcium ammonium nitrate (CAN) to urea-based fertilizer, N2O emissions observably
decrease between 58 to 87 percent. These findings appear to be incorporated into the emission methodologies of
Ireland, New Zealand, and the United Kingdom. In Ireland, switching from CAN to Urea or Urea + NBPT would decrease
the emission factor by 82 and 71 percent, respectively (Duffy et al., 2021, sec. 5.5). In New Zealand, switching to urea
would decrease the emission factor by 41 percent (0.01 to 0.0059) (Ministry for the Environment, 2021, sec. 5.5.2). In
the United Kingdom, separate emission factors are estimated for urea and other fertilizer types and are dependent
factors such as application rate and weather (Brown et al., 2021, sec. 5.5.2).

Working Paper March 31, 2022 simpsoncentre.ca 13
LAND-BASED EMISSION INTENSITIES
Average total N2O emissions per hectare of land decreased from 3.05 kg N2O in 1990 to 2.61 kg in 2019. Individual
values range between 0.07 in Australia to 7.07 in the Netherlands. Canada reported the 11th lowest value in 2019 at 1.53
kg N2O ha-1; this value has increased by 52 percent since 1990, see Figure 8. This spike in emissions can likely be
attributed to the 120 percent increase in fertilizer use (Canada, 2021). As seen in Figure 9, land-based intensity
measures in Canada are comparable to Latvia and Italy.
Narrowing the scope of emission estimates to include only emissions originating from synthetic fertilizers in 2019,
average N2O emissions per hectare of land was found to decrease from 0.087 kg N2O to 0.069 kg in 2019. Decreased
intensity distribution was also observed, with the range shrinking from 2.6 kg N2O to 0.95 kg. Under this scenario,
average emissions per hectare in Canada increased from 0.370 to 0.66. Compared with other jurisdictions, Canadian
emissions inflated from the lowest quartile in 1990, to the second-highest quartile in 2019, slightly above the median
value, see Figure 8. Canadian emission intensity estimate is above the median compared to other countries, over all
ranked 11th and comparable to the United Kingdom and Slovenia on an intensity basis, see Figure 10.
PRODUCTIVITY COMPARISON
One of the justifications for the federal emission reduction target provided in the AAFC discussion document was
Canada's high emission intensity compared to major producing regions. Canada's emission intensity estimate by AAFC
was 0.249 kg CO2e per kg cereal crop (Agriculture and Agri-Food Canada, 2022). This places Canada above the OECD and
EU averages, 0.207 kg, and 0.18 kg, respectively, ands countries like France and Russia, 0.121kg and 0.139 kg,
respectively. Comparing all cereal crops may not be the most appropriate measure, as emission intensities between
cereal types differ. Fouli et al. (2021) highlights these differences when comparing intensities across Canadian
commodities. Large emission intensity differences were reported between different wheat varieties, with the reported
value of durum wheat much lower than winter wheat, 160 kg compared to 1900 kg.
This report takes a different approach by estimating a benchmark value based on Canada's average wheat yield and
emission factors. First, average wheat yield data for 2019 was collected from the FAOSTAT database11(Food and
Agriculture Organization of the United Nations, 2021). Second, the benchmark was first estimated using Canadian (𝐶𝑎𝑛)
11 2017 data was used for Malta as 2018 and 2019 data was unavailable, Iceland and Liechtenstein were excluded given lack of data.

Working Paper March 31, 2022 simpsoncentre.ca 14
data by dividing average yield (𝑌𝐶𝑎𝑛) by the product of the emission factor (𝐸𝐹𝐶𝑎𝑛) and a substitute nitrogen application
rate (assumed 100 kg ha-1, 𝐴𝑅𝐶𝑎𝑛), see Equation 6.
𝐶𝑎𝑛 = 𝑌𝐶𝑎𝑛
𝐸𝐹𝐶𝑎𝑛∗𝐴𝑅𝐶𝑎𝑛 (6)
Third, the fertilizer application rate for country 𝑖 that would be needed to equal the Canadian benchmark 𝐶𝑎𝑛, was
estimated using Equation 7, the value of 𝐶𝑎𝑛, country-specific emission factors, and average yield data.
𝐶𝑎𝑛 = 𝑌𝑖
𝐸𝐹𝑖∗𝐴𝑅𝑖 → 𝐴𝑅𝑖 =
1
(𝐶𝑎𝑛∗𝐸𝐹𝑖𝑌𝑖
) (7)
By comparing the percent difference between the fertilizer application rates between Canada and country 𝑖
resulting in the same benchmark value, wheat production efficiency relative to Canada can be calculated. Given the
measure, positive values indicate greater production efficiency, requiring higher fertilizer levels to reach the benchmark
value. Referencing Table 6 and Figure 11 it appears that average Canadian production efficiency was low compared to
the total group. Although below average, several major producing countries such as the United States, Turkey, Russia,
and Kazakhstan had large negative differences, suggesting less efficient production. From Figure 12, Canada is
comparable in efficiency to Ukraine, Italy, and Poland, and less efficient than the Netherlands, the United Kingdom, and
New Zealand in wheat production. Relatively low efficiency can be partially attributed to low yield, suggesting Canada
may have a problem with productivity, rather than emissions. Of the 40 countries where average yield data was
available, Canada had the 10th lowest average yield at 3.38t ha-1 (Food and Agriculture Organization of the United
Nations, 2021). Average yield values had a range of 1.01t in Kazakhstan to 9.38 in Ireland with average Canadian yields
comparable to the US (Food and Agriculture Organization of the United Nations, 2021).
Three hypothetical scenarios are also evaluated to observe the effects of increased efficiency and changes in emission
factors. The first scenario conducted increased 𝐶𝑎𝑛 by 10 percent, to simulate an improvement of efficiency, either
through increased yields or decreased average emission factor. The average percent difference across the 40 countries
decreased from 38 to 26 percent, and the number of countries reporting negative values increased from 10 to 14. The
second scenario examined changes to the reported emission factor. Countries which reported using the IPCC default
factor were reassigned a value of 0.013, the disaggregated factor for temperate wet climates in the 2019 refinement
(Hergoualc’h et al., 2019). The average percent difference decreased from 38 to 18 percent, and countries with negative
differences increased from 10 to 18 when compared with the benchmark values. The last scenario used both the
increased efficiency measure for 𝐶𝑎𝑛 and the disaggregated emission factor instead of the default factor. Compared
with the benchmark value, average percent difference decreased from 38 to 7 percent, and countries reporting negative
Working Paper March 31, 2022 simpsoncentre.ca 15
differences increased from 10 to 23. The median value decreased from 28 to -7 percent, suggesting above average
production efficiency in Canada under this scenario, see Figure 11 and 12. While hypothetical, these additional scenarios
highlight the importance of the emission factor estimate. If Canada were to further develop its emission methodology,
such as differentiating by fertilizer type, or modifying to account for 4R practices, average emission factor decreases are
likely. Additionally, if European countries were to develop country specific approaches that account for precipitation,
like in the US, UK, or Canada, increases in the average emission factor would be expected. The IPCC climate zones map
designates most European land as temperate and moist, similar to much of Central and Eastern Canada (Reddy et al.,
2019, p. 3.47), where average emission factors range from 0.013 in Prince Edward Island to 0.017 in Quebec and
Newfoundland and Labrador (Environment and Climate Change Canada, 2021c).
CONCLUSION
As environmental, social, and political pressures rise to reduce emission reductions, the importance of accurate and
reliable greenhouse gas emission measurements becomes prevalent. Canada has a well-developed methodology for
estimating direct N2O emissions from agricultural soils. The approach takes critical steps to account for the effects of
weather and the environment on greenhouse gas emissions, incorporating some production practices within the
methodology.
Canadian methodology is more developed compared to other regions, particularly Europe, which generally used limited
Tier 1 approaches. This creates challenges when comparing N2O emissions between countries, as the uncertainty
estimates for default values were estimated to be approximately ±100 percent and therefore may not reflect actual
emission levels (Hergoualc’h et al., 2019, p. 11.12). This casts doubt on the reliability of emission estimates that do not
account for environmental factors, and essentially equate 1 percent of fertilizer use. Compared to Tier 2 and country-
specific Tier 1 methodologies, Canada better captures environmental characteristics. A factor missing from the Canadian
methodology, but is accounted for in other countries’ methodology, is fertilizer type. The DayCent model developed and
used by the United States would clearly improve estimates but would require increase in data and continue to face
several of the same issues faced currently by the Canadian methodology.
Relative and absolute land-based emission intensity increased in Canada since 1990, as intensity increased by 52
percent, and fertilizer use increased by 120 percent (Canada, 2021). Overall, Canada has the 11th lowest land-based
emission intensity on a total N2O emissions per ha basis. Given the 120 percent increase in fertilizer use, Canada’s
relatively high intensity measure is no surprise when comparing synthetic fertilizer emissions specifically. However,
despite sharp increase, intensity was approximately average compared with other jurisdictions. Canada ranked

Working Paper March 31, 2022 simpsoncentre.ca 16
relatively poorly comparing emission intensity on a wheat productivity basis given reported emission factors. However,
Canada production was more efficient than some major wheat producing countries like Kazakhstan, Russia and the
United States.
The Canadian model lacks accountability of the mitigation efforts promoted as short term BMPs within the AAFC
document. Producers in Canada aiming to meet the national emission targets will require updated and comprehensive
methodology. To do so, Canadian policy designers and actors need to ensure that current and upcoming programs
reduce emissions are accounted for within the national methodology in parallel. The current quantification protocol for
agricultural nitrous oxide emission reductions is not effective at reducing provincial emissions at the national level, as
the carbon offset measures are not included in the national methodology. Improvement to the current Canadian
methodology through transparency and use of discrete emission factors may enhance policy and communication
development. Canada has a well-developed methodology for estimating direct N2O emissions from agricultural soils.
The approach takes critical steps to account for the effects of weather and the environment on greenhouse gas
emissions, incorporating some production practices within the methodology. The model lacks to account for many of
the mitigation efforts promoted as short term BMPs within the AAFC document. If Canadian producers are to meet the
national emission targets, updating the methodology is essential. Canadian policy makers need to ensure that programs
developed in parallel to reduce emissions are accounted for within the national methodology. Programs like the
quantification protocol for agricultural nitrous oxide emission reductions would not be effective at reducing provincial
emissions at the national level, as the requirements for the carbon offset are not included in the national methodology.

Working Paper March 31, 2022 simpsoncentre.ca 17
REFERENCES
Agriculture and Agri-Food Canada. (2013, May 29). EcoZones, EcoRegions, and EcoDistricts. Canada.Ca.
https://sis.agr.gc.ca/cansis/nsdb/ecostrat/hierarchy.html
Agriculture and Agri-Food Canada. (2022, February 25). Discussion Document: Reducing emissions arising from the application of
fertilizer in Canada’s agriculture sector. https://agriculture.canada.ca/en/about-our-department/transparency-and-corporate-
reporting/public-opinion-research-and-consultations/share-ideas-fertilizer-emissions-reduction-target/discussion-document-
reducing-emissions-arising-application-fertilizer-canadas-agriculture-sector
Anderl, M., Friedrich, A., Gangl, M., Haider, S., Köther, T., Kriech, M., Kuschel, V., Lampert, C., Mandl, N., Matthews, B., Pazdernik, K.,
Pinterits, M., Poupa, S., Purzner, M., Schieder, W., Schmid, C., Schmidt, G., Schodl, B., Schwaiger, E., … Zechmeister, A. (2021).
Agriculture (CRF Sector 3). Austria’s National Inventory Report 2021, 300–384.
Andre, J.-M., Barrault, S., Cuniasse, B., Druart, A., Durand, A., Feutren, E., Gavel, A., Glass, T., Grellier, L., Imad, V., Jeannot, C., le
Borgne, G., Mathias, E., Mazin, V., Robert, C., Sirina-Leboine, N., Tapiavillarreal, I., Vandromme, N., & Viera Da Rocha, T.
(2021). Agriculture (CRF 3). In National Inventory Report for France under the United Nations Framework Convention on
Climate Change and the Kyoto Protocol. CITEPA,.
Australia. (2021). 2021 Common Reporting Format (CRF) Table. In National Inventory Submissions 2021. UNFCCC.
https://unfccc.int/documents/273475
Australian Government Department of Industry Science Energy and Resources, Australian Government Department of Industry
Science Energy and Resources, & Australian Government Department of Industry Science Energy and Resources. (2021).
National Inventory Report Volume 1 (Vol. 1). Australian Government Department of Industry Science Energy and Resources.
Austria. (2021). 2021 Common Reporting Format (CRF) Table . In National Inventory Submissions 2021. UNFCCC.
https://unfccc.int/documents/273488
Bechet, T., de Brabanter, E., Dornseiffer, P., Kemmer, M., Manetta, D., Mangen, M.-J., Mirgain, T., Schintgen, N., Schuman, M., Wahl,
F., & Wolter, M. (2021). Agriculture (CRF Sector 3). In Luxembourg’s National Inventory Report 1990-2019. Administration de
l’environnement.
Belarus. (2021). 2021 Common Reporting Format (CRF) Table. In National Inventory Submissions 2021. UNFCCC.
https://unfccc.int/documents/271557
Belgian Interregional Environment Agency, Federal Public Service for Health, Food Chain Safety and the Environment, National
Climate Commission, Flemish Environment Agency, Flemish Agency for Energy and Climate, Walloon Agency for Air and
Climate, Brussels Environment, & ECONOTEC. (2021). Belgium’s Greenhouse Gas Inventory (1990-2019).
Belgium. (2021). 2021 Common Reporting Format (CRF) Table. In National Inventory Submissions 2021. UNFCCC.
https://unfccc.int/documents/271621
Beranova, J., Klir, J., & Wollnerova, J. (2021). Agriculture (CRF Sector 3). In National Greenhouse Gas Inventory Report of the Czech
Republic. Czech Hydrometeorological Institute, Ministry of the Enviornment of the Czech Republic.
Brown, P., Cardenas, L., Choudrie, S., del Vento, S., Karagianni, E., MacCarthy, J., Mullen, P., Passant, N., Richmond, B., Smith, H.,
Thistlethwaite, G., Thomson, A., Turtle, L., Wakeling, D., Broomfield, M., Buys, G., Clilverd, H., Gibbs, M., Gilhespy, S., … Zhang,
H. (2021). Agriculture (CRF sector 3). In UK Greenhouse Gas Inventory, 1990 to 2019: Annual Report for Submission under the
Framework Convention on Climate Change. Ricardo Energy & Environment,.

Working Paper March 31, 2022 simpsoncentre.ca 18
Bulgaria. (2020). 2021 Common Reporting Format (CRF) Table. In National Inventory Submissions 2021. UNFCCC.
https://unfccc.int/documents/273452
Canada. (2021). 2021 Common Reporting Format (CRF) Table. In National Inventory Submissions 2021. UNFCCC.
https://unfccc.int/documents/271492
Croatia. (2021). 2021 Common Reporting Format (CRF) Table. In National Inventory Submissions 2021. UNFCCC.
https://unfccc.int/documents/271574
Cyprus. (2021). 2021 Common Reporting Format (CRF) Table. In National Inventory Submissions 2021. UNFCCC.
https://unfccc.int/documents/271428
Czechia. (2021). 2021 Common Reporting Format (CRF) Table. In National Inventory Submissions 2021. UNFCCC.
https://unfccc.int/documents/271576
David, C., Lemke, R., Helgason, W., & Farrell, R. E. (2018). Current inventory approach overestimates the effect of irrigated crop
management on soil-derived greenhouse gas emissions in the semi-arid Canadian Prairies. Agricultural Water Management,
208, 19–32. https://doi.org/10.1016/j.agwat.2018.06.006
de Klein, C., Novoa, R. S. A., Ogle, S., Smith, K., Rochette, P., Wirth, T. C., McConkey, B. G., Mosier, A., Rypdal, K., Walsh, M., &
Williams, S. A. (2006). N2O Emissions from Managed Soils, and CO2 Emissions from Lime and Urea Application. In S. Eggleston,
L. Buendia, K. Miwa, T. Ngara, & K. Tanabe (Eds.), 2006 IPCC Guidelines for National Greenhouse Gas Inventories (Vol. 4).
Institute for Global Environmental Strategies.
Denmark. (2021). 2021 Convention - Common Reporting Format (CRF) Table. In National Inventory Submissions 2021. UNFCCC.
https://unfccc.int/documents/273486
di Cristofaro, E., & Cordella, M. (2021). Agriculture (CRF Sector 3). In Italian Greenhouse Gas Inventory 1990-2019: National
Inventory Report 2021. Institute for Environmental Protection and Research,.
Duffy, P., Black, K., Fahey, D., Hyde, B., Kehoe, A., Murphy, J., Quirke, B., Ryan, A. M., Ponzi, J., & Environmental Protection Agency.
(2021). Agriculture. In Ireland’s National Inventory Report 2021. Environmental Protection Agency,.
Environment and Climate Change Canada. (2016). Pan-CanadianFramework on Clean Growth and Climate Change.
Environment and Climate Change Canada. (2020). A Healthy Environment and a Healthy Economy.
Environment and Climate Change Canada. (2021a). Agriculture (CRF Sector 3). National Inventory Report 1990–2019: Greenhouse
Gas Sources and Sinks in Canada, 1, 120–140.
Environment and Climate Change Canada. (2021b). Common Reporting Format (CRF) Tables. In National Inventory Submissions 2021
(Vol. 1). Environment and Climate Change Canada. https://unfccc.int/sites/default/files/resource/can-2021-crf-12apr21.zip
Environment and Climate Change Canada. (2021c). National Inventory Report 1990-2019: Greenhouse Gas Sources and Sinks in
Canada - Part 2.
Environment and Climate Change Canada. (2021d). National Inventory Report 1990-2019: Greenhouse Gas Sources and Sinks in
Canada - Part 3.
Environment and Climate Change Canada. (2021e, April 23). Canada’s Enhanced Nationally Determined Contribution - Canada.ca.
Govenment of Canada. https://www.canada.ca/en/environment-climate-change/news/2021/04/canadas-enhanced-
nationally-determined-contribution.html
Estonia. (2021). 2021 Common Reporting Format (CRF) Table. In National Inventory Submissions 2021. UNFCCC.
https://unfccc.int/documents/273485

Working Paper March 31, 2022 simpsoncentre.ca 19
Executive Environment Agency at the Ministry of Environment and Water. (2021). Agriculture (CRF Sector 3). In National Inventory
Report 2021: Greenhouse Gas Emissions in Bulgaria 1988-2019.
Federal Environment Agency. (2021). Agriculture (CRF Sector 3). In Submission under the United Nations Framework Convention on
Climate Change and the Kyoto Protocol 2021: National Inventory Report for the German Greenhouse Gas Inventory 1990 –
2019. Federal Environment Agency,.
Federal Office for the Environment. (2021). Agriculture. In Switzerland’s Greenhouse Gas Inventory 1990–2019: National Inventory
Report. Federal Office for the Environment,.
Fertilizer Canada. (n.d.). Stewardship. Retrieved March 27, 2022, from https://fertilizercanada.ca/our-focus/stewardship/
Finland. (2021). 2021 Common Reporting Format (CRF) Table. In National Inventory Submissions 2021. UNFCC.
https://unfccc.int/documents/271520
Food and Agriculture Organization of the United Nations. (2021). FAOSTAT statistical database. FAO.
https://search.library.wisc.edu/catalog/999890171702121
Fouli, Y., Hurlbert, M., & Kröbel, R. (2021). Greenhouse Gas Emissions From Canadian Agriculture:Estimates and MEasurements. The
School of Public Policy Publications, 14(35), 1–32. www.policyschool.ca
France. (2021). 2021 Common Reporting Format (CRF) Table (Convention). In National Inventory Submissions 2021. UNFCCC.
https://unfccc.int/documents/273487
Germany. (2021). 2021 Common Reporting Format (CRF) Table . In National Inventory Submissions 2021. UNFCCC.
https://unfccc.int/documents/271972
Greece. (2021). 2021 Common Reporting Format (CRF) Table . In National Inventory Submissions 2021. UNFCCC.
https://unfccc.int/documents/272917
Harty, M. A., Forrestal, P. J., Watson, C. J., McGeough, K. L., Carolan, R., Elliot, C., Krol, D., Laughlin, R. J., Richards, K. G., & Lanigan,
G. J. (2016). Reducing nitrous oxide emissions by changing N fertiliser use from calcium ammonium nitrate (CAN) to urea
based formulations. Science of the Total Environment, 563–564, 576–586. https://doi.org/10.1016/j.scitotenv.2016.04.120
Hergoualc’h, K., Akiyama, H., Bernoux, M., Chirinda, N., del Prado, A., Kasimir Åsa, MacDonald, J. D., Ogle, S. M., Regina, K., van der
Weerden, T. J., Liang, C., & Noble, A. (2019). N2O Emissions from Managed Soils, and CO2 Emissions from Lime and Urea
Application (E. Calvo Buendia, K. Tanabe, A. Kranjc, J. Baasansuren, M. Fukuda, Ngarize S., A. Osako, Y. Pyrozhenko, & P. F. S.
Shermanau, Eds.; Vol. 4). Intergovernmental Panel on Climate Change.
Hungary. (2021). 2021 Common Reporting Format (CRF) Table. In National Inventory Submissions 2021. UNFCCC.
https://unfccc.int/documents/273466
Iceland. (2021). 2021 Common Reporting Format (CRF) Table. In National Inventory Submissions 2021. UNFCCC.
https://unfccc.int/documents/273422
Ireland. (2021, April 13). 2021 Common Reporting Format (CRF) Table. National Inventory Submissions 2021.
https://unfccc.int/documents/271516
Italy. (2021). 2021 Common Reporting Format (CRF) Table. In National Inventory Submissions 2021. UNFCCC.
https://unfccc.int/documents/271490
Japan. (2021). 2021 Common Reporting Format (CRF) Table . In National Inventory Submissions 2021. UNFCCC.
https://unfccc.int/documents/271501
Working Paper March 31, 2022 simpsoncentre.ca 20
Juška, R., & Žiukelytė, I. (2021). Agriculture (CRF 3). In Lithuania’s National Inventory Report 2021 Greenhouse Gas Emissions 1990-
2019.
Katalin, L. (2021). Agriculture (CRF Sector 3). In National Inventory Report 1985-2019: Hungary. Hungarian Meteorological Service,.
Kazakhstan. (2021). 2021 Common Reporting Format (CRF) Table. In National Inventory Submissions 2021. UNFCCC.
https://unfccc.int/documents/273502
Keller, N., Stefani, M., Einarsdóttir, S. R., Ásta, K. H., Helgason, R., Guðlaugsdóttir, H., Snorrason, A., Tinganelli, L., & Þórsson, J.
(2021). Agriculture (CRF sector 3). In National Inventory Report Emissions of Greenhouse Gases in Iceland from 1990 to 2019.
Environment Agency of Iceland,.
Kupri, H.-L., Alber, R., Joa, K., Lehtpuu, K., Štõkov, S., Karu, H., Suursild, E., & Sims, A. (2021). Agriculture (CRF 3). In Greenhouse Gas
Emissions in Estonia 1990-2019 National Inventory Report Submission to the UNFCCC Secretariat. Ministry of the
Environment,.
Latvia. (2021). 2021 Common Reporting Format (CRF) Table. In National Inventory Submissions 2021. UNFCCC.
https://unfccc.int/documents/271529
Liechtenstein. (2021). 2021 Common Reporting Format (CRF) Table . In National Inventory Submissions 2021. UNFCCC.
https://unfccc.int/documents/271889
Lithuania. (2021). 2021 Common Reporting Format (CRF) Table . In National Inventory Submissions 2021. UNFCCC.
https://unfccc.int/documents/272963
Luxembourg. (2021). 2021 Common Reporting Format (CRF) Table . In National Inventory Submissions 2021. UNFCCC.
https://unfccc.int/documents/271522
Malta. (2021). 2021 Common Reporting Format (CRF) Table . In National Inventory Submissions 2021. UNFCCC.
https://unfccc.int/documents/307626
Marković, B., & Glückselig, B. (2021). Agriculture (CRF sector 3). In Croatian greenhouse gas inventory for the period 1990 - 2019
(National Inventory Report 2021). Ministry of Economy and Sustainable Development,.
Ministry for the Environment. (2021). Agriculture. In New Zealand’s Greenhouse Gas Inventory 1990–2019. Ministry for the
Environment,.
Ministry of Agriculture Rural Development and Environment. (2021). Agriculture (CRF sector 3). In Cyprus National Greenhouse Gas
Inventory 2021 Submission. Ministry of Agriculture Rural Development and Environment,.
Ministry of Environmental Protection and Natural Resources of Ukraine. (2021). Agriculture (CRF Sector 3). In Ukraine’s Greenhouse
Gas Inventory 1990-2019. Ministry of Environmental Protection and Natural Resources of Ukraine,.
Ministry of the Environment and Energy. (2021). Agriculture (CRF sector 3). In National Inventory Report of Greece for Greenhouse
and Other Gases for the Years 1990-2019. Ministry of the Enviornment and Energy,.
Ministry of the Environment, & National Institute for Environmental Studies. (2021). Agriculture (CRF Sector 3). In National
Greenhouse Gas Inventory Report of Japan. Center for Global Environmental Research,.
MITECO. (2021). Agricultura (CRF 3). In National Greenhouse Gas Inventory Report (Informe De Inventario Nacional Gases De Efecto
Invernadero). MITECO.
Narkevich I.P., Gonchar K.V., Melekh D.V., Konkova V.M., Bertosh E.I., & Yu.V., F. (2021). Agriculture (СЕЛЬСКОЕ ХОЗЯЙСТВО). In
National Inventory Report (НАЦИОНАЛЬНЫЙ ДОКЛАД О КАДАСТРЕ). Ministry of Natural Resources and Environmental
Protection of the Republic of Belarus,.

Working Paper March 31, 2022 simpsoncentre.ca 21
Netherlands. (2021). 2021 Common Reporting Format (CRF) Table. In National Inventory Submissions 2021. UNFCCC.
https://unfccc.int/documents/307135
New Zealand. (2021). 2021 Common Reporting Format (CRF) Table. In National Inventory Submissions 2021. UNFCCC.
https://unfccc.int/documents/271550
Nielsen, O.-K., Plejdrup, M. S., Winther, M., Nielsen, M., Gyldenkærne, S., Mikkelsen, M. H., Albrektsen, R., Thomsen, M., Hjelgaard,
K., Fauser, P., Bruun, H. G., Johannsen, V. K., Nord-Larsen, T., Vesterdal, L., Stupak, I., Scott-Bentsen, N., Rasmussen, E.,
Petersen, S. B., Olsen, T. M., & Hansen, M. G. (2021). Agriculture. In Denmark’s National Inventory Report 2021.
https://doi.org/No. 437
Norway. (2021). 2021 Common Reporting Format (CRF) Table. In National Inventory Submissions 2021. UNFCCC.
https://unfccc.int/documents/273426
Olecka, A., Bebkiewicz, K., Chłopek, Z., Chojnacka, K., Doberska, A., Jędrysiak, P., Kanafa, M., Kargulewicz, I., Rutkowski, J., Sędziwa,
M., Skośkiewicz, J., Walęzak, M., Waśniewska, S., Zimakowska, M., & Marcin Żaczek, L. (2021). Agriculture (CRF Sector 3). In
Poland’s National Inventory Report 2021 Greenhouse Gas Inventory for 1988-2019. Ministry of Climate and Environment,.
Olteanu, L. (2021). Agriculture (CRF Sector 3). In Romania’s Greenhouse Gas Inventory 1989-2019: National Inventory Report.
National Environmental Protection Agency.
Pina, A., & Portuguese Environment Agency. (2021). Agriculture (CRF 3). In National Invenotry Report 2021: Portugal. Portuguese
Environment Agency,.
Poland. (2021). 2021 Common Reporting Format (CRF) Table . In National Inventory Submissions 2021. UNFCCC.
https://unfccc.int/documents/274751
Portugal. (2021). 2021 Common Reporting Format (CRF) Table. In National Inventory Submissions 2021. UNFCCC.
https://unfccc.int/documents/271506
Reddy, S., Panichelli, L., Waterworth, R. M., Federici, S., Green, C., Jonckheere, I., Kurz, W. A., de ligt, R., Ometto, J. P., Petersson, H.,
Takahiro, E., Paul, T., Tullis, J., Somogyim, Z., Pandya, M., Rocha, M. T., & Suzuki, K. (2019). Consistent Representation of
Lands. In 2019 Refinement to the 2006 IPCC Guidelines for National Greenhouse Gas Inventories (Vol. 4). IPCC.
Romania. (2021). 2021 Common Reporting Format (CRF) Table. In National Inventory Submissions 2021. UNFCCC.
https://unfccc.int/documents/275942
Romanovskaya, A. A., Nakhutin, A. I., Ginzburg, V. A., Grabar, V. A., Imshennik, E. v, Karaban, R. T., Korotkov, V. N., Vertyankina, V.
Yu., Grigurina, T. v, Govor, I. L., Litvinchuk, G. G., Lytov, V. M., Polumieva, P. D., Popov, N. v, Trunov, A. A., Prokhorova, L. A., &
Federal Service for Hydrometeorology and environmental monitoring. (2021). Agriculture (CRF Sector 3) (Сельское
хозяйство). In National Inventory Report (НАЦИОНАЛЬНЫЙ ДОКЛАД О КАДАСТРЕ). Federal Service for Hydrometeorology
and environmental monitoring,.
Russian Federation. (2021). 2021 Common Reporting Format (CRF) Table. In National Inventory Submissions 2021. UNFCCC.
https://unfccc.int/documents/273489
Ruyssenaars, P. G., Coenen, P. W. H. G., Rienstra, J. D., Zijlema, P. J., Arets, E. J. M. M., Baas, K., Dröge, R., Geilenkirchen, G., ’t Hoen,
M., Honig, E., van Huet, B., van Huis, E. P., Koch, W. W. R., te Molder, R. M., Montfoort, J. A., van der Zee, T., van Zanten, M. C.,
& National Institute for Public Health and the Environment. (2021). Agriculture (CRF sector 3). In Greenhouse gas emissions in
the Netherlands 1990–2019 National Inventory Report 2021. National Institute for Public Health and the Environment,.
https://doi.org/10.21945/RIVM-2021-0007

Working Paper March 31, 2022 simpsoncentre.ca 22
Skrebele, A., Rubene, L., Lupkina, L., Cakars, I., Siņics, L., Lazdāne-Mihalko, J., Puļķe, A., Klāvs, G., Gračkova, L., Lazdiņš, A., Butlers, A.,
Bārdule, A., Līcīte, I., Bērziņa, L., Gancone, A., Zustenieks, G., & Ministry of Environmental Protection and Regional
Development of the Republic of Latvia. (2021). Agriculture (CRF 3). In Latvia’s National Inventory Report Submission under
UNFCCC and the Kyoto Protocol. Ministry of Environmental Protection and Regional Development of the Republic of Latvia,.
Slovak Hydrometeorological Institute, Ministry of Environment of the Slovak Republic, Ministry of Environment of the Slovak
Republic, & Department, C. C. (2021). Agriculture. In Slovak Republic: National Inventory Report 2021. Ministry of Environment
of the Slovak Republic, Slovak Hydrometeorological Institute,.
Slovakia. (2021). 2021 Common Reporting Format (CRF) Table. In National Inventory Submissions 2021. UNFCCC.
https://unfccc.int/documents/271570
Slovenia. (2021). 2021 Common Reporting Format (CRF) Table . In National Inventory Submissions 2021. UNFCCC.
https://unfccc.int/documents/271481
Spain. (2021). 2021 Common Reporting Format (CRF) Table . In National Inventory Submissions 2021. UNFCCC.
https://unfccc.int/documents/307148
Statistics Finland, & The Natural Resources Institute Finland. (2021). Agriculture (CRF 3). In Finland’s National Inventory Report 2021.
Statistics Finland.
Sweden. (2021). 2021 Common Reporting Format (CRF) Table. In National Inventory Submissions 2021. UNFCCC.
https://unfccc.int/documents/271826
Swedish Environmental Protection Agency, & Swedish Environmental Protection Agency. (2021). Annex 7: Uncertainties. In National
Inventory Report Sweden 2021: Annexes. Swedish Environmental Protection Agency.
Switzerland. (2021). 2021 Common Reporting Format (CRF) Table. In National Inventory Submissions 2021. UNFCCC.
https://unfccc.int/documents/271476
The Malta Resources Authority. (2021). Agriculture. In Malta’s National Inventory of Greenhouse Gas Emissions and Removals, 2021
(Vol. 1). https://doi.org/MRA/04/2021
The Norwegian Environment Agency, Statistics Norway, & Norwegian Institute of Bioeconomy Research. (2020). Agriculture (CRF
sector 3). In Greenhouse Gas Emissions 1990-2018, National Inventory Report (Vol. 1). The Norwegian Environment Agency.
The Norwegian Environment Agency, Statistics Norway, & Norwegian Institute of Bioeconomy Research. (2021). Agriculture (CRF
sector 3). In Greenhouse Gas Emissions 1990-2019: National Inventory Report.
Tokpaev, Z. R. (2021). Agriculture (СЕЛЬСКОЕ ХОЗЯЙСТВО). In National Inventory Report of the Republic of Kazakhstan
(Национальный доклад Республики Казахстан). www.zhasyldamu.kz,
Turkey. (2021). 2021 Common Reporting Format (CRF) Table . In National Inventory Submissions 2021. UNFCCC.
https://unfccc.int/documents/271541
Turkish Statistical Institute. (2021). Agriculture (CRF Sector 3). In Turkish Greenhouse Gas Inventory 1990 - 2019. Turkish Statistical
Institute,.
Ukraine. (2021). 2021 Common Reporting Format (CRF) Table. In National Inventory Submissions 2021. UNFCCC.
https://unfccc.int/documents/273456
United Kingdom. (2021). 2021 Convention Common Reporting Format (CRF) Table. In National Inventory Submissions 2021. UNFCCC.
https://unfccc.int/documents/273497

Working Paper March 31, 2022 simpsoncentre.ca 23
United Nations Framework Convention on Climate Change. (2022). National Inventory Submissions 2021. https://unfccc.int/ghg-
inventories-annex-i-parties/2021
United States Environmental Protection Agency. (2021a). Agriculture. In Inventory of U.S. Greenhouse Gas Emissions and Sinks:
1990–2019. United States Environmental Protection Agency,.
United States Environmental Protection Agency. (2021b). Annexes to the Inventory of U.S. GHG Emissions and Sinks. In Inventory of
U.S. Greenhouse Gas Emissions and Sinks: 1990-2019. United States Environmental Protection Agency,.
United States of America. (2021). 2021 Common Reporting Format (CRF) Table. In National Inventory Submissions 2021. UNFCCC.
https://unfccc.int/documents/272414
Verbič, J., Mekinda Majaron, T., Republic of Slovenia, & Slovenian Environment Agency. (2021). Agriculture (CRF Sector 3). In
Slovenia’s National Inventory Report 2021. Ministry of the Environment and Spatial Planning,.
Weber, F. (2021). Agriculture. In Liechtenstein’s Greenhouse Gas Inventory 1990 - 2019: National Inventory Report 2021. Office of
Environment.

Working Paper March 31, 2022 simpsoncentre.ca 24
TABLES
Table 1
Emission Factor Variable Inclusions
Model Tier Nitrogen Source
Application Rate
Soil Type
Weather Tillage Irrigation Rotation Production
Type
2006 Guidelines
1
2019 Refinement
1 1a 1a
Ireland 1 1
Netherlands 1 1
Australia 2 1 1 1
Canada 2 1 1 1 1 1b
Japan 2 1 1
New Zealand 2 1
Russia 2 1
United Kingdom
2 1 1 1
United States
3 1 1 1 1 1 1 1
Note. a. Indicates disaggregated emission factors (Hergoualc’h et al., 2019) b. Crop rotation is indirectly accounted for in estimating emissions from summer fallow (Environment and Climate Change Canada, 2021c). Information used was collected from the 2021 National Inventory Submissions.

Working Paper March 31, 2022 simpsoncentre.ca 25
Table 2
Country List
Country Abbreviation National Inventory Report Common Reporting
Format Tables Translation
Australia AUS
(Australian Government
Department of Industry
Science Energy and
Resources et al., 2021)
(Australia, 2021)
Austria AUT (Anderl et al., 2021) (Austria, 2021)
Belarus BLR (Narkevich I.P. et al., 2021) (Belarus, 2021) Russian
Belgium BEL
(Belgian Interregional
Environment Agency et al.,
2021)
(Belgium, 2021)
Bulgaria BGR
(Executive Environment
Agency at the Ministry of
Environment and Water,
2021)
(Bulgaria, 2020)
Canada CAN (Environment and Climate
Change Canada, 2021a) (Canada, 2021)
Croatia HRV (Marković & Glückselig,
2021) (Croatia, 2021)
Cyprus CYP
(Ministry of Agriculture Rural
Development and
Environment, 2021)
(Cyprus, 2021)
Czechia CZE (Beranova et al., 2021) (Czechia, 2021)
Denmark DNK (Nielsen et al., 2021) (Denmark, 2021)
Estonia EST (Kupri et al., 2021) (Estonia, 2021)
Finland FIN
(Statistics Finland & The
Natural Resources Institute
Finland, 2021)
(Finland, 2021)
France FRA (Andre et al., 2021) (France, 2021) French
Germany DEU (Federal Environment
Agency, 2021) (Germany, 2021)
Greece GRC (Ministry of the Environment
and Energy, 2021) (Greece, 2021)
Hungary HUN (Katalin, 2021) (Hungary, 2021)

Working Paper March 31, 2022 simpsoncentre.ca 26
Country Abbreviation National Inventory Report Common Reporting
Format Tables Translation
Iceland ISL (Keller et al., 2021) (Iceland, 2021)
Ireland IRL (Duffy et al., 2021) (Ireland, 2021)
Italy ITA (di Cristofaro & Cordella,
2021) (Italy, 2021)
Japan JPN
(Ministry of the Environment
& National Institute for
Environmental Studies, 2021)
(Japan, 2021)
Kazakhstan KZA (Tokpaev, 2021) (Kazakhstan, 2021) Russian
Latvia LVA (Skrebele et al., 2021) (Latvia, 2021)
Liechtenstein LIE (Weber, 2021) (Liechtenstein, 2021)
Lithuania LTU (Juška & Žiukelytė, 2021) (Lithuania, 2021)
Luxembourg LUX (Bechet et al., 2021) (Luxembourg, 2021)
Malta MLT (The Malta Resources
Authority, 2021) (Malta, 2021)
Netherlands NLD (Ruyssenaars et al., 2021) (Netherlands, 2021)
New Zealand NZL (Ministry for the
Environment, 2021) (New Zealand, 2021)
Norway NOR (The Norwegian Environment
Agency et al., 2020, 2021) (Norway, 2021)
Poland POL (Olecka et al., 2021) (Poland, 2021)
Portugal PRT (Pina & Portuguese
Environment Agency, 2021) (Portugal, 2021)
Romania ROU (Olteanu, 2021) (Romania, 2021)
Russian Fed. RUS (Romanovskaya et al., 2021) Russian
Slovakia SVK (Slovak Hydrometeorological
Institute et al., 2021) (Slovakia, 2021)
Slovenia SVN (Verbič et al., 2021) (Slovenia, 2021)
Spain ESP (MITECO, 2021) (Spain, 2021) Spanish
Sweden SWE
(Swedish Environmental
Protection Agency & Swedish
Environmental Protection
Agency, 2021)
(Sweden, 2021)

Working Paper March 31, 2022 simpsoncentre.ca 27
Country Abbreviation National Inventory Report Common Reporting
Format Tables Translation
Switzerland CHE (Federal Office for the
Environment, 2021) (Switzerland, 2021)
Turkey TUR (Turkish Statistical Institute,
2021) (Turkey, 2021)
Ukraine UKR
(Ministry of Environmental
Protection and Natural
Resources of Ukraine, 2021)
(Ukraine, 2021)
United Kingdom GBR (Brown et al., 2021) (United Kingdom, 2021)
United States USA
(United States Environmental
Protection Agency, 2021a,
2021b)
(United States of America,
2021)
Note. UNFCCC National Inventory Submission repository can be found at the following link: https://unfccc.int/ghg-inventories-
annex-i-parties/2021

Working Paper March 31, 2022 simpsoncentre.ca 28
Table 3
IPCC and Country Specific Emission Factors
Model Subcategory Emission Factor (kg N2O-N kg N-1)
2006 Guidelines Default Value 0.010
2019 Refinement Default Value 0.010
Synthetic fertilizer Wet climates 0.016
Dry Climate 0.005
Ireland Average Value 0.0123
CAN 0.014
Urea 0.003
Urea +NBPT 0.004
Netherlands Average Value 0.0106
Mineral soils grassland 0.008
Organic soils grassland 0.030
Mineral soils arable land 0.007
Organic soils arable land 0.030
Australia Average Value 0.0035
Irrigated Pasture 0.004
Irrigated Crop 0.009
Non-Irrigated Pasture 0.002
Non-Irrigated Crop 0.002
Sugar Cane 0.020
Cotton 0.006
Horticulture 0.009
Canada Average Value 0.0085
Japan Average Value 0.0065
Paddy Rice 0.0031
Tea 0.029
Other Crop 0.0062
Tea (N+DCD) 0.021

Working Paper March 31, 2022 simpsoncentre.ca 29
Model Subcategory Emission Factor (kg N2O-N kg N-1)
Other Crop (N+DCD) 0.0046
New Zealand Average Value 0.0068
Urea 0.006
Other Synthetic N 0.010
Russia Average Value 0.0137
Chernozems 0.013
Soddy-Podzolic 0.024
Other soil types 0.010
Application Under Rice 0.003
United Kingdom Average Value 0.0072
United States Average Value 0.0116
Note. Canada, United Kingdom, and the United States do not use discrete emission factors. Data used was collected from the 2021
National Inventory Reports and CRF Table 3. d

Working Paper March 31, 2022 simpsoncentre.ca 30
Table 4
Canadian Emission Factor Comparison with Background Data
Data Regional Factors 1990 2005 2010 2019
Canadaa
British Columbia 0.0102 0.0102 0.0102 0.0102
Alberta 0.0089 0.0083 0.0083 0.0083
Saskatchewan 0.0076 0.0070 0.0070 0.0076
Manitoba 0.0089 0.0095 0.0089 0.0089
Ontario 0.0146 0.0146 0.0146 0.0146
Quebec 0.0165 0.0165 0.0165 0.0165
New Brunswick 0.0159 0.0159 0.0159 0.0159
Nova Scotia 0.0153 0.0153 0.0153 0.0153
Price Edward Island 0.0134 0.0134 0.0134 0.0134
Newfoundland & Labrador 0.0165 0.0165 0.0165 0.0165
Canadab 0.0112 0.0096 0.0093 0.0085
IPCCc
IPCC Default 0.010
IPCC Wet Climate 0.014
IPCC Dry Climate 0.005
IPCC - Wet Climate - Temperate 0.013
IPCC - Dry Climate - Temperate 0.007
IPCC - Dry Climate - Irrigated 0.004
IPCC - Dry Climate - Non-Irrigated 0.001
Canada
Background
Datad
Brown/Dark Brown Soil 0.002
Black/ Gray Soil 0.008
Ontario & Quebec Soil 0.017
Irrigation 0.017
NT-RT factor (Western Canada) -0.800
NT-RT factor (Eastern Canada) 0.100
Note. a.(Environment and Climate Change Canada, 2021c, sec. A6.4.4) b. (Canada, 2021)c. (Hergoualc’h et al., 2019, sec. 11A.2)
d. (Environment and Climate Change Canada, 2021c, sec. A3.4.5.1)

Working Paper March 31, 2022 simpsoncentre.ca 31
Table 5
CRF Table Summery Statistics (1990, 2005, 2019)
Variable Units Year Mean Min Max Canada Rankb
Total Synthetic
Fertilizer Applied t 1990 843850 237 LIE 9910000 USA 1200000 8
Emission Factor kg N2O-N /
kg N 1990 0.01000 0.0064 JPN 0.0136 RUS 0.0112 4
Total Emissions:
Synthetic Fert kt N2O 1990 15.01 0.004 LIE 211.688 USA 21.088 6
Total Emissions: Direct kt N2O 1990 49.69 0.016 LIE 914.533 USA 47.856 8
Total Emissions: Ag
Soils kt N2O 1990 59.48 0.022 LIE 1060.091 USA 57.220 8
Total Reported Crop
Land kHa 1990 15323 2 LIE 174471 USA 50047 3
Total Reported Ag
Landa kHa 1990 46270 6 LIE 559278 AUS 57008 5
Ratio of Total Ag Soil
Emission to Total Ag
Land
kg N2O /
Ha 1990 3.057 0.070 AUS 11.560 NLD 1.004 38
Ratio of Fertilizer
Emissions to Total Ag
Land
kg N2O /
Ha 1990 0.873 0.010 AUS 2.620 NLD 0.370 36
Total Synthetic
Fertilizer Applied t 2005 674294 187 LIE 10700000 USA 1540000 4
Emission Factor kg N2O-N /
kg N 2005 0.0098 0.0043 AUS 0.0136 RUS 0.0096 37
Total Emissions:
Synthetic Fert kt N2O 2005 11.41 0.003 LIE 214.801 USA 23.133 4
Total Emissions: Direct kt N2O 2005 43.40 0.015 LIE 914.668 USA 51.531 6
Total Emissions: Ag
Soils kt N2O 2005 50.98 0.020 LIE 1051.644 USA 62.977 5
Total Reported Crop
Land kHa 2005 13942 2 LIE 165727 USA 49119 3
Total Reported Ag
Landa kHa 2005 45614 6 LIE 562349 AUS 55736 5

Working Paper March 31, 2022 simpsoncentre.ca 32
Variable Units Year Mean Min Max Canada Rankb
Ratio of Total Ag Soil
Emission to Total Ag
Land
kg N2O /
Ha 2005 2.481 0.08 AUS 8.020 NLD 1.130 35
Ratio of Fertilizer
Emissions to Total Ag
Land
kg N2O /
Ha 2005 0.632 0.001 KAZ 1.890 NLD 0.415 29
Total Synthetic
Fertilizer Applied t 2019 812717 184 LIE 13000000 USA 2640000 2
Emission Factor kg N2O-N /
kg N 2019 0.010 0.0035 AUS 0.0137 RUS 0.0085 38
Total Emissions:
Synthetic Fert kt N2O 2019 13.12 0.0029 LIE 236.374 USA 35.449 3
Total Emissions: Direct kt N2O 2019 46.98 0.0150 LIE 974.547 USA 67.948 6
Total Emissions: Ag
Soils kt N2O 2019 56.22 0.0199 LIE 1156.442 USA 82.031 6
Total Reported Crop
Land kHa 2019 13674 2 LIE 161933 USA 47414 3
Total Reported Ag
Landa kHa 2019 45205 6 LIE 559406 AUS 53729 5
Ratio of Total Ag Soil
Emission to Total Ag
Land
kg N2O /
Ha 2019 2.608 0.07 AUS 7.070 NLD 1.527 32
Ratio of Fertilizer
Emissions to Total Ag
Land
kg N2O /
Ha 2019 0.692 0.003 KAZ 1.640 NLD 0.660 20
Note. Data was collected from 2021 CRF Tables 4.1, see Table 2.
Table 6

Working Paper March 31, 2022 simpsoncentre.ca 33
Summary of Productivity Based Emission Intensity Scenarios
Variable Measure Mean SD Min
Value
25th
Percentile
50th
Percentile
75th
Percentile
Max
Value
Canadian
Value
Wheat Yield t / ha 5.19 2.18 1.01 3.43 4.97 5.96 9.38 3.38
Emission
Factor
kg N2O-N /
kg N
0.0097 0.0016 0.0035 0.0100 0.0100 0.0100 0.0137 0.00855
Benchmark % 0.38 0.64 -0.71 -0.01 0.28 0.71 2.31 0
Scenario 1 % 0.26 0.58 -0.73 -0.08 0.16 0.56 2.01 0
Scenario 2 % 0.18 0.63 -0.71 -0.18 0.02 0.44 2.31 0
Scenario 3 % 0.07 0.58 -0.73 -0.26 -0.07 0.31 2.01 0
Note. Data was collected from the FAOSTAT database and 2021 CRF Tables 3.d and 4.1, see Table 2.

Working Paper March 31, 2022 simpsoncentre.ca 34
FIGURES
Figure 1
Total Agricultural Land by Country: 2019
Note. Data was collected from 2021 CRF Tables 4.1, see Table 2.

Working Paper March 31, 2022 simpsoncentre.ca 35
Figure 2
Cropland as a share of total agricultural land area: 2019
Note. Data was collected from 2021 CRF Tables 3.d, see Table 2.
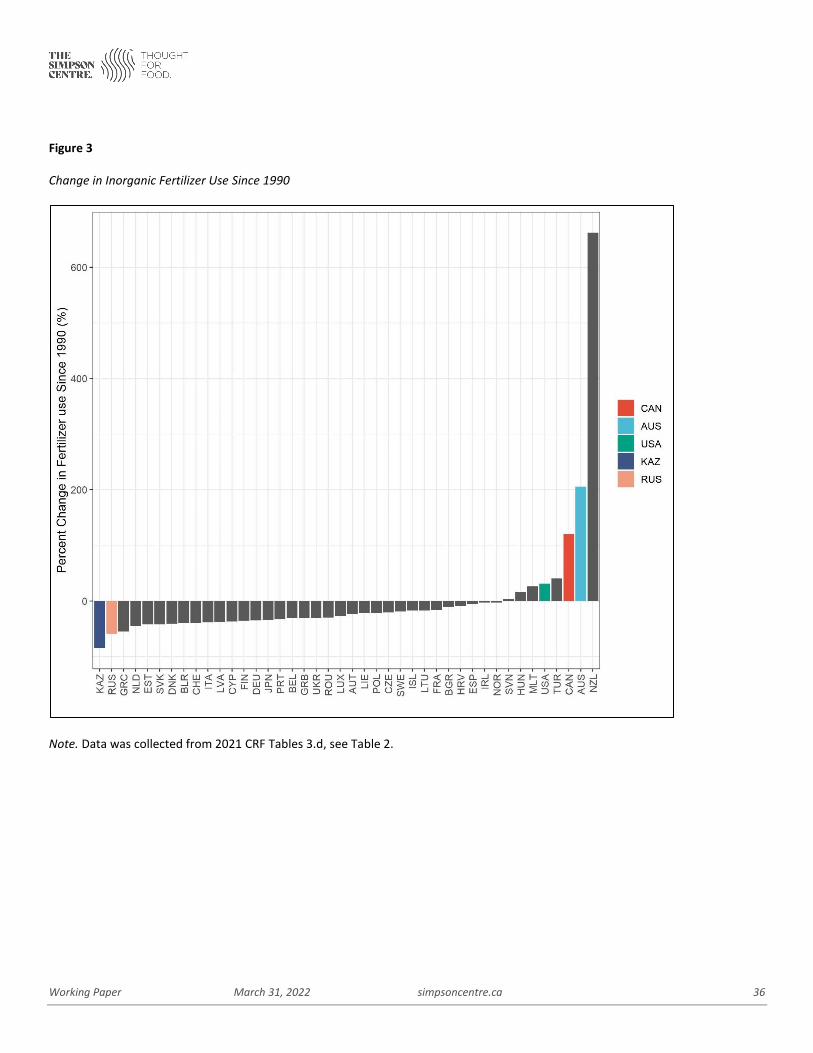
Working Paper March 31, 2022 simpsoncentre.ca 36
Figure 3
Change in Inorganic Fertilizer Use Since 1990
Note. Data was collected from 2021 CRF Tables 3.d, see Table 2.

Working Paper March 31, 2022 simpsoncentre.ca 37
Figure 4
Implied Application Rate Comparison
Note. Data was collected from 2021 CRF Tables 3.d and 4.1, see Table 2.

Working Paper March 31, 2022 simpsoncentre.ca 38
Figure 5
Implied Inorganic Fertilizer Application Rate on Total Agricultural Land: 2019
Note. Data was collected from 2021 CRF Tables 3.d and 4.1, see Table 2.

Working Paper March 31, 2022 simpsoncentre.ca 39
Figure 6
Reported Emission Factors, With International and Provincial Estimates
Note. Data was collected from 2021 CRF Tables 3.d, see Table 2.

Working Paper March 31, 2022 simpsoncentre.ca 40
Figure 7
Reported Emission Factor Comparison: 2019
Note. Data was collected from 2021 CRF Tables 3.d, see Table 2.

Working Paper March 31, 2022 simpsoncentre.ca 41
Figure 8
Comparison of Land Based Intensity Measures
Note. Data was collected from 2021 CRF Tables 3.d and 4.1, see Table 2.

Working Paper March 31, 2022 simpsoncentre.ca 42
Figure 9
Emission Intensity Total Agricultural Soils Emissions / Total Agricultural Land: 2019
Note. Data was collected from 2021 CRF Tables 3.d and 4.1, see Table 2.

Working Paper March 31, 2022 simpsoncentre.ca 43
Figure 10
Emission Intensity Direct Inorganic Fertilizer Emissions / Total Agricultural Land: 2019
Note. Data was collected from 2021 CRF Tables 3.d and 4.1, see Table 2.
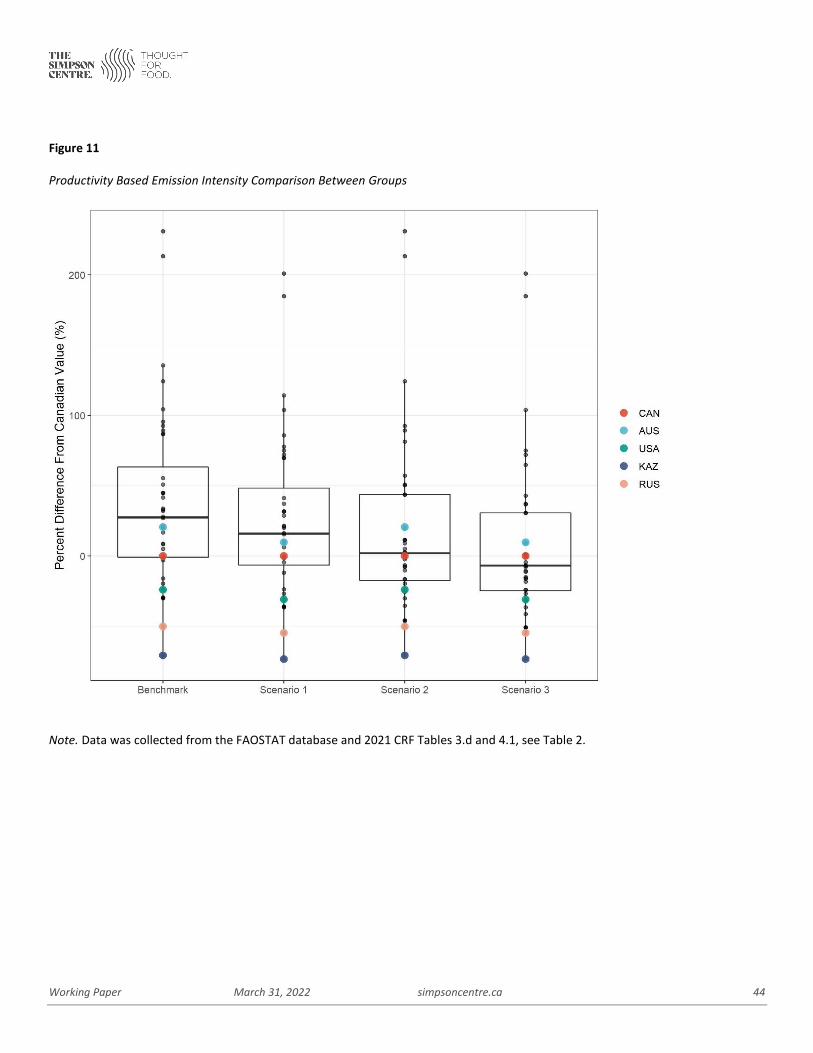
Working Paper March 31, 2022 simpsoncentre.ca 44
Figure 11
Productivity Based Emission Intensity Comparison Between Groups
Note. Data was collected from the FAOSTAT database and 2021 CRF Tables 3.d and 4.1, see Table 2.
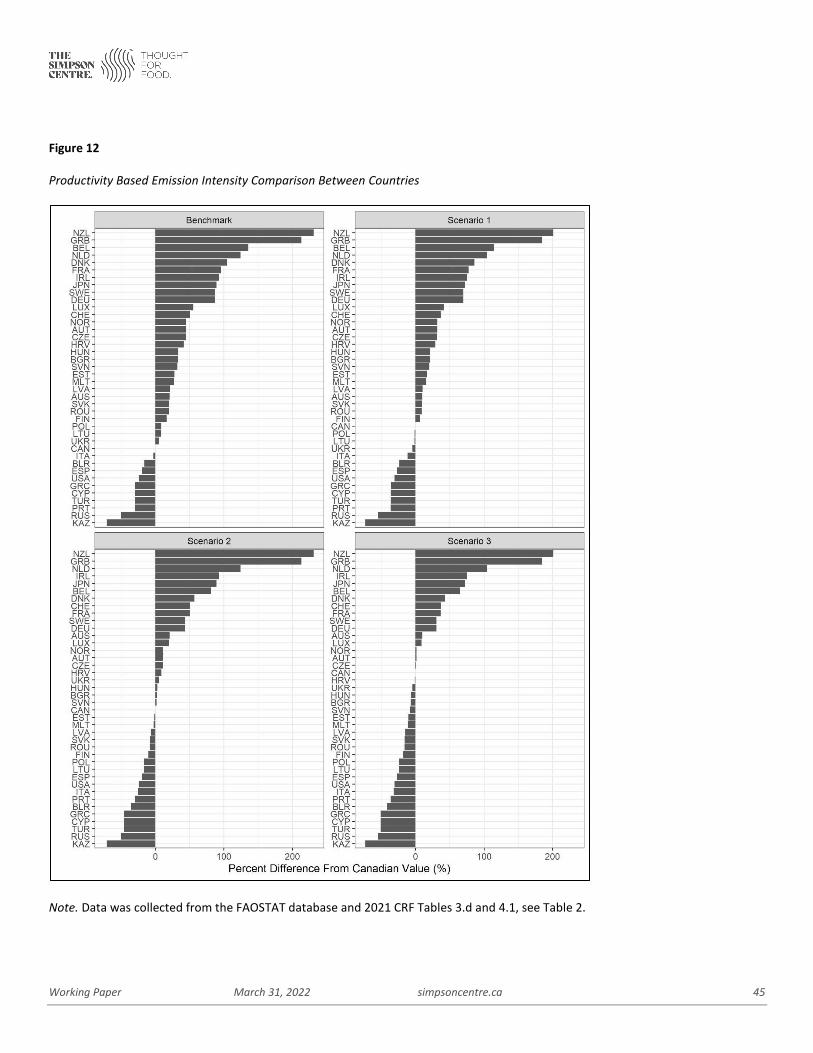
Working Paper March 31, 2022 simpsoncentre.ca 45
Figure 12
Productivity Based Emission Intensity Comparison Between Countries
Note. Data was collected from the FAOSTAT database and 2021 CRF Tables 3.d and 4.1, see Table 2.

DOCUMENT TYPE September 30, 3021 simpsoncentre.ca 46
The Simpson Centre mobilizes research for better policymaking
and decision-making to realize a more sustainable agricultural
industry. Strengthening the sustainability of agri-food and agri-
business means increasing food production to feed a growing
global population, while attending to social and health impacts
and the natural environment.
We connect researchers, everyday people, industry stakeholders
and government actors to scientific issues critical to the future of
Canada’s agricultural and food industry.
For more information visit
simpsoncentre.ca
The Simpson Centre
906 8th Ave SW, 4th Floor
Calgary, AB, Canada T2P 1H9


