Embed Size (px)
Citation preview
Gross Domestic Product:
Introduction:
The concept of GDP was first developed by Simon Kuznets for
a US Congress report in 1934. GDP became the main tool for
measuring a country's economy from the year 1944
Gross domestic product (GDP) is defined as "an aggregate
measure of production equal to the sum of the gross values
added of all resident institutional units engaged in
production (plus any taxes, and minus any subsidies, on
products not included in the value of their outputs)."
Gross domestic product (GDP) is the monetary value of
all the finished goods and services produced within a
country's borders in a specific time period.
Gross domestic product (GDP) is one the
primary indicators used to gauge the health of a
country's economy.
GDP estimates are commonly used to measure of the
economic output of a whole country or region, but can also
measure the relative contribution of an industry sector.
GDP estimates is also used to calculate the growth of
the economy from year to year (and recently from quarter to
quarter) and helps in determining country's standard of
living.
GDP growth rate helps indicate the success or failure
of economic policy and to determine whether an economy is 'in
recession' or not.
GDP is usually calculated on an annual basis. It
includes all of private and public consumption, government
outlays, investments and exports less imports that occur
within a defined territory.
GDP = C + G + I + NX
where:
"C" is equal to all private consumption, or consumer spending,
in a nation's economy
"G" is the sum of government spending
"I" is the sum of all the country's businesses spending on
capital
"NX" is the nation's total net exports, calculated as total
exports minus total imports. (NX = Exports - Imports)
Determining or measuring GDP:
Measuring GDP is complicated, GDP can be determined in
three ways
Production or output or value added approach
Income approach
Expenditure approach
i. Production or output or value added approach:
Production approach is the measure of total production
or output in the economy. Under this approach GDP is the total
value of products and services are produce and rendered during
an year.
GDP = Monetary (market) Value of all goods and services
produced during an year
Total GDP is the sum of gross value added by institutional
units that are resident in the economy (in different economic
activities) plus taxes on products and import (VAT, excise tax
and customs duties) less subsidies on products.
Calculation:
Total output (goods and services) by types of activities in
market prices (-) intermediary consumption for generating
goods and services = GDP at market prices (+) taxes on
products and import (-) subsidies on products = Total GDP at
market prices.
ii. Income approach:
GDP = Sum of income of all firms and individuals
engaged in production of any goods or services
This method measures GDP by adding incomes that firms pay
households for factors of production they hire - wages for
labour, interest for capital, rent for land and profits for
entrepreneurship.
If GDP is calculated by this method then it sometimes called
as 'Gross Domestic Income'(GDI) or GDP(I).
Incomes divided into five categories,
Wages, salaries, and supplementary labour income
Corporate profits
Interest and miscellaneous investment income
Farmers' incomes
Income from non-farm unincorporated businesses
GDP = compensation of employees + gross operating surplus + gross
mixed income+ taxes less subsidies on production and imports
GDP = COE + GOS + GMI + TP & M – SP & M
The sum of COE, GOS and GMI is called total factor income. he
factor income is also expressed as
Total factor income = employee compensation + corporate
profits + proprietor's income + rental income + net interest
or
GDP= R+I+P+SA+W
where,
R :Rents
I :interests
P :Profits
SA : statistical adjustments (corporate income taxes,
dividends, undistributed corporate profits)
W : wages.
iii. Expenditure approach:
GDP = Sum of expenditure from all firms and individuals on
consumption of any goods or services
This is the third way to estimate GDP. GDP estimates from
expenditure approach is almost similar to GDP estimates from
income approach.
If GDP is calculated by this method then its known as GDP(Y).
GDP (Y) is the sum of consumption (C), investment
(I), government spending (G) and net exports (X – M).
Y = C + I + G + (X − M)
Where,
C is Private consumption from households (for eg: goods and
services such as food, clothes, laundry etc)
I is Investment from firms to increase productive capacity(for
eg: purchasing machines, office buildings etc).This also
includes unsold goods in the inventory of firms
G is Spending from Government (for eg: to build hospitals,
schools, infrastructure etc)
(X-M) is Spending from foreign consumers on goods and services
produced within our country. This is calculated by measuring
net exports (subtracting the value of imports from the value
of exports of goods and services)
GDP (Y) is also calculated in the form of sum of final
consumption expenditure (FCE), gross capital formation (GCF),
and net exports (X – M).
Y = FCE + GCF+ (X − M)
This method works on the presumption that all the goods and
services that the country is producing is consumed
amongst these four groups of people. So if one adds up the
total expenses by each of these groups, the total GDP can be
measured.
Nominal GDP:
The determination of actual gross domestic
product without taking
into account other factors or variables such as inflation.
GDP figure that does not account for inflation can be misleadi
ng because GDP will appear higher than it actually is. So,
the nominal GDP is to be adjusted according to inflation rate.
Real GDP:
Real GDP is the Gross domestic product after accounting for
inflation. Comparing real GDP from year to year shows the
amount an economy has grown or shrunk and how this actually
affects the economy because they show the buying power of
money has been affected. Real GDP is used to compare GDP from
year to year. The factor used to convert nominal GDP to real
GDP is known as GDP deflator. The GDP deflator measures
changes in the prices of all domestically produced goods and
services in an economy including investment goods and
government services, as well as household consumption goods.
Real GDP is the one indicator that says the most about the
health of the economy and the advance release will almost
always move markets.
GDP deflator = Nominal GDP/ Real GDP* 100
GDP growth rate:
It tells you exactly how fast a country's economy is
growing. Most countries use real GDP to remove the effect of
inflation.
Constant-GDP figures allow us to calculate a GDP
growth rate, which indicates how much a country's production
has increased (or decreased, if the growth rate is negative)
compared to the previous year.
Real GDP growth rate for year n = [(Real GDP in year n) −
(Real GDP in year n − 1)] / (Real GDP in year n − 1)
Population growth effects the GDP growth rate in the manner
that if a country's GDP doubled over a certain period, but its
population tripled, the increase in GDP may not mean that the
standard of living increased for the country's residents; the
average person in the country is producing less than they were
before. Per-capita GDP is a measure to account for population
growth.
Per capita GDP:
GDP per person that is total GDP is divided by total
population of the country. If you want to compare GDP between
countries, keep in mind some countries have a large economic
output because they have so many people. To get a more
accurate picture, it's helpful to use GDP per capita. It shows
the real productivity of the population. its also used to
determine the standard of living of the country.
GDP comparison between countries:
The countries in the world compare their GDP by converting
their currency value according to either current currency
exchange rate or purchase power parity exchange rate.
Current GDP growth rate of India is 2.10% and GDP annual
growth rate is 4.60% and GDP growth worth is 1876.80 billion
dollars and GDP Per capita is 1165.00.
Gross National product:
Gross national product (GNP) is the market value of all
the products and services produced in one year by labour and
property supplied by the citizens of a country.
GNP is the total value of
all final goods and services produced within a nation in a
particular year, plus income earned by its citizens (including
income of those located abroad), minus income of non residents
in the country, i.e., GDP, plus any income earned by residents
from overseas investments, minus income earned within the
domestic economy by overseas residents.
GNP is one measure of the economic condition of a
country, under the assumption that a higher GNP leads to a
higher quality of living, all other things being equal. While
GDP is the total value of goods and services produced in the
country, GNP also takes into account the value of goods and
services offered by Indian companies outside the boundaries of
the country. Adding the income of a country’s nationals from
abroad and subtracting the income of foreign nationals in that
country results in ‘Net Income from Abroad’.
GNP = GDP + Net Income from Abroad
If Net Income from Abroad is positive, then GNP > GDP
otherwise GDP > GNP
Current Gross National Product is 99965.15 INR billion.
Net Domestic Product:
Net domestic product (NDP) represents the net book
value of all goods and services produced within a nation's
geographic borders over a specified period of time.
NDP is the annual measure economic output of a nation
that is adjusted to account for depreciation. Net domestic
product accounts for capital that has been consumed over the
year in the form of housing, vehicle, or machinery
deterioration. The depreciation accounted for is often
referred to as capital consumption allowance and represents
the amount needed in order to replace those depreciated
assets.
If the country is not able to replace the capital stock
lost through depreciation, then GDP will fall. In addition, a
growing gap between GDP and NDP indicates increasing
obsolescence of capital goods, while a narrowing gap means
that the condition of capital stock in the country is
improving. It reduces the value of capital that is why it is
separated from GDP to get NDP.
NDP= GDP - Depreciation
Similarly,
NDP = Consumption + Government Expenditures + investments+Exports - Imports - depreciation
Net National Product:
Net National Product is the monetary value of finished
goods and services produced by a country's citizens, whether
overseas or resident, in the time period being measured (i.e.,
the gross national product, or GNP) minus the amount of GNP
required to purchase new goods to maintain existing stock
(i.e., depreciation).
Depreciation (also known as consumption of fixed
capital) measures the amount of GNP that must be spent on new
capital goods to maintain the existing physical capital stock.
NNP = GNP - Depreciation, that means
NNP = Market value of Finished Goods + Market Value of
Finished Services - Depreciation
Alternatively, Net National Product (NNP) can be calculated as
total payroll compensation + net indirect tax on current
production + operating surpluses.
NNP is a measure of how much a country can consume in a
given period. Note that NNP measures output regardless of
where that production takes place (in other words, it includes
the value of goods and services that American companies
produce, supply or create abroad). Previously NNP is used as
the key identity in national accounting, later its replaced by
GNP and GDP.
Balance of Payment (BoP):
Balance of Payment (BoP) of a country is defined as the
statement of all economic transactions between the residents
of a country and the rest of the world in a particular period
(over a quarter of a year or more commonly over a year ).
These transactions are made by individuals firms and
government bodies. The balance of payments, also known as
balance of international payments, encompasses all
transactions between a country’s residents and its non
residents involving goods, services and income; financial
claims on and liabilities to the rest of the world; and
transfers such as gifts. BOP is calculated in order to
determine how much money is going in and out of a country. BOP
includes transactions that are payments made for the
country's exports and imports of goods, services, financial
capital, and financial transfers.
If a country has received money, this is known as a
credit, and if a country has paid or given money, the
transaction is counted as a debit. Theoretically, the BOP
should be zero, meaning that assets (credits) and liabilities
(debits) should balance, but in practice this is rarely the
case.
The balance payments divided into three main categories
they are
i. Current account
ii. Capital account
iii. Financial account
i. Current account:
The current account is an important indicator about an
economy's health. The current account records goods, services,
income and current transfers of a country for a particular
period. The current account is used to mark the inflow and
outflow of goods and services into a country. Earnings on
investments, both public and private, are also put into the
current account. The balance of the current account tells us
if a country has a deficit or a surplus.
The components of Current account are goods, services,
incomes and current transfers.
"Current account balance(CAB) = X - M + NY +
NCT"
Where
X = Export of goods and services
M = Import of goods and services
NY = Net income abroad
NCT = Net current transfers
ii. Capital account:
A national account that shows the net change in asset
ownership for a nation. The capital account is the net result
of public and private international investments flowing in and
out of a country.
A surplus in the capital account means money is flowing
into the country, a deficit in the capital account means money
is flowing out of the country. The capital account includes
foreign direct investment (FDI), portfolio and other
investments, plus changes in the reserve account.
"Capital account = Foreign direct investment + Portfolio
management + Other investment + Reserve account"
iii. Financial account:
In the financial account, international monetary flows
related to investment in business, real estate, bonds and
stocks are documented. Also included are government-owned
assets such as foreign reserves, gold, special drawing
rights (SDRs) held with the International Monetary Fund (IMF),
private assets held abroad and direct foreign investment.
Assets owned by foreigners, private and official, are also
recorded in the financial account.
Current account deficit:
Current account records all transactions in goods and
services i.e., imports and exports of the country along with
net income, such as interest and dividends, as well as
transfers, such as foreign aid. Current account deficit occurs
when imports are more than exports i.e., it shows negative
balance in Current account. current account deficit, which
indicates that it is a net borrower.
Developed countries, such as the United States, often
run current account deficits, while emerging economies often
run current account surpluses. Countries that are very poor
tend to run current account deficits.
A country can reduce its current account deficit by
increasing the value of its exports relative to the value of
imports. It can place restrictions on imports, such as tariffs
or quotas, or it can emphasize policies that promote exports,
such as import substitution industrialization or policies that
improve domestic companies' global competitiveness.
The country can also use monetary policy to improve the
domestic currency’s valuation relative to other currencies
through devaluation, since this makes a country’s exports less
expensive.
India recorded a Current Account deficit of 1.20 USD
Billion in the first quarter of 2014, it amounts 0.2% of GDP.
Current account surplus:
Current account records all transactions in goods and
services i.e., imports and exports of the country along with
net income, such as interest and dividends, as well as
transfers, such as foreign aid. Current account surplus occurs
when there is more exports than imports.
A current account surplus indicates that a nation is a
net lender to the rest of the world and has a positive trade
balance. A current account surplus increases a nation’s net
assets by the amount of the surplus.
Nations with large and consistent current account
surpluses are typically exporters of manufactured products or
energy. With manufactured products, these export-oriented
nations either follow a policy of mass-market production –
like China – or have a reputation for top quality, like
Germany, Japan and Switzerland.
Top 10 Current account surplus countries are Germany,
China, Saudi Arabia, Russia, Japan, Netherlands, Norway,
Kuwait, Switzerland, Qatar. These current account surpluses
are used to finance current account deficits in other nations.
Consumer Price Index(CPI):
A consumer price index (CPI) measures changes in the
price level of a market basket of consumer goods and services
purchased by households. The CPI is calculated by taking price
changes for each item in the predetermined basket of goods and
averaging them; the goods are weighted according to their
importance.
The prices of goods and services fluctuate over time,
but when prices change too much and too quickly, the effects
can shock an economy. The Consumer Price Index (CPI), the
principle gauge of the prices of goods and services, indicates
whether the economy is
experiencing inflation, deflation or stagflation.
Consumer price index is also known as Cost of living
index.
Uses of Consumer Price Index:
The CPI is often used to adjust consumer income
payments for changes in the currency's value and to adjust
other economic series. Social Security ties the CPI to income
eligibility levels; the income tax structure relies on the CPI
to make adjustments that avoid inflation-induced increases in
tax rates and finally, employers use the CPI to make wage
adjustments that keep up with the cost of living. Data series
on retail sales, hourly and weekly earnings and the national
income and product accounts are all tied to the CPI to
translate the related indexes into inflation-free terms.
The CPI is probably the most important and widely
watched economic indicator, and it's the best known measure
for determining cost of living changes--which, as history
shows us, can be detrimental if they are large and rapid. The
CPI is used to adjust wages, retirement benefits, tax brackets
and other important economic indicators. It can tell investors
some things about what may happen in the financial markets,
which share both direct and indirect relationships with
consumer prices. By knowing the state of consumer prices,
investors can make appropriate investment decisions and
protect themselves by using investment products.
Calculation of Consumer Price Index(CPI) :
For single item:
Current item price ($) = (base year price) * (Current CPI) /
(Base year CPI) or
CPI2 / CPI1 = Price2 / Price1
Alternatively, the CPI can be performed as CPI = updated
cost / base period cost * 100
"updated cost" is the price of an item at a given year.
For multiple items:
where the s sum to 1 or 100.
Consumer price index for July 2014 is 143.7
Percentage of variation over the year is 8.0%.
Wholesale price index:
Wholesale price index that measures and tracks the
changes in price of goods in the stages before the retail
level. Some countries use WPI changes as a central measure
of inflation. Previously India also used WPI as a measure of
inflation but now India is using CPI as a measure of
inflation.
The Indian WPI figure was released weekly on every
Thursday. But since 2009 it has been made monthly. The
Wholesale Price Index focuses on the price of goods traded
between corporations, rather than goods bought by consumers.
WPI is published by the Office of Economic Adviser,
Ministry of Commerce and Industry. WPI captures price
movements in a most comprehensive way. It is widely used by
Government, banks, industry and business circles. Important
monetary and fiscal policy changes are linked to WPI
movements.
Calculation of wholesale price index:
The wholesale price index (WPI) is based on the
wholesale price of a few relevant commodities of over 240
commodities available. The commodities chosen for the
calculation are based on their importance in the region and
the point of time the WPI is employed. The indicator tracks
the price movement of each commodity individually. Based on
this individual movement, the WPI is determined through the
averaging principle. The following methods are used to compute
the WPI:
Laspeyres Formula
It is the weighted arithmetic mean based on the fixed value-
based weights for the base period.
Ten-Day Price Index
Under this method, “sample prices” with high intra-month
fluctuations are selected and surveyed every ten days through
phone. Utilizing the data retrieved by this procedure and with
the assumption that other non-surveyed “sample prices” remain
unchanged, a “ten-day price index” is compiled and released.
Formula for calculating WPI is
(Price of commodity for current year - Price of commodity for
base year) / price of commodity for base year * 100.
Current WPI as on July 2014 is 184.6.
Percentage variation over year is 5.2%.
Index of industrial production:
The first official attempt to compute the IIP was made
much earlier than even the recommendations on the subject at
the international level. The Office of the Economic Advisor,
Ministry of Commerce and Industry made the first attempt of
compilation and release of IIP with base year 1937, covering
15 important industries, accounting for more than 90% of the
total production of the selected industries. The all-India IIP
is being released as a monthly series since 1950. With the
inception of the Central Statistical Organization in 1951, the
responsibility for compilation and publication of IIP was
vested with this office.
Index of Industrial Production details the growth of
industrial sectors such as mining, electricity and
manufacturing in the economy. IIP is one of the prime
indicators of economic development and short term economic
analysis and measures the trends in the behaviour of
industrial production over a period of time with reference to
a chosen base year. Present base year for IIP is 2004-05.
USES:
1. IIP is used by the planners, the state and the
central government at different levels for different policy
decisions and other purposes.
2. IIP used by state government for preparation state
income estimates of manufacturing sector.
3. The monthly IIP helps to use it as a reference
series in the compilation of cyclical indicators which helps
to predict the future turning points in business cycle.
4. Investors can use IIP of various industries to
examine the growth in the respective industries.
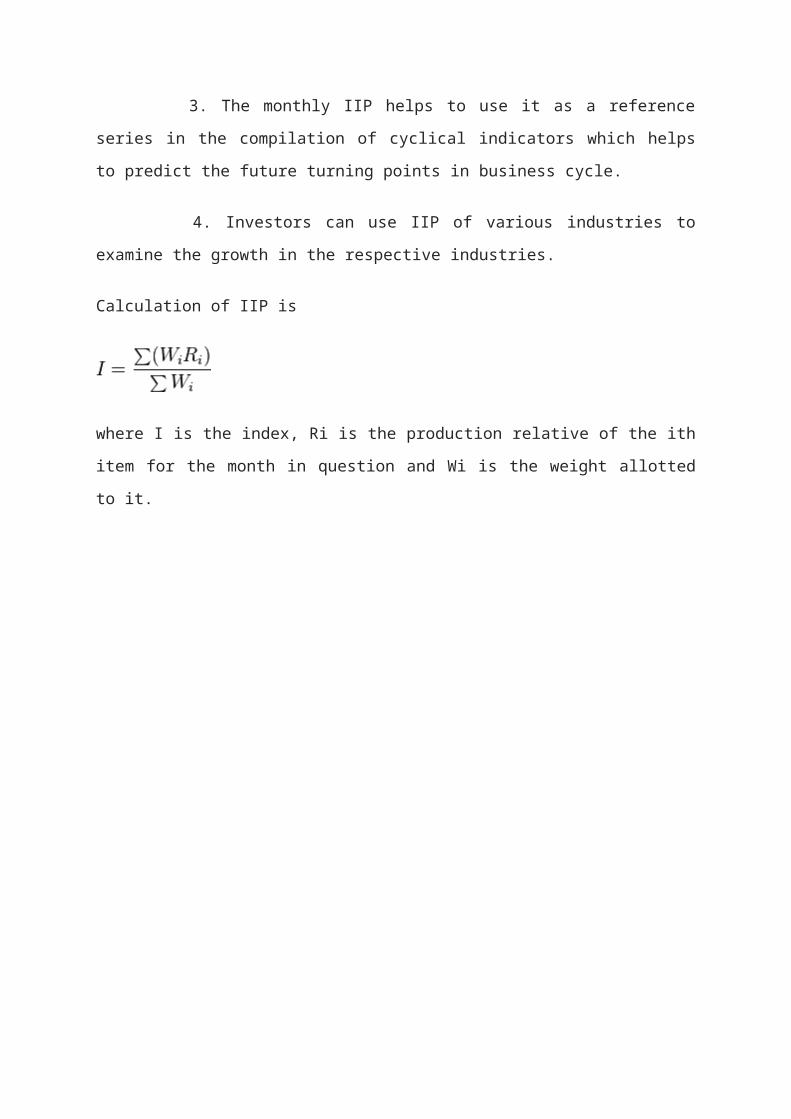
Calculation of IIP is
where I is the index, Ri is the production relative of the ith
item for the month in question and Wi is the weight allotted
to it.


