Embed Size (px)
Citation preview
Guerrilla Performance Analysis
for Robot Swarms: Degrees of Collaboration
and Chains of Interference Events
Heiko Hamann1, Till Aust1,Andreagiovanni Reina2
1Institute of Computer Engineering,University of Lubeck, Germany
2 Department of Computer Science,University of Sheffield, UK
October 2020
Abstract
Scalability is a key feature of swarm robotics. Hence, measuring per-formance depending on swarm size is important to check the validity ofthe design. Performance diagrams have generic qualities across many dif-ferent application scenarios. We summarize these findings and condensethem in a practical performance analysis guide for swarm robotics. Weintroduce three general classes of performance: linear increase, satura-tion, and increase/decrease. As the performance diagrams may containrich information about underlying processes, such as the degree of collab-oration and chains of interference events in crowded situations, we discussoptions for quickly devising hypotheses about the underlying robot behav-iors. The validity of our performance analysis guide is then made plausiblein a number of simple examples based on models and simulations.
1 Introduction
In a world of growing businesses and growing populations the question of howto collaborate effectively and how to form efficient groups is important. Groupsthat are too large can become inefficient as the cost needed by the group mem-bers to coordinate their actions is greater than the benefits the collaborationwould bring. For example, rumor has it that Jeff Bezos limits group sizes bythe amount its members can eat (so-called ‘Two Pizza Rule’ [33]) and Brooks’slaw says “adding manpower to a late software project makes it later” [5]. A sci-entific result is the Ringelmann effect describing the decreasing productivity ofindividuals with increasing group size [38]. However, certain systems can ex-ploit collaboration at their advantage to obtain a superlinear increase in group
1
0
5
10
15
20
25
30
35
0 10 20 30 40 50
perf
orm
ance
P
system size N
linearUSL
Amdahlswarm model1
2
3
4
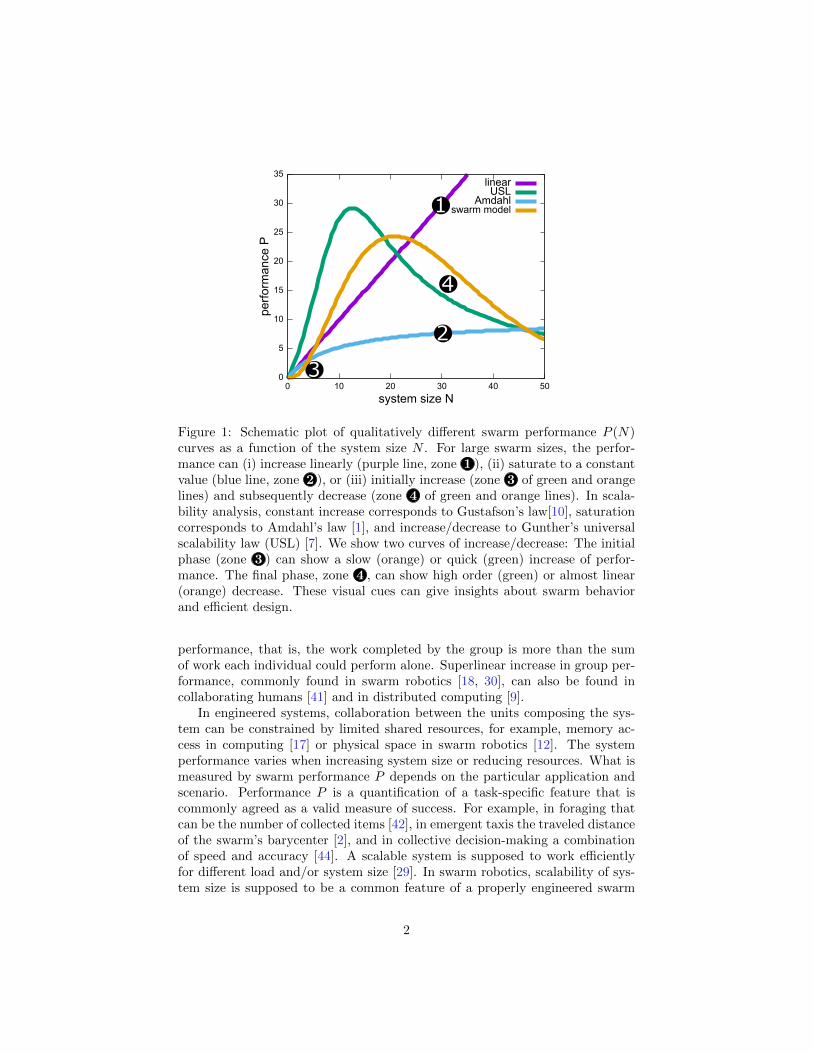
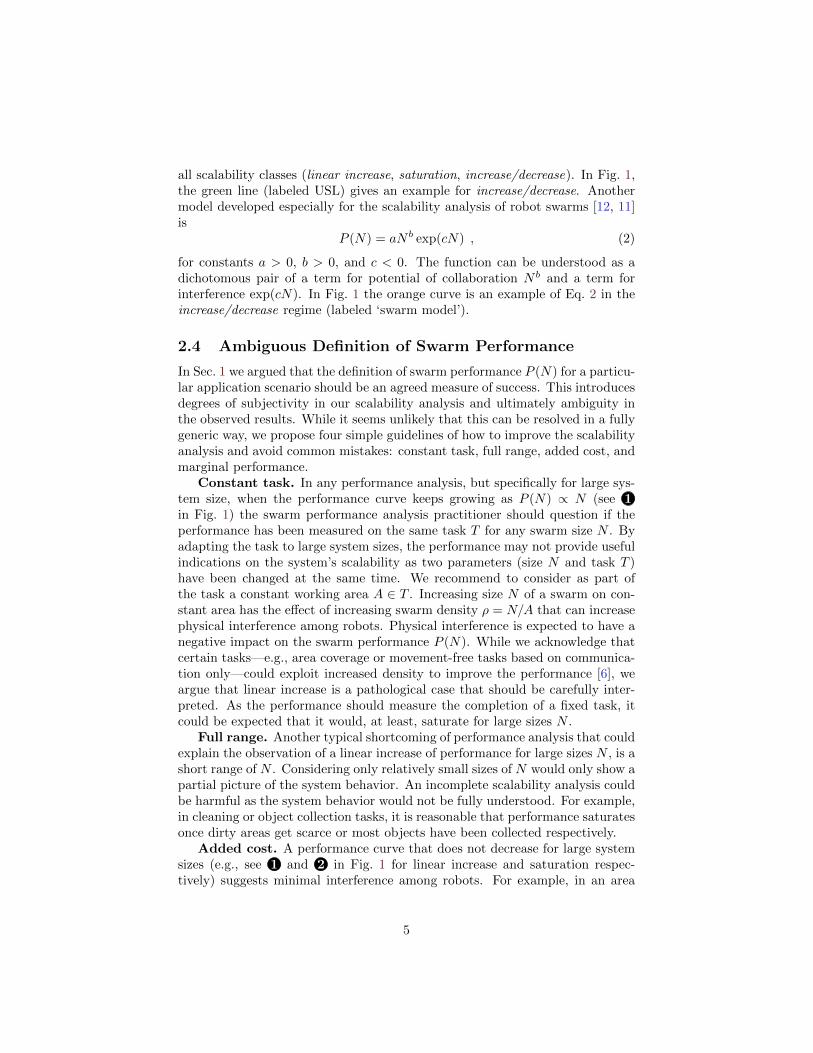
Figure 1: Schematic plot of qualitatively different swarm performance P (N)curves as a function of the system size N . For large swarm sizes, the perfor-mance can (i) increase linearly (purple line, zone 1 ), (ii) saturate to a constantvalue (blue line, zone 2 ), or (iii) initially increase (zone 3 of green and orangelines) and subsequently decrease (zone 4 of green and orange lines). In scala-bility analysis, constant increase corresponds to Gustafson’s law[10], saturationcorresponds to Amdahl’s law [1], and increase/decrease to Gunther’s universalscalability law (USL) [7]. We show two curves of increase/decrease: The initialphase (zone 3 ) can show a slow (orange) or quick (green) increase of perfor-mance. The final phase, zone 4 , can show high order (green) or almost linear(orange) decrease. These visual cues can give insights about swarm behaviorand efficient design.
performance, that is, the work completed by the group is more than the sumof work each individual could perform alone. Superlinear increase in group per-formance, commonly found in swarm robotics [18, 30], can also be found incollaborating humans [41] and in distributed computing [9].
In engineered systems, collaboration between the units composing the sys-tem can be constrained by limited shared resources, for example, memory ac-cess in computing [17] or physical space in swarm robotics [12]. The systemperformance varies when increasing system size or reducing resources. What ismeasured by swarm performance P depends on the particular application andscenario. Performance P is a quantification of a task-specific feature that iscommonly agreed as a valid measure of success. For example, in foraging thatcan be the number of collected items [42], in emergent taxis the traveled distanceof the swarm’s barycenter [2], and in collective decision-making a combinationof speed and accuracy [44]. A scalable system is supposed to work efficientlyfor different load and/or system size [29]. In swarm robotics, scalability of sys-tem size is supposed to be a common feature of a properly engineered swarm
2
system [13]. However, robots have a physical body and their movement caninterfere with others when the swarm density ρ = N/A (number of robots Nper area A) is high [11]. Increasing area A (shared resource) with swarm size Nwould keep the density ρ constant. This experiment design would provide noinformation gain about the system’s scalability. Instead, we are interested inmeasuring swarm performance P over swarm density ρ. In most published ex-periments this, in turn, means measuring swarm performance P over systemsize N because usually the provided area A is constant.
A promising feature of robot swarms is that they can form an open system(‘open swarms’ [35]) that have potential for scalability in real time. That is,robots can join and leave the swarm on demand depending on the needs ofthe moment [27]. In this type of systems, the robots can collectively adaptto varying swarm size (or densities) by updating their control parameters inreal time [45, 34]. While in this work, we focus on swarms with constant sizewithin an experiment, to engineer open swarms, scalability analysis is crucial toquantify the performance for varying system size. In fact, scalability analysismay reveal that adding more units is counterproductive and can instruct theswarm engineer on the most efficient way to react to real-time changes.
Our main motivation is that swarm performance curves P (N) seem to pos-sess generic qualities that appear across a wide collection of different swarmscenarios [11, 12, 14]. Our contribution is to summarize these findings here andto turn them into a practical performance analysis guide for swarm robotics.In this work, our access to understanding swarms is almost exclusively phe-nomonemological and macroscopic. Still, such findings can help to understandessential qualitative features of the swarm and to develop approaches to resolveperformance issues. Although deriving microscopic properties (e.g., requiredbehaviors of individual robots) from macroscopic properties is difficult [15, 36],we are able to indicate some micro-macro links that may even be generic. Forexample, we show how the macroscopic performance curve can indicate whethersmall or big groups of robots interact in beneficial or detrimental ways.
The term ‘guerrilla’ in the title is a tribute to Gunther [7] who wrote therenowned book ‘Guerrilla Capacity Planning’ [8] to provide industry managerswith a simple framework for scalabilty planning. Here we let the term representthe rather practical and phenomenological top-down approach to performance inswarm robotics. We provide a practical guide to quickly understand fundamen-tal scalability features of a studied swarm based on elementary insights aboutsuperficial characteristics of their P (N) plot. We present three classes of per-formance: linear increase, saturation, and increase/decrease. Then we focus onthe increase/decrease class and discuss how the performance curve can explainthe relationship between collaboration and interference among the robots.
3
2 Three General Classes of Performance SystemBehavior
Analyzing the system performance P (N) reveals three qualitatively differenttypes of scalability classes: linear increase, saturation, and increase/decrease.
2.1 Linear Increase
If we observe a sustained trend of performance P (N) ∝ N up to large valuesof N (see purple line 1 in Fig. 1), then we observe the scalability class of linearincrease. This situation is advantageous as the swarm performance improvesby increasing the number of robots. However, we should note that it cannot beconsidered the ideal case as also superlinear performance scaling can be observedin swarm robotics and computing systems [28, 12, 9], as represented by the rapidinitial increase of the green curve in Fig. 1.
2.2 Saturation
We observe the saturation class when performance P (N) approaches a maxi-mum P (N → ∞) = s∗ (see blue curve 2 in Fig. 1). Therefore, such a regimehas no performance peak and is equivalent to Amdahl’s law [1] that was origi-nally formulated to (pessimistically) describe the scalability of parallel comput-ers. While Amdahl’s law has demonstrated its applicability [8], we argue thatthis saturation scenario is rare in swarm robotics or ignores costs (see Sec. 2.4).Physical interference due to high robot densities usually has a significant impacton swarm performance causing an increase/decrease situation.
2.3 Increase/Decrease
In swarm robotics, the representative scalability class is increase/decrease, char-acterized by increasing performance for small N , a performance peak at acritical swarm size Nc, and decreasing performance for N > Nc. Perfor-mance P (N < Nc) increases because robots efficiently collaborate or work inparallel to perform the task, and performance P (N > Nc) decreases becauserobots interfere with each other.
Gunther [7, 9] proposed the universal scalability law (USL) to describe thisincrease/decrease class as observed in computing. The USL is based on per-formance improvements S (speedup) for size N compared to the minimal sys-tem N = 1. The USL is
S(N) =P (N)
P (1)=
N
1 + σ(N − 1) + κN(N − 1), (1)
with parameter σ describing the influence of contention (e.g., queues for sharedresources) and parameter κ describing a coherency delay (e.g., distributing andsynchronizing information). The USL properly parameterized by σ and κ covers
4
all scalability classes (linear increase, saturation, increase/decrease). In Fig. 1,the green line (labeled USL) gives an example for increase/decrease. Anothermodel developed especially for the scalability analysis of robot swarms [12, 11]is
P (N) = aN b exp(cN) , (2)
for constants a > 0, b > 0, and c < 0. The function can be understood as adichotomous pair of a term for potential of collaboration N b and a term forinterference exp(cN). In Fig. 1 the orange curve is an example of Eq. 2 in theincrease/decrease regime (labeled ‘swarm model’).
2.4 Ambiguous Definition of Swarm Performance
In Sec. 1 we argued that the definition of swarm performance P (N) for a particu-lar application scenario should be an agreed measure of success. This introducesdegrees of subjectivity in our scalability analysis and ultimately ambiguity inthe observed results. While it seems unlikely that this can be resolved in a fullygeneric way, we propose four simple guidelines of how to improve the scalabilityanalysis and avoid common mistakes: constant task, full range, added cost, andmarginal performance.
Constant task. In any performance analysis, but specifically for large sys-tem size, when the performance curve keeps growing as P (N) ∝ N (see 1in Fig. 1) the swarm performance analysis practitioner should question if theperformance has been measured on the same task T for any swarm size N . Byadapting the task to large system sizes, the performance may not provide usefulindications on the system’s scalability as two parameters (size N and task T )have been changed at the same time. We recommend to consider as part ofthe task a constant working area A ∈ T . Increasing size N of a swarm on con-stant area has the effect of increasing swarm density ρ = N/A that can increasephysical interference among robots. Physical interference is expected to have anegative impact on the swarm performance P (N). While we acknowledge thatcertain tasks—e.g., area coverage or movement-free tasks based on communica-tion only—could exploit increased density to improve the performance [6], weargue that linear increase is a pathological case that should be carefully inter-preted. As the performance should measure the completion of a fixed task, itcould be expected that it would, at least, saturate for large sizes N .
Full range. Another typical shortcoming of performance analysis that couldexplain the observation of a linear increase of performance for large sizes N , is ashort range of N . Considering only relatively small sizes of N would only show apartial picture of the system behavior. An incomplete scalability analysis couldbe harmful as the system behavior would not be fully understood. For example,in cleaning or object collection tasks, it is reasonable that performance saturatesonce dirty areas get scarce or most objects have been collected respectively.
Added cost. A performance curve that does not decrease for large systemsizes (e.g., see 1 and 2 in Fig. 1 for linear increase and saturation respec-tively) suggests minimal interference among robots. For example, in an area
5
-25
0
25
50
75
100
26 52 78
performance
P
system size N
performance Peffciency Pe
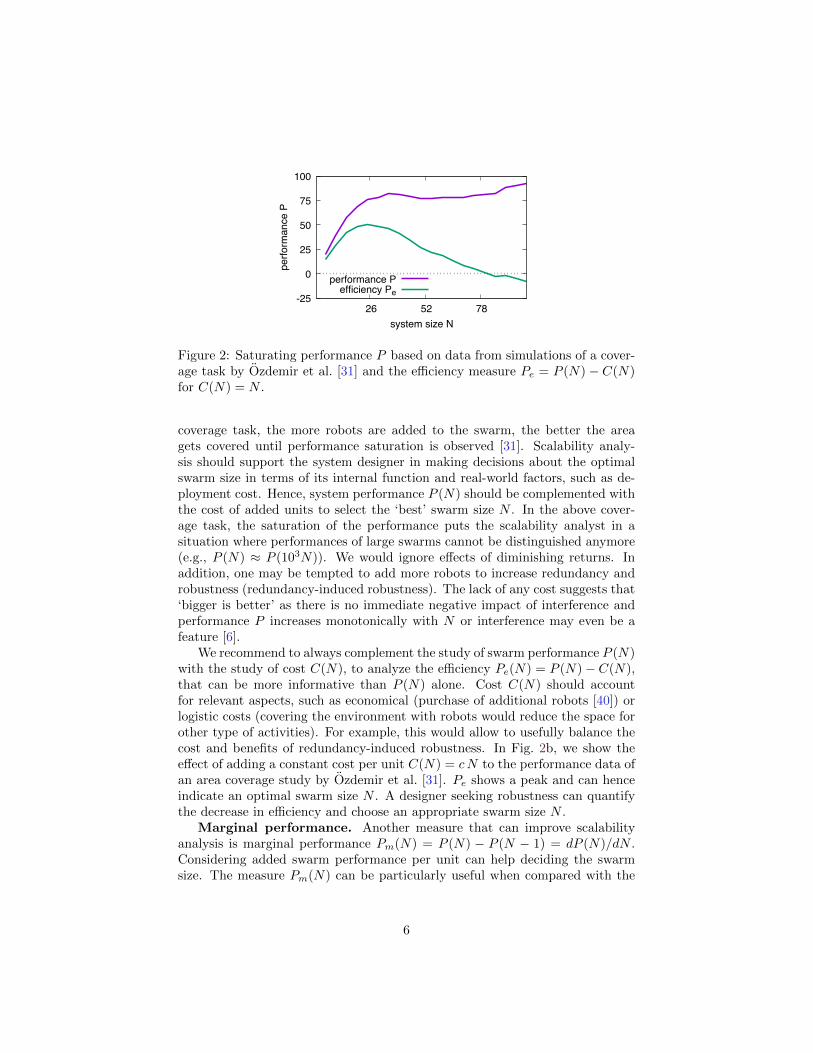
Figure 2: Saturating performance P based on data from simulations of a cover-age task by Ozdemir et al. [31] and the efficiency measure Pe = P (N)− C(N)for C(N) = N .
coverage task, the more robots are added to the swarm, the better the areagets covered until performance saturation is observed [31]. Scalability analy-sis should support the system designer in making decisions about the optimalswarm size in terms of its internal function and real-world factors, such as de-ployment cost. Hence, system performance P (N) should be complemented withthe cost of added units to select the ‘best’ swarm size N . In the above cover-age task, the saturation of the performance puts the scalability analyst in asituation where performances of large swarms cannot be distinguished anymore(e.g., P (N) ≈ P (103N)). We would ignore effects of diminishing returns. Inaddition, one may be tempted to add more robots to increase redundancy androbustness (redundancy-induced robustness). The lack of any cost suggests that‘bigger is better’ as there is no immediate negative impact of interference andperformance P increases monotonically with N or interference may even be afeature [6].
We recommend to always complement the study of swarm performance P (N)with the study of cost C(N), to analyze the efficiency Pe(N) = P (N)− C(N),that can be more informative than P (N) alone. Cost C(N) should accountfor relevant aspects, such as economical (purchase of additional robots [40]) orlogistic costs (covering the environment with robots would reduce the space forother type of activities). For example, this would allow to usefully balance thecost and benefits of redundancy-induced robustness. In Fig. 2b, we show theeffect of adding a constant cost per unit C(N) = cN to the performance data ofan area coverage study by Ozdemir et al. [31]. Pe shows a peak and can henceindicate an optimal swarm size N . A designer seeking robustness can quantifythe decrease in efficiency and choose an appropriate swarm size N .
Marginal performance. Another measure that can improve scalabilityanalysis is marginal performance Pm(N) = P (N) − P (N − 1) = dP (N)/dN .Considering added swarm performance per unit can help deciding the swarmsize. The measure Pm(N) can be particularly useful when compared with the
6
marginal cost Cm(N) = C(N)−C(N−1) = dC(N)/dN . For Pm(N) < Cm(N),adding robots to the system would decrease swarm performance. Similarly, onecould consider the mean individual performance I(N) = P (N)/N . In a moreholistic way, here the entire swarm shares the benefits of an added robot. Alsoin this case, the measure I(N), that indicates the performance contribution ofeach robot, can be compared with the individual cost Ic(N) = C(N)/N in orderto appropriately scale the system.
3 From Eye-catchers to a Practical PerformanceAnalysis
The performance class that is most frequently observed in swarm robotics is in-crease/decrease. For this class we provide a guide how to quickly interpret P (N)diagrams in terms of two features: shape of the curve for small system sizes(see 3 in Fig. 1) and shape of the curve for large systems (see 4 in Fig. 1).
3.1 Increase: Low- and High-order Robot-robot Collabo-ration
By looking at the initial phase of the performance curve ( 3 in Fig. 1, forN < 15), we can obtain indications of how much robot-robot collaboration isdone to complete the task (cf. other, more sophisticated efforts to derive groupsizes from macroscopic measurements [15]). A fast increase of P (N) for smallestvalues N ∈ {1, 2, 3}, shows that a small swarm is already sufficient to completeat least parts of the task (e.g., green curve of Fig. 1). Instead, if the curvehas a slow start and P (N) shows a noticeable increase only for larger sizes N ,it could indicate the necessity of robot-robot collaboration in larger groups.In most published swarm performance measurements, the initial increase ofperformance is approximately linear (fast increase). However, there are rarecases of published datasets showing a nonlinear (curved) and slow increase [26].Note that we do not focus on distinguishing between super- and sub-linearperformance increases, instead we try to understand when to expect linear andwhen nonlinear increases.
Both scalability functions described in Sec. 2.3 can represent both linear(fast) and nonlinear (slow) increase despite their simplicity. Interestingly, sim-ilar nonlinear system behaviors can be observed in models from not directlyrelated fields, such as PT2 lag elements in control theory, or residence timesin cascades of stirred-tank reactors (tanks in series) [23]. In both of these ex-amples, sequences of events or higher order time-delays introduce the observednonlinearity. Comparable effects emerge in robot swarms when several robotsneed to collaborate in order to perform the given task.
To support our above claims, we show two minimal examples in which ob-serving the system performance curve for small system sizes ( 3 , N < 10, inFig. 1) allows us to estimate the necessary amount of robot-robot interactions
7
0
0.5
1
0 0.5 1
probability
Γ
swarm density ρ
collab. of k=4collab. of k=3collab. of k=2
no collab. (k=1)
(a) Γk =∑m
i=k
(mi
)ρi(1 − ρ)(m−i)
0
0.5
0 0.5 1
probability
Γ
swarm density ρ
collab. of k=4collab. of k=3collab. of k=2
no collab. (k=1)
(b) Γ′k =(mk
)ρk(1 − ρ)(m−k)
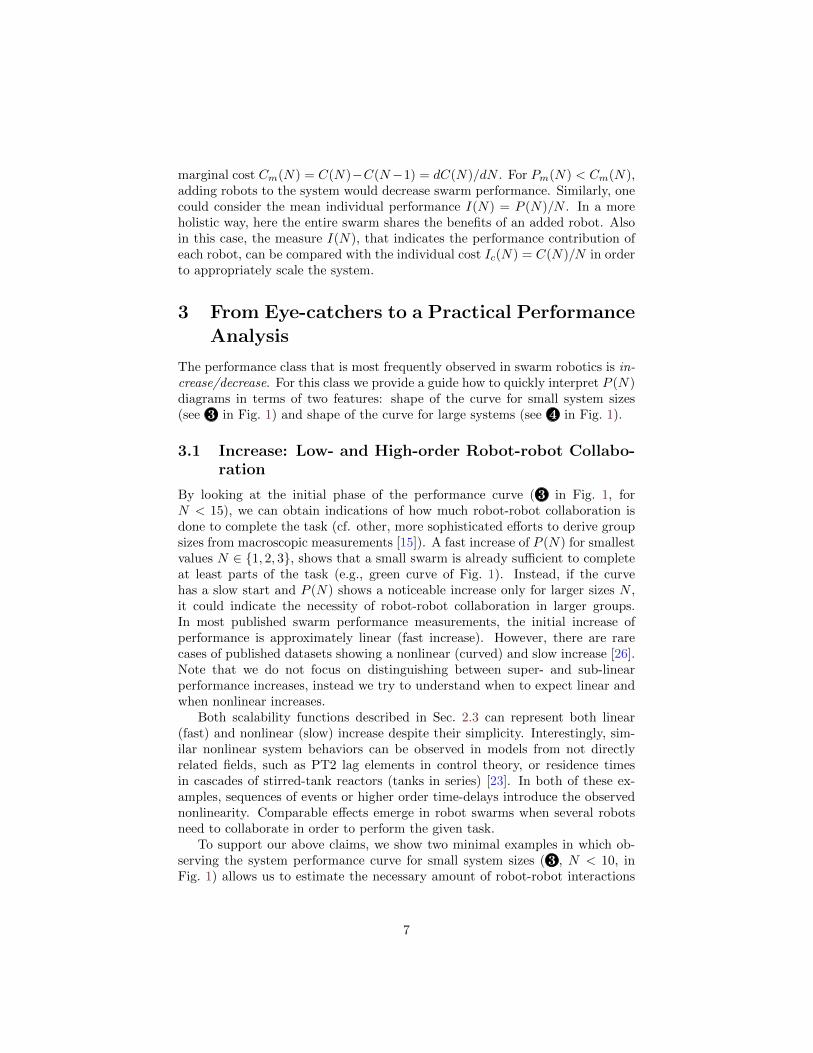
Figure 3: Combinatorial explanation of chances for collaboration, collabora-tion probability Γk for k ∈ {1, 2, 3, 4} and neighborhood size m = 9 (Mooreneighborhood), and swarm density ρ; two scenarios: (a) without and (b) withinterference.
to complete the task. If robots can perform the task without any/much helpfrom other robots, then the initial increase is steep and close to linear. We saythat robots require low-order interactions. If robots require considerable helpfrom other robots to perform the task, then the initial performance remains lowfor small sizes N and shows a curved (nonlinear) increase. We say that robotsrequire high-order interactions. We give evidence for this conjecture throughtwo simple analyses: a simple combinatorial argumentation and empirical ob-servations in simulations of an abstract system inspired by the stick pullingexperiment [18].
Our combinatorial consideration is based on the precondition for robot-robotcollaboration: robots need to be in close proximity to each other. In swarmrobotics, robot movement is often based on random motion [3]. We consider theprobability that collaboration among k robots takes place as a stochastic eventproportional to k and swarm density ρ. Assuming a simple grid environmentwhere collaboration takes place between neighboring robots, we can derive theprobability of having at least k robots in Moore neighborhoods, 3 × 3, of m =9 cells. Swarm density ρ indicates the (independent) probability of findinga robot in a given cell. The probability Γk of finding at least k robots ina Moore neighborhood of m = 9 cells corresponds to Γk =
∑mi=k
(mi
)ρi(1 −
ρ)(m−i). In Fig. 3a we show Γk as a function of ρ for k ∈ {1, 2, 3, 4}. Asexpected, the probability that at least k robots meet (our assumed preconditionfor collaboration) decreases by increasing k. Looking at the initial part of thecurves, for low density values, larger groups have a slow (nonlinear) increase.Instead, small groups (e.g., k = 1 or k = 2) have fast and almost linear increases.In Fig. 3a, we assume no interference between robots, thus values larger than kstill allow for collaboration without overhead. In Fig. 3b, we assume that valueslarger than k would prohibit collaboration. The shown probability is Γ′k =(mk
)ρk(1−ρ)(m−k). Despite the different shapes for high densities (see Sec. 3.2),
the initial part shows the same type of shapes for varying k.
8
0
5
10
15
20
25
30
0 20 40 60 80 100 120
swarm
performance
P
system size N
collaboration of 4collaboration of 3collaboration of 2no collaboration
(a) performance P
0
0.5
1
0 20 40 60 80 100 120
individual performance
I
system size N
(b) individual performance I = P/N
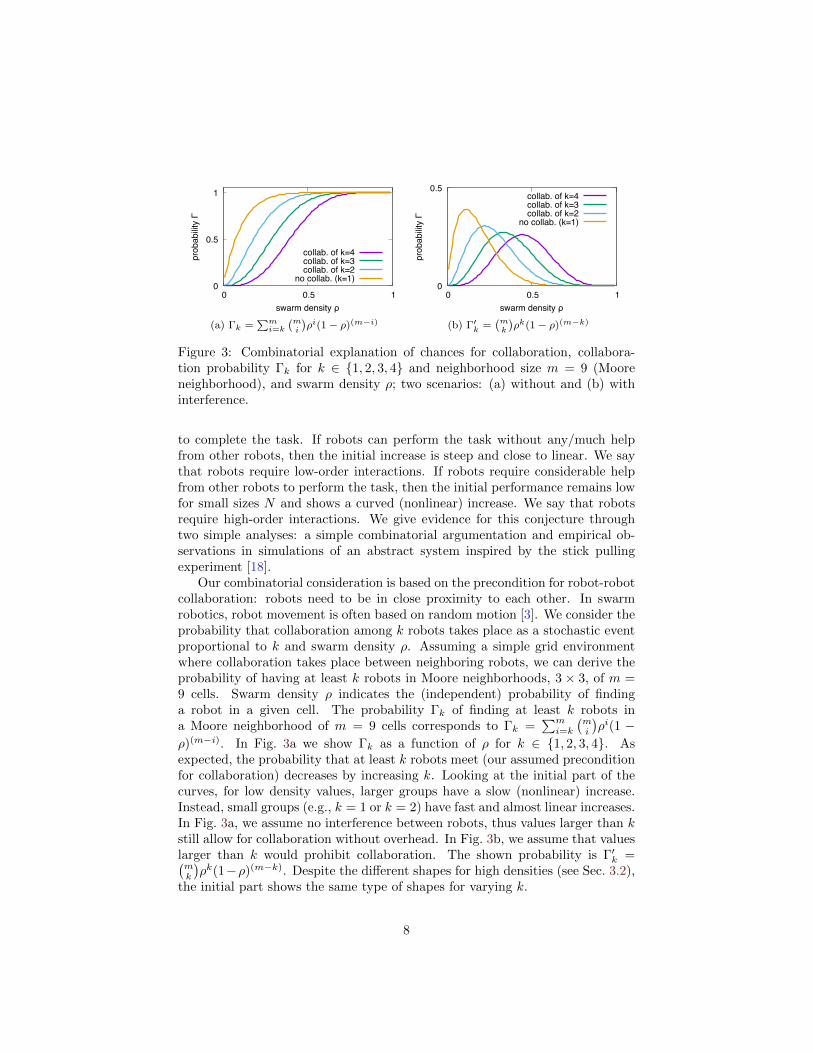
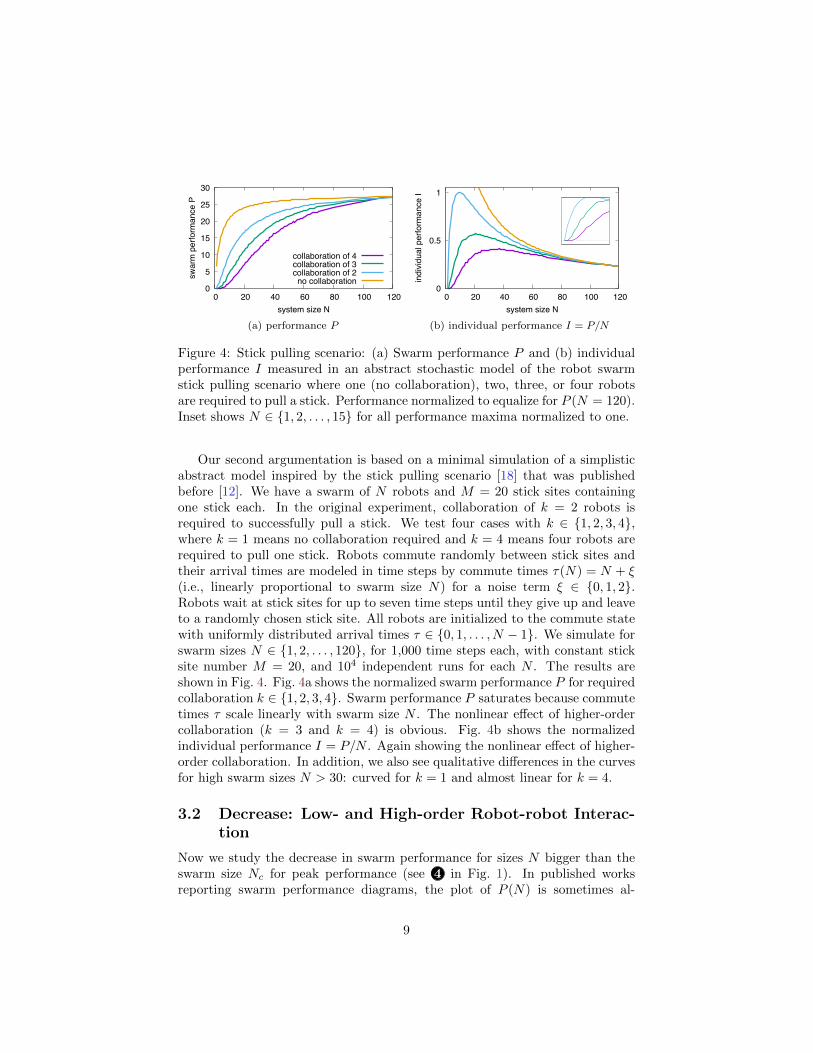
Figure 4: Stick pulling scenario: (a) Swarm performance P and (b) individualperformance I measured in an abstract stochastic model of the robot swarmstick pulling scenario where one (no collaboration), two, three, or four robotsare required to pull a stick. Performance normalized to equalize for P (N = 120).Inset shows N ∈ {1, 2, . . . , 15} for all performance maxima normalized to one.
Our second argumentation is based on a minimal simulation of a simplisticabstract model inspired by the stick pulling scenario [18] that was publishedbefore [12]. We have a swarm of N robots and M = 20 stick sites containingone stick each. In the original experiment, collaboration of k = 2 robots isrequired to successfully pull a stick. We test four cases with k ∈ {1, 2, 3, 4},where k = 1 means no collaboration required and k = 4 means four robots arerequired to pull one stick. Robots commute randomly between stick sites andtheir arrival times are modeled in time steps by commute times τ(N) = N + ξ(i.e., linearly proportional to swarm size N) for a noise term ξ ∈ {0, 1, 2}.Robots wait at stick sites for up to seven time steps until they give up and leaveto a randomly chosen stick site. All robots are initialized to the commute statewith uniformly distributed arrival times τ ∈ {0, 1, . . . , N − 1}. We simulate forswarm sizes N ∈ {1, 2, . . . , 120}, for 1,000 time steps each, with constant sticksite number M = 20, and 104 independent runs for each N . The results areshown in Fig. 4. Fig. 4a shows the normalized swarm performance P for requiredcollaboration k ∈ {1, 2, 3, 4}. Swarm performance P saturates because commutetimes τ scale linearly with swarm size N . The nonlinear effect of higher-ordercollaboration (k = 3 and k = 4) is obvious. Fig. 4b shows the normalizedindividual performance I = P/N . Again showing the nonlinear effect of higher-order collaboration. In addition, we also see qualitative differences in the curvesfor high swarm sizes N > 30: curved for k = 1 and almost linear for k = 4.
3.2 Decrease: Low- and High-order Robot-robot Interac-tion
Now we study the decrease in swarm performance for sizes N bigger than theswarm size Nc for peak performance (see 4 in Fig. 1). In published worksreporting swarm performance diagrams, the plot of P (N) is sometimes al-
9
most linear [16, 25], sometimes slightly curved [22, 43, 47], and sometimescurved [39, 42, 18] for sizes N > Nc. For example, Llenas et al. [25] re-port performance plots with graceful linear degradation for a foraging scenario.The underlying simulation of Kilobots was simplified, temporarily small clustersformed that dissolved quickly, and traffic lanes were formed. Hence, most col-lision avoidance actions were of first order, that is, robots made a transition tocollision avoidance but didn’t trigger collision avoidance in others. This is simi-lar to traffic models were a linear decrease is assumed classically, for example inthe Lighthill–Whitham–Richards (LWR) model [24]. The traffic is assumed tobe fully synchronized with strong serial dependencies due to lanes (1-d space)for system size Nc. If system size is further increased, traffic is disturbed, andfor too crowded systems traffic jams emerge. In swarm robotics the situationis more complex as space is 2-d and it is unknown which robots in collisionavoidance state may trigger collision avoidance in others. Another analogy aretransport systems [19]. There viscosity or mechanical impedance increases non-linearly with concentration (cf. interference in eq. 2). For robots that translatesto number of collision avoidance events.
Performance for big sizes (for N > 20 as seen at 4 in Fig. 1) is our focusnow. If robots interfering with each other manage to resolve the interference(e.g., by avoidance movements) and return to productive mode quickly, then theperformance decrease is low and close to linear. We say they show low-orderinterference. If robots by trying to resolve interference, trigger cascades ofcollision avoidance, then the performance decrease is steep and curved. We saythey show high-order interference. To support our claims, we present empiricalevidence based on a simulation. The main idea of this experiment is to controlthe number of collision-avoidance events that a robot triggers. We define asfirst order interference the collision avoidance that is triggered by two robotsmoving close to each other. During collision avoidance (CA), the robots performa set of maneuvers to avoid physical collision. If during the execution of thisset of avoidance maneuvers, the robot triggers collision avoidance in anotherrobot, we define it as second order interference. Therefore, when these robotsperforming collision avoidance (in state CA) trigger another jth robot, suchevent corresponds to the jth order interference, for j robots involved. This isrelated to the basic reproduction number R0 in the SIR epidemic model [20],where R0 defines the average number of infections that each infected individualscauses. Considering R0 the average number of collision avoidance events thateach robot in state CA triggers, we have that with R0 = 1 each robot in stateCA ‘infects’ one other robot with the ‘collision-avoidance disease.’ With R0 > 1each robot in state CA triggers more than one collision avoidance, its growth isexponential, and the resulting decrease of performance P (N) is nonlinear.
We use the Webots simulation environment [46] for our experiments on in-terference. The simulated robot is the Thymio II [37] operating as a swarmof size N in a 2 m× 2 m arena. We simulate a simple multi-robot navigationtask. The arena has four bases (north, south, east, west). The robots’ goal isto reach the respective opposite base (e.g., from north to south and vice versa).At the beginning of each run, we randomly distribute N = 1 to N = 55 robots
10
0
25
50
75
100
125
150
175
0 20 40 60
performance
P
system size N
Premove=1.0Premove=0.7Premove=0.4physical sim.
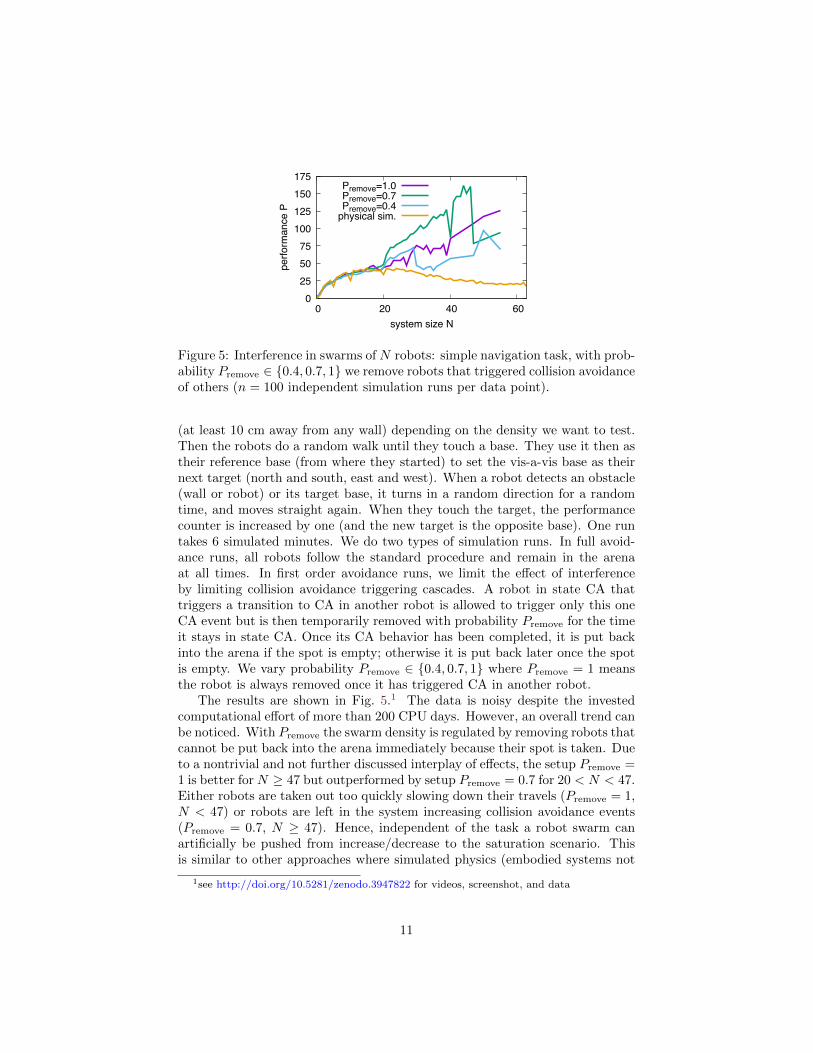
Figure 5: Interference in swarms of N robots: simple navigation task, with prob-ability Premove ∈ {0.4, 0.7, 1} we remove robots that triggered collision avoidanceof others (n = 100 independent simulation runs per data point).
(at least 10 cm away from any wall) depending on the density we want to test.Then the robots do a random walk until they touch a base. They use it then astheir reference base (from where they started) to set the vis-a-vis base as theirnext target (north and south, east and west). When a robot detects an obstacle(wall or robot) or its target base, it turns in a random direction for a randomtime, and moves straight again. When they touch the target, the performancecounter is increased by one (and the new target is the opposite base). One runtakes 6 simulated minutes. We do two types of simulation runs. In full avoid-ance runs, all robots follow the standard procedure and remain in the arenaat all times. In first order avoidance runs, we limit the effect of interferenceby limiting collision avoidance triggering cascades. A robot in state CA thattriggers a transition to CA in another robot is allowed to trigger only this oneCA event but is then temporarily removed with probability Premove for the timeit stays in state CA. Once its CA behavior has been completed, it is put backinto the arena if the spot is empty; otherwise it is put back later once the spotis empty. We vary probability Premove ∈ {0.4, 0.7, 1} where Premove = 1 meansthe robot is always removed once it has triggered CA in another robot.
The results are shown in Fig. 5.1 The data is noisy despite the investedcomputational effort of more than 200 CPU days. However, an overall trend canbe noticed. With Premove the swarm density is regulated by removing robots thatcannot be put back into the arena immediately because their spot is taken. Dueto a nontrivial and not further discussed interplay of effects, the setup Premove =1 is better for N ≥ 47 but outperformed by setup Premove = 0.7 for 20 < N < 47.Either robots are taken out too quickly slowing down their travels (Premove = 1,N < 47) or robots are left in the system increasing collision avoidance events(Premove = 0.7, N ≥ 47). Hence, independent of the task a robot swarm canartificially be pushed from increase/decrease to the saturation scenario. Thisis similar to other approaches where simulated physics (embodied systems not
1see http://doi.org/10.5281/zenodo.3947822 for videos, screenshot, and data
11
allowing to pass through other bodies) was turned on/off [39, 42]. Also behaviorsin ants mitigate overcrowded situations to avoid the increase/decrease situationin favor of a saturation scenario [21, 4, 32]. With our experiment we investigatedthe impact of interference on performance by modulating probability Premove.
4 Conclusion
We have given a practical guide to analyze swarm performance and scalability.Swarm performance plots contain rich information about underlying processes.The left part of the swarm performance plot can give hints on the level of collab-oration necessary to solve the task. The right part of the plot is a reflection ofthe ratio between marginal cost and performance. Performance scales in qual-itatively different ways depending on the task. Tasks that are not limited byphysical interference (e.g., area coverage) show no collapse of performance forincreased swarm sizes. However, usually physical interference has a negativeeffect in a variety of tasks. These qualitative differences vanish once we a applya benefit-cost analysis (BCA) that reveals the relation between the marginalperformance (added swarm performance of an added robot) and the relativemarginal cost. An important design choice is about the redundancy-inducedrobustness. Swarm robotics is commonly assumed to be robust to failures be-cause of its high degree of redundancy. In a homogeneous swarm, robots areexchangeable and serve as mutual replacements. Through BCA and marginalcost/performance analysis the designer can make a more informed choice tobalance the efficiency-robustness tradeoff. Following our practical (‘guerrilla’)performance analysis guide allows swarm scalability analysts to quickly formu-late hypotheses about the underlying system behaviors and consequently tospeedup the design and studies in swarm robotics.
References
[1] Amdahl, G.M.: Validity of the single processor approach to achieving largescale computing capabilities. In: AFIPS Conference Proceedings. pp. 483–485. ACM (1967)
[2] Bjerknes, J.D., Winfield, A., Melhuish, C.: An analysis of emergent taxisin a wireless connected swarm of mobile robots. In: Shi, Y., Dorigo, M.(eds.) IEEE Swarm Intelligence Symposium. pp. 45–52. IEEE Press, LosAlamitos, CA (2007)
[3] Dimidov, C., Oriolo, G., Trianni, V.: Random walks in swarm robotics:An experiment with kilobots. In: Swarm Intelligence (ANTS 2016), pp.185–196. Springer, Berlin, Heidelberg (2016)
[4] Dussutour, A., Fourcassie, V., Helbing, D., Deneubourg, J.L.: Optimaltraffic organization in ants under crowded conditions. Nature 428, 70–73(March 2004)
12
[5] Frederick P. Brooks, J.: The Mythical Man-Month. Addison-Wesley (1995)
[6] Goldberg, D., Mataric, M.J.: Interference as a tool for designing and eval-uating multi-robot controllers. In: Kuipers, B.J., Webber, B. (eds.) Proc.of the Fourteenth National Conference on Artificial Intelligence (AAAI’97).pp. 637–642. MIT Press, Cambridge, MA (1997)
[7] Gunther, N.J.: A simple capacity model of massively parallel transactionsystems. In: CMG National Conf. pp. 1035–1044 (1993)
[8] Gunther, N.J.: Guerrilla Capacity Planning. Springer (2007)
[9] Gunther, N.J., Puglia, P., Tomasette, K.: Hadoop super-linear scalability:The perpetual motion of parallel performance. ACM Queue 13(5), 46–55(2015)
[10] Gustafson, J.L.: Reevaluating Amdahl’s law. Commun. ACM 31(5), 532–533 (May 1988). https://doi.org/10.1145/42411.42415
[11] Hamann, H.: Towards swarm calculus: Urn models of collective decisionsand universal properties of swarm performance. Swarm Intelligence 7(2-3),145–172 (2013), http://dx.doi.org/10.1007/s11721-013-0080-0
[12] Hamann, H.: Superlinear scalability in parallel computing and multi-robot systems: Shared resources, collaboration, and network topology. In:Berekovic, M., Buchty, R., Hamann, H., Koch, D., Pionteck, T. (eds.)Architecture of Computing Systems – ARCS 2018. pp. 31–42. Springer In-ternational Publishing, Cham (2018)
[13] Hamann, H.: Swarm Robotics: A Formal Approach. Springer (2018)
[14] Hamann, H., Reina, A.: Scalability in computing and robotics. arXiv (Jun2020), https://arxiv.org/abs/2006.04969
[15] Hamann, H., Valentini, G., Khaluf, Y., Dorigo, M.: Derivation of a micro-macro link for collective decision-making systems: Uncover network fea-tures based on drift measurements. In: Bartz-Beielstein, T. (ed.) 13th In-ternational Conference on Parallel Problem Solving from Nature (PPSN2014), Lecture Notes in Computer Science, vol. 8672, pp. 181–190. Springer(2014), http://dx.doi.org/10.1007/978-3-319-10762-2 18
[16] Hayes, A.T.: How many robots? group size and efficiency in collectivesearch tasks. In: Distributed Autonomous Robotic Systems 5, pp. 289–298. Springer (2002)
[17] Hill, M.D.: What is scalability? ACM SIGARCH Computer ArchitectureNews 18(4), 18–21 (1990)
13
[18] Ijspeert, A.J., Martinoli, A., Billard, A., Gambardella, L.M.: Collabora-tion through the exploitation of local interactions in autonomous collectiverobotics: The stick pulling experiment. Autonomous Robots 11, 149–171(2001). https://doi.org/10.1023/A:1011227210047
[19] Jensen, K.H., Kim, W., Holbrook, N.M., Bush, J.W.M.: Optimal con-centrations in transport systems. Journal of The Royal Society Interface10(83), 20130138 (2013)
[20] Keeling, M.J., Rohani, P.: Modeling infectious diseases in humans andanimals. Princeton University Press (2011)
[21] Laure-Anne, P., Sebastien, M., Jacques, G., Buhl, J., Audrey, D.: Experi-mental investigation of ant traffic under crowded conditions. eLife 8 (2019)
[22] Lerman, K., Galstyan, A.: Mathematical model of foraging in a group ofrobots: Effect of interference. Autonomous Robots 13, 127–141 (2002)
[23] Levenspiel, O.: Chemical reaction engineering. Industrial & engineeringchemistry research 38(11), 4140–4143 (1999)
[24] Lighthill, M.J., Whitham, G.B.: On kinematic waves. II. A theory of trafficflow on long crowded roads. Proceedings of the Royal Society of LondonA229(1178), 317–345 (May 1955)
[25] Llenas, A.F., Talamali, M.S., Xu, X., Marshall, J.A., Reina, A.: Quality-sensitive foraging by a robot swarm through virtual pheromone trails.In: International Conference on Swarm Intelligence. pp. 135–149. Springer(2018)
[26] Mateo, D., Kuan, Y.K., Bouffanais, R.: Effect of correlations inswarms on collective response. Scientific Reports 7, 10388 (2017).https://doi.org/10.1038/s41598-017-09830-w
[27] Mayya, S., Pierpaoli, P., Egerstedt, M.: Voluntary retreat for de-centralized interference reduction in robot swarms. In: Int. Conf.on Robotics and Automation (ICRA). pp. 9667–9673 (May 2019).https://doi.org/10.1109/ICRA.2019.8794124
[28] Mondada, F., Gambardella, L.M., Floreano, D., Nolfi, S., Deneubourg,J.L., Dorigo, M.: The cooperation of swarm-bots: Physical interactions incollective robotics. IEEE Robotics & Automation Magazine 12(2), 21–28(Jun 2005)
[29] Neuman, B.C.: Scale in distributed systems. In: Readings in DistributedComputing Systems. IEEE Computer Society Press (1994)
[30] O’Grady, R., Gross, R., Christensen, A.L., Mondada, F., Bo-nani, M., Dorigo, M.: Performance benefits of self-assembly in
14
a swarm-bot. In: IEEE/RSJ International Conference on Intel-ligent Robots and Systems (IROS). pp. 2381–2387 (Oct 2007).https://doi.org/10.1109/IROS.2007.4399424
[31] Ozdemir, A., Gauci, M., Kolling, A., Hall, M.D., Groß, R.: Spatial coveragewithout computation. In: Int. Conf. on Robotics and Automation (ICRA).pp. 9674–9680. IEEE (2019)
[32] Poissonnier, L.A., Motsch, S., Gautrais, J., Buhl, J., Dussutour, A.: Ex-perimental investigation of ant traffic under crowded conditions. eLife 8,e48945 (oct 2019). https://doi.org/10.7554/eLife.48945
[33] Pratt, E.L.: Virtual teams in very small classes. Virtual Teamwork (2010)
[34] Rausch, I., Reina, A., Simoens, P., Khaluf, Y.: Coherent col-lective behaviour emerging from decentralised balancing of socialfeedback and noise. Swarm Intelligence 13(3–4), 321–345 (2019).https://doi.org/10.1007/s11721-019-00173-y
[35] Reina, A.: Robot teams stay safe with blockchains. Nature Machine Intel-ligence 2, 240–241 (2020). https://doi.org/10.1038/s42256-020-0178-1
[36] Reina, A., Miletitch, R., Dorigo, M., Trianni, V.: A quantitative micro–macro link for collective decisions: the shortest path discovery/selectionexample. Swarm Intelligence 9(2-3), 75–102 (2015)
[37] Riedo, F., Chevalier, M., Magnenat, S., Mondada, F.: Thymio II, a robotthat grows wiser with children. In: IEEE Workshop on Advanced Roboticsand its Social Impacts (ARSO 2013). pp. 187–193. IEEE (2013)
[38] Ringelmann, M.: Recherches sur les moteurs animes: Travail de l’homme.Annales de l’Institut National Agronomique, 2nd series 12, 1–40 (1913)
[39] Rosenfeld, A., Kaminka, G.A., Kraus, S.: A study of scalability propertiesin robotic teams. In: Scerri, P., Vincent, R., Mailler, R. (eds.) Coordinationof Large-Scale Multiagent Systems, pp. 27–51. Springer US, Boston, MA(2006), https://doi.org/10.1007/0-387-27972-5 2
[40] Salman, M., Ligot, A., Birattari, M.: Concurrent design of con-trol software and configuration of hardware for robot swarms undereconomic constraints. PeerJ Computer Science 5, e221 (Sep 2019).https://doi.org/10.7717/peerj-cs.221
[41] Sornette, D., Maillart, T., Ghezzi, G.: How much is the whole re-ally more than the sum of its parts? 1 � 1 = 2.5: Superlinear pro-ductivity in collective group actions. PLOS ONE 9(8), 1–15 (08 2014).https://doi.org/10.1371/journal.pone.0103023
[42] Talamali, M.S., Bose, T., Haire, M., Xu, X., Marshall, J.A., Reina, A.:Sophisticated collective foraging with minimalist agents: a swarm roboticstest. Swarm Intelligence 14(1), 25–56 (2020)
15
[43] Trianni, V., Groß, R., Labella, T.H., Sahin, E., Dorigo, M.: Evolving ag-gregation behaviors in a swarm of robots. In: Banzhaf, W., Ziegler, J.,Christaller, T., Dittrich, P., Kim, J.T. (eds.) Advances in Artificial Life(ECAL 2003), Lecture Notes in Artificial Intelligence, vol. 2801, pp. 865–874. Springer (2003)
[44] Valentini, G.: Achieving Consensus in Robot Swarms: Design and Analysisof Strategies for the best-of-n Problem. Springer (2017), https://doi.org/10.1007/978-3-319-53609-5
[45] Wahby, M., Petzold, J., Eschke, C., Schmickl, T., Hamann, H.: Collectivechange detection: Adaptivity to dynamic swarm densities and light condi-tions in robot swarms. Artificial Life Conference Proceedings (31), 642–649(2019). https://doi.org/10.1162/isal a 00233
[46] Webots: version r2020a by Cyberbotics Ltd. (2020), https://cyberbotics.com
[47] Zahadat, P., Hofstadler, D.N.: Toward a theory of collective resource distri-bution: a study of a dynamic morphogenesis controller. Swarm Intelligence13(3-4), 347–380 (2019)
16


