Embed Size (px)
Citation preview
©
Your success is our success
Emkay
Emkay Research is also available on www.emkayglobal.com, Bloomberg EMKAY<GO>, Reuters and DOWJONES. DBS Bank Ltd, DBS Vickers Securities (Singapore) Pte Ltd,its respective connected and associated corporations and affiliates are the distributors of the research reports, please refer to the last page of the report on Restrictions on Distribution. In Singapore, this research report or research analyses may only be distributed to Institutional Investors,Expert Investors or Accredited Investors as defined in the Securities and Futures Act, Chapter 289 of Singapore ED: ANISH MATHEW SA: DHANANJAY SINHA
India Equity Research | Oil & Gas
December 3, 2018
Initiating Coverage
Gulf Oil Lubricants India Refer to important disclosures at the end of this report
A Well-Oiled Growth Machine at a Compelling Valuation
CMP Target Price
Rs 738 Rs 1,150 as of (December 3, 2018) 12 months
Rating Upside
BUY 55.8 %
Change in Estimates
EPS Chg FY19E/FY20E (%) -/-
Target Price change (%) NA
Target Period (Months) 12
Previous Reco NA
Emkay vs Consensus
EPS Estimates
FY19E FY20E
Emkay 36.0 44.0
Consensus - -
Mean Consensus TP (12M) Rs 957
Stock Details
Bloomberg Code GOLI IN
Face Value (Rs) 2
Shares outstanding (mn) 50
52 Week H/L 1,100 / 618
M Cap (Rs bn/USD bn) 37 / 0.53
Daily Avg Volume (nos.) 34,656
Daily Avg Turnover (US$ mn) 0.4
Shareholding Pattern Sep '18
Promoters 72.7%
FIIs 8.0%
DIIs 5.9%
Public and Others 13.4%
Price Performance
(%) 1M 3M 6M 12M
Absolute 4 (10) (16) (28)
Rel. to Nifty (1) (3) (17) (32)
We initiate coverage on Gulf Oil Lubricants India (GOLI), with a Buy rating and a target
price of Rs1,150 (over 50% upside). We value GOLI at 22x FY21E EPS on the back of
18% EPS CAGR and 30%+ ROE during FY18-21.
GOLI recorded a robust 3-year volume CAGR of 12% despite major economy-wide
disruptions such as the demonetization and GST. In 1HFY19, core growth accelerated
further to 27% yoy, with all segments growing in double digits.
While 1HFY19 margins were impacted by rise in base oil prices, a weak rupee and higher
share of B2B-insti-OEM volumes, recent softening of base oil, steady rupee, proactive
pricing and overall premiumization, should aid margin recovery going forward.
Relative price chart
Source: Bloomberg This report is solely produced by Emkay Global. The following person(s) are responsible for the production of the recommendation:
Sabri Hazarika
+91-022-66121282
Ankur Chauhan
+91-022-66242491
-40
-30
-20
-10
0
10
700
780
860
940
1020
1100
Dec-17 Jan-18 Apr-18 May-18 Jul-18 Sep-18 Nov-18
%Rs
Gulf Oil Lubricant (LHS) Rel to Nifty (RHS)
Strong volume growth trajectory leading to market share gains: In the past three
years, GOLI’s volume CAGR stood at a strong 12%, in line with its target to do 2-3x industry
growth. This was despite major economy-wide disruptions such as the demonetization and
GST implementation. In 1HFY19, core volume growth accelerated to 27% yoy with all
segments, namely motorcycle (MCO), passenger car (PCMO), CV/diesel (CVO/DEO) and
industrial oils reporting double-digit growth, driven by a low base, OEM tie ups and
distribution expansion. In the Bazaar segment, GOLI’s market share is estimated to have
grown from under 7%, 2-3 years ago to almost 8% currently (~0.5% increase annually).
We expect the lube market to grow at 4-5% and see GOLI’s volume growth at
25%/15%/13% yoy for FY19/20/21, with FY20/21 run-rate likely having upside risks.
Margins likely to recover with proactive pricing, premiumization and softer base oil
prices: GOLI’s EBITDA/liter (margin) has grown at a 9% CAGR in the past five years until
FY18. FY17 was the only year in this period when margins were impacted due to de-
monetization playing the spoil sport. In FY18, there was 8%/13%/17% increase in net
realization/gross margin/EBITDA margin. FY19 is weaker on the margin front, with
EBITDA/liter in 1H down 7% yoy due to high oil/base oil prices, a weak rupee, and
increased share of low-margin B2B-insti-OEM sales that were driving volume growth. We,
however, expect margins to recover going forward due to softening of base oil prices, a
steady rupee, and the effect of price hikes (last taken in July). Against a 2% decline in
EBITDA/liter expected in FY19, we estimate a 3% growth each in FY20/21.
Initiating coverage with a Buy rating and a TP of Rs1,150: We estimate an EPS CAGR
of 18% during FY18-21 building in 18% volume and 2% EBITDA/liter CAGR assumptions.
We value GOLI at a conservative 22x FY21E EPS of Rs52 to arrive at our target price of
Rs1,150, providing over 50% upside. GOLI’s return ratios are likely to remain steady at
over 30%. We initiate coverage on the stock with a Buy rating. The key risks are acute
competitive pressure and adverse base oil price and currency movements.
Financial Snapshot
(Rs mn) FY17 FY18 FY19E FY20E FY21E
Revenue 10,868 13,323 16,942 19,933 23,058
EBITDA 1,778 2,357 2,880 3,427 4,008
EBITDA Margin (%) 16.4 17.7 17.0 17.2 17.4
APAT 1,176 1,586 1,790 2,188 2,597
EPS (Rs) 23.7 31.9 36.0 44.0 52.3
EPS (% chg) 17.0 34.7 12.9 22.2 18.7
ROE (%) 39.0 38.6 34.6 35.0 34.6
P/E (x) 31.4 23.3 20.6 16.9 14.2
EV/EBITDA (x) 20.0 15.3 12.2 10.0 8.2
P/BV (x) 10.4 7.9 6.5 5.4 4.5
Source: Company, Emkay Research
Gulf Oil Lubricants India (GOLI IN) India Equity Research | Initiating Coverage
Emkay Research is also available on www.emkayglobal.com, Bloomberg EMKAY<GO>, Reuters and DOWJONES. DBS Bank Ltd, DBS Vickers Securities (Singapore) Pte Ltd,its respective connected and associated corporations and affiliates are the distributors of the research reports, please refer to the last page of the report on Restrictions on Distribution. In Singapore, this research report or research analyses may only be distributed to Institutional Investors,Expert Investors or Accredited Investors as defined in the Securities and Futures Act, Chapter 289 of Singapore
ED: ANISH MATHEW SA: DHANANJAY SINHA December 3, 2018 | 2
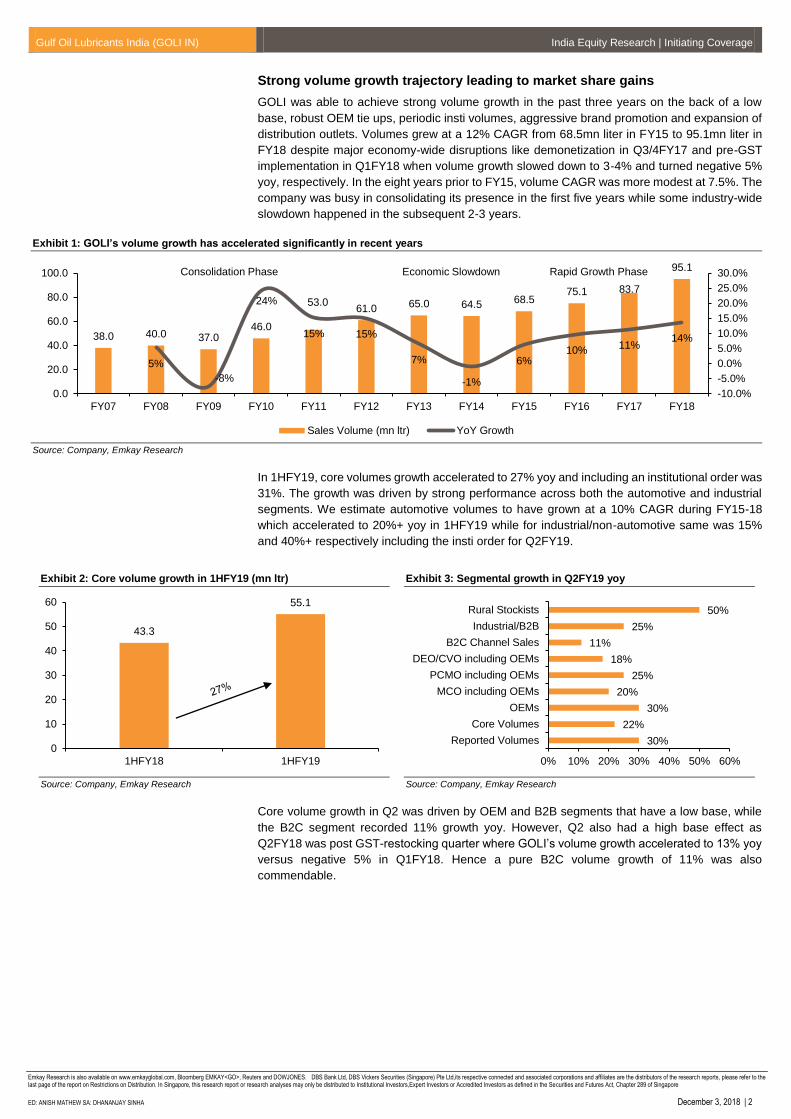
Strong volume growth trajectory leading to market share gains
GOLI was able to achieve strong volume growth in the past three years on the back of a low
base, robust OEM tie ups, periodic insti volumes, aggressive brand promotion and expansion of
distribution outlets. Volumes grew at a 12% CAGR from 68.5mn liter in FY15 to 95.1mn liter in
FY18 despite major economy-wide disruptions like demonetization in Q3/4FY17 and pre-GST
implementation in Q1FY18 when volume growth slowed down to 3-4% and turned negative 5%
yoy, respectively. In the eight years prior to FY15, volume CAGR was more modest at 7.5%. The
company was busy in consolidating its presence in the first five years while some industry-wide
slowdown happened in the subsequent 2-3 years.
Exhibit 1: GOLI’s volume growth has accelerated significantly in recent years
Source: Company, Emkay Research
In 1HFY19, core volumes growth accelerated to 27% yoy and including an institutional order was
31%. The growth was driven by strong performance across both the automotive and industrial
segments. We estimate automotive volumes to have grown at a 10% CAGR during FY15-18
which accelerated to 20%+ yoy in 1HFY19 while for industrial/non-automotive same was 15%
and 40%+ respectively including the insti order for Q2FY19.
Exhibit 2: Core volume growth in 1HFY19 (mn ltr)
Source: Company, Emkay Research
Exhibit 3: Segmental growth in Q2FY19 yoy
Source: Company, Emkay Research
Core volume growth in Q2 was driven by OEM and B2B segments that have a low base, while
the B2C segment recorded 11% growth yoy. However, Q2 also had a high base effect as
Q2FY18 was post GST-restocking quarter where GOLI’s volume growth accelerated to 13% yoy
versus negative 5% in Q1FY18. Hence a pure B2C volume growth of 11% was also
commendable.
38.0 40.0 37.046.0
53.061.0 65.0 64.5 68.5
75.1 83.7
95.1
5%
-8%
24%
15% 15%
7%
-1%
6%10%
11%14%
-10.0%
-5.0%
0.0%
5.0%
10.0%
15.0%
20.0%
25.0%
30.0%
0.0
20.0
40.0
60.0
80.0
100.0
FY07 FY08 FY09 FY10 FY11 FY12 FY13 FY14 FY15 FY16 FY17 FY18
Sales Volume (mn ltr) YoY Growth
Consolidation Phase Economic Slowdown Rapid Growth Phase
43.3
55.1
0
10
20
30
40
50
60
1HFY18 1HFY19
30%
22%
30%
20%
25%
18%
11%
25%
50%
0% 10% 20% 30% 40% 50% 60%
Reported Volumes
Core Volumes
OEMs
MCO including OEMs
PCMO including OEMs
DEO/CVO including OEMs
B2C Channel Sales
Industrial/B2B
Rural Stockists
Gulf Oil Lubricants India (GOLI IN) India Equity Research | Initiating Coverage
Emkay Research is also available on www.emkayglobal.com, Bloomberg EMKAY<GO>, Reuters and DOWJONES. DBS Bank Ltd, DBS Vickers Securities (Singapore) Pte Ltd,its respective connected and associated corporations and affiliates are the distributors of the research reports, please refer to the last page of the report on Restrictions on Distribution. In Singapore, this research report or research analyses may only be distributed to Institutional Investors,Expert Investors or Accredited Investors as defined in the Securities and Futures Act, Chapter 289 of Singapore
ED: ANISH MATHEW SA: DHANANJAY SINHA December 3, 2018 | 3
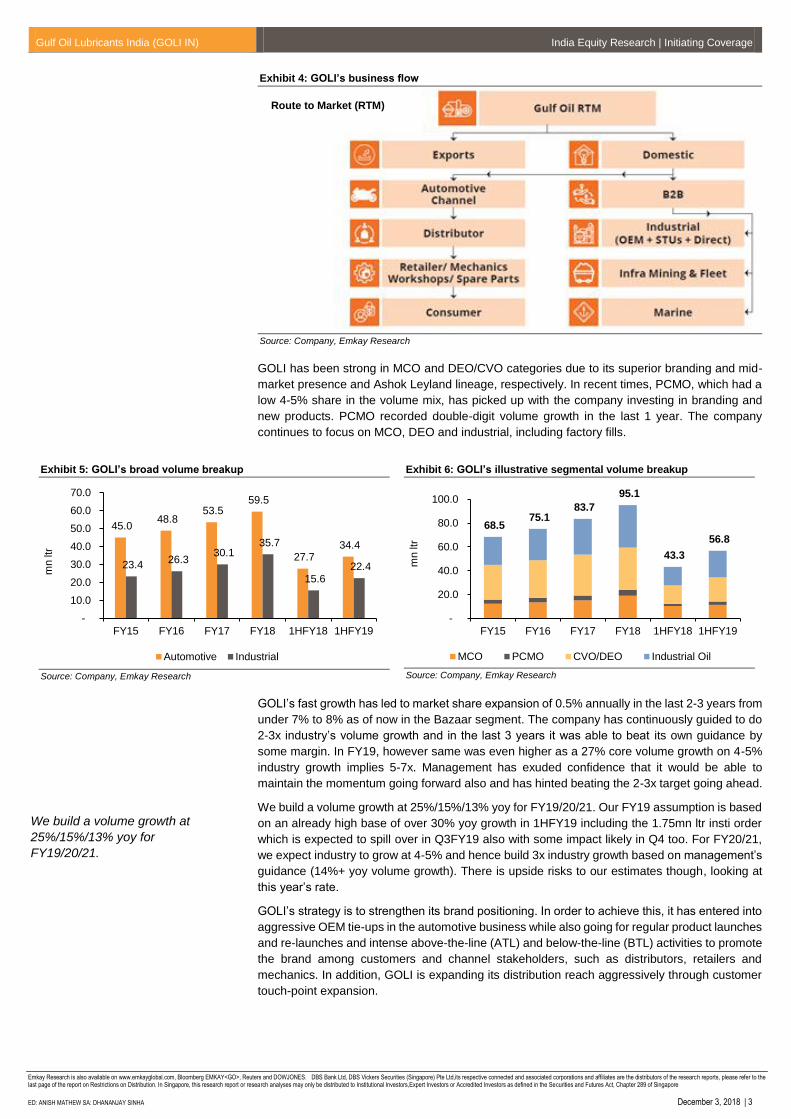
Exhibit 4: GOLI’s business flow
Source: Company, Emkay Research
GOLI has been strong in MCO and DEO/CVO categories due to its superior branding and mid-
market presence and Ashok Leyland lineage, respectively. In recent times, PCMO, which had a
low 4-5% share in the volume mix, has picked up with the company investing in branding and
new products. PCMO recorded double-digit volume growth in the last 1 year. The company
continues to focus on MCO, DEO and industrial, including factory fills.
Exhibit 5: GOLI’s broad volume breakup
Source: Company, Emkay Research
Exhibit 6: GOLI’s illustrative segmental volume breakup
Source: Company, Emkay Research
GOLI’s fast growth has led to market share expansion of 0.5% annually in the last 2-3 years from
under 7% to 8% as of now in the Bazaar segment. The company has continuously guided to do
2-3x industry’s volume growth and in the last 3 years it was able to beat its own guidance by
some margin. In FY19, however same was even higher as a 27% core volume growth on 4-5%
industry growth implies 5-7x. Management has exuded confidence that it would be able to
maintain the momentum going forward also and has hinted beating the 2-3x target going ahead.
We build a volume growth at 25%/15%/13% yoy for FY19/20/21. Our FY19 assumption is based
on an already high base of over 30% yoy growth in 1HFY19 including the 1.75mn ltr insti order
which is expected to spill over in Q3FY19 also with some impact likely in Q4 too. For FY20/21,
we expect industry to grow at 4-5% and hence build 3x industry growth based on management’s
guidance (14%+ yoy volume growth). There is upside risks to our estimates though, looking at
this year’s rate.
GOLI’s strategy is to strengthen its brand positioning. In order to achieve this, it has entered into
aggressive OEM tie-ups in the automotive business while also going for regular product launches
and re-launches and intense above-the-line (ATL) and below-the-line (BTL) activities to promote
the brand among customers and channel stakeholders, such as distributors, retailers and
mechanics. In addition, GOLI is expanding its distribution reach aggressively through customer
touch-point expansion.
45.0 48.8
53.5 59.5
27.7 34.4
23.4 26.3
30.1 35.7
15.6 22.4
-
10.0
20.0
30.0
40.0
50.0
60.0
70.0
FY15 FY16 FY17 FY18 1HFY18 1HFY19
mn ltr
Automotive Industrial
68.5 75.1
83.7
95.1
43.3
56.8
-
20.0
40.0
60.0
80.0
100.0
FY15 FY16 FY17 FY18 1HFY18 1HFY19
mn ltr
MCO PCMO CVO/DEO Industrial Oil
We build a volume growth at
25%/15%/13% yoy for
FY19/20/21.
Route to Market (RTM)
Gulf Oil Lubricants India (GOLI IN) India Equity Research | Initiating Coverage
Emkay Research is also available on www.emkayglobal.com, Bloomberg EMKAY<GO>, Reuters and DOWJONES. DBS Bank Ltd, DBS Vickers Securities (Singapore) Pte Ltd,its respective connected and associated corporations and affiliates are the distributors of the research reports, please refer to the last page of the report on Restrictions on Distribution. In Singapore, this research report or research analyses may only be distributed to Institutional Investors,Expert Investors or Accredited Investors as defined in the Securities and Futures Act, Chapter 289 of Singapore
ED: ANISH MATHEW SA: DHANANJAY SINHA December 3, 2018 | 4
Exhibit 7: GOLI’s major OEM tie ups (Tata Motors PCMO CBO was signed recently)
Source: Company, Emkay Research
Currently, the company has 12 key OEM tie-ups in its portfolio and plans to increase it further.
Major tie-ups include Ashok Leyland, Mahindra, Swaraj, Bajaj Auto, Bharat Benz, Force Motors,
and Tata Motors. The Tata Motors agreement was signed recently to launch co-branded oils
(CBO) in the passenger car division starting January 2019 and the company expects a 10-15%
volume contribution in the PCMO segment.
Exhibit 8: GOLI’s OEM tie-ups over the years
Year OEMs
FY11 CBO launched with Mahindra; supply agreement with Essar
FY12 Agreement with L&T Komatsu for CBO, AL; tie-up with AL Nissan/Deere
FY14 CBO launched with Mahindra and Toshiba
FY15 Agreement with Schwing Stetter; M&M co-developed XHD tractor oil launched
FY16 Technical partnership with Milwaukee BMW team
FY17 Bajaj Auto (GOs)
FY18 Kobelco; Bajaj Auto (certain overseas markets)
1HFY19 Tata Motors
Source: Company, Emkay Research
The company is working toward entering into more such tie-ups. OEM tie-ups have benefited the
company in the form of strong volume growth both in factory fills and franchise workshops. In
Q2FY19, OEM volumes grew close to 30% yoy. While margins are lower in OEMs, as mentioned
earlier, such tie-ups strengthen the brand’s position.
GOLI’s innovation pipeline is robust with planned launches and re-launches, including new get
up and packeting on a continuous basis. GOLI was pioneer in long-drain oils (36,000kms vs
market’s 18,000kms DEO and 10,000kms vs 5,000kms MCO in FY07; 80,000kms DEO in FY11)
which helped it consolidate its position in the DEO market. In FY19, it re-launched (new pack) its
MCO brand Gulf Pride 4T Plus while also introducing a new grease brand, Gulf Crown.
Exhibit 9: GOLI’s product launches
Year Products
FY11 CBO diesel oil; Gulf Superfleet Long Drain oil launched
FY13 Superfleet Turbo range launched
FY14 Formula GX (syth), CBO diesel & hydraulic oils launched
FY15 Pride Scooter launched, Crown LX DuraMax 80,000km grease
FY16 Ultrasynth X with detoxifiers, Powertrac (synthetic) launched
FY17 MTF-T NxG CBO transmission fluid for 1Lkm Drain, PowerTrac 4T, SuperDuty XLE DEO, Superfleet Trawler
1HFY19 Re-launched Gulf Pride 4T Plus; Gulf Crown (Greases)
Source: Company, Emkay Research
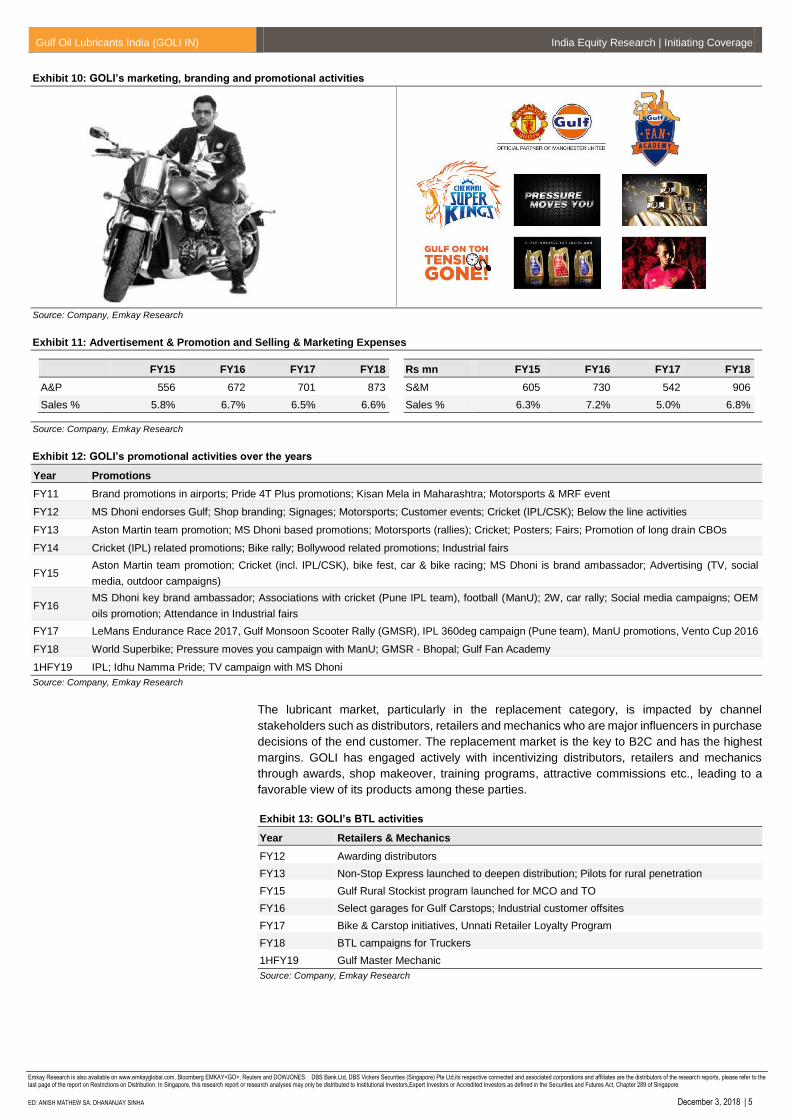
GOLI’s above-the-line (ATL) activities include advertising and promotion with a budget of 6-7%
of sales annually. It has tie-ups with Manchester United (for PCMO) and Chennai Super Kings.
GOLI has former Indian Cricket Team Captain MS Dhoni as its brand ambassador along with
cricketer Hardik Pandya. The major advertising and promotion activities include sports, rallies,
fairs, and TV campaigns.
The company has 12 key OEM
tie-ups in its portfolio and plans to
increase it further.
GOLI’s innovation pipeline is
robust with planned launches and
re-launches, including new get up
and packeting on a continuous
basis.
Gulf Oil Lubricants India (GOLI IN) India Equity Research | Initiating Coverage
Emkay Research is also available on www.emkayglobal.com, Bloomberg EMKAY<GO>, Reuters and DOWJONES. DBS Bank Ltd, DBS Vickers Securities (Singapore) Pte Ltd,its respective connected and associated corporations and affiliates are the distributors of the research reports, please refer to the last page of the report on Restrictions on Distribution. In Singapore, this research report or research analyses may only be distributed to Institutional Investors,Expert Investors or Accredited Investors as defined in the Securities and Futures Act, Chapter 289 of Singapore
ED: ANISH MATHEW SA: DHANANJAY SINHA December 3, 2018 | 5
Exhibit 10: GOLI’s marketing, branding and promotional activities
Source: Company, Emkay Research
Exhibit 11: Advertisement & Promotion and Selling & Marketing Expenses
Rs mn FY15 FY16 FY17 FY18
A&P 556 672 701 873
Sales % 5.8% 6.7% 6.5% 6.6%
Rs mn FY15 FY16 FY17 FY18
S&M 605 730 542 906
Sales % 6.3% 7.2% 5.0% 6.8%
Source: Company, Emkay Research
Exhibit 12: GOLI’s promotional activities over the years
Year Promotions
FY11 Brand promotions in airports; Pride 4T Plus promotions; Kisan Mela in Maharashtra; Motorsports & MRF event
FY12 MS Dhoni endorses Gulf; Shop branding; Signages; Motorsports; Customer events; Cricket (IPL/CSK); Below the line activities
FY13 Aston Martin team promotion; MS Dhoni based promotions; Motorsports (rallies); Cricket; Posters; Fairs; Promotion of long drain CBOs
FY14 Cricket (IPL) related promotions; Bike rally; Bollywood related promotions; Industrial fairs
FY15 Aston Martin team promotion; Cricket (incl. IPL/CSK), bike fest, car & bike racing; MS Dhoni is brand ambassador; Advertising (TV, social
media, outdoor campaigns)
FY16 MS Dhoni key brand ambassador; Associations with cricket (Pune IPL team), football (ManU); 2W, car rally; Social media campaigns; OEM
oils promotion; Attendance in Industrial fairs
FY17 LeMans Endurance Race 2017, Gulf Monsoon Scooter Rally (GMSR), IPL 360deg campaign (Pune team), ManU promotions, Vento Cup 2016
FY18 World Superbike; Pressure moves you campaign with ManU; GMSR - Bhopal; Gulf Fan Academy
1HFY19 IPL; Idhu Namma Pride; TV campaign with MS Dhoni
Source: Company, Emkay Research
The lubricant market, particularly in the replacement category, is impacted by channel
stakeholders such as distributors, retailers and mechanics who are major influencers in purchase
decisions of the end customer. The replacement market is the key to B2C and has the highest
margins. GOLI has engaged actively with incentivizing distributors, retailers and mechanics
through awards, shop makeover, training programs, attractive commissions etc., leading to a
favorable view of its products among these parties.
Exhibit 13: GOLI’s BTL activities
Year Retailers & Mechanics
FY12 Awarding distributors
FY13 Non-Stop Express launched to deepen distribution; Pilots for rural penetration
FY15 Gulf Rural Stockist program launched for MCO and TO
FY16 Select garages for Gulf Carstops; Industrial customer offsites
FY17 Bike & Carstop initiatives, Unnati Retailer Loyalty Program
FY18 BTL campaigns for Truckers
1HFY19 Gulf Master Mechanic
Source: Company, Emkay Research
Gulf Oil Lubricants India (GOLI IN) India Equity Research | Initiating Coverage
Emkay Research is also available on www.emkayglobal.com, Bloomberg EMKAY<GO>, Reuters and DOWJONES. DBS Bank Ltd, DBS Vickers Securities (Singapore) Pte Ltd,its respective connected and associated corporations and affiliates are the distributors of the research reports, please refer to the last page of the report on Restrictions on Distribution. In Singapore, this research report or research analyses may only be distributed to Institutional Investors,Expert Investors or Accredited Investors as defined in the Securities and Futures Act, Chapter 289 of Singapore
ED: ANISH MATHEW SA: DHANANJAY SINHA December 3, 2018 | 6
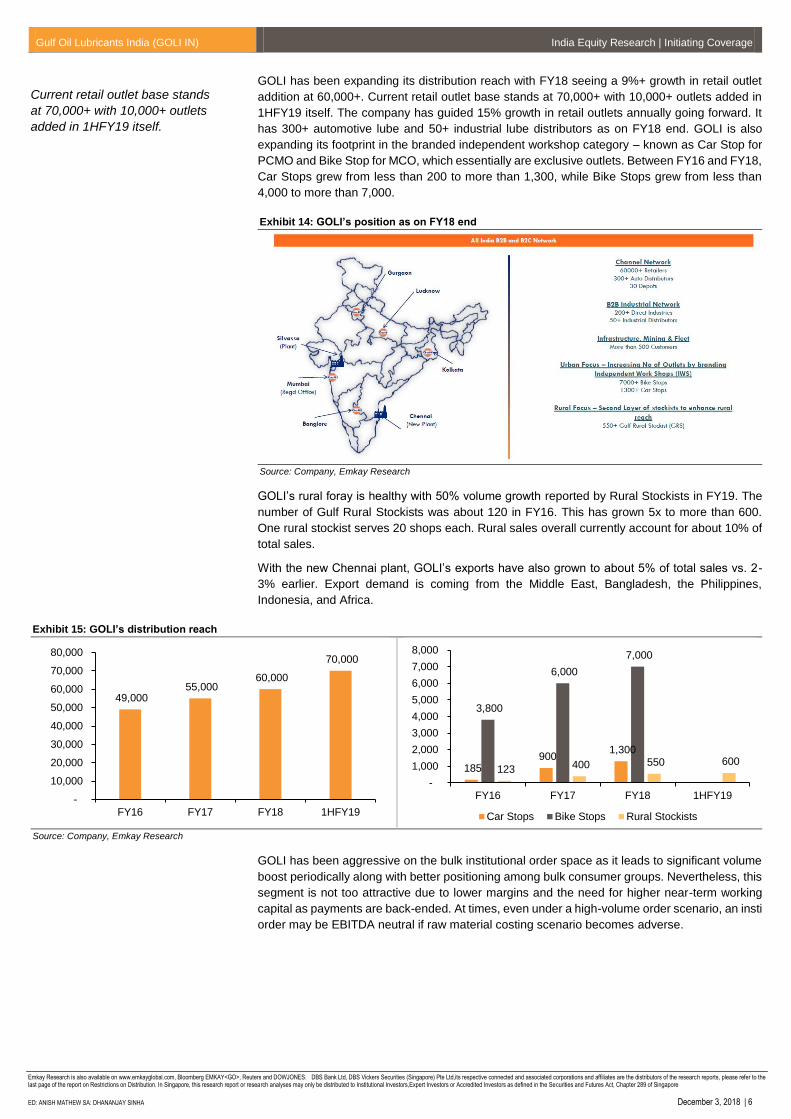
GOLI has been expanding its distribution reach with FY18 seeing a 9%+ growth in retail outlet
addition at 60,000+. Current retail outlet base stands at 70,000+ with 10,000+ outlets added in
1HFY19 itself. The company has guided 15% growth in retail outlets annually going forward. It
has 300+ automotive lube and 50+ industrial lube distributors as on FY18 end. GOLI is also
expanding its footprint in the branded independent workshop category – known as Car Stop for
PCMO and Bike Stop for MCO, which essentially are exclusive outlets. Between FY16 and FY18,
Car Stops grew from less than 200 to more than 1,300, while Bike Stops grew from less than
4,000 to more than 7,000.
Exhibit 14: GOLI’s position as on FY18 end
Source: Company, Emkay Research
GOLI’s rural foray is healthy with 50% volume growth reported by Rural Stockists in FY19. The
number of Gulf Rural Stockists was about 120 in FY16. This has grown 5x to more than 600.
One rural stockist serves 20 shops each. Rural sales overall currently account for about 10% of
total sales.
With the new Chennai plant, GOLI’s exports have also grown to about 5% of total sales vs. 2-
3% earlier. Export demand is coming from the Middle East, Bangladesh, the Philippines,
Indonesia, and Africa.
Exhibit 15: GOLI’s distribution reach
Source: Company, Emkay Research
GOLI has been aggressive on the bulk institutional order space as it leads to significant volume
boost periodically along with better positioning among bulk consumer groups. Nevertheless, this
segment is not too attractive due to lower margins and the need for higher near-term working
capital as payments are back-ended. At times, even under a high-volume order scenario, an insti
order may be EBITDA neutral if raw material costing scenario becomes adverse.
49,000 55,000
60,000
70,000
-
10,000
20,000
30,000
40,000
50,000
60,000
70,000
80,000
FY16 FY17 FY18 1HFY19
185 900
1,300
3,800
6,000
7,000
123 400 550 600
-
1,000
2,000
3,000
4,000
5,000
6,000
7,000
8,000
FY16 FY17 FY18 1HFY19
Car Stops Bike Stops Rural Stockists
Current retail outlet base stands
at 70,000+ with 10,000+ outlets
added in 1HFY19 itself.
Gulf Oil Lubricants India (GOLI IN) India Equity Research | Initiating Coverage
Emkay Research is also available on www.emkayglobal.com, Bloomberg EMKAY<GO>, Reuters and DOWJONES. DBS Bank Ltd, DBS Vickers Securities (Singapore) Pte Ltd,its respective connected and associated corporations and affiliates are the distributors of the research reports, please refer to the last page of the report on Restrictions on Distribution. In Singapore, this research report or research analyses may only be distributed to Institutional Investors,Expert Investors or Accredited Investors as defined in the Securities and Futures Act, Chapter 289 of Singapore
ED: ANISH MATHEW SA: DHANANJAY SINHA December 3, 2018 | 7
Margins likely to recover with proactive pricing, premiumization and softer base
oil prices
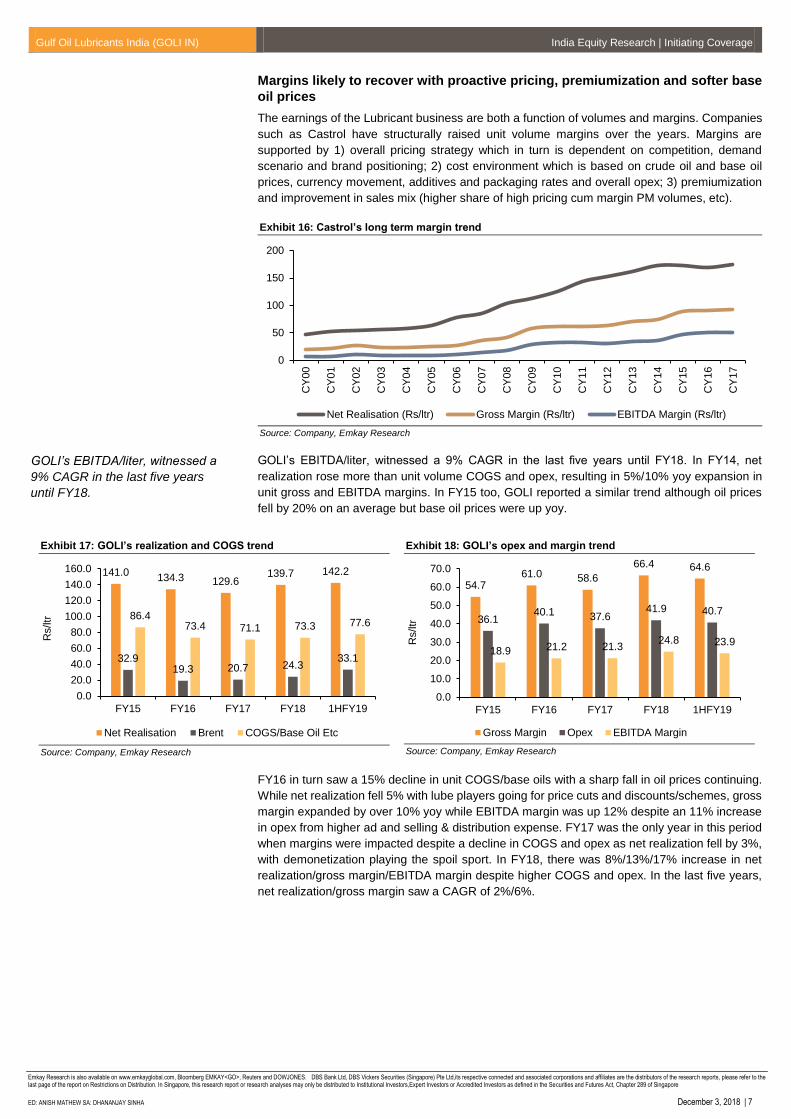
The earnings of the Lubricant business are both a function of volumes and margins. Companies
such as Castrol have structurally raised unit volume margins over the years. Margins are
supported by 1) overall pricing strategy which in turn is dependent on competition, demand
scenario and brand positioning; 2) cost environment which is based on crude oil and base oil
prices, currency movement, additives and packaging rates and overall opex; 3) premiumization
and improvement in sales mix (higher share of high pricing cum margin PM volumes, etc).
Exhibit 16: Castrol’s long term margin trend
Source: Company, Emkay Research
GOLI’s EBITDA/liter, witnessed a 9% CAGR in the last five years until FY18. In FY14, net
realization rose more than unit volume COGS and opex, resulting in 5%/10% yoy expansion in
unit gross and EBITDA margins. In FY15 too, GOLI reported a similar trend although oil prices
fell by 20% on an average but base oil prices were up yoy.
Exhibit 17: GOLI’s realization and COGS trend
Source: Company, Emkay Research
Exhibit 18: GOLI’s opex and margin trend
Source: Company, Emkay Research
FY16 in turn saw a 15% decline in unit COGS/base oils with a sharp fall in oil prices continuing.
While net realization fell 5% with lube players going for price cuts and discounts/schemes, gross
margin expanded by over 10% yoy while EBITDA margin was up 12% despite an 11% increase
in opex from higher ad and selling & distribution expense. FY17 was the only year in this period
when margins were impacted despite a decline in COGS and opex as net realization fell by 3%,
with demonetization playing the spoil sport. In FY18, there was 8%/13%/17% increase in net
realization/gross margin/EBITDA margin despite higher COGS and opex. In the last five years,
net realization/gross margin saw a CAGR of 2%/6%.
0
50
100
150
200
CY
00
CY
01
CY
02
CY
03
CY
04
CY
05
CY
06
CY
07
CY
08
CY
09
CY
10
CY
11
CY
12
CY
13
CY
14
CY
15
CY
16
CY
17
Net Realisation (Rs/ltr) Gross Margin (Rs/ltr) EBITDA Margin (Rs/ltr)
141.0134.3 129.6
139.7 142.2
32.919.3 20.7 24.3
33.1
86.473.4 71.1 73.3 77.6
0.0
20.0
40.0
60.0
80.0
100.0
120.0
140.0
160.0
FY15 FY16 FY17 FY18 1HFY19
Rs/ltr
Net Realisation Brent COGS/Base Oil Etc
54.761.0 58.6
66.4 64.6
36.140.1 37.6
41.9 40.7
18.9 21.2 21.324.8 23.9
0.0
10.0
20.0
30.0
40.0
50.0
60.0
70.0
FY15 FY16 FY17 FY18 1HFY19
Rs/ltr
Gross Margin Opex EBITDA Margin
GOLI’s EBITDA/liter, witnessed a
9% CAGR in the last five years
until FY18.
Gulf Oil Lubricants India (GOLI IN) India Equity Research | Initiating Coverage
Emkay Research is also available on www.emkayglobal.com, Bloomberg EMKAY<GO>, Reuters and DOWJONES. DBS Bank Ltd, DBS Vickers Securities (Singapore) Pte Ltd,its respective connected and associated corporations and affiliates are the distributors of the research reports, please refer to the last page of the report on Restrictions on Distribution. In Singapore, this research report or research analyses may only be distributed to Institutional Investors,Expert Investors or Accredited Investors as defined in the Securities and Futures Act, Chapter 289 of Singapore
ED: ANISH MATHEW SA: DHANANJAY SINHA December 3, 2018 | 8
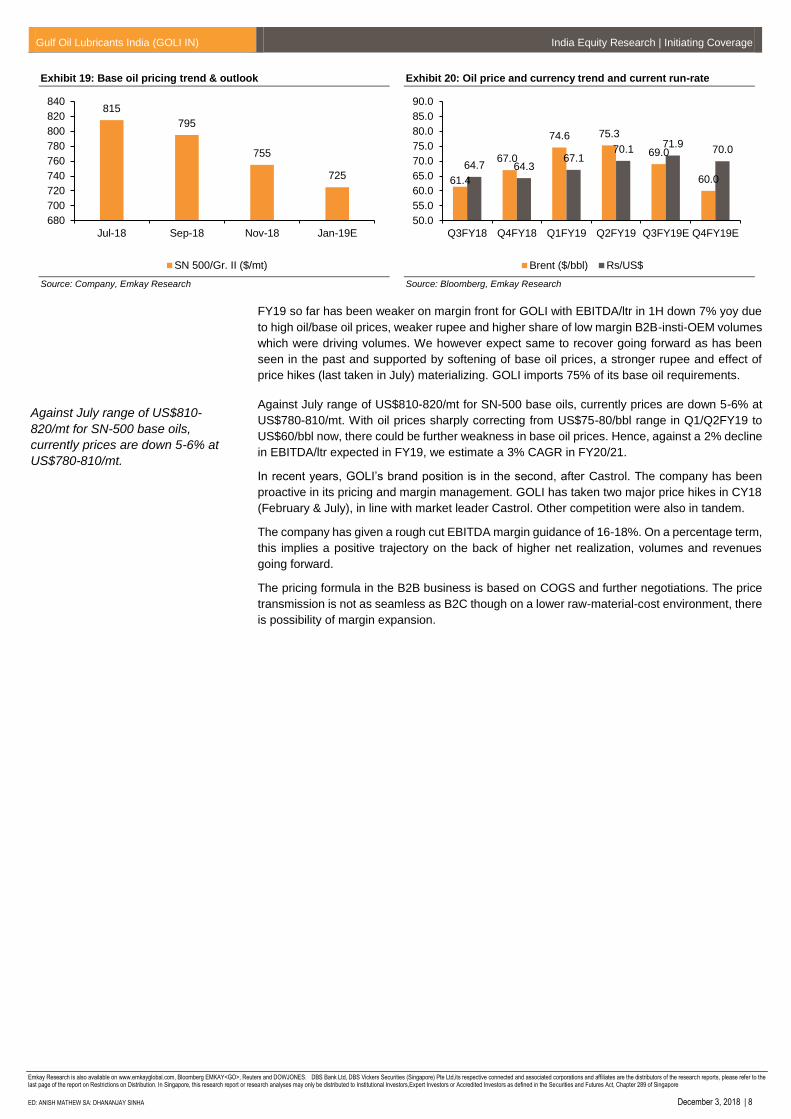
Exhibit 19: Base oil pricing trend & outlook
Source: Company, Emkay Research
Exhibit 20: Oil price and currency trend and current run-rate
Source: Bloomberg, Emkay Research
FY19 so far has been weaker on margin front for GOLI with EBITDA/ltr in 1H down 7% yoy due
to high oil/base oil prices, weaker rupee and higher share of low margin B2B-insti-OEM volumes
which were driving volumes. We however expect same to recover going forward as has been
seen in the past and supported by softening of base oil prices, a stronger rupee and effect of
price hikes (last taken in July) materializing. GOLI imports 75% of its base oil requirements.
Against July range of US$810-820/mt for SN-500 base oils, currently prices are down 5-6% at
US$780-810/mt. With oil prices sharply correcting from US$75-80/bbl range in Q1/Q2FY19 to
US$60/bbl now, there could be further weakness in base oil prices. Hence, against a 2% decline
in EBITDA/ltr expected in FY19, we estimate a 3% CAGR in FY20/21.
In recent years, GOLI’s brand position is in the second, after Castrol. The company has been
proactive in its pricing and margin management. GOLI has taken two major price hikes in CY18
(February & July), in line with market leader Castrol. Other competition were also in tandem.
The company has given a rough cut EBITDA margin guidance of 16-18%. On a percentage term,
this implies a positive trajectory on the back of higher net realization, volumes and revenues
going forward.
The pricing formula in the B2B business is based on COGS and further negotiations. The price
transmission is not as seamless as B2C though on a lower raw-material-cost environment, there
is possibility of margin expansion.
815
795
755
725
680
700
720
740
760
780
800
820
840
Jul-18 Sep-18 Nov-18 Jan-19E
SN 500/Gr. II ($/mt)
61.4
67.0
74.6 75.3
69.0
60.0
64.7 64.367.1
70.171.9
70.0
50.0
55.0
60.0
65.0
70.0
75.0
80.0
85.0
90.0
Q3FY18 Q4FY18 Q1FY19 Q2FY19 Q3FY19E Q4FY19E
Brent ($/bbl) Rs/US$
Against July range of US$810-
820/mt for SN-500 base oils,
currently prices are down 5-6% at
US$780-810/mt.
Gulf Oil Lubricants India (GOLI IN) India Equity Research | Initiating Coverage
Emkay Research is also available on www.emkayglobal.com, Bloomberg EMKAY<GO>, Reuters and DOWJONES. DBS Bank Ltd, DBS Vickers Securities (Singapore) Pte Ltd,its respective connected and associated corporations and affiliates are the distributors of the research reports, please refer to the last page of the report on Restrictions on Distribution. In Singapore, this research report or research analyses may only be distributed to Institutional Investors,Expert Investors or Accredited Investors as defined in the Securities and Futures Act, Chapter 289 of Singapore
ED: ANISH MATHEW SA: DHANANJAY SINHA December 3, 2018 | 9
Expect better sector outlook with premiumization opportunities; EVs a long-term
phenomenon
GOLI is investing on personal mobility (PM), which include MCO and PCMO, through brand
promotion and also improve its positioning through OEM tie-ups. PCMO, which is a lucrative
segment, was a challenge for GOLI earlier. Until 2-3 years ago, GOLI’s mix was 60% B2C (higher
margin) and 40% B2B (lower margin) of which under B2C, MCO was 17%, PCMO 4% and
CVO/DEO 39%. PCMO hence was a weaker area with a low base. However, over the last 2-3
years, GOLI invested in PCMO brand promotion by significant initiatives such as the tie-up with
Manchester United and OEM tie-ups. Since the last one year, PCMO has been seeing double-
digit volume growth. MCO has always been a stronger area. The continued strong focus on MCO
through product re-launches, BTL activities, and capitalizing on cricketer MS Dhoni as the brand
ambassador have kept growth in this segment intact. Lately, CVO/DEO have also grown
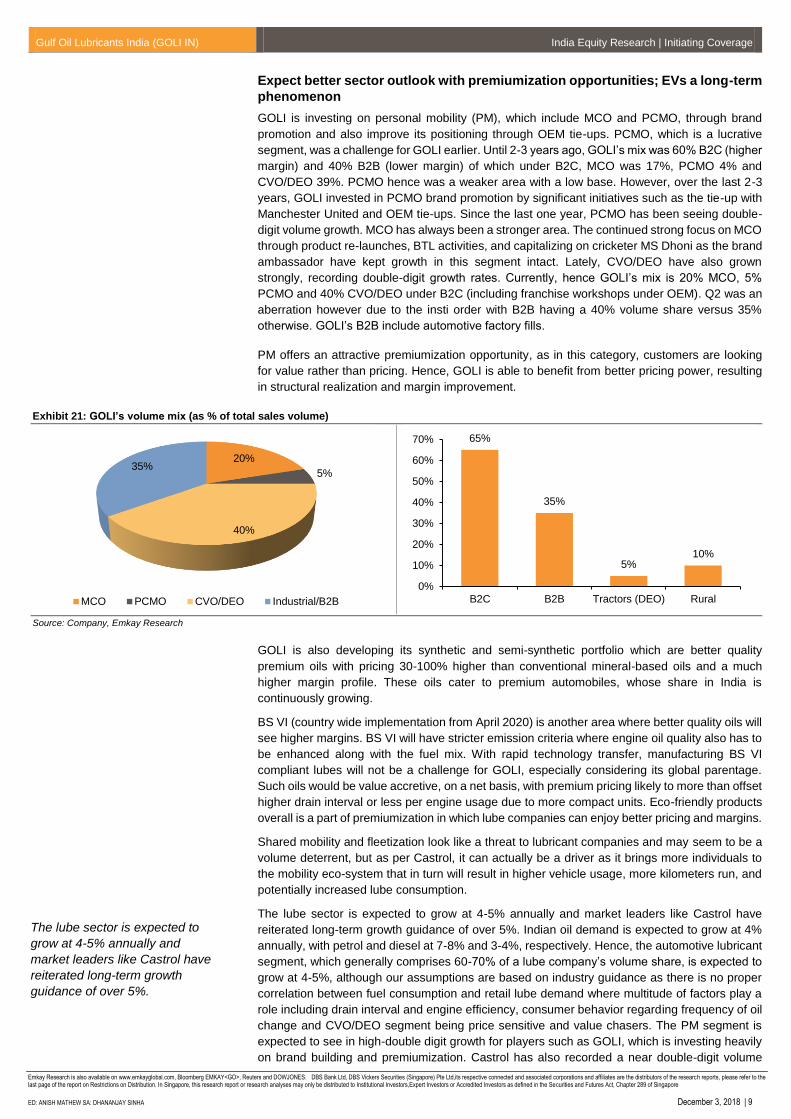
strongly, recording double-digit growth rates. Currently, hence GOLI’s mix is 20% MCO, 5%
PCMO and 40% CVO/DEO under B2C (including franchise workshops under OEM). Q2 was an
aberration however due to the insti order with B2B having a 40% volume share versus 35%
otherwise. GOLI’s B2B include automotive factory fills.
PM offers an attractive premiumization opportunity, as in this category, customers are looking
for value rather than pricing. Hence, GOLI is able to benefit from better pricing power, resulting
in structural realization and margin improvement.
Exhibit 21: GOLI’s volume mix (as % of total sales volume)
Source: Company, Emkay Research
GOLI is also developing its synthetic and semi-synthetic portfolio which are better quality
premium oils with pricing 30-100% higher than conventional mineral-based oils and a much
higher margin profile. These oils cater to premium automobiles, whose share in India is
continuously growing.
BS VI (country wide implementation from April 2020) is another area where better quality oils will
see higher margins. BS VI will have stricter emission criteria where engine oil quality also has to
be enhanced along with the fuel mix. With rapid technology transfer, manufacturing BS VI
compliant lubes will not be a challenge for GOLI, especially considering its global parentage.
Such oils would be value accretive, on a net basis, with premium pricing likely to more than offset
higher drain interval or less per engine usage due to more compact units. Eco-friendly products
overall is a part of premiumization in which lube companies can enjoy better pricing and margins.
Shared mobility and fleetization look like a threat to lubricant companies and may seem to be a
volume deterrent, but as per Castrol, it can actually be a driver as it brings more individuals to
the mobility eco-system that in turn will result in higher vehicle usage, more kilometers run, and
potentially increased lube consumption.
The lube sector is expected to grow at 4-5% annually and market leaders like Castrol have
reiterated long-term growth guidance of over 5%. Indian oil demand is expected to grow at 4%
annually, with petrol and diesel at 7-8% and 3-4%, respectively. Hence, the automotive lubricant
segment, which generally comprises 60-70% of a lube company’s volume share, is expected to
grow at 4-5%, although our assumptions are based on industry guidance as there is no proper
correlation between fuel consumption and retail lube demand where multitude of factors play a
role including drain interval and engine efficiency, consumer behavior regarding frequency of oil
change and CVO/DEO segment being price sensitive and value chasers. The PM segment is
expected to see in high-double digit growth for players such as GOLI, which is investing heavily
on brand building and premiumization. Castrol has also recorded a near double-digit volume
20%
5%
40%
35%
MCO PCMO CVO/DEO Industrial/B2B
65%
35%
5%10%
0%
10%
20%
30%
40%
50%
60%
70%
B2C B2B Tractors (DEO) Rural
The lube sector is expected to
grow at 4-5% annually and
market leaders like Castrol have
reiterated long-term growth
guidance of over 5%.
Gulf Oil Lubricants India (GOLI IN) India Equity Research | Initiating Coverage
Emkay Research is also available on www.emkayglobal.com, Bloomberg EMKAY<GO>, Reuters and DOWJONES. DBS Bank Ltd, DBS Vickers Securities (Singapore) Pte Ltd,its respective connected and associated corporations and affiliates are the distributors of the research reports, please refer to the last page of the report on Restrictions on Distribution. In Singapore, this research report or research analyses may only be distributed to Institutional Investors,Expert Investors or Accredited Investors as defined in the Securities and Futures Act, Chapter 289 of Singapore
ED: ANISH MATHEW SA: DHANANJAY SINHA December 3, 2018| 10
growth in this segment despite being the market leader and hence commanding a bigger share.
The CVO/DEO segment is expected to grow at 3-4% industry-wide though for GOLI same would
be higher and closer to double digit due to a low base and growing OEM profile. The industrial
lubricant sector’s growth is dependent on overall economic activities including manufacturing,
infrastructure, mining, and marine. Being a B2B business, margins are lower in the CVO/DEO
segment compared with the B2C automotive business. However, due to its low base and rapid
expansion, GOLI has been able to record high-double digit growth in this space as well. Hence,
we believe that compared with the industry’s volume growth of 4-5%, GOLI can do a steady-
state volume growth of 13-15% which we are building in FY20/21.
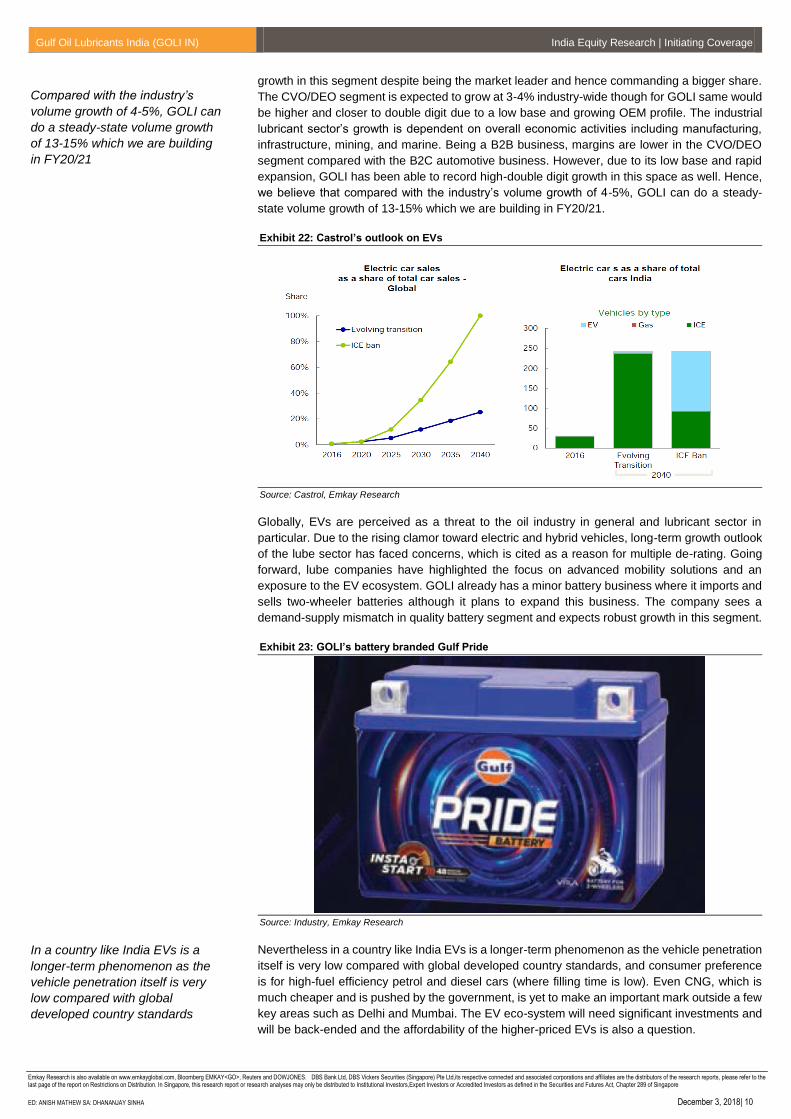
Exhibit 22: Castrol’s outlook on EVs
Source: Castrol, Emkay Research
Globally, EVs are perceived as a threat to the oil industry in general and lubricant sector in
particular. Due to the rising clamor toward electric and hybrid vehicles, long-term growth outlook
of the lube sector has faced concerns, which is cited as a reason for multiple de-rating. Going
forward, lube companies have highlighted the focus on advanced mobility solutions and an
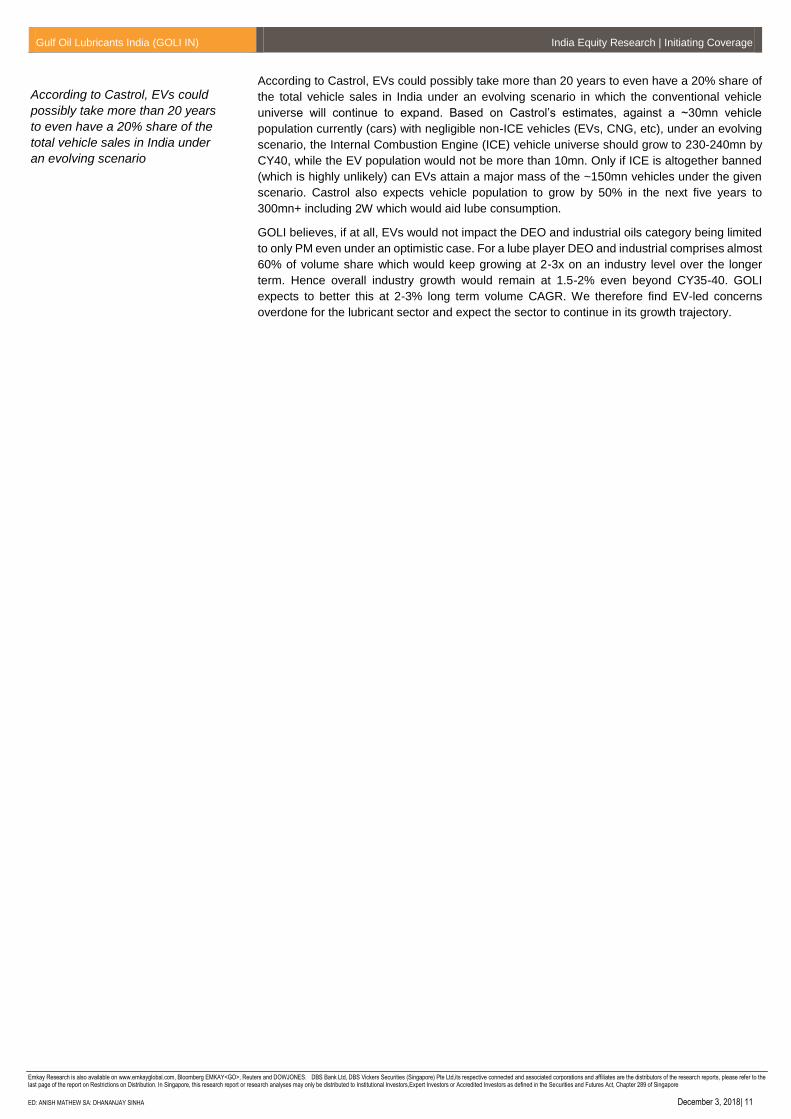
exposure to the EV ecosystem. GOLI already has a minor battery business where it imports and
sells two-wheeler batteries although it plans to expand this business. The company sees a
demand-supply mismatch in quality battery segment and expects robust growth in this segment.
Exhibit 23: GOLI’s battery branded Gulf Pride
Source: Industry, Emkay Research
Nevertheless in a country like India EVs is a longer-term phenomenon as the vehicle penetration
itself is very low compared with global developed country standards, and consumer preference
is for high-fuel efficiency petrol and diesel cars (where filling time is low). Even CNG, which is
much cheaper and is pushed by the government, is yet to make an important mark outside a few
key areas such as Delhi and Mumbai. The EV eco-system will need significant investments and
will be back-ended and the affordability of the higher-priced EVs is also a question.
Compared with the industry’s
volume growth of 4-5%, GOLI can
do a steady-state volume growth
of 13-15% which we are building
in FY20/21
In a country like India EVs is a
longer-term phenomenon as the
vehicle penetration itself is very
low compared with global
developed country standards
Gulf Oil Lubricants India (GOLI IN) India Equity Research | Initiating Coverage
Emkay Research is also available on www.emkayglobal.com, Bloomberg EMKAY<GO>, Reuters and DOWJONES. DBS Bank Ltd, DBS Vickers Securities (Singapore) Pte Ltd,its respective connected and associated corporations and affiliates are the distributors of the research reports, please refer to the last page of the report on Restrictions on Distribution. In Singapore, this research report or research analyses may only be distributed to Institutional Investors,Expert Investors or Accredited Investors as defined in the Securities and Futures Act, Chapter 289 of Singapore
ED: ANISH MATHEW SA: DHANANJAY SINHA December 3, 2018| 11
According to Castrol, EVs could possibly take more than 20 years to even have a 20% share of
the total vehicle sales in India under an evolving scenario in which the conventional vehicle
universe will continue to expand. Based on Castrol’s estimates, against a ~30mn vehicle
population currently (cars) with negligible non-ICE vehicles (EVs, CNG, etc), under an evolving
scenario, the Internal Combustion Engine (ICE) vehicle universe should grow to 230-240mn by
CY40, while the EV population would not be more than 10mn. Only if ICE is altogether banned
(which is highly unlikely) can EVs attain a major mass of the ~150mn vehicles under the given
scenario. Castrol also expects vehicle population to grow by 50% in the next five years to
300mn+ including 2W which would aid lube consumption.
GOLI believes, if at all, EVs would not impact the DEO and industrial oils category being limited
to only PM even under an optimistic case. For a lube player DEO and industrial comprises almost
60% of volume share which would keep growing at 2-3x on an industry level over the longer
term. Hence overall industry growth would remain at 1.5-2% even beyond CY35-40. GOLI
expects to better this at 2-3% long term volume CAGR. We therefore find EV-led concerns
overdone for the lubricant sector and expect the sector to continue in its growth trajectory.
According to Castrol, EVs could
possibly take more than 20 years
to even have a 20% share of the
total vehicle sales in India under
an evolving scenario
Gulf Oil Lubricants India (GOLI IN) India Equity Research | Initiating Coverage
Emkay Research is also available on www.emkayglobal.com, Bloomberg EMKAY<GO>, Reuters and DOWJONES. DBS Bank Ltd, DBS Vickers Securities (Singapore) Pte Ltd,its respective connected and associated corporations and affiliates are the distributors of the research reports, please refer to the last page of the report on Restrictions on Distribution. In Singapore, this research report or research analyses may only be distributed to Institutional Investors,Expert Investors or Accredited Investors as defined in the Securities and Futures Act, Chapter 289 of Singapore
ED: ANISH MATHEW SA: DHANANJAY SINHA December 3, 2018| 12
Financial analysis
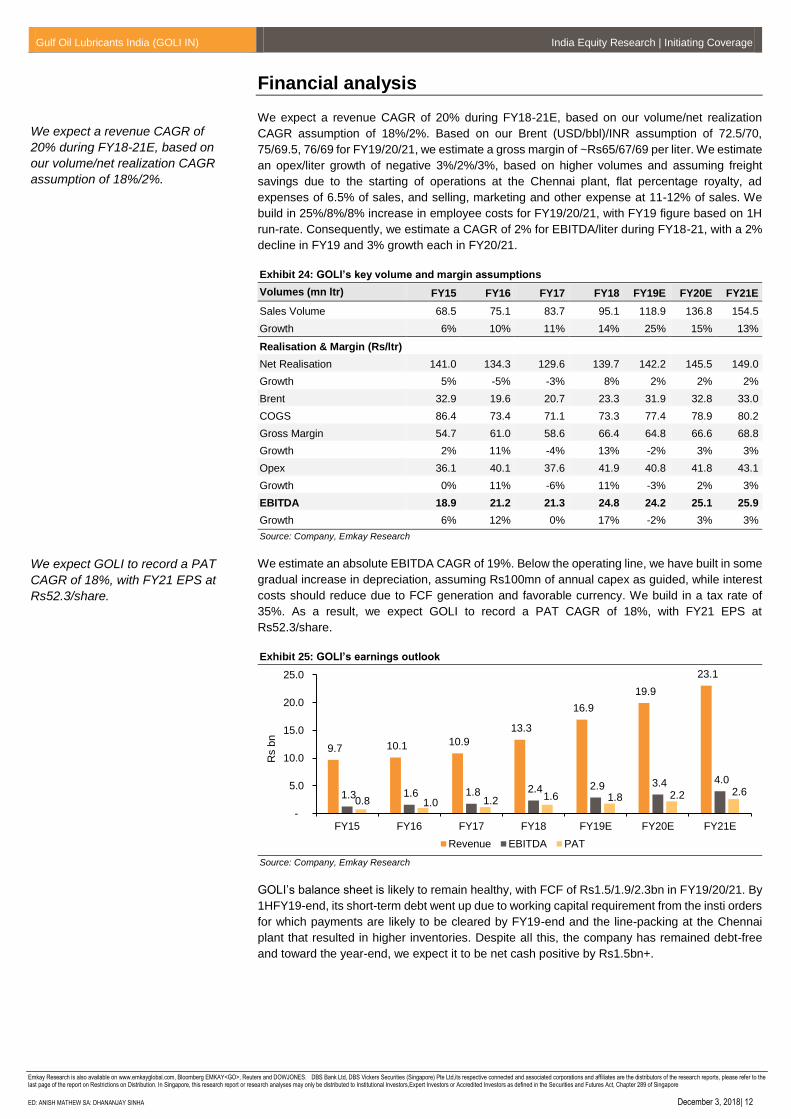
We expect a revenue CAGR of 20% during FY18-21E, based on our volume/net realization
CAGR assumption of 18%/2%. Based on our Brent (USD/bbl)/INR assumption of 72.5/70,
75/69.5, 76/69 for FY19/20/21, we estimate a gross margin of ~Rs65/67/69 per liter. We estimate
an opex/liter growth of negative 3%/2%/3%, based on higher volumes and assuming freight
savings due to the starting of operations at the Chennai plant, flat percentage royalty, ad
expenses of 6.5% of sales, and selling, marketing and other expense at 11-12% of sales. We
build in 25%/8%/8% increase in employee costs for FY19/20/21, with FY19 figure based on 1H
run-rate. Consequently, we estimate a CAGR of 2% for EBITDA/liter during FY18-21, with a 2%
decline in FY19 and 3% growth each in FY20/21.
Exhibit 24: GOLI’s key volume and margin assumptions
Volumes (mn ltr) FY15 FY16 FY17 FY18 FY19E FY20E FY21E
Sales Volume 68.5 75.1 83.7 95.1 118.9 136.8 154.5
Growth 6% 10% 11% 14% 25% 15% 13%
Realisation & Margin (Rs/ltr)
Net Realisation 141.0 134.3 129.6 139.7 142.2 145.5 149.0
Growth 5% -5% -3% 8% 2% 2% 2%
Brent 32.9 19.6 20.7 23.3 31.9 32.8 33.0
COGS 86.4 73.4 71.1 73.3 77.4 78.9 80.2
Gross Margin 54.7 61.0 58.6 66.4 64.8 66.6 68.8
Growth 2% 11% -4% 13% -2% 3% 3%
Opex 36.1 40.1 37.6 41.9 40.8 41.8 43.1
Growth 0% 11% -6% 11% -3% 2% 3%
EBITDA 18.9 21.2 21.3 24.8 24.2 25.1 25.9
Growth 6% 12% 0% 17% -2% 3% 3%
Source: Company, Emkay Research
We estimate an absolute EBITDA CAGR of 19%. Below the operating line, we have built in some
gradual increase in depreciation, assuming Rs100mn of annual capex as guided, while interest
costs should reduce due to FCF generation and favorable currency. We build in a tax rate of
35%. As a result, we expect GOLI to record a PAT CAGR of 18%, with FY21 EPS at
Rs52.3/share.
Exhibit 25: GOLI’s earnings outlook
Source: Company, Emkay Research
GOLI’s balance sheet is likely to remain healthy, with FCF of Rs1.5/1.9/2.3bn in FY19/20/21. By
1HFY19-end, its short-term debt went up due to working capital requirement from the insti orders
for which payments are likely to be cleared by FY19-end and the line-packing at the Chennai
plant that resulted in higher inventories. Despite all this, the company has remained debt-free
and toward the year-end, we expect it to be net cash positive by Rs1.5bn+.
9.7 10.1 10.9
13.3
16.9
19.9
23.1
1.3 1.6 1.8 2.4 2.9 3.4 4.0
0.8 1.0 1.2 1.6 1.8 2.2 2.6
-
5.0
10.0
15.0
20.0
25.0
FY15 FY16 FY17 FY18 FY19E FY20E FY21E
Rs b
n
Revenue EBITDA PAT
We expect a revenue CAGR of
20% during FY18-21E, based on
our volume/net realization CAGR
assumption of 18%/2%.
We expect GOLI to record a PAT
CAGR of 18%, with FY21 EPS at
Rs52.3/share.
Gulf Oil Lubricants India (GOLI IN) India Equity Research | Initiating Coverage
Emkay Research is also available on www.emkayglobal.com, Bloomberg EMKAY<GO>, Reuters and DOWJONES. DBS Bank Ltd, DBS Vickers Securities (Singapore) Pte Ltd,its respective connected and associated corporations and affiliates are the distributors of the research reports, please refer to the last page of the report on Restrictions on Distribution. In Singapore, this research report or research analyses may only be distributed to Institutional Investors,Expert Investors or Accredited Investors as defined in the Securities and Futures Act, Chapter 289 of Singapore
ED: ANISH MATHEW SA: DHANANJAY SINHA December 3, 2018| 13
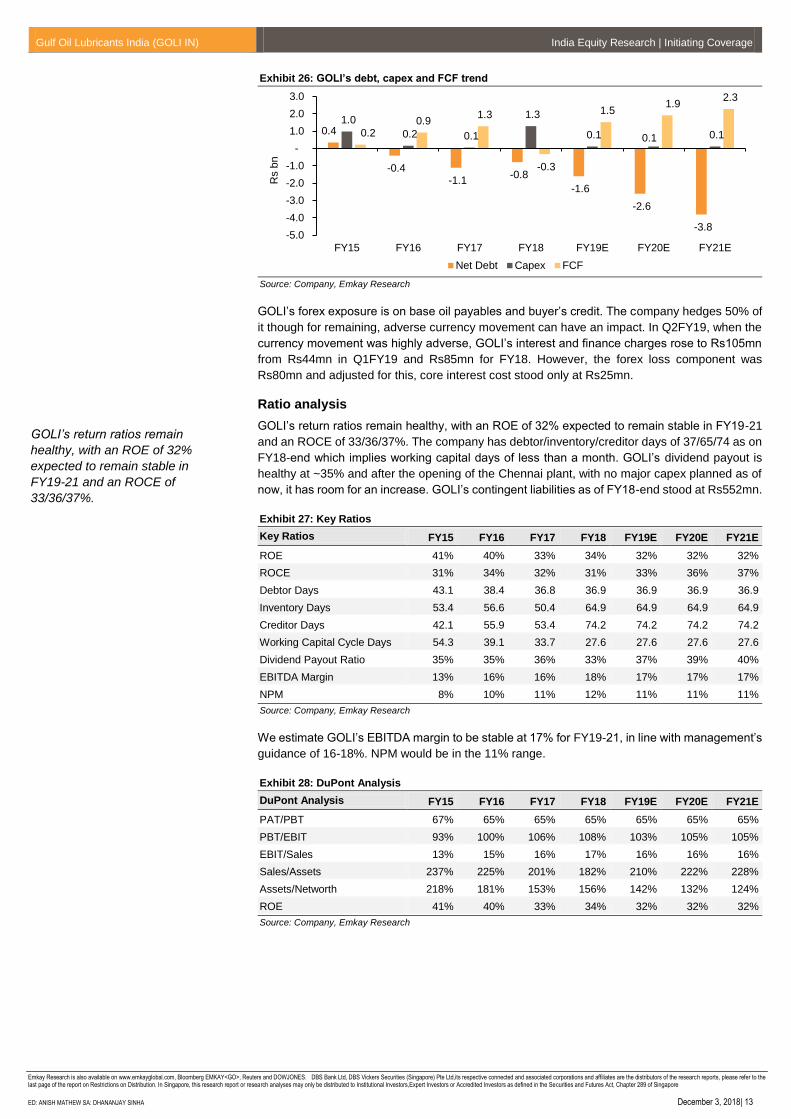
Exhibit 26: GOLI’s debt, capex and FCF trend
Source: Company, Emkay Research
GOLI’s forex exposure is on base oil payables and buyer’s credit. The company hedges 50% of
it though for remaining, adverse currency movement can have an impact. In Q2FY19, when the
currency movement was highly adverse, GOLI’s interest and finance charges rose to Rs105mn
from Rs44mn in Q1FY19 and Rs85mn for FY18. However, the forex loss component was
Rs80mn and adjusted for this, core interest cost stood only at Rs25mn.
Ratio analysis
GOLI’s return ratios remain healthy, with an ROE of 32% expected to remain stable in FY19-21
and an ROCE of 33/36/37%. The company has debtor/inventory/creditor days of 37/65/74 as on
FY18-end which implies working capital days of less than a month. GOLI’s dividend payout is
healthy at ~35% and after the opening of the Chennai plant, with no major capex planned as of
now, it has room for an increase. GOLI’s contingent liabilities as of FY18-end stood at Rs552mn.
Exhibit 27: Key Ratios
Key Ratios FY15 FY16 FY17 FY18 FY19E FY20E FY21E
ROE 41% 40% 33% 34% 32% 32% 32%
ROCE 31% 34% 32% 31% 33% 36% 37%
Debtor Days 43.1 38.4 36.8 36.9 36.9 36.9 36.9
Inventory Days 53.4 56.6 50.4 64.9 64.9 64.9 64.9
Creditor Days 42.1 55.9 53.4 74.2 74.2 74.2 74.2
Working Capital Cycle Days 54.3 39.1 33.7 27.6 27.6 27.6 27.6
Dividend Payout Ratio 35% 35% 36% 33% 37% 39% 40%
EBITDA Margin 13% 16% 16% 18% 17% 17% 17%
NPM 8% 10% 11% 12% 11% 11% 11%
Source: Company, Emkay Research
We estimate GOLI’s EBITDA margin to be stable at 17% for FY19-21, in line with management’s
guidance of 16-18%. NPM would be in the 11% range.
Exhibit 28: DuPont Analysis
DuPont Analysis FY15 FY16 FY17 FY18 FY19E FY20E FY21E
PAT/PBT 67% 65% 65% 65% 65% 65% 65%
PBT/EBIT 93% 100% 106% 108% 103% 105% 105%
EBIT/Sales 13% 15% 16% 17% 16% 16% 16%
Sales/Assets 237% 225% 201% 182% 210% 222% 228%
Assets/Networth 218% 181% 153% 156% 142% 132% 124%
ROE 41% 40% 33% 34% 32% 32% 32%
Source: Company, Emkay Research
0.4
-0.4 -1.1
-0.8
-1.6
-2.6
-3.8
1.0
0.2 0.1
1.3
0.1 0.1 0.1 0.2 0.9
1.3
-0.3
1.5 1.9
2.3
-5.0
-4.0
-3.0
-2.0
-1.0
-
1.0
2.0
3.0
FY15 FY16 FY17 FY18 FY19E FY20E FY21E
Rs b
nNet Debt Capex FCF
GOLI’s return ratios remain
healthy, with an ROE of 32%
expected to remain stable in
FY19-21 and an ROCE of
33/36/37%.
Gulf Oil Lubricants India (GOLI IN) India Equity Research | Initiating Coverage
Emkay Research is also available on www.emkayglobal.com, Bloomberg EMKAY<GO>, Reuters and DOWJONES. DBS Bank Ltd, DBS Vickers Securities (Singapore) Pte Ltd,its respective connected and associated corporations and affiliates are the distributors of the research reports, please refer to the last page of the report on Restrictions on Distribution. In Singapore, this research report or research analyses may only be distributed to Institutional Investors,Expert Investors or Accredited Investors as defined in the Securities and Futures Act, Chapter 289 of Singapore
ED: ANISH MATHEW SA: DHANANJAY SINHA December 3, 2018| 14
Valuation
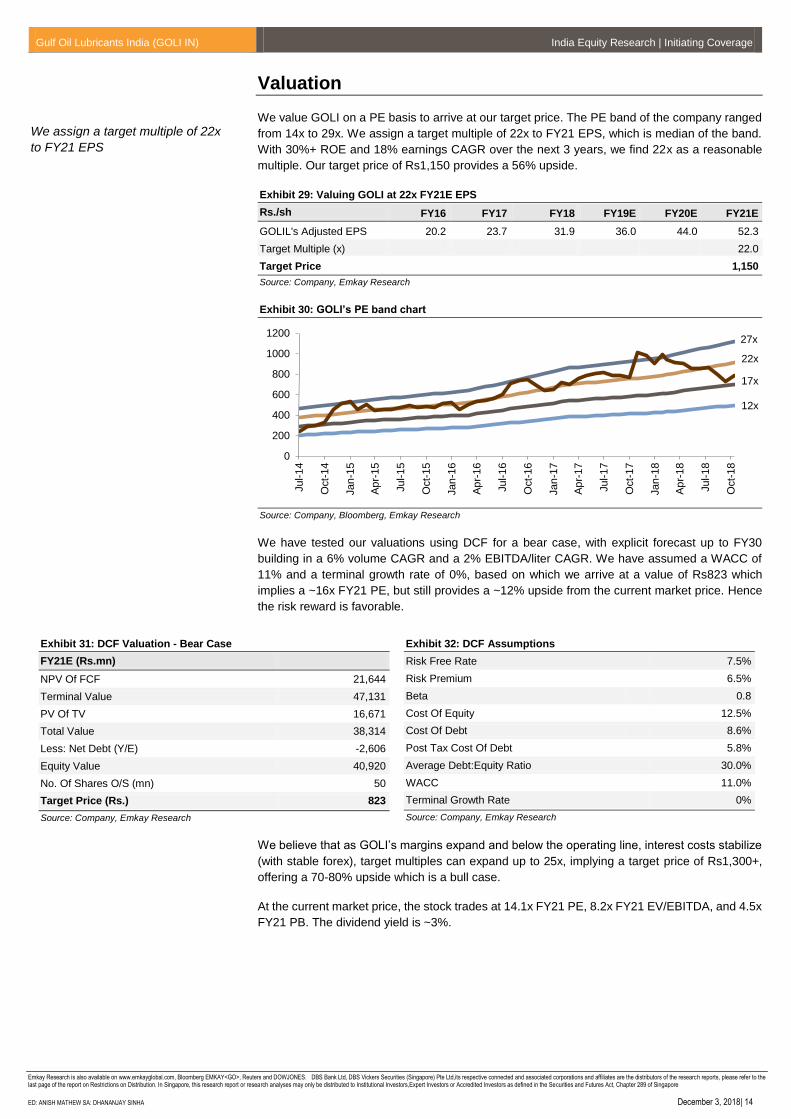
We value GOLI on a PE basis to arrive at our target price. The PE band of the company ranged
from 14x to 29x. We assign a target multiple of 22x to FY21 EPS, which is median of the band.
With 30%+ ROE and 18% earnings CAGR over the next 3 years, we find 22x as a reasonable
multiple. Our target price of Rs1,150 provides a 56% upside.
Exhibit 29: Valuing GOLI at 22x FY21E EPS
Rs./sh FY16 FY17 FY18 FY19E FY20E FY21E
GOLIL's Adjusted EPS 20.2 23.7 31.9 36.0 44.0 52.3
Target Multiple (x) 22.0
Target Price 1,150
Source: Company, Emkay Research
Exhibit 30: GOLI’s PE band chart
Source: Company, Bloomberg, Emkay Research
We have tested our valuations using DCF for a bear case, with explicit forecast up to FY30
building in a 6% volume CAGR and a 2% EBITDA/liter CAGR. We have assumed a WACC of
11% and a terminal growth rate of 0%, based on which we arrive at a value of Rs823 which
implies a ~16x FY21 PE, but still provides a ~12% upside from the current market price. Hence
the risk reward is favorable.
Exhibit 31: DCF Valuation - Bear Case
FY21E (Rs.mn)
NPV Of FCF 21,644
Terminal Value 47,131
PV Of TV 16,671
Total Value 38,314
Less: Net Debt (Y/E) -2,606
Equity Value 40,920
No. Of Shares O/S (mn) 50
Target Price (Rs.) 823
Source: Company, Emkay Research
Exhibit 32: DCF Assumptions
Risk Free Rate 7.5%
Risk Premium 6.5%
Beta 0.8
Cost Of Equity 12.5%
Cost Of Debt 8.6%
Post Tax Cost Of Debt 5.8%
Average Debt:Equity Ratio 30.0%
WACC 11.0%
Terminal Growth Rate 0%
Source: Company, Emkay Research
We believe that as GOLI’s margins expand and below the operating line, interest costs stabilize
(with stable forex), target multiples can expand up to 25x, implying a target price of Rs1,300+,
offering a 70-80% upside which is a bull case.
At the current market price, the stock trades at 14.1x FY21 PE, 8.2x FY21 EV/EBITDA, and 4.5x
FY21 PB. The dividend yield is ~3%.
0
200
400
600
800
1000
1200
Jul-1
4
Oct-
14
Jan
-15
Ap
r-15
Jul-1
5
Oct-
15
Jan
-16
Ap
r-16
Jul-1
6
Oct-
16
Jan
-17
Ap
r-17
Jul-1
7
Oct-
17
Jan
-18
Ap
r-18
Jul-1
8
Oct-
18
12x
17x
22x
27x
We assign a target multiple of 22x
to FY21 EPS
Gulf Oil Lubricants India (GOLI IN) India Equity Research | Initiating Coverage
Emkay Research is also available on www.emkayglobal.com, Bloomberg EMKAY<GO>, Reuters and DOWJONES. DBS Bank Ltd, DBS Vickers Securities (Singapore) Pte Ltd,its respective connected and associated corporations and affiliates are the distributors of the research reports, please refer to the last page of the report on Restrictions on Distribution. In Singapore, this research report or research analyses may only be distributed to Institutional Investors,Expert Investors or Accredited Investors as defined in the Securities and Futures Act, Chapter 289 of Singapore
ED: ANISH MATHEW SA: DHANANJAY SINHA December 3, 2018| 15
Exhibit 33: Valuation Ratios
Valuation Ratios FY15 FY16 FY17 FY18 FY19E FY20E FY21E
EV/Sales (x) 3.8 3.6 3.3 2.7 2.1 1.7 1.4
EV/EBIDTA 28.5 22.7 20.0 15.2 12.2 9.9 8.2
PCE (x) 44.5 34.4 29.3 21.7 18.4 15.3 13.0
PE(x) 47.3 36.5 31.2 23.1 20.5 16.8 14.1
PB (x) 19.6 14.7 10.3 7.8 6.5 5.4 4.5
PEG 363.3 123.2 181.3 66.3 159.0 75.5 75.5
Dividend Yield 1% 1% 1% 1% 2% 2% 3%
FCF Yield 1% 3% 4% -1% 4% 5% 6%
Source: Company, Emkay Research
Exhibit 34: Comparative valuation of Indian FMCG companies
Domestic Peers
Price (Rs)
Mcap Earnings growth(%) PER (x) EV / EBITDA (x) ROE ROCE
(Rs bn) FY20 FY21 FY20 FY21 FY20 FY21 FY20 FY21 FY20 FY21
HUVR 1,732 3,750 19% 19% 50.6 42.7 35.2 29.7 91 98 136 145
DABUR 415 733 16% 15% 40.9 35.5 34.4 29.8 26 26 29 29
MRCO 360 464 27% 18% 38.5 32.7 27.6 23.4 40 40 49 50
CLGT 1,228 334 15% 15% 38.6 33.5 23.0 20.1 58 62 89 95
GCPL 746 762 20% 18% 40.0 33.8 28.1 23.9 25 26 29 32
NEST 10,710 1,033 16% 19% 50.9 42.8 31.6 26.7 51 54 76 81
APNT 1,324 1,270 17% 19% 49.0 41.3 30.1 25.4 26 28 36 38
BRGR 313 304 24% 22% 47.3 38.9 27.4 22.7 24 26 33 36
PIDI 1,160 589 17% 16% 50.6 43.6 34.0 29.1 26 26 35 35
Average 45.1 38.3 30.2 25.6 40.8 42.8 56.9 60.2
Source: Company, Emkay Research
Exhibit 35: Comparative valuation of global lube companies
Peers Mcap Earnings growth (%) PER (x) EV / EBITDA (x) ROE
(USD mn) CY18 CY19 CY18 CY19 CY18 CY19 CY18 CY19
Castrol 2,233 -5% 9% 22.6 21.6 17.7 13.8 69 73
Jiangsu Lopal 363 NM NM 23.7 NM 19.7 NM 10 NM
Qingdao Copton 314 NM NM 18.4 NM 18.9 NM 15 NM
Jiangsu Gaoke 208 NM NM 49.4 NM 33.5 NM 5 NM
Fuchs Petrolub 5,717 10% 7% 17.7 17.5 12.9 10.1 22 18
Tide Water Oil 273 NM NM 17.4 NM 14.3 NM 17 NM
Source: Bloomberg, Company, Emkay Research
Exhibit 36: Snapshot
Y/E, March 31 FY15 FY16 FY17 FY18 FY19E FY20E FY21E
Revenues (Rs.mn) 9,675 10,114 10,868 13,323 16,942 19,933 23,058
EBITDA (Rs.mn) 1,294 1,592 1,778 2,357 2,880 3,427 4,008
Reported PAT (Rs.mn) 774 1,003 1,176 1,586 1,790 2,188 2,597
Adjusted PAT (Rs.mn) 774 1,003 1,176 1,586 1,790 2,188 2,597
Growth 30% 17% 35% 13% 22% 19%
Reported EPS (Rs.) 15.6 20.2 23.7 31.9 36.0 44.0 52.3
Adjusted EPS (Rs.) 15.6 20.2 23.7 31.9 36.0 44.0 52.3
Adjusted PE (x) 47.3 36.5 31.2 23.1 20.5 16.8 14.1
PB (x) 19.6 14.7 10.3 7.8 6.5 5.4 4.5
EV/EBITDA (x) 28.5 22.7 20.0 15.2 12.2 9.9 8.2
RoE 41% 40% 33% 34% 32% 32% 32%
RoCE 31% 34% 32% 31% 33% 36% 37%
Debt:Equity (x) 1.2 0.8 0.5 0.5 0.4 0.3 0.2
EBITDA/ltr (Rs.) 18.9 21.2 21.3 24.8 24.2 25.1 25.9
Growth 12% 0% 17% -2% 3% 3%
Sales Volume (mn.ltr) 68 75 84 95 119 137 155
Growth 10% 11% 14% 25% 15% 13%
Source: Company, Emkay Research
Gulf Oil Lubricants India (GOLI IN) India Equity Research | Initiating Coverage
Emkay Research is also available on www.emkayglobal.com, Bloomberg EMKAY<GO>, Reuters and DOWJONES. DBS Bank Ltd, DBS Vickers Securities (Singapore) Pte Ltd,its respective connected and associated corporations and affiliates are the distributors of the research reports, please refer to the last page of the report on Restrictions on Distribution. In Singapore, this research report or research analyses may only be distributed to Institutional Investors,Expert Investors or Accredited Investors as defined in the Securities and Futures Act, Chapter 289 of Singapore
ED: ANISH MATHEW SA: DHANANJAY SINHA December 3, 2018| 16
Company description
Gulf Oil Lubricants India Ltd (GOLI) is 72.7% owned by Gulf Oil International, a Hinduja group
company. The parent company has rights to the Gulf brand in all countries except Portugal,
Spain, and the US. GOLI was demerged as a pure-play lubricant company from Gulf Oil
Corporation in CY15. GOLI is No.2 in the private/non-OMCs space with an 8% Bazaar and 5%
overall market share.
GOLI’s key segments are automotive and industrial lubricants and its product line includes
engine oils, gear oils, transmission fluids, brake fluids, and fork oil under automotive and
hydraulic oils, compressor oils, cutting oils, and rust preventives under the industrial category,
which includes marine oils. GOLI’s marquee brands are Gulf Formula GX, Tec, Ultrasynth and
MAX in PCMO, Gulf Pride in MCO/2W, Gulf Supreme, Superduty, Superfleet, Super Diesel and
Master in CVO, Gulf XHD in tractors and Gulf Supreme in 3W/CNG. GOLI also has exposure to
the tender business of transport corporations, government entities, defense, etc. In terms of
pricing, GOLI claims to be a 10‐15% discount provider compared with the market leader Castrol.
It has two blending plants — one in Silvassa with a capacity of 90mn liters and a second one in
Chennai with a capacity of 50mn liters that was recently commissioned with a capex of Rs 1.8bn.
The Chennai plant is operating at 50% capacity utilization and has helped GOLI consolidate and
cater the South Indian market in addition to giving export volumes. The Silvassa plant’s capacity
utilization is ~85%. As of FY18-end, GOLI had 60,000+ retailers, 300+ automotive distributors,
30 depots, 200+ direct industrial customers under B2B, 50+ industrial distributors, and 500+
customers in the infra mining space. The company’s headquarters is in Mumbai.
GOLI also has a battery business in which it markets imported 2W batteries and the company is
aiming to significantly scale it up. Mr. Ravi Chawla is the MD and Mr Manish Gangwal is the
CFO. Mr. Sanjay Hinduja is the Chairman of the Board, which comprises three independent
directors and a non‐independent non‐executive director. The company reported revenues of
Rs13bn and a PAT of Rs1.6bn in FY18. The current market capitalization stands at Rs37bn.
Key risks
Adverse oil price and base oil pricing scenario: raw material cost fluctuation could impact
margins if retail pricing is sticky. This will include additives and packaging.
Currency risks: since base oil and additives are dollar-denominated and retail products are
rupee-denominated, currency risk is inherent in the business with a depreciating INR/USD
adverse affecting margins.
Competitive risk: predatory and destructive pricing by competitors, crowding out of new
players. Intense promotional activities can lead to a jump in advertising and other expenses.
Other risks: plant outage, industrial relations, adverse taxation, JV and related party risks.
Higher drain intervals: the structural decline in lube consumption due to efficient and smaller
engines and long drain oils by lubricant players. However, long drain oils are generally
value-accretive for a lube supplier.
Technological changes: the advent of EVs and the clamor around it. Although, as
discussed earlier, in India EVs are a much longer-term phenomenon. Channel disruptions,
with online market places offering substantial discounts.
Gulf Oil Lubricants India (GOLI IN) India Equity Research | Initiating Coverage
Emkay Research is also available on www.emkayglobal.com, Bloomberg EMKAY<GO>, Reuters and DOWJONES. DBS Bank Ltd, DBS Vickers Securities (Singapore) Pte Ltd,its respective connected and associated corporations and affiliates are the distributors of the research reports, please refer to the last page of the report on Restrictions on Distribution. In Singapore, this research report or research analyses may only be distributed to Institutional Investors,Expert Investors or Accredited Investors as defined in the Securities and Futures Act, Chapter 289 of Singapore
ED: ANISH MATHEW SA: DHANANJAY SINHA December 3, 2018| 17
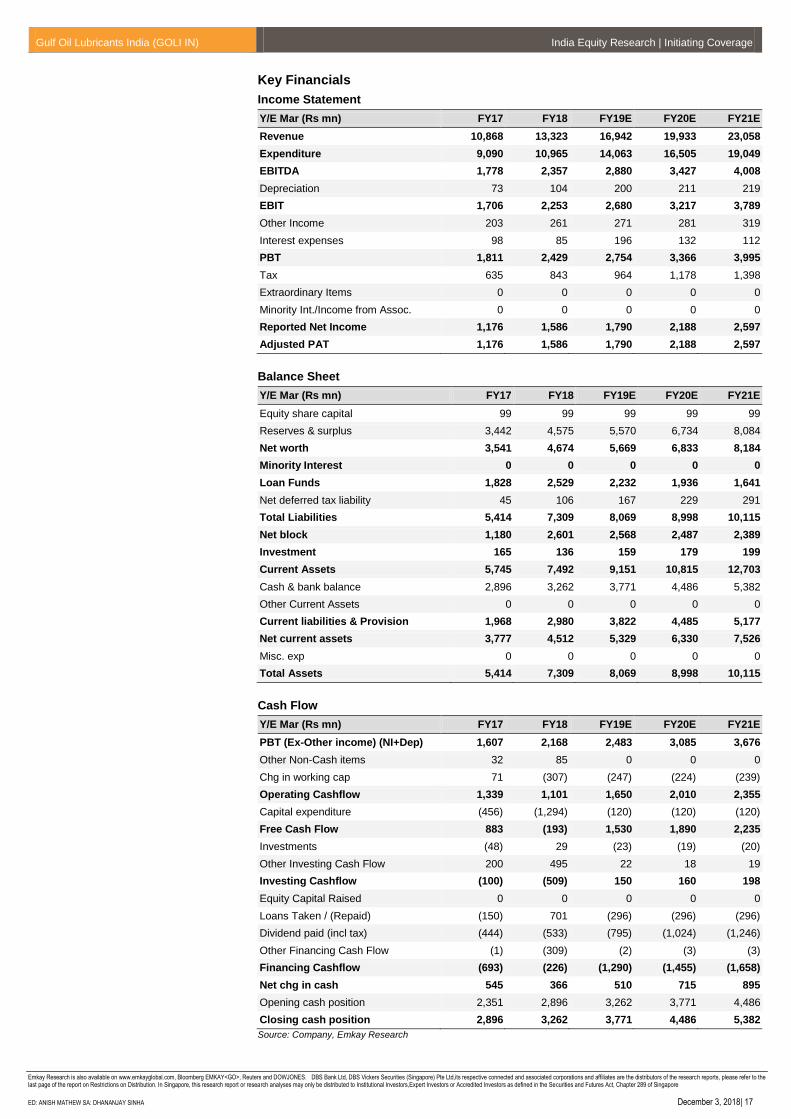
Key Financials
Income Statement
Y/E Mar (Rs mn) FY17 FY18 FY19E FY20E FY21E
Revenue 10,868 13,323 16,942 19,933 23,058
Expenditure 9,090 10,965 14,063 16,505 19,049
EBITDA 1,778 2,357 2,880 3,427 4,008
Depreciation 73 104 200 211 219
EBIT 1,706 2,253 2,680 3,217 3,789
Other Income 203 261 271 281 319
Interest expenses 98 85 196 132 112
PBT 1,811 2,429 2,754 3,366 3,995
Tax 635 843 964 1,178 1,398
Extraordinary Items 0 0 0 0 0
Minority Int./Income from Assoc. 0 0 0 0 0
Reported Net Income 1,176 1,586 1,790 2,188 2,597
Adjusted PAT 1,176 1,586 1,790 2,188 2,597
Balance Sheet
Y/E Mar (Rs mn) FY17 FY18 FY19E FY20E FY21E
Equity share capital 99 99 99 99 99
Reserves & surplus 3,442 4,575 5,570 6,734 8,084
Net worth 3,541 4,674 5,669 6,833 8,184
Minority Interest 0 0 0 0 0
Loan Funds 1,828 2,529 2,232 1,936 1,641
Net deferred tax liability 45 106 167 229 291
Total Liabilities 5,414 7,309 8,069 8,998 10,115
Net block 1,180 2,601 2,568 2,487 2,389
Investment 165 136 159 179 199
Current Assets 5,745 7,492 9,151 10,815 12,703
Cash & bank balance 2,896 3,262 3,771 4,486 5,382
Other Current Assets 0 0 0 0 0
Current liabilities & Provision 1,968 2,980 3,822 4,485 5,177
Net current assets 3,777 4,512 5,329 6,330 7,526
Misc. exp 0 0 0 0 0
Total Assets 5,414 7,309 8,069 8,998 10,115
Cash Flow
Y/E Mar (Rs mn) FY17 FY18 FY19E FY20E FY21E
PBT (Ex-Other income) (NI+Dep) 1,607 2,168 2,483 3,085 3,676
Other Non-Cash items 32 85 0 0 0
Chg in working cap 71 (307) (247) (224) (239)
Operating Cashflow 1,339 1,101 1,650 2,010 2,355
Capital expenditure (456) (1,294) (120) (120) (120)
Free Cash Flow 883 (193) 1,530 1,890 2,235
Investments (48) 29 (23) (19) (20)
Other Investing Cash Flow 200 495 22 18 19
Investing Cashflow (100) (509) 150 160 198
Equity Capital Raised 0 0 0 0 0
Loans Taken / (Repaid) (150) 701 (296) (296) (296)
Dividend paid (incl tax) (444) (533) (795) (1,024) (1,246)
Other Financing Cash Flow (1) (309) (2) (3) (3)
Financing Cashflow (693) (226) (1,290) (1,455) (1,658)
Net chg in cash 545 366 510 715 895
Opening cash position 2,351 2,896 3,262 3,771 4,486
Closing cash position 2,896 3,262 3,771 4,486 5,382
Source: Company, Emkay Research
Gulf Oil Lubricants India (GOLI IN) India Equity Research | Initiating Coverage
Emkay Research is also available on www.emkayglobal.com, Bloomberg EMKAY<GO>, Reuters and DOWJONES. DBS Bank Ltd, DBS Vickers Securities (Singapore) Pte Ltd,its respective connected and associated corporations and affiliates are the distributors of the research reports, please refer to the last page of the report on Restrictions on Distribution. In Singapore, this research report or research analyses may only be distributed to Institutional Investors,Expert Investors or Accredited Investors as defined in the Securities and Futures Act, Chapter 289 of Singapore
ED: ANISH MATHEW SA: DHANANJAY SINHA December 3, 2018| 18
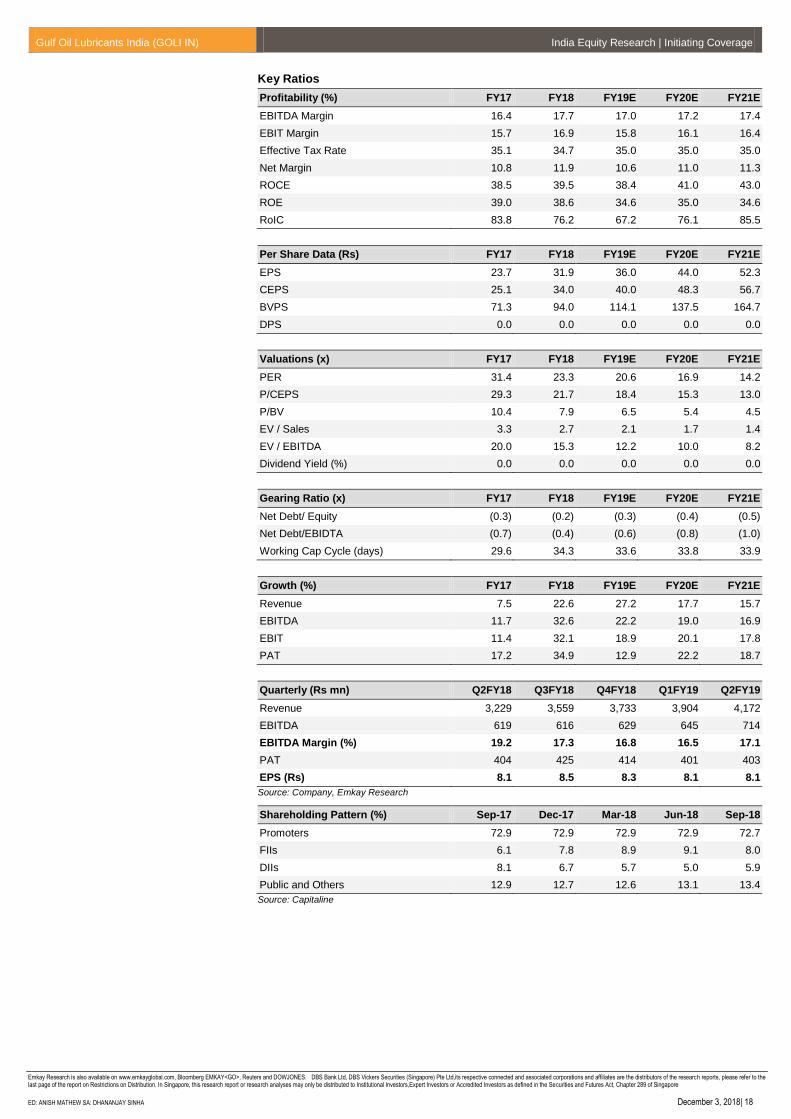
Key Ratios
Profitability (%) FY17 FY18 FY19E FY20E FY21E
EBITDA Margin 16.4 17.7 17.0 17.2 17.4
EBIT Margin 15.7 16.9 15.8 16.1 16.4
Effective Tax Rate 35.1 34.7 35.0 35.0 35.0
Net Margin 10.8 11.9 10.6 11.0 11.3
ROCE 38.5 39.5 38.4 41.0 43.0
ROE 39.0 38.6 34.6 35.0 34.6
RoIC 83.8 76.2 67.2 76.1 85.5
Per Share Data (Rs) FY17 FY18 FY19E FY20E FY21E
EPS 23.7 31.9 36.0 44.0 52.3
CEPS 25.1 34.0 40.0 48.3 56.7
BVPS 71.3 94.0 114.1 137.5 164.7
DPS 0.0 0.0 0.0 0.0 0.0
Valuations (x) FY17 FY18 FY19E FY20E FY21E
PER 31.4 23.3 20.6 16.9 14.2
P/CEPS 29.3 21.7 18.4 15.3 13.0
P/BV 10.4 7.9 6.5 5.4 4.5
EV / Sales 3.3 2.7 2.1 1.7 1.4
EV / EBITDA 20.0 15.3 12.2 10.0 8.2
Dividend Yield (%) 0.0 0.0 0.0 0.0 0.0
Gearing Ratio (x) FY17 FY18 FY19E FY20E FY21E
Net Debt/ Equity (0.3) (0.2) (0.3) (0.4) (0.5)
Net Debt/EBIDTA (0.7) (0.4) (0.6) (0.8) (1.0)
Working Cap Cycle (days) 29.6 34.3 33.6 33.8 33.9
Growth (%) FY17 FY18 FY19E FY20E FY21E
Revenue 7.5 22.6 27.2 17.7 15.7
EBITDA 11.7 32.6 22.2 19.0 16.9
EBIT 11.4 32.1 18.9 20.1 17.8
PAT 17.2 34.9 12.9 22.2 18.7
Quarterly (Rs mn) Q2FY18 Q3FY18 Q4FY18 Q1FY19 Q2FY19
Revenue 3,229 3,559 3,733 3,904 4,172
EBITDA 619 616 629 645 714
EBITDA Margin (%) 19.2 17.3 16.8 16.5 17.1
PAT 404 425 414 401 403
EPS (Rs) 8.1 8.5 8.3 8.1 8.1
Source: Company, Emkay Research
Shareholding Pattern (%) Sep-17 Dec-17 Mar-18 Jun-18 Sep-18
Promoters 72.9 72.9 72.9 72.9 72.7
FIIs 6.1 7.8 8.9 9.1 8.0
DIIs 8.1 6.7 5.7 5.0 5.9
Public and Others 12.9 12.7 12.6 13.1 13.4
Source: Capitaline
Gulf Oil Lubricants India (GOLI IN) India Equity Research | Initiating Coverage
Emkay Research is also available on www.emkayglobal.com, Bloomberg EMKAY<GO>, Reuters and DOWJONES. DBS Bank Ltd, DBS Vickers Securities (Singapore) Pte Ltd,its respective connected and associated corporations and affiliates are the distributors of the research reports, please refer to the last page of the report on Restrictions on Distribution. In Singapore, this research report or research analyses may only be distributed to Institutional Investors,Expert Investors or Accredited Investors as defined in the Securities and Futures Act, Chapter 289 of Singapore
ED: ANISH MATHEW SA: DHANANJAY SINHA December 3, 2018| 19
Emkay Rating Distribution
BUY Expected total return (%) (Stock price appreciation and dividend yield) of over 25% within the next 12-18 months.
ACCUMULATE Expected total return (%) (Stock price appreciation and dividend yield) of over 10% within the next 12-18 months.
HOLD Expected total return (%) (Stock price appreciation and dividend yield) of upto 10% within the next 12-18 months.
REDUCE Expected total return (%) (Stock price depreciation) of upto (-) 10% within the next 12-18 months.
SELL The stock is believed to underperform the broad market indices or its related universe within the next 12-18 months.
Completed Date: 03 Dec 2018 17:16:24 (SGT) Dissemination Date: 03 Dec 2018 17:17:24 (SGT)
Sources for all charts and tables are Emkay Research unless otherwise specified.
GENERAL DISCLOSURE/DISCLAIMER BY EMKAY GLOBAL FINANCIAL SERVICES LIMITED (EGFSL): Emkay Global Financial Services Limited (CIN-L67120MH1995PLC084899) and its affiliates are a full-service, brokerage, investment banking, investment management and financing group. Emkay Global Financial Services Limited (EGFSL) along with its affiliates are participants in virtually all securities trading markets in India. EGFSL was established in 1995 and is one of India's leading brokerage and distribution house. EGFSL is a corporate trading member of Bombay Stock Exchange Limited (BSE), National Stock Exchange of India Limited (NSE), MCX Stock Exchange Limited (MCX-SX). EGFSL along with its subsidiaries offers the most comprehensive avenues for investments and is engaged in the businesses including stock broking (Institutional and retail), merchant banking, commodity broking, depository participant, portfolio management, insurance broking and services rendered in connection with distribution of primary market issues and financial products like mutual funds, fixed deposits. Details of associates are available on our website i.e. www.emkayglobal.com EGFSL is registered as Research Analyst with SEBI bearing registration Number INH000000354 as per SEBI (Research Analysts) Regulations, 2014. EGFSL hereby declares that it has not defaulted with any stock exchange nor its activities were suspended by any stock exchange with whom it is registered in last five years, except that NSE had disabled EGFSL from trading on October 05, October 08 and October 09, 2012 for a manifest error resulting into a bonafide erroneous trade on October 05, 2012. However, SEBI and Stock Exchanges have conducted the routine inspection and based on their observations have issued advice letters or levied minor penalty on EGFSL for certain operational deviations in ordinary/routine course of business. EGFSL has not been debarred from doing business by any Stock Exchange / SEBI or any other authorities; nor has its certificate of registration been cancelled by SEBI at any point of time. EGFSL offers research services to clients as well as prospects. The analyst for this report certifies that all of the views expressed in this report accurately reflect his or her personal views about the subject company or companies and its or their securities, and no part of his or her compensation was, is or will be, directly or indirectly related to specific recommendations or views expressed in this report. Other disclosures by Emkay Global Financial Services Limited (Research Entity) and its Research Analyst under SEBI (Research Analyst) Regulations, 2014 with reference to the subject company(s) covered in this report EGFSL and/or its affiliates may seek investment banking or other business from the company or companies that are the subject of this material. Our salespeople, traders, and other professionals may provide oral or written market commentary or trading strategies to our clients that reflect opinions that are contrary to the opinions expressed herein, and our proprietary trading and investing businesses may make investment decisions that may be inconsistent with the recommendations expressed herein. In reviewing these materials, you should be aware that any or all of the foregoing, among other things, may give rise to real or potential conflicts of interest including but not limited to those stated herein. Additionally, other important information regarding our relationships with the company or companies that are the subject of this material is provided herein. This report is not directed to, or intended for distribution to or use by, any person or entity who is a citizen or resident of or located in any locality, state, country or other jurisdiction where such distribution, publication, availability or use would be contrary to law or regulation or which would subject EGFSL or its group companies to any registration or licensing requirement within such jurisdiction. Specifically, this document does not constitute an offer to or solicitation to any U.S. person for the purchase or sale of any financial instrument or as an official confirmation of any transaction to any U.S. person. Unless otherwise stated, this message should not be construed as official confirmation of any transaction. No part of this document may be used by private customers in United Kingdom. All material presented in this report, unless specifically indicated otherwise, is under copyright to Emkay. None of the material, nor its content, nor any copy of it, may be altered in any way, transmitted to, copied or distributed to any other party, without the prior express written permission of EGFSL . All trademarks, service marks and logos used in this report are trademarks or registered trademarks of EGFSL or its Group Companies. The information contained herein is not intended for publication or distribution or circulation in any manner whatsoever and any unauthorized reading, dissemination, distribution or copying of this communication is prohibited unless otherwise expressly authorized. Please ensure that you have read “Risk Disclosure Document for Capital Market and Derivatives Segments” as prescribed by Securities and Exchange Board of India before investing in Indian Securities Market. In so far as this report includes current or historic information, it is believed to be reliable, although its accuracy and completeness cannot be guaranteed.
This publication has not been reviewed or authorized by any regulatory authority. There is no planned schedule or frequency for updating research publication relating to any issuer.
Please contact the primary analyst for valuation methodologies and assumptions associated with the covered companies or price targets Disclaimer for U.S. persons only: This research report is a product of Emkay Global Financial Services Limited (Emkay), which is the employer of the research analyst(s) who has prepared the research report. The research analyst(s) preparing the research report is/are resident outside the United States (U.S.) and are not associated persons of any U.S. regulated broker-dealer and therefore the analyst(s) is/are not subject to supervision by a U.S. broker-dealer, and is/are not required to satisfy the regulatory licensing requirements of Financial Institutions Regulatory Authority (FINRA) or required to otherwise comply with U.S. rules or regulations regarding, among other things, communications with a subject company, public appearances and trading securities held by a research analyst account. This report is intended for distribution to "Major Institutional Investors" as defined by Rule 15a-6(b)(4) of the U.S. Securities and Exchange Act, 1934 (the Exchange Act) and interpretations thereof by U.S. Securities and Exchange Commission (SEC) in reliance on Rule 15a 6(a)(2). If the recipient of this report is not a Major Institutional Investor as specified above, then it should not act upon this report and return the same to the sender. Further, this report may not be copied, duplicated and/or transmitted onward to any U.S. person, which is not the Major Institutional Investor. In reliance on the exemption from registration provided by Rule 15a-6 of the Exchange Act and interpretations thereof by the SEC in order to conduct certain business with Major Institutional Investors.
Gulf Oil Lubricants India (GOLI IN) India Equity Research | Initiating Coverage
Emkay Research is also available on www.emkayglobal.com, Bloomberg EMKAY<GO>, Reuters and DOWJONES. DBS Bank Ltd, DBS Vickers Securities (Singapore) Pte Ltd,its respective connected and associated corporations and affiliates are the distributors of the research reports, please refer to the last page of the report on Restrictions on Distribution. In Singapore, this research report or research analyses may only be distributed to Institutional Investors,Expert Investors or Accredited Investors as defined in the Securities and Futures Act, Chapter 289 of Singapore
ED: ANISH MATHEW SA: DHANANJAY SINHA December 3, 2018| 20
GENERAL DISCLOSURE/DISCLAIMER BY DBS BANK LTD AS DISTRIBUTOR OF THE RESEARCH REPORT This report is solely intended for the clients of DBS Bank Ltd,its respective connected and associated corporations and affiliates only and no part of this document may be (i) copied, photocopied or duplicated in any form or by any means or (ii) redistributed without the prior written consent of DBS Bank Ltd. The research set out in this report is based on information obtained from sources believed to be reliable, but we (which collectively refers to DBS Bank Ltd, its respective connected and associated corporations, affiliates and their respective directors, officers, employees and agents (collectively, the “DBS Group”) have not conducted due diligence on any of the companies, verified any information or sources or taken into account any other factors which we may consider to be relevant or appropriate in preparing the research. Accordingly, we do not make any representation or warranty as to the accuracy, completeness or correctness of the research set out in this report. Opinions expressed are subject to change without notice. This research is prepared for general circulation. Any recommendation contained in this document does not have regard to the specific investment objectives, financial situation and the particular needs of any specific addressee. This document is for the information of addressees only and is not to be taken in substitution for the exercise of judgement by addressees, who should obtain separate independent legal or financial advice. The DBS Group accepts no liability whatsoever for any direct, indirect and/or consequential loss (including any claims for loss of profit) arising from any use of and/or reliance upon this document and/or further communication given in relation to this document. This document is not to be construed as an offer or a solicitation of an offer to buy or sell any securities. The DBS Group, along with its affiliates and/or persons associated with any of them may from time to time have interests in the securities mentioned in this document. The DBS Group, may have positions in, and may effect transactions in securities mentioned herein and may also perform or seek to perform broking, investment banking and other banking services for these companies. Any valuations, opinions, estimates, forecasts, ratings or risk assessments herein constitutes a judgment as of the date of this report, and there can be no assurance that future results or events will be consistent with any such valuations, opinions, estimates, forecasts, ratings or risk assessments. The information in this document is subject to change without notice, its accuracy is not guaranteed, it may be incomplete or condensed, it may not contain all material information concerning the company (or companies) referred to in this report and the DBS Group is under no obligation to update the information in this report. This publication has not been reviewed or authorized by any regulatory authority in Singapore, Hong Kong or elsewhere. There is no planned schedule or frequency for updating research publication relating to any issuer.
The valuations, opinions, estimates, forecasts, ratings or risk assessments described in this report were based upon a number of estimates and assumptions and are inherently subject to significant uncertainties and contingencies. It can be expected that one or more of the estimates on which the valuations, opinions, estimates, forecasts, ratings or risk assessments were based will not materialize or will vary significantly from actual results. Therefore, the inclusion of the valuations, opinions, estimates, forecasts, ratings or risk assessments described herein IS NOT TO BE RELIED UPON as a representation and/or warranty by the DBS Group (and/or any persons associated with the aforesaid entities), that: (a) such valuations, opinions, estimates, forecasts, ratings or risk assessments or their underlying assumptions will be achieved, and (b) there is any assurance that future results or events will be consistent with any such valuations, opinions, estimates, forecasts, ratings or risk assessments stated therein. Please contact the primary analyst for valuation methodologies and assumptions associated with the covered companies or price targets. Any assumptions made in this report that refers to commodities, are for the purposes of making forecasts for the company (or companies) mentioned herein. They are not to be construed as recommendations to trade in the physical commodity or in the futures contract relating to the commodity referred to in this report. DBSVUSA, a US-registered broker-dealer, does not have its own investment banking or research department, has not participated in any public offering of securities as a manager or co-manager or in any other investment banking transaction in the past twelve months and does not engage in market-making.
ANALYST CERTIFICATION BY EMKAY GLOBAL FINANCIAL SERVICES LIMITED (EGFSL) The research analyst(s) primarily responsible for the content of this research report, in part or in whole, certifies that the views about the companies and their securities expressed in this report accurately reflect his/her personal views. The analyst(s) also certifies that no part of his/her compensation was, is, or will be, directly or indirectly, related to specific recommendations or views expressed in the report. The research analyst (s) primarily responsible of the content of this research report, in part or in whole, certifies that he or his associate1 does not serve as an officer, director or employee of the issuer or the new listing applicant (which includes in the case of a real estate investment trust, an officer of the management company of the real estate investment trust; and in the case of any other entity, an officer or its equivalent counterparty of the entity who is responsible for the management of the issuer or the new listing applicant). The research analyst(s) primarily responsible for the content of this research report or his associate does not have financial interests2 in relation to an issuer or a new listing applicant that the analyst reviews. EGFSL has procedures in place to eliminate, avoid and manage any potential conflicts of interests that may arise in connection with the production of research reports. The research analyst(s) responsible for this report operates as part of a separate and independent team to the investment banking function of the EGFSL and procedures are in place to ensure that confidential information held by either the research or investment banking function is handled appropriately. There is no direct link of EGFSL compensation to any specific investment banking function of the EGFSL. 1 An associate is defined as (i) the spouse, or any minor child (natural or adopted) or minor step-child, of the analyst; (ii) the trustee of a trust of which the analyst, his spouse, minor child (natural or adopted) or minor step-child, is a beneficiary or discretionary object; or (iii) another person accustomed or obliged to act in accordance with the directions or instructions of the analyst. 2 Financial interest is defined as interest that are commonly known financial interest, such as investment in the securities in respect of an issuer or a new listing applicant, or financial accommodation arrangement between the issuer or the new listing applicant and the firm or analysis. This term does not include commercial lending conducted at the arm’s length, or investments in any collective investment scheme other than an issuer or new listing applicant notwithstanding the fact that the scheme has investments in securities in respect of an issuer or a new listing applicant.
Gulf Oil Lubricants India (GOLI IN) India Equity Research | Initiating Coverage
Emkay Research is also available on www.emkayglobal.com, Bloomberg EMKAY<GO>, Reuters and DOWJONES. DBS Bank Ltd, DBS Vickers Securities (Singapore) Pte Ltd,its respective connected and associated corporations and affiliates are the distributors of the research reports, please refer to the last page of the report on Restrictions on Distribution. In Singapore, this research report or research analyses may only be distributed to Institutional Investors,Expert Investors or Accredited Investors as defined in the Securities and Futures Act, Chapter 289 of Singapore
ED: ANISH MATHEW SA: DHANANJAY SINHA December 3, 2018| 21
COMPANY-SPECIFIC / REGULATORY DISCLOSURES BY EMKAY GLOBAL FINANCIAL SERVICES LIMITED (EGFSL):
Disclosures by Emkay Global Financial Services Limited (Research Entity) and its Research Analyst under SEBI (Research Analyst) Regulations, 2014 with reference to the subject company(s) covered in this report-: 1. EGFSL, its subsidiaries and/or other affiliates do not have a proprietary position in the securities recommended in this report as of December 3,
2018 2. EGFSL, and/or Research Analyst does not market make in equity securities of the issuer(s) or company(ies) mentioned in this Research Report Disclosure of previous investment recommendation produced: 3. EGFSL may have published other investment recommendations in respect of the same securities / instruments recommended in this research
report during the preceding 12 months. Please contact the primary analyst listed in the first page of this report to view previous investment recommendations published by EGFSL in the preceding 12 months.
4. EGFSL , its subsidiaries and/or other affiliates and Research Analyst or his/her relative’s does not have any material conflict of interest in the securities recommended in this report as of December 3, 2018.
5. EGFSL, its subsidiaries and/or other affiliates and Research Analyst or his/her relative’s does not have actual/beneficial ownership of 1% or more securities of the subject company at the end of the month immediately preceding the December 3, 2018
6. EGFSL, its subsidiaries and/or other affiliates and Research Analyst have not received any compensation in whatever form including compensation for investment banking or merchant banking or brokerage services or for products or services other than investment banking or merchant banking or brokerage services from securities recommended in this report (subject company) in the past 12 months.
7. EGFSL, its subsidiaries and/or other affiliates and/or and Research Analyst have not received any compensation or other benefits from securities recommended in this report (subject company) or third party in connection with the research report.
8. Securities recommended in this report (Subject Company) has not been client of EGFSL, its subsidiaries and/or other affiliates and/or and Research Analyst during twelve months preceding the December 3, 2018
Gulf Oil Lubricants India (GOLI IN) India Equity Research | Initiating Coverage
Emkay Research is also available on www.emkayglobal.com, Bloomberg EMKAY<GO>, Reuters and DOWJONES. DBS Bank Ltd, DBS Vickers Securities (Singapore) Pte Ltd,its respective connected and associated corporations and affiliates are the distributors of the research reports, please refer to the last page of the report on Restrictions on Distribution. In Singapore, this research report or research analyses may only be distributed to Institutional Investors,Expert Investors or Accredited Investors as defined in the Securities and Futures Act, Chapter 289 of Singapore
ED: ANISH MATHEW SA: DHANANJAY SINHA December 3, 2018| 22
COMPANY-SPECIFIC / REGULATORY DISCLOSURES BY DBS BANK LTD AS DISTRIBUTOR OF THE RESEARCH REPORT
1. DBS Bank Ltd., DBS HK, DBS Vickers Securities (Singapore) Pte Ltd (“DBSVS”) or their subsidiaries and/or other affiliates do not have a proprietary position in the securities recommended in this report as of 30 Apr 2018.
2. Neither DBS Bank Ltd nor DBS HK market makes in equity securities of the issuer(s) or company(ies) mentioned in this Research Report. Compensation for investment banking services: 3. DBSVUSA, does not have its own investment banking or research department, nor has it participated in any public offering of securities as a manager
or co-manager or in any other investment banking transaction in the past twelve months. Any US persons wishing to obtain further information, including any clarification on disclosures in this disclaimer, or to effect a transaction in any security discussed in this document should contact DBSVUSA exclusively.
Disclosure of previous investment recommendation produced: 4. DBS Bank Ltd. DBS Vickers Securities (Singapore) Pte Ltd (“DBSVS”), their subsidiaries and/or other affiliates may have published other investment
recommendations in respect of the same securities / instruments recommended in this research report during the preceding 12 months. Please contact the primary analyst listed in the first page of this report to view previous investment recommendations published by DBS Bank Ltd. DBS Vickers Securities (Singapore) Pte Ltd (“DBSVS”), their subsidiaries and/or other affiliates in the preceding 12 months.
RESTRICTIONS ON DISTRIBUTION
General This report is not directed to, or intended for distribution to or use by, any person or entity who is a citizen or resident of or located in any locality, state, country or other jurisdiction where such distribution, publication, availability or use would be contrary to law or regulation.
Australia This report is not for distribution into Australia.
Hong Kong This report is not for distribution into Hong Kong.
Indonesia This report is being distributed in Indonesia by PT DBS Vickers Sekuritas Indonesia.
Malaysia This report is not for distribution into Malaysia.
Singapore
This report is distributed in Singapore by DBS Bank Ltd (Company Regn. No. 16800306E) or DBSVS (Company Regn. No. 1860024G) both of which are Exempt Financial Advisers as defined in the Financial Advisers Act and regulated by the Monetary Authority of Singapore. DBS Bank Ltd and/or DBSVS, may distribute reports produced by its respective foreign entities, affiliates or other foreign research houses pursuant to an agreement under Regulation 32C of the financial Advisers Regulations. Singapore recipients should contact DBS Bank Ltd at 6327 2288 for matters arising from, or in connection with the report.
Thailand This report is being distributed in Thailand by DBS Vickers Securities (Thailand) Co Ltd.
United Kingdom
This report is disseminated in the United Kingdom by DBS Vickers Securities (UK) Ltd, ("DBSVUK"). DBSVUK is authorised and regulated by the Financial Conduct Authority in the United Kingdom.
In respect of the United Kingdom, this report is solely intended for the clients of DBSVUK, its respective connected and associated corporations and affiliates only and no part of this document may be (i) copied, photocopied or duplicated in any form or by any means or (ii) redistributed without the prior written consent of DBSVUK. This communication is directed at persons having professional experience in matters relating to investments. Any investment activity following from this communication will only be engaged in with such persons. Persons who do not have professional experience in matters relating to investments should not rely on this communication.
Dubai International Financial Centre
This research report is being distributed by DBS Bank Ltd., (DIFC Branch) having its office at units 608-610, 6th Floor, Gate Precinct Building 5, PO Box 506538, Dubai International Financial Centre (DIFC), Dubai, United Arab Emirates. DBS Bank Ltd., (DIFC Branch) is regulated by The Dubai Financial Services Authority. This research report is intended only for professional clients (as defined in the DFSA rulebook) and no other person may act upon it.
United Arab Emirates
This report is provided by DBS Bank Ltd (Company Regn. No. 196800306E) which is an Exempt Financial Adviser as defined in the Financial Advisers Act and regulated by the Monetary Authority of Singapore. This report is for information purposes only and should not be relied upon or acted on by the recipient or considered as a solicitation or inducement to buy or sell any financial product. It does not constitute a personal recommendation or take into account the particular investment objectives, financial situation, or needs of individual clients. You should contact your relationship manager or investment adviser if you need advice on the merits of buying, selling or holding a particular investment. You should note that the information in this report may be out of date and it is not represented or warranted to be accurate, timely or complete. This report or any portion thereof may not be reprinted, sold or redistributed without our written consent.
United States
DBSVUSA did not participate in its preparation. The research analyst(s) named on this report are not registered as research analysts with FINRA and are not associated persons of DBSVUSA. The research analyst(s) are not subject to FINRA Rule 2241 restrictions on analyst compensation, communications with a subject company, public appearances and trading securities held by a research analyst. This report is being distributed in the United States by DBSVUSA, which accepts responsibility for its contents. This report may only be distributed to Major U.S. Institutional Investors (as defined in SEC Rule 15a-6) and to such other institutional investors and qualified persons as DBSVUSA may authorize. Any U.S. person receiving this report who wishes to effect transactions in any securities referred to herein should contact DBSVUSA directly and not its affiliate.
Other jurisdictions In any other jurisdictions, except if otherwise restricted by laws or regulations, this report is intended only for qualified, professional, institutional or sophisticated investors as defined in the laws and regulations of such jurisdictions.
Emkay Global Financial Services Ltd.
CIN - L67120MH1995PLC084899
7th Floor, The Ruby, Senapati Bapat Marg, Dadar - West, Mumbai - 400028. India
Tel: +91 22 66121212 Fax: +91 22 66121299 Web: www.emkayglobal.com
Gulf Oil Lubricants India (GOLI IN) India Equity Research | Initiating Coverage
Emkay Research is also available on www.emkayglobal.com, Bloomberg EMKAY<GO>, Reuters and DOWJONES. DBS Bank Ltd, DBS Vickers Securities (Singapore) Pte Ltd,its respective connected and associated corporations and affiliates are the distributors of the research reports, please refer to the last page of the report on Restrictions on Distribution. In Singapore, this research report or research analyses may only be distributed to Institutional Investors,Expert Investors or Accredited Investors as defined in the Securities and Futures Act, Chapter 289 of Singapore
ED: ANISH MATHEW SA: DHANANJAY SINHA December 3, 2018| 23
SINGAPORE
DBS Bank Ltd
Contact: Janice Chua
12 Marina Boulevard, Marina Bay Financial Centre Tower 3
Singapore 018982
Tel. 65-6878 8888
Fax: 65 65353 418
e-mail: [email protected]
Company Regn. No. 196800306E
THAILAND
DBS Vickers Securities (Thailand) Co Ltd
Contact: Chanpen Sirithanarattanakul
989 Siam Piwat Tower Building,
9th, 14th-15th Floor
Rama 1 Road, Pathumwan,
Nagkok Thailand 10330
Tel. 66 2 857 7831
Fax: 66 2 658 1269
e-mail: [email protected]
Company Regn. No 0105539127012
Securities and Exchange Commission, Thailand
INDONESIA
PT DBS Vickers Sekuritas (Indonesia)
Contact: Maynard Priajaya Arif
DBS Bank Tower
Ciputra World 1, 32/F
JI. Prof. Dr. Satrio Kav. 3-5
Jakarta 12940, Indonesia
Tel. 62 21 3003 4900
Fax: 62 21 3003 4943
e-mail: [email protected]
Gulf Oil Lubricants India (GOLI IN) India Equity Research | Initiating Coverage
Emkay Research is also available on www.emkayglobal.com, Bloomberg EMKAY<GO>, Reuters and DOWJONES. DBS Bank Ltd, DBS Vickers Securities (Singapore) Pte Ltd,its respective connected and associated corporations and affiliates are the distributors of the research reports, please refer to the last page of the report on Restrictions on Distribution. In Singapore, this research report or research analyses may only be distributed to Institutional Investors,Expert Investors or Accredited Investors as defined in the Securities and Futures Act, Chapter 289 of Singapore
ED: ANISH MATHEW SA: DHANANJAY SINHA December 3, 2018| 24
Sabri Hazarika
+91-022-66121282


