Embed Size (px)
Citation preview
International Journal of Primatology, Vol. 19, No. 6, 1998
Habitat Use and Ranging of Wild Bonobos (Panpaniscus) at Wamba
Chie Hashimoto,1,2 Yasuko Tashiro,3 Daiji Kimura,4 Tomoo Enomoto,5
Ellen J. Ingmanson,6 Gen'ichi Idani,7 and Takeshi Furuichi8
Received June 3, 1997; revised December 12, 1997, February 10, 1998, and April 21, 1998
The relationship between vegetation and ranging patterns of wild bonobos atWamba, Democratic Republic of the Congo, was examined. Via Landsat data,we distinguished three types of vegetation—dry forest, swamp forest, anddisturbed forest—at Wamba. The home ranges of the study groups changedconsiderably from year to year, due mainly to intergroup relationships. Thepopulation density of each group varied between 1.4 and 2.5 individuals perkm2 and was lowest during a period of population increase. Home rangesconsisted mainly of dry forest. The bonobos used dry forest more frequentlythan the other forest types, though they also used swamp and disturbed forestalmost every day. The latter types of forest seemed to be important resourcesfor the bonobos, owing to the abundant herbaceous plants that are rich inprotein and constantly available. The bonobos tended to use dry forest morefrequently in the rainy season than in the relatively dry season, probablybecause the favored fruits in the dry forest were mostly available in the rainyseason. There was no seasonal difference in the size of the daily ranging area.
KEY WORDS: bonobo; Pan paniscus; home range; habitat use; Landsat; seasonality.
1Laboratory of Human Evolution, Faculty of Science, Kyoto University, Sakyo Kyoto, 606,Japan.
2To whom correspondence should be addressed at Section of Social Behavior, PrimateResearch Institute, Kyoto University, Kanrin, Inuyama, Aichi, 484, Japan.
3Primate Research Institute, Kyoto University, Kyoto, Japan.4The Center for African Area Studies, Kyoto University, Kyoto, Japan.5School of Medicine, Tokai University, Japan.6 Anthropology Department, Dickinson College, Carlisle, Pennsylvania.7Hayashibara Museum of Natural Sciences, Japan.8Laboratory of Biology, Meiji-Gakuin University, Japan.
1045
0164-029I/98/1200-1045$15.00/0 © 1998 Plenum Publishing Corporation
INTRODUCTION
While chimpanzees occupy a range of habitats from rain forest to sa-vanna–woodland, bonobos live only in tropical rain forest. However, theirtropical rain-forest habitat is not homogeneous, but consists of differenttypes of vegetation, including primary forest, swamp forest, and secondaryforest around villages (Kano, 1992; Idani et al., 1994). Idani et al. (1994)reported that all of these types of forest have many kinds of food trees forbonobos.
Some reports about habitat use of bonobos emphasize the importanceof primary forest. Bonobos use primary forest almost every day (Kano andMulavwa, 1984), and its utilization rises during the seasons of favored fruits(Kano, 1992). Bonobos also tend to use primary forest for sleeping sites(Kano, 1992; Idani et al., 1994).
Conversely, some reports stress the importance of swamp forest andsecondary forest for bonobos, which often forage there as well as the pri-mary forest (Kano, 1992). They include abundant herbaceous foods thatcontain more protein than is in fruits (Wrangham, 1986; Kano, 1992;Malenky and Stiles, 1991; Malenky et al., 1994; Idani et al. 1994). Bonobosuse them frequently during the transition period between fruiting seasons(Kano, 1992).
To obtain a more general view of habitat use by bonobos, we need aquantitative analysis of the relative importance of vegetation types on thebasis of long-term data. We analyzed data for two wild groups at Wambafrom several observation periods between 1983 and 1996. We determinedthe vegetation types in the home range via Landsat data and analyzed dailyranging routes to assess the frequency of use of each vegetation type. Wealso examined changes in the home ranges of these two groups in relationto intergroup relationships.
MATERIALS AND METHODS
We focus on habitat use by two wild bonobo groups, El and E2, atWamba, Region de 1'Equateur, Democratic Republic of the Congo (0°02'N,22°35'E). The temperature of this area is fairly stable throughout the yearand the average highest and lowest monthly air temperatures are 30 and20°C, respectively. Annual rainfall is about 2000 mm. Although it rainsthroughout the year, there are two rainy seasons and two relatively dryseasons. The light rainy season is from March to May, and the severe rainyseason is from September to November. The dry seasons are from June
1046 Hashimoto et al.
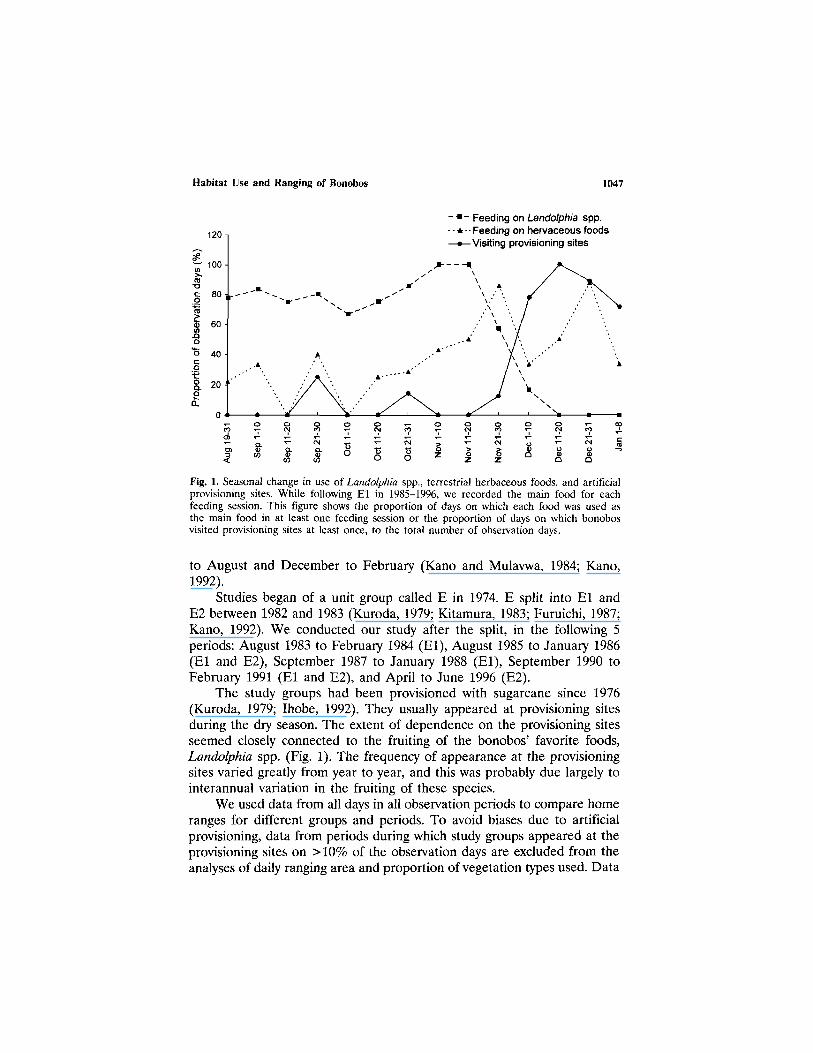
Fig. 1. Seasonal change in use of Landolphia spp., terrestrial herbaceous foods, and artificialprovisioning sites. While following El in 1985-1996, we recorded the main food for eachfeeding session. This figure shows the proportion of days on which each food was used asthe main food in at least one feeding session or the proportion of days on which bonobosvisited provisioning sites at least once, to the total number of observation days.
to August and December to February (Kano and Mulavwa, 1984; Kano,1992).
Studies began of a unit group called E in 1974. E split into El andE2 between 1982 and 1983 (Kuroda, 1979; Kitamura, 1983; Furuichi, 1987;Kano, 1992). We conducted our study after the split, in the following 5periods: August 1983 to February 1984 (El), August 1985 to January 1986(El and E2), September 1987 to January 1988 (El), September 1990 toFebruary 1991 (El and E2), and April to June 1996 (E2).
The study groups had been provisioned with sugarcane since 1976(Kuroda, 1979; Ihobe, 1992). They usually appeared at provisioning sitesduring the dry season. The extent of dependence on the provisioning sitesseemed closely connected to the fruiting of the bonobos' favorite foods,Landolphia spp. (Fig. 1). The frequency of appearance at the provisioningsites varied greatly from year to year, and this was probably due largely tointerannual variation in the fruiting of these species.
We used data from all days in all observation periods to compare homeranges for different groups and periods. To avoid biases due to artificialprovisioning, data from periods during which study groups appeared at theprovisioning sites on > 10% of the observation days are excluded from theanalyses of daily ranging area and proportion of vegetation types used. Data
Habitat Use and Ranging of Bonobos 1047
1048
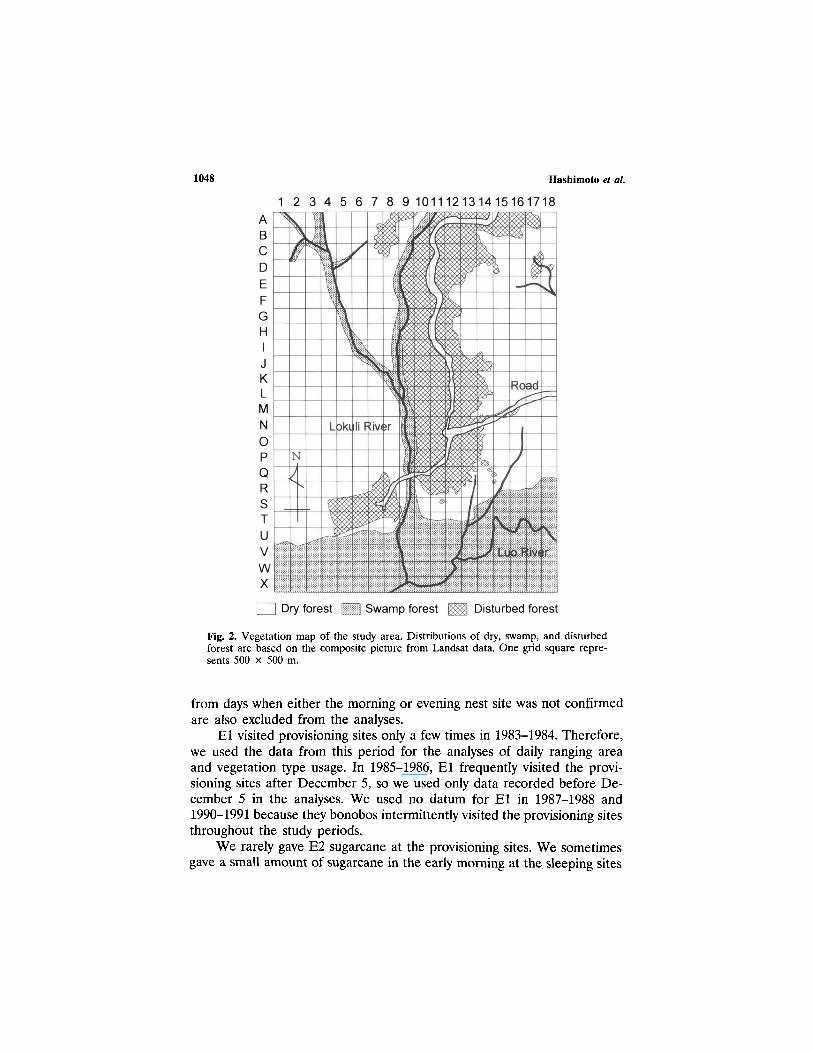
Fig. 2. Vegetation map of the study area. Distributions of dry, swamp, and disturbedforest are based on the composite picture from Landsat data. One grid square repre-sents 500 x 500 m.
from days when either the morning or evening nest site was not confirmedare also excluded from the analyses.
El visited provisioning sites only a few times in 1983-1984. Therefore,we used the data from this period for the analyses of daily ranging areaand vegetation type usage. In 1985-1986, El frequently visited the provi-sioning sites after December 5, so we used only data recorded before De-cember 5 in the analyses. We used no datum for El in 1987-1988 and1990-1991 because they bonobos intermittently visited the provisioning sitesthroughout the study periods.
We rarely gave E2 sugarcane at the provisioning sites. We sometimesgave a small amount of sugarcane in the early morning at the sleeping sites
Hashimoto et al.
to confirm the membership of parties, but this did not seem to influencetheir ranging pattern. Thus we used the data for E2 from all study periodsfor all kinds of analysis.
We used Landsat data to make a vegetation map of the study area.They are from the Landsat Scene of Thematic Mapper (TM) sensor [path178–row 60, 175 km (North-South) x 185 km (East-West)], recorded onJanuary 14, 1991. These data were analyzed by the program ERDAS, Ver-sion 7.5. A picture was synthesized by TM bands 5 (midinfrared: 1.55–1.74mm), 4 (reflective-infrared: 0.76-0.09 mm), and 3 (red: 0.63-0.69 mm) andare represented by red, green, and blue, respectively.
We divided an area covering the home range of El and E2 into agrid with squares 500 x 500 m (Fig. 2). We assigned each square to oneof the vegetation types if more than two-thirds of it was covered by thattype. When two types of vegetation each covered more than one-third ofthe square, we scored it as evenly divided between the two vegetationtypes.
Although, like chimpanzees, bonobos have fission and fusion of par-ties, they usually range as one or two large mixed parties (Furuichi, 1987;White, 1988; Kano, 1992; Elsacker, et al., 1995). We usually followed thelargest mixed party and recorded the squares that they visited on each ob-servation day. The daily ranging area is represented by the number ofsquares that were visited by the party. We counted a square >2 times whenthe party visited it repeatedly on the same day. For the analysis of thedaily ranging area, we used data from days on which both sleeping sites inthe morning and evening were confirmed.
The daily use of each vegetation type is represented by the frequencyof squares visited. Because bonobos rarely moved more than 500 m withouta break for other activities, we could assume that the squares visited wereactually used by bonobos. When a study group visited a square that wasrepresented by a certain vegetation type, we gave one point to that type.If a study group passed a grid that was represented by two vegetation types,we gave 0.5 point to each type. Then we calculated the proportion of totalpoints of each vegetation type to the total points for all vegetation typesfor each day. This analysis also used data from the days on which bothmorning and evening sleeping sites were confirmed.
One might prefer analyses based on the actual time spent in thesquares rather than analyses based on the frequency of visits to the squares.However the number of data sets for which data of actual time are availableis too small to compare the tendency of habitat use between differentgroups and different years. Furthermore, analyses based on the actual timemight underestimate the use of swamp and disturbed forests because it wasvery difficult to track and to observe bonobos directly in such vegetation.
Habitat Use and Ranging of Bonobos 1049
We avoided such bias by an analyses based on the frequency of visit tothe squares, since we could record the ranging route of bonobos throughouta day by tracing their footprints and vocalizations.
To examine the points, we compared results from the frequency-based analysis an those from the time-based analysis of one data set. Thefrequency-based analysis showed that in 1983-1984, El used dry, swamp,and disturbed forests for 64.2, 20.3, and 15.5%, respectively (Fig. 4b),while the time-based analysis showed that the use of these vegetationtypes were 68.2, 17.1, and 14.7%. The proportion of use of swamp anddisturbed forests is slightly smaller in the time-based analysis because ofthe less direct observation in these forests, but the differences are notstatistically significant. Therefore, we assume that the frequency-basedanalysis is a reasonable method to evaluate the use of each vegetationtype.
RESULTS
Vegetation Types
We can distinguish 3 types of vegetation in the picture produced byLandsat data. Our knowledge of actual vegetation in many parts of thestudy area indicates that they represent dry forest, swamp forest, and dis-turbed forest (Fig. 2).
The majority of dry forest in our analysis coincides with primary forestin the vegetation map produced by Kano and Mulavwa (1984), but it alsoincludes areas of old secondary forest on their map. Dry forest is dominatedby trees of the Caesalpiniaceae, and some areas have a thick undergrowthof Marantaceae (herbs).
Swamp forest in our study coincides with the findings of Kano andMulavwa (1984). It occurs along large rivers like the Luo, as well as smallerstreams like the Lokuli River. It is mostly primary forest, covered by talltrees, such as Uapaca heudelotti. There are many terrestrial herbs includingAframomum spp. and Sclerosperma mannii in the swamp forests.
Disturbed forest in our study includes young secondary forest and cul-tivated or fallow land in the study by Kano and Mulavwa (1984). Youngsecondary forest was usually < 10 years old, and it had been used repeatedlyfor fields. There are many trees of Musanga cecropioides, and a thick un-dergrowth of Aframomum spp., Haumania liebrechtsiana, and other herba-ceous species in disturbed forests.
1050 Hashimoto et al.
Habitat Use and Ranging of Bonobos 1051
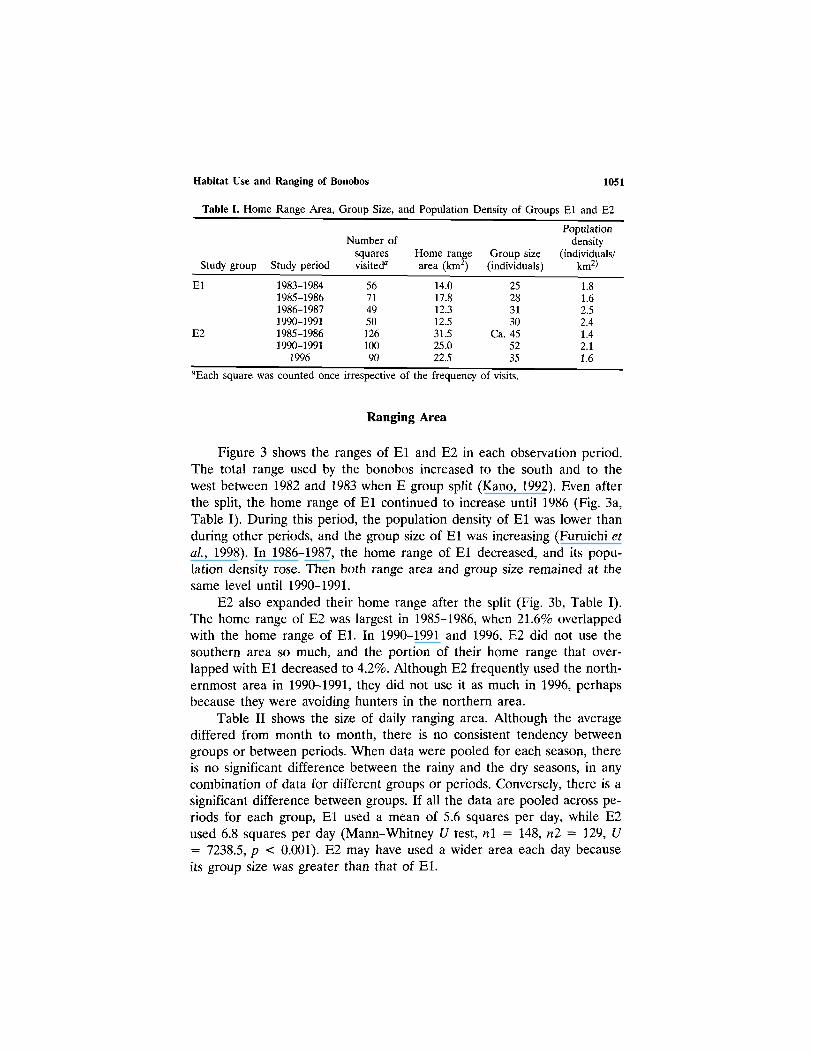
Table I. Home Range Area, Group Size, and Population Density of Groups El and E2
Study group
El
E2
Study period
1983-19841985-19861986-19871990-19911985-19861990-1991
1996
Number ofsquaresvisiteda
5671495012610090
Home rangearea (km2)
14.017.812.312.531.525.022.5
Group size(individuals)
25283130
Ca. 455235
Populationdensity
(individuals/km2)
1.81.62.52.41.42.11.6
aEach square was counted once irrespective of the frequency of visits.
Ranging Area
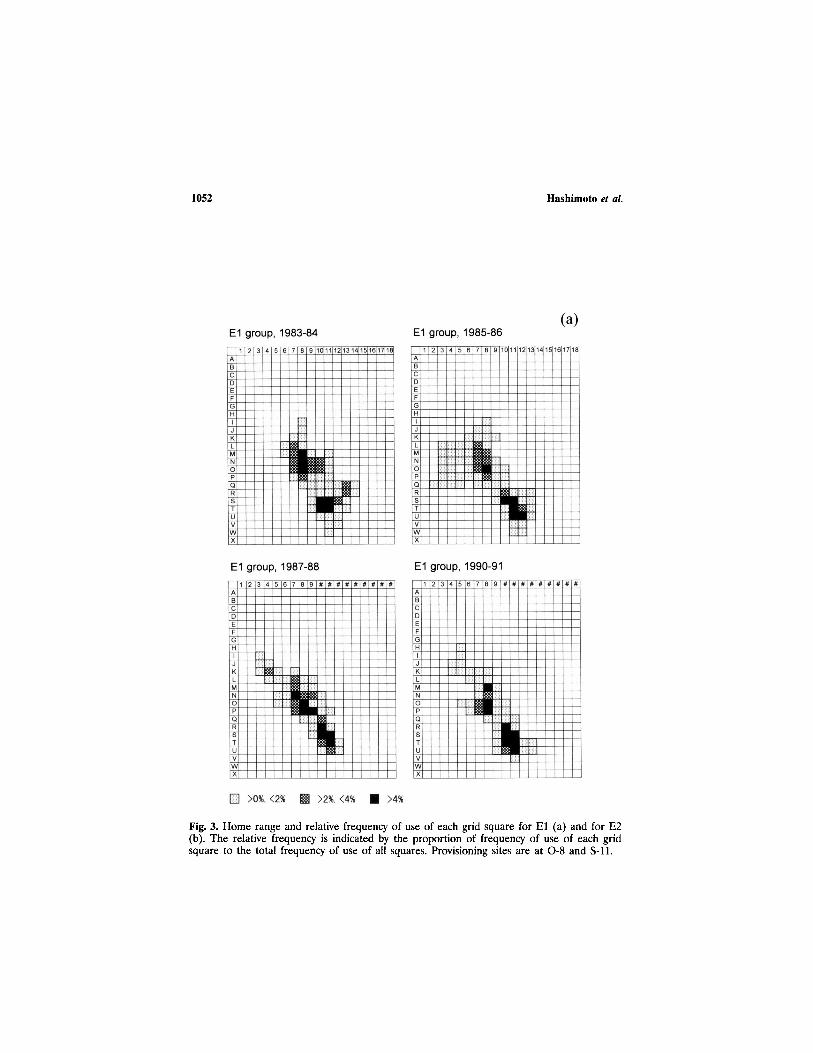
Figure 3 shows the ranges of El and E2 in each observation period.The total range used by the bonobos increased to the south and to thewest between 1982 and 1983 when E group split (Kano, 1992). Even afterthe split, the home range of El continued to increase until 1986 (Fig. 3a,Table I). During this period, the population density of El was lower thanduring other periods, and the group size of El was increasing (Furuichi etal., 1998). In 1986–1987, the home range of El decreased, and its popu-lation density rose. Then both range area and group size remained at thesame level until 1990-1991.
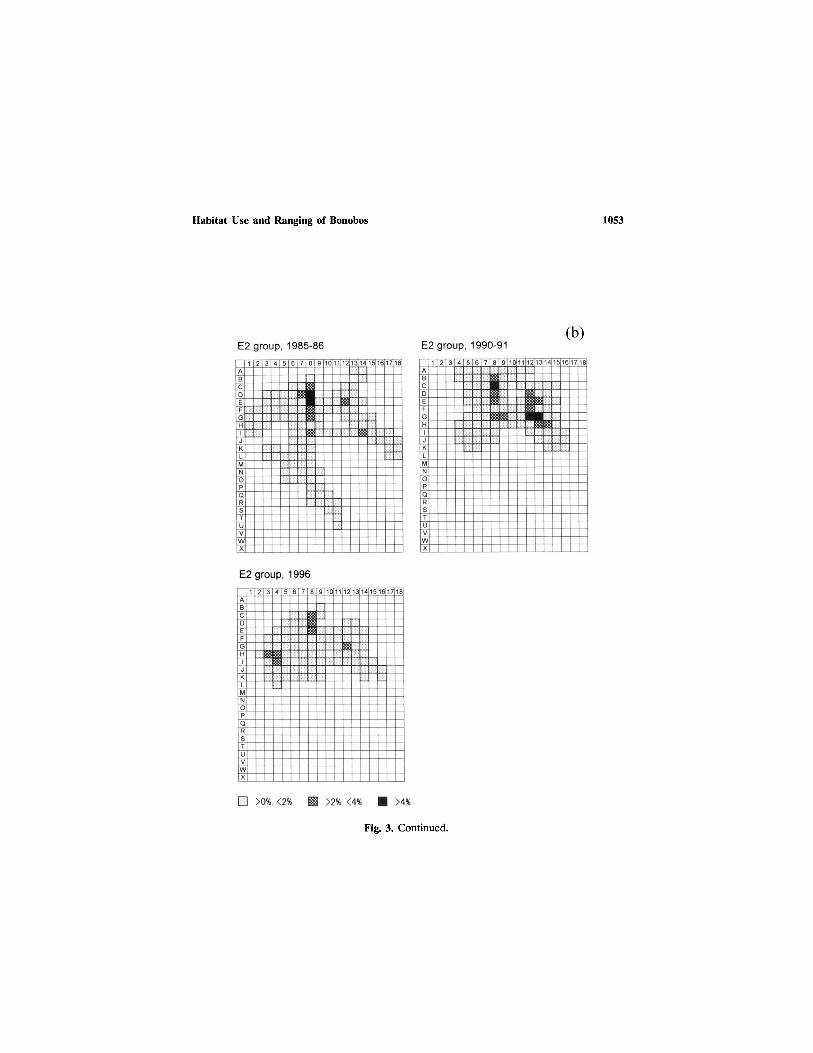
E2 also expanded their home range after the split (Fig. 3b, Table I).The home range of E2 was largest in 1985-1986, when 21.6% overlappedwith the home range of El. In 1990-1991 and 1996, E2 did not use thesouthern area so much, and the portion of their home range that over-lapped with El decreased to 4.2%. Although E2 frequently used the north-ernmost area in 1990-1991, they did not use it as much in 1996, perhapsbecause they were avoiding hunters in the northern area.
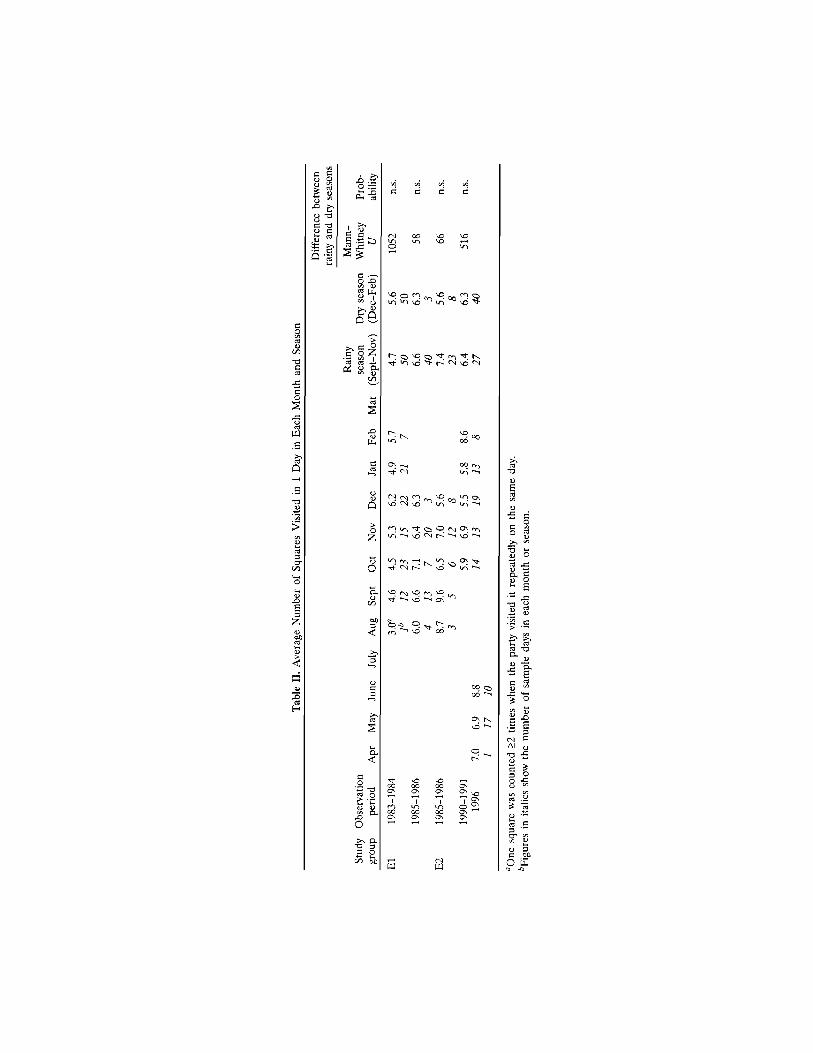
Table II shows the size of daily ranging area. Although the averagediffered from month to month, there is no consistent tendency betweengroups or between periods. When data were pooled for each season, thereis no significant difference between the rainy and the dry seasons, in anycombination of data for different groups or periods. Conversely, there is asignificant difference between groups. If all the data are pooled across pe-riods for each group, El used a mean of 5.6 squares per day, while E2used 6.8 squares per day (Mann–Whitney U test, n1 = 148, n2 = 129, U= 7238.5, p < 0.001). E2 may have used a wider area each day becauseits group size was greater than that of El.
1052
Fig. 3. Home range and relative frequency of use of each grid square for El (a) and for E2(b). The relative frequency is indicated by the proportion of frequency of use of each gridsquare to the total frequency of use of all squares. Provisioning sites are at O-8 and S-ll.
Hashimoto et al.
Habitat Use and Ranging of Bonobos
Fig. 3. Continued.
1053
Habitat Use and Ranging of Bonobos
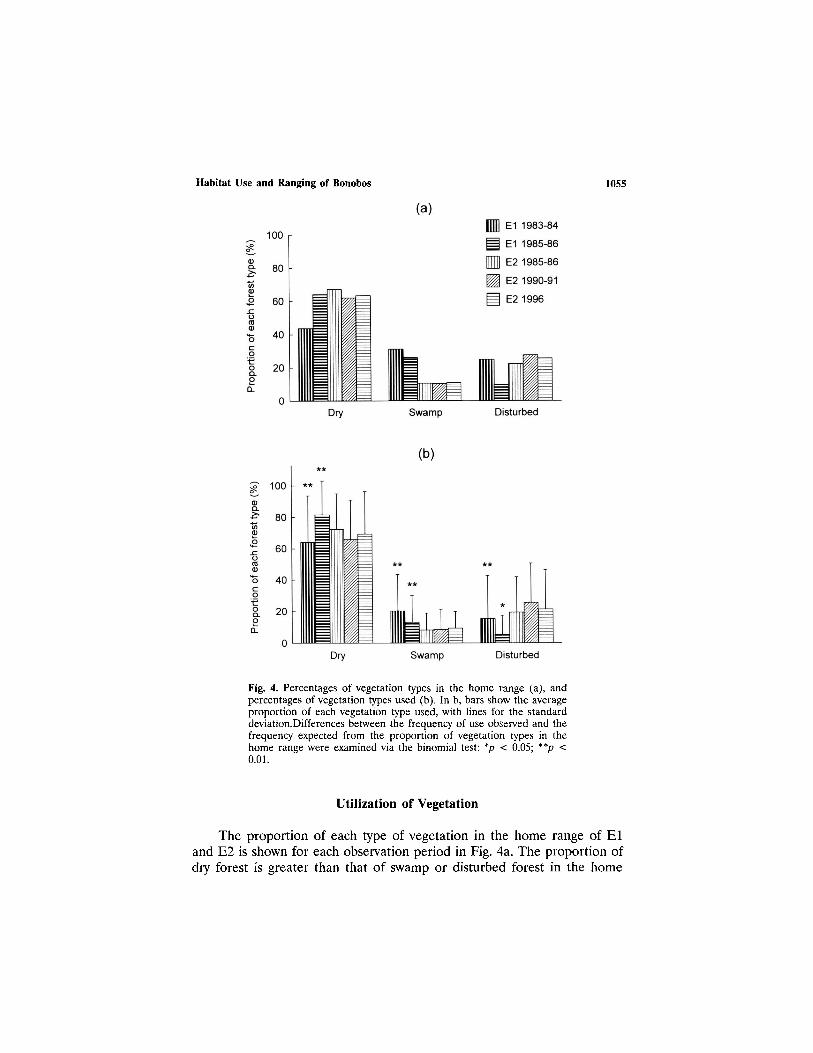
Fig. 4. Percentages of vegetation types in the home range (a), andpercentages of vegetation types used (b). In b, bars show the averageproportion of each vegetation type used, with lines for the standarddeviation.Differences between the frequency of use observed and thefrequency expected from the proportion of vegetation types in thehome range were examined via the binomial test: *p < 0.05; **p <0.01.
Utilization of Vegetation
The proportion of each type of vegetation in the home range of Eland E2 is shown for each observation period in Fig. 4a. The proportion ofdry forest is greater than that of swamp or disturbed forest in the home
1055
range of both groups in every study period. The proportion of swamp forestis greater in El's home range than in that of E2.
Figure 4b shows the average proportions of vegetation types used daily,with standard deviations. These proportions are similar to the vegetationbreakdown of the home range (Fig. 4a). There is a significant differenceonly for El, for which the proportion of dry forest used is higher than theproportion expected from the vegetation breakdown, and the proportionsof swamp and disturbed forests used are lower than expected.
When the data in Fig. 4b are pooled for each group, there is no sig-nificant difference between El and E2 in the proportion of dry forest useddaily (Mann–Whitney U test, n1 = 148, n2 = 129, U = 8917, p = 0.34).Conversely, El used a greater proportion of swamp forest (n1 = 148, n2= 129, U = 7445.5, p < 0.01), and E2 used a greater proportion of dis-turbed forest (n1 = 148, n2 = 129, U = 6531, p < 0.001) than the othergroup did. These differences seemed to reflect the different proportions ofvegetation types in the northern and southern parts of the Wamba forest.These results suggest that both El and E2 used dry forest in similar pro-portions, and that they used either swamp or disturbed forest as a supple-ment.
The standard deviation of the proportion of dry forest used is rathersmall, and there is no significant difference between the deviations of dif-ferent groups and periods. This means that bonobos constantly used bothdry forest and the other types of forest on most of the observation days,irrespective of any differences between groups or between periods.
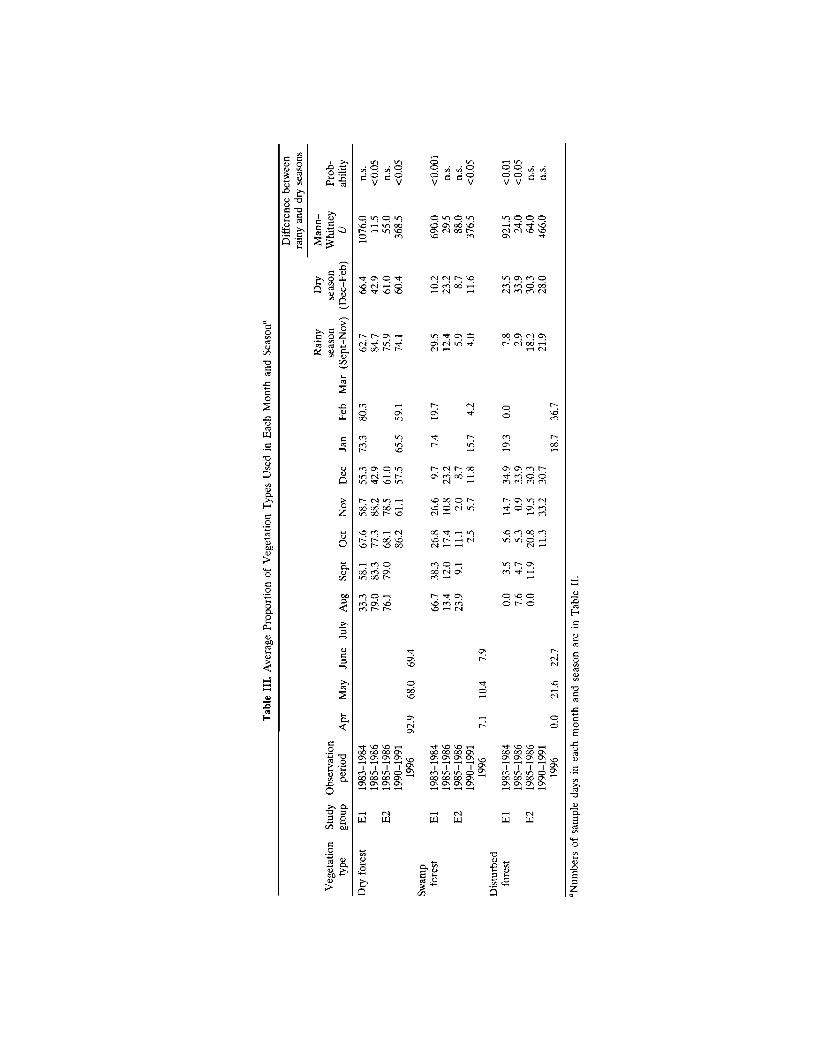
Table III shows the average proportion of vegetation types used ineach month. Although the proportions differ from month to month, thereseems to be no consistent seasonal difference in monthly use of the dif-ferent vegetation types. When the data are pooled for seasons differencesare apparent. Bonobos used dry forest more frequently in the rainy seasonand disturbed forest more frequently in the dry season, though in bothcases the difference is statistically significant in only 2 of 4 comparabledata sets. Conversely, there is no consistent difference in the use of swampforest between the rainy and the dry seasons.
DISCUSSION
The application of Landsat data to surveys of vegetation types oftenintroduces problems. First, the different combinations TM bands can yieldmany kinds of pictures, which suggest different vegetation maps. However,in our study three types of vegetation—dry, swamp, and disturbed forest—were easily distinguished in many combinations of TM bands, and their
Habitat Use and Ranging of Bonobos 1057
distributions agreed with our knowledge of the vegetation and with thevegetation map of Kano and Mulavwa (1984). Another potential problemis that the sunny and shadowed sides of slopes tend to appear as differentcolors, which makes it difficult to distinguish between vegetation types.However, this problem did not arise for the study area, which is situatedin a very flat tropical forest.
Nevertheless, the use of Landsat data has its limitations. It was im-possible to reliably distinguish between the primary forest and the old sec-ondary forest, which comprised the dry forest category, or between thecultivated fields and the young secondary forest, which made up the dis-turbed forest. However, to make a more detailed vegetation map for sucha wide area by actually surveying vegetation on the ground would be pro-hibitively time-consuming. Instead, breaking it down into 3 basic vegetationtypes provided valuable information for the analysis of habitat use.
The home ranges of the study groups changed noticeably from yearto year, probably due to social relationships with other neighboring groups.During the group split, both El and E2 expanded their home ranges intoformerly unused areas, then settled into new home ranges after severalyears. An interesting trend is that the population density of El was lowerduring a period of population increase than during periods when the popu-lation was stable or decreasing (Furuichi et al., 1998).
In spite of dynamic changes in home range, the home range of bothstudy groups in each period contained fairly stable proportions of dry,swamp, and disturbed forests. Dry forest comprised the largest proportionof the home range, and it was most frequently used in daily ranging. Manyfavored fruit-providing food plants, such as Pancovia laurentii, Landolphiaspp., and Dialium spp., occur in dry forest. The tendency of bonobos tosleep in dry forest might also have contributed to the high proportion ofits use (Kano, 1992; Idani et al., 1994).
Swamp and disturbed forests were also consistently used by the studygroups. Both of them provide abundant terrestrial herbaceous food (Idaniet al., 1994), which may be an important source of protein for bonobos,and one which is available throughout the year (Malenky and Stiles, 1991).Swamp and disturbed forests probably play an indispensable role in con-tributing to the bonobos' diet, even though they are used less often thandry forest.
We have shown that dry forest was used more frequently in the rainyseason than in the dry season, though this tendency was not clear in bothgroups in study periods. Such seasonality seemed to appear because thebonobos' favorite fruits were available in the rainy season more than inthe dry season. However, some favorite fruits, such as Pancovia laurentii,occur during the dry season (Kano and Mulavwa, 1984). Furthermore, fruit-
1058 Hashimoto et al.
ing of food trees varied substantially from year to year. These factors mayexplain why the difference between the rainy and dry seasons was not al-ways clear.
Bonobos use both dry forest and swamp or disturbed forest on a daily,seasonal, and yearly basis. The combination of the 3 vegetation types maycontribute to the overall stability in the availability of food resources.Hashimoto (1995) reported that a patchy distribution of secondary forestwithin a primary forest favored a high density of chimpanzees in the Ka-linzu Forest, Uganda. The combination of different types of vegetation mayalso favor a high density of bonobos at Wamba (Kano, 1992; Idani et al.,1994).
ACKNOWLEDGMENTS
We thank Drs. Takayoshi Kano and Toshisada Nishida and CREF ofDemocratic Republic of the Congo for their continuous support for ourstudy. We thank Dr. Hiroshi Ihobe and members of the Laboratory of Hu-man Evolution Studies and the Primate Research Institute, Kyoto Univer-sity, for providing valuable comments and discussion. We thank Mr.Nkoy-Batolumbo and other people of Wamba for their much appreciatedhelp with the field work. We thank Dr. Frances White for giving us thechance to present this paper at the 1996 IPS/ASP Congress. This study wasfinancially supported by grants under the Monbusho International ScientificResearch Program to Drs. T. Kano and T. Nishida (Nos. 60041020,61043017, and 63041078).
REFERENCES
Elsacker, L. V. (1995). A review of terminology on aggregation patterns in bonobos (Panpaniscus). Int. J. Primatol. 16: 37-52.
Furuichi, T. (1987). Sexual swelling, receptivity, and grouping of wild pygmy chimpanzeefemales at Wamba, Zaire. Primates 28: 309-318.
Furuichi, T., Idani, G., Ihobe, H., Kuroda, S., Kitamura, K., Mori, A., Enomoto, T., Okayasu,N., Hashimoto, C., and Kano, T. (1998). Population dynamics of wild bonobos (Panpaniscus) at Wamba. Int. J. Primatol. 19: 1029-1043.
Hashimoto, C. (1995). Population census of the chimpanzees in the Kalinzu Forest, Uganda:comparison between methods with nest counts. Primates 36: 477-488.
Idani, G., Kuroda, S., Kano, T., and Asato, R. (1994). Flora and vegetation of Wamba forest,central Zaire with reference to bonobo (Pan paniscus) foods. Tropics 3: 309-332.
Ihobe, H (1992). Male-male relationships among wild bonobos (Pan paniscus) at Wamba,Republic of Zaire. Primates 33: 163-179.
Kano, T., and Mulavwa, M. (1984). Feeding ecology of the pygmy chimpanzees (Pan paniscus)of Wamba. In Susman, R. L. (ed.), The Pygmy Chimpanzee, Plenum Press, New York,pp. 233-274.
Habitat Use and Ranging of Bonobos 1059
Kano, T. (1992). The Last Ape: Pygmy Chimpanzee Behavior and Ecology, Stanford UniversityPress, Stanford, CA.
Kitamura, K. (1983). Pygmy chimpanzee association patterns in ranging. Primates 24: 1-12.Kuroda, S. (1979). Grouping of the pygmy chimpanzees. Primates 20: 161-183.Malenky, R. K., and Stiles, E. W. (1991). Distribution of terrestrial herbaceous vegetation
and its consumption by Pan paniscus in the Lomako Forest, Zaire. Am. J. Primatol. 23:153-169.
Malenky, R. K., Kuroda, S., Vineberg, E. O., and Wrangham, R. W. (1994). The significanceof terrestrial herbaceous foods for bonobos, chimpanzees, and gorillas. In Wrangham, R.W., McGrew, W. C., de Waal, F. B. M., and Heltne, P. G. (eds.), Chimpanzee Cultures,Harvard University Press, Cambridge, MA, and London, pp. 59-75.
White, F. J. (1988). Party composition and dynamics in Pan paniscus. Int. J. Primatol. 9:179-193.
Wrangham, R. W. (1986). Ecology and social relationships in two species of chimpanzee. InRubenstein, D. L., and Wrangham, R. W. (eds.), Ecological Aspects of Social Evolution,Princeton University Press, Princeton, NJ, pp. 352-378.
1060 Hashimoto et al.