Embed Size (px)
Citation preview
arX
iv:a
stro
-ph/
0601
376v
1 1
7 Ja
n 20
06
Mon. Not. R. Astron. Soc. 000, 1–17 (2005) Printed 19 January 2014 (MN LATEX style file v2.2)
Hα Kinematics of the SINGS Nearby Galaxies Survey. I⋆
O. Daigle1,5†, C. Carignan1,5, P. Amram2,5, O. Hernandez1,2,5, L. Chemin1,
C. Balkowski3,5 and R. Kennicutt4
1Observatoire du mont Megantic, LAE, Universite de Montreal, C. P. 6128 succ. centre ville, Montreal, Quebec, Canada H3C 3J7.2Observatoire Astronomique de Marseille Provence, Laboratoire d’Astrophysique de Marseille, 2 place Le Verrier, F-13248 Marseille
Cedex 04, France.3Observatoire de Paris, section Meudon, GEPI, CNRS UMR 8111 et Universite Paris 7, 5 place J. Janssen, 92195 Meudon Cedex,
France.4Department of Astronomy, Steward Observatory, 933 N. Cherry Ave., Tucson, AZ 85721-0065, USA.5Visiting Astronomer, Canada–France–Hawaii Telescope, operated by the National Research Council of Canada, the Centre National
de la Recherche Scientifique de France, and the University of Hawaii.
Accepted . Received ; in original form
ABSTRACT
This is the first part of an Hα kinematics follow-up survey of the SINGS sample.The data for 28 galaxies are presented. The observations were done on three differenttelescopes with FaNTOmM, an integral field photon counting spectrometer, installed inthe respective focal reducer of each telescope. The data reduction was done through anewly built pipeline with the aim of producing the most homogenous data set possible.Adaptive spatial binning was applied to the data cubes in order to get a constantsignal-to-noise ratio across the field of view. Radial velocity and monochromatic mapswere generated using a new algorithm and the kinematical parameters were derivedusing tilted-ring models.
Key words: galaxies: kinematics and dynamics − methods: observational. − tech-niques: radial velocities.
1 INTRODUCTION
The Legacy survey SINGS (Spitzer Infrared Nearby Galax-ies Survey) wants to characterise the infrared emission acrossthe entire range of galaxy properties and star formation en-vironments, including regions that until now have been in-accessible at infrared wavelengths (Kennicutt et al., 2003).SINGS will provide:
• new insights into the physical processes connecting starformation to the ISM properties of galaxies;
• a vital foundation of data, diagnostic tools, and astro-physical inputs for understanding SPITZER observations ofthe distant universe and ultraluminous and active galaxies;
• an archive that integrates visible/UV andIR/submillimeter studies into a coherent self-consistent
⋆ Based on observations collected at the European Southern Ob-servatory, La Silla, Chile.† E-mail: [email protected]
whole, and enables many follow-up investigations of starformation and of the ISM.
The SPITZER observations will provide images in 7 dif-ferent bands from 3.6µm to 160µm and spectroscopic data atmedium and low resolution in the range 5–95µm . These datawill be used to trace the distribution and content of differentdust components, from the PAHs and very small grains inthe mid-IR, to the big grains in the far-IR (del Burgo et al.2003, Kennicutt et al. 2003). Ancillary multiwavelength ob-servations will provide images in X-rays, UV (1300–2800 Aimaging and spectrophotometry), BVRIJHK, Hα, Paα, FIR,submillimeter, CO and HI. A total of 20 ground- and space-based telescopes are providing supporting data.
These data will help understand the process of star for-mation and feedback mechanisms that are fundamental pa-rameters regulating the formation and evolution of galax-ies. History of star formation has been strongly differentfor galaxies of different morphological type and luminosity.While short events of star formation, probably triggered byviolent merging, formed most stars in elliptical galaxies, late-
c© 2005 RAS
2 O. Daigle et al.
type systems seem to have their star formation modulatedby the angular momentum (Sandage, 1986) or by the massof the initial system (Boselli, 2001). The process of star for-mation and feedback must thus be clearly understood in or-der to understand galaxies’ evolution. However, these phys-ical processes are still poorly known. The primordial atomicgas has to condense into molecular clouds to form stars.The newly formed stars inject metals into the interstellarmedium via stellar winds, heat the dust and ionise the sur-rounding gas. It seems that the activity of star formation isregulated by the total gas surface density (Kennicutt, 1989),but it is still unclear what is the role of rotation in this pro-cess.
Even as important as it seems, no gathering of opti-cal kinematical data was planned for the SINGS galaxies.This paper, by providing the Hα kinematics over the wholeoptical extent for 28 galaxies of the SINGS sample, wantsto make up for this lack. A total of 58 SINGS galaxies arepotentially observable in the Hα emission line (see section2.1). The Hα kinematics of the 30 remaining galaxies of theobservable part of the sample will be published in a forth-coming paper. These data were obtained with FaNTOmM onthree different telescopes (see section 2.3). FaNTOmM is an in-tegral field spectrometer made of a photon-counting camerausing a third generation photo-cathode, a scanning Fabry-Perot (FP) and a narrow-band interference filter. FaNTOmMwas coupled to the focal reducer of the telescopes used. Thephoto-cathode used has a high quantum efficiency (∼ 30%at Hα). This camera enables one to scan rapidly (∼ 5–10minutes) the FP Free Spectral Range (FSR) and to cyclemany times during an observation, thus averaging chang-ing photometrical conditions, as compared to CCD obser-vations where scanning must be done slowly to overcomethe readout noise (details about the camera can be foundin Hernandez et al., 2003 and Gach et al., 2002). In this pa-per, section 2 gives an overview of the observational cam-paign and of the galaxies studied. Section 3 discusses howthe data were reduced, processed and how the kinematicaldata and parameters were extracted. Section 4 provides allthe maps extracted from the work done in section 3. Section5 discusses the advantages of FP kinematical data as com-pared to other kinematical data. A short appendix is addedto comment the observational characteristics of the galaxiespresented. Once completed, the data set will be availablein the SINGS database, as for the other SINGS ancillarysurveys.
2 OBSERVATIONS
2.1 The sample
The SINGS sample as defined by Kennicutt et al. (2003) iscomposed of 75 nearby (∆ < 30 Mpc, median of 9.5 Mpc,for H0 = 70 kms−1 Mpc−1) galaxies, covering a wide rangein a 3D parameter space of physical properties:
• morphological type (E to Im), which is also correlatedwith the Star Formation Rate (SFR) per unit mass, gasfraction and bulge/disk ratio;
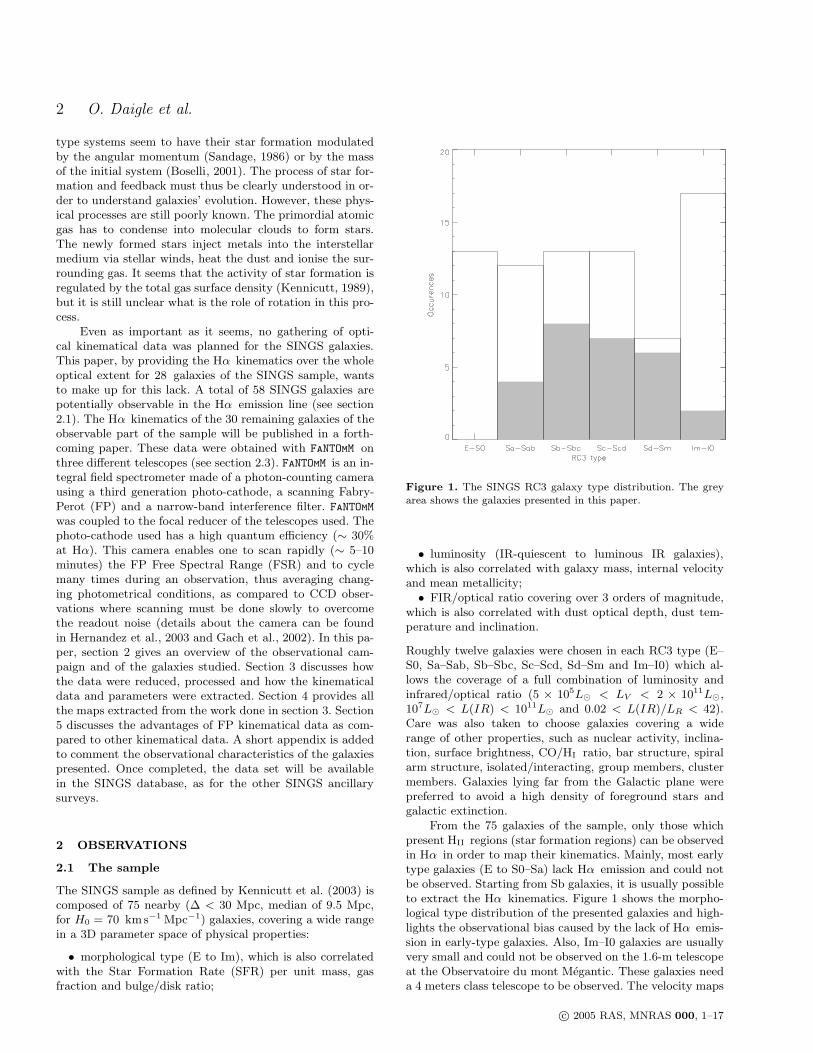
Figure 1. The SINGS RC3 galaxy type distribution. The greyarea shows the galaxies presented in this paper.
• luminosity (IR-quiescent to luminous IR galaxies),which is also correlated with galaxy mass, internal velocityand mean metallicity;
• FIR/optical ratio covering over 3 orders of magnitude,which is also correlated with dust optical depth, dust tem-perature and inclination.
Roughly twelve galaxies were chosen in each RC3 type (E–S0, Sa–Sab, Sb–Sbc, Sc–Scd, Sd–Sm and Im–I0) which al-lows the coverage of a full combination of luminosity andinfrared/optical ratio (5 × 10⁵L⊙ < LV < 2 × 10¹¹L⊙,107L⊙ < L(IR) < 1011L⊙ and 0.02 < L(IR)/LR < 42).Care was also taken to choose galaxies covering a widerange of other properties, such as nuclear activity, inclina-tion, surface brightness, CO/HI ratio, bar structure, spiralarm structure, isolated/interacting, group members, clustermembers. Galaxies lying far from the Galactic plane werepreferred to avoid a high density of foreground stars andgalactic extinction.
From the 75 galaxies of the sample, only those whichpresent HII regions (star formation regions) can be observedin Hα in order to map their kinematics. Mainly, most earlytype galaxies (E to S0–Sa) lack Hα emission and could notbe observed. Starting from Sb galaxies, it is usually possibleto extract the Hα kinematics. Figure 1 shows the morpho-logical type distribution of the presented galaxies and high-lights the observational bias caused by the lack of Hα emis-sion in early-type galaxies. Also, Im–I0 galaxies are usuallyvery small and could not be observed on the 1.6-m telescopeat the Observatoire du mont Megantic. These galaxies needa 4 meters class telescope to be observed. The velocity maps
c© 2005 RAS, MNRAS 000, 1–17
Hα Kinematics of the SINGS Nearby Galaxies Survey. I 3
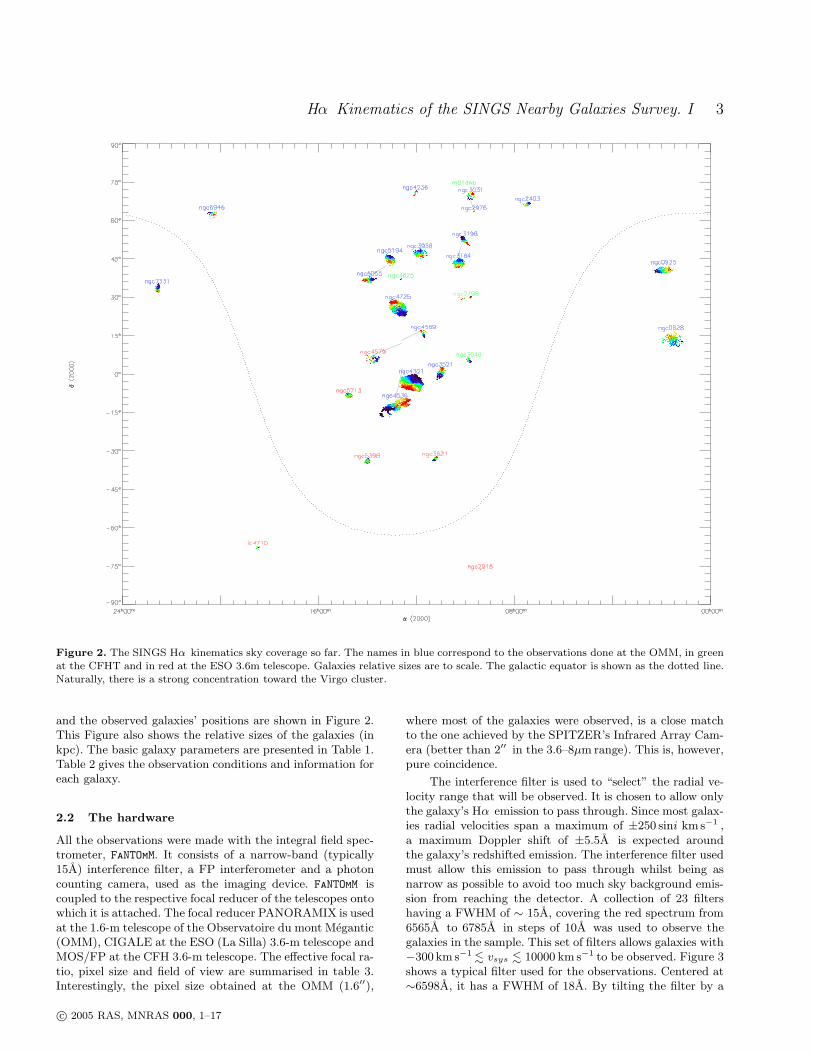
Figure 2. The SINGS Hα kinematics sky coverage so far. The names in blue correspond to the observations done at the OMM, in greenat the CFHT and in red at the ESO 3.6m telescope. Galaxies relative sizes are to scale. The galactic equator is shown as the dotted line.Naturally, there is a strong concentration toward the Virgo cluster.
and the observed galaxies’ positions are shown in Figure 2.This Figure also shows the relative sizes of the galaxies (inkpc). The basic galaxy parameters are presented in Table 1.Table 2 gives the observation conditions and information foreach galaxy.
2.2 The hardware
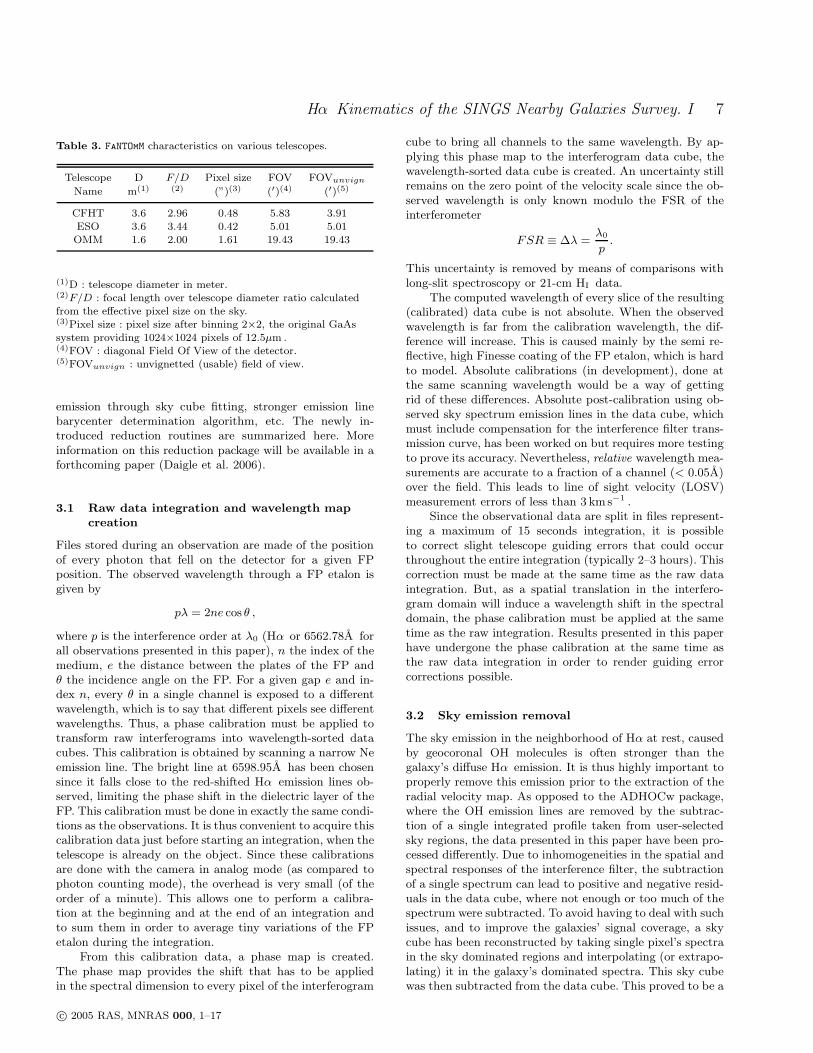
All the observations were made with the integral field spec-trometer, FaNTOmM. It consists of a narrow-band (typically15A) interference filter, a FP interferometer and a photoncounting camera, used as the imaging device. FaNTOmM iscoupled to the respective focal reducer of the telescopes ontowhich it is attached. The focal reducer PANORAMIX is usedat the 1.6-m telescope of the Observatoire du mont Megantic(OMM), CIGALE at the ESO (La Silla) 3.6-m telescope andMOS/FP at the CFH 3.6-m telescope. The effective focal ra-tio, pixel size and field of view are summarised in table 3.Interestingly, the pixel size obtained at the OMM (1.6′′),
where most of the galaxies were observed, is a close matchto the one achieved by the SPITZER’s Infrared Array Cam-era (better than 2′′ in the 3.6–8µm range). This is, however,pure coincidence.
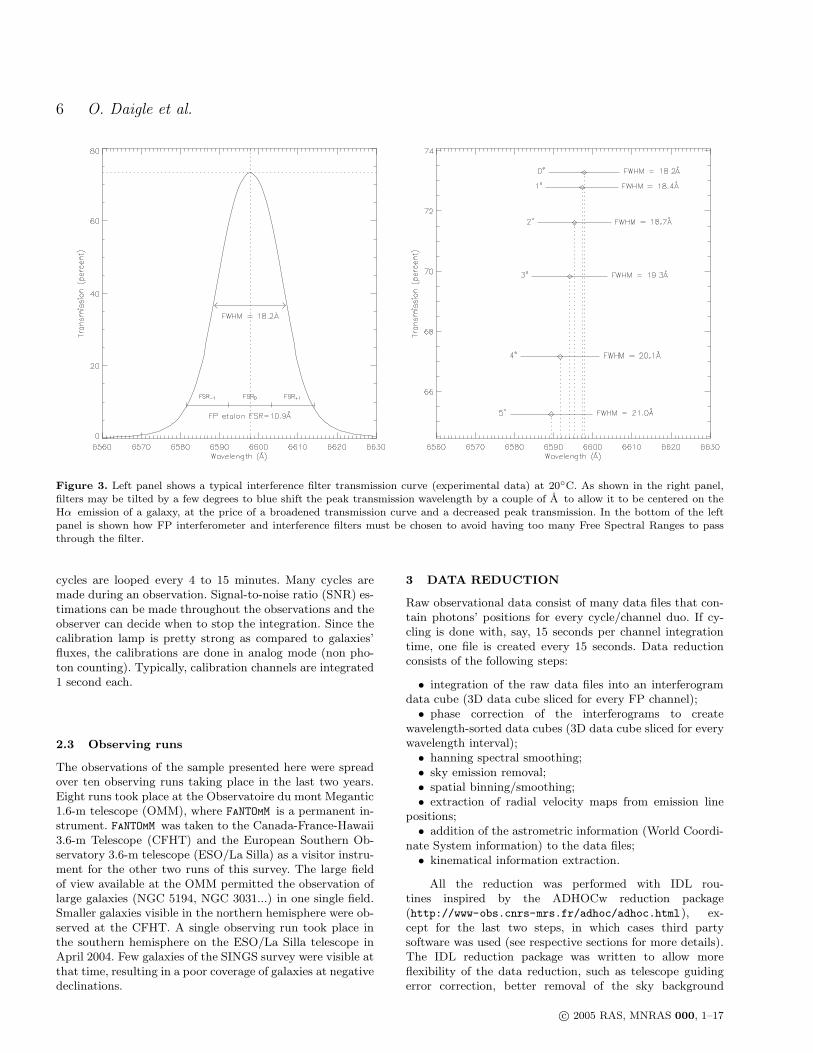
The interference filter is used to “select” the radial ve-locity range that will be observed. It is chosen to allow onlythe galaxy’s Hα emission to pass through. Since most galax-ies radial velocities span a maximum of ±250 sini kms−1 ,a maximum Doppler shift of ±5.5A is expected aroundthe galaxy’s redshifted emission. The interference filter usedmust allow this emission to pass through whilst being asnarrow as possible to avoid too much sky background emis-sion from reaching the detector. A collection of 23 filtershaving a FWHM of ∼ 15A, covering the red spectrum from6565A to 6785A in steps of 10A was used to observe thegalaxies in the sample. This set of filters allows galaxies with−300 km s−1 . vsys . 10000 km s−1 to be observed. Figure 3shows a typical filter used for the observations. Centered at∼6598A, it has a FWHM of 18A. By tilting the filter by a
c© 2005 RAS, MNRAS 000, 1–17
4 O. Daigle et al.
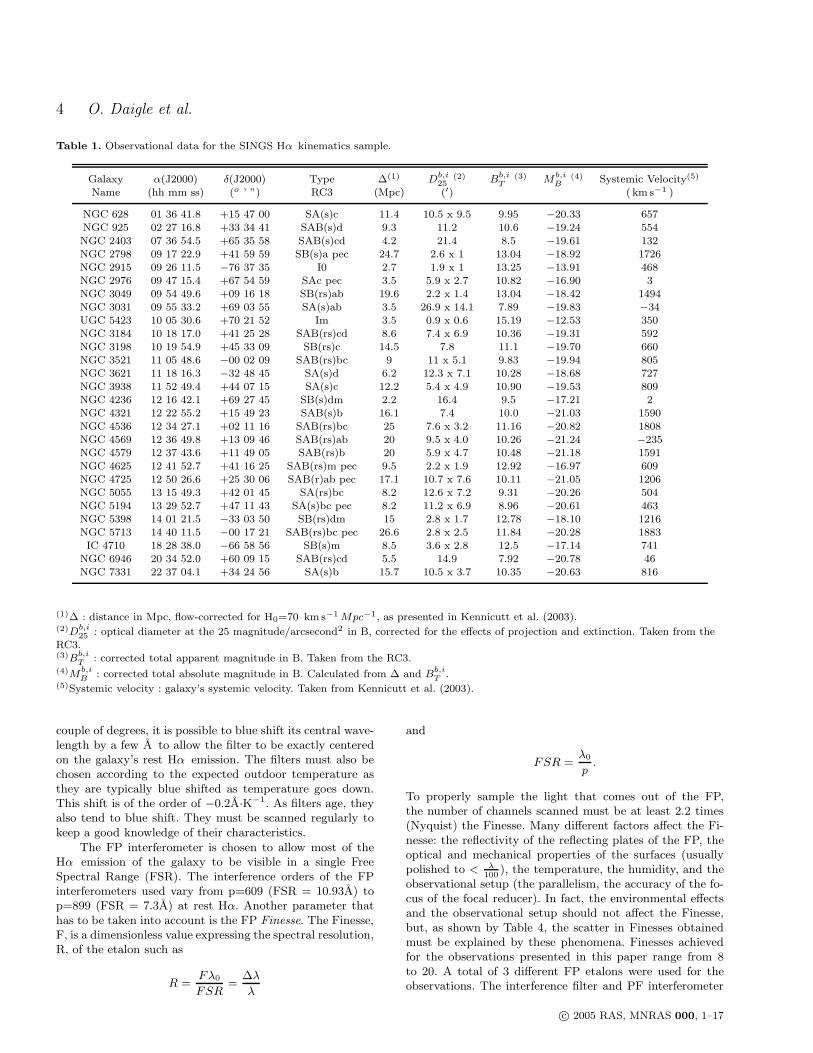
Table 1. Observational data for the SINGS Hα kinematics sample.
Galaxy α(J2000) δ(J2000) Type ∆(1) Db,i25
(2) Bb,iT
(3) Mb,iB
(4) Systemic Velocity(5)
Name (hh mm ss) (o ’ ”) RC3 (Mpc) (′) ( km s−1 )
NGC 628 01 36 41.8 +15 47 00 SA(s)c 11.4 10.5 x 9.5 9.95 −20.33 657NGC 925 02 27 16.8 +33 34 41 SAB(s)d 9.3 11.2 10.6 −19.24 554
NGC 2403 07 36 54.5 +65 35 58 SAB(s)cd 4.2 21.4 8.5 −19.61 132NGC 2798 09 17 22.9 +41 59 59 SB(s)a pec 24.7 2.6 x 1 13.04 −18.92 1726NGC 2915 09 26 11.5 −76 37 35 I0 2.7 1.9 x 1 13.25 −13.91 468NGC 2976 09 47 15.4 +67 54 59 SAc pec 3.5 5.9 x 2.7 10.82 −16.90 3NGC 3049 09 54 49.6 +09 16 18 SB(rs)ab 19.6 2.2 x 1.4 13.04 −18.42 1494NGC 3031 09 55 33.2 +69 03 55 SA(s)ab 3.5 26.9 x 14.1 7.89 −19.83 −34UGC 5423 10 05 30.6 +70 21 52 Im 3.5 0.9 x 0.6 15.19 −12.53 350NGC 3184 10 18 17.0 +41 25 28 SAB(rs)cd 8.6 7.4 x 6.9 10.36 −19.31 592NGC 3198 10 19 54.9 +45 33 09 SB(rs)c 14.5 7.8 11.1 −19.70 660NGC 3521 11 05 48.6 −00 02 09 SAB(rs)bc 9 11 x 5.1 9.83 −19.94 805NGC 3621 11 18 16.3 −32 48 45 SA(s)d 6.2 12.3 x 7.1 10.28 −18.68 727NGC 3938 11 52 49.4 +44 07 15 SA(s)c 12.2 5.4 x 4.9 10.90 −19.53 809NGC 4236 12 16 42.1 +69 27 45 SB(s)dm 2.2 16.4 9.5 −17.21 2NGC 4321 12 22 55.2 +15 49 23 SAB(s)b 16.1 7.4 10.0 −21.03 1590NGC 4536 12 34 27.1 +02 11 16 SAB(rs)bc 25 7.6 x 3.2 11.16 −20.82 1808NGC 4569 12 36 49.8 +13 09 46 SAB(rs)ab 20 9.5 x 4.0 10.26 −21.24 −235NGC 4579 12 37 43.6 +11 49 05 SAB(rs)b 20 5.9 x 4.7 10.48 −21.18 1591NGC 4625 12 41 52.7 +41 16 25 SAB(rs)m pec 9.5 2.2 x 1.9 12.92 −16.97 609NGC 4725 12 50 26.6 +25 30 06 SAB(r)ab pec 17.1 10.7 x 7.6 10.11 −21.05 1206NGC 5055 13 15 49.3 +42 01 45 SA(rs)bc 8.2 12.6 x 7.2 9.31 −20.26 504NGC 5194 13 29 52.7 +47 11 43 SA(s)bc pec 8.2 11.2 x 6.9 8.96 −20.61 463NGC 5398 14 01 21.5 −33 03 50 SB(rs)dm 15 2.8 x 1.7 12.78 −18.10 1216NGC 5713 14 40 11.5 −00 17 21 SAB(rs)bc pec 26.6 2.8 x 2.5 11.84 −20.28 1883IC 4710 18 28 38.0 −66 58 56 SB(s)m 8.5 3.6 x 2.8 12.5 −17.14 741
NGC 6946 20 34 52.0 +60 09 15 SAB(rs)cd 5.5 14.9 7.92 −20.78 46NGC 7331 22 37 04.1 +34 24 56 SA(s)b 15.7 10.5 x 3.7 10.35 −20.63 816
(1)∆ : distance in Mpc, flow-corrected for H0=70 km s−1 Mpc−1, as presented in Kennicutt et al. (2003).(2)Db,i
25 : optical diameter at the 25 magnitude/arcsecond2 in B, corrected for the effects of projection and extinction. Taken from theRC3.(3)Bb,i
T: corrected total apparent magnitude in B. Taken from the RC3.
(4)Mb,iB
: corrected total absolute magnitude in B. Calculated from ∆ and Bb,iT
.(5)Systemic velocity : galaxy’s systemic velocity. Taken from Kennicutt et al. (2003).
couple of degrees, it is possible to blue shift its central wave-length by a few A to allow the filter to be exactly centeredon the galaxy’s rest Hα emission. The filters must also bechosen according to the expected outdoor temperature asthey are typically blue shifted as temperature goes down.This shift is of the order of −0.2A·K−1. As filters age, theyalso tend to blue shift. They must be scanned regularly tokeep a good knowledge of their characteristics.
The FP interferometer is chosen to allow most of theHα emission of the galaxy to be visible in a single FreeSpectral Range (FSR). The interference orders of the FPinterferometers used vary from p=609 (FSR = 10.93A) top=899 (FSR = 7.3A) at rest Hα. Another parameter thathas to be taken into account is the FP Finesse. The Finesse,F, is a dimensionless value expressing the spectral resolution,R, of the etalon such as
R =Fλ0
FSR=
∆λ
λ
and
FSR =λ0
p.
To properly sample the light that comes out of the FP,the number of channels scanned must be at least 2.2 times(Nyquist) the Finesse. Many different factors affect the Fi-nesse: the reflectivity of the reflecting plates of the FP, theoptical and mechanical properties of the surfaces (usuallypolished to < λ
100), the temperature, the humidity, and the
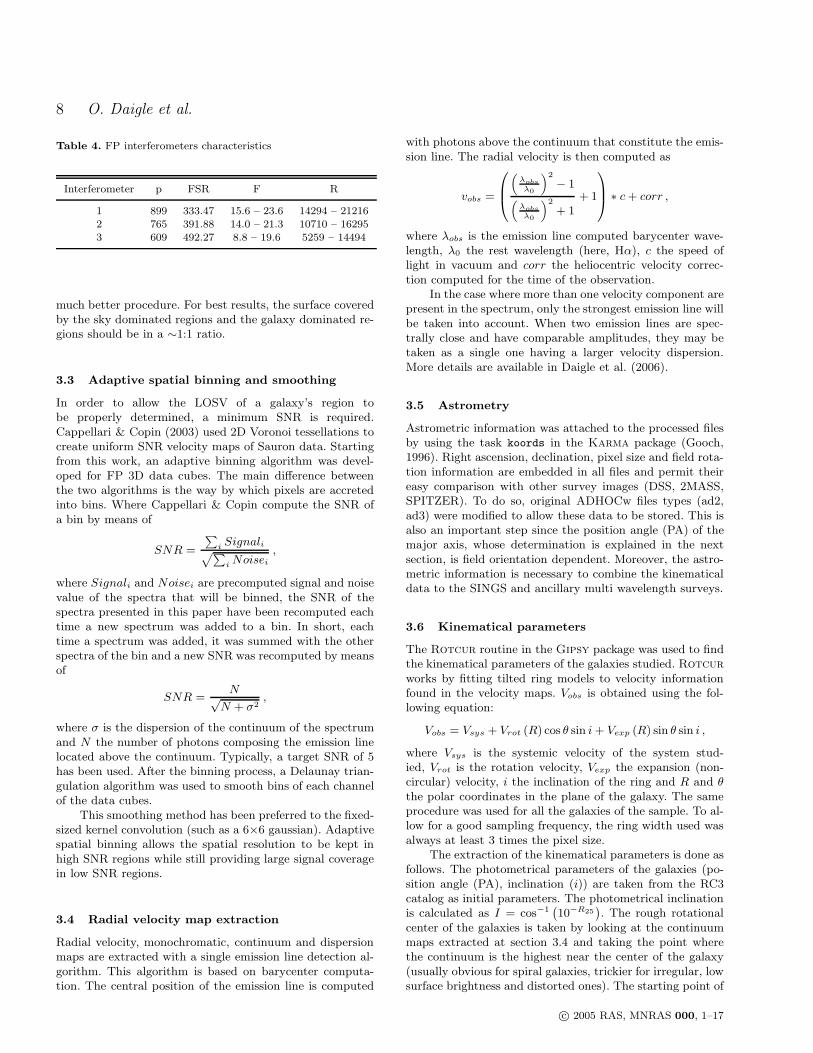
observational setup (the parallelism, the accuracy of the fo-cus of the focal reducer). In fact, the environmental effectsand the observational setup should not affect the Finesse,but, as shown by Table 4, the scatter in Finesses obtainedmust be explained by these phenomena. Finesses achievedfor the observations presented in this paper range from 8to 20. A total of 3 different FP etalons were used for theobservations. The interference filter and PF interferometer
c© 2005 RAS, MNRAS 000, 1–17
Hα Kinematics of the SINGS Nearby Galaxies Survey. I 5
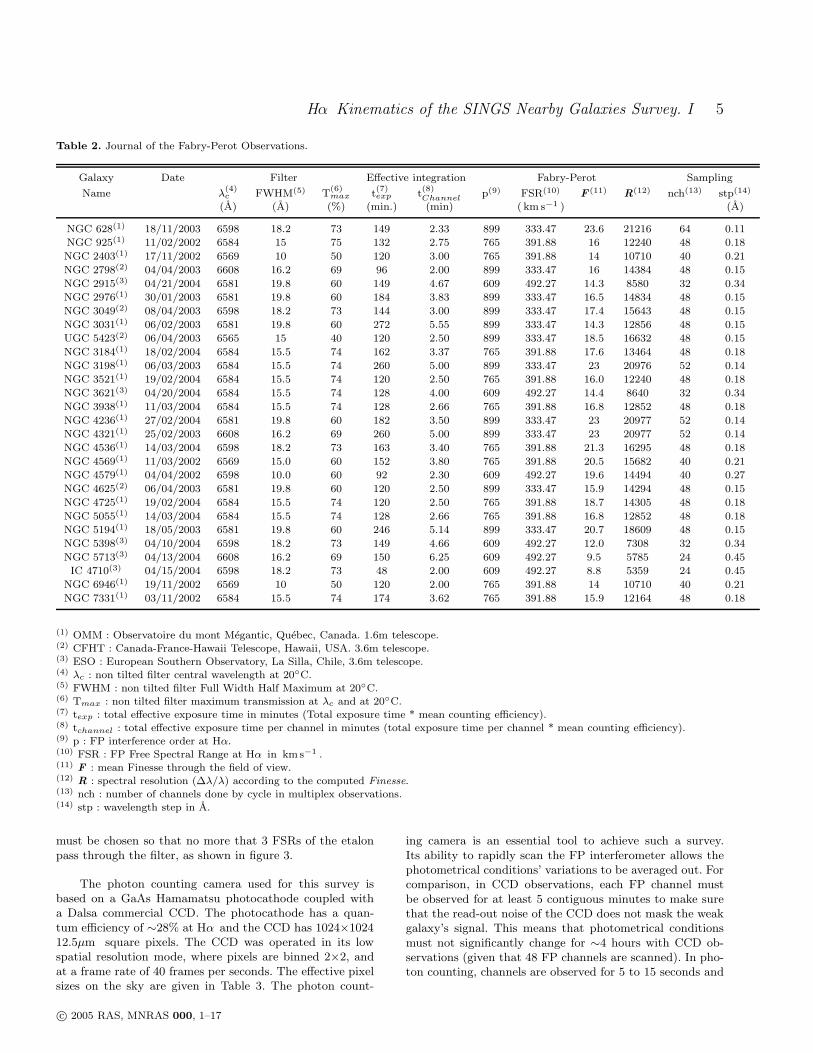
Table 2. Journal of the Fabry-Perot Observations.
Galaxy Date Filter Effective integration Fabry-Perot Sampling
Name λ(4)c FWHM(5) T
(6)max t
(7)exp t
(8)Channel
p(9) FSR(10) F (11) R(12) nch(13) stp(14)
(A) (A) (%) (min.) (min) ( km s−1 ) (A)
NGC 628(1) 18/11/2003 6598 18.2 73 149 2.33 899 333.47 23.6 21216 64 0.11
NGC 925(1) 11/02/2002 6584 15 75 132 2.75 765 391.88 16 12240 48 0.18
NGC 2403(1) 17/11/2002 6569 10 50 120 3.00 765 391.88 14 10710 40 0.21
NGC 2798(2) 04/04/2003 6608 16.2 69 96 2.00 899 333.47 16 14384 48 0.15
NGC 2915(3) 04/21/2004 6581 19.8 60 149 4.67 609 492.27 14.3 8580 32 0.34
NGC 2976(1) 30/01/2003 6581 19.8 60 184 3.83 899 333.47 16.5 14834 48 0.15
NGC 3049(2) 08/04/2003 6598 18.2 73 144 3.00 899 333.47 17.4 15643 48 0.15
NGC 3031(1) 06/02/2003 6581 19.8 60 272 5.55 899 333.47 14.3 12856 48 0.15
UGC 5423(2) 06/04/2003 6565 15 40 120 2.50 899 333.47 18.5 16632 48 0.15
NGC 3184(1) 18/02/2004 6584 15.5 74 162 3.37 765 391.88 17.6 13464 48 0.18
NGC 3198(1) 06/03/2003 6584 15.5 74 260 5.00 899 333.47 23 20976 52 0.14
NGC 3521(1) 19/02/2004 6584 15.5 74 120 2.50 765 391.88 16.0 12240 48 0.18
NGC 3621(3) 04/20/2004 6584 15.5 74 128 4.00 609 492.27 14.4 8640 32 0.34
NGC 3938(1) 11/03/2004 6584 15.5 74 128 2.66 765 391.88 16.8 12852 48 0.18
NGC 4236(1) 27/02/2004 6581 19.8 60 182 3.50 899 333.47 23 20977 52 0.14
NGC 4321(1) 25/02/2003 6608 16.2 69 260 5.00 899 333.47 23 20977 52 0.14
NGC 4536(1) 14/03/2004 6598 18.2 73 163 3.40 765 391.88 21.3 16295 48 0.18
NGC 4569(1) 11/03/2002 6569 15.0 60 152 3.80 765 391.88 20.5 15682 40 0.21
NGC 4579(1) 04/04/2002 6598 10.0 60 92 2.30 609 492.27 19.6 14494 40 0.27
NGC 4625(2) 06/04/2003 6581 19.8 60 120 2.50 899 333.47 15.9 14294 48 0.15
NGC 4725(1) 19/02/2004 6584 15.5 74 120 2.50 765 391.88 18.7 14305 48 0.18
NGC 5055(1) 14/03/2004 6584 15.5 74 128 2.66 765 391.88 16.8 12852 48 0.18
NGC 5194(1) 18/05/2003 6581 19.8 60 246 5.14 899 333.47 20.7 18609 48 0.15
NGC 5398(3) 04/10/2004 6598 18.2 73 149 4.66 609 492.27 12.0 7308 32 0.34
NGC 5713(3) 04/13/2004 6608 16.2 69 150 6.25 609 492.27 9.5 5785 24 0.45
IC 4710(3) 04/15/2004 6598 18.2 73 48 2.00 609 492.27 8.8 5359 24 0.45
NGC 6946(1) 19/11/2002 6569 10 50 120 2.00 765 391.88 14 10710 40 0.21
NGC 7331(1) 03/11/2002 6584 15.5 74 174 3.62 765 391.88 15.9 12164 48 0.18
(1) OMM : Observatoire du mont Megantic, Quebec, Canada. 1.6m telescope.(2) CFHT : Canada-France-Hawaii Telescope, Hawaii, USA. 3.6m telescope.(3) ESO : European Southern Observatory, La Silla, Chile, 3.6m telescope.(4) λc : non tilted filter central wavelength at 20◦C.(5) FWHM : non tilted filter Full Width Half Maximum at 20◦C.(6) Tmax : non tilted filter maximum transmission at λc and at 20◦C.(7) texp : total effective exposure time in minutes (Total exposure time * mean counting efficiency).(8) tchannel : total effective exposure time per channel in minutes (total exposure time per channel * mean counting efficiency).(9) p : FP interference order at Hα.(10) FSR : FP Free Spectral Range at Hα in km s−1 .(11) F : mean Finesse through the field of view.(12) R : spectral resolution (∆λ/λ) according to the computed Finesse.(13) nch : number of channels done by cycle in multiplex observations.(14) stp : wavelength step in A.
must be chosen so that no more that 3 FSRs of the etalonpass through the filter, as shown in figure 3.
The photon counting camera used for this survey isbased on a GaAs Hamamatsu photocathode coupled witha Dalsa commercial CCD. The photocathode has a quan-tum efficiency of ∼28% at Hα and the CCD has 1024×102412.5µm square pixels. The CCD was operated in its lowspatial resolution mode, where pixels are binned 2×2, andat a frame rate of 40 frames per seconds. The effective pixelsizes on the sky are given in Table 3. The photon count-
ing camera is an essential tool to achieve such a survey.Its ability to rapidly scan the FP interferometer allows thephotometrical conditions’ variations to be averaged out. Forcomparison, in CCD observations, each FP channel mustbe observed for at least 5 contiguous minutes to make surethat the read-out noise of the CCD does not mask the weakgalaxy’s signal. This means that photometrical conditionsmust not significantly change for ∼4 hours with CCD ob-servations (given that 48 FP channels are scanned). In pho-ton counting, channels are observed for 5 to 15 seconds and
c© 2005 RAS, MNRAS 000, 1–17
6 O. Daigle et al.
Figure 3. Left panel shows a typical interference filter transmission curve (experimental data) at 20◦C. As shown in the right panel,filters may be tilted by a few degrees to blue shift the peak transmission wavelength by a couple of A to allow it to be centered on theHα emission of a galaxy, at the price of a broadened transmission curve and a decreased peak transmission. In the bottom of the leftpanel is shown how FP interferometer and interference filters must be chosen to avoid having too many Free Spectral Ranges to passthrough the filter.
cycles are looped every 4 to 15 minutes. Many cycles aremade during an observation. Signal-to-noise ratio (SNR) es-timations can be made throughout the observations and theobserver can decide when to stop the integration. Since thecalibration lamp is pretty strong as compared to galaxies’fluxes, the calibrations are done in analog mode (non pho-ton counting). Typically, calibration channels are integrated1 second each.
2.3 Observing runs
The observations of the sample presented here were spreadover ten observing runs taking place in the last two years.Eight runs took place at the Observatoire du mont Megantic1.6-m telescope (OMM), where FaNTOmM is a permanent in-strument. FaNTOmM was taken to the Canada-France-Hawaii3.6-m Telescope (CFHT) and the European Southern Ob-servatory 3.6-m telescope (ESO/La Silla) as a visitor instru-ment for the other two runs of this survey. The large fieldof view available at the OMM permitted the observation oflarge galaxies (NGC 5194, NGC 3031...) in one single field.Smaller galaxies visible in the northern hemisphere were ob-served at the CFHT. A single observing run took place inthe southern hemisphere on the ESO/La Silla telescope inApril 2004. Few galaxies of the SINGS survey were visible atthat time, resulting in a poor coverage of galaxies at negativedeclinations.
3 DATA REDUCTION
Raw observational data consist of many data files that con-tain photons’ positions for every cycle/channel duo. If cy-cling is done with, say, 15 seconds per channel integrationtime, one file is created every 15 seconds. Data reductionconsists of the following steps:
• integration of the raw data files into an interferogramdata cube (3D data cube sliced for every FP channel);
• phase correction of the interferograms to createwavelength-sorted data cubes (3D data cube sliced for everywavelength interval);
• hanning spectral smoothing;• sky emission removal;• spatial binning/smoothing;• extraction of radial velocity maps from emission line
positions;• addition of the astrometric information (World Coordi-
nate System information) to the data files;• kinematical information extraction.
All the reduction was performed with IDL rou-tines inspired by the ADHOCw reduction package(http://www-obs.cnrs-mrs.fr/adhoc/adhoc.html), ex-cept for the last two steps, in which cases third partysoftware was used (see respective sections for more details).The IDL reduction package was written to allow moreflexibility of the data reduction, such as telescope guidingerror correction, better removal of the sky background
c© 2005 RAS, MNRAS 000, 1–17
Hα Kinematics of the SINGS Nearby Galaxies Survey. I 7
Table 3. FaNTOmM characteristics on various telescopes.
Telescope D F/D Pixel size FOV FOVunvign
Name m(1) (2) (”)(3) (′)(4) (′)(5)
CFHT 3.6 2.96 0.48 5.83 3.91ESO 3.6 3.44 0.42 5.01 5.01OMM 1.6 2.00 1.61 19.43 19.43
(1)D : telescope diameter in meter.(2)F/D : focal length over telescope diameter ratio calculatedfrom the effective pixel size on the sky.(3)Pixel size : pixel size after binning 2×2, the original GaAssystem providing 1024×1024 pixels of 12.5µm .(4)FOV : diagonal Field Of View of the detector.(5)FOVunvign : unvignetted (usable) field of view.
emission through sky cube fitting, stronger emission linebarycenter determination algorithm, etc. The newly in-troduced reduction routines are summarized here. Moreinformation on this reduction package will be available in aforthcoming paper (Daigle et al. 2006).
3.1 Raw data integration and wavelength mapcreation
Files stored during an observation are made of the positionof every photon that fell on the detector for a given FPposition. The observed wavelength through a FP etalon isgiven by
pλ = 2ne cos θ ,
where p is the interference order at λ0 (Hα or 6562.78A forall observations presented in this paper), n the index of themedium, e the distance between the plates of the FP andθ the incidence angle on the FP. For a given gap e and in-dex n, every θ in a single channel is exposed to a differentwavelength, which is to say that different pixels see differentwavelengths. Thus, a phase calibration must be applied totransform raw interferograms into wavelength-sorted datacubes. This calibration is obtained by scanning a narrow Neemission line. The bright line at 6598.95A has been chosensince it falls close to the red-shifted Hα emission lines ob-served, limiting the phase shift in the dielectric layer of theFP. This calibration must be done in exactly the same condi-tions as the observations. It is thus convenient to acquire thiscalibration data just before starting an integration, when thetelescope is already on the object. Since these calibrationsare done with the camera in analog mode (as compared tophoton counting mode), the overhead is very small (of theorder of a minute). This allows one to perform a calibra-tion at the beginning and at the end of an integration andto sum them in order to average tiny variations of the FPetalon during the integration.
From this calibration data, a phase map is created.The phase map provides the shift that has to be appliedin the spectral dimension to every pixel of the interferogram
cube to bring all channels to the same wavelength. By ap-plying this phase map to the interferogram data cube, thewavelength-sorted data cube is created. An uncertainty stillremains on the zero point of the velocity scale since the ob-served wavelength is only known modulo the FSR of theinterferometer
FSR ≡ ∆λ =λ0
p.
This uncertainty is removed by means of comparisons withlong-slit spectroscopy or 21-cm HI data.
The computed wavelength of every slice of the resulting(calibrated) data cube is not absolute. When the observedwavelength is far from the calibration wavelength, the dif-ference will increase. This is caused mainly by the semi re-flective, high Finesse coating of the FP etalon, which is hardto model. Absolute calibrations (in development), done atthe same scanning wavelength would be a way of gettingrid of these differences. Absolute post-calibration using ob-served sky spectrum emission lines in the data cube, whichmust include compensation for the interference filter trans-mission curve, has been worked on but requires more testingto prove its accuracy. Nevertheless, relative wavelength mea-surements are accurate to a fraction of a channel (< 0.05A)over the field. This leads to line of sight velocity (LOSV)measurement errors of less than 3 kms−1 .
Since the observational data are split in files represent-ing a maximum of 15 seconds integration, it is possibleto correct slight telescope guiding errors that could occurthroughout the entire integration (typically 2–3 hours). Thiscorrection must be made at the same time as the raw dataintegration. But, as a spatial translation in the interfero-gram domain will induce a wavelength shift in the spectraldomain, the phase calibration must be applied at the sametime as the raw integration. Results presented in this paperhave undergone the phase calibration at the same time asthe raw data integration in order to render guiding errorcorrections possible.
3.2 Sky emission removal
The sky emission in the neighborhood of Hα at rest, causedby geocoronal OH molecules is often stronger than thegalaxy’s diffuse Hα emission. It is thus highly important toproperly remove this emission prior to the extraction of theradial velocity map. As opposed to the ADHOCw package,where the OH emission lines are removed by the subtrac-tion of a single integrated profile taken from user-selectedsky regions, the data presented in this paper have been pro-cessed differently. Due to inhomogeneities in the spatial andspectral responses of the interference filter, the subtractionof a single spectrum can lead to positive and negative resid-uals in the data cube, where not enough or too much of thespectrum were subtracted. To avoid having to deal with suchissues, and to improve the galaxies’ signal coverage, a skycube has been reconstructed by taking single pixel’s spectrain the sky dominated regions and interpolating (or extrapo-lating) it in the galaxy’s dominated spectra. This sky cubewas then subtracted from the data cube. This proved to be a
c© 2005 RAS, MNRAS 000, 1–17
8 O. Daigle et al.
Table 4. FP interferometers characteristics
Interferometer p FSR F R
1 899 333.47 15.6 – 23.6 14294 – 212162 765 391.88 14.0 – 21.3 10710 – 162953 609 492.27 8.8 – 19.6 5259 – 14494
much better procedure. For best results, the surface coveredby the sky dominated regions and the galaxy dominated re-gions should be in a ∼1:1 ratio.
3.3 Adaptive spatial binning and smoothing
In order to allow the LOSV of a galaxy’s region tobe properly determined, a minimum SNR is required.Cappellari & Copin (2003) used 2D Voronoi tessellations tocreate uniform SNR velocity maps of Sauron data. Startingfrom this work, an adaptive binning algorithm was devel-oped for FP 3D data cubes. The main difference betweenthe two algorithms is the way by which pixels are accretedinto bins. Where Cappellari & Copin compute the SNR ofa bin by means of
SNR =
∑
iSignali
√∑
iNoisei
,
where Signali and Noisei are precomputed signal and noisevalue of the spectra that will be binned, the SNR of thespectra presented in this paper have been recomputed eachtime a new spectrum was added to a bin. In short, eachtime a spectrum was added, it was summed with the otherspectra of the bin and a new SNR was recomputed by meansof
SNR =N√
N + σ2,
where σ is the dispersion of the continuum of the spectrumand N the number of photons composing the emission linelocated above the continuum. Typically, a target SNR of 5has been used. After the binning process, a Delaunay trian-gulation algorithm was used to smooth bins of each channelof the data cubes.
This smoothing method has been preferred to the fixed-sized kernel convolution (such as a 6×6 gaussian). Adaptivespatial binning allows the spatial resolution to be kept inhigh SNR regions while still providing large signal coveragein low SNR regions.
3.4 Radial velocity map extraction
Radial velocity, monochromatic, continuum and dispersionmaps are extracted with a single emission line detection al-gorithm. This algorithm is based on barycenter computa-tion. The central position of the emission line is computed
with photons above the continuum that constitute the emis-sion line. The radial velocity is then computed as
vobs =
(
λobs
λ0
)2
− 1(
λobs
λ0
)2
+ 1+ 1
∗ c + corr ,
where λobs is the emission line computed barycenter wave-length, λ0 the rest wavelength (here, Hα), c the speed oflight in vacuum and corr the heliocentric velocity correc-tion computed for the time of the observation.
In the case where more than one velocity component arepresent in the spectrum, only the strongest emission line willbe taken into account. When two emission lines are spec-trally close and have comparable amplitudes, they may betaken as a single one having a larger velocity dispersion.More details are available in Daigle et al. (2006).
3.5 Astrometry
Astrometric information was attached to the processed filesby using the task koords in the Karma package (Gooch,1996). Right ascension, declination, pixel size and field rota-tion information are embedded in all files and permit theireasy comparison with other survey images (DSS, 2MASS,SPITZER). To do so, original ADHOCw files types (ad2,ad3) were modified to allow these data to be stored. This isalso an important step since the position angle (PA) of themajor axis, whose determination is explained in the nextsection, is field orientation dependent. Moreover, the astro-metric information is necessary to combine the kinematicaldata to the SINGS and ancillary multi wavelength surveys.
3.6 Kinematical parameters
The Rotcur routine in the Gipsy package was used to findthe kinematical parameters of the galaxies studied. Rotcur
works by fitting tilted ring models to velocity informationfound in the velocity maps. Vobs is obtained using the fol-lowing equation:
Vobs = Vsys + Vrot (R) cos θ sin i + Vexp (R) sin θ sin i ,
where Vsys is the systemic velocity of the system stud-ied, Vrot is the rotation velocity, Vexp the expansion (non-circular) velocity, i the inclination of the ring and R and θthe polar coordinates in the plane of the galaxy. The sameprocedure was used for all the galaxies of the sample. To al-low for a good sampling frequency, the ring width used wasalways at least 3 times the pixel size.
The extraction of the kinematical parameters is done asfollows. The photometrical parameters of the galaxies (po-sition angle (PA), inclination (i)) are taken from the RC3catalog as initial parameters. The photometrical inclinationis calculated as I = cos−1
(
10−R25
)
. The rough rotationalcenter of the galaxies is taken by looking at the continuummaps extracted at section 3.4 and taking the point wherethe continuum is the highest near the center of the galaxy(usually obvious for spiral galaxies, trickier for irregular, lowsurface brightness and distorted ones). The starting point of
c© 2005 RAS, MNRAS 000, 1–17
Hα Kinematics of the SINGS Nearby Galaxies Survey. I 9
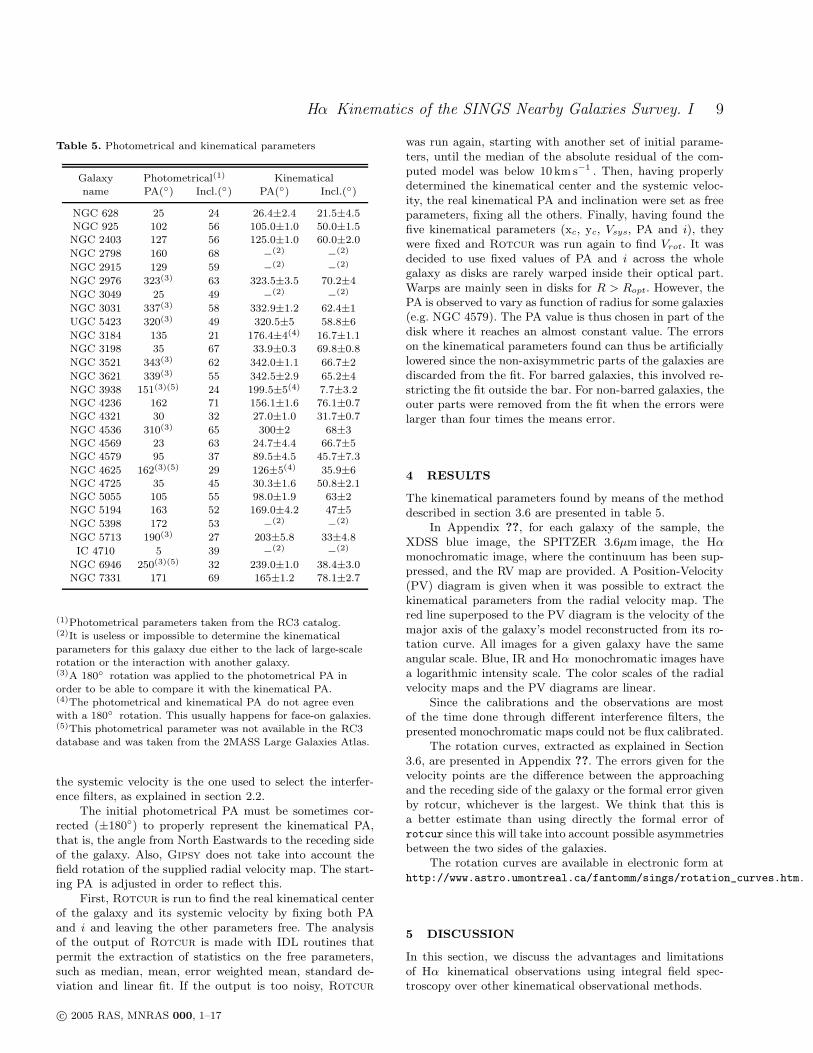
Table 5. Photometrical and kinematical parameters
Galaxy Photometrical(1) Kinematicalname PA(◦) Incl.(◦) PA(◦) Incl.(◦)
NGC 628 25 24 26.4±2.4 21.5±4.5NGC 925 102 56 105.0±1.0 50.0±1.5NGC 2403 127 56 125.0±1.0 60.0±2.0
NGC 2798 160 68 −(2) −(2)
NGC 2915 129 59 −(2) −(2)
NGC 2976 323(3) 63 323.5±3.5 70.2±4
NGC 3049 25 49 −(2) −(2)
NGC 3031 337(3) 58 332.9±1.2 62.4±1
UGC 5423 320(3) 49 320.5±5 58.8±6
NGC 3184 135 21 176.4±4(4) 16.7±1.1NGC 3198 35 67 33.9±0.3 69.8±0.8
NGC 3521 343(3) 62 342.0±1.1 66.7±2
NGC 3621 339(3) 55 342.5±2.9 65.2±4
NGC 3938 151(3)(5) 24 199.5±5(4) 7.7±3.2NGC 4236 162 71 156.1±1.6 76.1±0.7NGC 4321 30 32 27.0±1.0 31.7±0.7
NGC 4536 310(3) 65 300±2 68±3NGC 4569 23 63 24.7±4.4 66.7±5NGC 4579 95 37 89.5±4.5 45.7±7.3
NGC 4625 162(3)(5) 29 126±5(4) 35.9±6NGC 4725 35 45 30.3±1.6 50.8±2.1NGC 5055 105 55 98.0±1.9 63±2NGC 5194 163 52 169.0±4.2 47±5
NGC 5398 172 53 −(2) −(2)
NGC 5713 190(3) 27 203±5.8 33±4.8
IC 4710 5 39 −(2) −(2)
NGC 6946 250(3)(5) 32 239.0±1.0 38.4±3.0NGC 7331 171 69 165±1.2 78.1±2.7
(1)Photometrical parameters taken from the RC3 catalog.(2)It is useless or impossible to determine the kinematical
parameters for this galaxy due either to the lack of large-scalerotation or the interaction with another galaxy.(3)A 180◦ rotation was applied to the photometrical PA inorder to be able to compare it with the kinematical PA.(4)The photometrical and kinematical PA do not agree evenwith a 180◦ rotation. This usually happens for face-on galaxies.(5)This photometrical parameter was not available in the RC3database and was taken from the 2MASS Large Galaxies Atlas.
the systemic velocity is the one used to select the interfer-ence filters, as explained in section 2.2.
The initial photometrical PA must be sometimes cor-rected (±180◦) to properly represent the kinematical PA,that is, the angle from North Eastwards to the receding sideof the galaxy. Also, Gipsy does not take into account thefield rotation of the supplied radial velocity map. The start-ing PA is adjusted in order to reflect this.
First, Rotcur is run to find the real kinematical centerof the galaxy and its systemic velocity by fixing both PAand i and leaving the other parameters free. The analysisof the output of Rotcur is made with IDL routines thatpermit the extraction of statistics on the free parameters,such as median, mean, error weighted mean, standard de-viation and linear fit. If the output is too noisy, Rotcur
was run again, starting with another set of initial parame-ters, until the median of the absolute residual of the com-puted model was below 10 km s−1 . Then, having properlydetermined the kinematical center and the systemic veloc-ity, the real kinematical PA and inclination were set as freeparameters, fixing all the others. Finally, having found thefive kinematical parameters (xc, yc, Vsys, PA and i), theywere fixed and Rotcur was run again to find Vrot. It wasdecided to use fixed values of PA and i across the wholegalaxy as disks are rarely warped inside their optical part.Warps are mainly seen in disks for R > Ropt. However, thePA is observed to vary as function of radius for some galaxies(e.g. NGC 4579). The PA value is thus chosen in part of thedisk where it reaches an almost constant value. The errorson the kinematical parameters found can thus be artificiallylowered since the non-axisymmetric parts of the galaxies arediscarded from the fit. For barred galaxies, this involved re-stricting the fit outside the bar. For non-barred galaxies, theouter parts were removed from the fit when the errors werelarger than four times the means error.
4 RESULTS
The kinematical parameters found by means of the methoddescribed in section 3.6 are presented in table 5.
In Appendix ??, for each galaxy of the sample, theXDSS blue image, the SPITZER 3.6µm image, the Hαmonochromatic image, where the continuum has been sup-pressed, and the RV map are provided. A Position-Velocity(PV) diagram is given when it was possible to extract thekinematical parameters from the radial velocity map. Thered line superposed to the PV diagram is the velocity of themajor axis of the galaxy’s model reconstructed from its ro-tation curve. All images for a given galaxy have the sameangular scale. Blue, IR and Hα monochromatic images havea logarithmic intensity scale. The color scales of the radialvelocity maps and the PV diagrams are linear.
Since the calibrations and the observations are mostof the time done through different interference filters, thepresented monochromatic maps could not be flux calibrated.
The rotation curves, extracted as explained in Section3.6, are presented in Appendix ??. The errors given for thevelocity points are the difference between the approachingand the receding side of the galaxy or the formal error givenby rotcur, whichever is the largest. We think that this isa better estimate than using directly the formal error ofrotcur since this will take into account possible asymmetriesbetween the two sides of the galaxies.
The rotation curves are available in electronic form athttp://www.astro.umontreal.ca/fantomm/sings/rotation_curves.htm.
5 DISCUSSION
In this section, we discuss the advantages and limitationsof Hα kinematical observations using integral field spec-troscopy over other kinematical observational methods.
c© 2005 RAS, MNRAS 000, 1–17
10 O. Daigle et al.
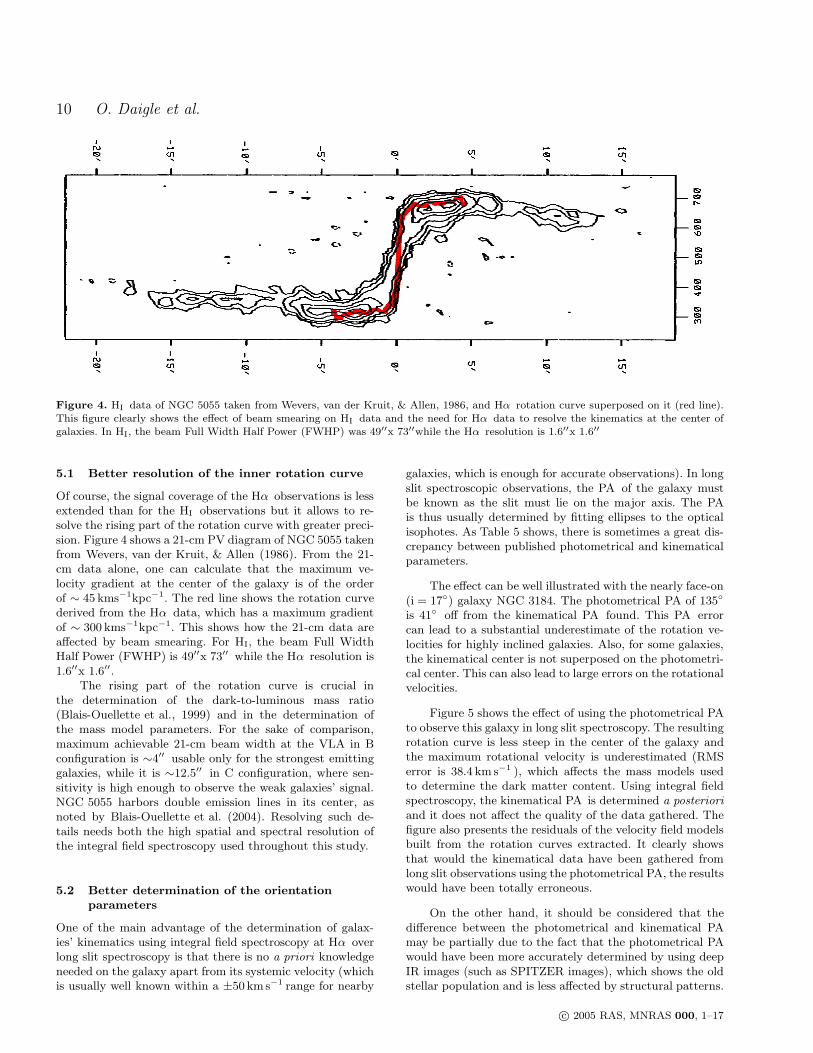
Figure 4. HI data of NGC 5055 taken from Wevers, van der Kruit, & Allen, 1986, and Hα rotation curve superposed on it (red line).This figure clearly shows the effect of beam smearing on HI data and the need for Hα data to resolve the kinematics at the center ofgalaxies. In HI, the beam Full Width Half Power (FWHP) was 49′′x 73′′while the Hα resolution is 1.6′′x 1.6′′
5.1 Better resolution of the inner rotation curve
Of course, the signal coverage of the Hα observations is lessextended than for the HI observations but it allows to re-solve the rising part of the rotation curve with greater preci-sion. Figure 4 shows a 21-cm PV diagram of NGC 5055 takenfrom Wevers, van der Kruit, & Allen (1986). From the 21-cm data alone, one can calculate that the maximum ve-locity gradient at the center of the galaxy is of the orderof ∼ 45 kms−1kpc−1. The red line shows the rotation curvederived from the Hα data, which has a maximum gradientof ∼ 300 kms−1kpc−1. This shows how the 21-cm data areaffected by beam smearing. For HI, the beam Full WidthHalf Power (FWHP) is 49′′x 73′′ while the Hα resolution is1.6′′x 1.6′′.
The rising part of the rotation curve is crucial inthe determination of the dark-to-luminous mass ratio(Blais-Ouellette et al., 1999) and in the determination ofthe mass model parameters. For the sake of comparison,maximum achievable 21-cm beam width at the VLA in Bconfiguration is ∼4′′ usable only for the strongest emittinggalaxies, while it is ∼12.5′′ in C configuration, where sen-sitivity is high enough to observe the weak galaxies’ signal.NGC 5055 harbors double emission lines in its center, asnoted by Blais-Ouellette et al. (2004). Resolving such de-tails needs both the high spatial and spectral resolution ofthe integral field spectroscopy used throughout this study.
5.2 Better determination of the orientationparameters
One of the main advantage of the determination of galax-ies’ kinematics using integral field spectroscopy at Hα overlong slit spectroscopy is that there is no a priori knowledgeneeded on the galaxy apart from its systemic velocity (whichis usually well known within a ±50 kms−1 range for nearby
galaxies, which is enough for accurate observations). In longslit spectroscopic observations, the PA of the galaxy mustbe known as the slit must lie on the major axis. The PAis thus usually determined by fitting ellipses to the opticalisophotes. As Table 5 shows, there is sometimes a great dis-crepancy between published photometrical and kinematicalparameters.
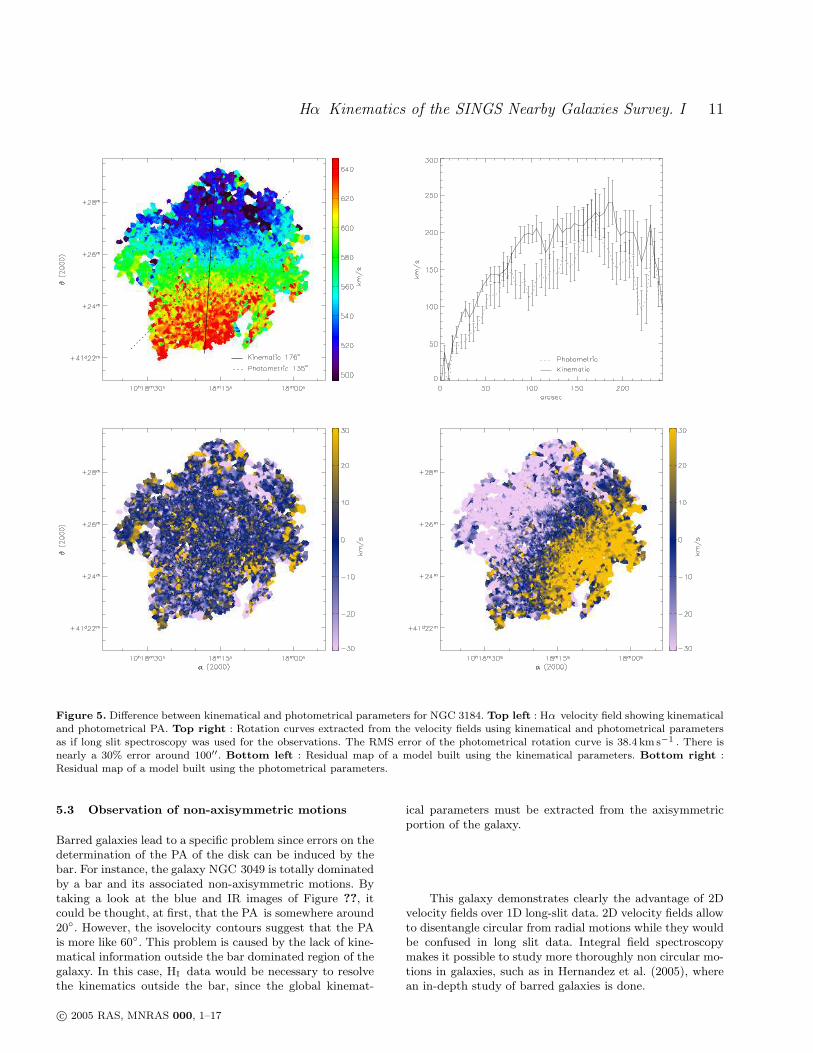
The effect can be well illustrated with the nearly face-on(i = 17◦) galaxy NGC 3184. The photometrical PA of 135◦
is 41◦ off from the kinematical PA found. This PA errorcan lead to a substantial underestimate of the rotation ve-locities for highly inclined galaxies. Also, for some galaxies,the kinematical center is not superposed on the photometri-cal center. This can also lead to large errors on the rotationalvelocities.
Figure 5 shows the effect of using the photometrical PAto observe this galaxy in long slit spectroscopy. The resultingrotation curve is less steep in the center of the galaxy andthe maximum rotational velocity is underestimated (RMSerror is 38.4 km s−1 ), which affects the mass models usedto determine the dark matter content. Using integral fieldspectroscopy, the kinematical PA is determined a posteriori
and it does not affect the quality of the data gathered. Thefigure also presents the residuals of the velocity field modelsbuilt from the rotation curves extracted. It clearly showsthat would the kinematical data have been gathered fromlong slit observations using the photometrical PA, the resultswould have been totally erroneous.
On the other hand, it should be considered that thedifference between the photometrical and kinematical PAmay be partially due to the fact that the photometrical PAwould have been more accurately determined by using deepIR images (such as SPITZER images), which shows the oldstellar population and is less affected by structural patterns.
c© 2005 RAS, MNRAS 000, 1–17
Hα Kinematics of the SINGS Nearby Galaxies Survey. I 11
Figure 5. Difference between kinematical and photometrical parameters for NGC 3184. Top left : Hα velocity field showing kinematicaland photometrical PA. Top right : Rotation curves extracted from the velocity fields using kinematical and photometrical parametersas if long slit spectroscopy was used for the observations. The RMS error of the photometrical rotation curve is 38.4 km s−1 . There isnearly a 30% error around 100′′. Bottom left : Residual map of a model built using the kinematical parameters. Bottom right :Residual map of a model built using the photometrical parameters.
5.3 Observation of non-axisymmetric motions
Barred galaxies lead to a specific problem since errors on thedetermination of the PA of the disk can be induced by thebar. For instance, the galaxy NGC 3049 is totally dominatedby a bar and its associated non-axisymmetric motions. Bytaking a look at the blue and IR images of Figure ??, itcould be thought, at first, that the PA is somewhere around20◦. However, the isovelocity contours suggest that the PAis more like 60◦. This problem is caused by the lack of kine-matical information outside the bar dominated region of thegalaxy. In this case, HI data would be necessary to resolvethe kinematics outside the bar, since the global kinemat-
ical parameters must be extracted from the axisymmetricportion of the galaxy.
This galaxy demonstrates clearly the advantage of 2Dvelocity fields over 1D long-slit data. 2D velocity fields allowto disentangle circular from radial motions while they wouldbe confused in long slit data. Integral field spectroscopymakes it possible to study more thoroughly non circular mo-tions in galaxies, such as in Hernandez et al. (2005), wherean in-depth study of barred galaxies is done.
c© 2005 RAS, MNRAS 000, 1–17
12 O. Daigle et al.
5.4 Observation of highly inclined galaxies
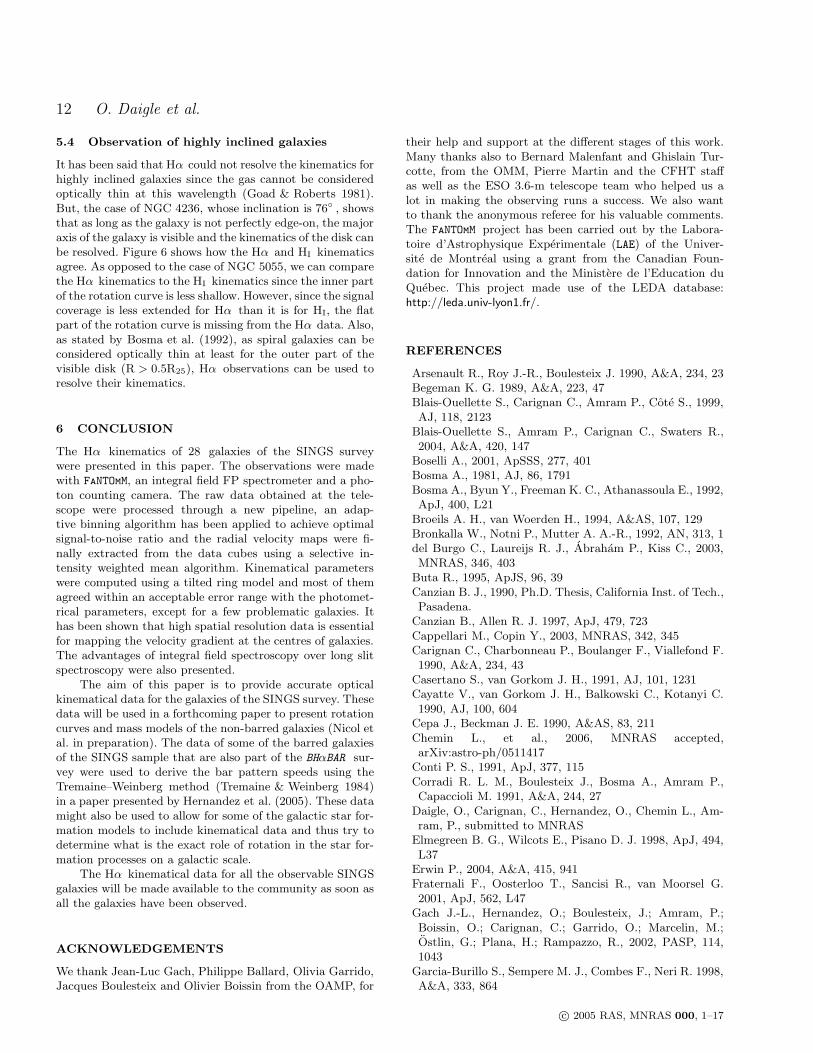
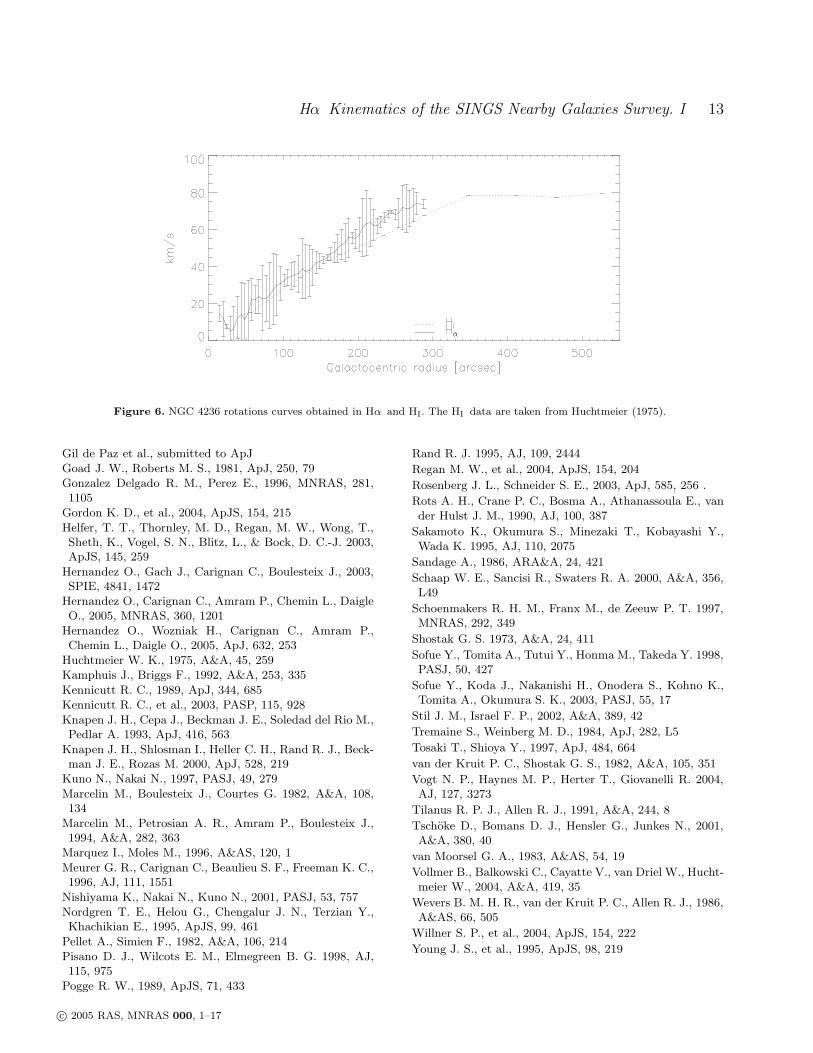
It has been said that Hα could not resolve the kinematics forhighly inclined galaxies since the gas cannot be consideredoptically thin at this wavelength (Goad & Roberts 1981).But, the case of NGC 4236, whose inclination is 76◦ , showsthat as long as the galaxy is not perfectly edge-on, the majoraxis of the galaxy is visible and the kinematics of the disk canbe resolved. Figure 6 shows how the Hα and HI kinematicsagree. As opposed to the case of NGC 5055, we can comparethe Hα kinematics to the HI kinematics since the inner partof the rotation curve is less shallow. However, since the signalcoverage is less extended for Hα than it is for HI, the flatpart of the rotation curve is missing from the Hα data. Also,as stated by Bosma et al. (1992), as spiral galaxies can beconsidered optically thin at least for the outer part of thevisible disk (R > 0.5R25), Hα observations can be used toresolve their kinematics.
6 CONCLUSION
The Hα kinematics of 28 galaxies of the SINGS surveywere presented in this paper. The observations were madewith FaNTOmM, an integral field FP spectrometer and a pho-ton counting camera. The raw data obtained at the tele-scope were processed through a new pipeline, an adap-tive binning algorithm has been applied to achieve optimalsignal-to-noise ratio and the radial velocity maps were fi-nally extracted from the data cubes using a selective in-tensity weighted mean algorithm. Kinematical parameterswere computed using a tilted ring model and most of themagreed within an acceptable error range with the photomet-rical parameters, except for a few problematic galaxies. Ithas been shown that high spatial resolution data is essentialfor mapping the velocity gradient at the centres of galaxies.The advantages of integral field spectroscopy over long slitspectroscopy were also presented.
The aim of this paper is to provide accurate opticalkinematical data for the galaxies of the SINGS survey. Thesedata will be used in a forthcoming paper to present rotationcurves and mass models of the non-barred galaxies (Nicol etal. in preparation). The data of some of the barred galaxiesof the SINGS sample that are also part of the BHαBAR sur-vey were used to derive the bar pattern speeds using theTremaine–Weinberg method (Tremaine & Weinberg 1984)in a paper presented by Hernandez et al. (2005). These datamight also be used to allow for some of the galactic star for-mation models to include kinematical data and thus try todetermine what is the exact role of rotation in the star for-mation processes on a galactic scale.
The Hα kinematical data for all the observable SINGSgalaxies will be made available to the community as soon asall the galaxies have been observed.
ACKNOWLEDGEMENTS
We thank Jean-Luc Gach, Philippe Ballard, Olivia Garrido,Jacques Boulesteix and Olivier Boissin from the OAMP, for
their help and support at the different stages of this work.Many thanks also to Bernard Malenfant and Ghislain Tur-cotte, from the OMM, Pierre Martin and the CFHT staffas well as the ESO 3.6-m telescope team who helped us alot in making the observing runs a success. We also wantto thank the anonymous referee for his valuable comments.The FaNTOmM project has been carried out by the Labora-toire d’Astrophysique Experimentale (LAE) of the Univer-site de Montreal using a grant from the Canadian Foun-dation for Innovation and the Ministere de l’Education duQuebec. This project made use of the LEDA database:http://leda.univ-lyon1.fr/.
REFERENCES
Arsenault R., Roy J.-R., Boulesteix J. 1990, A&A, 234, 23Begeman K. G. 1989, A&A, 223, 47Blais-Ouellette S., Carignan C., Amram P., Cote S., 1999,AJ, 118, 2123
Blais-Ouellette S., Amram P., Carignan C., Swaters R.,2004, A&A, 420, 147
Boselli A., 2001, ApSSS, 277, 401Bosma A., 1981, AJ, 86, 1791Bosma A., Byun Y., Freeman K. C., Athanassoula E., 1992,ApJ, 400, L21
Broeils A. H., van Woerden H., 1994, A&AS, 107, 129Bronkalla W., Notni P., Mutter A. A.-R., 1992, AN, 313, 1del Burgo C., Laureijs R. J., Abraham P., Kiss C., 2003,MNRAS, 346, 403
Buta R., 1995, ApJS, 96, 39Canzian B. J., 1990, Ph.D. Thesis, California Inst. of Tech.,Pasadena.
Canzian B., Allen R. J. 1997, ApJ, 479, 723Cappellari M., Copin Y., 2003, MNRAS, 342, 345Carignan C., Charbonneau P., Boulanger F., Viallefond F.1990, A&A, 234, 43
Casertano S., van Gorkom J. H., 1991, AJ, 101, 1231Cayatte V., van Gorkom J. H., Balkowski C., Kotanyi C.1990, AJ, 100, 604
Cepa J., Beckman J. E. 1990, A&AS, 83, 211Chemin L., et al., 2006, MNRAS accepted,arXiv:astro-ph/0511417
Conti P. S., 1991, ApJ, 377, 115Corradi R. L. M., Boulesteix J., Bosma A., Amram P.,Capaccioli M. 1991, A&A, 244, 27
Daigle, O., Carignan, C., Hernandez, O., Chemin L., Am-ram, P., submitted to MNRAS
Elmegreen B. G., Wilcots E., Pisano D. J. 1998, ApJ, 494,L37
Erwin P., 2004, A&A, 415, 941Fraternali F., Oosterloo T., Sancisi R., van Moorsel G.2001, ApJ, 562, L47
Gach J.-L., Hernandez, O.; Boulesteix, J.; Amram, P.;Boissin, O.; Carignan, C.; Garrido, O.; Marcelin, M.;Ostlin, G.; Plana, H.; Rampazzo, R., 2002, PASP, 114,1043
Garcia-Burillo S., Sempere M. J., Combes F., Neri R. 1998,A&A, 333, 864
c© 2005 RAS, MNRAS 000, 1–17
Hα Kinematics of the SINGS Nearby Galaxies Survey. I 13
Figure 6. NGC 4236 rotations curves obtained in Hα and HI. The HI data are taken from Huchtmeier (1975).
Gil de Paz et al., submitted to ApJGoad J. W., Roberts M. S., 1981, ApJ, 250, 79Gonzalez Delgado R. M., Perez E., 1996, MNRAS, 281,1105
Gordon K. D., et al., 2004, ApJS, 154, 215
Helfer, T. T., Thornley, M. D., Regan, M. W., Wong, T.,Sheth, K., Vogel, S. N., Blitz, L., & Bock, D. C.-J. 2003,ApJS, 145, 259
Hernandez O., Gach J., Carignan C., Boulesteix J., 2003,SPIE, 4841, 1472
Hernandez O., Carignan C., Amram P., Chemin L., DaigleO., 2005, MNRAS, 360, 1201
Hernandez O., Wozniak H., Carignan C., Amram P.,Chemin L., Daigle O., 2005, ApJ, 632, 253
Huchtmeier W. K., 1975, A&A, 45, 259Kamphuis J., Briggs F., 1992, A&A, 253, 335
Kennicutt R. C., 1989, ApJ, 344, 685Kennicutt R. C., et al., 2003, PASP, 115, 928
Knapen J. H., Cepa J., Beckman J. E., Soledad del Rio M.,Pedlar A. 1993, ApJ, 416, 563
Knapen J. H., Shlosman I., Heller C. H., Rand R. J., Beck-man J. E., Rozas M. 2000, ApJ, 528, 219
Kuno N., Nakai N., 1997, PASJ, 49, 279
Marcelin M., Boulesteix J., Courtes G. 1982, A&A, 108,134
Marcelin M., Petrosian A. R., Amram P., Boulesteix J.,1994, A&A, 282, 363
Marquez I., Moles M., 1996, A&AS, 120, 1
Meurer G. R., Carignan C., Beaulieu S. F., Freeman K. C.,1996, AJ, 111, 1551
Nishiyama K., Nakai N., Kuno N., 2001, PASJ, 53, 757Nordgren T. E., Helou G., Chengalur J. N., Terzian Y.,Khachikian E., 1995, ApJS, 99, 461
Pellet A., Simien F., 1982, A&A, 106, 214Pisano D. J., Wilcots E. M., Elmegreen B. G. 1998, AJ,115, 975
Pogge R. W., 1989, ApJS, 71, 433
Rand R. J. 1995, AJ, 109, 2444
Regan M. W., et al., 2004, ApJS, 154, 204
Rosenberg J. L., Schneider S. E., 2003, ApJ, 585, 256 .
Rots A. H., Crane P. C., Bosma A., Athanassoula E., vander Hulst J. M., 1990, AJ, 100, 387
Sakamoto K., Okumura S., Minezaki T., Kobayashi Y.,Wada K. 1995, AJ, 110, 2075
Sandage A., 1986, ARA&A, 24, 421
Schaap W. E., Sancisi R., Swaters R. A. 2000, A&A, 356,L49
Schoenmakers R. H. M., Franx M., de Zeeuw P. T. 1997,MNRAS, 292, 349
Shostak G. S. 1973, A&A, 24, 411
Sofue Y., Tomita A., Tutui Y., Honma M., Takeda Y. 1998,PASJ, 50, 427
Sofue Y., Koda J., Nakanishi H., Onodera S., Kohno K.,Tomita A., Okumura S. K., 2003, PASJ, 55, 17
Stil J. M., Israel F. P., 2002, A&A, 389, 42
Tremaine S., Weinberg M. D., 1984, ApJ, 282, L5
Tosaki T., Shioya Y., 1997, ApJ, 484, 664
van der Kruit P. C., Shostak G. S., 1982, A&A, 105, 351
Vogt N. P., Haynes M. P., Herter T., Giovanelli R. 2004,AJ, 127, 3273
Tilanus R. P. J., Allen R. J., 1991, A&A, 244, 8
Tschoke D., Bomans D. J., Hensler G., Junkes N., 2001,A&A, 380, 40
van Moorsel G. A., 1983, A&AS, 54, 19
Vollmer B., Balkowski C., Cayatte V., van Driel W., Hucht-meier W., 2004, A&A, 419, 35
Wevers B. M. H. R., van der Kruit P. C., Allen R. J., 1986,A&AS, 66, 505
Willner S. P., et al., 2004, ApJS, 154, 222
Young J. S., et al., 1995, ApJS, 98, 219
c© 2005 RAS, MNRAS 000, 1–17
14 O. Daigle et al.
APPENDIX A: DESCRIPTION OF THEINDIVIDUAL GALAXIES
A brief description of the structures observed in the Hαvelocity fields, monochromatic images and PV diagrams ofthe SINGS sample is made in this appendix. The galaxiesNGC 0925, NGC 2403, NGC 3198, NGC 4236, NGC 4321and NGC 6964 are part of the BHαBAR survey and are ex-tensively described in Hernandez et al. (2005). The galaxiesNGC 4321, NGC 4536, NGC 4569 and NGC 4579 are partof the sample of 30 Virgo cluster galaxies and will be studiedin Chemin et al. (2006).
NGC 628 (M74): The HI PA of this face-on galaxyvaries greatly with distance from the center, as observed byKamphuis & Briggs (1992). In the visible, this phenomenonis seen in the outer rings of the Hα RV map. Some HII
regions with velocities that are perpendicular to the planeof the galaxy are also visible. The HI PA determined byKamphuis & Briggs (1992) agrees with the kinematical one(Table 5), but the inclination differs greatly (6.5◦ for HI
and 21.5◦ for Hα). This may be due to the fact thatrotcur has problems dealing with galaxies whose inclina-tion is <40◦ (Begeman 1989, Chemin et al. 2006). For therotation curve presented in Figure ??, the HI inclinationwas adopted. This galaxy has also been observed in CO byNishiyama, Nakai, & Kuno (2001).
NGC 925: This late type SBcd galaxy has a brightoptical and Hα bar and two bright patchy spiral arms be-ginning at the ends of the bar. Many HII regions lie along thebar. The photometrical and kinematical data agree. The PVdiagram shows non axisymmetric motions near the center.It is well studied in HI (Elmegreen, Wilcots, & Pisano 1998;Pisano, Wilcots, & Elmegreen 1998), in CO (Helfer et al.2003) and in Hα (Marcelin, Boulesteix, & Courtes 1982).It shows strong streaming motions.
NGC 2403: This SABc galaxy shows amorphous spi-ral features. The Hα velocity maps and the PV diagramshow an almost rigid structure near the center of the galaxy.Bright HII regions can be seen in the Hα monochro-matic image. It is not clear whether this galaxy is barredor not. According to Schoenmakers, Franx, & de Zeeuw(1997), their Fourier harmonic analysis of the HI veloc-ity field shows that non-circular motions are not impor-tant in this galaxy. Moreover, Schaap, Sancisi, & Swaters(2000) stress that the thin hydrogen disk of NGC 2403 issurrounded by a vertically extended layer of HI that rotatesslower than the disk. A complete modeling of the galaxywill provide more details on its structures. Fraternali et al.(2001) suggest that this anomalous HI component may besimilar to a class of high velocity clouds observed in theMilky Way. In CO data, no molecular gas is detected (Helferet al. 2003).
NGC 2798: This galaxy is interacting with its closecompanion, NGC 2799 on the east. Marquez & Moles (1996)observed a difference of 125 km s−1 in the velocity of the HI
and HII components of NGC 2799. Due to this interaction,it was useless to determine the kinematical parameters ofthis galaxy (Table 5).
NGC 2915: The radial velocity map of this galaxy
shows a highly distorted optical disk. This renders impossi-ble the determination of the kinematical parameters of thegalaxy. Two bright HII regions are visible toward the centerof the galaxy. Meurer et al. (1996) obtained the HI kinemat-ics of this blue compact dwarf galaxy. They observed thatthe optical disk of the galaxy corresponds to the central HI
bar. They think that the dark matter halo dominates atnearly all radii.
NGC 2976: This peculiar dwarf late type galaxy hasa nearly linear rotation curve. There is no spiral arm visi-ble. Two strong HII regions are located on each side of thegalaxy. Stil & Israel (2002) observed that in HI the rotationcurve seems to flatten near the edge of the HI disk. Accord-ing to Bronkalla, Notni, & Mutter (1992), the outer parts ofNGC 2976 have been undisturbed for a long time and arevery old (5 Gy, probably up to 15 Gy).
NGC 3031 (M81): The great M81 spiral galaxy hasfew Hα emission in its center, given its somewhat early type(Sab). The velocity information for radii up to ∼4′ is thusdifficult to extract. Farther away from the center, the ro-tation curve is very flat and does not show any decreasenear the edge of the optical disk. Long slit observations per-formed by Pellet & Simien (1982) show the same flattening.The bright core, as seen in infrared, contrasts greatly withits dim Hα counterpart. Detailed investigation of the UV,Hα and IR SFR indicators based on SPITZER and SINGSancillary data have been done by Gordon et al. (2004) andsuggests that the central dust is heated by stars in the bulgerather than star formation. The morphological analysis ofthe IR data that has been done by Willner et al. (2004) andshows evolved stars organized in bulge and disk components,a dusty interstellar medium showing star forming regionsand a clumpy profile. Still according to Willner et al., theflux density of the pointlike nucleus seems to have decreasedby a factor of three in the past four years.
NGC 3049: This Makarian galaxy harbours a “doublenucleus”, as stated by Nordgren et al. (1995). This feature,invisible in infrared, is easily seen in Hα and it does notseem to affect the galaxy’s kinematics. The “second nucleus”is most probably just a strong starburst HII region. Still ac-cording to Nordgen, this galaxy does not show any traceof merging. The galaxy is totally dominated by a bar andthe signal is too weak outside the bar to resolve the kine-matics, rendering the extraction of kinematical parametersimpossible.
UGC 5423 (M81 dwarf B): We present the firstavailable kinematical data for this dwarf galaxy. Rotationis weak.
NGC 3184: CO kinematics have been obtained byNishiyama, Nakai, & Kuno (2001) for this nearly face-ongalaxy. Hα data show a pretty flat rotation curve that nearlyreaches a flat part within the optical disk.
NGC 3198: This SB(rs)c galaxy has been exten-sively studied in HI (Bosma 1981; Begeman 1989), FP Hα(Corradi et al. 1991, Blais-Ouellette et al. 1999) and Hα and[NII] long-slit spectroscopy (Sofue et al. 1998, Vogt et al.2004). According to the PV diagram, non circular motions
c© 2005 RAS, MNRAS 000, 1–17
Hα Kinematics of the SINGS Nearby Galaxies Survey. I 15
near the centre can be seen. A strong velocity gradient isalso seen perpendicular to the bar major axis.
NGC 3521: The declining HI rotation curve of thisgalaxy allowed Casertano & van Gorkom (1991) to call forthe end of the “disk-halo conspiracy”. Though not visible inHα, the rotation curve starts to decline within a radius of22 kpc and the Hα data stops at 13 kpc.
NGC 3621: Many strong HII regions are visible inthis galaxy at all galactic radii. The Hα data do not seemto reach the flat part of the rotation curve. This galaxyhas been observed by using three fields of the ESO/La Silla3.6-m telescope. More kinematical data could be gatheredby observing further north and south of the galaxy.
NGC 3938: The nearly face-on orientation of thisgalaxy allowed van der Kruit & Shostak (1982) to study itin HI to search for extra-planar velocity components. Anin-depth study of the Hα velocity map is required in orderto corroborate this.
NGC 4236: This late type SBdm galaxy is seen nearlyedge-on. Its kinematical inclination is 76◦. The Hα imageshows that the HII regions are distributed along the bar,with two bright regions near the end of the bar. These fea-tures are also seen in HI (Shostak 1973). An extensive regionof solid-body rotation coincides with the bar.
NGC 4321 (M100): This grand-design spiral galaxyis located in the Virgo Cluster. It has been fre-quently mapped in the Hα emission line using high-resolution FP interferometry (Arsenault, Roy, & Boulesteix1990, Cepa & Beckman 1990, Canzian & Allen 1997,Knapen et al. 2000), in the molecular CO emission-line (Canzian 1990, Sakamoto et al. 1995, Rand 1995,Garcia-Burillo et al. 1998, Helfer et al. 2003) and in the21-cm HI emission-line (Cayatte et al. 1990, Knapen et al.1993). The HI disk is almost totally confined within the op-tical one but with a slight lopsidedness towards the SW(Knapen et al. 1993). The HI, CO and Hα velocity fieldsshow kinematical disturbances such as streaming motionsalong the spiral arms and a central S-shape distortion of theiso-velocity contours along the bar axis. The circum-nuclearregion shows the presence of an enhanced star formation re-gion as a four-armed Hα ring-like structure and a CO &Hα spiral-like structure. Much more details can be found inHernandez et al. (2005) and in Chemin et al. (2006).
NGC 4536: Streaming motions along the spiral armsand a Z-shape of the velocities in the central parts are ob-served in this barred galaxy. As in the CO data (Sofue et al.,2003), a steep velocity gradient is observed in the Hα data.
NGC 4625: This galaxy has a close companion, lying8′ away, which is only 22 kpc distant. The galaxy has a veryweak rotation and harbours a lot of double profile emissionlines, a sign of non-circular activity. This explains the largeerrors on the kinematical parameters found and the “boil-ing” aspect of the Hα velocity field extracted. van Moorsel(1983) studied it in HI and found a neutral hydrogen diskhaving a diameter of 5′, which is ∼5 times larger than theobserved Hα disk. GALEX images of this galaxy show a veryextended UV disk, extending at least 2–3 times the radiusof the main star-forming disk (Gil de Paz et al. 2005).
NGC 4569 (M90): This galaxy is located in theVirgo cluster. An off-plane sructure to the West of thedisk of NGC 4569 has been seen through deep Hα imag-ing (Tschoke et al., 2001) and in HI data (Vollmer et al.,2004). It is observed here as a string of HII regions whosekinematics follows the rotation of the disk, although it isslightly more red-shifted than inside the disk at equal az-imuth angles (Chemin et al. 2006).
NGC 4579 (M58): In addition to the main large-scale spiral arms, this Virgo galaxy exhibits a nuclearspiral structure (the so-called “loop” in Pogge, 1989 andGonzalez Delgado & Perez, 1996) within which is detecteda gradient of up to ∼ 500 kms−1 . The FP velocity fieldshows that the kinematical PA of this nuclear spiral differsby ∼ 90◦ from that of the main spiral arms. The kinematicalparameters of this galaxy shown in Table 5 are calculatedfor the grand-design spiral structure (ie. outside of the nu-clear spiral structure). See Figure ??. The PA of the nuclearstructure is ≃174◦±11 (Chemin et al. 2006).
NGC 4725: This barred ringed Sab lenticular galaxyis catalogued as a double barred galaxy by Erwin (2004) andHI rich by Rosenberg & Schneider (2003). No kinematicaldata are available for this galaxy. The kinematics in thecenter of the galaxy are hard to resolve given its early type.
NGC 5055 (M63): This galaxy shows several armpatterns that are well visible in Hα. It harbours a verystrong velocity gradient in its center and a flat rotationcurve. No bar structure is visible. It has been studied in HI
by Bosma (1981) and in CO by Nishiyama, Nakai, & Kuno(2001). This galaxy has also been studied in Hα byBlais-Ouellette et al. (2004), which showed two velocitycomponents in its central region. The Hα images presentedin this paper have weaker response on the receding side ofthe galaxy than on the approaching side due to the wide spanin the galaxy’s velocities which made the receding emissionfall on the wing of the interference filter.
NGC 5194 (M51a): Two emission lines are visible inthe very center of the galaxy and may account for the “dip”in the rotation curve shown in the PV diagram. The strongHII regions discriminate the great spiral structure from therest of the galaxy. A flow of HII regions is seen extend-ing towards its companion. This galaxy has been studiedin HI by Rots et al. (1990), in both HI and Hα (scanningFP) by Tilanus & Allen (1991) and more recently in CO byKuno & Nakai (1997). NGC 5195, the galaxy’s companion,has been observed in Hα through this study but it is im-possible to get kinematical information as it is an early typegalaxy (SB0p).
NGC 5398: This study provides the first kinematicaldata for this galaxy. Its peculiar radial velocity map makesit impossible to extract kinematical parameters. It has beenclassified as ringed galaxy by Buta (1995) and Wolf-Rayetgalaxy by Conti (1991).
NGC 5713: Many strong HII regions are visible in thisgalaxy and produces a oddly looking radial velocity map.There were no kinematical data available for this galaxyprior to publishing this paper.
c© 2005 RAS, MNRAS 000, 1–17
16 O. Daigle et al.
IC 4710 : This galaxy has plenty of HII regions butdoes not seem to harbour large-scale rotation.
NGC 6946: According to HI studies (Carignan et al.1990), the HI distribution is not symmetric but is more ex-tended to the NE side. This feature is also seen in the Hαemission map. The overall Hα velocity map is regular butshows some non-circular motions near the center, confirmedby the PV diagram. It has been recently observed in FP byBlais-Ouellette et al. (2004) leading to the same conclusions.Once again the wide field of FaNTOmM and its high sensitivityis clearly an advantage to obtain better Hα velocity fields.CO data has been gathered by Young et al. (1995).
NGC 7331: The receding part of the galaxy is invisiblein the RV maps presented in this paper. It was first thoughtthat this part of the galaxy was out of the interference filter,but this feature has also been observed by Marcelin et al.(1994). An a posteriori scan of the interference filter usedshowed that the galaxy should have been well centered inthe filter. Deep Hα images taken by Regan et al. (2004) atthe KPNO 2.1 meter telescope show the same asymmetricemission pattern. However, Regan et al. (2004) also madePaα observations and did not observe that asymmetry. Atheory to explain this is that a ring of dust located south ofthe center of the galaxy is blocking the Hα emission fromreaching us whilst letting the Paα through. This galaxy hasbeen called “Post starburst” by Tosaki & Shioya (1997) whostudied its kinematics in CO. CO data have also been gath-ered by Nishiyama, Nakai, & Kuno (2001).
c© 2005 RAS, MNRAS 000, 1–17
Hα Kinematics of the SINGS Nearby Galaxies Survey. I 17
APPENDIX B: OBSERVATIONAL DATA
Figures were removed for the astro-ph version of this paperdue to file size constraints. You can access them online athttp://www.astro.umontreal.ca/fantomm/sings .
APPENDIX C: ROTATION CURVES
Figures were removed for the astro-ph version of this paperdue to file size constraints. You can access them onlineat http://www.astro.umontreal.ca/fantomm/sings. Therotation curves in their electronic form are available athttp://www.astro.umontreal.ca/fantomm/sings/rotation_curves.htm.
This paper has been typeset from a TEX/ LATEX file preparedby the author.
c© 2005 RAS, MNRAS 000, 1–17


