Embed Size (px)
Citation preview

arX
iv:1
002.
1946
v1 [
astr
o-ph
.CO
] 9
Feb
201
0Mon. Not. R. Astron. Soc. 000, 1–26 (2010) Printed 9 February 2010 (MN LATEX style file v2.2)
PINGS: the PPAK IFS Nearby Galaxies Survey⋆
F. F. Rosales-Ortega,1† R. C. Kennicutt,1 S. F. Sanchez,2,3,4 A. I. Dıaz,5
A. Pasquali,6 B. D. Johnson1 and C. N. Hao11Institute of Astronomy, University of Cambridge, Madingley Road, Cambridge CB3 0HA, UK2Centro Astronomico Hispano Aleman, Calar Alto, CSIC-MPG, Jesus Durban Remon 2, E-04004 Almeria, Spain3Centro de Estudios de Fısica del Cosmos de Aragon (CEFCA), C/General Pizarro 1, 3◦, E-41001 Teruel, Spain4Fundacion Agencia Aragonesa para la Investigacion y el Desarrollo (ARAID)5Departamento de Fısica Teorica, C-XI, Universidad Autonoma de Madrid, 28049 Madrid, Spain6Max-Planck Institut fur Astronomie, Konigstuhl 17, 69117 Heidelberg, Germany
Accepted 2010 February 09. Received 2010 January 24; in original form 2009 May 11
ABSTRACTWe present the PPAK Integral Field Spectroscopy (IFS) Nearby Galaxies Survey:PINGS, a 2-dimensional spectroscopic mosaicking of 17 nearby disk galaxies in theoptical wavelength range. This project represents the first attempt to obtain continu-ous coverage spectra of the whole surface of a galaxy in the nearby universe. The finaldata set comprises more than 50000 individual spectra, covering in total an observedarea of nearly 80 arcmin2. The observations will be supplemented with broad bandand narrow band imaging for those objects without public available images in orderto maximise the scientific and archival value of the data set. In this paper we describethe main astrophysical issues to be addressed by the PINGS project, we present thegalaxy sample and explain the observing strategy, the data reduction process and alluncertainties involved. Additionally, we give some scientific highlights extracted fromthe first analysis of the PINGS sample. A companion paper will report on the firstresults obtained for NGC628: the largest IFS survey on a single galaxy.
Key words: Surveys – methods: observational – techniques: spectroscopic – galaxies:general – galaxies: abundances – ISM: abundances
1 INTRODUCTION
Hitherto, most spectroscopic studies in nearby galaxies havefocused on the derivation of physical and chemical propertiesof spatially-resolved bright individual H II regions. Most ofthese measurements were made with single-aperture or long-slit spectrographs, resulting in samples of typically a fewH II regions per galaxy or single spectra of large sampleslike the Sloan Digital Sky Survey (SDSS, York et al. 2000) orother large surveys. The advent of multi-object and integralfield spectrometers with large fields of view now offers us theopportunity to undertake a new generation of emission-linesurveys, based on samples of scores to hundreds of individualH II regions within a single galaxy and full 2-dimensional(2D) coverage of the disks.
In this paper, we describe the PPAK IFS NearbyGalaxies Survey: PINGS, a project designed to construct
⋆ Based on observations collected at the Centro Astronomico His-pano Aleman (CAHA) at Calar Alto, operated jointly by theMax-Planck Institut fur Astronomie and the Instituto de As-trofısica de Andalucıa (CSIC).† E-mail: [email protected]
2D spectroscopic mosaics of a representative sample ofnearby spiral galaxies, using the unique instrumental ca-pabilities of the Postdam Multi Aperture Spectrograph,PMAS (Roth et al. 2005) in the PPAK mode (Verhei-jen et al. 2004; Kelz et al. 2006; Kelz & Roth 2006)at the Centro Astronomico Hispano Aleman (CAHA) atCalar Alto, Spain. “The PMAS fibre PAcK (PPAK) is cur-rently one of the world’s widest integral field units with afield-of-view (FOV) of 74× 65 arcsec that provides a semi-contiguous regular sampling of extended astronomical ob-jects” (Kelz, http://tinyurl.com/ppak-aip). This projectrepresents one of the first attempts to obtain 2D spectra ofthe whole surface of a galaxy in the nearby universe. The ob-servations consist of integral field unit (IFU) spectroscopicmosaics for 17 nearby galaxies (D < 100 Mpc) with a pro-jected optical angular size of less than 10 arcmin. The spec-troscopic mosaicking comprises more than 50000 spectra inthe optical wavelength range. The data set will be supple-mented with broad band and narrow band imaging for thoseobjects without publicly available images.
The primary scientific objectives of PINGS are to usethe 2D IFS observations to study the small and intermediatescale variation in the line emission and stellar continuum
c© 2010 RAS

2 Rosales-Ortega et al.
by means of pixel-resolved maps across the disks of nearbygalaxies. These spectral maps will allow us to test, confirm,and extend the previous body of results from small-samplestudies, while at the same time open up a new frontier ofstudying the two-dimensional metallicity structure of disksand the intrinsic dispersion in metallicity. Furthermore, thelarge body of data arising from these studies will also allowus to test and strengthen the diagnostic methods that areused to measure H II region abundances in galaxies.
Previous works have used multi-object instruments toobtain simultaneous spectra of H II regions in a disk galaxy(e.g. Roy & Walsh 1988; Kennicutt & Garnett 1996; Mous-takas & Kennicutt 2006a), or narrow-band imaging of spe-cific fields to obtain information of star forming regions andthe ionized gas (e.g. Scowen et al. 1996). One important at-tempt is represented by the SAURON project (Bacon et al.2001), which is based on a panoramic lenslet array spec-trograph with a relatively large FOV of 33× 41 arcsec2.SAURON was specifically designed to study the kinemat-ics and stellar populations of a sample of nearby ellipticaland lenticular galaxies. The application of SAURON to spi-ral galaxies was restricted to the study of spiral bulges. Arecent effort by Rosolowsky & Simon (2008) plans to obtainspectroscopy for ∼ 1000 H II regions through the M33 Metal-licity Project, using multi-slit observations. On the otherhand, Blanc et al. (2009) obtained IFS observations of thecentral region of M51 (∼ 1.7 arcmin2), using the VIRUS-Pinstrument. However, in spite of the obvious advantages ofthe IFS technique in tackling known scientific problems andin opening up new lines of research, 2D spectroscopy is amethod that has been used relatively infrequently to studylarge angular-size nearby objects. Recently, PPAK was usedsuccessfully to map the Orion nebula, obtaining the chem-ical composition through strong line ratios (Sanchez et al.2007b). Likewise, PMAS in the lens-array configuration wasused to map the spatial distribution of the physical proper-ties of the dwarf H II galaxy II Zw70 (Kehrig et al. 2008),although covering just a small FOV (∼ 32 arcsec).
Despite these previous efforts toward IFS of nearbygalaxies, the application to obtain complete 2D informationin galaxies is a novel technique. Reasons for the lack of stud-ies in this area include small wavelength coverage, fibre-opticcalibration problems, but mainly the limited FOV of the in-struments available worldwide. Most of these IFUs have aFOV of the order of arcsec, preventing a good coverage ofthe target galaxies on the sky in a reasonable time, evenwith a mosaicking technique. Furthermore, in some cases thespectral coverage is not appropriate to measure importantdiagnostic emission-lines used in chemical abundance stud-ies. Moreover, the complex data reduction and visualisationimposes a further obstacle to more ambitious projects basedon 2D spectroscopy. To our knowledge there has been noattempt to obtain point-by-point spectra over a large wave-length range of the whole surface of a galaxy covering allH II regions within it. Similarly to SAURON for early-typegalaxies, PINGS will provide the most detailed knowledge ofstar formation and gas chemistry across a late-type galaxy.This information is also relevant for interpreting the inte-grated colours and spectra of high redshift sources. In thatrespect, PINGS represents a leap in the study of the chem-ical abundances and the global properties of galaxies.
The objectives of this paper are: 1) to provide the back-
ground information of the PINGS survey; including a de-tailed description of the observations, all the data reductiontechniques implemented (some of them novel in the treat-ment of IFS data), and all the uncertainties involved in thisprocess; 2) to offer a general description of the proceduresinvolved in IFS observations of this kind; and 3) to presentthe PINGS data products and the archival value of this sur-vey. The paper is organised as follows. In § 2 we describethe core scientific objectives of the PINGS project and wediscuss some of the many applications of the data set. In§ 3 we describe the properties of the galaxy sample selected,while in § 4 we explain the observational strategy and thePINGS observations themselves. In § 5 we present the des-cription of the complex data reduction involved in this IFSsurvey, while in § 6 we describe the sources and magnitudesof the errors and uncertainties in the data sample. In § 7, wesummarise the basic properties of the data, showing a fewscience case examples extracted from the data set, includingthe integrated properties, emission line maps and a compar-ison of line intensity ratios with previously published studiesfor some galaxies. Finally, in § 8 we give a summary of thearticle.
2 SCIENTIFIC OBJECTIVES
The study of chemical abundances in galaxies has been sig-nificantly benefited from the vast amount of data collectedin recent years, either at the neighborhood of the Sun, orat high redshifts, especially on large scale surveys such asthe SDSS or the 2dF galaxy redshift survey (Colless et al.2001). Most studies derived from these observations havefocused on linking the properties of high redshift galaxieswith nearby objects, as an attempt to understand the prin-ciples of the formation and chemical evolution of the galaxies(e.g. see Pettini 2006). Historically, the metal content of lowredshift galaxies has been determined through the nebularemission of individual H II regions at discrete spatial po-sitions, these measurements provide hints on the chemicalevolution, stellar nucleosynthesis and star formation histo-ries of spiral galaxies. The chemical evolution is dictated bya complex array of parameters, including the local initialcomposition, the distribution of molecular and neutral gas,star formation history (SFH), gas infall and outflows, radialtransport and mixing of gas within disks, stellar yields, andthe initial mass function (IMF). Although it is difficult todisentangle the effects of the various contributors, measure-ments of current elemental abundances constrain the possi-ble evolutionary histories of the existing stars and galaxies,and thus the importance of the accurate determination ofthe chemical composition among different galaxy types.
Different studies have shown a complex link between thechemical abundances of galaxies and their physical proper-ties. Such studies are only able to accurately measure thefirst two moments of the abundance distribution –the meanmetal abundances of disks and their radial gradients– and oncharacterising the relations between these abundance prop-erties and the physical properties of the parent galaxies, forexample galactic luminosity, stellar and dynamical mass, cir-cular velocity, surface brightness, colors, mass-to-light ra-tios, Hubble type, gas fraction of the disk, etc. These stud-ies have revealed a number of important scaling laws and
c© 2010 RAS, MNRAS 000, 1–26

PINGS: the PPAK IFS Nearby Galaxies Survey 3
systematic patterns including luminosity-metallicity, mass-metallicity, and surface brightness vs. metallicity relations(e.g. Skillman et al. 1989; Vila-Costas & Edmunds 1992;Zaritsky et al. 1994; Tremonti et al. 2004), effective yieldvs. luminosity and circular velocity relations (e.g. Garnett2002), abundance gradients and the effective radius of disks(e.g. Diaz 1989), and systematic differences in the gas-phaseabundance gradients between normal and barred spirals (e.g.Zaritsky et al. 1994; Martin & Roy 1994). However, thesestudies have been limited by the number of objects sam-pled, the number of H II regions observed and the coverageof these regions within the galaxy surface.
In order to obtain a deeper insight of the mechanismsthat rule the chemical evolution of galaxies, we require thecombination of high quality multi-wavelength data and widefield optical spectroscopy in order to increase significantlythe number of H II regions sampled in any given galaxy.The PINGS project was conceived to tackle the problemof the 2-dimensional coverage of the whole galaxy surface.The imaging spectroscopy technique applied in PINGS pro-vides a powerful tool for studying the distribution of physicalproperties in nearby well-resolved galaxies. PINGS was spe-cially designed to obtain complete maps of the emission-lineabundances, stellar populations, and reddening using an IFSmosaicking imaging, which takes advantage of what is cur-rently one of the world’s widest FOV IFU. With this novelspectroscopic technique, the data can be used to derive: 1)oxygen abundance distributions based on a suite of strong-line diagnostics incorporating absorption-corrected Hα, Hβ,[O II], [O III], [N II], and [S II] line ratios; 2) local nebular red-dening estimates based on the Balmer decrement; 3) mea-surements of ionization structure in H II regions and dif-fuse ionized gas using the well-known and most updatedforbidden-line diagnostics in the oxygen and nitrogen lines;4) rough fits to the stellar age mix from the stellar spectra.
The resulting spectral maps and ancillary data will beused to address a number of important astrophysical issuesregarding both the gas-phase and the stellar populations ingalaxies. For example, one application will be able to testwhether the metal abundance distributions in disks are ax-isymmetric. This is usually taken for granted in chemicalevolution models, but one might expect strong deviationsfrom symmetry in strongly lopsided, interacting, or barredgalaxies, which are subject to large scale gas flows. Anotherimportant goal is to place strong limits on the dispersionin metal abundance locally in disks; there is evidence for alarge dispersion in some objects such as NGC925 or M 33(Rosolowsky & Simon 2008), but it is not clear from thosedata whether the dispersion is due to non-axisymmetricabundance variations, systematic errors in the abundancemeasurements, or a real local dispersion. Yet another byproduct of our analysis will be point by point reddeningmaps of the galaxies, which can be combined with UV,Hα, and infrared maps to derive robust, extinction-correctedmaps of the SFR.
PINGS can also provide a very detailed knowledge ofthe role played by star formation in the cosmic life of galax-ies. All the important scaling laws previously mentioned tellus that, once born, stars change the ionization state, thekinematics and chemistry of the interstellar medium and,thus, change the initial conditions of the next episode of starformation. Substantially, star formation is a loop mechanism
which drives the luminosity, mass and chemical evolution ofeach galaxy (leaving aside external agents like interactionsand mergers). The details of such a complex mechanism arestill not well established observationally and not well devel-oped theoretically, and limit our understanding of galaxyevolution from the early universe to present day. In com-bination with ancillary data, the flux maps computed fromthe PINGS data will be used to study both the most recentstar formation activity of the targets and the older stellarpopulations. We will be able to identify the gas and stellarfeatures responsible for the observed spectra, to derive thedependence of the local star formation rate on the local sur-face brightness, a key recipe for modelling galaxy evolutionand the environmental dependence of star formation. Thesedata will also provide an important check for interpretingthe integrated broad-band colours and spectra of high red-shift sources.
3 SAMPLE DESCRIPTION
In order to achieve the scientific goals described above, weincorporated a diverse population of galaxies, adopting aphysically based approach to defining the PINGS sample.We decided to observe a set of local spiral galaxies whichwere representative of different galaxy types. However, thesize and precise nature of the sample were heavily influ-enced by a set of technical considerations, the principal lim-iting factor being the FOV of the PPAK unit. We wanted toobserve relatively nearby galaxies to maximise the physicallinear resolution using the mosaicking technique. However,we also had to take into account the limitations imposed bythe amount of non-secure observing time and meteorologicalconditions for the granted runs. Therefore, the sample sizewas dictated by a balance between achieving a representa-tive range of galaxies properties and practical limitations inobserving time.
When constructing the sample, we also took into ac-count a range of other galaxy properties, such as inclination(with preference to face-on galaxies), surface brightness, barstructure, spiral arm structure, and environment (i.e. iso-lated, interacting and clustered). We favoured galaxies withhigh surface brightness and active star formation so thatwe could have a good distribution of H II regions across thegalaxies surface. Galaxies with bars and/or non-typical spi-ral morphology were also preferred. The final selection ofgalaxies also took into account practical factors such as op-timal equatorial right ascension and declination for the lo-cation of Calar Alto observatory, and the observable timeper night for a given object above a certain airmass (due toproblems of differential atmospheric refraction).
The PINGS sample consists of 17 galaxies within a ma-ximum distance of 100 Mpc; the average distance of the sam-ple is 28 Mpc (for H0 = 73 kms−1 Mpc−1). The final sam-ple includes normal, lopsided, interacting and barred spiralswith a good range of galactic properties and SF environ-ments with multi-wavelength public data. A good fractionof the sample belongs to the Spitzer Infrared Nearby Galax-ies Survey (SINGS, Kennicutt et al. 2003), which ensures arich set of ancillary observations in the UV, infrared, H I andradio.
The sample objects were given a different observing pri-
c© 2010 RAS, MNRAS 000, 1–26
4 Rosales-Ortega et al.
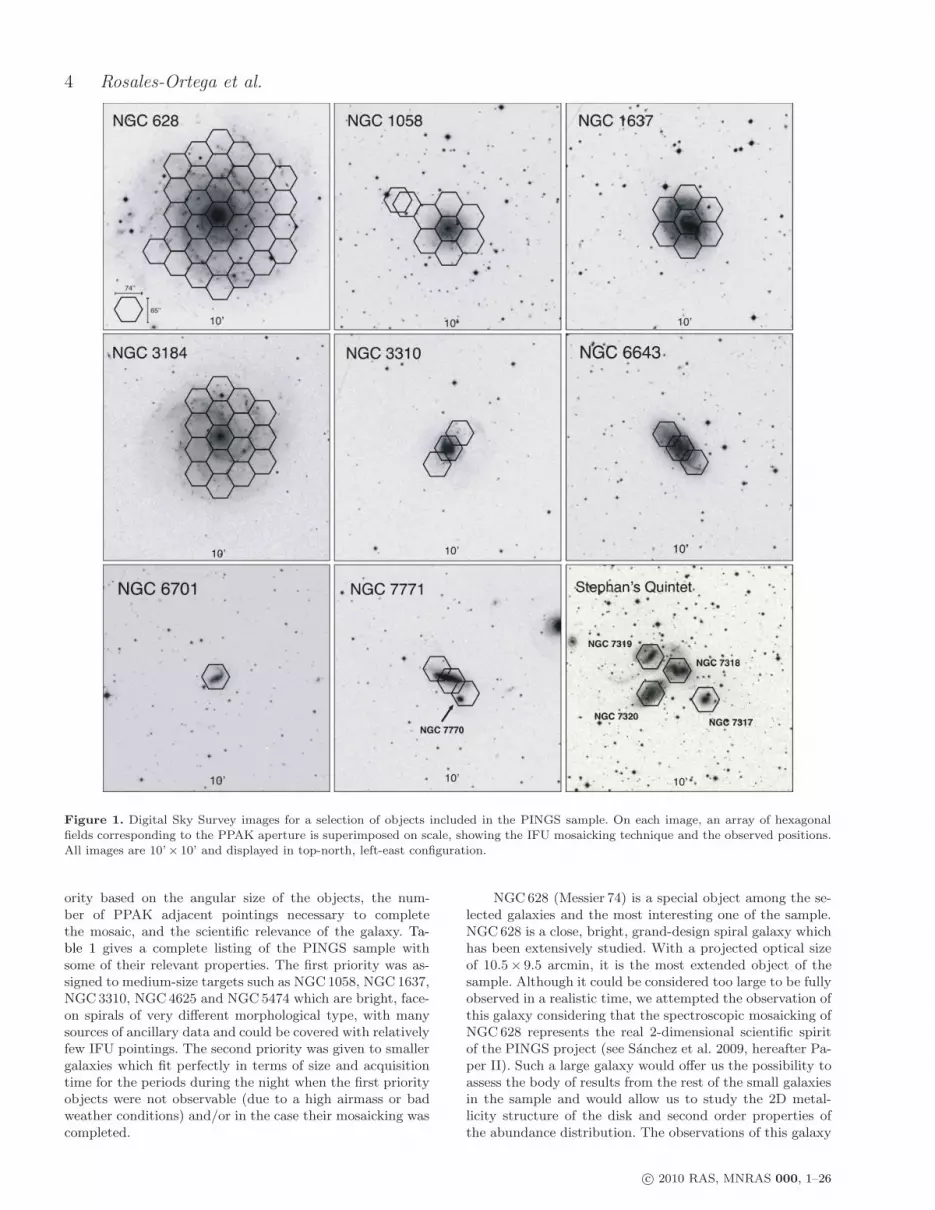
Figure 1. Digital Sky Survey images for a selection of objects included in the PINGS sample. On each image, an array of hexagonalfields corresponding to the PPAK aperture is superimposed on scale, showing the IFU mosaicking technique and the observed positions.All images are 10’× 10’ and displayed in top-north, left-east configuration.
ority based on the angular size of the objects, the num-ber of PPAK adjacent pointings necessary to completethe mosaic, and the scientific relevance of the galaxy. Ta-ble 1 gives a complete listing of the PINGS sample withsome of their relevant properties. The first priority was as-signed to medium-size targets such as NGC1058, NGC1637,NGC3310, NGC4625 and NGC5474 which are bright, face-on spirals of very different morphological type, with manysources of ancillary data and could be covered with relativelyfew IFU pointings. The second priority was given to smallergalaxies which fit perfectly in terms of size and acquisitiontime for the periods during the night when the first priorityobjects were not observable (due to a high airmass or badweather conditions) and/or in the case their mosaicking wascompleted.
NGC628 (Messier 74) is a special object among the se-lected galaxies and the most interesting one of the sample.NGC628 is a close, bright, grand-design spiral galaxy whichhas been extensively studied. With a projected optical sizeof 10.5× 9.5 arcmin, it is the most extended object of thesample. Although it could be considered too large to be fullyobserved in a realistic time, we attempted the observation ofthis galaxy considering that the spectroscopic mosaicking ofNGC628 represents the real 2-dimensional scientific spiritof the PINGS project (see Sanchez et al. 2009, hereafter Pa-per II). Such a large galaxy would offer us the possibility toassess the body of results from the rest of the small galaxiesin the sample and would allow us to study the 2D metal-licity structure of the disk and second order properties ofthe abundance distribution. The observations of this galaxy
c© 2010 RAS, MNRAS 000, 1–26

PINGS: the PPAK IFS Nearby Galaxies Survey 5
spanned a period of three-years. Hitherto, NGC628 repre-sents the largest area ever covered by an IFU, as describedbriefly in the next section and in detail in Paper II. A specialpriority was also given to NGC3184, galaxy which falls be-tween the medium first-priority and large size galaxies. Theobservations for this object spanned for 2 years, obtainingan almost complete mosaicking (see Figure 1), making thisgalaxy the 2nd largest object of the sample.
Figure 1 shows Digital Sky Survey1 images for a se-lection of galaxies listed in Table 1. The mosaicking of thelargest objects in the sample, NGC628 and NGC3184, con-sist of 34 and 16 individual IFU pointings respectively, cov-ering almost completely the spiral arms of these two brightgrand-design galaxies. The outlying pointings of NGC1058and the mosaicking configurations of NGC3310, NGC6643and NGC7771 are explained in the next section.
In summary, the PINGS sample was selected in a carefulway to find a trade-off between the size of the galaxies, theirmorphological types, their physical properties and the prac-tical limitations imposed by the instrument and the amountof observing time. The result is a comprehensive sample ofgalaxies with a good range of galactic properties and avail-able multi-wavelength ancillary data, in order to maximiseboth the original science goals of the project and the possiblearchival value of the survey.
4 OBSERVATIONS
Observations for the PINGS galaxies were carried out atthe 3.5m telescope of the Calar Alto observatory with thePostdam Multi Aperture Spectrograph, PMAS (Roth et al.2005) in the PPAK mode (Verheijen et al. 2004; Kelz et al.2006), i.e. “a retrofitted bare fibre bundle IFU which ex-pands the FOV of PMAS to a hexagonal area with a foot-print of 74× 65 arcsec, with a filling factor of 65% due togaps in between the fibres”. The PPAK unit features a cen-tral hexagonal bundle with 331 densely packed optical fibresto sample an astronomical object at 2.7 arcsec per fibre.The sky background is sampled by 36 additional fibres dis-tributed in 6 mini-IFU bundles of 6 fibres each, in a circulardistribution at ∼ 90 arcsec of the centre and at the edges ofthe central hexagon. The sky-fibres are distributed amongthe science ones in the pseudo-slit, in order to have a goodcharacterisation of the sky. Additionally, 15 fibres can beilluminated directly by internal lamps to calibrate the in-strument.
All sample galaxies were observed using the same tele-scope and instrument set-up. We used the V300 grating,covering a wavelength between 3700 – 7100 A with a reso-lution of ∼ 10 A FWHM, corresponding to ∼ 600 kms−1.With this set-up we cover all the optical strong emissionlines used in typical abundance diagnostic methods (Sanchezet al. 2007b). For the particular setup used in the PINGS
1 The Digitized Sky Survey was produced at the Space TelescopeScience Institute under U.S. Government grant NAG W-2166.The images of these surveys are based on photographic data ob-tained using the Oschin Schmidt Telescope on Palomar Mountainand the UK Schmidt Telescope. The plates were processed intothe present compressed digital form with the permission of theseinstitutions.
survey there was no need to use a order separating filter. Themain reason being that the efficiency of the instrument +telescope system (mostly the grating reflectivity and the fi-bre transmission), drops dramatically at wavelengths shorterthan ∼ 3600 A, where the transmission is 1/40000 of the oneat the peak intensity for the V300 grating (∼ 5400 A) and1/10000 of the value at redder wavelengths covered by oursurvey (∼ 6500 A). At bluer wavelengths the efficiency iseven lower. Therefore, the system by itself blocks any pos-sible 2nd order contamination up to ∼ 7200 A, and only atlarger wavelengths it is required an order separation filter(Kelz et al. 2006). The exposure times were calculated fromprevious experience with the instrument in order to obtainspectroscopy with S/N > 20 in the continuum and S/N >
50 in the Hα emission line for the brightest H II regions withthe given grating.
Different observing strategies were implemented de-pending on the size and priority of the targets. For those ob-jects with relatively small angular size, single PPAK point-ings would not sample the surface of the galaxy with enoughspatial resolution, due to the incomplete filling factor of thefibre bundle. In this case, a dithering procedure was applied(Sanchez et al. 2007a). For each individual position in dither-ing mode, the first exposure was recorded and then, twoconsecutive exposures with the same acquisition time wererecorded, but with small offsets of ∆(RA,Dec)= (1.56, 0.78)and (1.56, –0.78) arcsec with respect to the first exposure.The advantage of this method is that all gaps of the originalexposure are covered, and every single point of the ditheredfield is spectroscopically sampled within the resolution. Thepitfalls are that the exposure time and the amount of datato be processed is triple a normal frame, preventing the pos-sibility of applying this method to large mosaics. We used amean acquisition time per PPAK field in dithering mode (in-cluding set-up + integration time) of 2× 600 sec. per dither-ing position for a total of 60 min. exposure; and 3× 600 sec.for non-dithered frames.
The observations extended over a period of three-yearswith a total of 19 observing nights distributed during dif-ferent observing runs and seasons. For all the objects inthe sample, the first exposure was centered in a given ge-ometrical position which, depending on the morphology ora particular mosaicking pattern, may or may not coincidewith the bright bulge of the galaxy. Consecutive pointingsfollowed in general a hexagonal pattern, adjusting the mo-saic pointings to the shape of the PPAK science bundle asshown in Figure 1. Due to the shape of the PPAK bundleand by construction of the mosaics, 11 spectra of each point-ing corresponding to one edge of the hexagon, overlap withthe same number of spectra from the previous pointing. Thispattern was selected to maximise the covered area, but toallow enough overlapping to match the different exposurestaken under variable atmospheric conditions. Exceptions areNGC2976, NGC3310, NGC6643 and NGC7770 in whichthe mosaics were constructed to optimise the galaxy surfacecoverage as explained below.
4.1 NGC 628
NGC628 (or M74) is an extensively studied isolated grand-design Sc spiral galaxy at a distance of 9.3 Mpc in the con-stellation of Pisces. The observations for this galaxy totaled
c© 2010 RAS, MNRAS 000, 1–26

6 Rosales-Ortega et al.
Table 1. Galaxy properties of the PINGS sample. Col. (1): Galaxy name. Col. (2): Morphological type from the R3Ccatalog(de Vaucouleurs et al. 1991). Col. (3): Distances in Mpc, references: NGC628, Hendry et al. (2005); NGC1058,Eastman et al. (1996); NGC1637, Saha et al. (2006); NGC2976, Karachentsev et al. (2002); NGC3184, Leonard et al. (2002);NGC3310, Terry et al. (2002); NGC5474, Drozdovsky & Karachentsev (2000); NGC6643, Willick et al. (1997); NGC4625,NGC6701, NGC7771, & Stephan’s Quintet: Galactocentric GSR distances derived from the redshift, assumming a value ofH0 = 73 km s−1 Mpc−1. Col. (4): Projected size, major and minor axes at the B25 mag arcsec−2 from R3C, except NGC7318from Jarrett et al. (2003). Col. (5): Absolute B-band magnitude calculated from the apparent magnitude listed in the R3Ccatalog and the adopted distances to the system. Col. (6): Redshift, references: NGC628, Lu et al. (1993); NGC4625,Fisher et al. (1995); NGC6701, Theureau et al. (1998); NGC7770, Woods et al. (2006); NGC1637, NGC3310, Hayneset al. (1998); NGC2976, NGC5474, Falco et al. (1999, The Updated Zwicky Catalog); NGC1058, NGC3184, NGC6643,NGC7771, Springob et al. (2005); NGC7317, NGC7318a, NGC7318b, Hickson et al. (1992); NGC7319, NGC7320, Nishiuraet al. (2000). Col. (7): Heliocentric velocities calculated from v = zc, with no further correction applied. Col. (8): Galaxyinclination angle based on the B25 mag arcsec−2 from R3C. Col. (9): Galaxy position angle, measured positive NE, in theB25 mag arcsec−2 except for NGC1058, NGC1637, NGC7317, NGC7319, NGC7770, which are based on the Ks-band(Jarrett et al. 2003), and NGC3310, NGC4625, NGC5474 based on the r-SDSS band. Col. (10): Galaxy location.
Distance Projected size V⊙
Object Type (Mpc) (arcmin) MB z (km s−1) i P.A. Constellation(1) (2) (3) (4) (5) (6) (7) (8) (9) (10)
NGC628 . . . . . . . . SA(s)c 9.3 10.5× 9.5 −19.9 0.00219 657 24 25 Pisces
NGC1058 . . . . . . . SA(rs)c 10.6 3.0× 2.8 −18.3 0.00173 519 21 95 Perseus
NGC1637 . . . . . . . SAB(rs)c 12.0 4.0× 3.2 −18.9 0.00239 717 36 33 Eridanus
NGC2976 . . . . . . . SAc pec 3.6 5.9× 2.7 −16.9 0.00008 24 63 143 Ursa Major
NGC3184 . . . . . . . SAB(rs)cd 11.1 7.4× 6.9 −19.9 0.00194 582 21 135 Ursa Major
NGC3310 . . . . . . . SAB(r)bc 17.5 3.1× 2.4 −20.1 0.00331 993 39 163 Ursa Major
NGC4625 . . . . . . . SAB(rs)m 9.0 2.2× 1.9 −16.9 0.00203 609 29 30 C. Venatici
NGC5474 . . . . . . . SA(s)cd 6.8 4.8× 4.3 −17.9 0.00098 294 27 91 Ursa Major
NGC6643 . . . . . . . SA(rs)c 20.1 3.8× 1.9 −19.8 0.00495 1485 60 37 Draco
NGC6701 . . . . . . . SB(s)a 57.2 1.5× 1.3 −20.8 0.01323 3969 32 24 Draco
NGC7770 . . . . . . . S0 58.7 0.8× 0.7 −19.4 0.01414 4242 27 50 Pegasus
NGC7771 . . . . . . . SB(s)a 60.8 2.5× 1.0 −20.8 0.01445 4335 66 68 ”
Stephan’s Quintet PegasusNGC7317 . . . . . E4 93.3 1.1× 1.1 −20.3 0.02201 6603 12 150 ”
NGC7318A . . . E2 pec 93.7 0.9× 0.9 −20.5 0.02211 6633 . . . . . . ”
NGC7318B . . . SB(s)bc pec 82.0 1.9× 1.2 −20.6 0.01926 5778 . . . . . . ”
NGC7319 . . . . . SB(s)bc pec 95.4 1.7× 1.3 −20.8 0.02251 6753 41 148 ”
NGC7320 . . . . . SA(s)d 13.7 2.2× 1.1 −17.5 0.00262 786 59 132 ”
six observing nights and 34 different pointings. The cen-tral position was observed in dithering mode to gain spatialresolution, while the remaining 33 positions were observedwithout dithering due to the large size of the mosaic. Sevenpositions were observed on the 28th October 2006, 19 posi-tions were observed between the 10th and 12th of Decem-ber 2007, 1 position on August 9th 2008 and the remainingpointings on October 28th 2008. Figure 1 shows the mosaicpattern covering NGC628 consisting in a central positionand consecutive hexagonal concentric rings. The area cov-ered by all the observed positions accounts approximatelyfor 34 arcmin2, making this galaxy the largest area evercovered by a IFU mosaicking. The spectroscopic mosaic con-tains 11094 individual spectra, considering overlapping andrepeated exposures (see Paper II).
4.2 NGC 1058
NGC1058 is a well studied Sc spiral with a projected sizeof 3.0× 2.8 arcmin at a distance of 10.6 Mpc, in the con-stellation of Perseus. The observations for this galaxy wereperformed on three consecutive nights from the 7th to the9th December 2007. The mosaic consists of the central po-
sition and one concentric ring, covering most of the galaxysurface within one optical radius (defined by the B-band25th magnitude isophote). Ferguson et al. (1998) found theexistence of H II regions out to and beyond two optical radiiin this galaxy. We tried to observe these intrinsically inter-esting objects by performing a couple of offsets of 2 and2.5 arcmin north-east from the central position. These 2 ad-ditional position were merged to the original 7 tiles for amosaic, covering an area of approximately 8.5 arcmin2 (seeFigure 1). All positions (with the exception of one blind off-set) were observed in dithering mode, accounting for a spec-troscopic mosaic containing 7944 individual spectra. At thetime of the observations, we were able to observe the recentlydiscovered supernova 2007gr, a SN type Ic located at 24”.8west and 15”.8 north of the nucleus of NGC 1058 betweentwo foreground stars (see subsection 7.4 and Figure 11).
4.3 NGC 1637
NGC1637 is a SAB distorted galaxy in Eridanus with aprojected size of 4.0× 3.2 arcmin, at a distance of 12 Mpc.This galaxy presents a clear asymmetry with a third well-defined arm seen in optical images, an unusually extended
c© 2010 RAS, MNRAS 000, 1–26

PINGS: the PPAK IFS Nearby Galaxies Survey 7
NGC628 NGC1058
NGC1637 NGC3184
Figure 2. Examples of the spectroscopic mosaics of NGC628, NGC1058, NGC1637 and NGC3184. Each panel shows an intensity levelnarrow-band map centered at Hα (6563 A) in units of 10−16 erg s−1 cm−2 arcsec−2. Note the effect of surface area coverage for dithered(e.g. NGC1058, NGC1637) vs. non-dithered (e.g. NGC628, NGC3184) observations, where the gaps between the fibres are clearly seen.
H I envelope (DH I /D25 = 3.0), and an optical centre thatdiffers from the kinematic centre by 9 arcsec (Roberts et al.2001). NGC1637 was observed during December 8th to 10th2007. The mosaic was built with a central position and oneconcentric ring of 6 pointings (see Figure 1), covering mostof the galaxy surface within one optical radius. The mosaiccovers approximately 7 arcmin2. This galaxy has a full spec-troscopic mosaic containing 6951 individual spectra.
4.4 NGC 2976
NGC2976 is a SAc peculiar spiral galaxy with strong emis-sion line spectra with a projected size of 5.9× 2.7 arcminin Ursa Major, at a distance of 3.6 Mpc, being the clos-est object of the sample. The observations for NGC2976were carried out on October 30th 2008. Given the distortedmorphology of the galaxy a more convenient mosaic pattern
was designed. Two pointings were observed for this object,corresponding to the central region of NGC2976. The obser-vations were performed in non-dithering mode. The spectro-scopic data for this galaxy consist of 662 individual spectra.
4.5 NGC 3184
NGC3184, a SAB face-on galaxy located in Ursa Major,has the 2nd largest angular size in the sample. It covers anarea of 7.4× 6.9 arcmin at a distance of 11 Mpc. NGC3184has been classified as one of the metal-richest galaxies everobserved (McCall et al. 1985; van Zee et al. 1998), andwhich has also harboured recently a supernova explosion(SN 1999gi) (Nakano & Kushida 1999). Three concentricrings are necessary to cover the entire optical disk. Observa-tions for this galaxy were performed on December 10th 2007,following the standard mosaicking pattern with a central po-
c© 2010 RAS, MNRAS 000, 1–26

8 Rosales-Ortega et al.
NGC3310 NGC6701
NGC7770 & 7771 Stephan’s Quintet
Figure 3. Spectroscopic mosaics of NGC3310, NGC6701, NGC7770, and the Stephan’s Quintet. Note the effect of dithered (top panels)vs. non-dithered (bottom panels) observations. Units as in Figure 2.
sition and one complete ring of 7 IFU pointings. Then, onApril 27th and 28th 2009, 9 additional pointings were ob-served covering partially a second concentric ring as shownin Figure 1. The area covered by all the observed positionsis ∼ 16 arcmin2. The spectroscopic data for this galaxy con-sists of 5296 individual spectra.
4.6 NGC 3310
NGC3310 is a very distorted spiral galaxy with strong starformation in the constellation of Ursa Major, at a distanceof 17.5 Mpc. It covers an area of 3.1× 2.4 arcmin in the op-tical B-band, with a very bright central nucleus, surroundedby a ring of luminous H II regions. Different studies of thisgalaxy suggest a recent merging episode which triggered theburst of star formation (Kregel & Sancisi 2001; Wehner et al.2006, and references atherein). Given its morphology, a tai-lored mosaic pattern was constructed for this galaxy (see
Figure 1). Three pointings cover the surface of NGC3310with a central position centered in the galaxy’s nucleus andtwo offsets of (–35, 35) and (35, –35) arcsec in (RA,Dec) innorth-west and south-east directions respectively. The ob-servations were carried out on December 8th 2007, and wereperformed in dithering mode. This galaxy has a full spec-troscopic mosaic, which covers an area of approximately 2.8arcmin2. The spectroscopic data for this galaxy totals 2979individual spectra.
4.7 NGC 4625
NGC4625 is a low-luminosity SAB, one-armed Magellanicspiral galaxy thought to be interacting with the also single-armed spiral NGC4618 in Canes Venatici, at a distance of9 Mpc. The optical size of this galaxy covers an area ofapproximately 2.2× 1.9 arcmin, however Gil de Paz et al.(2005) discovered an extended UV disk reaching to 4 times
c© 2010 RAS, MNRAS 000, 1–26

PINGS: the PPAK IFS Nearby Galaxies Survey 9
Table 2. Summary of observations of the PINGS sample. Col. (1):Galaxy name. Col. (2): Number of individual IFU positions ob-served for each galaxy mosaic. Col. (3): Status of the mosaicking;when a percentage is shown, the number in parentheses repre-sents the total number of pointings necessary to cover the opticalsurface of the galaxy. Col. (4): Total number of spectra for each
mosaic. Col. (5): Comments: a) Largest area ever covered by a IFUmosaicking, with a total of ∼ 35 arcmin2; b) An offset position ofNGC1058 was not observed in dithering mode (see Figure 2); c)Galaxy with the second largest area of the sample; d) NGC7770within the field; e) NGC7318A and NGC7318B are included inone field; ⋆All pointings observed in dithering mode.
Object Positions Mosaic Spectra Notes(1) (2) (3) (4) (5)
NGC628 34 92% (37) 13571 a
NGC1058 9 complete 7944 ⋆,b
NGC1637 7 complete 6951 ⋆
NGC2976 2 22% (9) 662
NGC3184 16 84% (19) 5296 c
NGC3310 3 complete 2979 ⋆
NGC4625 1 14% (7) 993 ⋆
NGC5474 6 86% (7) 5958 ⋆
NGC6643 3 complete 2979 ⋆
NGC6701 1 complete 993 ⋆
NGC7771 3 complete 993 d
Stephan’s Q. 4 complete 1324 e
its optical radius showing evidence of recent star formation.The observation of this galaxy was performed on December9th 2007 with one single pointing in dithering mode coveringthe optical radius of NGC4625. The spectroscopic data forthis object consists of 993 individual spectra.
4.8 NGC 5474
NGC5474 is a strongly lopsided spiral galaxy covering anarea of 4.8× 4.3 arcmin in Ursa Major, at a distance of 7Mpc. We observed this galaxy with a standard mosaic con-figuration consisting of one central position and one con-centric ring. All pointings were observed in dithering mode.Observations were carried out in two different periods; 4positions were observed during August 9th and 10th 2008,while 2 additional pointings were observed on the 27th April2009. Given the distorted morphology of this galaxy, thecentral position of the mosaic does not coincide with thebright bulge; a 30 arcsec offset in declination was performedtowards the south, so that the area covered by the IFU mo-saicking includes most of the optical disk of the galaxy ina symmetric way. The area covered by all the observed po-sitions is approximately 6 arcmin2. The spectroscopic datafor this galaxy totals 5958 individual spectra.
4.9 NGC 6643
NGC6643 is a SAc galaxy in Draco, with a projected sizeof 3.8× 1.9 arcmin in the B-band, at a distance of 20 Mpc.A tailored mosaic pattern for this galaxy was constructed inorder to cover most of its optical area. Three pointings coverthe surface of NGC6643 with a central position centered onthe bulge and two offsets of (37, 34) and (–35, –34) arcsec
in (RA,Dec) in north-east and south-west directions respec-tively (see Figure 1). Observations were performed on June2nd 2008 for the first 2 positions and on August 10th 2008for the 3rd position, all of them in dithering mode. At thetime of the first observing run, we were able to observe thesupernova 2008bo, a SN type Ib located at 31” north and 15”west of the nucleus of NGC6643. This galaxy has a completespectroscopic mosaic covering an area of approximately 2.8arcmin2. The data consists of 2979 individual spectra. How-ever, due to a technical problem with the instrument set-up,positions 1 and 2 do not cover the usual wavelength range,but are shifted towards the red by approximately 100 A.
4.10 NGC 6701
NGC6701 is a small barred spiral in Draco with an angu-lar size of 1.5× 1.3 arcmin, at a distance of 57 Mpc. Thisgalaxy was considered to be an isolated galaxy, but studiesof NGC6701 have discovered morphological and kinemat-ical features that are consequence of an interaction, mostprobably with a companion at 73 kpc in projected distance(Marquez et al. 1996). The observation of NGC6701 wascarried out on August 9th 2008 with one single pointing indithering mode covering the optical radius of the galaxy (seeFigure 1). The spectroscopic data of this galaxy contains 993individual spectra.
4.11 NGC 7770 and NGC 7771
The main target for this mosaic was the galaxy NGC7771,a barred spiral in Pegasus with an optical B-band size of2.5× 1.0 arcmin at a distance of 59 Mpc. This galaxy ispart of an interactive system containing mainly the face-onspiral NGC7769 and the faint lenticular NGC7770 (Nord-gren et al. 1997). The central part of NGC7771 containsa massive circumnuclear starburst which was probably trig-gered by the interaction with the other members of the group(Smith et al. 1999, and references therein). Due to the pro-jected size of this galaxy, the mosaic pattern was constructedwith three IFU positions. The central position of the mo-saic has an offset of (–15, –15) arcsec in (RA,Dec) from thegeometrical centre of the galaxy (see Figure 1). Two ad-ditional positions were observed with offsets of (37, 33) and(–37, –33) arcsec. A second member of the interacting group,NGC7770, a small S0 galaxy with an optical size 0.8× 0.7arcmin was observed within the field of the mosaic pattern.Observations of all 3 positions were performed on October30th 2008. The spectroscopic data for this galaxy contains993 individual spectra.
4.12 Stephan’s Quintet
The Stephan’s Quintet is one of the most famous and well-studied group of galaxies, consisting of NGC7317, 7318A,7318B, 7319 and 7320 in Pegasus. The distance to this com-pact group of galaxies has been in debate due to the pres-ence of the brightest member, NGC7320, which exhibits asmaller redshift than the others, suggesting that is a fore-ground object lying along the line of sight of the other fourinteracting galaxies. Although some controversy prevailed(Balkowski et al. 1974; Kent 1981), recent observations by
c© 2010 RAS, MNRAS 000, 1–26

10 Rosales-Ortega et al.
HST show that individual stars, clusters, and nebulae areclearly seen in NGC7320 and not in any of the other galax-ies (Gallagher et al. 2001; Appleton et al. 2006, and refer-ences therein). Four individual pointings in non-ditheringmode were observed on August 10th 2008, three of whichwere centered at the bright bulges of NGC7317, 7319 and7320, while the last pointing was centered in configurationto cover NGC7318A and NGC7318B (see Figure 1). Thespectroscopic data for all pointings of the Stephan’s Quin-tet contains 1324 individual spectra.
5 DATA REDUCTION
The reduction of IFS observations possesses an intrinsiccomplexity given the nature of the data and the vast amountof information recorded in a single observation. This com-plexity is increased if one considers creating an IFU spectro-scopic mosaic of a given object for which the observationswere performed not only on different nights, but even indifferent years, with dissimilar atmospheric conditions, andslightly differing instrument configurations.
In this section we give an overview of the IFS data re-duction process for all the observations of the PINGS sam-ple. In general, the reduction process for the all pointingsfollows the standard steps for fibre-based integral field spec-troscopy. However, the construction of the mosaics out ofthe individual pointings requires further and more compli-cated reduction steps than for a single, standard IFU obser-vation. These extra steps arise due to the special mosaick-ing pattern for some of the objects, the differences in theatmospheric transparence and extinction, slight geometricalmisalignments, sky-level variations, differential atmosphericrefraction, etc. A complete explanation of the complex dataprocessing for the creation of the PINGS mosaics sampleis beyond the scope of this paper, but the reader will finda detailed description of the IFS data reducing in Sanchez2006 (hereafter San06) and additional information on themosaicking technique for the PINGS sample in the descrip-tion of the PPAK-IFS survey of NGC628 (Paper II).
Following San06, all the data reduction steps can besummarised as follows: a) Pre-reduction. b) Identification ofthe location of the spectra on the detector. c) Extractionof each individual spectrum. d) Distortion correction of theextracted spectra. e) Application of wavelength solution. f)Fibre-to-fibre transmission correction. g) Flux calibration.h) Allocation of the spectra to the sky position. i) Cubeand/or dithered reconstruction (if any).
The raw data extracted from a PINGS observation con-sists of a collection of spectra, stored as 2D frames, alignedalong the dispersion axis. The pre-reduction of the IFS dataconsists of all the corrections applied to the CCD that arecommon to the reduction of any CCD-based data, i.e. biassubtraction, flat fielding (in the case of PINGS, using twi-light sky exposures), combinations of different exposuresof the same pointing and cosmic ray rejection. The pre-reduction processing was performed using standard IRAF2
2 IRAF is distributed by the National Optical Astronomy Obser-vatories, which are operated by the Association of Universities forResearch in Astronomy, Inc., under cooperative agreement withthe National Science Foundation.
packages for CCD pre-reduction steps while the main re-duction was performed using the R3D software for fibre-fedand integral-field spectroscopy data (San06) in combinationwith the E3D visualization software (Sanchez 2004).
On a raw data frame, each spectrum is spread over acertain number of pixels along the cross-dispersion axis. Thespectra are generally not perfectly aligned along the disper-sion axis due to the configuration of the instrument, theoptical distortions, the instrument focus and the mechanicalflexures. Therefore, in order to find the location of each spec-trum at each wavelength along the CCD and to extract itscorresponding flux, we made use of continuum illuminatedexposures taken at each pointing corresponding to a differentorientation of the telescope. Each spectrum was extractedfrom the science frames by co-adding the flux within an aper-ture of 5 pixels assuming a cut across the cross-dispersionaxis found by iterative Gaussian fits (see subsection 6.5 fora detailed description of this reduction step). Since the mis-alignments of the fibres with the pseudo-slit also affect thewavelength solution, we require lamp exposures obtained ateach observed position to find a wavelength solution for eachindividual spectrum. Wavelength calibration was performedusing HeHgCd+ThAr arc lamps obtained through the in-strument calibration fibres. Differences in the fibre-to-fibretransmission throughput were corrected by creating a mas-ter fibreflat from twilight skyflat exposures taken in everyrun.
The reduced IFS data can be stored using different dataformats, all of which should allow to store the spectral in-formation in association with the 2D position on the sky.Two data formats are widely used in the IFS community:datacubes (3-dimensional images) and Row-Staked-Spectra(RSS) files. Datacubes are only valid to store reduced datafrom instruments that sample the sky-plane in a regular-gridor for interpolated data. In this case the data are stored in a3-dimensional FITS image, with two spatial dimensions andone corresponding to the dispersion axis. RSS format is a2D FITS image where the X and Y axes contain the spec-tral and spatial information respectively, regardless of theirposition in the sky. This format requires an additional file(either a FITS or ASCII table), where the position of thedifferent spatial elements on the sky is stored. RSS is widelyused by IFUs with a discontinuous sampling of the sky, asit is the case for PPAK. We chose to store the PINGS datain the RSS format, with corresponding position tables.
Once the spectra are extracted, corrected for distor-tions, wavelength calibrated, and corrected for differences intransmission fibre-to-fibre, they must be sky-subtracted andflux-calibrated. One of the most difficult steps in the datareduction is the correct subtraction of the night sky emis-sion spectrum. In long-slit spectroscopy the sky is sampledin different regions of the slit and a median sky spectrumis obtained by spectral averaging or interpolation. This ispossible due to the size of the long-slit compared with thesize of the astronomical objects of interest. However, in IFSthe techniques vary depending on the geometry of the ob-served object and on the variation of the sky level for agiven observation. By construction, many of the positionsof the PINGS mosaics (specially those in the galaxy centre)would fill the entire FOV of the IFU, and none of the spax-
c© 2010 RAS, MNRAS 000, 1–26
PINGS: the PPAK IFS Nearby Galaxies Survey 11
els3 would be completely free of galaxy “contamination”. Inthis case, we obtained supplementary sky exposures (imme-diately after the science frames) applying large offsets fromthe observed positions and between different exposures, wethen used these “sky-frames” to perform a direct sky sub-traction of the reduced spectra. On the other hand, if theFOV is not entirely filled by the object, it is possible to selectthose spaxels (i.e. the sky-fibres in the case of PPAK) withspectra free of contamination from objects, average themand subtract the resulting sky-spectrum from the sciencespectra. We used this technique for observations in the lastring of a mosaic or at the edges of the optical surface of thegalaxies, where the sky-fibres bundles did actually samplethe sky emission.
Once the sky emission has been subtracted, we needto flux calibrate the observed frames. Absolute spectropho-tometry with fibre-fed spectrographs is rather complex; asin slit-spectroscopy, where slit losses impose severe limita-tions, IFU spectrographs can suffer important light lossesdue to the geometry of the fibre-arrays. The flux calibra-tion requires the observation of spectrophotometric standardstars during the night. Given that the PPAK IFU bundledoes not cover the entire FOV due to gaps among the fi-bres, the observation of calibration standard stars is proneto flux losses, especially when the standards are not com-pletely well centered in a single IFU spaxel. However wedeveloped a method which takes into account the flux lossesdue to the gaps in the fibre-bundle, the pointing misalign-ments and PSF of the observed standard stars, as well ascorrections for minor cross-talk effects, airmass, local opti-cal extinction and additional information provided by broadand narrow-band imaging photometry in order to obtain themost accurate possible spectrophotometric flux-calibrationwithin the limits imposed by the instrumentation.
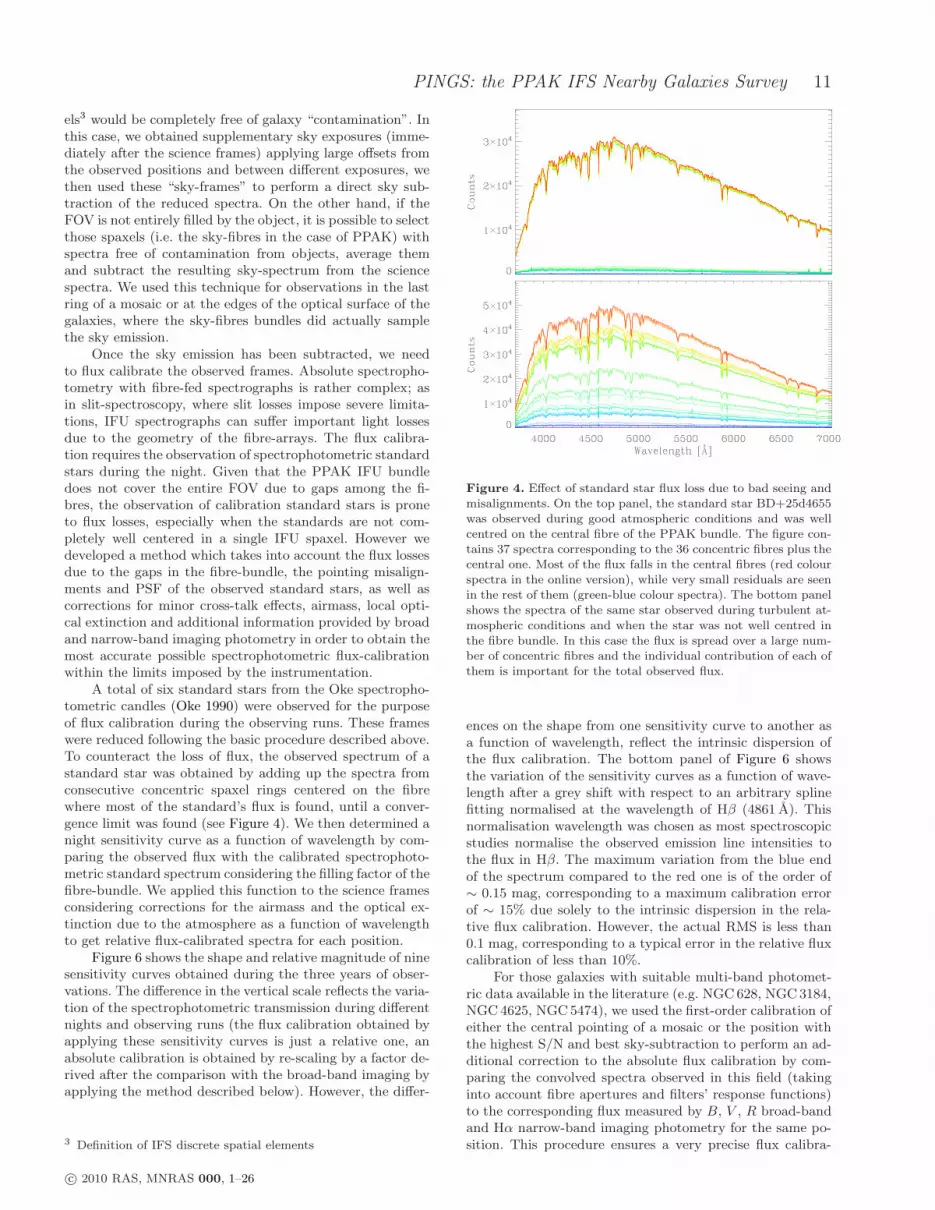
A total of six standard stars from the Oke spectropho-tometric candles (Oke 1990) were observed for the purposeof flux calibration during the observing runs. These frameswere reduced following the basic procedure described above.To counteract the loss of flux, the observed spectrum of astandard star was obtained by adding up the spectra fromconsecutive concentric spaxel rings centered on the fibrewhere most of the standard’s flux is found, until a conver-gence limit was found (see Figure 4). We then determined anight sensitivity curve as a function of wavelength by com-paring the observed flux with the calibrated spectrophoto-metric standard spectrum considering the filling factor of thefibre-bundle. We applied this function to the science framesconsidering corrections for the airmass and the optical ex-tinction due to the atmosphere as a function of wavelengthto get relative flux-calibrated spectra for each position.
Figure 6 shows the shape and relative magnitude of ninesensitivity curves obtained during the three years of obser-vations. The difference in the vertical scale reflects the varia-tion of the spectrophotometric transmission during differentnights and observing runs (the flux calibration obtained byapplying these sensitivity curves is just a relative one, anabsolute calibration is obtained by re-scaling by a factor de-rived after the comparison with the broad-band imaging byapplying the method described below). However, the differ-
3 Definition of IFS discrete spatial elements
Figure 4. Effect of standard star flux loss due to bad seeing andmisalignments. On the top panel, the standard star BD+25d4655was observed during good atmospheric conditions and was wellcentred on the central fibre of the PPAK bundle. The figure con-tains 37 spectra corresponding to the 36 concentric fibres plus thecentral one. Most of the flux falls in the central fibres (red colourspectra in the online version), while very small residuals are seenin the rest of them (green-blue colour spectra). The bottom panelshows the spectra of the same star observed during turbulent at-
mospheric conditions and when the star was not well centred inthe fibre bundle. In this case the flux is spread over a large num-ber of concentric fibres and the individual contribution of each ofthem is important for the total observed flux.
ences on the shape from one sensitivity curve to another asa function of wavelength, reflect the intrinsic dispersion ofthe flux calibration. The bottom panel of Figure 6 showsthe variation of the sensitivity curves as a function of wave-length after a grey shift with respect to an arbitrary splinefitting normalised at the wavelength of Hβ (4861 A). Thisnormalisation wavelength was chosen as most spectroscopicstudies normalise the observed emission line intensities tothe flux in Hβ. The maximum variation from the blue endof the spectrum compared to the red one is of the order of∼ 0.15 mag, corresponding to a maximum calibration errorof ∼ 15% due solely to the intrinsic dispersion in the rela-tive flux calibration. However, the actual RMS is less than0.1 mag, corresponding to a typical error in the relative fluxcalibration of less than 10%.
For those galaxies with suitable multi-band photomet-ric data available in the literature (e.g. NGC628, NGC3184,NGC4625, NGC5474), we used the first-order calibration ofeither the central pointing of a mosaic or the position withthe highest S/N and best sky-subtraction to perform an ad-ditional correction to the absolute flux calibration by com-paring the convolved spectra observed in this field (takinginto account fibre apertures and filters’ response functions)to the corresponding flux measured by B, V , R broad-bandand Hα narrow-band imaging photometry for the same po-sition. This procedure ensures a very precise flux calibra-
c© 2010 RAS, MNRAS 000, 1–26

12 Rosales-Ortega et al.
Figure 5. Observed standard stars on the 9th December 2007.The top panel figure shows a comparison of the night flux cal-ibration applied to the observed stars (in colour in the onlineversion) and the corresponding calibrated fluxes. The panel be-low show the residuals in magnitudes as a function of wavelengthfor each star. The points with relatively large deviations are dueto strong sky emission lines and cosmetic defects of the CCD.
tion and sky extinction correction for this master pointing.To our knowledge, no other IFS observations have ever at-tempted to get such (instrument-limited) spectrophotome-try accuracy. All galaxies belonging to the SINGS samplewere corrected by this method using their ancillary data asdescribed in more detail in Paper II.
After reducing each individual pointing with a first-order flux calibration and with the help of the absolute flux-calibrated master pointing, we built a single RSS file for thewhole mosaic following an iterative procedure. The processstarts in the master pointing chosen for a specific mosaic,i.e. the pointing that has the best possible flux calibrationand sky extinction correction, with the best signal-to-noiseand the most optimal observing conditions regardless of thegeometric position of the pointing in the mosaic. Taking thismaster pointing as a reference, the mosaic is constructed byadding consecutive pointings following the particular mo-saic geometry. During this process, the new added pointingis re-scaled by using the average ratio of the brightest emis-sion lines found in the overlapping spectra (which is thenreplaced by the average between the previous pointing andthe new re-scaled spectra). In most cases the scale factor isfound to be between 0.7 and 1.3 with respect to the masterpointing.
However, this ratio is wavelength dependent (speciallyin the cases of variable photometric conditions between theobservations). Therefore as a second-order correction, we fit-ted the variations found between the previous pointing andthe new re-scaled overlapping spectra to a low order polyno-mial function and divided all the spectra in the new pointingby the resulting wavelength dependent scale. This correctionhas little effect on the data when the observations were per-
Figure 6. Variation of the spectrophotometric transmission asa function of wavelength. The top panel shows nine sensitivitytransmission curves using different calibration standard stars. Thethick dark line is a 3rd degree spline fitting to the data. The panelbelow shows the dispersion in magnitudes after a grey re-scaling ofall the sensitivity curves with respect to the spline fit normalisedat the Hβ wavelength (4861 A).
formed during the same or consecutive nights, as it is thecase for the small mosaics. However, we accounted variationsafter all the possible corrections of the order of 10-15% inthe extreme cases when the observations were carried outat different epochs (e.g. NGC628, NGC3184). This level oferror is what we expect from observations performed duringdifferent nights and observing runs, reflecting the variationof the spectrophotometric transmission from night to night(see Figure 6). The procedure was repeated for each mosaicuntil the last pointing is included (except for the Stephan’sQuintet, where not actual overlapping occurs), ending witha final set of individual spectra and their corresponding po-sition tables. This process ensures a homogenous flux cal-ibration and sky extinction correction for the entire dataset.
6 ERRORS AND UNCERTAINTIES IN THEDATA SAMPLE
During the process of data reduction and basic analysis, wehave identified several possible sources of errors and uncer-tainties in the PINGS data set. Each of them contributein a different way and magnitude to the overall error bud-get associated with the observations. These are in order ofimportance: 1) sky subtraction, 2) flux calibration, 3) differ-ential atmospheric refraction (DAR), 4) cross-talk, and 5)second order spectra. In this section we describe the natureof each of these sources of errors, the tests performed in or-der to understand their effects on the accuracy of the data,and the techniques applied to minimise them.
c© 2010 RAS, MNRAS 000, 1–26

PINGS: the PPAK IFS Nearby Galaxies Survey 13
6.1 Sky subtraction
As mentioned before, sky subtraction is one of the mostdifficult steps in the IFS reduction process and it is partic-ularly complex for the nature of the observing technique ofPINGS. As described in Sanchez (2006), a deficient sky sub-traction in this sort of data has several consequences: “thecontamination of the sky emission lines along the spectrawhich prevents the detection and/or correct measurementof relatively weak nebular emission lines (e.g. the weak tem-perature sensitive [O III] λ4363, which is located in the samespectral region as the strong Hg I λ4358 sky line), and alsoaffects the shape and intensity of the continuum, which isimportant for the analysis of the stellar populations and thedetermination of reddening”. In fact, we made use of themosaicking method in order to find the best possible skysubtraction. Due to the shape of the PPAK bundle and byconstruction of the mosaics in the standard mosaic configu-ration, 11 spectra of a given pointing (corresponding to oneedge of the hexagon) overlap with the same number of spec-tra from the previous pointing (see NGC628 or NGC3184in Figure 2). This allows the comparison of the same ob-served regions at different times and with different atmo-spheric conditions.
For a non-standard configuration the number of over-lapping fibres is larger (e.g. NGC3310). These overlappingspectra can be compared and used to correct for the skyemission of the adjacent frame. However, prior to perform-ing the sky subtraction it is required to visually check thatno residual of the galaxy is kept in the derived spectrum.This can be the case if the transmission changed substan-tially during the observation of the adjacent frames. Thesetechniques proved to result in good sky subtraction in mostcases. On the other hand, when we were forced to obtainsupplementary large-angle offset sky-exposures for the in-ner pointings in the mosaics that were completely filled bythe target, we found that when the sky exposure is takenwithin a few minutes of the science exposure it produces agood subtraction. For those cases in which the atmosphericconditions changed drastically and/or the sky subtractionappeared to be poor, we combined different sky frames withdifferent weights to derive a better result.
One way of assessing the goodness of the sky subtrac-tion is to check for sky residuals in the subtracted spectra.The galaxy mosaic more prone to be affected by residualsin the sky subtraction is NGC628, which as explained insection 4, was observed during six nights along four observ-ing runs. Therefore we would expect that the spectroscopicmosaic of this galaxy would show the most extreme effectsdue to the sky subtraction to be found in the PINGS sam-ple, given all the variations in transparency and photometricconditions of the night-sky along the three years of observa-tions.
In order to obtain a quantitative assessment of the qual-ity of the sky subtraction, we performed two different datareductions of the spectroscopic mosaic of NGC628. In thefirst reduction, the sky subtraction was performed directlywith the average spectrum of the sky fibres at each posi-tion, without considering the overlapping spectra betweenpointings, and not accounting for the object contaminationin the sky fibres. Therefore, in this first reduction we applieda “poor” sky subtraction. For the second reduction, we ap-
plied an individual sky subtraction per mosaic position usingthe techniques described above, i.e. applying corrections us-ing the overlapping spectra, checking for galaxy residuals inthe derived sky spectrum, using the sky exposures obtainedby large offsets for the most internal regions of the galaxy,and combining different sky frames with different weights inthose cases when there were important changes in the trans-mission between pointings observed during the same night.We refer to this reduction as the “refined” sky subtraction.
Airglow is the most important component of the light ofthe night-sky spectrum at Calar Alto observatory, althougha substantial fraction of the spectral features is due to airpollution (Sanchez et al. 2007). The strongest sky line inthe Calar Alto night-sky spectrum is the [O I] λ5577 line,followed by the [O I] λ6300 line, both produced by airglowwith a notorious stronger effect near twilight. A deficientsky subtraction can be recognised by residual features ofthe sky lines in the derived spectra, this effect is clearlyseen in the [O I] λ5577 sky line which is located in a spec-tral region without any important nebular emission line. Ingeneral terms, (without considering variations in the trans-parency of the sky), a residual in emission of this line wouldimply a subtraction of the sky spectrum of slightly lowerstrength than required, while an absorption feature wouldimply an over-correction.
In order to make a comparative analysis of the strengthof the sky residuals in the two data reductions of NGC628described above, we measured the equivalent width (EW)of the residual features centered at the [O I] λ5577 line. Fornumerical reasons (regions of null continuum), the local con-tinuum in the neighbourhood of the [O I] λ5577 sky line wasre-scaled to a flux level of 10−16 erg s−1 cm−2 A−1 in everysingle spectrum of both mosaics. EWs with negative signcorrespond to residual emission features, while positive EWscorrespond to absorption features.
Figure 7 shows the value of the EW residuals for the[O I] λ5577 line for both data reductions as a function of thepointing position in the spectroscopic mosaic. Each posi-tion bin contains 331 values corresponding to the number ofspectra per pointing, a total of 11104 values are shown, cor-responding to the 34 positions observed for NGC628. Thegreen dots correspond to the poor sky subtraction reduction,while the blue dots correspond to the refined sky subtraction(see the online version of this plot). There is a considerableamount of scatter of the EW residual value for the poor skysubtraction compared to the refined one. In the first twopointings of the mosaic (which correspond to central posi-tions of the galaxy), there are strong residuals in emissionfor the poor reduction, while the residuals have been min-imised in the refined one. Figure 7 shows clear evidence ofthose pointings in which the sky transparency varied by aconsiderable amount (positions 4, 5, 11, 12, 23, 24, 28, 29,33, 34). In all the pointings, the scatter in the residuals isimproved in the refined reduction with respect to the firstone. This effect is more notorious between positions 13 to22. The poor sky subtraction yields very strong sky residu-als in emission for positions 33 and 34, while in the refined
reduction these are minimised.
At the chosen continuum level used for this exercise,a (absolute) value of 5 A in EW for the [O I] λ5577 resid-ual line in emission corresponds approximately to a flux in-tensity value of 5 × 10⁻¹⁶ erg s−1 cm−2, while a value of
c© 2010 RAS, MNRAS 000, 1–26

14 Rosales-Ortega et al.
Figure 7. Equivalent width values for the emission and absorp-tion residual features of the [O I] λ5577 sky line as a function ofthe observed position for the spectroscopic mosaic of NGC628.Positive values correspond to absorption features, while negativevalues to emission residuals. The local continuum level was re-scaled to the same value in order to make this comparison. Thegreen dots (in the online version) correspond to a poor sky sub-traction, while the blue dots represent the refined reduction asexplained in the text. The two horizontal dotted lines mark the
threshold EW values of residuals features corresponding to a goodsky subtraction.
10 A corresponds to ∼ 10 × 10−16 erg s−1 cm−2. The aver-age flux intensity of the [O I] λ5577 sky line in Calar Altois of the order of 33 × 10−16 erg s−1 cm−2 (Sanchez et al.2007). However, from a sample of 500 sky spectra acquiredduring the three years of observation we measured the in-tensity of the [O I] λ5577 in the range between 30 and 60× 10−16 erg s−1 cm−2, with a mean value of 44. Therefore, avalue of 5 A in EW for a residual emission feature would cor-respond to ∼ 8–10% of the total emission of the [O I] λ5577line. Visual inspection of the spectra with emission residualof the order of 5 A in EW confirms that this value couldbe considered as the threshold for a good sky subtraction.Spectra with emission or absorption residuals with absoluteEW values less than 5 A could be considered to have a goodsubtraction, for features above this value the effects of adeficient sky subtraction are evident.
The two horizontal dotted lines in Figure 7 indicate the±5 EW threshold value for both emission and absorptionfeatures. These two lines encompass a region for which thespectra can be considered with a good sky subtraction. Thepoor sky subtraction (green) shows a lot of scatter and asmall fraction of the spectra falls within these limits. On theother hand, for the refined reduction (blue) a total of 9629spectra fall within these limits, i.e. 87% of the total mosaic.The number of spectra with sky subtraction problems forwhich |EW| > 5 A is 1475, i.e 13% of the mosaic, these spec-tra are found in those pointings with extreme transparencyvariations as expected.
Figure 8 shows the histograms of the EW values for bothdata reductions, the poor sky subtraction in green and therefined reduction in blue colour following Figure 7 (see theonline version of this plot). The top panels show the distri-bution of residual emission values, while the bottom panels
Figure 8. Histograms of the EW residual features shown inFigure 7. The top panels shows the distribution of EW values forthe emission residuals. The bottom panels shows the EW valuesfor the absorption features. All EW values are shown in logarith-mic scale (assuming a positive EW value for the emission resid-uals). The top histograms in both cases correspond to the poorsky subtraction, while the bottom histograms correspond to therefined reduction (green and blue colour histograms in the onlineversion). The ∼ 5 A EW threshold value is shown as the verticalline in all the histograms, residual values to the right of this linecan be considered a deficient sky subtraction as explained in thetext.
show the absorption residual features for the [O I] λ5577.The ∼ 5 A EW threshold value is shown as the vertical linein the histograms, residual values to the right of this line canbe considered a deficient sky subtraction. Visual inspectionof the spectra shows that, at the continuum level used forthis comparison, emission or absorption features with valuesof log(|EW|) 6 0 could be considered negligible and withinthe statistical noise of the spectra. The residual emissionhistograms show that the poor sky subtraction produces alarge number of strong residuals with values of |EW| > 5A, even reaching |EW| ∼ 60 A. The majority of the residualvalues in refined sky subtraction are found at log(|EW|) ∼ 0,corresponding to negligible residual values, however there isa small tail of strong emission residuals for which |EW| > 5A (∼ 18% of the total emission residuals). The distribution
c© 2010 RAS, MNRAS 000, 1–26

PINGS: the PPAK IFS Nearby Galaxies Survey 15
of EW values of the absorption features for the poor subtrac-tion is approximately centered at the threshold limit, whilefor the refined reduction, the values are nearly normally dis-tributed with a centre value of log(EW) ∼ 0 with a smalltail of strong absorption values (∼ 7%) due most likely toan over subtraction of the sky spectrum.
The refined sky subtraction was the final adopted onefor the spectroscopic mosaic of NGC628. All the sky sub-traction techniques implemented showed that the quality ofthe derived spectra was improved by a considerable amountcompared to a standard sky subtraction. Most of the skyresiduals are within the limits of a reasonably good skysubtraction. The spectra with strong features are found forthose positions in which the photometric conditions changeddrastically during the night or observing run. This residualanalysis allows to identify those pointings with strong skyvariations and thus, to flag the spectral data for future anal-ysis. The sky subtraction for the rest of the PINGS samplewas performed similarly to the refined technique describedabove. Therefore we applied the best possible sky subtrac-tion to all the spectroscopic mosaics within the limitationsimposed by the IFS data itself.
6.2 Detection of the [O III] λ4363 line
The Hg λ4358 sky line strongly affects any attempt to mea-sure precisely the emission of the faint temperature-sensitive[O III] λ4363 line in any object with a low redshift. The factthat the strength of this line decreases with increasing abun-dance (Bresolin 2006), in combination with typically faintH II regions and low spectroscopic resolution limits impor-tantly the detectability of this key diagnostic line.
In order to assess the significance of the detection ofthe [O III] λ4363 given the contamination of the Hg λ4358sky line in our data, we performed a simulation of the de-tectability of the [O III] λ4363 line for a given range of red-shifts and line intensity strengths. We simulated a pure emis-sion line spectrum including the Hγ λ4340 and [O III] λ4363lines at the same spectral resolution of the PINGS observa-tions; we assumed a normally distributed I(λ4363)/Hγ ra-tio with a mean value of 0.10± 0.05, corresponding to typ-ical values found in previous spectroscopic studies wherethe [O III] λ4363 line was detected in H II regions withinthe metallicity range of the PINGS sample (e.g. McCallet al. 1985); we did not consider higher ratios (∼ 0.25± 0.10)which are representative of extremely low metallicity objects(e.g. Pagel et al. 1992; Izotov & Thuan 2004). We added arandom statistical noise of 0.05 RMS at the continuum levelconstructed from the observed spectroscopic data. A sam-ple of 540 sky spectra were selected among all the observ-ing runs during the three years of observations (consideringvery different photometric conditions). A flux calibrated skyspectrum was created out of these selected spectra. This skyspectrum was added to the previous emission line plus thenoise described above to create a simulated “observed” spec-trum. An average sky spectrum constructed from a randomsubset of 36 sky spectra (the number of PPAK sky-fibres)was then subtracted from the simulated “observed” spec-trum to obtain a “sky-free” spectrum.
Emission line intensities were then measured simultane-ously for both lines in the simulated “sky-free” spectrum us-ing the techniques described in subsection 7.2. These line in-
Figure 9. Detectability of the [O III] λ4363 line as a function ofredshift and line strength according to the simulation describedin subsection 6.2. For a given redshift, the [O III] λ4363 can besignificantly detected for flux values above the thick line, whichmarks the region at which the difference between the observed andsimulated line intensity is of the order of 15%. The contaminationeffect of the Hg λ4358 disappears for redshift values larger than0.004.
tensities were then compared with the flux of the pure emis-sion lines. For a given redshift, we varied the emission linestrengths of the simulated spectrum from high to lower val-ues until the significance of the detection of the [O III] λ4363fell drastically. We performed 500 realisations of the emis-sion line intensity measurements for a given redshift and fora given line strength. Figure 9 shows the results of the simu-lation, the thick line represents the region at which the differ-ence between the line intensity measured from the simulated“sky-free” spectrum and the flux from the pure emission lineis of the order of 15%. According to the simulation, observedflux values of the [O III] λ4363 above this line can be signif-icantly detected at a given redshift. For flux values belowthis region the significance of the detection is negligible asit is mostly affected by the statistical noise of the data. Thecontamination effect of the Hg λ4358 disappears for redshiftvalues larger than ∼ 0.004, where the detectability of the[O III] λ4363 depends on the signal-to-noise of the spectrumat low line-intensity levels. Experience with the data hasproven that the simulation described in this section placesvery good limits on the detectability and potential measure-ment of this faint line, although after detection, individualand visual inspection of the spectra has to follow in orderto correctly assess the usefulness of this line.
6.3 Flux calibration
Several refinements in the observation technique and stan-dard flux recovery were applied to the pipeline which im-proved substantially the accuracy of the sensitivity functionsobtained after every standard candle observation. Duringmost of the observing runs we observed different standardstars per night at different airmasses in order to asses the
c© 2010 RAS, MNRAS 000, 1–26

16 Rosales-Ortega et al.
variation in transmission and its effect on the relative fluxcalibration.
We generated several sensitivity curves following thestandard pipeline procedure in R3D, changing the key pa-rameters that could affect the accuracy of the derived sen-sitivity function (e.g. order and type of the fitting function,extinction, airmass, smoothing, etc.). Furthermore, we madea comparison of the response curves obtained through R3Dand the ones obtained using standard long-slit flux calibra-tion routines in IRAF after performing all the appropriatecorrections and transformations for the two different kindsof data. We even derived whole-run sensitivity curves af-ter the combination of several response curves for a givenobserving run and applied the derived calibration to the ob-served standard candles as a proof of self-consistency. In allcases, we found very consistent results in the final relativeflux calibration. As described in section 5, even without are-calibration using broad-band imaging, the spectral shapeand features are reproduced within the expected errors foran IFS observation (∼ 20% in the absolute sense) along thewhole spectral range, with a small increase in the blue region(λ < 3800 A) due in part to the degradation of the CCDimage quality and instrumental low sensitivity towards theblue (∼ 2 – 5%, telescope/atmosphere excluded) in this spec-tral region (Roth, priv. comm.).
For those galaxies with available multi-band photomet-ric data, small differences in the transmission curves of thefilters and astrometric errors of the built mosaics bring someuncertainties in the derived flux ratios that contribute to theoverall standard deviation when applying the photometricre-calibration described before. The errors in the first caseare difficult to estimate, however the latter ones were esti-mated by simulating different mosaic patterns by applyingnormally distributed random offsets of the simulated fibre-apertures with mean values of 0.3, 0.5 and 1.3 arcsec onthe broad-band images and then comparing the extractedspectrophotometry. From the results of these simulationsand considering that the IFS mosaics were re-centered us-ing the information directly from the aperture photometry,we expect that the location of the fibres lies within 0.5 arc-sec, and therefore the error due to the uncertainty in theastrometry would be of the order of 10%. Based on theseresults, we estimate a spectrophotometry accuracy betterthan ∼ 0.2 mag, down to a flux limit corresponding to a sur-face brightness of ∼ 22 mag/arcsec2 (see Paper II) when weapply the re-calibration derived by the flux ratio analysis.In the following section we compare our data with previ-ously published spectrophotometrically calibrated data. Thespectral shape, the spectral features and emission line in-tensities match remarkably well, even for those objects forwhich no re-calibration was performed (see Figure 11). Asstated above, to our knowledge no other IFU observationhas ever implemented such corrections in order to obtain aninstrumental-limited spectrophotometry accuracy as in thiswork.
6.4 Differential Atmospheric Refraction
An important systematic effect in any spectroscopic obser-vation is due to the refraction induced by the atmosphere,which tends to alter the apparent position of the sourcesobserved at different wavelengths. By definition, there is no
refraction when the telescope is pointed at the zenith, but forlarger zenith angles the effect becomes increasingly signifi-cant. For IFU observations, this has the consequence that,when comparing for example the intensities at two differentwavelengths (e.g the emission line ratio of a source), one willactually compare different regions, given that different wave-lengths are shifted relative to each other on the surface ofthe IFU. In theory, one is capable of performing a correctionof DAR for a given pointing without requiring knowledge ofthe original orientation of the instrument and without theneed of a compensator, as explained by Arribas et al. (1999).The correction of DAR is important for the proper combi-nation of different IFS exposures of the same object takenat different altitudes and under different atmospheric condi-tions, and for the proper alignment of a mosaic and ditheredexposures, as it is the case of most PINGS observations. AnIFS observation can be understood as a set of narrow-bandimages with a band-width equal to the spectral resolution(San06). These images can be recentered using the theoret-ical offsets determined by the DAR formulae (Filippenko1982) by tracing the intensity peak of a reference object inthe FOV along the spectral range, and recentering it. Theapplication of this method is basically unfeasible in slit spec-troscopy, which represents one additional advantage of IFS.The correction can be applied by determining the centroid ofa particular object or source in the image slice extracted ateach wavelength from an interpolated data cube. Then, it ispossible to shift the full data cube to a common reference byresampling and shifting each image slice at each wavelength(using an interpolation scheme), and storing the result ina new data cube. A pitfall of this methodology is that theDAR correction imposes always an interpolation in the spa-tial direction as described above, a 3-dimensional (3D) datacube has to be created for each observed position, reducingthe versatility given by the much simpler and handy RSSfiles.
We have to note here that the widely accepted formula-tion summarised by the work of Filippenko and the conceptof parallactic angle are just a first order approximation tothe problem. All this theoretical body is based on the as-sumption that all different atmospheric layers have an equalrefraction index, are flat-parallel and perpendicular to thezenith. While this approximation is roughly valid, there areappreciable deviations due to the topography and landformsat the location of the telescope, since they alter considerablythe structure of the low-altitude atmospheric layers. There-fore, the “a posteriori” correction of the DAR effect, onlypossible when using IFS, is the most accurate approach tothe problem.
In general, the effects due to DAR in IFS are only im-portant for IFUs with small spatial elements (6 1.5 arcsec)while for large ones (as it is the case of PPAK), the effect ismostly negligible, as experience with the instruments shows,especially when the airmass of the observations is 1.1 or be-low (Sandin et al. 2008). According to the DAR formulas onecan calculate the angular separation in arcsec due to this ef-fect for two different wavelengths under typical atmosphericconditions for a range of airmasses (Filippenko 1982, Ta-ble 1). If we consider for example the wavelengths of Hα atλ6563 and [O II] λ3727 emission lines, the angular separationdue to DAR is smaller than the radius of the PPAK fibres(1.35 arcsec) for airmasses below 1.3. Nevertheless, for each
c© 2010 RAS, MNRAS 000, 1–26

PINGS: the PPAK IFS Nearby Galaxies Survey 17
object in the sample we analysed those pointings which wereobserved at an airmass > 1.2 in order to test any effects dueto DAR in our data. We transformed these individual point-ings into 3D data cubes (with a scale of 1”/pixel) and we se-lected suitable sources within the field (e.g. foreground stars,compact bright emission line regions) to perform a DARcorrection creating continuum maps of these bright sourcesand looking for spatial deviations along the dispersion axis.No significant intensity gradients were found in any of thetest fields. Additionally, we looked for regions in which wecould observe emission in the blue (e.g. [O II] λ3727) butno emission in the red (e.g. Hα λ6563) and vice versa. Inmost of the cases we did not find strange [O II]/Hα ratios,although for some pointings we did not have enough brightH II regions to perform this exercise. However, for a numberof pointings we did find peculiar deviations from the fluxmeasured in both part of the spectra. All these pointingswere observed with an airmass > 1.4 and correspond to:NGC1637 (all 7 dithered pointings), NGC6701 (all 3 point-ings), and NGC5474 (pointings 3, 4 & 5). These particularpointings could be individually converted to 3D data cubesand be further analysed and corrected for any DAR effects.In the case of particular studies which require a degree ofspatial precision, one has to bear in mind the significanceof the spatial-spectral information derived from the individ-ual fibres of these pointings. Integrated spectra over a largeaperture (∼ 5 arcsec) could be considered reliable.
Considering in general that the effects of DAR are verysmall given the relatively large size of the spatial elements ofPPAK, that ∼ 70% of the observations were performed withan airmass 6 1.35, and that we found no significant evi-dence of DAR effects in the analysis of our data (apart fromthe flagged pointings described above), we decided that noDAR correction should be applied when building the finalspectroscopic mosaics of the PINGS sample, avoiding thetransformation of the RSS files to 3D data cubes and theundesirable interpolation of data. It is important to notethat problems caused by atmospheric dispersion cannot becompletely avoided in the spectroscopic study of extendedobjects like any other IFS observation, only for those ob-servations performed in dithering mode a correction for theeffect of DAR can be sought.
6.5 Cross-talk
One of the critical reduction steps is to extract the flux corre-sponding to different spectra at each pixel along the disper-sion axis (see section 5). However, this is not straightforwardas there could be contamination by flux coming from the ad-jacent spectra, i.e. cross-talk. This contamination effect mayproduce a wrong interpretation of the data. For observationsperformed with PPAK, and due to the geometrical construc-tion of the instrument, the adjacent spectra on the plane ofthe CCD may not correspond to nearby locations in the skyplane (Kelz et al. 2006). Furthermore, the position of the cal-ibration fibres (which are located in between the science onesalong the pseudo-slit) also contributes to overall contamina-tion. Therefore, the cross-talk effect would potentially mixup spectra from locations that may not be physically related(because of the spectra position on the CCD) or from spec-tra with completely different nature (i.e. calibration fibres).Given that the cross-talk is an incoherent contamination it
Figure 10. Example of a strong cross-talk effect in a fibre ad-jacent to a very bright source, in this case a standard star witha maximum of 40000 counts. The top spectrum shows the fullcross-talk effect when no correction is applied. The middle spec-trum shows a first-order correction obtained by minimising thepixel extraction aperture (but losing flux in the process). Thebottom spectrum shows the correction of the cross-talk by theimproved Gaussian-suppression method (described in Paper II)with an extracted spectrum of the same order of intensity as theaverage background signal (dotted line) found in the nearby fi-bres for this particular observation. The apparent periodicity ofthe cross-talk with respect to the wavelength is just an effect ofthe spectra misalignments and distortions on the CCD.
is preferable to keep it as low as possible, an average valueof ∼ 1% with a maximum of ∼ 10% (San06, and referencestherein) seems technically as a good trade-off.
Given the limited size of CCDs and the need to record asmany spectra as possible within that reduced area, IFS ob-servations will always face a certain level of cross-talk. TheFWHM of the projected profile along the cross-dispersionaxis is normally defined by the design of the spectrographand the size of the input fibres, placing a limit in the se-lected aperture. As explained by San06, the PPAK spec-tra profiles have a FWHM of the order of ∼ 2.3 pixels, and∆peaks of ∼ 5 pixels in the 2× 2 binning mode (as was thecase for all PINGS observations). Selecting an aperture sizeof the order of ∆peaks seems to be an acceptable compro-mise between maximising the recovered flux and minimisingthe cross-talk. Several methods have been implemented tominimise the effect of cross-talk, in particular, San06 de-veloped an efficient technique named Gaussian-suppression
that reduces the effects of the cross-talk and maximises therecovered flux to within 10% of the original values for anyspaxel at any wavelength. However, for certain raw frameswhich were too crowded or when we targeted bright sourceswithin the field (e.g. foreground stars, galaxy bulges), westill found some level of contamination that could not beconsidered negligible.
Therefore, we improved the Gaussian-suppression tech-nique to a new method which increases the signal-to-noiseratio of the extracted spectra and reduces the effect ofthe cross-talk compared to previous extractions. The newtechnique is explained in detail in Paper II, and it is nowfully implemented in the standard R3D package (San06).We performed several tests using simulated and real spectra
c© 2010 RAS, MNRAS 000, 1–26

18 Rosales-Ortega et al.
with a broad range of intensities in order to assess thelevel of contamination that the extracted spectra show dueto the cross-talk. We tested the new method varying therelative intensity of the spectra in the central and adjacentfibres, the pixel extraction apertures and the average widthof the Gaussian profiles. We found that in the extreme cases(very bright adjacent fibres) the cross-talk is suppressedby 95%, being almost negligible for the range of spectralintensities compared to the instrumental misalignmentsand distortions found during conventional observations ofthe PINGS sample (see Figure 10).
In summary, the two most important sources of error inthe data reduction arise from the sky subtraction and theflux calibration. We have made several tests and applied newtechniques in each case in order to minimise the magnitudeof the uncertainties. We found that the sky subtraction can-not be applied as part of any standard reduction pipelineand has to be considered on an individual basis, depend-ing on the observing mode, configuration and strategy. Onthe other hand, the maximum expected error in the abso-lute flux calibration for those objects in which a broad-bandimaging recalibration was applied is of the order of 20%, be-ing slightly larger in a narrow blue spectral region λ < 3800A. For those objects without broad-band imaging, the abso-lute flux calibration error is of the order of 30%. However,the absolute error is better than 20% for objects observedduring photometric conditions and/or with high S/N. Thecolors, spectral features and gradients are completely repro-duced when comparing our data with previously publishedlong-slit observations (see subsection 7.1).
DAR effects were found to be negligible due to the largesize of the spatial elements of PPAK, we did not find strongevidence of DAR in the several test pointings analysed. How-ever we flagged all individual IFU positions for which theobservations were performed with an airmass > 1.3. Withrespect to cross-talk, the new extraction method proved tosuppress this effect to a negligible level for the range of spec-tral intensities in the PINGS observations. Furthermore, noevidence of any second-order contamination has been foundduring the data reduction and analysis of the PINGS dataset. As explained in section 4, the contamination of the 2ndorder, up to 7200 A, is expected to be lower than 1/10000,being negligible for our science case.
7 THE PINGS DATA
The PINGS data set contains more than 50000 flux cali-brated spectra for a sample of 17 galaxies covering in totalan observed spectroscopic area of nearly 80 arcmin2. Ta-ble 2 shows a summary of the observations, including thenumber of individual IFU pointings observed for the mosaicof each galaxy, the observational status of the mosaicking,the total number of spectra, and additional individual com-ments on each object. The spectroscopic data set samplesthe observed objects with fibre circular apertures of ∼ 2.7arcsec in diameter, covering the optical wavelength rangebetween ∼ 3700 – 7100 A, which includes the most promi-nent recombination and collisionally excited emission linesfrom [O II] λλ 3727, 3729 to [S II] λλ 6717, 6731.
It is beyond the scope of this article to extract all the
information potentially available in this huge spectroscopicdata base. Independent studies for individual objects, re-gions and galaxy subsamples will be presented in a series offuture papers. We consider here a few relevant scientific ex-amples that have been extracted from the data set to demon-strate the use of these data. In this section 4 we present theintegrated spectra and emission line intensities for selectedH II regions of the IFS mosaics of NGC1058 and NGC3310,with a comparison to previously published data. Further-more, we obtained emission line maps for NGC1058 andwe present a qualitative description of the 2D distributionof physical properties inferred from the line intensity maps.Finally, we present the spectra of the SN 2007gr observedin NGC1058 as an example of the utility of wide-field IFSsurveys to find potential SNe progenitors and their environ-mental properties.
7.1 Integrated spectra
The study of the optical integrated light provides a pow-erful tool to investigate the physical properties of galaxiesat different epochs in the history of the universe. Spectralinvestigations based on integrated optical spectrophotome-try have been used to explore the main drivers of galaxyevolution, e.g. star formation rate, star formation history,stellar mass, chemical abundance, dust content, etc. (e.g.Kauffmann et al. 2003; Tremonti et al. 2004). The analysisof the integrated spectra in nearby objects can be used to as-sess the limitations imposed by high-redshift surveys, suchas their limiting magnitude and incomplete spatial cover-age (or aperture bias), factors that may be important giventhat many physical properties of galaxies vary depending onthe geometry and position (e.g. stellar populations, metal-licity, extinction, etc.). A solution to the incomplete spa-tial coverage of spectroscopic observations on nearby ob-jects consists on using sequential methods that use time toscan a target while recording the spectral information. Thestandard method for obtaining integrated spectra in nearbyobjects was developed by Kennicutt (1992). The so-calleddrift-scanning technique consists of a scan perpendicular tothe slit over the optical extent of the galaxy during a sin-gle exposure. Using this method Moustakas & Kennicutt2006b (hereafter MK06) obtained spatially integrated opti-cal (3600 – 6900 A) spectrophotometry for 417 nearby galax-ies of a diverse range of galaxy types, which were later usedto study several integrated galactic properties (SFR, metal-licity, etc.).
One by-product of 2D spectroscopy and IFS data setsis the intrinsic capability of adding up all the spectra withinan observed field or mosaic into a single spectrum, i.e. us-ing the IFU as a large-aperture spectrograph to obtain theintegrated spectra of a given FOV. The PINGS sample isan ideal data set for this purpose given that the spectro-scopic mosaics cover, in most cases, the entire optical radius
4 The analysis of this section was partly based on a set ofIDL routines created in order to handle and visualise the2D spectroscopic mosaics. Although they were first devel-oped for the specific PINGS data format, they can be imple-mented to any IFS data based on RSS files and correspond-ing position tables. The PINGS software is freely available athttp://www.ast.cam.ac.uk/research/pings/.
c© 2010 RAS, MNRAS 000, 1–26

PINGS: the PPAK IFS Nearby Galaxies Survey 19
Figure 11. Top panels: Integrated spectra of NGC1058 derived from the PINGS slit-extraction (thick solid line) and the whole mosaic(dotted line) spectra compared to the MK06 data (blue line in the online version), as explained in the text. Flux in units of 10−16
erg s−1 cm−2 A−1. Bottom panels: Comparison of the integrated spectra of NGC3310 with the same color coding as the figure above.For both galaxies, the diagrams on the right represent narrow-band intensity maps centred at Hα showing the mosaic pattern and therectangular slit-apertures of MK06. The arrow in the NGC1058 mosaic diagram shows the position of SN 2007gr. The contours of theindividual fibres have been drawn in the case of NGC3310.
of the galaxy. The integrated spectra derived from PINGScan be used to study the real average spectroscopic proper-ties of a given nearby, large angular size galaxy, as opposedto previous studies that attempted to describe their aver-age properties by the analysis of individual spectra takenfrom different regions, or by targeting objects with a lim-ited extraction aperture which recovers only a fraction ofthe total optical light. In this section we present examplesof high signal-to-noise integrated spectra for NGC1058 andNGC3310 obtained by co-adding the spectra from their cor-responding mosaics using different simulated apertures ap-plied to the IFS mosaic. We compare these data with previ-ously published integrated spectra from MK06. In Paper II,we present the integrated spectra of NGC628 with a moreelaborated analysis of the integrated stellar populations andnebular abundances.
Figure 11 shows in the left upper panel the compari-
son of the integrated spectrum of NGC1058 extracted fromthe PINGS mosaic to the drift-scan spectrum obtained byMK06 of this galaxy, at the same spectral resolution. Theright upper panel shows the PINGS spectroscopic mosaicdiagram of NGC1058 with intensity levels corresponding toa “narrow-band” 100 A width image extracted from the IFSdata centred at Hα. The rectangular shape shows the slit-aperture used in the drift-scan technique by MK06 to obtainthe integrated spectrum of this galaxy5. Three foregroundstars and the supernova SN2007gr (see subsection 7.4) wereremoved from the co-added spectra (the arrow shows the po-sition of SN2007gr between two foreground stars). The black
5 The simulated extraction slit was registered over the surface ofthe galaxy by visual comparison to corresponding diagram shownby MK06, therefore there is an uncertainty of the correct positionof the extraction slit over the IFS mosaic of the order of∼ 2 arcsec.
c© 2010 RAS, MNRAS 000, 1–26

20 Rosales-Ortega et al.
solid line spectrum in the left upper panel was obtained byextracting from the PINGS mosaic all the individual spec-tra within the area enclosed by the rectangular shape andtaking into account the overlapping regions and the coveringfraction of the fibres due to the dithering technique appliedto this galaxy.
The blue line corresponds to the spectrum obtained byMK06 using the drift-scan technique. The dotted line wasderived after co-adding all the spectra of the seven IFU po-sitions shown in Figure 11 and considering the ditheringoverlaps. This spectrum is constructed out of 6951 individ-ual spectra covering the whole optical B25 mag arcsec−2
radius of NGC1058. In this case we can see clearly the ef-fect of the incomplete spatial coverage when comparing theintegrated spectrum within the slit-aperture of MK06 andthe whole optical radius covered by the PINGS mosaic (dot-ted line). Although it is beyond the scope of this paper togive a more quantitative comparison, we can notice from apurely qualitative point of view that the determination ofsome physical properties may vary when using both the slit-aperture and the whole mosaic integrated spectra, probablyby as much as ∼ 15 – 20%.
In a similar way, the bottom panels of Figure 11 showthe integrated spectra of the starburst galaxy NGC3310.The black line shows the integrated spectrum obtained af-ter co-adding all the spectra within the rectangular patterncorresponding to the MK06 slit-aperture and considering allthe overlaps in the mosaic due to the dithering observingmethod and the non-standard construction of the mosaic. Noforeground stars were found within this field. The blue linecorresponds to the MK06 drift-scan integrated spectrum.In this case the PINGS extraction is spatially incompletewhen compared to the rectangular area of the MK06 aper-ture. Nevertheless, all the spectral features are reproducedquite well when we compare the PINGS spectrum with theMK06 data. The apparent disagreement seen in some of theemission lines can be explained by the spatial incomplete-ness of the IFS mosaic with respect to the MK06 slit, andthe presence of a bright H II region at (∆α,∆δ) ∼ (–10,–30), which is located at the edge of the extraction slit andpresents particularly strong emission in the [O III] lines. Asmall shift of the reported position of the MK06 slit resultsin a slightly different integrated spectrum due to this strongH II region, causing that the peaks of the emission lines dif-fer in height. A stronger effect is seen in the blue spectralregion (λ < 3800 A) which is expected due to the intrinsicproblems of the spectrophotometric calibration in this re-gions as explained in section 6. The integrated spectrum ofNGC3310 using all the fibres in the three dithered positionsdiffers very little from the extracted one, and it is not shownfor the sake of clarity.
The spectroscopic mosaics of NGC1058 and NGC3310were not re-calibrated using the broad-band imaging tech-nique described in Paper II, and therefore they are notcalibrated for the absolute zero point flux. Nevertheless,both the spectral shape and the spectral features of thePINGS extracted spectra corresponding to the slit-apertureof MK06 match remarkably well with these previously pub-lished, spectrophotometrically calibrated data, showing thequality of the PINGS IFS data set.
7.2 Emission line maps
One of the main objectives of the PINGS project is to ob-tain complete maps of the emission-line intensities whichcould then be analysed to describe the 2D spatially-resolveddistribution of the physical properties of the sample. ThePINGS spectroscopic mosaics allow us to obtain for the firsttime a complete 2D view in the optical wavelength range ofthe main emission lines used in typical abundance diagnos-tics methods, and important spectral features useful for theanalysis of the underlying stellar populations.
The ionized gas in spiral galaxies exhibits a complexstructure associated morphologically with star-forming re-gions located mainly along the spiral arms. Previous at-tempts to perform a 2D analysis have made use of narrow-band and Fabry-Perot imaging at different spectral widths.However, in some cases the narrow-band imaging includesthe contribution of more than one single emission line,such as the case of the Hα imaging, which includes the[N II] λλ 6548, 6584 doublet, or the [S II] density sensitivedoublet at λλ 6717, 6731. This factor limits the utilizationof these techniques to study just the basic parameters ofthe ionized gas, under the assumption of fixed line ratios.The great advantage of IFS arises from the fact that we areable to deblend emission lines at any discrete spatial loca-tion, and to ultimately produce maps of individual emissionlines.
In order to extract any physical information from thedata set, we need first to identify the detected emission linesof the ionized gas and to decouple their emission from thestellar population in each individual spectrum of the IFSmosaic. We used population synthesis to model and sub-tract the stellar continuum underlying the nebular emissionlines. This technique results in emission-line measurementscorrected (to a first-order) for stellar absorption. The detailsof this process are described in Paper II, however we presentbriefly here the scheme followed to decouple the stellar pop-ulation and the emission lines in our database: i) A set ofemission lines is identified from any strong H II region of thegalaxy. ii) For each spectrum in the data set, the underlyingstellar population is fitted by a linear combination of a gridof Single Stellar Populations (SSP), masking all the nebularand sky emission lines. The template models are selected inorder to cover the widest possible range of ages and metal-licities. We consider the effects of dust extinction by varyingAV from 0 to 1 mag at ∆0.2 mag. iii) We subtract the fitstellar population from the original spectrum to get a resid-ual pure emission-line spectrum. iv) Finally, we derive theintensities for each detected emission line.
Individual emission-line fluxes were measured in eachspectrum by considering spectral window regions of ∼ 200 A.We performed a simultaneous multi-component fitting us-ing a single Gaussian function (for each emission line con-tained within each window) plus a low order polynomial(to describe the local continuum and to simplify the fittingprocedure) using FIT3D (Sanchez et al. 2006). The centralredshifted wavelengths of the emission lines were fixed andsince the FWHM is dominated by the spectral resolution,the widths of all the lines were set equal to the width ofthe brightest line in this spectral region. This proceduredecreases the number of free parameters and increases theaccuracy of the deblending process (when required). Line
c© 2010 RAS, MNRAS 000, 1–26

PINGS: the PPAK IFS Nearby Galaxies Survey 21
Figure 12. Emission line maps obtained from the IFS mosaic of NGC1058 (without the outlying pointing). In the top-left panel, Hα
line intensity map, top-right Hα/Hβ flux line ratio. Bottom-left, [O II] λ3727, bottom-right [O III] λ4959+λ5007 intensity maps. Allmaps were obtained by fitting a single Gaussian function to the emission line for each single spectrum in the mosaic. The intensity mapis then reconstructed by interpolating the recovered flux at the location of each spectrum as described in the text. All maps are in unitsof 10−16 erg s−1 cm−2 arcsec−2. No correction for dust extinction was applied to any map.
intensity fluxes were then measured by integrating the ob-served intensity of each line. The statistical uncertainty inthe measurement of the line flux was calculated by propa-gating the error associated to the multi-component fittingand considering the signal-to-noise of the spectral region.
We applied this line-fitting method to NGC1058 andcreated emission line maps by interpolating the intensitiesderived for each individual line in each individual spec-trum, correcting for the dithering overlapping effects. Theinterpolation was performed using E3D, adopting a natural-neighbour, non-linear interpolation scheme, with a final scaleof 1”/pixel in the resulting maps. The data at the locationof bright foreground stars in the field were masked prior toany interpolation, in order to decrease the effects of theircontamination.
As a prime example of this technique for the pur-pose of this paper, we calculated the following emissionline maps: Hα, Hβ, the doublet-blended [O II] λ3727, and
[O III] λλ 4959, 5007. In order to prevent contamination bylow signal-to-noise data, we masked all pixels that corre-spond to an integrated flux per fibre below 10−16 erg s−1
cm−2. Figure 12 shows the emission line maps in units of10−16 erg s−1 cm−2 arcsec−2. The top panels show the dis-tribution of the star-forming regions in the galaxy tracedby the Hα intensity map (left) and the distribution of dustextinction, outlined by the Hα/Hβ flux ratio (right). Fromthese maps we note that, although many of the most intenseemission regions are located along the inner spiral arms ofthe galaxy, some of them lie in outer regions not associatedwith any spiral structure (e.g. to the south of the galaxy, at∆RA ∼ –10, ∆Dec ∼ –90 arcsec). On the other hand, theHα/Hβ flux ratio shows a smooth distribution, especiallyconcentrated in the inner part of the galaxy with strongpeaks in the outlying star-forming regions. As a matter offact, the very intense outlying regions of star-formation areresponsible for the difference found in between the inte-
c© 2010 RAS, MNRAS 000, 1–26
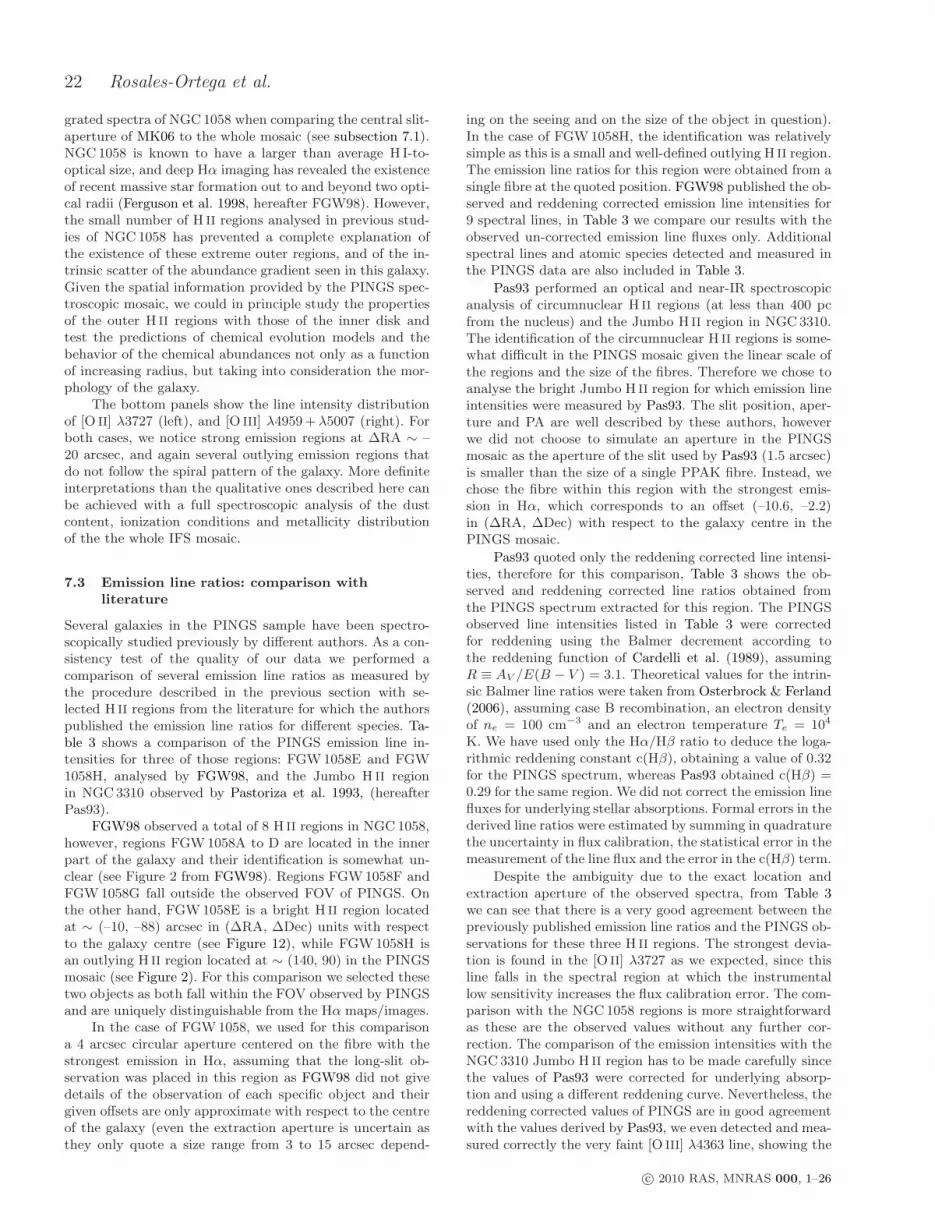
22 Rosales-Ortega et al.
grated spectra of NGC1058 when comparing the central slit-aperture of MK06 to the whole mosaic (see subsection 7.1).NGC1058 is known to have a larger than average H I-to-optical size, and deep Hα imaging has revealed the existenceof recent massive star formation out to and beyond two opti-cal radii (Ferguson et al. 1998, hereafter FGW98). However,the small number of H II regions analysed in previous stud-ies of NGC1058 has prevented a complete explanation ofthe existence of these extreme outer regions, and of the in-trinsic scatter of the abundance gradient seen in this galaxy.Given the spatial information provided by the PINGS spec-troscopic mosaic, we could in principle study the propertiesof the outer H II regions with those of the inner disk andtest the predictions of chemical evolution models and thebehavior of the chemical abundances not only as a functionof increasing radius, but taking into consideration the mor-phology of the galaxy.
The bottom panels show the line intensity distributionof [O II] λ3727 (left), and [O III] λ4959+λ5007 (right). Forboth cases, we notice strong emission regions at ∆RA ∼ –20 arcsec, and again several outlying emission regions thatdo not follow the spiral pattern of the galaxy. More definiteinterpretations than the qualitative ones described here canbe achieved with a full spectroscopic analysis of the dustcontent, ionization conditions and metallicity distributionof the the whole IFS mosaic.
7.3 Emission line ratios: comparison withliterature
Several galaxies in the PINGS sample have been spectro-scopically studied previously by different authors. As a con-sistency test of the quality of our data we performed acomparison of several emission line ratios as measured bythe procedure described in the previous section with se-lected H II regions from the literature for which the authorspublished the emission line ratios for different species. Ta-ble 3 shows a comparison of the PINGS emission line in-tensities for three of those regions: FGW1058E and FGW1058H, analysed by FGW98, and the Jumbo H II regionin NGC3310 observed by Pastoriza et al. 1993, (hereafterPas93).
FGW98 observed a total of 8 H II regions in NGC1058,however, regions FGW1058A to D are located in the innerpart of the galaxy and their identification is somewhat un-clear (see Figure 2 from FGW98). Regions FGW1058F andFGW1058G fall outside the observed FOV of PINGS. Onthe other hand, FGW1058E is a bright H II region locatedat ∼ (–10, –88) arcsec in (∆RA, ∆Dec) units with respectto the galaxy centre (see Figure 12), while FGW1058H isan outlying H II region located at ∼ (140, 90) in the PINGSmosaic (see Figure 2). For this comparison we selected thesetwo objects as both fall within the FOV observed by PINGSand are uniquely distinguishable from the Hα maps/images.
In the case of FGW1058, we used for this comparisona 4 arcsec circular aperture centered on the fibre with thestrongest emission in Hα, assuming that the long-slit ob-servation was placed in this region as FGW98 did not givedetails of the observation of each specific object and theirgiven offsets are only approximate with respect to the centreof the galaxy (even the extraction aperture is uncertain asthey only quote a size range from 3 to 15 arcsec depend-
ing on the seeing and on the size of the object in question).In the case of FGW1058H, the identification was relativelysimple as this is a small and well-defined outlying H II region.The emission line ratios for this region were obtained from asingle fibre at the quoted position. FGW98 published the ob-served and reddening corrected emission line intensities for9 spectral lines, in Table 3 we compare our results with theobserved un-corrected emission line fluxes only. Additionalspectral lines and atomic species detected and measured inthe PINGS data are also included in Table 3.
Pas93 performed an optical and near-IR spectroscopicanalysis of circumnuclear H II regions (at less than 400 pcfrom the nucleus) and the Jumbo H II region in NGC3310.The identification of the circumnuclear H II regions is some-what difficult in the PINGS mosaic given the linear scale ofthe regions and the size of the fibres. Therefore we chose toanalyse the bright Jumbo H II region for which emission lineintensities were measured by Pas93. The slit position, aper-ture and PA are well described by these authors, howeverwe did not choose to simulate an aperture in the PINGSmosaic as the aperture of the slit used by Pas93 (1.5 arcsec)is smaller than the size of a single PPAK fibre. Instead, wechose the fibre within this region with the strongest emis-sion in Hα, which corresponds to an offset (–10.6, –2.2)in (∆RA, ∆Dec) with respect to the galaxy centre in thePINGS mosaic.
Pas93 quoted only the reddening corrected line intensi-ties, therefore for this comparison, Table 3 shows the ob-served and reddening corrected line ratios obtained fromthe PINGS spectrum extracted for this region. The PINGSobserved line intensities listed in Table 3 were correctedfor reddening using the Balmer decrement according tothe reddening function of Cardelli et al. (1989), assumingR ≡ AV /E(B − V ) = 3.1. Theoretical values for the intrin-sic Balmer line ratios were taken from Osterbrock & Ferland(2006), assuming case B recombination, an electron densityof ne = 100 cm−3 and an electron temperature Te = 104
K. We have used only the Hα/Hβ ratio to deduce the loga-rithmic reddening constant c(Hβ), obtaining a value of 0.32for the PINGS spectrum, whereas Pas93 obtained c(Hβ) =0.29 for the same region. We did not correct the emission linefluxes for underlying stellar absorptions. Formal errors in thederived line ratios were estimated by summing in quadraturethe uncertainty in flux calibration, the statistical error in themeasurement of the line flux and the error in the c(Hβ) term.
Despite the ambiguity due to the exact location andextraction aperture of the observed spectra, from Table 3we can see that there is a very good agreement between thepreviously published emission line ratios and the PINGS ob-servations for these three H II regions. The strongest devia-tion is found in the [O II] λ3727 as we expected, since thisline falls in the spectral region at which the instrumentallow sensitivity increases the flux calibration error. The com-parison with the NGC1058 regions is more straightforwardas these are the observed values without any further cor-rection. The comparison of the emission intensities with theNGC3310 Jumbo H II region has to be made carefully sincethe values of Pas93 were corrected for underlying absorp-tion and using a different reddening curve. Nevertheless, thereddening corrected values of PINGS are in good agreementwith the values derived by Pas93, we even detected and mea-sured correctly the very faint [O III] λ4363 line, showing the
c© 2010 RAS, MNRAS 000, 1–26

PINGS: the PPAK IFS Nearby Galaxies Survey 23
Table 3. Comparison of the PINGS emission line intensities for two H II regions in NGC1058 and one in NGC3310 with previousobservations and published line ratios. For NGC1058 we compare with the regions E and H by Ferguson et al. (1998), and the JumboH II region in NGC3310 observed by Pastoriza et al. (1993). For NGC1058, the coordinates shown represent approximate offsets ofthe H II regions with respect to the galaxy nucleus in the PINGS mosaic in the format (∆RA, ∆Dec) with NE positive. All values forNGC1058 are the observed line ratios. In the case of the NGC3310 Jumbo H II region, the observed and redenning corrected ratios forPINGS are shown as Pas 93 only shows corrected line intensities (see text for details). All line ratios are normalised to Hβ. *Observed
Hβ flux in units of 10−16 erg s−1 cm−2.
NGC1058 NGC3310 Jumbo H II region
(–10.6, –87.9) (140.6, 90.0) PINGS Pas 93
Line PINGS FGW 1058E PINGS FGW 1058H F(λ)/F(Hβ) I(λ)/I(Hβ) I(λ)/I(Hβ)
[O II] λ3727 3.033 ± 0.262 2.739 ± 0.064 2.261 ± 0.130 1.950 ± 0.052 2.388 ± 0.132 3.028 ± 0.352 2.59 ± 0.040
[Ne III] λ3869 0.170 ± 0.018 0.188 ± 0.026 0.180 ± 0.020 0.223 ± 0.048 0.18 ± 0.040
H8 + He I λ3889 0.164 ± 0.018 0.111 ± 0.021 0.126 ± 0.021 0.156 ± 0.044 0.13 ± 0.039
Hǫ λ3970 0.162 ± 0.018 0.173 ± 0.025 0.115 ± 0.020 0.140 ± 0.043 0.17 ± 0.053
Hδ λ4101 0.209 ± 0.022 0.228 ± 0.029 0.184 ± 0.020 0.218 ± 0.039 0.21:
Hγ λ4340 0.386 ± 0.039 0.447 ± 0.046 0.406 ± 0.018 0.455 ± 0.046 0.40:
[O III] λ4363 . . . . . . 0.017 ± 0.004 0.019 ± 0.006 0.018 ± 0.005
He I λ4471 0.029 ± 0.004 0.052 ± 0.012 0.034 ± 0.004 0.037 ± 0.009 0.036 ± 0.009
Hβ λ4861 1.000 ± 0.050 1.000 ± 0.033 1.000 ± 0.051 1.000 ± 0.037 1.000 ± 0.038 1.000 ± 0.082 1.000 ± 0.053
[O III] λ4959 0.745 ± 0.038 0.786 ± 0.026 1.137 ± 0.057 1.148 ± 0.042 0.936 ± 0.048 0.919 ± 0.067 0.740 ± 0.007
[O III] λ5007 2.301 ± 0.115 2.298 ± 0.076 3.227 ± 0.163 3.282 ± 0.117 2.857 ± 0.060 2.779 ± 0.143 2.310 ± 0.009
He I λ5876 0.109 ± 0.011 0.223 ± 0.024 0.133 ± 0.011 0.114 ± 0.013 0.099 ± 0.005
[O I] λ6300 0.050 ± 0.006 0.069 ± 0.009 0.060 ± 0.008 0.050 ± 0.010 0.051 ± 0.004
[S III] λ6312 . . . . . . 0.011 ± 0.004 0.009 ± 0.006 0.011 ± 0.003
[O I] λ6363 . . . . . . 0.021 ± 0.006 0.017 ± 0.008 0.014 ± 0.005
[N II] λ6548 0.142 ± 0.023 0.135 ± 0.005 0.065 ± 0.013 0.099 ± 0.009 0.189 ± 0.018 0.152 ± 0.020 0.150 ± 0.005
Hα λ6563 3.114 ± 0.156 3.231 ± 0.106 3.135 ± 0.158 2.980 ± 0.106 3.574 ± 0.056 2.870 ± 0.179 2.880 ± 0.004
[N II] λ6584 0.413 ± 0.045 0.414 ± 0.014 0.187 ± 0.022 0.179 ± 0.009 0.548 ± 0.038 0.439 ± 0.055 0.460 ± 0.003
He I λ6678 0.037 ± 0.004 0.020 ± 0.006 0.045 ± 0.006 0.035 ± 0.008 0.032 ± 0.003
[S II] λ6717 0.373 ± 0.028 0.362 ± 0.012 0.190 ± 0.020 0.238 ± 0.011 0.315 ± 0.014 0.249 ± 0.032 0.270 ± 0.006
[S II] λ6731 0.270 ± 0.023 0.257 ± 0.009 0.134 ± 0.014 0.148 ± 0.008 0.248 ± 0.015 0.196 ± 0.025 0.220 ± 0.006
I(λ5007)/I(λ4959) 3.09 ± 0.15 2.92 ± 0.14 2.83 ± 0.20 2.85 ± 0.15 3.05 ± 0.05 3.02 ± 0.08 3.12 ± 0.03
* F(Hβ) λ4861 236.2 210.5 11.6 19.5 1096 1690
good quality of the sky subtraction despite the presence ofthe Hg λ4358 sky line. The line strength of the [O III] λ4363line combined with the redshift of NGC3310 makes it fall inthe region of “detectability” as described in the simulationpresented in subsection 6.2.
An additional assessment of the quality of the data isgiven by the value of the I(λ5007)/I(λ4959) ratio which canbe predicted from atomic theory and observed in high signal-to-noise astronomical spectra. According to current atomiccomputations, the theoretical value for this intensity ratio is2.98 (Storey & Zeippen 2000). In Table 3 we show this ratiofor the three H II regions. The observed central values for theregion FGW1058E in both datasets are in good agreementwith the theoretical value. In the case of FGW1058H bothvalues are quite similar but differ within the errors fromthe theoretical value. For the NGC3310 Jumbo H II region,the central value observed by PINGS is closer to the theo-retical value for both uncorrected and corrected line ratioscompared to the Pas93 value.
The flux observed by PINGS in the Hβ line forFGW1058E is slightly higher than the one measured byFGW98, contrary to the case of FGW1058H, where the fluxin PINGS for the same line is somehow smaller, reflectingthe unknown aperture extraction for the FGW98 long-slitspectrum. In the case of the NGC3310 Jumbo H II region,the flux measured by PINGS is somewhat smaller than theone measured by Pas93.
The 2D character of the PINGS data allows us to studythe variation of the spectra within a given area that would beotherwise taken as a single H II region. In Figure 13 we showthe effect of the extraction aperture on the emission line in-tensities for the H II region FGW1058E. FGW98 consideredFGW1058E as a single H II region, however a closer look us-ing the dithered spectroscopic mosaic shows that this regionis actually a complex composed of several knots and sub-structures with varying emission fluxes in the most promi-nent lines. In order to examine the difference in the emissionline ratios in this region, we take as a central position the fi-bre with the strongest emission in Hα within this area, withan integration aperture of 2.7 arcsec diameter. We then takeconcentric circular apertures of different sizes (ranging from4 to 12 arcsec in diameter), we integrate the spectra withinthese apertures to obtain spectra from which we measure adifferent set of emission line intensities.
The five top panels of Figure 13 show the variation ofthe emission line ratios obtained at different extraction aper-ture sizes for some relevant lines (normalised to Hβ). Thesecond data point corresponds to the value shown in Table 3(4 arcsec aperture), the horizontal line in each panel showsthe central value and the error bar obtained by FGW98 (thedark/light blue colour line/band in the online version). Thebottom panel shows the integrated flux of Hβ at each aper-ture. From Figure 13 we can see that the emission line ratiosmeasured using different extraction apertures vary consid-
c© 2010 RAS, MNRAS 000, 1–26

24 Rosales-Ortega et al.
Figure 13. Variation of the emission line ratios as a functionof integration aperture of the H II region FGW 1058E. The hor-izontal line/band in each panel shows the value/error derived byFGW98. All emission line intensities are normalized to Hβ. Theobserved integrated fluxes of Hβ are in units of 10−15 erg s−1
cm−2.
erably as a function of the aperture size, and that in mostcases the dispersion of the central values is larger than theerror of the measurements, reflecting that this is a physicaleffect. All emission line ratios tend to converge to a cer-tain value as the aperture size increases. Note that at theflux level in Hβ measured by FGW98 for this region, all theemission line intensity ratios, as measured by PINGS, arebasically the same (within errors) as the values derived byFGW98.
From this exercise we note that, to a first-order, theemission line ratios measured for a given H II region maysignificantly depend on the morphology of the region, onthe slit (fibre) position, on the extraction aperture and onthe signal-to-noise of the observed spectrum. All these ef-fects should be taken into account when deriving physicalquantities from spectroscopic studies of H II regions.
7.4 SN 2007gr in NGC 1058
As another example of the potential of the PINGS spectro-scopic data, we present the spectrum of a particular objectobserved during the mosaicking of the galaxy NGC1058.The observation of this galaxy was carried out during thenights of the 7th and 8th of December 2007. During this pe-riod we were able to observe the spectrum of the Supernova2007gr, previously discovered by the Lick Observatory Su-
Figure 14. Extracted spectrum of the SN 2007gr in the mosaicof NGC1058. The flux units are 10−16 erg s−1 cm2 A−1. Somenebular emission lines are seen superimposed to the SN spectrum.
pernova Search on the 15th of August 2007 (Chornock et al.2007).
SN2007gr was located at 24.8” West and 15.8”North of the nucleus of NGC 1058, with coordinates RA02h 43m 27.s98 and Dec: +37◦ 20m 44.s7. In the mosaic dia-gram of NGC1058 shown in Figure 11, the arrow shows thelocation of SN2007gr between two bright foreground stars.Figure 14 shows the optical spectrum of the supernova ex-tracted from the IFS mosaic, showing the typical spectrumof a Type Ic core collapse supernova, with the lack of hy-drogen, helium and silicon absorption lines. Emission lines of[O II] λ3727, Hα, [N II] λλ 6548, 6584 and [S II] λλ 6717, 6731are clearly seen on top of the SN spectra, probably reflectingthe environment of the H II region in which this supernovaexploded.
As described by Valenti et al. (2008), SN 2007gr showedan average peak luminosity but unusually narrow spectrallines and an almost flat photospheric velocity profile. SN2007gr motivated an extensive observational campaign forseveral reasons: it was discovered at a very early stage (5days after the explosion), it was located in a relatively closedistance galaxy, it was the nearest stripped-envelope carbon-rich SNe ever observed, and a suitable candidate for progen-itor search (Valenti et al. 2008). Wide-field IFS may becomeone of the main resources for SNe research groups to findSNe progenitors in previously observed galaxies. The pro-genitor supergiant stars (M > 8 M⊙) that at the end oftheir lives explode as core-collapse supernovae may show astrong stellar spectrum that could be recovered from 2Dspectroscopic maps with enough spatial resolution. Further-more, the nebular emission from the spatially adjacent spec-tra could provide information on the environment in whichthese SNe explosions occur.
8 SUMMARY
We have presented the PPAK IFS Nearby Galaxies Survey:PINGS, a project designed to construct 2D spectroscopic
c© 2010 RAS, MNRAS 000, 1–26
PINGS: the PPAK IFS Nearby Galaxies Survey 25
mosaics of 17 nearby disk galaxies in the optical wavelengthrange. This project represents one of the first attempts toobtain continuous coverage spectra of the whole surface ofa galaxy in the nearby universe.
The final sample includes different galaxy types, includ-ing normal, lopsided, interacting and barred spirals with agood range of galactic properties and SF environments withmulti-wavelength public data. The spectroscopic data setcomprises more than 50000 individual spectra, covering anobserved area of nearly 80 arcmin2. The data set will besupplemented with broad band and narrow band imagingfor those objects without publicly available images in orderto maximise the scientific and archival value of the observa-tions. Future plans consider to release the PINGS data set inorder to make it freely available to the scientific communityas a PPAK legacy project.
The primary scientific objectives of PINGS are to obtainemission-line maps and moderate-resolution spectra of theunderlying stellar population across the disks of the galax-ies. These spectral maps will allow us to study the spatialdistribution of the physical properties of the ionized gas andthe stellar components in galaxies, solving the limitationsimposed by the small FOV and spectral coverage of previ-ous attempts at obtaining the 2D information of a galaxy.PINGS will provide the most detailed knowledge of star for-mation, gas chemistry and the variations across a late-typegalaxy. This information is very relevant for interpreting theintegrated colours and spectra of high redshift sources. Thedetails provided by PINGS will contribute significantly tothe study of the chemical abundances and the global prop-erties of galaxies.
We have assessed very carefully all sources of errors anduncertainties found during the intrinsically complex reduc-tion of IFS observations. This complexity is further deep-ened if one considers building an IFU spectroscopic mosaicof a given object for which the observations were performedat very different stages, for some objects even spanning aperiod of years.
To demonstrate the use of these data, we presented afew relevant scientific examples that have been extractedfrom the data set. We presented the integrated spectra of theIFS mosaics of NGC1058 and NGC3310 and a comparisonwith previously published data. Furthermore, we obtainedemission line maps for NGC1058 and we presented a quali-tative description of the 2D distribution of physical proper-ties inferred from the line intensity maps. We performed acomparison of the emission line ratios obtained for a numberof selected H II regions from the literature, we showed thatthe emission line intensities obtained from the PINGS dataagree with previously published studies, and that the lineratios derived from a single H II region may depend stronglyon the position and aperture size of the slit/fibre (amongother factors) for a given spectroscopic study. Finally, weshowed the spectra of the SN 2007gr observed in NGC1058as an example of the utility of wide-field IFS surveys to findpotential SNe progenitors and their environmental proper-ties. Independent studies for individual objects, regions andgalaxies samples will be presented in future papers. As ahighlight of this project, the spectroscopic mosaicking of oneof the sample objects: NGC628, represents the largest areaever covered by an IFU observation. In Paper II we present
a complete analysis of the integrated and spatially resolvedproperties of this galaxy.
ACKNOWLEDGMENTS
FFRO would like to acknowledge the Mexican NationalCouncil for Science and Technology (CONACYT), the Di-reccion General de Relaciones Internacionales (SEP), TrinityCollege, the Cambridge Philosophical Society, and the RoyalAstronomical Society for the financial support to carry outthis research SFS and AD thank the Spanish Plan Na-cional de Astronomıa programmes AYA2005-09413-C02-02and AYA2007-67965-C03-03 respectively. SFS acknowledgesthe Plan Andaluz de Investigacion of Junta de Andalucıa asresearch group FQM360.
REFERENCES
Appleton P. N., Xu K. C., Reach W., et al., 2006, ApJ,639, L51
Arribas S., Mediavilla E., Garcıa-Lorenzo B., et al., 1999,A&AS, 136, 189
Bacon R., Copin Y., Monnet G., et al., 2001, MNRAS, 326,23
Balkowski C., Bottinelli L., Chamaraux P., et al., 1974, TheFormation and Dynamics of Galaxies: Proceedings fromIAU Symposium no. 58 held in Canberra, 58, 237
Blanc G. A., Heiderman A., Gebhardt K., et al., 2009, ApJ,704, 842
Bresolin F., 2006, arXiv, p. 10Cardelli J. A., Clayton G. C., Mathis J. S., 1989, ApJ, 345,245
Chornock R., Filippenko A. V., Li W., et al., 2007, CBET,1036, 1
Colless M., Dalton G., Maddox S., et al., 2001, Mon. Not.R. Astron. Soc., 328, 1039
de Paz A. G., Madore B. F., Boissier S., et al., 2005, ApJ,627, L29
de Vaucouleurs G., de Vaucouleurs A., Corwin H. G.,et al., 1991, Third Reference Catalogue of Bright Galaxies(RC3)
Diaz A. I., 1989, IN: Evolutionary phenomena in galaxies(A90-31743 13-90). Cambridge and New York, p. 377
Drozdovsky I. O., Karachentsev I. D., 2000, A&AS, 142,425
Eastman R. G., Schmidt B. P., Kirshner R., 1996, ApJ,466, 911
Falco E. E., Kurtz M. J., Geller M. J., et al., 1999, PASP,111, 438
Ferguson A. M. N., Gallagher J. S., Wyse R. F. G., 1998,AJ, 116, 673
Filippenko A. V., 1982, PASP, 94, 715Fisher K. B., Huchra J. P., Strauss M. A., et al., 1995,ApJS, 100, 69
Gallagher S. C., Charlton J. C., Hunsberger S. D., et al.,2001, AJ, 122, 163
Garnett D. R., 2002, ApJ, 581, 1019Haynes M. P., van Zee L., Hogg D. E., et al., 1998, AJ, 115,62
c© 2010 RAS, MNRAS 000, 1–26

26 Rosales-Ortega et al.
Hendry M. A., Smartt S. J., Maund J. R., et al., 2005,MNRAS, 359, 906
Hickson P., de Oliveira C. M., Huchra J. P., et al., 1992,ApJ, 399, 353
Izotov Y. I., Thuan T. X., 2004, ApJ, 602, 200Jarrett T. H., Chester T., Cutri R., et al., 2003, AJ, 125,525
Karachentsev I. D., Dolphin A. E., Geisler D., et al., 2002,A&A, 383, 125
Kauffmann G., Heckman T. M., White S. D. M., et al.,2003, Monthly Notice of the Royal Astronomical Society,341, 33
Kehrig C., Vılchez J. M., Sanchez S. F., et al., 2008, A&A,477, 813
Kelz A., Roth M. M., 2006, NewAR, 50, 355Kelz A., Verheijen M. A. W., Roth M. M., et al., 2006,PASP, 118, 129
Kennicutt R. C., 1992, ApJS, 79, 255Kennicutt R. C., Armus L., Bendo G., et al., 2003, PASP,115, 928
Kennicutt R. C., Garnett D. R., 1996, ApJ, 456, 504Kent S. M., 1981, Astronomical Society of the Pacific, 93,554
Kregel M., Sancisi R., 2001, A&A, 376, 59Leonard D. C., Filippenko A. V., Li W., et al., 2002, AJ,124, 2490
Lu N. Y., Hoffman G. L., Groff T., et al., 1993, ApJS, 88,383
McCall M. L., Rybski P. M., Shields G. A., 1985, ApJS,57, 1
Marquez I., Moles M., Masegosa J., 1996, A&A, 310, 401Martin P., Roy J.-R., 1994, ApJ, 424, 599Moustakas J., Kennicutt R. C., 2006a, ApJ, 651, 155Moustakas J., Kennicutt R. C., 2006b, ApJS, 164, 81Nakano S., Kushida R., 1999, IAU Circ., 7329, 1Nishiura S., Shimada M., Ohyama Y., et al., 2000, AJ, 120,1691
Nordgren T. E., Chengalur J. N., Salpeter E. E., et al.,1997, Astronomical Journal v.114, 114, 77
Oke J. B., 1990, AJ, 99, 1621Osterbrock D. E., Ferland G. J., 2006, Astrophysics ofgaseous nebulae and active galactic nuclei
Pagel B. E. J., Simonson E. A., Terlevich R. J., et al., 1992,MNRAS, 255, 325
Pastoriza M. G., Dottori H. A., Terlevich E., et al., 1993,MNRAS, 260, 177
Pettini M., 2006, The Fabulous Destiny of Galaxies: Bridg-ing Past and Present. Marseille International CosmologyConference (5 : 2005: Marseille, p. 319
Roberts M. S., Hogg D. E., Schulman E., 2001, Gas andGalaxy Evolution, 240, 294
Rosolowsky E., Simon J. D., 2008, ApJ, 675, 1213Roth M. M., Kelz A., Fechner T., et al., 2005, PASP, 117,620
Roy J.-R., Walsh J. R., 1988, MNRAS, 234, 977Saha A., Thim F., Tammann G. A., et al., 2006, ApJS,165, 108
Sanchez S. F., 2004, AN, 325, 167Sanchez S. F., 2006, AN, 327, 850Sanchez S. F., Aceituno J., Thiele U., et al., 2007, PASP,119, 1186
Sanchez S. F., Cardiel N., Verheijen M. A. W., et al., 2007a,
Mon. Not. R. Astron. Soc., 376, 125Sanchez S. F., Cardiel N., Verheijen M. A. W., et al., 2007b,A&A, 465, 207
Sanchez S. F., Garcıa-Lorenzo B., Jahnke K., et al., 2006,AN, 327, 167
Sanchez S. F., Rosales-Ortega F. F., Kenniccutt R., et al.,2009, submitted
Sandin C., Schonberner D., Roth M. M., et al., 2008, A&A,486, 545
Scowen P. A., Hester J. J., Gallagher J. S., et al., 1996,BAAS, 189, 1360
Skillman E. D., Kennicutt R. C., Hodge P. W., 1989, ApJ,347, 875
Smith D. A., Herter T., Haynes M. P., et al., 1999, ApJ,510, 669
Springob C. M., Haynes M. P., Giovanelli R., et al., 2005,ApJS, 160, 149
Storey P. J., Zeippen C. J., 2000, Mon. Not. R. Astron.Soc., 312, 813
Terry J. N., Paturel G., Ekholm T., 2002, A&A, 393, 57Theureau G., Bottinelli L., Coudreau-Durand N., et al.,1998, A&AS, 130, 333
Tremonti C. A., Heckman T. M., Kauffmann G., et al.,2004, ApJ, 613, 898
Valenti S., Elias-Rosa N., Taubenberger S., et al., 2008,ApJ, 673, L155
van Zee L., Salzer J. J., Haynes M. P., 1998, ApJ, 497, L1Verheijen M. A. W., Bershady M. A., Andersen D. R.,et al., 2004, AN, 325, 151
Vila-Costas M. B., Edmunds M. G., 1992, MNRAS, 259,121
Wehner E. H., Gallagher J. S., Papaderos P., et al., 2006,MNRAS, 371, 1047
Willick J. A., Courteau S., Faber S. M., et al., 1997, ApJS,109, 333
Woods D. F., Geller M. J., Barton E. J., 2006, AJ, 132,197
York D. G., Adelman J., Anderson J. E., et al., 2000, AJ,120, 1579
Zaritsky D., Kennicutt R. C., Huchra J. P., 1994, ApJ, 420,87
c© 2010 RAS, MNRAS 000, 1–26


