Embed Size (px)
Citation preview

Current Biology, Volume 22
Supplemental Information
DAD2 Is an / Hydrolase Likely to Be
Involved in the Perception of the Plant
Branching Hormone, Strigolactone Cyril Hamiaux, Revel S.M. Drummond, Bart J. Janssen, Susan E. Ledger,
Janine M. Cooney, Richard D. Newcomb, and Kimberley C. Snowden
Supplemental Inventory
1. Supplemental Figures and Tables
Figure S1, related to Figure 1
Figure S2, related to Figure 2
Figure S3, related to Figure 3
Figure S4, related to Figure 4
Table S1, related to Figure 2
2. Supplemental Experimental Procedures
3. Supplemental References


Figure S1. Identification of the DAD2 Gene, Related to Figure 1
(A) Phylogenetic analysis of DAD2 homologous proteins. Sequences with similarity to DAD2
were identified in public databases by iterative BLAST searches and aligned using CLUSTALX.
Phylogenetic relationships were determined using Geneious software to create a neighbor-joining
tree using the Jukes-Cantor model. Numbers are percent bootstrap values for 1000 replicates.
Genes are named with the first three letters of the genus name followed by the first two letters of
the species name followed by the mutant name and then the ChromDB accession
(http://www.chromdb.org/index.html) identifier except for one SOLLY gene which uses the
SolDB accession (http://solgenomics.net/). Three clades closely related to DAD2 were identified
and are shown along with an outgroup of related α/β hydrolase fold proteins.
(B) Sequence surrounding the insertion of the PhAT1 transposon into the intron of DAD2 in the
dad2-1 allele, and showing the footprint present after the excision of PhAT1 in revertants of
dad2-1 (denoted here as DAD2*).
(C) Sequence surrounding the insertion of the dTph1 transposon into the first exon of DAD2 in
the dad2-2 allele.
(D) Progeny of a self-cross of the tagged plant dad2-1 dad2-2, showing one plant with the
mutant phenotype and three revertant plants. Revertants are crosses between different genetic
backgrounds and are all well within the expected wild-type phenotype for these genetic
backgrounds. Beneath each photo is a description of the alleles of DAD2 present in each plant.
TSD, target site duplication; FP, footprint.


Figure S2. Analysis of the DAD2 Protein Structure, Related to Figure 2
(A, B) DAD2 and DAD2S96A active sites. Final a-weighted 2Fo-Fc electron density maps for
the (A) 2.15 Å resolution DAD2 and the (B) 2.8 Å resolution DAD2S96A (monomer A)
structures (see Table S1). Maps are shown around the active site in the same orientation, and are
both contoured at 1. In the DAD2 structure, a glycerol molecule was modelled in the internal
cavity, although it shows only partial electron density. The assignment of the glycerol moiety
was done on the basis of another dataset collected at 2.5 Å from a crystal grown in the presence
of 10% glycerol, and for which very clear density for a fully occupied glycerol site was observed
(data not shown). The DAD2S96A dataset was collected from crystals grown in presence of 1
mM GR24, but no density for GR24 was observed inside the cavity. Attempts to model the
spherical blob inside the cavity with a phosphate ion were not convincing and a water molecule
was modelled instead.
(C) Superimposition of the DAD2 and DAD2S96A (monomer A) active sites. The F27 has its
main chain slightly moved away from A96, as a result of the suppression of the hydrogen bond
present in the DAD2 structure, and its side chain has weak discontinuous electron density,
suggesting it is now partially disordered. Such flexibility of F27 inside the DAD2S96A mutant's
cavity may interfere with binding of GR24. In addition, H218, located just at the entrance of the
cavity shows different conformations, also within the different monomers of the DAD2S96A
structure, indicating that this residue has some flexibility.
(D) Position of the 7 phenylalanine residues surrounding the internal cavity (F27, F125, F135,
F144, F158, F174, F194), mostly around its entrance located at the top of the drawing. F194,
opposite to S96, has very weak density in both structures indicating it is highly flexible.
(E-G) Comparisons between DAD2 and GID1. (E,F) Structural comparisons between DAD2
(left) and GID1 in complex with GA4 (right, PDB entry code 3EBL). (E) Top view and (F) side
view rotated from E ~90 degrees around a horizontal axis. In both cases, the conserved / core
domain is shown in grey. The lids are shown in orange for DAD2 (residues 126-198, including
the β-hairpin spanning residues 126-134) and in blue for GID1 (residues 15-53 and 232-261).
Internal cavities are in red and cyan. The bound GA4 is shown in stick mode inside the GID1
cavity. (G) Topology diagrams of DAD2 and GID1 proteins.

Figure S3. Thermal Stability of DAD2H246A, Related to Figure 3
Thermal stability of DAD2H246A at varying concentrations of GR24 as assessed by differential
scanning fluorometry.
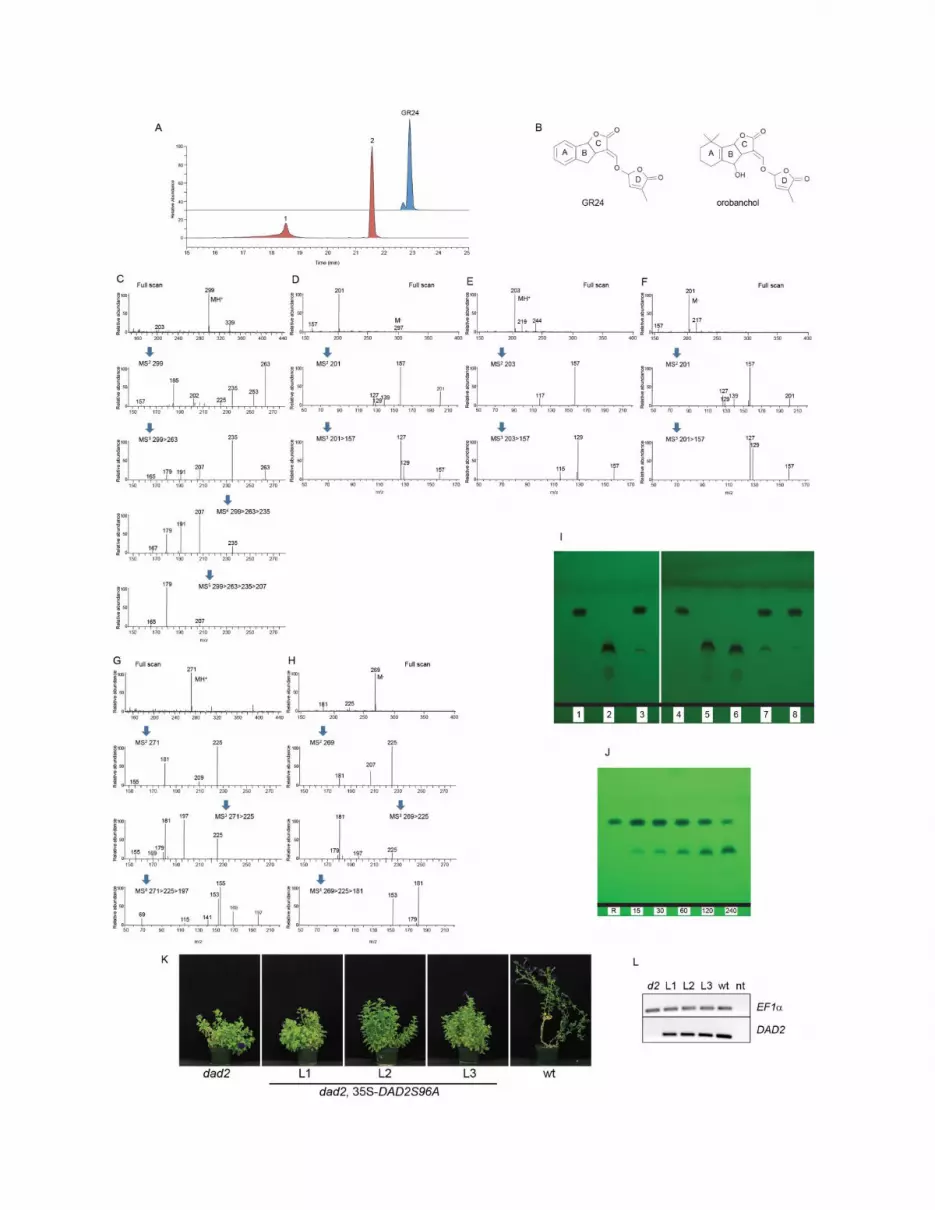
Figure S4. Cleavage of GR24 by DAD2, Related to Figure 4
(A-G) MS-MS data for the identification of GR24 hydrolysis by DAD2. (A) LC-APCI-MS base
peak plot of GR24 (top) [MH+ 299] and the GR24 reaction products (bottom) 1 [MH
+ 203] and 2
[MH+ 271]. (B) The structure of GR24 and the natural strigolactone orobanchol for comparison,
with labelling of rings indicated. (C,D) LC-APCI-MSn analysis of GR24 in (C) positive ion
mode, and (D) negative ion mode. (E,F) LC-APCI-MSn analysis of GR24 reaction product 1 in
(E) positive ion mode, and (F) negative ion mode.
(G,H) LC-APCI-MSn analysis of GR24 reaction product 2 in (G) positive ion mode, and (H)
negative ion mode.
(I,J) TLC analysis of GR24 hydrolysis. (I) GR24 hydrolysis in the presence of DAD2 (lane 2, 5
and 6), DAD2S96A (lane 3) or DAD2H246A (lane 7). A no-protein solution was used as
negative control (lane 8). Lanes 1 and 4 contain fresh GR24 as a reference. (J) A time course of
GR24 cleavage. Time points (15, 30, 60, 120 and 240 minutes) are indicated. Fresh GR24 in
acetone was used as a reference (lane R).
(K,L) DAD2S96A does not complement the dad2 mutant. (K) Three independent lines of dad2
(L1, L2, L3) transformed with 35S-DAD2S96A show a highly branched phenotype. (L)
Expression of the transgene in each of the lines was confirmed by semi-quantitative PCR on
cDNA, using EF1α as a control.

Table S1. Data Collection and Refinement Statistics, Related to Figure 2
Crystal DAD2 DAD2-S96A Space Group I23 P31 Cell parameters (Å and
o) a = b = c = 129.3 a = b = 176.7, c = 107.7
= = = 90 = = 90, = 120 Number of molecules/au 1 12
Dataset Beamline Australian Synchrotron MX1 Australian Synchrotron MX2
(Å) 0.941797 0.978916
Total rotation range (o) 180 360
Resolution (Å) 40.88 - 2.15 (2.27 - 2.15) 62.36 - 2.8 (2.95 - 2.8) Reflections observed 426889 (62828) 1030174 (147278) Unique reflections 19684 (2848) 92560 (13513) Rmerge (%) 12.6 ( 45.8) 18.2 (53.0)
I/(I) 20.1 (7.7) 10.2 (4.5)
Completeness (%) 100.0 (100.0) 100.0 (100.0) Multiplicity 21.7 (22.1) 11.1 (10.9) Average mosaicity (
o) 0.26 0.35
Bwilson 23.6 56.6
Refinement Resolution (Å) 40.88 - 2.15 (2.206 - 2.15) 62.36 - 2.8 (2.873 - 2.8) Reflections used 18665 (1372) 87904 (6554) Number of atoms all/protein/water/others 2268/2072/182/14 25042/24719/323 TLS groups 1 (whole molecule) 12 (one per monomer) NCS symmetry none 12-fold Rwork / Rfree (%) 16.7/21.1 (17.5/21.5) 24.2/27.2 (26.4/31.4) Average B factors all atoms/protein/water/others 26.6/26.0 /33.1/35.8 52.6/52.7/44.5 RMSD bond (Å) / angles (
o) 0.016/1.492 0.015/1.463
Ramachandran statistics (%) Most favored 90.4 89.3 Allowed 9.1 10.2 Generous 0.4 0.1 Disallowed 0 0.3
Values in parentheses are for the last resolution shell.

Supplemental Experimental Procedures
Plant Methods
Petunia (Petunia hybrida) Vilm inbred genetic stock V26 and the dad mutants derived from V26
[1] were grown under greenhouse conditions as described previously [2]. For transposon tagging
two endogenous transposon lines in petunia were used (with active copies of either Psl or dTph1)
[3, 4], dad2-1 was crossed to each line and progeny screened for dad2 mutant phenotype plants.
Approximately 60,000 progeny were screened from the Psl-active line and dad2-1 cross, with no
dad2-phenotype plants identified. Among the 8,300 progeny produced between the dTph1-active
line and dad2-1, one highly branched plant was identified, and the new allele of DAD2 in this
plant is referred to as dad2-2. Inverse PCR from petunia transposons identified transposon
insertions in mutant dad2 alleles.
Transgenic Petunia hybrida plants were produced using Agrobacterium-mediated
transformation essentially using the method of Janssen and Gardner [5] using leaf pieces (approx
6 mm2) rather than leaf discs. Four of five independent lines transformed with the 35S-DAD2 T-
DNA complemented the dad2 mutant.
For strigolactone treatment of plants, GR24 (Chiralix, Nijmegen, The Netherlands, 10 µM
in 0.5% acetone, 0.1% Tween20, 0.05% Silwet) was applied seven times over 14 days directly to
all axillary buds on wild type, dad1 and dad2 mutant plants.
For Arabidopsis (Col-O background) two-node bud growth assays, the method followed
[6] except that the ATS solution was replaced with a hydroponic salt solution (HSS) containing
1.5 mM calcium nitrate, 0.5 mM phosphoric acid, 1.5 mM potassium chloride, 0.5 mM
magnesium sulphate, 5 µM iron (III) chloride, 40 µM EDTA iron (III) sodium salt, 6 µM
manganese chloride, 6 µM zinc chloride, 40 µM boric acid, 4 µM cupric chloride, and 0.1 µM
sodium molybdate. GR24 or products (both in PBS containing 5% DMSO, see hydrolysis section
below) were diluted 100-fold in HSS (final concentration of GR24 or products was 5 µM) and
the control solution had an equivalent amount of DMSO and PBS added.
Quantitative RT-PCR
Quantitative RT-PCR using three housekeeping genes to normalise gene expression was carried
out as described previously [7]. Primers used to amplify the DAD2 gene were 5’-
TAGGTGGGAAGAACACAGTGC-3’ and 5’-CCTATGTGAAAGAGCTCTTCTCAACTC-3’,
and the CDKB gene were 5’-TTAGGAACCCCAACTGAGCA-3’ and 5’-
GGAACATGAGAGGCCAAGTT-3’. Petunia CDKB was identified from the petunia454DB
(http://140.164.45.140/454petuniadb/) as ClusterID PETAX003053.
Yeast 2-Hybrid Methods
The 36 possible pairwise combinations of DAD2, DAD2S96A, PhMAX2A, PhMAX2B, PSK3
and empty vector in pAD and pBD plasmids [8] in PJ69-4 yeast [9] were screened in the
presence and absence of 5 µM GR24 (Chiralix, Nijmegen, The Netherlands) on selective media
using methods from Clontech Yeast Protocols Handbook, 2009. The presence of the binding
domain and activation domain fusion proteins in selected diploid yeast strains was confirmed by
Western analysis. Liquid culture assays using orthonitrophenyl-β-galactopyranoside (Sigma-
Aldrich) as the substrate, were used to quantify the strength of the interactions between the
combinations of proteins. The value of Kd for the DAD2/MAX2A interaction is the mean ± SEM

over three replicate experiments. When a third untagged protein was required in yeast 2-hybrid
experiments, it was supplied from pU3, a Gateway-enabled derivative of pTFT1 [10] constructed
by C. Brendolise, Plant & Food Research.
Protein, Expression and Purification
DAD2 was codon optimised for bacterial expression and produced as a cleavable His-MBP
fusion protein in Escherichia coli Rosetta-Gami2 cells at 20 oC with 0.5 mM isopropyl-β-D-thio-
galactoside. The fusion protein was purified by metal affinity chromatography (TALON resin,
Clontech) and anion exchange (Hi-Trap Q HP, GE Healthcare). After proteolytic cleavage with
TEV protease, DAD2 was purified by metal affinity chromatography in 20 mM Tris-HCl, 100
mM NaCl, 50 mM L-glutamic acid, 50 mM L-arginine (pH 8.0), concentrated to ~8-10 mg/mL,
and stored at −80 oC. Active site mutations (S96A, H246A) were generated using the
QuikChange® Lightning kit (Agilent Technologies). All mutants were expressed and purified in
the same manner as wild-type protein. Before other analyses (TLC, LC/MS, DSF), DAD2 and
mutants were exchanged into PBS buffer by gel filtration (Superdex 200 10/300 GL, GE
Healthcare).
Crystallization, Data Collection and Structure Determination
DAD2 (9 mg/mL) and the DAD2S96A mutant (4 mg/mL, supplemented with 1 mM GR24 in
PBS, 5% DMSO) were crystallized by hanging drop vapour diffusion at 18 oC. Precipitants were
100 mM HEPES (pH 7.1), 0.6 M (NH4)2HPO4, and 100 mM MES (pH 6.6), 0.2 M (NH4)2HPO4,
18% PEG 3350, respectively. Crystals were cryoprotected by transfer into precipitant solutions
supplemented with glycerol.
Datasets were collected at the Australian Synchrotron, and processed with iMOSFLM [11],
Pointless [12] and Scala [12]. Statistics are listed in Table S1. The structure of wt-DAD2 was
solved by molecular replacement with Phaser [13], using Bacillus subtilis RsbQ (40% sequence
identity with DAD2) as template (PDB entry code 1WOM). The final model was automatically
built using Buccaneer [14]. The structure of the DAD2S96A mutant was solved with Phaser
using DAD2 as the template and searching for 12 solutions. Refinements were done with
Refmac5 [15] and Coot [16]. Statistics are listed in Table S1.
Hydrolysis of GR24 and Purification of Products for Bud Assays
Hydrolysis for bud assays used 25 µM DAD2 and 0.5 mM GR24 in PBS buffer containing 5%
DMSO. After 18 hours incubation at 25° C the reaction mixture was centrifuged at 20,000×g for
5 minutes and filtered through a Vivaspin 500 (MWCO=3000 Da; Sartorius) to separate the
protein from the products. An aliquot (100 µL) of the products was analyzed by TLC (as
described in the Supplementary Figure S4) to ensure hydrolysis was complete. Control solution
consisted of PBS buffer containing 5% DMSO incubated at 25 oC as above.
Thin Layer Chromatography
125 µL reactions consisting of DAD2, DAD2S96A or DAD2H246A 50 µM and GR24 1 mM in
PBS buffer containing 5% DMSO were incubated at 25 °C for 18 hours. A no-protein solution (1
mM GR24 in PBS / 5% DMSO) incubated in the same conditions was used as negative control.
Reaction mixtures were transferred to 4 mL glass vials, and extracted with 1 mL ethyl acetate by
vortexing for 1 minute. After 5 minutes centrifugation at 3500×g, the organic phase was
collected and transferred into a 1 mL glass vial containing 5 µL acetic acid. The extract was
evaporated under nitrogen, resuspended in 20 µL acetone containing 5/1000 acetic acid, and
analyzed by TLC on a pre-coated silica gel 60 F254 plate (Merck) using chloroform/acetone (4:1,
v/v, containing 5/1000 acetic acid) as developing solvent. Spots were visualized under UV light
(254 nm).
For the time course of GR24 cleavage, a 500 µL reaction containing 50 µM DAD2 and 1
mM GR24 in PBS containing 5% DMSO was incubated at 22 °C. At given time points (15, 30,
60, 120 and 240 minutes), 100 µL aliquots were transferred to 4 mL glass vials, extracted with 1
mL ethyl acetate and analyzed by TLC as described above. Fresh GR24 in acetone was used as a
reference.
LC/MS-MS
DAD2 50 µM and GR24 1 mM in PBS buffer containing 5% DMSO were incubated at 25 oC for
18 hours. The reaction mixture was centrifuged at 20,000×g for 5 minutes and filtered through a
Vivaspin 500 (MWCO=3000 Da; Sartorius) to separate the protein from the products. Products,
collected in the flow-through, were either analyzed directly by HPLC, or diluted 10-fold in
formic acid 0.1% for LC-MS analysis. GR24 was dissolved in PBS, 5% DMSO for HPLC and in
methanol, isopropanol, 0.1% formic acid before being further diluted with 0.1% formic acid for
LC-MS. LC-MS employed an LTQ linear ion trap mass spectrometer fitted with an APCI
interface (ThermoFisher, San Jose, CA, USA) coupled to an Ettan™ MDLC (GE Healthcare
Bio-Sciences) and Surveyor™ PDA detector. Separation of GR24 and its hydrolysis products
was achieved using a Prodigy 5µ ODS(3) 100Å (Phenomenex, Torrance, CA, USA), 150 × 2
mm analytical column maintained at 35 ºC. Solvents were (A) acetonitrile + 0.1% formic acid
and (B) water + 0.1% formic acid and the flow rate was 200 µL/min. The initial mobile phase,
95% A/ 5% B, was held for 1 minute then ramped linearly to 100% B at 32 minutes and held for
1 minute before resetting to the original conditions. Sample injection volume was 10 L. PDA
detection was by absorbance from 200-600 nm. MS data were acquired in both the negative and
positive modes using a data-dependent LC- MS5 method with dynamic exclusion enabled and a
repeat count of 2.
Differential Scanning Fluorimetry (DSF)
DSF experiments [17] were performed on a LightCycler 480 (Roche) using excitation and
emission wavelengths of 498 and 640 nm, respectively. Sypro Tangerine (Ex/Em: 490/640 nm)
was used as the reporter dye. Samples were heat-denatured using a linear 25 to 95 oC gradient at
a rate of 1.3 oC per minute. Protein unfolding was monitored by detecting changes in Sypro
Tangerine fluorescence. The inflection point of the fluorescence vs temperature curves was
identified by plotting the first derivative over temperature using the “Tm calling” function of the
LightCycler 480 Software, and the minima were referred to as the melting temperatures.
Final reaction mixtures were prepared in triplicate in 384-well white microplates, by
mixing 10 µL of 20 µM DAD2 (wt, S96A, H246A) containing Sypro Tangerine 20× in PBS
buffer, and 10 µL of GR24 solutions at 0, 20, 50, 100, 200 and 400 µM in PBS buffer containing
10% DMSO. Reactions were incubated for 30 minutes at room temperature in the absence of
light before analysis.

Supplemental References
1. Napoli, C.A., and Ruehle, J. (1996). New mutations affecting meristem growth and potential in
Petunia hybridaVilm. J. Hered. 87, 371-377.
2. Snowden, K., Simkin, A., Janssen, B., Templeton, K., Loucas, H., Simons, J., Karunairetnam, S.,
Gleave, A., Clark, D., and Klee, H. (2005). The decreased apical dominance1/Petunia hybrida
CAROTENOID CLEAVAGE DIOXYGENASE8 gene affects branch production and plays a role in leaf
senescence, root growth, and flower development. Plant Cell 17, 746-759.
3. Gerats, A.G., Huits, H., Vrijlandt, E., Marana, C., Souer, E., and Beld, M. (1990). Molecular
characterization of a nonautonomous transposable element (dTph1) of petunia. Plant Cell 2, 1121-1128.
4. Snowden, K.C., and Napoli, C.A. (1998). Psl: a novel Spm-like transposable element from Petunia
hybrida. Plant J. 14, 43-54.
5. Janssen, B.J., and Gardner, R.C. (1990). Localized transient expression of GUS in leaf discs
following cocultivation with Agrobacterium. Plant Mol Biol 14, 61-72.
6. Crawford, S., Shinohara, N., Sieberer, T., Williamson, L., George, G., Hepworth, J., Müller, D.,
Domagalska, M.A., and Leyser, O. (2010). Strigolactones enhance competition between shoot branches
by dampening auxin transport. Development 137, 2905-2913.
7. Drummond, R.S.M., Sheehan, H., Simons, J.L., Martinez-Sánchez, N.M., Turner, R.M., Putterill,
J., and Snowden, K.C. (2012). The expression of petunia strigolactone pathway genes is altered as part of
the endogenous developmental program. Frontiers in Plant Science 2, 115.
8. Maier, R., Brandner, C., Hintner, H., Bauer, J., and Önder, K. (2008). Construction of a reading
frame–independent yeast two-hybrid vector system for site-specific recombinational cloning and protein
interaction screening. BioTechniques 45, 235-244.
9. James, P., Halladay, J., and Craig, E. (1996). Genomic Libraries and a Host Strain Designed for
Highly Efficient Two-Hybrid Selection in Yeast. Genetics 144, 1425-1436.
10. Egea-Cortines, M., Saedler, H., and Sommer, H. (1999). Ternary complex formation between the
MADS-box proteins SQUAMOSA, DEFICIENS and GLOBOSA is involved in the control of floral
architecture in Antirrhinum majus. EMBO J 18, 5370-5379.
11. Leslie, A.G. (2006). The integration of macromolecular diffraction data. Acta Crystallogr D Biol
Crystallogr 62, 48-57.
12. Evans, P. (2006). Scaling and assessment of data quality. Acta Crystallogr D Biol Crystallogr 62,
72-82.
13. McCoy, A.J., Grosse-Kunstleve, R.W., Adams, P.D., Winn, M.D., Storoni, L.C., and Read, R.J.
(2007). Phaser crystallographic software. J Appl Crystallogr 40, 658-674.
14. Cowtan, K. (2006). The Buccaneer software for automated model building. 1. Tracing protein
chains. Acta Crystallogr D Biol Crystallogr 62, 1002-1011.
15. Murshudov, G.N., Vagin, A.A., Lebedev, A., Wilson, K.S., and Dodson, E.J. (1999). Efficient
anisotropic refinement of macromolecular structures using FFT. Acta Crystallogr D Biol Crystallogr 55,
247-255.
16. Emsley, P., Lohkamp, B., Scott, W.G., and Cowtan, K. (2010). Features and development of Coot.
Acta Crystallogr D Biol Crystallogr 66, 486-501.
17. Niesen, F.H., Berglund, H., and Vedadi, M. (2007). The use of differential scanning fluorimetry to
detect ligand interactions that promote protein stability. Nat Protoc 2, 2212-2221.


