Embed Size (px)
Citation preview

FINAL REPORT | MAY 31, 2016
HENNEPIN AND 1ST AVENUE TRANSPORTATION STUDY
Prepared by: Alliant Engineering, Inc.
Prepared for: City of Minneapolis

Hennepin and 1st Avenue Transportation Study
i
Alliant No. 115-0063
Acknowledgements
Alliant acknowledges and thanks the members of the Study Review Committee for their
participation in the study process. Their involvement provided valuable insight and was important
to the successful completion of the study. The Hennepin Avenue and 1st Avenue Transportation
Study was prepared under the direction of:
Project Team
Nathan Koster, Transportation Planner, City of Minneapolis
Study Review Committee
Haila Maze, Community, Planning and Economic Development, City of Minneapolis
Allan Klugman, Traffic and Parking Services, City of Minneapolis
Robert Byers, Transportation Department, Hennepin County
Kelly Yemen, Transportation Department, Hennepin County
Ron Rauchle, Metro District, MnDOT
Kyle Burrows, Metro Transit
David Hanson, Metro Transit
Consultant
Alliant Engineering, Inc.
Minneapolis, MN

Hennepin and 1st Avenue Transportation Study
ii
Alliant No. 115-0063
Table of Contents
Acknowledgements ........................................................................................................................ i
Table of Contents .......................................................................................................................... ii
List of Figures ............................................................................................................................... iii
List of Tables ................................................................................................................................ iv
List of Appendices ........................................................................................................................ iv
Executive Summary .................................................................................................. ES-1
1.0 Introduction .................................................................................... 1
Project Location ...................................................................................................................1
Study Overview ...................................................................................................................1
Study Purpose and Need ......................................................................................................2
Stakeholder and Public Involvement ...................................................................................3
1.4.1 Technical Advisory Committee ...................................................................................4
1.4.2 Neighborhood Study Advisory Committee .................................................................5
1.4.3 Project Website ............................................................................................................5
2.0 Existing and Future Conditions .................................................... 6
Street Network .....................................................................................................................6
Roadway Safety ...................................................................................................................6
Transit ..................................................................................................................................9
Land Use ............................................................................................................................12
Parking ...............................................................................................................................14
Mobility..............................................................................................................................14
2.6.1 Bicycle and Pedestrians .............................................................................................14
2.6.2 Motor Vehicles...........................................................................................................17
2.6.3 Regional Traffic Demand ..........................................................................................19
2.6.4 Two-way Street Network ...........................................................................................19
Issues and Constraints ........................................................................................................23
3.0 Alternatives Development ........................................................... 25
Key Objectives ...................................................................................................................25
Design Considerations .......................................................................................................26
Screening Evaluation Process ............................................................................................27
Universe of Alternatives ....................................................................................................30
Leading Typical Section Alternatives ................................................................................33
4.0 Concept Design ............................................................................. 36
One-way Concepts .............................................................................................................36
Two-way Concepts ............................................................................................................37

Hennepin and 1st Avenue Transportation Study
iii
Alliant No. 115-0063
5.0 Evaluation of Alternatives ........................................................... 47
Concept Design Alternatives Evaluation Matrix ...............................................................47
Motor Vehicle Mobility and Access ..................................................................................49
5.2.1 Approach ....................................................................................................................50
5.2.2 Planned Streetcar .......................................................................................................50
5.2.3 Results ........................................................................................................................51
5.2.4 Motor Vehicle and Transit Vehicle Travel Times .....................................................55
5.2.5 Mobility Analysis Conclusions ..................................................................................61
5.2.6 Design Considerations ...............................................................................................62
Concept Design Benefit and Impact Evaluation ................................................................64
6.0 Cost Estimate ................................................................................ 70
Long Term Implementation ...............................................................................................70
Interim Implementation .....................................................................................................70
7.0 Next Steps ...................................................................................... 71
List of Figures Figure 1. Study Area ....................................................................................................................... 3 Figure 2. Existing Street Network Characteristics .......................................................................... 7 Figure 3. Existing Sidewalk Conditions ......................................................................................... 8
Figure 4. Crash History ................................................................................................................. 10 Figure 5. Transit Network ............................................................................................................. 11
Figure 6. Existing Land Use ......................................................................................................... 12 Figure 7. Potential Redevelopment Parcels .................................................................................. 13
Figure 8. Public Parking Utilization ............................................................................................. 15 Figure 9. Existing Pedestrian and Bicycle Volumes ..................................................................... 16
Figure 10. Existing Motor Vehicle Traffic Volumes .................................................................... 18 Figure 11. Origin-Destination Traffic Patterns ............................................................................. 21 Figure 12. Existing Two-way Street Network Motor Vehicle Volumes ...................................... 22
Figure 13. Issues and Constraints ................................................................................................. 24 Figure 14. Alternatives Development Process .............................................................................. 25 Figure 15. Key Design Parameters ............................................................................................... 27
Figure 16. Concept Design – One-way Alternative 1-1B ............................................................. 39 Figure 17. Concept Design – One-way Alternative 1-2B ............................................................. 41 Figure 18. Concept Design – One-way Alternative 1-2C ............................................................. 43 Figure 19. Concept Design – Two-way Alternative 2-1B ............................................................ 44 Figure 20. Concept Design – Two-way Alternative 2-1C ............................................................ 46
Figure 21. Overall Intersection Delay (seconds/vehicle) Comparison – AM Peak Period .......... 53 Figure 22. Overall Intersection Delay (seconds/vehicle) Comparison – Off Peak Period ........... 54
Figure 23. Overall Intersection Delay (seconds/vehicle) Comparison – PM Peak Period ........... 54 Figure 24. Hennepin Avenue and 1st Avenue Travel Time Comparison – AM Peak Period ....... 56 Figure 25. Hennepin Avenue and 1st Avenue Travel Time Comparison – Off Peak Period ........ 57 Figure 26. Hennepin Avenue and 1st Avenue Travel Time Comparison – PM Peak Period ........ 58 Figure 27. Total Network Delay Comparison............................................................................... 59

Hennepin and 1st Avenue Transportation Study
iv
Alliant No. 115-0063
Figure 28. PM Peak Period Congestion Map................................................................................ 63
List of Tables Table 1. Existing and Forecast 2035 Motor Vehicle ADT ........................................................... 17 Table 2. Two-way Street Network Limits .................................................................................... 20 Table 3. Alternatives Evaluation Objectives ................................................................................ 26 Table 4. Evaluation Metrics .......................................................................................................... 29
Table 5. One-way Scenario Alternatives Screening Analysis ...................................................... 31 Table 6. Two-way Scenario Alternatives Screening Analysis...................................................... 32 Table 7. Leading One-way Typical Cross Sections ...................................................................... 33 Table 8. Leading Two-way Typical Cross Sections ..................................................................... 34 Table 9. Interim Concept 1-1A ..................................................................................................... 37
Table 10. Interim Concept 1-2A ................................................................................................... 37
Table 11. Interim Concept 2-1A ................................................................................................... 38
Table 12. Concept Design Alternatives Qualitative Evaluation Matrix ....................................... 47 Table 13. Concept Design Comparison Summary ........................................................................ 48
Table 14. Traffic Operation Analysis Scenario Matrix ................................................................ 50 Table 15. Level of Service Description ........................................................................................ 52 Table 16. Concept Design Evaluation – One-way Concept 1-1B ................................................ 64
Table 17. Concept Design Evaluation – Concept 1-2B ................................................................ 65 Table 18. Concept Design Evaluation – Concept 1-2C ................................................................ 66
Table 19. Concept Design Evaluation – Concept 2-1A ................................................................ 67 Table 20. Concept Design Evaluation – Concept 2-1B ................................................................ 68 Table 21. Concept Design Evaluation – Concept 2-1C ................................................................ 69
Table 22. Planning Level Reconstruction Cost Estimate .............................................................. 70
List of Appendices Appendix A: Neighborhood Study Advisory Committee Meeting Minutes

Hennepin and 1st Avenue Transportation Study
ES-1
Alliant No. 115-0063
Executive Summary
A multimodal transportation study has been completed to evaluate the existing transportation
system and a range of roadway concepts in the Nicollet Island-East Bank (NIEB) and Marcy
Holmes Neighborhoods. This planning study examined one-way, two-way, and hybrid roadway
configurations along the Hennepin and 1st Avenue corridors with consideration for quality of life,
access, safety, connectivity, and mobility for all modes of travel.
Along with other priorities, this study identifies draft roadway concepts and documents benefits
and impacts (i.e., pros and cons) associated with any potential implementation. Particular attention
is paid to the following elements:
Access to and from primary destination points,
Innovative pedestrian and bicycle infrastructure,
Providing a safe environment for all travel modes,
Alignment with future development plans,
Changes in traffic operations and parking demand,
Existing and planned transit service, and
Consideration of travel through the study area.
Purpose The purpose of this study was to develop and evaluate roadway concepts that improve safety and
comfort for all users within the public right of way, while ensuring improved neighborhood
connectivity and mobility for all modes within and through the study area. Key neighborhood goals
include:
Connect pedestrian, bicycle, and transit infrastructure to the River and to adjacent
neighborhoods and districts, including downtown Minneapolis, the University of
Minnesota, Dinkytown and the Northeast Arts District.
Provide an exceptional urban pedestrian experience for people of all ages.
Enhance the pedestrian and bicyclist experience and improve pedestrian and bicyclist
safety and comfort.
Achieve a better balance between pedestrian, bicycle, transit and automobile travel modes.
Expand and improve pedestrian, bicycling, and transit infrastructure throughout the
neighborhood.
Improve multi-modal connections with existing transportation networks to improve access
to and from destinations throughout Minneapolis and beyond.
Parking will be conveniently accessible for residents and visitors who choose to travel by
car.
Support improved transit services and infrastructure including the Nicollet-Central
Streetcar implementation, real time transit information signage and otherwise.
Corridor Needs A detailed technical analysis was completed to evaluate the existing roadway, multimodal
facilities, the future land use, and transportation network conditions. Key elements include the
Hennepin and 1st Avenue Transportation Study
ES-2
Alliant No. 115-0063
corridor characteristics, pedestrian and bicycle network, parking, transit, roadway safety, land use,
and mobility.
Alternatives Development
The alternatives development process developed and evaluated a multitude of cross-section
configurations based upon input form stakeholders and a review of the purpose and needs. From
this range of alternatives, a screening evaluation was completed to evaluate 88 typical cross-
sections against key objectives. This process identified the alternatives that best met the project
goals and were carried forward for further screening and evaluation.
Concept Design Six leading cross-section configurations were developed into more refined concept designs to
illustrate how the typical sections may be applied through the study area.
Concept 1-1B: One-way, Two Travel Lanes with Right Side Transit and Protected Bike
Lane
Concept 1-2B: One-way, Three Travel Lanes with Off Peak Parking, Left Side Streetcar
and Protected Bike Lane
Concept 1-2C: One-way, Three Travel Lanes with Right Side Transit and Protected Bike
Lane
Concept 2-1A: Two-way, Three Travel Lanes, Two Side Parking and Standard Bike Lane
Concept 2-1B: Two-way, Three Travel Lanes, One Side Parking and Protected Bike Lane
Concept 2-1C: Two-way, Three Travel Lanes, Two Side Parking and Protected Bike Lane
The primary goal of each concept design was to balance the vision of the community, existing
physical constraints, and the regional role Hennepin and 1st Avenue serve beyond the immediate
neighborhood. The design features included in each concept included: a protected bicycle facility,
streetcar alignment (both left and right side alignments are illustrated), wider sidewalks and
increased pedestrian space wherever feasible, shorter pedestrian crosswalks, on street parking,
opportunities for “greening”, and vehicle travel lanes.
Concept Evaluation A detailed evaluation was conducted for the six concept designs to assess their individual benefits
and impacts to the right-of-way, users, residents, and businesses. The evaluation focused on the
key objectives and neighborhood priorities. A detailed traffic operation analysis was conducted to
assess access, mobility, and the benefits and impacts (i.e., pros and cons) associated with any
potential implementation of the concept designs. A summary of the qualitative evaluation is shown
below.

Hennepin and 1st Avenue Transportation Study
ES-3
Alliant No. 115-0063
The analysis indicates there may be negative mobility and access impacts under forecasted p.m.
peak period conditions with the design concept that reduces the number of northbound travel lanes
on Hennepin Avenue. The concepts with two travel lanes along Hennepin Avenue (one-way or
two-way scenarios) are expected to experience congestion at the first couple traffic signals into the
network (Main Street to University Avenue). The congestion is the result of the combined impact
from a reduction to two travel lanes, additional signal phases at Main Street, and transit operations
(dwelling transit vehicles) in the right lane. The two-way scenario introduces complication with
the potential for the left lane to be blocked by a yielding motorist waiting to turn left and dwelling
transit vehicles in the right lane. A queue length extending over the Hennepin Avenue Bridge is
expected. This may impact the operation of the West River Parkway and Nicollet Island bus stops
and streetcar stations. The overall travel time impact as result of this congestion is expected to
triple the motor vehicle and double bus transit travel times under the two travel lane scenarios. It
may be reasonable to assume motorists may divert to other travel routes or the demand may spread
to time periods outside of the peak period. A macro-level travel demand modeling analysis was
not conducted to estimate the potential diversion to other routes in downtown and near-downtown
neighborhoods.
Next Steps Planning-level construction cost estimates were prepared to help assess the funding need. The
estimated cost for a full reconstruction is approximately $17.2 Million. Interim implementation of
one-way or two-way concepts could be addressed as part of a pavement marking or resurfacing
project. The costs have been estimated at $590,000 and $1.2 Million (cost do not include
bituminous or concrete resurfacing, but do include bituminous seal coat) for the one-way and two-
way alternatives, respectively. Any efforts related to advancing a full reconstruction of the
corridors would require more detailed engineering, investigation, and stakeholder engagement.
Upon determining the long-term operations of the Hennepin and 1st Avenue corridors, a detailed
study of the Central/Hennepin/5th intersection will be required to identify and evaluate potential
intersection improvement solutions to address the mobility, safety, multimodal deficiencies,
greening, and the potential development of special service districts.

Hennepin and 1st Avenue Transportation Study
1
Alliant No. 115-0063
1.0 Introduction
A multimodal transportation study has been completed to evaluate the existing transportation system
and a range of roadway concepts in the Nicollet Island-East Bank (NIEB) and Marcy Holmes
Neighborhoods. This planning study examined one-way, two-way, and hybrid roadway
configurations along the Hennepin and 1st Avenue corridors with consideration for quality of life,
access, safety, connectivity, and mobility for all modes of travel.
Project Location
This study evaluated the segments of Hennepin Avenue and 1st Avenue NE between the Hennepin
Avenue Bridge and 7th Street NE (northeast of Central Avenue). Both corridors serve as a primary
connection between the Downtown Central Business District and Northeast Minneapolis, along with
access to local businesses and adjoining neighborhoods. In addition to evaluating the Hennepin
Avenue and 1st Avenue NE corridors, the study includes all signalized intersections within proximity
of the study area. Figure 1 illustrates the study area and key intersections included within the
transportation study.
Study Overview
Several transportation studies have been completed in recent years that identify potential multimodal
opportunities, potential redevelopment, and transit system enhancements that will affect the NIEB
and Marcy Holmes neighborhoods. The studies have identified the Hennepin and 1st Avenue NE
corridors as part of the protected bicycle plan1 and part of the Nicollet-Central streetcar alignment2.
In addition, a top priority identified by residents in the NIEB neighborhood small area plan3 is to
restore the Hennepin and 1st Avenue NE to two-way street operation. A record of recent previous
studies is shown on the study corridor timeline on Page 4.
Along with other priorities, this study will identify draft roadway concepts and document benefits
and impacts (i.e., pros and cons) associated with any potential implementation. There will be
particular attention to the following elements:
Access to and from primary destination points,
Innovative pedestrian and bicycle infrastructure,
Providing a safe environment for all travel modes,
Alignment with future development plans,
Changes in traffic operations and parking demand,
Existing and planned transit service, and
Consideration of travel through the study area.
1 Protected Bikeway Update to the Minneapolis Bicycle Master Plan, City of Minneapolis, August 2015 2 Nicollet-Central Modern Streetcar Environmental Assessment, City of Minneapolis, February 2015 3 Nicollet Island-East Bank Neighborhood Small Area Plan, NIEB Neighborhood Association, September 2014
Hennepin and 1st Avenue Transportation Study
2
Alliant No. 115-0063
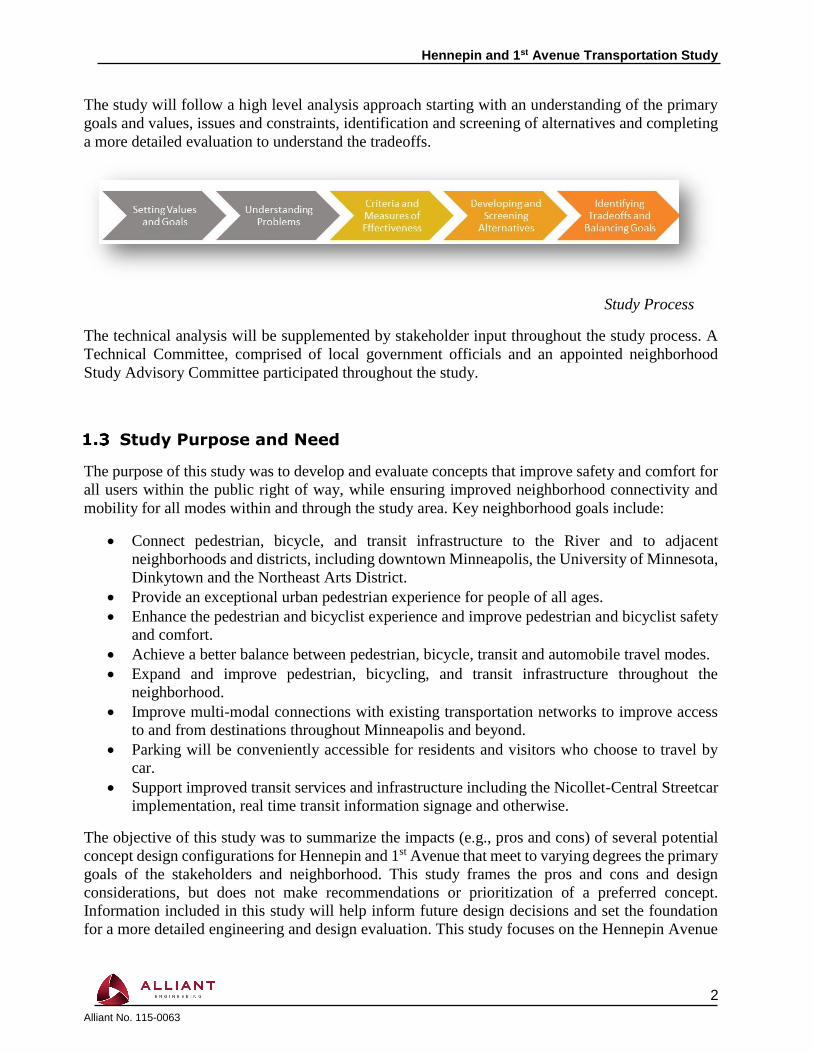
The study will follow a high level analysis approach starting with an understanding of the primary
goals and values, issues and constraints, identification and screening of alternatives and completing
a more detailed evaluation to understand the tradeoffs.
Study Process
The technical analysis will be supplemented by stakeholder input throughout the study process. A
Technical Committee, comprised of local government officials and an appointed neighborhood
Study Advisory Committee participated throughout the study.
Study Purpose and Need
The purpose of this study was to develop and evaluate concepts that improve safety and comfort for
all users within the public right of way, while ensuring improved neighborhood connectivity and
mobility for all modes within and through the study area. Key neighborhood goals include:
Connect pedestrian, bicycle, and transit infrastructure to the River and to adjacent
neighborhoods and districts, including downtown Minneapolis, the University of Minnesota,
Dinkytown and the Northeast Arts District.
Provide an exceptional urban pedestrian experience for people of all ages.
Enhance the pedestrian and bicyclist experience and improve pedestrian and bicyclist safety
and comfort.
Achieve a better balance between pedestrian, bicycle, transit and automobile travel modes.
Expand and improve pedestrian, bicycling, and transit infrastructure throughout the
neighborhood.
Improve multi-modal connections with existing transportation networks to improve access
to and from destinations throughout Minneapolis and beyond.
Parking will be conveniently accessible for residents and visitors who choose to travel by
car.
Support improved transit services and infrastructure including the Nicollet-Central Streetcar
implementation, real time transit information signage and otherwise.
The objective of this study was to summarize the impacts (e.g., pros and cons) of several potential
concept design configurations for Hennepin and 1st Avenue that meet to varying degrees the primary
goals of the stakeholders and neighborhood. This study frames the pros and cons and design
considerations, but does not make recommendations or prioritization of a preferred concept.
Information included in this study will help inform future design decisions and set the foundation
for a more detailed engineering and design evaluation. This study focuses on the Hennepin Avenue

Hennepin and 1st Avenue Transportation Study
3
Alliant No. 115-0063
and 1st Avenue segments. At the outset and through the study process, the Central Avenue/Hennepin
Avenue/5th Street intersection (Central/Hennepin Triangle) was identified as deficient for
pedestrians, motorists and bicycles. Improvements to this intersection are not identified in this study,
but upon determining the long-term operations of the Hennepin and 1st Avenue corridors a detailed
study of the Central/Hennepin/5th intersection will be required to identify and evaluate potential
intersection improvement solutions.
Figure 1. Study Area
Stakeholder and Public Involvement
A key part to the completion of the study is the stakeholder and public involvement process, which
included a Technical Advisory Committee (TAC) and an appointed neighborhood Study Advisory
Committee (SAC). Meetings were held between June 2015 and May 2016 as illustrated in the study
corridor project timeline.
Central/Hennepin Triangle
Key Intersection
Primary Study Corridor Limits
Mobility Analysis Study Area

Hennepin and 1st Avenue Transportation Study
4
Alliant No. 115-0063
Study Corridor Project Timeline
1.4.1 Technical Advisory Committee
The TAC consisted of members from the City of Minneapolis Traffic and Parking Services,
Transportation Planning and Programming, and Community Planning and Economic Development
divisions, Hennepin County Public Works, the Minnesota Department of Transportation (MnDOT),
and Metro Transit. The role of the TAC was to provide the study direction. They were given the
opportunity to provide feedback on technical analysis, make recommendations on the alternatives
analysis, and guide the development of the study design concepts.
The TAC met five times over the course of the study and was an integral part in developing the
alternatives and design concepts.
TAC Meeting 1 – discussed the project goals, the major issues of concern, challenges and
discuss the existing conditions inventory.
TAC Meeting 2 – discuss the cross-section alternatives development process and evaluation
metrics.
TAC Meeting 3 – held following the completion of the cross-section alternatives analysis
and focused on identifying the key concept alternatives for further evaluation.
TAC Meeting 4 – discussed the results of the traffic operations analysis and reviewed the
concept design alternatives.
TAC Meeting 5 – provided a final summary of the concept designs, project goals and
finalized the study report.
PLANNING
ENVIRONMENTAL
STUDY
TAC MEETINGS
2008 2009 APR 2015 JULY 2015 SEPT 2015JAN 2015 APR 2016 JULY 2016JAN 2016
Hennepin Ave/1st Avenue NE Transportation Study
SAC MEETINGS
B C
E
1 2 3 4
1 2 3
A
A
B
C
D
E
F
Access Minneapolis
Minneapolis Plan for Sustainable Growth
Hennepin Avenue Bicycle Plane
Nicollet Island - East Bank Neighborhood Small Area Plan
Nicollet - Central Modern Streetcar Environmental Assessment
Protected Bikeway Update to the Minneapolis Bicycle Master Plan
1
2
1
1
3
2
Technical Advisory Committee #1
Technical Advisory Committee #2
Study Advisory Committee #1
Streetcar Team Coordination
Technical Advisory Committee #3
Study Advisory Committee #2
4
3
5
Technical Advisory Committee #4
Study Advisory Committee #3
Technical Advisory Committee #5
4 Study Advisory Committee #4
2014
D F
1 5
4

Hennepin and 1st Avenue Transportation Study
5
Alliant No. 115-0063
1.4.2 Neighborhood Study Advisory Committee
The SAC consisted of a group of local stakeholders, business, and neighborhood representatives.
The role of SAC was to communicate information to and from the respective neighborhood and
business associations, actively provide input and guidance throughout the study, and to help the City
of Minneapolis collectively work towards achieving the neighborhood goals, city and regional goals,
while maintaining an efficient multimodal transportation system.
The SAC met four times of the course of the study. Each meeting was scheduled at key study
milestones to communicate information and to receive important input.
SAC Meeting 1 – communicated the study process, provided a review of the existing
conditions inventory, and heard important priorities and objectives of the neighborhood.
SAC Meeting 2 – discussed and received feedback on the preliminary cross-section
alternatives.
SAC Meeting 3 – discussed and received feedback on the concept designs.
SAC Meeting 4 – discussed and received feedback on the concept designs.
Meeting minutes collected at each of the SAC meetings are provided for reference in Appendix A.
1.4.3 Project Website
A website was established at the beginning of the project. The URL for the site is
http://www.minneapolismn.gov/cip/2016/WCMSP-174777. The purpose of the website is to
provide another way for the general public to be informed about the project status and to disseminate
information.

Hennepin and 1st Avenue Transportation Study
6
Alliant No. 115-0063
2.0 Existing and Future Conditions
An efficient transportation system is vital to the economic viability of the city, the region and the
state. Minneapolis must remain livable and walkable to maintain its regional and national
competitiveness. Transportation along Hennepin and 1st Avenue is multi-modal, comprised of
pedestrian, bicycle, transit and automobile. There are unique design challenges and often times
competing interests associated with each mode. The existing and future network conditions for the
Hennepin Avenue and 1st Avenue NE corridors are documented in the following sections. Key
elements include the corridor characteristics, pedestrian and bicycle network, parking, transit,
roadway safety, land use, and mobility.
Street Network
Hennepin Avenue and 1st Avenue serve an important role as a part of the regional transportation
system, which is supported by its functional classification as an A-Minor Augmenter Arterial. A-
Minor Augmenters supplement and provide connectivity to the principal arterial system and as
such they support access to major traffic generators, serve as primary transit corridors, carry higher
volumes of general traffic, and mobility for people walking or biking. The City of Minneapolis
defines these corridors as Activity Area Streets in Access Minneapolis, noting that these street
types are unique in that they have many different design characteristics and capacities due to their
location near Central Business District (CBD) and higher intensity land uses. It is understood that
Activity Area Streets have higher levels of pedestrian, bicycle, transit, and motor vehicle activity
due to adjoining land uses. This corridor is one of just a few streets (others include Central Avenue
and Plymouth Avenue) that have direct connectivity via major river crossings between Northeast
Minneapolis and the downtown CBD.
Hennepin and 1st Avenue are both one-way streets and generally consist of three travel lanes. On
street parking is provided along both sides of the streets on most blocks. The parking in many
locations is provided via a parking bay, which forms curb extensions (wider sidewalks) at the
intersections. Sidewalks within the study area vary greatly in width from one block to the next.
Street furniture, transit shelters and other obstacles are present in many locations resulting in
narrow pedestrian through space. Currently, there are no dedicated bicycle facilities along
Hennepin Avenue nor 1st Avenue. However, several on street bicycle facilities are provided within
the study area along 5th Street, University Avenue, and Central Avenue. Figure 2 illustrates the
existing roadway and corridor characteristics within the Hennepin and 1st Avenue study area and
Figure 3 documents the sidewalk conditions along with widths, obstruction locations and
furnishing zone components.
Roadway Safety
The number and locations of crashes in the study area were analyzed to help identify and address
safety problem areas. Crash data can be analyzed to identify problem locations or segments, crash
patterns, and probable causes. If root causes and locations can be identified, the means to reduce
the number and severity of crashes may be developed. A review of the corridor crash records was
conducted to evaluate the safety characteristics of the roadway. Historical crash data from the most
recent 5 years, 2010 to 2014, was obtained from the City of Minneapolis.

AREA = 15 SQ'
REM = 48 SQ '
PERIMETER = 30 '
AREA = 15 S
Q'
REM = 48 S
Q '
PERIMETER
= 30 '
AREA = 15 S
Q'
REM = 48 S
Q '
PERIMETER
= 30 '
AREA = 15 S
Q'
REM = 48 S
Q '
PERIMETER
= 30 '
AREA = 15 SQ'
REM = 48 SQ '
PERIMETER = 30 '
AREA = 15 SQ'REM = 48 SQ 'PERIMETER = 30 '
TW
O-W
AY
ONE-WAY
ONE-W
AY
AREA = 15 S
Q'
REM = 48 S
Q '
PERIMETER
= 30 '
AREA = 15 S
Q'
REM = 48 S
Q '
PERIMETER
= 30 '
AREA = 15 SQ'REM = 48 SQ 'PERIMETER = 30 '
AREA = 15 SQ'REM = 48 SQ 'PERIMETER = 30 '
AREA = 15 SQ'REM = 48 SQ 'PERIMETER = 30 '
AREA = 15 SQ'REM = 48 SQ 'PERIMETER = 30 '
AREA = 15 S
Q'
REM = 48 S
Q '
PERIMETER
= 30 '
ON
E-W
AY
ON
E-W
AY
56'
50.0'40.0'
56.0'
51.5'56.0'
48.0'
40.0'
56.0' 56.0'40.0'
48.0'
36.0'
36.0'26.0'
69.0'36.0'
56.0'60.0'
51.5'60.0'
58.0'
56.0'
56.0'
56.5' 56.5'48.5'48.5' 48.5' 56.5' 56.5'56.5'
56.5'56.5' 56.5'
40.0'40.0'
48.0'
48.0'48.0'40.0'
40.0'
49.5'
56.0'
54.0'
40.0'
40.0'
Cental Ave SE
E Hennepin Ave
1st A
ve N
E
Main St N
E
2nd St N
E
5th St S
E
5th St N
E
University A
ve N
E
Bank St SE
4th St N
E
7th St N
E
6th St N
E
E Hennepin Ave
1st Ave NE
Lourd
es Pl
40.0'
XX.X'
E N G I N E E R I N G
ALLIANT
5pm-2am
*Valet parking
7am-9am
*No parking
6am-6pm
*No parking
Parking
*Handicap
Parking
*Handicap
1 2 3
1 123
4 5 5 6
No Parking
On Street Parking
Restricted Parking (See Notes for specific details)
Bus Stop
(Face of Curb to Face of Curb)
Street Width
Shared Bike Lane Facility
Existing Bike Lane
3
4 5 6
1
6
Existing Street Network Characteristics
Figure 2Hennepin and 1st Avenue Transportation Study
University Ave NE and 2nd St NE
1st Ave NE between
Central Ave SE and 4th St NE
1st Ave NE between
4th St NE and University Ave NE
1st Ave NE between
Lourdes Pl and 2nd St SE
Hennepin Ave E between
2nd St SE and 4th St NE
Hennepin Ave E between
4th St NE and Central Ave SE
Hennepin Ave E between

Cental Ave SE
E Hennepin Ave
1st A
ve N
E
Main St N
E
2nd St N
E
University
Ave S
E
6th St S
E
5th St S
E
4th St S
E
5th St N
E
University A
ve N
E
Bank St SE
4th St N
E
7th St N
E
6th St N
E
SE 7th St
E Hennepin Ave
1st Ave NE
Lourd
es Pl
8.0'12.5'12.5'
11.5'
6.75'
11.5'
11.0'8.0'
7.67'8.0'10.0'10.0' 11.5'
8.5'
8.5'8.5'
13.5' 13.0'13.5'
10.5'
8.0'
8.0'
8.0'
8.0'
9.0'
9.0'
6.5'
12.5'10.5'
14.0'18.0' 15.0'7.75'8.0' 8.0' 11.75'
15.5'
11.0'
8.0'
12.0'11.5' *7.67'
9.0'9.0'
8.5' 8.5'
22.0'
22.0'
14.0' 12.5' 11.5' 11.5' 19.5' 12.0'13.75' *9.75' 19.5'
20.5'18.0'
18.0' 12.0' *16.0'
12.0'
*14.5'20.0'
12.0' 12.0'
*10.5'11.5' 12.0'
19.75'
8.5'
8.5'
12.25'
11.75'10.0'
11.0'
10.75'
10.0'
12.5'
12.25'
12.0'
10.0'
9.0'
14.25'
14.5'
14.5'
14.5'
*10.0' 11.75'
11.5'
11.5'
12.0'
12.5'
20.5'
20.5'
8.5'
8.5'
11.5'
12.5'
11.5'
9.5'
8.5'
6.0'
17.0'
12.0'
7.5'
*7.5'
*8.0'
*8.0' 19.75'
11.75'11.75'
3.67'
6.0'
6.0'
6.0'
6.0'
XX.X'
Power Poles, Lighting Poles and Signal Poles
Sidewalk Width (* Denotes width to obstruction)
E N G I N E E R I N G
ALLIANT
Existing Sidewalk Conditions
Figure 3
Sidewalk Obstruction
TreeHennepin and 1st Avenue Transportation Study
*7.5'
*7.0'

Hennepin and 1st Avenue Transportation Study
9
Alliant No. 115-0063
Crash Rate
Crashes are a function of exposure. Roadways with higher traffic volumes experience more
crashes than similar roadways with lower volumes. Rather than documenting the number of
crashes that occur in a particular segment or at a particular intersection, the crash rate must be
considered. Crash rates normalize different locations with varying traffic volumes, providing a
useful tool in comparing the locations with respect to safety.
Critical Crash Rate
Crash occurrence is somewhat random by nature. Identifying every intersection with a crash rate
above the average value in an analysis would produce a large amount of data that may not be
statistically relevant with respect to safety deficiencies. The critical crash rate, the second key
factor in safety analysis, identifies those locations that have a crash rate higher than similar
facilities by a statistically significant amount. The critical crash rate is calculated by adjusting the
system wide average based on the amount of exposure and a statistical constant indicating level of
confidence. Although varying confidence levels are typically utilized, the 99.5 percentile
confidence interval was selected for all safety calculations for this study. At locations where the
actual crash rate exceeds the critical crash rate, it is 99.5 percent certain that the crashes are a result
of deficiencies in the segment or intersection design.
The intersection crash characteristics, including crash rate, critical crash rate and distribution of
crash types are illustrated on Figure 4. In general, most intersections are experiencing a crash rate,
less than the critical crash rate. This is an indication that the number of crashes observed is
somewhat expected and a specific safety issue is not present. However, The Hennepin/Central
Triangle intersection is experiencing a very high crash rate, which may warrant further
investigation. Overall, 178 crashes were reported during the 5 year study period. Eleven of these
(approximately 6%) were bicycle and pedestrian related.
Transit
Hennepin Avenue and 1st Avenue serve as a vital link in facilitating bus service and route
circulation for Metro Transit (revenue and non-revenue service). Buses operate in mixed traffic
lanes. Buses stopping to pick up or drop off passengers block the right most moving traffic lane
on most blocks. On a few blocks, the bus stops are located within the on street parking zone, and
a dwelling bus is able to move out of the moving traffic lane.
In October 2013, the City of Minneapolis selected a locally preferred alternative as a result of the
Nicollet-Central Modern Streetcar Transit Alternatives Analysis and has since started work to
complete an Environmental Assessment of the line. The current streetcar alignment identifies left-
side operations across the Hennepin Avenue Bridge. This alignment is conducive to a left side
operation within the Hennepin and 1st Avenue NE study area and extending further north on
Central Avenue, but does not preclude the possibility of a right side streetcar alignment. The
operations and maintenance facility site has not yet been determined, which will have to be taken
into consideration when determining the streetcar alignment.
Figure 5 illustrates the Metro Transit bus service routes and trips traveling within and through the
study area.

Cental Ave SE
1st A
ve N
E
Main St N
E
2nd St N
E
University
Ave S
E
8th St S
E
6th St S
E
5th St S
E
4th St S
E5th St N
E
University A
ve N
E
Bank St SE
4th St N
E
7th St N
E
SE 7th St
Hennepin Ave & MainSt Hennepin Ave & 2nd St Hennepin Ave & University Ave Hennepin Ave & 4th St
1st Ave & Main St 1st Ave & University Ave 1st Ave & 4th St
Hennepin Ave & 5th St
Hennepin Ave & Central Ave
Traffic Signal
Lourd
es Pl
1st Ave & 5th St 1st Ave & Central Ave
CRASH TYPE CRASH TYPE CRASH TYPE CRASH TYPE CRASH TYPE
CRASH TYPE CRASH TYPE CRASH TYPE CRASH TYPE CRASH TYPE
CRASH TYPE
◕13 Crashes(2010-
Hennepin Ave
E N G I N E E R I N G
ALLIANT
UNAVAILABLEDATA
◕15 Cr ◕21 Cr ◕4 Cr ◕2 Cr ◕15 Cr
◕22 Cr ◕20 Cr ◕23 Cr ◕17 Cr ◕26 Cr
Intersection
Sidestreet Stop Controlled
6th St N
E
(2010 - 2014)
Crash History
Figure 4Hennepin and 1st Avenue Transportation Study
U
U U
UU

Cental Ave SE
E Hennepin Ave
1st A
ve N
E
Main St N
E
2nd St N
E
University
Ave S
E
8th St S
E
6th St S
E
5th St S
E
4th St S
E
5th St N
E
University A
ve N
E
Bank St SE
4th St N
E
7th St N
E
6th St N
E
SE 7th St
E Hennepin Ave
1st Ave NE
Lourd
es PlHennepin Ave E & Wilder St
Busses Per Hour
(11:00AM - 1:00PM)
Mid Peak
(7:00AM - 9:00AM)
AM Peak
(4:00PM - 6:00PM)
PM Peak
13 9 18
Bus Routes Served
4, 6, 11, 61, 141, 824
Hennepin Ave E & 2nd/Ortman St
Busses Per Hour
(11:00AM - 1:00PM)
Mid Peak
(7:00AM - 9:00AM)
AM Peak
(4:00PM - 6:00PM)
PM Peak
11 7 14
Bus Routes Served
4, 6, 61, 141, 824
Hennepin Ave E & 5th St
Busses Per Hour
(11:00AM - 1:00PM)
Mid Peak
(7:00AM - 9:00AM)
AM Peak
(4:00PM - 6:00PM)
PM Peak
7 4 7
Bus Routes Served
4, 61
4
4
1
2
Proposed Streetcar Alignment (Right Side)
Proposed Streetcar Alignment (Left Side)
Bus Routes
Streetcar Stop
Bus Stop Obstructs Driving Lane
Bus Stop Out of Driving LaneTransit Network
Figure 5Hennepin and 1st Avenue Transportation Study
E N G I N E E R I N G
ALLIANT
1st Ave E & De LaSalle Dr
Busses Per Hour
(11:00AM - 1:00PM)
Mid Peak
(7:00AM - 9:00AM)
AM Peak
(4:00PM - 6:00PM)
PM Peak
18 9 14
Bus Routes Served
4, 6, 11, 61, 141, 552, 554, 824
4th St SE & Hennepin Ave E
Busses Per Hour
(11:00AM - 1:00PM)
Mid Peak
(7:00AM - 9:00AM)
AM Peak
(4:00PM - 6:00PM)
PM Peak
4 3 4
Bus Routes Served
6
2nd St NE & 1st Ave NE
Busses Per Hour
(11:00AM - 1:00PM)
Mid Peak
(7:00AM - 9:00AM)
AM Peak
(4:00PM - 6:00PM)
PM Peak
4 2 3
Bus Routes Served
11
1st Ave E & 2nd St
Busses Per Hour
(11:00AM - 1:00PM)
Mid Peak
(7:00AM - 9:00AM)
AM Peak
(4:00PM - 6:00PM)
PM Peak
14 7 9
Bus Routes Served
4, 6, 61, 141, 824
University Ave NE & 1st Ave NE
Busses Per Hour
(11:00AM - 1:00PM)
Mid Peak
(7:00AM - 9:00AM)
AM Peak
(4:00PM - 6:00PM)
PM Peak
1 0 2
Bus Routes Served
824
1st Ave E & 5th St
Busses Per Hour
(11:00AM - 1:00PM)
Mid Peak
(7:00AM - 9:00AM)
AM Peak
(4:00PM - 6:00PM)
PM Peak
7 4 5
Bus Routes Served
4, 61
1st Ave E & 4th St
Busses Per Hour
(11:00AM - 1:00PM)
Mid Peak
(7:00AM - 9:00AM)
AM Peak
(4:00PM - 6:00PM)
PM Peak
7 4 5
Bus Routes Served
4, 61
1st Ave E & 6th St
Busses Per Hour
(11:00AM - 1:00PM)
Mid Peak
(7:00AM - 9:00AM)
AM Peak
(4:00PM - 6:00PM)
PM Peak
7 4 5
Bus Routes Served
4, 61
21
3
23
1
3
4
3
2
1
6
4, 61, 141
552
11, 824
Bus RoutesNo.
Bus Group
#

Hennepin and 1st Avenue Transportation Study
12
Alliant No. 115-0063
Land Use
The existing land use, illustrated in Figure 6, shows a wide variety of uses in the neighborhood,
including commercial, industrial, parks/open space, cultural/entertainment, public/institutional,
mixed use, and several types of residential uses of varying densities. Commercial is the most
dominant land use category in the neighborhood. These commercial uses include shops,
restaurants, bars, banks, and offices among others. Despite the industrial roots of the area, a limited
number of industrial properties remain in the neighborhood; these remaining properties are located
between 1st Avenue Northeast and the railroad tracks, east of University Avenue. The
neighborhood is unique in the wide variety of housing types it offers. The only single family homes
in the neighborhood are found on Nicollet Island. On the East Bank, residential properties include
low, medium, high, and very high densities and encompass townhomes, apartments and
condominiums.
Source: NIEB Small Area Plan
Figure 6. Existing Land Use

Hennepin and 1st Avenue Transportation Study
13
Alliant No. 115-0063
A key vision of the Nicollet Island-East Bank neighborhood is to be a vibrant pedestrian, bicycle
and transit oriented neighborhood with a variety of land uses that draw people to the area at all
times of the day. The addition of several new, high-density residential developments with ground
floor commercial uses will substantially increase the population while enhancing the area as a
thriving commercial district. Redevelopment within the study area is currently happening, with
many additional properties anticipated to develop into the coming years helping to fulfill this
vision. Figure 7 illustrates the location and type of know redevelopment parcels or projects
currently under review or construction.
Source: City of Minneapolis Community, Planning and Economic Development
Figure 7. Potential Redevelopment Parcels

Hennepin and 1st Avenue Transportation Study
14
Alliant No. 115-0063
Parking
The availability of convenient on-street and off-street parking within the study area remains an
important priority for residents and businesses. Commercial properties dominate much of the main
thoroughfares including Hennepin Avenue, 1st Avenue, Central Avenue and University Avenue.
Local businesses rely on, on and off street, public parking for their patrons. An understanding of
the current parking supply (both on street and off street) and the existing utilization is an important
consideration. A comprehensive on-street parking study was completed in June 2015 to collect
this information during key time periods throughout the day on both weekdays and weekends.
Figure 8 illustrates the parking supply and parking utilization data. As shown, the 2nd Street to
University Avenue block is most heavily utilized. In general though, a substantial amount of
available on-street parking spaces were found in the study area during most time periods evaluated.
Mobility
Motor vehicle mobility along Hennepin Avenue and 1st Avenue is also an important priority to
stakeholders, while at the same time understanding their specific concerns related to vehicle travel
speeds and circulation issues. Maintaining mobility will continue to serve the regional connection
to the Downtown CBD, is important to the viability of the businesses through provision of
reasonable access and circulation, and important to neighborhood for emergency access and
commerce. Improving mobility of the non-motorized users is equally important and is a priority
goal of this study. The roadway motor vehicle, bicycle and pedestrian volumes are an important
consideration in determining the appropriate design, lane configuration alternatives and facility
improvements.
2.6.1 Bicycle and Pedestrians
Existing pedestrian and bicycle volumes were field collected during the summer of 2013
(pedestrians) and the summer of 2015 (bicycles) and are illustrated in Figure 9. Most intersections
within the core of the study area (2nd Street to 4th Street) experience more than 100 pedestrians an
hour. Pedestrian activity is noticeably greater along Hennepin Avenue; however, it is expect this
will change as redevelopment infills along 1st Avenue. Bicycle volumes along corridors show less
than 50 per hour. The estimated daily number bicycles along Hennepin Avenue and 1st Avenue are
370 and 250, respectively. These bicycle volumes are occurring despite the fact there is not a
dedicated bicycle facility. Bicyclists are traveling within mixed traffic, and it is expected that
bicyclist volumes will increase with provision of a dedicated facility and the build-out of other
facilities planned on intersecting streets.

1 2 3 4
67891011
12
13Ce
ntal Ave SE
E Hennepin Ave
1st A
ve N
E
Main St N
E
2nd St N
E
8th St S
E
5th St S
E
University A
ve N
E
Bank St SE
4th St N
E
7th St N
E
6th St N
E
SE 7th St
E Hennepin Ave
1st Ave NE
Lourd
es Pl
141517
18
47
013
21
20
16
6 83
%
11
%19
%23
%0
% 2%
3%
0%
72
%84
%45
%
83
%49
% 29
%
55
%
44
%72
% 43
%
40
%0
%32
%
97
%0
%92
%93
%83
%89
%83
%
616 2
0
13
21
047
40
%23
%11
%44
%28
%0
% 6% 87
%44
%74
%79
%63
%0
%40
%
64
% 48
%41
%81
%31
%0
%26
%
87
%91
%65
% 85
%77
%0
%37
%
6
16
13
10
0%
41
%
3%
20
%
86
%
70
%
47
%
77
%
14
%
70
%
59
%
82
%
72
%
86
%
98
%
100
%
16
13
10
6
31
%
23
%
5%
0% 8
%
94
%
78
%
40
%
37
%
67
%
58
%
3%
84
%
93
%
71
%
80
%
12
15
15
4
22
0
61
%
12
%0
%
0%
0%
16
%
0%
37
%71
%
72
%
23
%
50
%
60
%
31
% 32
%
0%3%
0%
96
%
68
%
0%
95
%
97
%
80
%
12
15
4
22
15
0
13
%
16
%7
%
0% 5
%
0%
72
%
81
%
0%
23
%
83
%
48
%
64
%
77
%36
%
13
%
0%7
%
70
%
59
% 73
%
80
%
0%
59
%
E N G I N E E R I N G
ALLIANT
Public Parking Utilization
Figure 8Hennepin and 1st Avenue Transportation Study
16Ramp
Parking
Public
Additonal Off-Street Parking
Public Parking Ramp*
263 Parking Stalls 413 Parking Stalls
Surface Lots**
** - Counts collected in 2013
* - Counts collected in July 2015
Notes:

Cental Ave SE
E Hennepin Ave
1st A
ve N
E
Main St N
E
2nd St N
E
University
Ave S
E
8th St S
E
6th St S
E
5th St S
E
4th St S
E5th St N
E
University A
ve N
E
Bank St SE
7th St N
E
6th St N
E
SE 7th St
Traffic Signal
Lourd
es Pl
18/23/48
5/10/22
18/77/4216/46/25
13/49/51
35/76/32
7/112/34
8/87/31
11/54/45
4/42/25
2/74/41
6/42/14
19/23/
29
13/9/18
2/12/13
32/28/14
38/22/38
11/21/45
2/17/23
8/18/19
12/11/17
8/18/16
4/14/13
18/6/11
2/20/11
34/20/25Bike Volume
8/13/34Bike Volume
5/5/9
1/4/12
7/31/5
35/149/75
11/7/5
4/1/2
1/1/0
10/8/9
1/6/5
2/20/1
20/14/25
0/1/1
2/7/1
5
0/14/8
1/2/6
0/5/54/9/7
0/7/6
1/6/1
3/3/2
3/6/10
1/8/3
Hennepin Ave & MainSt Hennepin Ave & 2nd St Hennepin Ave & University Ave Hennepin Ave & 4th St Cental Ave & 5th St Central Ave & 7th St
1st Ave & Main St 1st Ave & 2nd St 1st Ave & University Ave 1st Ave & 4th St Hennepin Ave & 5th St Hennepin Ave & Central Ave
Main St
1St Av
e
2nd St
1st Ave
University A
ve
1st Ave 1st Ave Hennepin Ave
4th St
5th St
1/4/0Ce
ntral A
ve
Hennepin Ave
Hennepin Ave Hennepin Ave Hennepin Ave Hennepin Ave
Main St
2nd St
University A
ve
4th St 1st Ave
7th St
Central A
ve
Central A
ve
5th St
E N G I N E E R I N G
ALLIANT
Bicycle counts collected in June 2015
Pedestrian counts taken in Spring 2013
Note:
Controlled Intersection
Sidestreet Stop
- AM Peak Hour Volume/Off Peak Hour Volume/PM Peak Hour Volume
XX/XX/XX Pedestrian
- AM Peak Hour Volume/Off Peak Hour Volume/PM Peak Hour Volume
XX/XX/XX Bike
Existing Pedestrian and Bicycle Volumes
Figure 9Hennepin and 1st Avenue Transportation Study
U
U U
UU

Hennepin and 1st Avenue Transportation Study
17
Alliant No. 115-0063
2.6.2 Motor Vehicles
Existing motor vehicle traffic volumes were collected in the spring/summer of 2013 as part of
Minneapolis’ North/Northeast Traffic Signal Improvement project. The a.m., off (lunch hour) and
p.m. peak hour traffic volumes are shown in Figure 10. The peak hour volumes are necessary to
evaluate intersection capacity needs and/or assessment of impacts associated with any alternative
lane configurations or street operation.
Traffic volumes within the study area are expected to change as redevelopment occurs. A trip
generation assessment of the known development parcels (see Figure 7) was completed. Assuming
a 50% non-motorized user trip reduction, an anticipated 8% increase in traffic volumes is expected
with the redevelopment or addition of new properties in the study area. This equates to an
approximate 0.4% per year growth rate when normalizing over a 20 year period. Minneapolis
typically uses a 0.5% per year growth rate to account for redevelopment, traffic circulation changes
and regional demand. Considering both Hennepin and 1st Avenue also serve a regional traffic
function, the 0.5% growth rate (10% increase) is appropriate. Forecast year 2035 traffic volumes
were obtained by increasing the existing traffic volumes by 10%. The existing and forecast year
2035 average daily traffic (ADT) volumes are shown for reference in Table 1.
Table 1. Existing and Forecast 2035 Motor Vehicle ADT
Count Location ExistingForecast 2035
(One Way)
Hennepin Avenue (Main Street to Lourdes Pl) 15,300 16,900
Hennepin Avenue (4th Street to 5th Street) 8,700 9,600
Hennepin Avenue (7th Street to 8th Street) 13,900 15,400
1st Avenue (5th Street to 4th Street) 10,300 11,400
1st Avenue (University Avenue to 2nd Street) 8,800 9,700
Central Avenue (4th Street to 5th Street) 14,600 16,100
2nd Street (Hennepin to 1st Avenue) 3,900 4,300
University Avenue (Hennepin to 1st Avenue) 11,700 12,900
4th Street (Central to Hennepin) 12,600 13,900
4th Street (Hennepin to 1st Avenue) 9,300 10,300
5th Street (Hennepin Avenue to 1st Avenue) 2,400 2,700
Source: Minneapolis Traffic Count Management System

Cental Ave SE
E Hennepin Ave
1st A
ve N
E
Main St N
E
2nd St N
E
University
Ave S
E
8th St S
E
6th St S
E
5th St S
E
4th St S
E5th St N
E
University A
ve N
E
Bank St SE
4th St N
E
7th St N
E
6th St N
E
SE 7th St
617/535/1148 704/539/1167 443/376/806
280/170/317
100/117/269
825/424/429
513/449/871
477/464/876
240/36
1/78
9
703/32
1/38
8
528/451/912
186/2295/621
116/192/258
423/301/703
723/330/401
504/2
22/7
10
287/64
1/86
5
384/18
9/19
4
587/27
3/31
6
116/118/336
805/315/367
488/509/942
902/435/819
Hennepin Ave & MainSt Hennepin Ave & 2nd St Hennepin Ave & University Ave Hennepin Ave & 4th St
1st Ave & Main St 1st Ave & 2nd St 1st Ave & University Ave 1st Ave & 4th St
Cental Ave & 5th St
Hennepin Ave & 5th St Hennepin Ave & Central Ave
Central Ave & 7th St
Traffic Signal
Existing ADT
148/51/112
102/47/64
36/46/160
62/49/111
113/59/67
51/51/140
39/90/141
7/37/35
56/91/135
83/74/
246
217/65/139
226/54/61
70/67/231
119/60/77
46/44/110
47/52/116
94/190/158
113/200/433
111/28/53
20/9/12
1/1
2/1
4
8/10/17
8/17/17
64/77/204
4/12/11
140/6
9/9
6
62/21/57
40/28/44
48/61/66
42/45/86
59/30/51
10/36/31
74/81/96
11/45/66
33/33/
371240/5
48/112
6
28/28/40
42/60/56
1249/589/1267
26/22/73
61/22/32
1183/554/1269
23/89/74
1/2/0
0/0/0
4/2/5
33/1
8/3
8
52/8
4/3
8
5/3/5
6/9/3
1
2/0/1
13/42/48
59/51/39
11/36/51
30/53/42
11/22/32
0/0/0
2/0/0
15/26/14
6/1
8/2
2
Lourd
es Pl
XX/XX/XX AM Peak Hour Volume/Off Peak Hour Volume/PM Peak Hour Volume
E N G I N E E R I N G
ALLIANT Controlled Intersection
Sidestreet Stop 2013
Existing Motor Vehicle Traffic Volumes
Figure 10Hennepin and 1st Avenue Transportation Study
U
U U
UU
XXX

Hennepin and 1st Avenue Transportation Study
19
Alliant No. 115-0063
2.6.3 Regional Traffic Demand
Another important consideration is to understand how much of the motor vehicle traffic volumes
are traveling within or through the study area. To quantify the amount of regional traffic (motorist
traveling through) versus destination traffic (motorists traveling to or from the study area) an
origin-destination study was completed. The study used video recording to track motorists entering
and exiting the study area, and the license plates recorded were then matched. As part of the license
plate match, a time lag was assessed. Motorists that appeared at both the entering and exiting
locations within a short period (few minutes) were considered through traffic. If a long time
duration was observed these are considered destination trips. In many cases motorists were
observed at only the enter and the exit points only, which are also considered destination trips.
Figure 11 illustrates the results of the origin-destination study. As shown, approximately 60-65%
of the motorists are traveling through the study area along the major arterials (Hennepin Avenue,
1st Avenue and University Avenue) during the a.m. peak period. During the p.m. peak period the
through volume is slightly less, at approximately 50-55%. Approximately 2 to 12% of all the
motorists recorded could be specifically traced to destinations within the study area.
2.6.4 Two-way Street Network
The neighborhood has expressed desire to consider the restoration of Hennepin and 1st Avenue to
two-way street operation. This study will consider this alternative as it relates to other objectives;
however, key elements such as the limits of the two-way street network and the anticipated change
in motor vehicle traffic volumes need to be understood. A high level assessment considering
existing and future constraints (e.g., roadway width, pedestrian realm and the Central/Hennepin
Triangle complexity) was completed to determine the feasible limits of a two-way street network
along Hennepin Avenue and 1st Avenue NE. Based on this assessment, it was concluded that for a
variety of reasons, one-way street operation should be maintained along both corridors south of
Main Street, and on Hennepin Avenue between 5th Street and 7th Street.
Table 2 illustrates the potential two-way street network and summarizes the pros and cons of the
rationale for not extending Hennepin Avenue as a two-way beyond 5th Street.
Based on the potential two-way street network configuration, the motor vehicle traffic volumes
were developed. As shown previously, there is a high volume of through motorists. This indicates
that if two-way operation were to be realized, it is expected that the northbound volumes on
Hennepin and the southbound volumes on 1st Avenue will be considerably higher than the opposite
direction, as there is limited advantage for through motorists to change streets. The opposite
direction does provide destination traffic circulation advantage and would be expected to attract
motor vehicle volume. Figure 12 illustrates the estimated existing condition two-way traffic peak
hour motor vehicle volumes. Similar to the one-way scenario, the forecast 2035 traffic volumes
are obtained by applying a 0.5% per year growth rate (10% increase).

Hennepin and 1st Avenue Transportation Study
20
Alliant No. 115-0063
Table 2. Two-way Street Network Limits
Rationale for Maintaining Hennepin Avenue One-Way (5th Street SE to 7th Street SE)
Potential Two-way Street Segment
Existing Street Configuration
• Promotes non-motorized safety along and across streets• Narrows street crossing distances for pedestrians and bicycles at the Central
Triangle• Improves safety and multimodal operations• Reduces intersection footprint to provide more room for non-motorized modes
of travel• Supports corridor trip purposes and achieves better balance amongst travel
modes• Discourages regional traffic on southbound Hennepin• Reduces conflicting motorized movements at Hennepin/Central intersection• Increases transit reliability along Hennepin and Central• Potential for additional green space (Major Strategic Goal – NIEBNA SAP)• Expansion of space for pedestrian and bicycle infrastructure (Major Strategic
Goal – NIEBNA SAP)• Supports improved transit services (Top Priority – NIEBNA SAP)
PROS
• Establishes short one-way segment that may create confusion• Does not align with neighborhood expectations (Vision and Strategic Action –
NIEBNA)• May increase circuity for access to Henn/Central/7th triangle (May be
addressed during review of proposed development)
CONS

300
SCALE IN FEET
E N G I N E E R I N G
ALLIANT
Cental Ave SE
1st A
ve N
E
Main St N
E
2nd St N
E
University
Ave S
E
8th St S
E
6th St S
E
5th St S
E
4th St S
E5th St N
E
University A
ve N
E
4th St N
E
7th St N
E
6th St N
E
SE 7th St
E Hennepin Ave
1st Ave NE
XX% / XX% / XX% AM Peak Hour / Off Peak Hour / PM Peak Hour Destination Percentages Origin-Destination Traffic Patterns
Figure 11Hennepin and 1st Avenue Transportation Study
Project Destination
ROUTE AM MID PM
1st Ave NE
Thru 604 101 534
Southbound
University
Ave
28 14 27
Northbound
Univesity
Ave
40 24 87
Destination
Stop/Thru 49 31 133
Other Route
or
Destination
Stop
348 293 370
1st Ave NE
57% / 22% / 46%
39% / 37% / 43%
2% / 8% / 7%
3% / 5% / 7%
20% / 14% / 7%
36% / 36% / 38%
ROUTE AM MID PM
Hennepin
Ave
Thru
378 322 606
Southbound
University
Ave
211 123 111
Northbound
Univesity
Ave
28 43 78
Destination
Stop/Thru 24 71 105
Other Route
or
Destination
Stop
414 334 679
Hennepin Ave
3% / 3% / 2%
4% / 5% / 8%5% / 7% / 12%
33% / 63% / 32%

Cental Ave SE
E Hennepin Ave
1st A
ve N
E
Main St N
E
2nd St N
E
University
Ave S
E
8th St S
E
6th St S
E
5th St S
E
4th St S
E5th St N
E
University A
ve N
E
Bank St SE
4th St N
E
7th St N
E
6th St N
E
SE 7th St
Hennepin Ave & MainSt Hennepin Ave & 2nd St Hennepin Ave & University Ave Hennepin Ave & 4th St
1st Ave & Main St 1st Ave & 2nd St 1st Ave & University Ave 1st Ave & 4th St
Cental Ave & 5th St
Hennepin Ave & 5th St Hennepin Ave & Central Ave
Central Ave & 7th St
Traffic Signal
Existing ADT
106/47/79
7/29/24
165/42/100
226/54/61
104/34/49
20/9/16
2/1
2/1
4
8/10/17
8/17/17
4/12/11
140/6
9/9
6
62/21/57
34/25/40
43/35/37
31/44/80
54/25/40
10/26/29
36/44/45
13/40/60
23/25/
25
43/42/71
35/43/47
21/17/63
61/22/32
1/2/0
31/1
6/3
8
46/8
4/3
4
13/2/10
51/49/35
11/11/41
30/53/42
16/27/32
15/26/14
6/1
8/2
2
Lourd
es Pl
XX/XX/XX AM Peak Hour Volume/Off Peak Hour Volume/PM Peak Hour Volume
E N G I N E E R I N G
ALLIANT Controlled Intersection
Sidestreet Stop
42/25/55
52/27/34 1
7/36/28
42/44/93
10/5/20
81/41/63
99/30/49
37/40/41
5/13/10
37/82/51
7/21/40
33/18/10
66/50/48 107/103/99
12/22/30
30/2
7/3
189/8
6/8
9
17/25/15
7/42/48
11/20/15
18/27/25
50/55/76
13/36/25
36/85/90
6/15/20
13/32/18
23/25/23
8/10/12
92/40/62
96/27/69
19/25/30
10/15/13
3/6/6
1224/5
42/108
077/
71/229
75/79/230
1221/572/1209
8/22/7
39/56/121
88/149/398
94/170/133
0/0/0
1/0/0
0/0/0
780/279/330
1141/519/1219
134/143/360
435/431/872
888/407/878
54/133/173
1/0/0
393/274/664
186/295/621
64/77/204
739/358/431
435/365/789
0/1/0
370/16
1/16
4
603/30
0/34
6
504/2
22/7
10
225/40
2/78
0
5/3/5
4/2/5
703/32
5/40
3
240/36
1/78
9
6/9/3
1
0/3/5
18/19/20
53/77/85
8/5/4
46/71/105
434/410/837
430/358/767
90/98/255
242/151/305
400/320/758
13/4/3
858/419/425
0/0/0
45/46/123
626/495/1087
69/51/115
72/70/211
581/512/1098
2013
Existing Two-way Street Network Motor Vehicle Volumes
Figure 12Hennepin Ave and 1st Avenue Transportation Study
U
U U
UU
XXX

Hennepin and 1st Avenue Transportation Study
23
Alliant No. 115-0063
Issues and Constraints
The review of the existing and future transportation system characteristics found a number of areas
or issues that illustrate the purpose and need and/or require consideration during the alternatives
analysis. Figure 13 illustrates the key issues and constraints. A few considerations include:
Narrow pedestrian realm with numerous obstructions and locations with inconsistent
pedestrian through space.
High motor through vehicle demands during the peak periods.
A deficient and very complex intersection at the Central/Hennepin Triangle
Planned streetcar operations and alignment transition if operating on the left side or right
side through the study area.
Planned bicycle connections.

with neighborhood petition
One way street installed
- Evenings highest demand
utilization
- High on-street parking connection
Important bicycle
crossing
Difficult pedestrian
causes lane shifts
Travel lane imbalance-
design
- complicates bike lane facility
- Narrow street cross-section
when lane widths or direction changes
joints require consideration
Concrete roadway facility panel
parking utilization
- High on-street
Cental Ave SE
E Hennepin Ave
1st A
ve N
E
Main St N
E
2nd St N
E
University
Ave S
E
8th St S
E
6th St S
E
5th St S
E
5th St N
E
University A
ve N
E
Bank St SE
4th St N
E
7th St N
E
6th St N
E
SE 7th St
E Hennepin Ave
1st Ave NE
Lourd
es Pl
Bridge Deck
bike facility design
Lanes as they complicate
SB to WB Right Turn
- Evaluate need for Dual
- High Volume Route
movement
- high speed right turn
- Pedestrian unfriendly
considered
issue if right side operation is
-Streetcar alignment transition
- High crash rate
- Source point of existing congestion
- Operates at capacity
unfriendly intersection
- Complicated and pedestrian
Issues and Constraints
Figure 13
E N G I N E E R I N G
ALLIANT
6 feet
Sidewalk area less than
Minneapolis Park Land
Pedestrians crossing between residential area and Lunds Cafe patio restricting walkable path
Cafe patio restricting walkable path
intersection
Congestion caused by complicatedIntersection
E Hennepin Ave/SE Central Ave at 5th St SE
to less than 6 feet
Trees restricting walkable pathrestricting walkable path
Power Pole and Signal Cabinet
Intersection
- Complex
Pedestrian ramp
Potentially ADA compliant
Pedestrian ramp
Non-compliant ADA
cooperative agreement project.
2016-2018 as part of a Minneapolis and MnDOT
APS systems are programmed for construction in
Traffic signal rebuild, ADA pedestrian ramps and
alignment is considered
evaluation if right side
Streetcar alignment transition
1st Avenue
traffic demand on
High peak period through
Hennepin Ave
traffic demand on
High peak period through
Hennepin and 1st Avenue Transportation Study

Hennepin and 1st Avenue Transportation Study
25
Alliant No. 115-0063
3.0 Alternatives Development
The alternatives development identifies a multitude of transportation ideas and concepts based
upon input form stakeholders and a review of the purpose and needs. From this range of
alternatives, a screening evaluation is completed to evaluate each idea against key objectives. This
process identifies the alternatives that best meet the project goals and are carried forward for
further screening and evaluation. The goal is to arrive at a few feasible alternatives under both one-
way and two-way street operation that best balance and meet the primary objectives of the
stakeholders and neighborhood. An overview of the evaluation process is illustrated in Figure 14.
Figure 14. Alternatives Development Process
Key Objectives
The key objectives are based directly on the priorities and important considerations identified
within adopted City planning documents, input from members of the Technical Advisory
Committee (TAC), and voiced by the Study Advisory Committee (SAC). These objectives were
developed into qualitative and quantitative technical metrics to be applied as part of the screening
process and include five categories: Pedestrian/Biking, Mobility, Streetcar/Transit, Quality of Life,
and Economic Development. The category “Operations” will be evaluated during phase II of the
study. Table 3 summarizes the key objectives defined by the SAC.

Hennepin and 1st Avenue Transportation Study
26
Alliant No. 115-0063
Table 3. Alternatives Evaluation Objectives
Design Considerations
Best practice design standards and governing guidelines are considered to limit the range of
potential configurations and alternatives. While numerous resources and documents are consulted,
the key guidelines include the Municipal State Aid (MSA) Design standards (Chapter 8820) and
Access Minneapolis Street and Sidewalk Design Guidelines4. Figure 15 illustrates a few of the key
design parameters.
4 Access Minneapolis Ten Year Transportation Action Plan, Design Guidelines for Streets and Sidewalks, February
2008
Mobility/Safety
•Allow emergency access and truck operations for businesses
•Enhance non-motorized and motorized safety conflicts
•Reduce the number of complex intersection to increase safety
•Improve sight distances for non-motorized users
•Seek opportunities to address complex intersections (5th/Hennepin/Central, 7th/1st/Central, and 7th/Hennepin)
•Reduce complexity of the transportation network
•Address mixture of one-way and two-way streets
•Motorized throughput and congestion should not be driving factor
•Evaluate inconsistencies with parking bays and bump-outs
Pedestrian/Biking
•Improve connectivity for pedestrian, bicycling, and transit throughout the corridor
•Bicycle facilities should not be overlooked, part of greater network of connectivity to downtown, regional park system, and University of Minnesota campus
•Evaluate opportunities to address “free-flowing” right turns that encourage speeding and present conflicts with bicyclists and pedestrians
Streetcar/Transit
•Encourage transit use
•Streetcar is important improvement for the neighborhood and should be implemented in a way that maintain consistency with local and regional visions
Quality of Life
•Expand the pedestrian and bicycling facility
•Improve pedestrian and biking by using traffic calming techniques
•Influence travel behavior to reduce speeds before it enters the study area (e.g., Hennepin Bridge and Central Ave)
•Address signal timing that encourages speeding
Economic Development
•Parking will be accessible for residents and visitors
•Improve connections to businesses with access to and from destinations
•Limit speeding
•Promote traffic calming

Hennepin and 1st Avenue Transportation Study
27
Alliant No. 115-0063
Figure 15. Key Design Parameters
Screening Evaluation Process
The screening evaluation process reviewed each alternative against the key technical and design
standards and neighborhood objectives. Below is a list of technical and design “Fatal Flaws.”
All day No Parking on Both Sides.
Less than 2 Travel Lanes (One-way Concepts).
Street Type
Travel
Lane1
Left Turn
Lane
Bicycle
Lane2
Typical
Curb and
Gutter
Parking
Lane3
Activity Center
(MSA Sreet) 11 ft 10 ft 5-6 ft 2 ft 8 ft
1 May consider 10.83' lanes with State Aid Variance. A lane used by streetcar
requires 12' travel lane if adjancent to parking or bicycle lanes
2 On street bicycle lanes. If protected bicycle lanes are considered a 7' bike lane with 3'
buffer is desireable. If protected bicycle lanes are provided behind the curb an overall 9' width
(including clearance zones) is preferred, but may be as narrow as 6.5' in constrained locations
3 A 10' parking lane is required with 10,000 ADT or greater. An 8' parking lane may be provided
with a State Aid Variance.
Hennepin and 1st Avenue Transportation Study
28
Alliant No. 115-0063
Only 1 Travel Lane Each Direction (and No Turn Lane) – Two-way Concepts.
Shared Bicycle Facilities Only.
Less Than 11 Foot (10.83 foot lane may be considered) Travel Lane (Through Lane) .
Hennepin and 1st Avenue One-way Pair Bridges Two-way Operation.
Does not Maintain Streetcar “Couplet” alignment (northbound on Hennepin and
southbound on 1st Avenue).
Minimum Dimensions for All Modes of Travel (i.e., vehicle/transit, bicycle and parking).
Reduction of Pedestrian Zone Space.
Table 4 summarizes the evaluation metrics for the key neighborhood objectives.

Hennepin and 1st Avenue Transportation Study
29
Alliant No. 115-0063
Table 4. Evaluation Metrics
Mobility and Safety12' TRAVEL LANE
2 TRAVEL LANES
7' PARKING
ENHANCES NON-MOTORIZED AND MOTORIZED SAFETY
EMERGENCY VEHICLE ACCESS AND TRUCK OPERATIONS
CRITERIA PEFORMANCE
MEASURE
Pedestrian and Bicycles5' BIKE LANE WIDTH
BUFFERED BIKE ZONE (MIN 2')
12' OF PED REALM
BUFFER FROM MOTOR VEHICLE
TransitNO BIKE CONFLICT
10' RIGHT SIDE LOADING
10' LEFT SIDE LOADING
11' STREETCAR TRAVEL LANE
Quality of LifePEDESTRIAN ACCESSIBILITY AND COMFORT
TRAFFIC CALMING
CONNECTIVITY
PROVIDES OPTION FOR ALL MODES
Economic DevelopmentMaintain Parking
Complexity
TRAFFIC CIRCULATION AND CONGESTION
MORE THAN 12' TRAVEL LANE
LESS THAN 8' PARKING
CONFLICTS WITH RIGHT SIDE TRANSIT LOADING
MORE CONGESTED ALTERNATIVES SCORE WORSE THAN LESS CONGESTED ALTERNATIVES
LESS THAN 5' LANE
LESS THAN 2' BUFFERED BIKE ZONE
12' OF PED REALM
NO BUFFER
BIKE CONFLICT WITH MOTORIZED OR TRANSIT VEHICLES
LESS THAN 10' LOADING
GREATER THAN 10' LOADING
IF NOT DESIRABLE LANE WIDTH
SHORTER CROSSING DISTANCES
CURB EXTENSION, REFUGE ISLAND, OR OTHER FEATURES
BIKE LANE CONFIGURATION I.E., SHARED, STANDARD, ONE DIRECTION BIKE TRAVE, ETC..
OPTION ALLOWS FOR WIDE SIDEWALKS, BUFFERED BIKE LANES, SAFE TRANSIT ACCESSIBILITY
2 SIDE PARKING
LESS INTUITIVE OPERATION OR LESS UNDERSTOOD LANE CONFIGURATION
NO LEFT TURN LANE OR BUS STOPPING IN MOVING LANE
12' TRAVEL LANE
2 Travel Lanes
8' PARKING
LESS CONFLICTS, GOOD SIGHTLINES
MORE CONGESTED ALTERNATIVES SCORE WORSE THAN LESS CONGESTED ALTERNATIVES
6' LANE
2' BUFFERED BIKE ZONE
15' PED REALM
ON STREET PARKING
10' LOADING
LESS THAN 10' LOADING
MINIMUM LANE WIDTH IS 11' UNLESS ADJACENT TO ON STREET PARKING
SHORTER CROSSING DISTANCES
CURB EXTENSION, REFUGE ISLAND, OR OTHER FEATURES
BIKE LANE CONFIGURATION I.E., SHARED, STANDARD, ONE DIRECTION BIKE TRAVE, ETC..
OPTION ALLOWS FOR WIDE SIDEWALKS, BUFFERED BIKE LANES, SAFE TRANSIT ACCESSIBILITY
PEAK HOUR RESTRICTED PARKING
LESS INTUITIVE OPERATION OR LESS UNDERSTOOD LANE CONFIGURATION
LEFT TURN LANE OR BUS STOPPING IN 3RD TRAVEL LANE
11' TRAVEL LANE
3 TRAVEL LANES
7' PARKING
LESS CONFLICTS, GOOD SIGHTLINES
MORE CONGESTED ALTERNATIVES SCORE WORSE THAN LESS CONGESTED ALTERNATIVES
GREATER THAN 6' LANE
GREATER THAN 2' BUFFERED BIKE ZONE
20' PED REALM
BIKE LANE
NO BIKE CONFLICTS
GREATER THAN 10' LOADING
10' LOADING
12' IS PREFERRED
SHORTER CROSSING DISTANCES
CURB EXTENSION, REFUGE ISLAND, OR OTHER FEATURES
BIKE LANE CONFIGURATION I.E., SHARED, STANDARD, ONE DIRECTION BIKE TRAVE, ETC..
OPTION ALLOWS FOR WIDE SIDEWALKS, BUFFERED BIKE LANES, SAFE TRANSIT ACCESSIBILITY
PARKING ON 1-SIDE
LESS INTUITIVE OPERATION OR LESS UNDERSTOOD LANE CONFIGURATION
LEFT TURN LANE OR BUS STOPPING IN 3RD TRAVEL LANE
BEST MEETS OBJECTIVES
PARTIALLY MEETS OBJECTIVES
DOES NOT MEET OBJECTIVES

Hennepin and 1st Avenue Transportation Study
30
Alliant No. 115-0063
Universe of Alternatives
Under both the one-way and two-way operation scenarios, numerous possible street, bicycle and
pedestrian zone configurations can be created. The typical cross-sections developed followed a
practical approach to the potential street width scenarios that allow for interim, retrofit or full
reconstruction of Hennepin and 1st Avenue. Key street width scenarios include:
40 foot street width – maintains existing curbs.
40 foot street width – fills in the existing parking bays and maximizes the pedestrian zone
through retrofit or reconstruction.
48 foot street width – maintains the pedestrian zone and allows retrofit reconstruction with
removal of curb extension on one side.
50 foot street width – full reconstruction option to optimize the pedestrian realm and street
uses.
56 foot street width – retrofit option (curb extension removal) to maximize the street space
uses.
33 one-way alternatives and 55 two-way alternatives were developed and evaluated against the
screening criteria and key objectives. The alternatives and high level screening evaluation results
for the one-way and two-way scenarios are summarized in Table 5 and Table 6, respectively. An
overall qualitative rating of “best meets objectives”, “partially meets objectives”, and “does not
meet objectives” is listed for each typical section alternative.

Hennepin and 1st Avenue Transportation Study
31
Alliant No. 115-0063
Table 5. One-way Scenario Alternatives Screening Analysis
Existing 40-ft Streetwidth - RestripeA1 Buffered Bike Lane, 2 Side Parking, 2 Travel Lanes
A2 Shared Bike Lane, 2 Side Parking, 3 Travel Lanes
A3 Standard Bike Lane, 2 Side Parking, 3 Travel Lanes
A4 Buffered Bike Lane, 2 Side Parking, 3 Travel Lanes
40-ft Streetwidth (20' Ped Zone) - ReconstructionB1 Shared Bike Lane, 2 Side Parking, 2 Travel Lanes
B2 Standard Bike Lane, 2 Side Parking, 2 Travel Lanes
B3 Standard Bike Lane, 1 Side Parking, 2 Travel Lanes
B4 Standard Bike Lane, No Parking, 3 Travel Lanes
B5 Protected Bike Lane, 1 Side Parking, 2 Travel Lanes
B6 Protected Bike Lane, No Parking, 2 Travel Lanes
B7 Landscape Protected Bike Lane, No Parking, 3 Travel Lanes
B8 Shared Bike Lane, 1 Side Parking, 3 Travel Lanes
B9 Protected Bike Lane, 1 Side Off Peak Parking, 3 Travel Lanes
48-ft Streetwidth (12' Ped Zone) - Retrofit C1 Landscape Protected/Buffered Bike Lane, 1 Side Parking (East), 3 Travel Lanes
C2 Buffered Bike Lane, 1 Side Parking (East), 3 Travel Lanes
C3 Landscape Protected Bike Lane, 1 Side Parking (West), 3 Travel Lanes
C4 Protected Bike Lane, 1 Side Parking (West), 3 Travel Lanes
C5 Landscape Protected Bike Lane, 1 Side Parking (West), Off Peak Parking (East), 3 Travel Lanes
C6 Protected Bike Lane, 1 Side Parking (West), Off Peak Parking (East), 3 Travel Lanes
50-ft Streetwidth (15' Ped Zone) - ReconstructionD1 Buffered Bike Lane, 2 Side Parking, 2 Travel Lanes
D2 Shared Bike Lane, 2 Side Parking, 3 Travel Lanes
D3 Standard Bike Lane, 1 Side Parking, 3 Travel Lanes
D4 Landscape Protected Bike Lane, No Parking, 3 Travel Lanes
D5 Protected Bike Lane, 1 Side Parking, 3 Travel Lanes
D6 Landscape Protected Bike Lane, Off Peak Parking (East), 3 Travel Lanes
D7 Protected Bike Lane, 1 Side Parking (West), Off Peak Parking (East), 3 Travel Lanes
56-ft Streetwidth (12' Ped Zone) - RetrofitE1 Landscape Protected/Buffered Bike Lane, 2 side Parking, 2 Travel Lanes
E2 Buffered Bike Lane, 2 Side Parking, 2 Travel Lanes
E3 Shared Bike Lane, 2 Side Parking, 3 Travel Lanes
E4 Standard Bike Lane, 2 Side Parking, 3 Travel Lanes
E5 Landscape Protected Bike Lane, 1 Side Parking, 3 Travel Lanes
E6 Buffered Bike Lane, 2 Side Parking, 3 Travel Lanes
E7 Landscape Protected Bike Lane, 1 Side Parking (West), Off Peak Parking (East), 3 Travel Lanes
EVALUATION METHOD
LIST OF ALTERNATIVES
BEST MEETS OBJECTIVES
PARTIALLY MEETS OBJECTIVES
DOES NOT MEET OBJECTIVES

Hennepin and 1st Avenue Transportation Study
32
Alliant No. 115-0063
Table 6. Two-way Scenario Alternatives Screening Analysis
Existing 40-ft Streetwidth - RestripeA1 Standard Bike Lane,2 Side Parking, 2 Travel Lanes,Left Side Transit Loading
A2 Opposing Bike Lane,2 Side Parking, 2 Travel Lanes,Left Side Transit Loading
A3 Standard Bike Lane, 2 Side Parking, 2 Travel Lanes, CLTL, Right Side Transit Loading
A4 Opposing Bike Lane, 2 Side Parking, 2 Travel Lanes, CLTL, Right Side Transit Loading
A5 Opposing Bike Lane, 2 Side Parking,3 Travel Lanes, Right Side Transit Loading,
A6 Standard Bike Lane, 2 Side Parking,3 Travel Lanes, Right Side Transit Loading,
40-ft Streetwidth (20' Ped Zone) - ReconstructionB1 Shared Bike Lane,2 Side Parking, 2 Travel Lanes,Right Side Transit Loading
B2 Shared Bike Lane,1 Side Parking, 2 Travel Lanes, CLTL, Right Side Transit Loading
B3 Buffered Bike Lane,1 Side Parking, 2 Travel Lanes,Rigth Side Transit Loading
B4 Standard Bike Lane, No Parking, 3 Travel Lanes, Right Side Transit Loading
B5 Opposing/Buffered Bike Lane,No Parking, 2 Travel Lanes,Rigth Side Transit Loading
B6 Opposing Bike Lane, 1 Side Parking, 2 Travel Lanes, Right Side Transit Loading
B7 Opposing Bike Lane, No Parking, 3 Travel Lanes, Right Side Transit Loading
B8 Standard Bike Lane, Off Peak Parking (West), 3 Travel Lanes, Righ tside Transit Loading
48-ft Streetwidth (12' Ped Zone) - Retrofit C1 Buffered Bike Lane,1 Side Parking, 2 Travel Lanes,Left Side Transit Loading
C2 Standard Bike Lane,1 Side Parking, 3 Travel Lanes, Left Side Transit Loading
C3 Standard Bike Lane,1 Side Parking,4 Travel Lanes,Right Side Transit Loading
C4 Landscape Protected Bike Lane,1 Side Parking, 3 Travel Lanes,Right Side Transit Loading
C5 Opposing/Buffered Bike Lane,1 Side Parking, 3 Travel Lanes,Right Side Transit Loading
C6 Opposing Buffered Bike Lane,1 Side Parking, 3 Travel Lanes,Right Side Transit Loading
C7 Opposing/ Buffered Bike Lane,1 Side Parking, 2 Travel Lanes,CLTL, Right Side Transit Loading
C8 Buffered Bike Lane,1 Side Parking, 2 Travel Lanes,CLTL, Right Side Transit Loading
C9 Opposing Bike Lane,1 Side Parking, 3 Travel Lanes,CLTL, Right Side Transit Loading
C10 Standard Bike Lane,1 Side Parking, 3 Travel Lanes, CLTL, Right Side Transit Loading
C11 Buffered Bike Lane,2 Side Parking, 3 Travel Lanes, Right Side Transit Loading
50-ft Streetwidth (15' Ped Zone) - ReconstructionD1 Buffered Bike Lane,1 Side Parking, 2 Travel Lanes,Left Side Transit Loading
D2 Standard Bike Lane,1 Side Parking, 3 Travel Lanes,Right Side Transit Loading
D3 Buffered Bike Lane,1 Side Parking, 3 Travel Lanes,Right Side Transit Loading
D4 Buffered Bike Lane,1 Side Parking, 2 Travel Lane ,CLTL, Right Side Transit Loading
D5 Landscape Protected Bike Lane, No Parking, 2 Travel Lanes, Right Side Transit Loading
D6 Landscape Protected Bike Lane, No Parking, 2 Travel Lanes, CLTL, Right Side Transit Loading
D7 Opposing/Buffered Bike Lane, No Parking, 2 Travel Lanes, CLTL, Right Side Transit Loading
D8 Standard Bike Lane, No Parking, 3 Travel Lanes, CLTL, Right Side Transit Loading
D9 Opposing/Buffered Bike Lane, No Parking, 2 Travel Lanes, Left Side Transit Loading
D10 Buffered Bike Lane, No Parking, 3 Travel Lanes, Left Side Transit Loading
D11 Standard Bike Lane, Off Peak Parking (West), 3 Travel Lanes, Left Turn Lane, Right tside Transit Loading
56-ft Streetwidth (12' Ped Zone) - RetrofitE1 Buffered Bike Lane, 2 Side Parking, 3 Travel Lanes, Right Side Transit Loading
E2 Buffered Bike Lane, 2 Side Parking, 2 Travel Lanes, Left Side Transit Loading
E3 Opposing/Standard Bike Lane, 1 Side Parking, 2 Travel Lanes,Left Side Transit Loading
E4 Opposing/Buffered Bike Lane, 1 Side Parking, 2 Travel Lanes, Left Side Transit Loading
E5 Standard Bike Lane, 1 Side Parking, 3 Travel Lanes,Left Side Transit Loading
E6 Buffered Bike Lane,2 Side Parking, 2 Travel Lane ,CLTL, Right Side Transit Loading
E7 Opposing/Buffered Bike Lane,1 Side Parking, 2 Travel Lane ,CLTL, Right Side Transit Loading
E8 Opposing/Standard Bike Lane, 1 Side Parking, 2 Travel Lanes,CLTL,Right Side Transit Loading
E9 Standard Bike Lane,1 Side Parking, 3 Travel Lanes,CLTL,Right Side Transit Loading
E10 Opposing/Buffered Bike Lane, 1 Side Parking, 2 Travel Lanes, CLTL, Right Side Transit Loading
E11 Buffered Bike Lane, 1 Side Parking, 3 Travel Lanes, Right Side Transit Loading
E12 Oppoisng/Standard Bike Lane, 1 Side Parking, 3 Travel Lanes, Right Side Transit Loading
E13 Buffered Bike Lane, 1 Side Parking, 3 Travel Lanes, Right Side Transit Loading
E14 Landscape Protected Bike Lane, 1 Side Parking, 3 Travel Lanes, Right Side Transit Loading
E15 Standard Bike Lane, 1 Side Parking (East), Off Peak Parking (West), 4 Travel Lanes, Right Side Transit Loading
E16 Protected Bike Lane, Off Peak Parking (West), 3 Travel Lanes, Left Side Transit Loading
E17 Oppoisng/Standard Bike Lane, Off Peak Parking (East), 3 Travel Lanes, Left Side Transit Loading
E18 Protected Bike Lane, Off Peak Parking (West), 3 Travel Lanes, Left Side Transit Loading
E19 Protected Bike Lane, Off Peak Parking (West), 3 Travel Lanes, CLTL, Right Side Transit Loading
EVALUATION METHOD
LIST OF ALTERNATIVES
BEST MEETS OBJECTIVES
PARTIALLY MEETS OBJECTIVES
DOES NOT MEET OBJECTIVES

Hennepin and 1st Avenue Transportation Study
33
Alliant No. 115-0063
Leading Typical Section Alternatives
Six (three one-way and three two-way) leading typical section alternatives that best met the key
goals and objectives were identified through the screening analysis and discussion with the TAC.
Interim implementation strategies were also identified. Each cross-section alternative was also
presented to, discussed, and confirmed with the SAC. The leading one-way alternatives that will
be carried forward for further analysis and investigation are shown in Table 7.
Table 7. Leading One-way Typical Cross Sections
Concept 1-1B (B5)
Bicycle: Buffer Protected Bike Lane
Parking: 1 Side Parking (West)
Sidewalk: 20 Feet
Auto: 2 Travel Lanes
Streetcar: Right Side Alignment
Concept 1-2B (C3)
Bicycle: Barrier Protected Bike Lane
Parking: 1 Side Parking (West), Off Peak Parking (East)
Sidewalk: 12 Feet
Auto: 2 Travel Lanes (Off Peak), 3 Travel Lanes (PM Peak)
Streetcar: Left Side Alignment
Concept 1-2C
Bicycle: Barrier Protected Bike Lane
Parking: 1 Side Only
Sidewalk: 12 Feet
Auto: 3 Travel Lanes
Streetcar: Right Side Alignment

Hennepin and 1st Avenue Transportation Study
34
Alliant No. 115-0063
The leading two-way alternatives that will be carried forward for further analysis and investigation
are shown in Table 8.
Table 8. Leading Two-way Typical Cross Sections

Hennepin and 1st Avenue Transportation Study
35
Alliant No. 115-0063
The leading alternatives shown above and identified through the screening process were slightly
refined based on the following considerations:
Phasing/Staging of Concepts:
Ability to align with a minimum 40 foot and maximum of 56 foot cross-section envelopes
along Hennepin and 1st Avenue.
Smaller Scale Solutions:
Potential for a short-term/interim project.
Potential for a retrofit option to maintain the existing geometry with only pavement
marking restriping.
Larger Scale Solutions:
Potential for a mid to long term project.
Full reconstruction to fill in parking bays, modify curb extensions, provided protected
bikeway, sidewalk expansion and traffic signal modifications.
Balanced Approach:
Provide a similar cross-section for Hennepin and 1st Avenue.
Provide similar benefits to both corridors – quality of life, economic development, traffic
calming, circulation and multimodal mobility.

Hennepin and 1st Avenue Transportation Study
36
Alliant No. 115-0063
4.0 Concept Design
The six leading cross-section configurations were developed into more refined corridor-level
concept designs to illustrate how the cross-sections may be applied through the study area. The
primary goal of each concept design is to balance the vision of the community, existing physical
constraints, and the regional role Hennepin and 1st Avenue serve beyond the immediate
neighborhood. The concepts achieve the key goals of the neighborhood, which are:
Connect pedestrian, bicycle, and transit infrastructure to the River and to adjacent
neighborhoods and districts, including downtown Minneapolis, the University of
Minnesota, Dinkytown and the Northeast Arts District.
Provide an exceptional urban pedestrian experience for people of all ages.
Enhance the pedestrian and bicyclist experience and improve pedestrian and bicyclist
safety and comfort.
Achieve a better balance between pedestrian, bicycle, transit and automobile travel modes.
Expand and improve pedestrian, bicycling, and transit infrastructure throughout the
neighborhood.
Improve multi-modal connections with existing transportation networks to improve access
to and from destinations throughout Minneapolis and beyond.
Parking will be conveniently accessible for residents and visitors who choose to travel by
car.
Support improved transit services and infrastructure including the Nicollet-Central
Streetcar implementation, real time transit information signage and otherwise.
The design features included in each concept include; a protected bicycle facility, streetcar
alignment (both left and right side alignments are illustrated), wider sidewalks and increased
pedestrian space wherever feasible, shorter pedestrian crosswalks, on-street parking, opportunities
for “greening,” and balanced motor vehicle travel lanes.
One-way Concepts
The one-way concepts are illustrated in Figure 16 (Concept 1-1B), Figure 17 (Concept 1-2C) and
Figure 18 (1-2B). Potential implementation strategies may include:
Concept 1-1B:
Potential Short-Term: Restripe roadway for one-way operation with two travel lanes and
buffered bike lane (Concept 1-1A), while maintaining parking on both sides and existing
pedestrian zone as shown in Table 9.
Mid/Long-Term (1-1B): Reconstruct roadway for one-way operation with two travel lanes
and parking on one side, which would accommodate a protected bike lane and an expanded
pedestrian zone as shown in Figure 16.

Hennepin and 1st Avenue Transportation Study
37
Alliant No. 115-0063
Table 9. Interim Concept 1-1A
Concept 1-2B and 1-2C:
Potential Short-Term: Restripe roadway for one-way operation with three travel lanes and
standard bike lane, while maintaining parking on both sides and existing pedestrian zone
(Concept 1-2A) as shown in Table 10.
Mid/Long-Term (1-2B): Reconstruct roadway for one-way operation with two travel lanes,
parking on one side, protected bike lane, and off-peak parking, which would allow one lane
to serve as a travel lane at peak period as shown in Figure 17.
Mid/Long-Term (1-2C): Reconstruct roadway for one-way operation with three travel
lanes and parking on one side, which would accommodate a protected bike lane as shown
in Figure 18.
Table 10. Interim Concept 1-2A
Two-way Concepts
The two-way concepts are illustrated in Figure 19 (Concept 2-1B) and Figure 20 (Concept 2-1C).
Potential implementation strategies may include:
Concept 1-1A
Bicycle: Buffered Bike Lane
Parking: 2 Side
Sidewalk: 12 Feet
Auto: 2 Travel Lanes
Streetcar: Streetcar Compatible
Concept 1-2A
Bicycle: Standard Bike Lane
Parking: 2 Side
Sidewalk: 12 Feet
Auto: 3 Travel Lanes
Streetcar: Streetcar Compatible

Hennepin and 1st Avenue Transportation Study
38
Alliant No. 115-0063
Concept 2-1B and 2-1C:
Potential Short-Term: Restripe roadway for two-way operation with three travel lanes and
standard bike lane (Concept 2-1A), while maintaining parking on both sides and existing
pedestrian zone as shown in Table 11.
Mid/Long-Term (2-1B): Reconstruct roadway for two-way operation with three travel
lanes and parking on one side, which would accommodate a protected bike lane as shown
in Figure 19.
Mid/Long-Term (2-1C): Reconstruct roadway for two-way operation with three travel
lanes and parking on both sides, which would accommodate a protected bike lane as shown
in Figure 20.
Table 11. Interim Concept 2-1A
Concept 2-1A
Bicycle: Standard Bike Lane
Parking: 2 Side
Sidewalk: 12 Feet
Auto: 2 Travel Lanes Primary Direction, 1 Travel Lane Opposing
Streetcar: Streetcar Compatible

SC
SC
LEGEND
X
X
SHEET 1
CONCEPT 1-1BHennepin Ave/1st Ave Northeast Transportation Study
E N G I N E E R I N G
ALLIANT
1ST AVE
NE
E HENNEPIN AVE
2N
D
ST
NE
UNI
VE
RSI
TY
AV
E
4T
H
ST
NE
E HENNEPIN AVE
7' STANDARD BIKE LANE
11' LANE
PERIMETE R 30 FT
REM 35 SF
AREA 15 SF
8' PARKING
11' LANE
PERIMETER 30 FT
REM 35 SF
AREA 15 SF
8' PARKING
PERIMETER 30 FT
REM 35 SF
AREA 15 SF11' LANE
7' PROTECTED BIKE LANE
11' LANE
PERIMETER 30 FT
REM 35 SF
AREA 15 SF
PERIMETER 30 FT
REM 35 SF
AREA 15 SF11' LANE
8' PARKING
7' PROTECTED BIKE LANE
11' LANE
PERIMETER 30 FT
REM 35 SF
AREA 15 SF
PERIMETER 30 FT
REM 35 SF
AREA 15 SF11' LANE
8' PARKING
11' LANE
PERIMETER 30 FT
REM 35 SF
AREA 15 SF
AREA 26 SQ FT
PERIMETER 50FT
REM 95 SQ FT
AREA 26 SQ FT
PERIMETER 50FT
REM 95 SQ FT
AREA 26 SQ FT
PERIMETER 50FT
REM 95 SQ FT
AREA 26 SQ FT
PERIMETER 50FT
REM 95 SQ FT
7' PROTECTED BIKE LANE
AREA 26 SQ FT
PERIMETER 50FT
REM 95 SQ FT
PERIMETER 30 FT
REM 35 SF
AREA 15 SF
AREA = 15 SQ'
REM = 48 SQ '
PERIMETER = 30 '
AREA = 15 SQ'
REM = 48 SQ '
PERIMETER = 30 '
AREA = 15 SQ'
REM = 48 SQ '
PERIMETER = 30 '
PERIMETER 30 FT
REM 35 SF
AREA 15 SF
AREA 26 SQ FT
PERIMETER 50FT
REM 95 SQ FT
AREA 26 SQ FTPERIMETER 50FT
REM 95 SQ FT
AREA = 1
5 SQ'
REM
= 48 S
Q '
PERI
METE
R =
30 '
AREA = 1
5 SQ'
REM
= 48 S
Q '
PERI
METE
R =
30 '
RECONFIGURE 7TH ST NE LANE ASSIGNMENT
ADD ADDITONAL SIDEWALK
OPPORTUNITY TO CORRECT SKEWTRAFFIC SIGNAL
REMOVE BUS STOP
RELOCATED BUS STOP
EXISTING BUS STOP
POTENTIAL PEDESTRIAN REALM WIDENING
EXISTING PEDESTRIAN REALM
BIKE FACILITY
ADD CURB EXTENSION
POTENTIAL OPPORTUNITY TO
STREETCAR FROM RIGHT LANE TO LEFT LANE
DEDICATED RIGHT TURN LANE TO TRANSITION
DEDICATED RIGHT TURN LANE
7' STANDARD BIKE LANE TO ALLOW FOR
7' STANDARD BIKE LANE
(REQUIRES VARIANCE)
4' BIKE LANES WITH 1' BUFFER ON EACH SIDE
7' BIKE LANE WITH 3' PROTECTED BUFFER
STREETCAR LANE LOCATION
1
2
3
4
5
6
7
8
9
3
10'x100'TRANSIT AREA10'x100'TRANSIT AREA
8'
16'
20'
28'
20'
28' 1
9'
20'
28'
8' PARKING
11' LANE
PERIMETER 30 FT
REM 35 SF
AREA 15 SF
PERIMETER 30 FT
REM 35 SF
AREA 15 SF 11' LANE
8' PARKING
11' LANE
PERIMETER 30 FT
REM 35 SF
AREA 15 SF
PERIMETER 30 FT
REM 35 SF
AREA 15 SF 11' LANE
PERIMETER 30 FT
REM 35 SF
AREA 15 SF 11' LANE
8' PARKING
11' LANE
PERIMETER 30 FT
REM 35 SF
AREA 15 SF
11' LANE
PERIMETER 30 FT
REM 35 SF
AREA 15 SF
PERIMETER 30 FT
REM 35 SF
AREA 15 SF
PERIMETER 30 FT
REM 35 SF
AREA 15 SF
8' PARKIN
G11' LA
NE
PERIMETER 30 FT
REM 35 SF
AREA 15 SF
11' LA
NE
11' LANE
2
SC
MA
TC
H LIN
E
10'x100'TRANSIT AREA
1 1
1
21'
11' 1
2' 1
7'
13'
16'9'
10'
17'
27'
19'
30'
21'
6'
7'
9'
11'
2 2
666
1
25
2
6 6 6 6 6 6
•BIKE FACILITY AT STREET GRADE
•SWITCH STREETCAR FROM RIGHT TO LEFT
•EXCLUSIVE STREETCAR SIGNAL PHASE
EXAMPLE TRANSIT SHELTER/BIKE LANE FACILITY EXAMPLE STREET TO SIDEWALK TRANSITION DCBA OFFSTREET PROTECTED BIKE LANETYPICAL SECTION - PROTECTED BUFFER BIKEWAY
EXCLUSIVE LEFT TURN LANE
•STREETCAR ALIGNMENT REQUIRES AN
•SWITCH STREETCAR FROM LEFT TO RIGHT
•EXCLUSIVE STREETCAR SIGNAL PHASE
B
A
AB
C DDB
A
2
10'x100'TRANSIT AREA
C
6 68 8 8
8 8
668
8
68 8 8
11'
29'
6
A TYPICAL SECTION - PROTECTED BUFFER BIKEWAY
B
Note: Concepts are preliminary, and forplanning purposes only. Concept will requiremore detailed engineering investigation, andevaluation and as such is subject to change.
Figure 16 Concept Design - One-Way 1-1B
Sheet 1 of 2
Hennepin and 1st Avenue Transportation Study

LEGEND
X
X
SHEET 2
CONCEPT 1-1BHennepin Ave/1st Ave Northeast Transportation Study
E N G I N E E R I N G
ALLIANT
5T
H
ST
NE
6T
H
ST
NE
E HENNEPIN AVE
AREA 26 SQ FT
PERIMETER 50FT
REM 95 SQ FT
AREA 26 SQ FT
PERIMETER 50FT
REM 95 SQ FT
7' PROTECTED BIKE LANE
CE
NTR
AL
AVE
AREA = 15 SQ'
REM = 48 SQ '
PERIMETER = 30 '
AREA 26 SQ FT
PERIMETER 50FT
REM 95 SQ FT
PERIMETER 30 FT
REM 35 SF
AREA 15 SF
PERIMETER 30 FT
REM 35 SF
AREA 15 SF13' LANE
PERIMETER 30 FT
REM 35 SF
AREA 15 SF11' LANE
PERIMETER 30 FT
REM 35 SF
AREA 15 SF13' LANE
PERIMETER 30 FT
REM 35 SF
AREA 15 SF11' LANE
11' LANE
PERIMETER 30 FT
REM 35 SF
AREA 15 SF 11' LANE
11' LANE
PERIMETER 30 FT
REM 35 SF
AREA 15 SF
8' PARKING
7' PROTECTED BIKE LANE
AREA = 15
SQ'
REM = 48 SQ '
PERIMETER =
30 '
AREA = 15
SQ'
REM = 48 SQ '
PERIMETER =
30 '
RECONFIGURE 7TH ST NE LANE ASSIGNMENT
ADD ADDITONAL SIDEWALK
OPPORTUNITY TO CORRECT SKEWTRAFFIC SIGNAL
REMOVE BUS STOP
RELOCATED BUS STOP
EXISTING BUS STOP
POTENTIAL PEDESTRIAN REALM WIDENING
EXISTING PEDESTRIAN REALM
BIKE FACILITY
13' LA
NE
11' LA
NE
7T
H S
T
NE
11' LA
NE
ADD CURB EXTENSION
POTENTIAL OPPORTUNITY TO
STREETCAR FROM RIGHT LANE TO LEFT LANE
DEDICATED RIGHT TURN LANE TO TRANSITION
DEDICATED RIGHT TURN LANE
7' STANDARD BIKE LANE TO ALLOW FOR
7' STANDARD BIKE LANE
(REQUIRES VARIANCE)
4' BIKE LANES WITH 1' BUFFER ON EACH SIDE
7' BIKE LANE WITH 3' PROTECTED BUFFER
STREETCAR LANE LOCATION
1
2
3
4
5
6
7
8
9
10'x100'
TR
ANSI
T
AR
EA
SC
28'
29'
8'
25'
17'
26'
29'
31'
8' PARKING
7' PROTECTED BIKE LANE
11' LANE
PERIMETER 30 FT
REM 35 SF
AREA 15 SF
PERIMETER 30 FT
REM 35 SF
AREA 15 SF 11' LANE
7' PROTECTED BIKE LANE
PERIMETER 30 FT
REM 35 SF
AREA 15 SF 11' LANE
11' LANE
PERIMETER 30 FT
REM 35 SF
AREA 15 SF
8' PARKING
PERIMETER 30 FT
REM 35 SF
AREA 15 SF
PERIMETER 30 FT
REM 35 SF
AREA 15 SF
19'
SC
MA
TC
H LIN
E
1
1
19'
8' 8' 6'
26'
20'
15'1
9'
1
6 6666
6
4
7
7
9
EXAMPLE TRANSIT SHELTER/BIKE LANE FACILITY EXAMPLE STREET TO SIDEWALK TRANSITION DCB OFFSTREET PROTECTED BIKE LANEEXAMPLE TRANSIT SHELTER/BIKE LANE FACILITY EXAMPLE STREET TO SIDEWALK TRANSITION DCBA OFFSTREET PROTECTED BIKE LANETYPICAL SECTION - PROTECTED BUFFER BIKEWAY
IMPROVEMENTS
AND APPROPRIATE INTERSECTION
NEEDED TO IDENTIFY POTENTIAL
FURTHER INVESTIGATION IS
PARKING REMOVAL REQUIRED
•NEW TRAFFIC SIGNAL SYSTEM
•EXCLUSIVE STREETCAR PHASE REQUIRED
TURN ONTO 7TH ST
TO ACCOMODATE LEFT
STREETCAR ONLY LANE
A
AAA
A A
8 88 8
188
8
8
15'
8
8
PARKING REMOVAL REQUIRED
B
2
8
6'
1
12'
A
Note: Concepts are preliminary, and forplanning purposes only. Concept will requiremore detailed engineering investigation, andevaluation and as such is subject to change.
Figure 16 Concept Design - One-Way 1-1B
Sheet 2 of 2
Hennepin and 1st Avenue Transportation Study

SC
SC
LEGEND
X
X
SHEET 1
CONCEPT 1-2CHennepin Ave/1st Ave Northeast Transportation Study
E N G I N E E R I N G
ALLIANT
E Hennepin Ave
1st A
ve N
E
2nd St
NE
11' LANE
PERIMETER 30 FT
REM 35 SF
AREA 15 SF
PERIMETER 30 FT
REM 35 SF
AREA 15 SF11' LANE
11' LANE
PERIMETER 30 FT
REM 35 SF
AREA 15 SF
8' BIKE LANE
8' PARKING
11' LANE
11' LANE
11' LANE
8' BIKE LANE
8' PARKING
7' PLANTING AREA7' PLANTING AREA
8' PARKING
PERIMETER 30 FT
REM 35 SF
AREA 15 SF
PERIMETER 30 FT
REM 35 SF
AREA 15 SF
11' LANE
PERIMETER 30 FT
REM 35 SF
AREA 15 SF
8' BIKE LANE
11' LANE
11' LANE
7' PLANTING AREA
PERIMETER 30 FT
REM 35 SF
AREA 15 SF 11' LANE
11' LANE
8' PARKING
PERIMETER 30 FT
REM 35 SF
AREA 15 SF
PERIMETER 30 FT
REM 35 SF
AREA 15 SF11' LANE
11' LANE
PERIMETER 30 FT
REM 35 SF
AREA 15 SF
AREA 2
6 SQ F
T
PERI
METE
R 50
FT
REM
95 S
Q FT
PERIMETER 30 FT
REM 35 SF
AREA 15 SF 11' LANE
11' LANE
AREA 2
6 SQ F
T
PERI
METE
R 50
FT
REM
95 S
Q FT
11'
LANE
AREA 2
6 SQ F
T
PERI
METE
R 50
FT
REM
95 S
Q FT
11'
LANE
AREA 2
6 SQ F
T
PERI
METE
R 50
FTRE
M 95 S
Q FT
11'
LANE
PERIMETER 30 FT
REM 35 SF
AREA 15 SF
PERIMETER 30 FT
REM 35 SF
AREA 15 SF
PERIMETER 30 FT
REM 35 SF
AREA 15 SF
PERIMETER 30 FT
REM 35 SF
AREA 15 SF
AREA 26 SQ FT
PERIMETER 50FT
REM 95 SQ FT
PERIMETER 30 FT
REM 35 SF
AREA 15 SF
AREA = 15 SQ'
REM = 48 SQ '
PERIMETER = 30 '
UNI
VE
RSI
TY
AV
E
4T
H
ST
NE
AREA = 1
5 SQ'
REM
= 48 S
Q '
PERI
METE
R =
30 ' 11' LANEAR
EA = 1
5 SQ'
REM
= 48 S
Q '
PERI
METE
R =
30 '
PERIMETER 30 FT
REM 35 SF
AREA 15 SF 11' LANEPERIMETER 30 FT
REM 35 SF
AREA 15 SF 11' LANE
AREA = 1
5 SQ'
REM
= 48 S
Q '
PERI
METE
R =
30 '
AREA = 1
5 SQ'
REM
= 48 S
Q '
PERI
METE
R =
30 ' 11' LANE
13' LANE
8' PARKING
1' GUTTER ON TRAVEL LANE SIDE
7' PLANTER AREA - INCLUDES
TRAFFIC SIGNAL
REMOVE BUS STOP
RELOCATED BUS STOP
EXISTING BUS STOP
WIDENING
POTENTIAL PEDESTRIAN REALM
EXISTING PEDESTRIAN REALM
BIKE FACILITY
ASSIGNMENT
RECONFIGURE 7TH ST NE LANE
ADD ADDITONAL SIDEWALK
OPPORTUNITY TO CORRECT SKEW
STREETCAR LANE LOCATION
ADD CURB EXTENSION
POTENTIAL OPPORTUNITY TO
LANE TO LEFT LANE
TRANSITION STREETCAR FROM RIGHT
DEDICATED RIGHT TURN LANE TO
FOR DEDICATED RIGHT TURN LANE
7' STANDARD BIKE LANE TO ALLOW
7' BIKE LANE WITH 3' BUFFER
ON EACH SIDE (REQUIRES VARIANCE)
4' BIKE LANES WITH 1' BUFFER
WITH 7'LANDSCAPED BUFFER
8' RAISED PROTECTED BIKE LANE
14'
12'
10'
13'
12'
19'
11'
7'
9'
23'
6'1
0'
12'
8'
16'
16'
15'
15'
8'
4'
12' 2
0'
20'
12' 1
1'
20' 2
0'
11'
7'
11'
11'
13'
1
2
3
4
5
6
12' 2
0'
20'
12' 1
1'
20'
7
8
9
18'
20'
10'x100'TRANSIT AREA10'x 100'TRANSIT AREA
PERIMETER 30 FT
REM 35 SF
AREA 15 SF
PERIMETER 30 FT
REM 35 SF
AREA 15 SF
PERIMETER 30 FT
REM 35 SF
AREA 15 SF
SC
MA
TC
H LIN
E
EXCLUSIVE LEFT TURN LANE
•STREETCAR ALIGNMENT REQUIRES AN
•SWITCH STREETCAR FROM LEFT TO RIGHT
•EXCLUSIVE STREETCAR SIGNAL PHASE
EXAMPLE TRANSIT SHELTER/BIKE LANE FACILITY EXAMPLE STREET TO SIDEWALK TRANSITION
•BIKE FACILITY AT STREET GRADE
•SWITCH STREETCAR FROM RIGHT TO LEFT
•EXCLUSIVE STREETCAR SIGNAL PHASE
10'x100'TRANSIT AREA
10'x100'TRANSIT AREA
1 1 1 1
222
2
6
66
66 66
TYPICAL SECTION - LANDSCAPED BUFFER BIKEWAY
5
PARKING REMOVAL REQUIRED
9'
DCBA
AB B
B
CC
D D B
OFFSTREET PROTECTED BIKE LANE
18'
TYPICAL SECTION - LANDSCAPED BUFFER BIKEWAYA D TYPICAL SECTION - RAISED PROTECTED BIKEWAY
A DOR A DOR
A
DOR
6
PARKING REMOVAL REQUIRED
2
B
Note: Concepts are preliminary, and forplanning purposes only. Concept will requiremore detailed engineering investigation, andevaluation and as such is subject to change.
Figure 17 Concept Design - One-Way 1-2B
Sheet 1 of 2
Hennepin and 1st Avenue Transportation Study

LEGEND
X
X
SHEET 2
CONCEPT 1-2CHennepin Ave/1st Ave Northeast Transportation Study
E N G I N E E R I N G
ALLIANT
7th St N
E
CE
NTR
AL
AVE
E HENNEPIN AVE
7' PROTECTED BIKE LANE
AREA = 15 SQ'
REM = 48 SQ '
PERIMETER = 30 '
AREA 26 SQ FT
PERIMETER 50FT
REM 95 SQ FT
PERIMETER 30 FT
REM 35 SF
AREA 15 SF
PERIMETER 30 FT
REM 35 SF
AREA 15 SF13' LANE
PERIMETER 30 FT
REM 35 SF
AREA 15 SF11' LANE
PERIMETER 30 FT
REM 35 SF
AREA 15 SF13' LANE
PERIMETER 30 FT
REM 35 SF
AREA 15 SF11' LANE
11' LANE
8' PARKING
PERIMETER 30 FT
REM 35 SF
AREA 15 SF 11' LANE
PERIMETER 30 FT
REM 35 SF
AREA 15 SF 11' LANE
7' PLANTING AREA
8' BIKE LANE
8' PARKING
11' LANE
13' LANE
PERIMETER 30 FT
REM 35 SF
AREA 15 SF
PERIMETER 30 FT
REM 35 SF
AREA 15 SF
5t
h
St
NE
6t
h
St
NE
RECONFIGURE 7TH ST NE LANE ASSIGNMENT
ADD ADDITONAL SIDEWALK
OPPORTUNITY TO CORRECT SKEW
1' GUTTER ON TRAVEL LANE SIDE
7' PLANTER AREA - INCLUDES
TRAFFIC SIGNAL
REMOVE BUS STOP
RELOCATED BUS STOP
EXISTING BUS STOP
POTENTIAL PEDESTRIAN REALM WIDENING
EXISTING PEDESTRIAN REALM
BIKE FACILITY
11' LANE
PERIMETER 30 FT
REM 35 SF
AREA 15 SF
11' LANE
PERIMETER 30 FT
REM 35 SF
AREA 15 SF
11' LANE
PERIMETER 30 FT
REM 35 SF
AREA 15 SF
8' PARKING
7T
H S
T
NE
AREA = 15
SQ'
REM = 48 SQ '
PERIMETER =
30 '
AREA = 15
SQ'
REM = 48 SQ '
PERIMETER =
30 '
13' LA
NE
11' LA
NE
11' LA
NE
STREETCAR LANE LOCATION
ADD CURB EXTENSION
POTENTIAL OPPORTUNITY TO
STREETCAR FROM RIGHT LANE TO LEFT LANE
DEDICATED RIGHT TURN LANE TO TRANSITION
DEDICATED RIGHT TURN LANE
7' STANDARD BIKE LANE TO ALLOW FOR
7' BIKE LANE WITH 3' BUFFER
(REQUIRES VARIANCE)
4' BIKE LANES WITH 1' BUFFER ON EACH SIDE
BUFFER
8' RAISED PROTECTED BIKE LANE WITH 7'LANDSCAPED
8'
32'
24'
20'
27'
11'
20'
12'
20'
11'
7'
12'
11'
1
2
3
4
5
6
7
8
9
10'
27'
9'
26'
19'
8' BIKE LANE
10'x100'
TR
ANSI
T
AR
EA
SC
PERIMETER 30 FT
REM 35 SF
AREA 15 SF
PERIMETER 30 FT
REM 35 SF
AREA 15 SF
7' P
RO
TECTED BIK
E LA
NE
SC
MA
TC
H LIN
E
PARKING REMOVAL REQUIRED
TURN ONTO 7TH ST
TO ACCOMODATE LEFT
STREETCAR ONLY LANE
•NEW TRAFFIC SIGNAL SYSTEM
•EXCLUSIVE STREETCAR PHASE REQUIRED
8'
8' 6'
3
4
8
7
9
22'
26'
1
666
IMPROVEMENTS
AND APPROPRIATE INTERSECTION
NEEDED TO IDENTIFY POTENTIAL
FURTHER INVESTIGATION IS
EXAMPLE TRANSIT SHELTER/BIKE LANE FACILITY EXAMPLE STREET TO SIDEWALK TRANSITIONTYPICAL SECTION - LANDSCAPED BUFFER BIKEWAY DCBA OFFSTREET PROTECTED BIKE LANE
2
7
868
12
2
C
C
6
15'
8
PARKING REMOVAL REQUIRED
6'
3
2
12'
A DORB
A DORA DOR
8
B
D
Note: Concepts are preliminary, and forplanning purposes only. Concept will requiremore detailed engineering investigation, andevaluation and as such is subject to change.
Figure 17 Concept Design - One-Way 1-2B
Sheet 1 of 2
Hennepin and 1st Avenue Transportation Study

Left Side Streetcar
2nd St to 4th St (2-Blocks)
Concept 1-2B
LEGEND
8' PARKING
PERIMETER 30 FT
REM
35 SF
AREA 15 SF
11' LANE
PERIMETER 30 FT
REM
35 SF
AREA 15 SF
11' LANE PERIMETER 30 FT
REM
35 SF
AREA 15 SF
6' PLANTING AREA
8' BIKE LANE
OFF PEAK PARKING
12' LANE 12' LANE
11' LANE
11' LANEPERIM
ETER 30 FT
REM
35 SF
AREA 15 SF
PERIMETER 30 FT
REM
35 SF
AREA 15 SF
PERIMETER 30 FT
REM
35 SF
AREA 15 SF
6' PLANTING AREA
8' BIKE LANE
8' PARKING
UNI
VE
RSI
TY
AV
E
4T
H
ST
NE
2nd
ST
NE
NOTES:
CONCEPT 1-2B INSETHennepin Ave/1st Ave Northeast Transportation Study
E N G I N E E R I N G
ALLIANT
OFF PEAK PARKING
EXTENSION
POTENTIAL OPPORTUNITY TO ADD CURB
WITH 6' LANDSCAPED BUFFER
8' RAISED PROTECTED BIKE LANE
STREETCAR LANE LOCATION
1' GUTTER ON TRAVEL LANE SIDE
6' PLANTER AREA - INCLUDES
TRAFFIC SIGNAL
REMOVE BUS STOP
WIDENING
POTENTIAL PEDESTRIAN REALM
EXISTING PEDESTRIAN REALM
BIKE FACILITY
1
2
21'
12'
13'
20'
12'
20' 1
2'
20'
10'
10'x 80'TRANSIT AREA
SC
SC
1
A
1
2
A
2
A TYPICAL SECTION - LANDSCAPED BUFFER BIKEWAY
OR
Note: Concepts are preliminary, and forplanning purposes only. Concept will requiremore detailed engineering investigation, andevaluation and as such is subject to change.
Figure 18Concept Design - One-Way 1-2C
Hennepin and 1st Avenue Transportation Study

SC
SC
LEGEND
X
X
SHEET 1
CONCEPT 2-1BHennepin Ave/1st Ave Northeast Transportation Study
E N G I N E E R I N G
ALLIANT
E Hennepin Ave
1st A
ve N
E
PERIMETER 30 FT
REM 35 SF
AREA 15 SF
PERIMETER 30 FT
REM 35 SF
AREA 15 SF11' LANE
11' LANE
PERIMETER 30 FT
REM 35 SF
AREA 15 SF
8' BIKE LANE
8' PARKING
11' LANE
11' LANE
8' BIKE LANE
8' PARKING
7' PLANTING AREA7' PLANTING AREA
8' PARKING
PERIMETER 30 FT
REM 35 SF
AREA 15 SF
PERIMETER 30 FT
REM 35 SF
AREA 15 SF
8' BIKE LANE
11' LANE
11' LANE
7' PLANTING AREA
PERIMETER 30 FT
REM 35 SF
AREA 15 SF
11' LANE
11' LANE
8' PARKING
PERIMETER 30 FT
REM 35 SF
AREA 15 SF
PERIMETER 30 FT
REM 35 SF
AREA 15 SF11' LANE
11' LANE
PERIMETER 30 FT
REM 35 SF
AREA 15 SF
AREA 2
6 SQ F
T
PERI
METE
R 50
FT
REM
95 S
Q FT11' LANE
13' LANE11'
LANE
AREA 2
6 SQ F
T
PERI
METE
R 50
FT
REM
95 S
Q FT
11'
LANE
AREA 2
6 SQ F
T
PERI
METE
R 50
FTRE
M 95 S
Q FT
13'
LANE
PERIMETER 30 FTREM 35 SFAREA 15 SF
PERIMETER 30 FT
REM 35 SF
AREA 15 SF
PERIMETER 30 FT
REM 35 SF
AREA 15 SF
PERIMETER 30 FT
REM 35 SF
AREA 15 SF
AREA 26 SQ FT
PERIMETER 50FT
REM 95 SQ FT
PERIMETER 30 FT
REM 35 SF
AREA 15 SF
AREA = 15 SQ'
REM = 48 SQ '
PERIMETER = 30 '
4T
H
ST
NE
AREA = 1
5 SQ'
REM
= 48 S
Q '
PERI
METE
R =
30 ' 11' LANEAR
EA = 1
5 SQ'
REM
= 48 S
Q '
PERI
METE
R =
30 '
PERIMETER 30 FT
REM 35 SF
AREA 15 SF 11' LANEPERIMETER 30 FT
REM 35 SF
AREA 15 SF 11' LANE
AREA = 1
5 SQ'
REM
= 48 S
Q '
PERI
METE
R =
30 '
AREA = 1
5 SQ'
REM
= 48 S
Q '
PERI
METE
R =
30 ' 11' LANE
13' LANE
2nd
St
NE
MAI
N
ST
NE
PERIMETER 30 FT
REM 35 SF
AREA 15 SF
AREA 2
6 SQ F
T
PERI
METE
R 50
FT
REM
95 S
Q FT
11' LANE 11' LANE
AREA = 15 SQ'
REM = 48 SQ '
PERIMETER = 30 '
AREA = 15 SQ'
REM = 48 SQ '
PERIMETE R = 30 '
13' LANE
AV
E
UNI
VE
RSI
TY
8' PARKING
1' GUTTER ON TRAVEL LANE SIDE
7' PLANTER AREA - INCLUDES
TRAFFIC SIGNAL
REMOVE BUS STOP
RELOCATED BUS STOP
EXISTING BUS STOP
WIDENING
POTENTIAL PEDESTRIAN REALM
EXISTING PEDESTRIAN REALM
BIKE FACILITY
STREETCAR LANE LOCATIONASSIGNMENT
RECONFIGURE 7TH ST NE LANE
ADD ADDITONAL SIDEWALK
OPPORTUNITY TO CORRECT SKEW
ADD CURB EXTENSION
POTENTIAL OPPORTUNITY TO
LANE TO LEFT LANE
TRANSITION STREETCAR FROM RIGHT
DEDICATED RIGHT TURN LANE TO
FOR DEDICATED RIGHT TURN LANE
7' STANDARD BIKE LANE TO ALLOW
7' BIKE LANE WITH 3' BUFFER
ON EACH SIDE (REQUIRES VARIANCE)
4' BIKE LANES WITH 1' BUFFER
WITH 7' LANDSCAPED BUFFER
8' RAISDED PROTECTED BIKE LANE
14'
12'
10'
13'
12'
19'
11'
8'
9'
23'
6'1
0'
12'
8'
16'
16'
15'
15'
8'
4'
12' 2
0'
20'
12' 1
1'
20' 2
0'
11'
11'
13'
4
5
6
7
8
9
3
2
1
18'
10'x100'TRANSIT AREA10'x 100'TRANSIT AREA
PERIMETER 30 FT
REM 35 SF
AREA 15 SF
PERIMETER 30 FT
REM 35 SF
AREA 15 SF
PERIMETER 30 FT
REM 35 SF
AREA 15 SF
SC
MA
TC
H LIN
E
EXCLUSIVE LEFT TURN LANE
•STREETCAR ALIGNMENT REQUIRES AN
•SWITCH STREETCAR FROM LEFT TO RIGHT
•EXCLUSIVE STREETCAR SIGNAL PHASE
EXAMPLE TRANSIT SHELTER/BIKE LANE FACILITY EXAMPLE STREET TO SIDEWALK TRANSITION
8' BIKE LANE10'x100'TRANSIT AREA
1 12 1 2 1
22
1
2
6
66
66 66
TYPICAL SECTION - LANDSCAPED BUFFER BIKEWAY
5
PARKING REMOVAL REQUIRED
17'
DCBA
B B
B
C
C
C
D D B
OFFSTREET PROTECTED BIKE LANE
•BIKE FACILITY AT STREET GRADE
•SWITCH STREETCAR FROM RIGHT TO LEFT
•EXCLUSIVE STREETCAR SIGNAL PHASE
1
10'x100'TRANSIT AREA
RELOCATE STREETCAR LANE CHANGE
•MAY NEED TO RELOCATE TRANSIT STOP OR
SIDEWALK WIDTH
•TRANSIT AREA AND BIKE FACILITY EXCEEDS
TYPICAL SECTION - LANDSCAPED BUFFER BIKEWAYA TYPICAL SECTION - RAISED PROTECTED BIKEWAYD
PARKING REMOVAL REQUIRED
A DORA DORA DOR A
A
DOR
A DOR
Note: Concepts are preliminary, and forplanning purposes only. Concept will requiremore detailed engineering investigation, andevaluation and as such is subject to change.
Figure 19Concept Design - One-Way 2-1B
Sheet 1 of 2
Hennepin and 1st Avenue Transportation Study
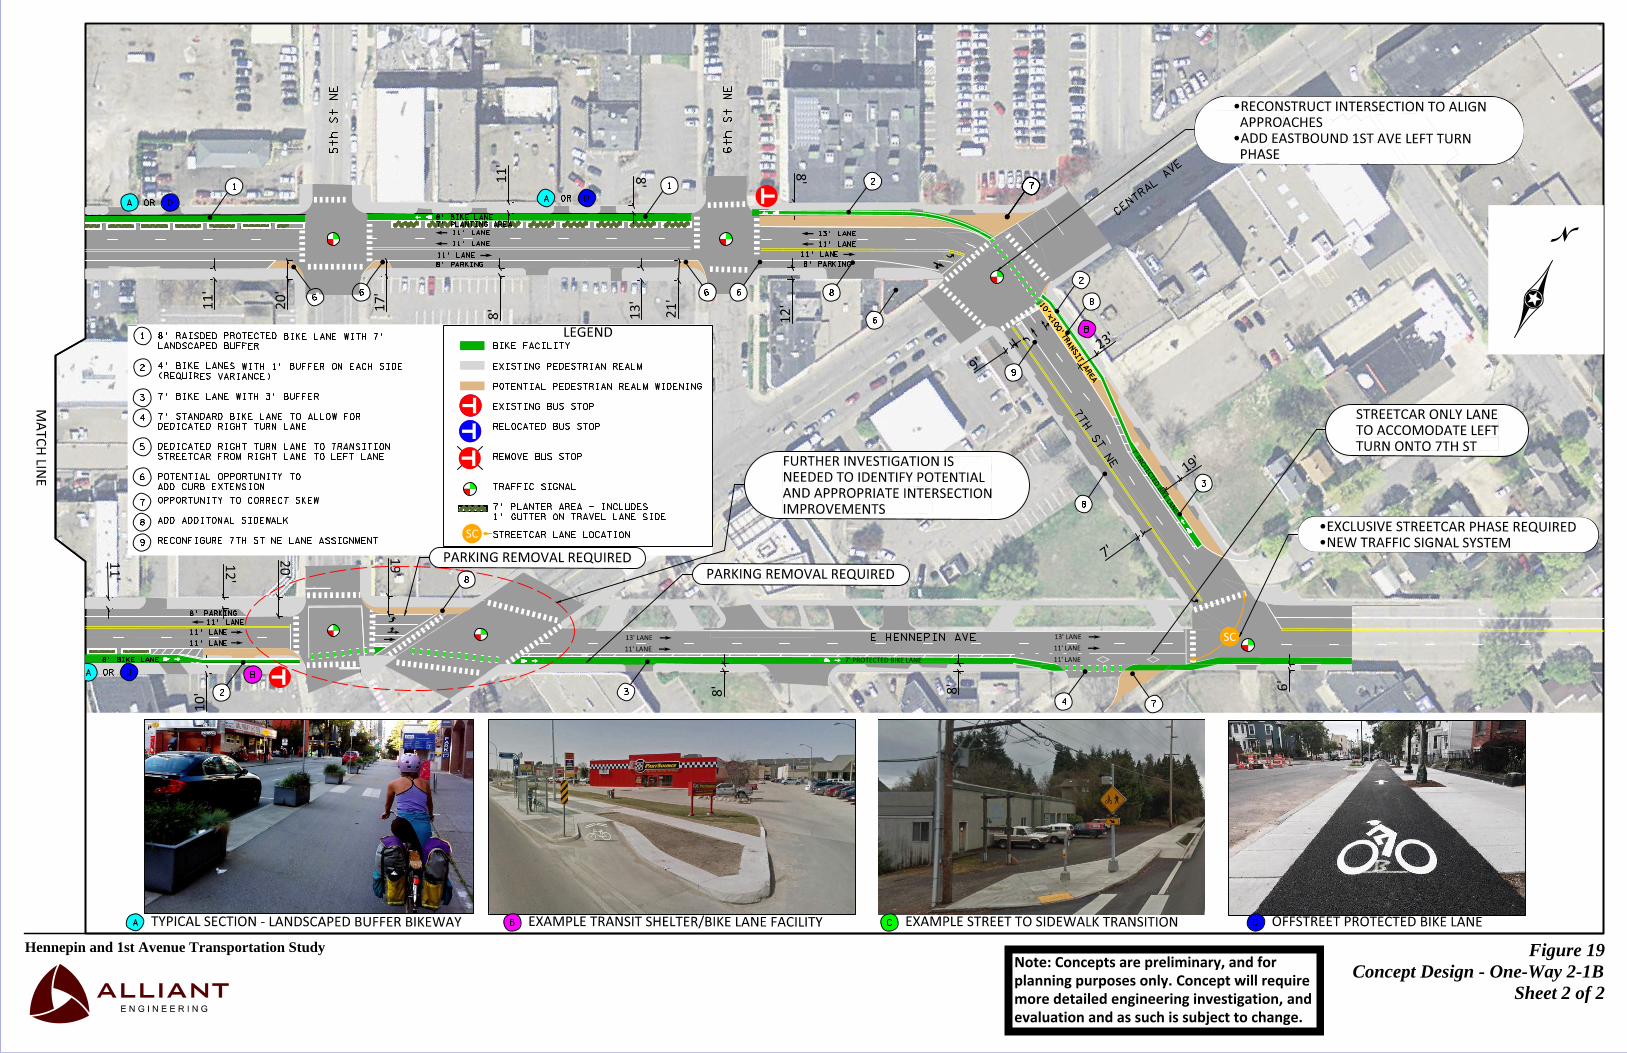
LEGEND
X
X
SHEET 2
CONCEPT 2-1BHennepin Ave/1st Ave Northeast Transportation Study
E N G I N E E R I N G
ALLIANT
8' PARKING
PERIMETER 30 FT
REM 35 SF
AREA 15 SF
PERIMETER 30 FT
REM 35 SF
AREA 15 SF11' LANE
11' LANE
PERIMETER 30 FT
REM 35 SF
AREA 15 SF
CE
NTR
AL
AVE
E HENNEPIN AVE
7T
H S
T
NE
AREA 26 SQ FT
PERIMETER 50FT
REM 95 SQ FT
PERIMETER 30 FT
REM 35 SF
AREA 15 SF
PERIMETER 30 FT
REM 35 SF
AREA 15 SF13' LANE
PERIMETER 30 FT
REM 35 SF
AREA 15 SF11' LANE
PERIMETER 30 FT
REM 35 SF
AREA 15 SF13' LANE
PERIMETER 30 FT
REM 35 SF
AREA 15 SF11' LANE
11' LANE
8' PARKING
PERIMETER 30 FT
REM 35 SF
AREA 15 SF11' LANE
PERIMETER 30 FT
REM 35 SF
AREA 15 SF 11' LANE
7' PLANTING AREA
8' BIKE LANE
8' PARKING
5t
h
St
NE
6t
h
St
NE
11' LANE
AREA 26 S
Q FT
PERIMETER 50FT
REM 95 S
Q FT
AREA = 15 SQ'
REM = 48 SQ '
PERIMETER = 30 '
11' LANE
11' LANE
PERIMETER 30 FT
REM 35 SF
AREA 15 SF
PERIMETER 30 FT
REM 35 SF
AREA 15 SF
PERIMETER 30 FT
REM 35 SF
AREA 15 SFAREA = 15 SQ'REM = 48 SQ '
PERIMETER = 30 '
PERIMETER 30 FT
REM 35 SF
AREA 15 SF 13' LANE
11' LANE
PERIMETER 30 FT
REM 35 SF
AREA 15 SF
AREA = 15 SQ'
REM = 48 SQ '
PERIMETER = 30 '
RECONFIGURE 7TH ST NE LANE ASSIGNMENT
ADD ADDITONAL SIDEWALK
OPPORTUNITY TO CORRECT SKEW
1' GUTTER ON TRAVEL LANE SIDE
7' PLANTER AREA - INCLUDES
TRAFFIC SIGNAL
REMOVE BUS STOP
RELOCATED BUS STOP
EXISTING BUS STOP
POTENTIAL PEDESTRIAN REALM WIDENING
EXISTING PEDESTRIAN REALM
BIKE FACILITY
STREETCAR LANE LOCATION
7' PROTECTED BIKE LANE
ADD CURB EXTENSION
POTENTIAL OPPORTUNITY TO
STREETCAR FROM RIGHT LANE TO LEFT LANE
DEDICATED RIGHT TURN LANE TO TRANSITION
DEDICATED RIGHT TURN LANE
7' STANDARD BIKE LANE TO ALLOW FOR
7' BIKE LANE WITH 3' BUFFER
(REQUIRES VARIANCE)
4' BIKE LANES WITH 1' BUFFER ON EACH SIDE
LANDSCAPED BUFFER
8' RAISDED PROTECTED BIKE LANE WITH 7'
12'
8'
8'
11'
20'
12'
20'
11'
8'
13'
21'
17'
11'
10'
1
2
3
4
5
6
7
8
9
19'
8' BIKE LANE
10'x100'
TR
ANSI
T
AR
EA
SC
PERIMETER 30 FT
REM 35 SF AREA 15 SF
PERIMETER 30 FT
REM 35 SF
AREA 15 SF
SC
7' P
RO
TECTED BIK
E LA
NE
MA
TC
H LIN
E
PARKING REMOVAL REQUIRED
TURN ONTO 7TH ST
TO ACCOMODATE LEFT
STREETCAR ONLY LANE
•NEW TRAFFIC SIGNAL SYSTEM
•EXCLUSIVE STREETCAR PHASE REQUIRED
8'
8' 6'
7'
3
4
7
7
9
11
66 66
EXAMPLE TRANSIT SHELTER/BIKE LANE FACILITY EXAMPLE STREET TO SIDEWALK TRANSITIONTYPICAL SECTION - LANDSCAPED BUFFER BIKEWAY DCBA OFFSTREET PROTECTED BIKE LANE
IMPROVEMENTS
AND APPROPRIATE INTERSECTION
NEEDED TO IDENTIFY POTENTIAL
FURTHER INVESTIGATION IS
2
6
8
PHASE
•ADD EASTBOUND 1ST AVE LEFT TURN
APPROACHES
•RECONSTRUCT INTERSECTION TO ALIGN
72
7
8
PARKING REMOVAL REQUIRED
3
23'
9'
8
8
B
19'
BA DOR
A DORA DOR
2
Note: Concepts are preliminary, and forplanning purposes only. Concept will requiremore detailed engineering investigation, andevaluation and as such is subject to change.
Figure 19Concept Design - One-Way 2-1B
Sheet 2 of 2
Hennepin and 1st Avenue Transportation Study

2nd St to 4th St (2-Blocks)
Concept 2-1C
LEGEND
8' PARKING
PERI
MET
ER 3
0 FT
REM
35 S
F
AREA 1
5 SF
11' LANE
PERIMETER 30 FT
REM
35 SF
AREA 15 SF
11' LANE
PERIMETER 30 FT
REM
35 SF
AREA 15 SF12' LANE
8' PARKING
UNI
VE
RSI
TY
AV
E
4T
H
ST
NE
2nd
ST
NE
11' LANE
PERIMETER 30 FT
REM
35 SF
AREA 15 SF
12' LANE PERIMETER 30 FT
REM
35 SF
AREA 15 SF
11' LANEPERI
MET
ER 3
0 FT
REM
35 S
F
AREA 1
5 SF
8' PARKING8' PARKING
12'
21'
20'
20' 1
2'
20'
NOTES:
CONCEPT 1-2B INSET
CONCEPT 2-1C INSETHennepin Ave/1st Ave Northeast Transportation Study
E N G I N E E R I N G
ALLIANT
STREETCAR LANE LOCATION
TRAFFIC SIGNAL
REMOVE BUS STOP
WIDENING
POTENTIAL PEDESTRIAN REALM
EXISTING PEDESTRIAN REALM
BIKE FACILITY
LOSS OF PEDESTRIAN SPACE
CURB EXTENSION
POTENTIAL OPPORTUNITY TO ADD
WITH 1' BUFFER ON EACH SIDE
4' RAISED PROTECTED BIKE LANES
STREETCAR LANE LOCATION
1' GUTTER ON TRAVEL LANE SIDE
6' PLANTER AREA - INCLUDES
TRAFFIC SIGNAL
REMOVE BUS STOP
WIDENING
POTENTIAL PEDESTRIAN REALM
EXISTING PEDESTRIAN REALM
BIKE FACILITY
1
2
3
10'x 120'TRANSIT AREA
SC
SC
EXAMPLE STREET TO SIDEWALK TRANSITIONA
AA
2
1 122
2
2
18'
5.5'9'
18'
B OFFSTREET PROTECTED BIKE LANE
B B
33
ElevatedCycletrack
Note: Concepts are preliminary, and forplanning purposes only. Concept will requiremore detailed engineering investigation, andevaluation and as such is subject to change.
Figure 20 Concept Design - One-Way 2-1C
Hennepin and 1st Avenue Transportation Study

Hennepin and 1st Avenue Transportation Study
47
Alliant No. 115-0063
5.0 Evaluation of Alternatives
A comparison evaluation was conducted for the six corridor level concept designs to assess their
individual benefits and impacts to the street system and users. The evaluation focuses on the key
objectives and neighborhood priorities. A detailed traffic operation analysis documenting the
quality of motor vehicle access and mobility, and the benefits and impacts (i.e., pros and cons)
associated with any potential implementation of the concept designs is documented.
Concept Design Alternatives Evaluation Matrix
A comparison matrix summarizing a high level qualitative evaluation of the leading six corridor
level concept designs (three one-way and three two-way) is shown in Table 12. The evaluation
illustrates a qualitative rating of “best meets objectives”, “partially meets objectives”, and “does
not meet objectives” for each of the five primary objective categories. Table 13 documents a
summary comparison of each leading alternative against the primary tradeoffs – travel lanes,
pedestrian space, transit, bicycle lanes, and on-street parking.
Table 12. Concept Design Alternatives Qualitative Evaluation Matrix

Hennepin and 1st Avenue Transportation Study
48
Alliant No. 115-0063
Table 13. Concept Design Comparison Summary
One-way Alternatives

Hennepin and 1st Avenue Transportation Study
49
Alliant No. 115-0063
Table 13. Concept Design Comparison Summary Continued
Two-way Alternatives
Motor Vehicle Mobility and Access
Maintaining motor vehicle mobility, circulation and access is a key objective in evaluating the
concept design alternatives for the Hennepin and 1st Avenue area. Equally important is determining
the potential impacts (e.g., transit reliability, pedestrian and bicycle safety, air quality and motor
vehicle safety) resulting from increased congestion levels through the corridor. A traffic operation
analysis was conducted to compare the relative performance of the design concepts, quantify
measures of effectiveness and generate key conclusions.

Hennepin and 1st Avenue Transportation Study
50
Alliant No. 115-0063
5.2.1 Approach
The Hennepin, Central, and 1st Avenue street network is a complex and dynamic system, including
many variables that influence mobility. Due to the interaction of closely spaced traffic signals on
a grid network system, the traffic mobility of the corridor was evaluated using micro-simulation
traffic modeling. The traffic operation analysis was completed using VISSIM modeling software.
Key elements accounted for include:
Metro Transit bus routes, schedules and station stops
Planned streetcar operation, alignment alternatives and station stops
Bicycle and pedestrian interaction at intersections.
The VISSIM modeling allows for evaluation of detailed motor vehicle traffic assignment matrices,
detailed bus route schedules and stop locations, streetcar operation and unique signal phasing,
pedestrians and bicycles and a refined evaluation of lane configurations. VISSIM is a standard
industry micro-simulation model that is used worldwide for similar applications and has been used
on many projects throughout the City of Minneapolis. The model is calibrated to the existing traffic
signal timings, traffic volumes; and replicates the existing real world traffic operations, vehicle
flows and travel times along Hennepin and 1st Avenues. The use of a calibrated traffic simulation
model produces reasonable results and is a useful tool to help inform the design and evaluation
process; however, engineering judgement along with many other traffic operation variables and
considerations are also made. Although there are some differences between the typical cross-
sections as it relates to various styles of bicycle lane design, sidewalk widths and on street parking
locations, these details are inconsequential to the traffic operation analysis. Therefore, several
typical sections can be expected to generally have the same level of motor vehicle mobility and
are evaluated as a single scenario. Table 14 below summarizes the traffic operation analysis
scenarios along with the corresponding concept alternative.
Table 14. Traffic Operation Analysis Scenario Matrix
5.2.2 Planned Streetcar
The operation and alignment of the planned modern streetcar system through the study area is an
important consideration in the traffic operation analysis. The streetcar vehicle operational
characteristics, alignment, station locations, and station dwell times may influence mobility. Key
streetcar design and operation assumptions made are consistent with the Nicollet-Central Modern
Facility Typical Concept DescriptionTraffic
Volumes
One Way Existing Existing Conditions 2015
One Way Existing Nobuild - No Streetcar 2015
One Way Existing & 1-2B Nobuild - Left Side Streetcar 2035
One Way 1-2C 3 Travel Lanes, Right Side Streetcar 2035
One Way 1-1B 2 Travel Lanes, Right Side Streetcar 2035
Two Way 2-1A, 2-1B, 2-1C 3 Travel Lanes 2015
Two Way 2-1A, 2-1B, 2-1C 3 Travel Lanes 2035

Hennepin and 1st Avenue Transportation Study
51
Alliant No. 115-0063
Streetcar Environmental Assessment (Streetcar EA). Other considerations accounted for within
the evaluation of each concept alternative include:
Streetcar Alignment. The current streetcar alignment identifies left-side operations across
the Hennepin Avenue Bridge. This alignment is conducive to a left side operation within
the Hennepin and 1st Avenue NE study area and extending further north on Central Avenue,
but does not preclude the possibility of a right side streetcar alignment. The operations
and maintenance facility site has not yet been determined, which will have to be taken into
consideration when determining the streetcar alignment
Alignment Transition. The evaluation of the right side streetcar alignment assumes a
dedicated traffic signal phase at intersections where an alignment transition occurs.
Station Locations. The alignment (right or left side) and the station locations are generally
consistent with the Council-approved locally preferred alternative. A dwell time of twenty
(20) seconds was assumed for each station to account for passenger boarding and alighting.
For those alternatives where a right side streetcar alignment is shown, the analysis
concluded that a lane transition is problematic near the Central/Hennepin/1st Avenue
Triangle. This resulted in a modified concept as compared to the current LPA alignment,
which resulted in an alignment that continues northeast along Hennepin Avenue before
routing back to 1st Avenue via 7th Street.
Evaluation of the planned modern streetcar components are estimated and are included to account
for any mobility impacts related to the concept alternatives. Transit signal priority (TSP) operation
is not evaluated in this analysis. Although TSP may have some limited travel time benefit, the
delay impact to motor vehicle and non-motorized movements at critical intersections require
evaluation. Within high pedestrian environments, the automatic recall (no pedestrian push button)
for the pedestrian clearance intervals need to be maintained, which further limits the potential
advantage of TSP. Further evaluation will be necessary to define design details, including the
benefit and impact of TSP if and when the streetcar or the concepts developed within this study
move forward.
5.2.3 Results
The quality of mobility is measured through the computation of Level of Service (LOS), estimation
of motor vehicle and transit vehicle travel times, network performance analysis, and overall
congestion assessment.
Level of Service
The concept of LOS is a method to estimate the quality of traffic flow through intersections and
along segments of roadway. In general, the capacity of a street is a measure of its ability to
accommodate a certain volume of moving vehicles. Typically, street capacity refers to the
maximum number of vehicles that can be expected to be accommodated in a given time period
under the prevailing roadway characteristics and conditions.
The LOS methodology is standardized by the Transportation Research Board (TRB) and is applied
uniformly regardless of jurisdictional boundaries. The method uses algorithms that are based on
delay and drivers’ expectations of acceptable delay or traffic flow to assign a LOS for particular

Hennepin and 1st Avenue Transportation Study
52
Alliant No. 115-0063
conditions. The results are then categorized on an LOS A to LOS F scale. LOS A represents high
quality traffic operations where motorists experience little or no delay (i.e. free flow conditions).
Conversely, LOS F corresponds to low quality operations with higher delays or potentially
congestion.
The LOS criteria as defined by the HCM for both signalized intersections and urban arterials is
illustrated in Table 15.
Table 15. Level of Service Description
The overall intersection delay comparison for each scenario under the a.m., off peak (i.e., 9:00
a.m. to 3:00 p.m.) and p.m. peak periods is shown in Figure 21, Figure 22 and Figure 23,
respectively.
The intersection LOS analysis indicates acceptable intersection operations, except that the p.m.
peak period is expected to be most problematic. The Hennepin Avenue and Main Street
intersection is expected to operate at LOS E during the p.m. peak period under both the one-way
two lane and the two-way scenarios. This intersection will facilitate the streetcar left side to right
side alignment transition and also serves as a bottleneck (three lanes exiting downtown
transitioning to two lanes into Northeast). There are a number of factors that contribute to the
conclusions found:
Source: Highway Capacity Manual, 2010 Edition, Transportation Research Board, Exhibit 18-4 for
Signalized Intersections and Exhibit 16-4 for Urban Street Facilities.
Base Speed
(30 mph)
Average
Travel Speed
(mph)
>26
>20
>15
>12
Description
Free Flow. Low volumes and no delays.
Stable Flow. Speeds restricted by travel conditions,
minor delays.
Stable Flow. Speeds and maneuverability closely
controlled due to higher volumes.
Stable Flow. Speeds considerably affected by
change in operating conditions. High density traffic
restricts maneuverability, volume near capacity.
Unstable Flow. Low speeds, considerable delay,
volume at or slightly over capacity.
Forced Flow. Very low speeds, volumes exceed
capacity, long delays with stop and go traffic.
Signalized
Intersection
0 - 10
>35 - 55
>55 - 80
C
D
E
F > 80
LOS
Intersection
Delay
(Seconds /
Vehicle)
A
B >10 - 20
>20 - 35
Urban Street
LOS
>9
<=9

Hennepin and 1st Avenue Transportation Study
53
Alliant No. 115-0063
The traffic patterns are generally directional, with high southbound 1st Avenue volumes
during the morning (entering downtown) and high northbound volumes on Hennepin
Avenue exiting the downtown.
In addition to the high commuter traffic volume exiting the downtown, there is a much
greater commercial destination and non-work based trips during the p.m. peak period.
1st Avenue generally operates better due to the traffic signal and intersection spacing. The
traffic volume is effectively metered in by side streets and doesn’t reach the highest volume
level until entering downtown. In addition, the corridor is not impacted by the six legged
Central Triangle intersection bottleneck.
The highest traffic volumes on Hennepin Avenue are concentrated on the Hennepin
Avenue Bridge, exiting downtown, and approach the first traffic signal system at their
highest level. The Hennepin/Main Street intersection represents the bottleneck from 3-
lanes to 2-lanes under certain concepts evaluated. Complicating the operation of the
bottleneck are transit stops occurring in the right lane, which at times renders the corridor
to operating with only one effective moving lane.
The Hennepin/Central/5th Triangle is a complex six-legged intersection that introduces an
additional bottleneck.
Figure 21. Overall Intersection Delay (seconds/vehicle) Comparison – AM Peak Period
HennepinAve andMain St
HennepinAve and2nd St
HennepinAve and
UniversityAve
HennepinAve and 4th
St
HennepinAve and
Central Aveand 5th St
HennepinAve and 7th
St
HennepinAve and 8th
St
1st Ave andMain St
1st Ave and2nd St
1st Ave andUniversity
Ave
1st Ave and4th St
Central Aveand
UniversityAve
Central Aveand 4th St
Central Aveand 7th St
Existing Conditions 15.3 11.0 10.6 5.6 34.8 12.7 10.6 8.1 13.6 15.2 18.1 16.4 21.1
2-Way - 2015 18.2 15.4 12.8 5.7 33.7 5.5 16.9 12.6 8.7 16.4 13.9 16.8 15.7 25.9
One-Way NobuildNo Streetcar - 2035
14.8 11.3 11.6 5.8 35.4 14.9 10.6 8.1 13.1 15.6 18.2 16.1 23.3
One-Way NobuildLeft Side Streetcar - 2035
14.9 12.0 12.0 6.0 35.4 15.0 11.1 9.5 13.6 15.5 18.1 16.1 23.3
One-Way 3 Lane Right SideStreetcar Operation - 2035
20.7 11.8 12.3 6.5 35.0 4.7 14.2 11.4 9.1 13.3 15.0 18.4 15.4 20.5
One-Way 2 Lane Right SideStreetcar Operation - 2035
21.6 17.1 14.0 9.3 35.0 5.0 14.4 14.0 12.7 17.7 22.1 18.8 15.4 19.3
2-Way Right SideStreetcar Operation - 2035
20.4 15.2 15.3 8.9 34.8 6.5 16.4 13.0 11.4 19.5 15.7 19.0 16.3 28.4
0.0
5.0
10.0
15.0
20.0
25.0
30.0
35.0
40.0
45.0
50.0
55.0
SEC
ON
DS
PER
VEH
ICLE
LOS B
LOS A
LOS C
LOS D
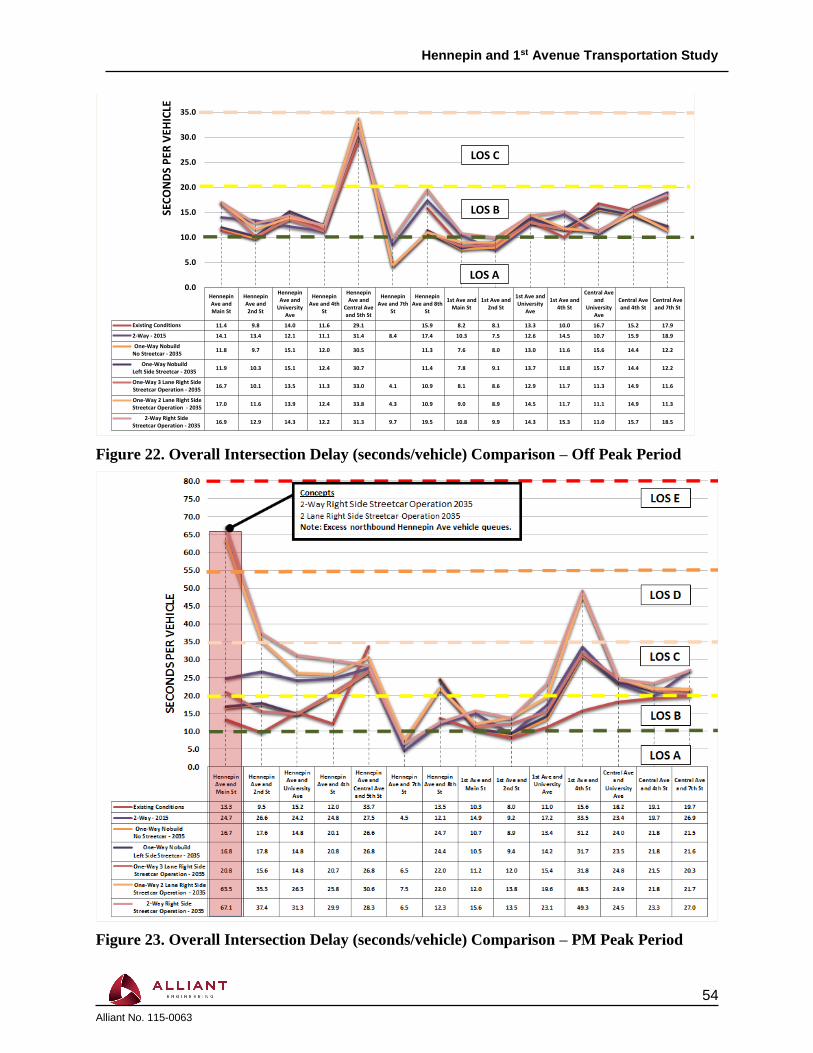
Hennepin and 1st Avenue Transportation Study
54
Alliant No. 115-0063
Figure 22. Overall Intersection Delay (seconds/vehicle) Comparison – Off Peak Period
Figure 23. Overall Intersection Delay (seconds/vehicle) Comparison – PM Peak Period
HennepinAve andMain St
HennepinAve and2nd St
HennepinAve and
UniversityAve
HennepinAve and 4th
St
HennepinAve and
Central Aveand 5th St
HennepinAve and 7th
St
HennepinAve and 8th
St
1st Ave andMain St
1st Ave and2nd St
1st Ave andUniversity
Ave
1st Ave and4th St
Central Aveand
UniversityAve
Central Aveand 4th St
Central Aveand 7th St
Existing Conditions 11.4 9.8 14.0 11.6 29.1 15.9 8.2 8.1 13.3 10.0 16.7 15.2 17.9
2-Way - 2015 14.1 13.4 12.1 11.1 31.4 8.4 17.4 10.3 7.5 12.6 14.5 10.7 15.9 18.9
One-Way NobuildNo Streetcar - 2035
11.8 9.7 15.1 12.0 30.5 11.3 7.6 8.0 13.0 11.6 15.6 14.4 12.2
One-Way NobuildLeft Side Streetcar - 2035
11.9 10.3 15.1 12.4 30.7 11.4 7.8 9.1 13.7 11.8 15.7 14.4 12.2
One-Way 3 Lane Right SideStreetcar Operation - 2035
16.7 10.1 13.5 11.3 33.0 4.1 10.9 8.1 8.6 12.9 11.7 11.3 14.9 11.6
One-Way 2 Lane Right SideStreetcar Operation - 2035
17.0 11.6 13.9 12.4 33.8 4.3 10.9 9.0 8.9 14.5 11.7 11.1 14.9 11.3
2-Way Right SideStreetcar Operation - 2035
16.9 12.9 14.3 12.2 31.3 9.7 19.5 10.8 9.9 14.3 15.3 11.0 15.7 18.5
0.0
5.0
10.0
15.0
20.0
25.0
30.0
35.0
40.0
45.0
50.0
55.0
SEC
ON
DS
PER
VEH
ICLE
LOS B
LOS A
LOS C
LOS D

Hennepin and 1st Avenue Transportation Study
55
Alliant No. 115-0063
5.2.4 Motor Vehicle and Transit Vehicle Travel Times
One-way to measure the magnitude of the congestion, or delay, can be measured through motor
vehicle, bus transit, and streetcar vehicle travel times. The estimated motor vehicle, bus transit,
and streetcar vehicle travel times on Hennepin Avenue and 1st Avenue for each scenario under the
a.m., off peak and p.m. peak periods are shown in Figure 24, Figure 25 and Figure 26, respectively.
The primary use of this data is to provide a relative comparison between scenarios and to help
assess the estimated change. The travel time data also gives a good indication of anticipated delay
expected with any projected congestion. Travel times are only reported for the Hennepin and 1st
Avenue corridors. The start and end points for motor vehicle, bus transit and streetcar vary between
the corridors to ensure all delay that may be expected with any alternative is measured. Hennepin
Avenue travel time segment begins at 1st Street S (CBD) and is recorded through Hennepin
Avenue/8th Street and the 1st Avenue travel time segment begins at Central Avenue/7th Street and
ends at the bridge just south of Main Street.
The streetcar travel times are expected to be similar to the bus transit travel times during the a.m.
and off peak periods; therefore, were only reported separately for the p.m. peak period. Under the
two congested scenarios (one-way two-lane and two-way operation), the streetcar will be in the
left lane along Hennepin Avenue and given a dedicated signal phase at Main Street to make the
alignment transition. This will be advantageous to the streetcar travel time.
The travel time analysis shows that all the three-lane, one-way scenarios, are expected to operate
similarly and are also expected to be similar to present conditions. The northbound Hennepin
Avenue travel time is expected to nearly triple (from a little over 3 minutes to nearly 9 minutes)
with the reduction from three lanes to two lanes on the one-way scenario. The two-way scenario
is expected to result in minimal additional travel time, compared to the one-way two lane scenario
since the vehicle congestion on the Hennepin Avenue Bridge is similar. The bus transit vehicles
are expected to follow the same trend. Streetcar travel times are expected to be more uniform
across the scenarios, since the streetcar will be in the left lane along Hennepin Avenue and given
a dedicated signal phase at Main Street to make the alignment transition. As a result, the streetcar
traveling in the left lane will be less impacted by queued passenger motorists in the middle and
right lanes on Hennepin Avenue. Vehicle and bus transit travel times are expected to experience
minimal changes along 1st Avenue.

Hennepin and 1st Avenue Transportation Study
56
Alliant No. 115-0063
Hennepin Avenue
1st Avenue
Figure 24. Hennepin Avenue and 1st Avenue Travel Time Comparison – AM Peak Period
3 min 14 secs
3 min 20 secs
3 min 13 secs
3 min 14 secs
3 min 19 secs
4 min 2 secs
3 min 35 secs
6 min 11 secs
6 min 29 secs
6 min 4 secs
6 min 4 secs
6 min 1 secs
7 min 43 secs
6 min 50 secs
-100% -75% -50% -25% 0% 25% 50% 75% 100% 125% 150% 175%
Existing Conditions
2-Way - 2015
One-Way NobuildNo Streetcar - 2035
One-Way NobuildLeft Side Streetcar - 2035
One-Way 3 Lane Right SideStreetcar Operation - 2035
One-Way 2 Lane Right SideStreetcar Operation - 2035
2-Way Right SideStreetcar Operation - 2035
Vehicle Travel Time Bus Travel Time Baseline (% Change) Streetcar
Typical Section: Existing
Typical Section: 2-1A, 2-1B, 2-1C
Typical Section: Existing
Typical Section: Existing & 1-2B
Typical Section: 1-2C
Typical Section: 1-1B
Typical Section: 2-1A, 2-1B, 2-1C
3 min 14 secs
3 min 20 secs
3 min 13 secs
3 min 14 secs
3 min 19 secs
4 min 2 secs
3 min 35 secs
6 min 11 secs
6 min 29 secs
6 min 4 secs
6 min 4 secs
6 min 1 secs
7 min 43 secs
6 min 50 secs
-100% -75% -50% -25% 0% 25% 50% 75% 100% 125% 150% 175%
Existing Conditions
2-Way - 2015
One-Way NobuildNo Streetcar - 2035
One-Way NobuildLeft Side Streetcar - 2035
One-Way 3 Lane Right SideStreetcar Operation - 2035
One-Way 2 Lane Right SideStreetcar Operation - 2035
2-Way Right SideStreetcar Operation - 2035
Vehicle Travel Time Bus Travel Time Baseline (% Change) Streetcar
Typical Section: Existing
Typical Section: 2-1A, 2-1B, 2-1C
Typical Section: Existing
Typical Section: Existing & 1-2B
Typical Section: 1-2C
Typical Section: 1-1B
Typical Section: 2-1A, 2-1B, 2-1C

Hennepin and 1st Avenue Transportation Study
57
Alliant No. 115-0063
Hennepin Avenue
1st Avenue
Figure 25. Hennepin Avenue and 1st Avenue Travel Time Comparison – Off Peak Period
3 min 14 secs
3 min 23 secs
3 min 10 secs
3 min 11 secs
3 min 11 secs
3 min 23 secs
3 min 41 secs
4 min 46 secs
5 min 34 secs
5 min 45 secs
5 min 45 secs
5 min 1 secs
5 min 54 secs
6 min 41 secs
-100% -75% -50% -25% 0% 25% 50% 75% 100% 125%
Existing Conditions
2-Way - 2015
One-Way NobuildNo Streetcar - 2035
One-Way NobuildLeft Side Streetcar - 2035
One-Way 3 Lane Right SideStreetcar Operation - 2035
One-Way 2 Lane Right SideStreetcar Operation - 2035
2-Way Right SideStreetcar Operation - 2035
Vehicle Travel Time Bus Travel Time Baseline (% Change)
Typical Section: Existing
Typical Section: 2-1A, 2-1B, 2-1C
Typical Section: Existing
Typical Section: Existing & 1-2B
Typical Section: 1-2C
Typical Section: 1-1B
Typical Section: 2-1A, 2-1B, 2-1C
1 min 33 secs
1 min 28 secs
1 min 27 secs
1 min 33 secs
1 min 34 secs
1 min 28 secs
1 min 37 secs
3 min 47 secs
3 min 47 secs
3 min 49 secs
3 min 49 secs
3 min 49 secs
3 min 44 secs
3 min 43 secs
-100% -75% -50% -25% 0% 25% 50% 75% 100% 125% 150% 175%
Existing Conditions
2-Way - 2015
One-Way NobuildNo Streetcar - 2035
One-Way NobuildLeft Side Streetcar - 2035
One-Way 3 Lane Right SideStreetcar Operation - 2035
One-Way 2 Lane Right SideStreetcar Operation - 2035
2-Way Right SideStreetcar Operation - 2035
Vehicle Travel Time Bus Travel Time Baseline (% Change)
Typical Section: Existing
Typical Section: 2-1A, 2-1B, 2-1C
Typical Section: Existing
Typical Section: Existing & 1-2B
Typical Section: 1-2C
Typical Section: 1-1B
Typical Section: 2-1A, 2-1B, 2-1C

Hennepin and 1st Avenue Transportation Study
58
Alliant No. 115-0063
Hennepin Avenue
1st Avenue
Figure 26. Hennepin Avenue and 1st Avenue Travel Time Comparison – PM Peak Period
3 min 28 secs
4 min 9 secs
2 min 53 secs
2 min 52 secs
3 min 4 secs
8 min 47 secs
9 min 3 secs
5 min 25 secs
7 min 18 secs
5 min 35 secs
5 min 35 secs
7 min 10 secs
9 min 55 secs
11 min 34 secs
3 min 39 secs
5 min 17 secs
7 min 44 secs
7 min 17 secs
-100% -75% -50% -25% 0% 25% 50% 75% 100% 125% 150% 175% 200% 225% 250% 275% 300%
Existing Conditions
2-Way - 2015
One-Way NobuildNo Streetcar - 2035
One-Way NobuildLeft Side Streetcar - 2035
One-Way 3 Lane Right SideStreetcar Operation - 2035
One-Way 2 Lane Right SideStreetcar Operation - 2035
2-Way Right SideStreetcar Operation - 2035
Vehicle Travel Time Bus Travel Time Streetcar Baseline (% Change)
Typical Section: Existing
Typical Section: 2-1A, 2-1B, 2-1C
Typical Section: Existing
Typical Section: Existing & 1-2B
Typical Section: 1-2C
Typical Section: 1-1B
Typical Section: 2-1A, 2-1B, 2-1C
1 min 21 secs
2 min 17 secs
1 min 58 secs
1 min 60 secs
2 min 3 secs
3 min 27 secs
2 min 43 secs
3 min 1 secs
4 min 38 secs
3 min 39 secs
3 min 39 secs
3 min 47 secs
5 min 41 secs
4 min 4 secs
3 min 2 secs
5 min 21 secs
6 min 38 secs
5 min 34 secs
-100% -50% 0% 50% 100% 150% 200% 250% 300% 350% 400%
Existing Conditions
2-Way - 2015
One-Way NobuildNo Streetcar - 2035
One-Way NobuildLeft Side Streetcar - 2035
One-Way 3 Lane Right SideStreetcar Operation - 2035
One-Way 2 Lane Right SideStreetcar Operation - 2035
2-Way Right SideStreetcar Operation - 2035
Vehicle Travel Time Bus Travel Time Streetcar Baseline (% Change)
Typical Section: Existing
Typical Section: 2-1A, 2-1B, 2-1C
Typical Section: Existing
Typical Section: Existing & 1-2B
Typical Section: 1-2C
Typical Section: 1-1B
Typical Section: 2-1A, 2-1B, 2-1C

Hennepin and 1st Avenue Transportation Study
59
Alliant No. 115-0063
Total Network Delay
Another useful comparison is to evaluate the overall network performance. The network delay
comparison captures delay incurred at other intersections in the study area that may be impacted
by signal timing strategies used to improve mobility along Hennepin or 1st Avenue, or from
residual congestion within the network. Figure 27 illustrates the overall network delay and percent
changes from the existing or nobuild scenarios. The analysis indicates that during the p.m. peak period, the one-way (2-lane) and the two-way
scenario are expected to experience a large increase in overall delay. Compared to the existing
2015 conditions, an estimate 37% and 52% increase in delay is expected. When comparing the
forecast 2035 one-way, 2-lane, and two-way scenarios, the overall network delay is expected to be
nearly double that of present conditions.
AM Peak Hour
Figure 27. Total Network Delay Comparison
95
112
108
111
117
131
135
Existing Conditions
2-Way - 2015
One-Way NobuildNo Streetcar - 2035
One-Way NobuildLeft Side Streetcar - 2035
One-Way 3 Lane Right SideStreetcar Operation - 2035
One-Way 2 Lane Right SideStreetcar Operation - 2035
2-Way Right SideStreetcar Operation - 2035
Total Network Delay (hr)
18% Increase
5% Increase
18% Increase
22% Increase
2% Increase from NoStreetcar to Streetcar
Existing Conditions Baseline
2035 Nobuild Baseline
Typical Section: Existing
Typical Section: 2-1A, 2-1B, 2-1C
Typical Section: Existing
Typical Section: Existing & 1-2B
Typical Section: 1-2C
Typical Section: 1-1B
Typical Section: 2-1A, 2-1B, 2-1C
14% Increase

Hennepin and 1st Avenue Transportation Study
60
Alliant No. 115-0063
Off Peak Hour
PM Peak Hour
Figure 27. Total Network Delay Comparison Continued
95
112
108
111
117
131
135
Existing Conditions
2-Way - 2015
One-Way NobuildNo Streetcar - 2035
One-Way NobuildLeft Side Streetcar - 2035
One-Way 3 Lane Right SideStreetcar Operation - 2035
One-Way 2 Lane Right SideStreetcar Operation - 2035
2-Way Right SideStreetcar Operation - 2035
Total Network Delay (hr)
18% Increase
5% Increase
18% Increase
22% Increase
2% Increase from NoStreetcar to Streetcar
Existing Conditions Baseline
2035 Nobuild Baseline
Typical Section: Existing
Typical Section: 2-1A, 2-1B, 2-1C
Typical Section: Existing
Typical Section: Existing & 1-2B
Typical Section: 1-2C
Typical Section: 1-1B
Typical Section: 2-1A, 2-1B, 2-1C
14% Increase
125
170
176
177
185
243
251
Existing Conditions
2-Way - 2015
One-Way NobuildNo Streetcar - 2035
One-Way NobuildLeft Side Streetcar - 2035
One-Way 3 Lane Right SideStreetcar Operation - 2035
One-Way 2 Lane Right SideStreetcar Operation - 2035
2-Way Right SideStreetcar Operation - 2035
Total Network Delay (hr)
36% Increase
4% Increase
37% Increase
42% Increase
1% Increase from NoStreetcar to Streetcar
Existing Conditions Baseline
2035 Nobuild Baseline
Typical Section: Existing
Typical Section: 2-1A, 2-1B, 2-1C
Typical Section: Existing
Typical Section: Existing & 1-2B
Typical Section: 1-2C
Typical Section: 1-1B
Typical Section: 2-1A, 2-1B, 2-1C
40% Increase
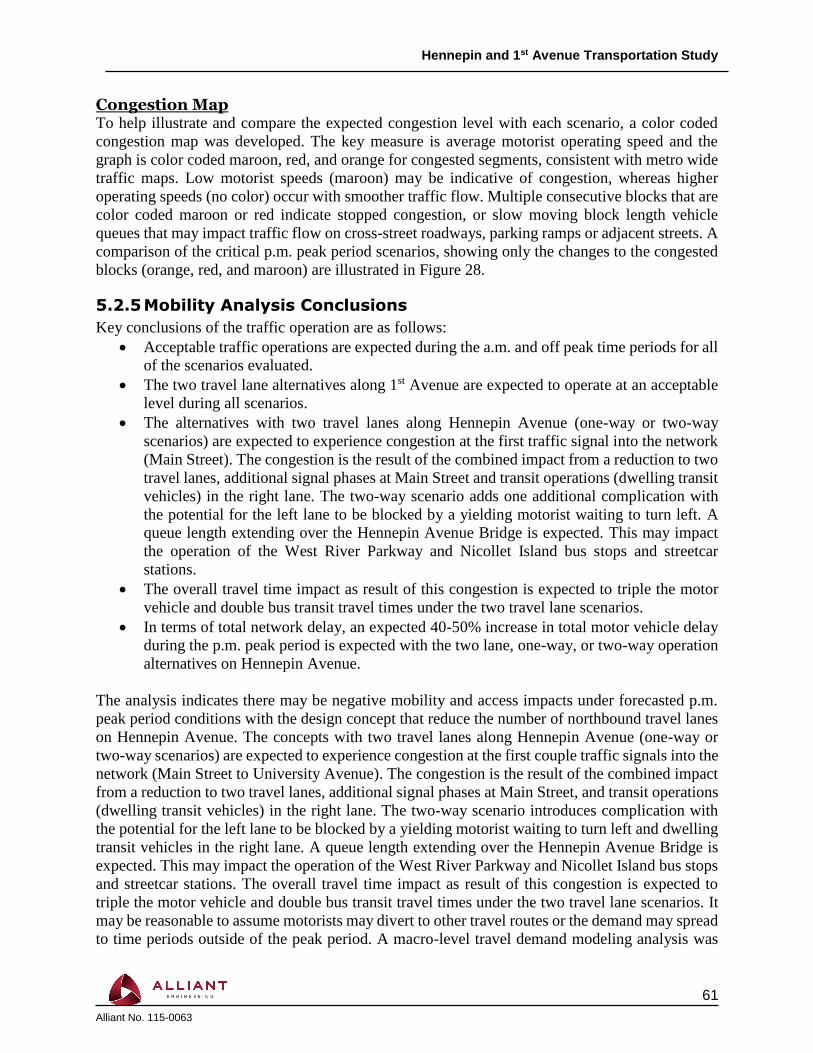
Hennepin and 1st Avenue Transportation Study
61
Alliant No. 115-0063
Congestion Map To help illustrate and compare the expected congestion level with each scenario, a color coded
congestion map was developed. The key measure is average motorist operating speed and the
graph is color coded maroon, red, and orange for congested segments, consistent with metro wide
traffic maps. Low motorist speeds (maroon) may be indicative of congestion, whereas higher
operating speeds (no color) occur with smoother traffic flow. Multiple consecutive blocks that are
color coded maroon or red indicate stopped congestion, or slow moving block length vehicle
queues that may impact traffic flow on cross-street roadways, parking ramps or adjacent streets. A
comparison of the critical p.m. peak period scenarios, showing only the changes to the congested
blocks (orange, red, and maroon) are illustrated in Figure 28.
5.2.5 Mobility Analysis Conclusions
Key conclusions of the traffic operation are as follows:
Acceptable traffic operations are expected during the a.m. and off peak time periods for all
of the scenarios evaluated.
The two travel lane alternatives along 1st Avenue are expected to operate at an acceptable
level during all scenarios.
The alternatives with two travel lanes along Hennepin Avenue (one-way or two-way
scenarios) are expected to experience congestion at the first traffic signal into the network
(Main Street). The congestion is the result of the combined impact from a reduction to two
travel lanes, additional signal phases at Main Street and transit operations (dwelling transit
vehicles) in the right lane. The two-way scenario adds one additional complication with
the potential for the left lane to be blocked by a yielding motorist waiting to turn left. A
queue length extending over the Hennepin Avenue Bridge is expected. This may impact
the operation of the West River Parkway and Nicollet Island bus stops and streetcar
stations.
The overall travel time impact as result of this congestion is expected to triple the motor
vehicle and double bus transit travel times under the two travel lane scenarios.
In terms of total network delay, an expected 40-50% increase in total motor vehicle delay
during the p.m. peak period is expected with the two lane, one-way, or two-way operation
alternatives on Hennepin Avenue.
The analysis indicates there may be negative mobility and access impacts under forecasted p.m.
peak period conditions with the design concept that reduce the number of northbound travel lanes
on Hennepin Avenue. The concepts with two travel lanes along Hennepin Avenue (one-way or
two-way scenarios) are expected to experience congestion at the first couple traffic signals into the
network (Main Street to University Avenue). The congestion is the result of the combined impact
from a reduction to two travel lanes, additional signal phases at Main Street, and transit operations
(dwelling transit vehicles) in the right lane. The two-way scenario introduces complication with
the potential for the left lane to be blocked by a yielding motorist waiting to turn left and dwelling
transit vehicles in the right lane. A queue length extending over the Hennepin Avenue Bridge is
expected. This may impact the operation of the West River Parkway and Nicollet Island bus stops
and streetcar stations. The overall travel time impact as result of this congestion is expected to
triple the motor vehicle and double bus transit travel times under the two travel lane scenarios. It
may be reasonable to assume motorists may divert to other travel routes or the demand may spread
to time periods outside of the peak period. A macro-level travel demand modeling analysis was

Hennepin and 1st Avenue Transportation Study
62
Alliant No. 115-0063
not conducted to estimate the potential diversion to other routes in downtown and near-downtown
neighborhoods.
5.2.6 Design Considerations
In addition to estimating potential capacity concerns and quality of motor vehicle and bus transit
mobility, the traffic operation analysis identified several important design considerations:
Streetcar alignment transition locations (left side to right side). The Hennepin
Avenue/Main Street and the 1st Avenue/2nd Avenue intersections were identified as the best
locations for the addition of the exclusive streetcar phase to accommodate the streetcar
transition.
The southbound transit station (streetcar or bus transit) in the vicinity of 4th Street is best
situated on the near side approach to the 4th Street intersection. In other words, it is best to
not locate a transit station between University Avenue and 4th Street if reducing 1st Avenue
from three travel lanes to two.

University Ave SE
4th St SE
5th St SE
6th St SE
E Hen
nepin Av
e8th St SE
1st A
ve N
E
Lourdes Pl
Ban
k St SE
2nd St SE
SE 7th St
E Hen
nepin Av
e
2nd St N
E
Main St N
E
EXISTING CONDITION
2015 TRAFFIC VOLUMES
Main St N
E
2nd St N
EUniversity
Ave N
E 1st A
ve N
E
E Hen
nepin Av
e
Ban
k St SE
Lourdes Pl
University Ave SE
4th St SE
5th St SE
Cental Ave S
E
Two-Way - Concept 2-1A, 2-1B, 2-1C 2015 Traffic Volumes
3 Travel Lanes Right Side Streetcar
1st A
ve N
E
E Hen
nepin Av
e
Ban
k St SE
Lourdes Pl
2nd St SE
University Ave SE
4th St SE
5th St SE
6th St SE
SE 7th St
Main St N
E
2nd St N
E
E Hen
nepin Av
e
Main St N
E1st Ave N
E
Lourdes Pl
2nd St N
E
University
Ave N
E
E Hen
nepin Av
e
4th St N
E
5th St N
E
1st A
ve N
E
Ban
k St SE
University Ave SE
2nd St SE
4th St SE
5th St SE
1st A
ve N
E
E Hen
nepin Av
eSE 7th St6th St N
E
Cental Ave S
E
6th St SE
5th St SE
One Way - No Build 2035 Traffic Volumes
3 Travel Lanes No Streetcar
E Hen
nepin Av
e
1st A
ve N
E
Ban
k St SE
Lourdes Pl
2nd St SE
University Ave SE
4th St SE
5th St SE
6th St SE
8th St SE
SE 7th St
E Hen
nepin Av
e
2nd St N
E
Main St N
E
5th St SE
One Way - No Build and Concept 1-2B
2035 Traffic Volumes 3 Travel Lanes Left Side Streetcar
E Hen
nepin Av
e
1st A
ve N
E
Ban
k St SE
Lourdes Pl
2nd St SE
University Ave SE
4th St SE
5th St SE
6th St SE
8th St SE
SE 7th St
E Hen
nepin Av
e
2nd St N
E
Main St N
E
5th St SE
One Way - Concept 1-2C 2035 Traffic Volumes
3 Travel Lanes Right Side Streetcar
Main St N
E
Lourdes Pl
Ban
k St SE
University Ave SE
4th St SE
5th St SE
Cental Ave S
E
1st A
ve N
E2nd St N
EUniversity
Ave N
E
E Hen
nepin Av
e
One Way - Concept 1-1B 2035 Traffic Volumes
2 Travel Lanes Right Side Streetcar
2nd St N
EUniversity
Ave N
E 1st A
ve N
E
E Hen
nepin Av
e
Ban
k St SE
Lourdes Pl
University Ave SE
4th St SE
5th St SE
Cental Ave S
E
Main St N
E
Two-Way - Concept 2-1A, 2-1B, 2-1C 2035 Traffic Volumes
3 Travel Lanes Right Side Streetcar
E N G I N E E R I N G
ALLIANTE N G I N E E R I N G
ALLIANTE N G I N E E R I N G
ALLIANTE N G I N E E R I N G
ALLIANTE N G I N E E R I N G
ALLIANTE N G I N E E R I N G
ALLIANTE N G I N E E R I N G
ALLIANT
< 6
6 to 9
9 to 12
mphColor
All Intervals
Speed
CBD AREA.
NEAR THE DOWNTOWN
EXPECTED TO EXTEND
VEHICLE DELAYS ARE 1.
NOTE:
CBD AREA.
NEAR THE DOWNTOWN
EXPECTED TO EXTEND
VEHICLE DELAYS ARE 1.
NOTE:
PM Peak Period Congestion Map
Figure 28Hennepin and 1st Avenue Transportation Study

Hennepin and 1st Avenue Transportation Study
64
Alliant No. 115-0063
Concept Design Benefit and Impact Evaluation
A comprehensive qualitative evaluation of the benefit and impact (i.e., pros and cons) was
completed for each concept design with respect to the key objectives as summarized in Table 16
through Table 21. The pros and cons provide a valuable means of comparing trade-offs and
ensuring a balance between transportation modes and the stakeholder and neighborhood objectives
are best met.
Table 16. Concept Design Evaluation – One-way Concept 1-1B

Hennepin and 1st Avenue Transportation Study
65
Alliant No. 115-0063
Table 17. Concept Design Evaluation – Concept 1-2B

Hennepin and 1st Avenue Transportation Study
66
Alliant No. 115-0063
Table 18. Concept Design Evaluation – Concept 1-2C

Hennepin and 1st Avenue Transportation Study
67
Alliant No. 115-0063
Table 19. Concept Design Evaluation – Concept 2-1A

Hennepin and 1st Avenue Transportation Study
68
Alliant No. 115-0063
Table 20. Concept Design Evaluation – Concept 2-1B

Hennepin and 1st Avenue Transportation Study
69
Alliant No. 115-0063
Table 21. Concept Design Evaluation – Concept 2-1C

Hennepin and 1st Avenue Transportation Study
70
Alliant No. 115-0063
6.0 Cost Estimate
Planning level construction cost estimates were prepared to help assess the funding requirements.
For planning purposes, full reconstruction is expected with a long term implementation of any of
the alternatives. Although it may be most practical to reconstruct Hennepin and 1st Avenue
concurrent with the streetcar alignment implementation, the streetcar components are not included
in the cost estimate. As identified previously both the one-way and two-way alternatives could be
implemented on an interim basis, accomplished mostly through pavement markings and traffic
signal modifications.
Long Term Implementation
A full reconstruct of Hennepin and 1st Avenue from building face to building face would best
accommodate the full implementation of any concept. Although the features between the buildings
may vary, at a planning level, the total reconstruction cost is assumed to be similar. Based on
historical reconstruction costs for Minneapolis streets, the cost ranges from approximately $15
million to $18 million per mile for bituminous and concrete streets, respectively. Table 22 details
the estimated reconstruction cost of the Hennepin Avenue and 1st Avenue corridors.
Table 22. Planning Level Reconstruction Cost Estimate
Interim Implementation
Construction costs for an interim implementation could vary significantly depending on the type
and magnitude of the retrofit for the limits of Hennepin and 1st Avenue between 7th Street and
Main Street. An interim implementation may be accompanied by pavement resurfacing,
renovation, or seal coating treatments, but could also be accomplished with less intensive re-
striping treatments. The one-way or two-way travel lane alternatives would require a variety of
modifications to the pavement markings and roadway signing. However, the two-way alternative
would require traffic signal modifications to add the overhead mast arm signal indications in the
opposing direction. Costs for signal modifications would vary significantly depending on the
unique condition and location of each signal system, as well as compliance with ADA
regulations. In certain circumstances, full signal re-builds may be required at each corner of the
intersection. For these specific reasons, further analysis and concept development are required to
more accurately determine the costs required for interim improvements.
Segment Surface Cost / MileLength
(Mile)
Estimated
Reconstruction
Cost
($)
Hennepin Avenue - Main Avenue to Central Avenue Concrete $18 Million 0.3 6,180,000$
Hennepin Avenue - Central Avenue to 7th Street Concrete $18 Million 0.2 2,950,000$
1st Avenue - Central Avenue to Main Avenue Bituminous $15 Million 0.4 6,680,000$
7th Street - Central Avenue to Hennepin Avenue Bituminous $15 Million 0.1 1,500,000$
Total Reconstruction Cost 1.1 17,310,000$

Hennepin and 1st Avenue Transportation Study
71
Alliant No. 115-0063
7.0 Next Steps
The objective of this study was to develop and evaluate several potential concept design
configurations for Hennepin and 1st Avenue that meet to varying degrees the primary goals of the
stakeholders and neighborhood. This information in this study frames the pros and cons and design
considerations; however, does not make recommendation of the preferred concept. Information
included in this study will help inform future design decisions and set the foundation for a more
detailed engineering and design evaluation.
Any efforts related to advancing a full reconstruction of the corridors would require more detailed
engineering, investigation, and stakeholder engagement. Upon determining the long-term
operations of the Hennepin and 1st Avenue corridors, a detailed study of the Central/Hennepin/5th
intersection will be required to identify and evaluate potential intersection improvement solutions
to address the mobility, safety, multimodal deficiencies, greening, and the potential development
of special service districts.

Hennepin and 1st Avenue Transportation Study
72
Alliant No. 115-0063
Appendix A: Neighborhood Study Advisory Committee Meeting Minutes
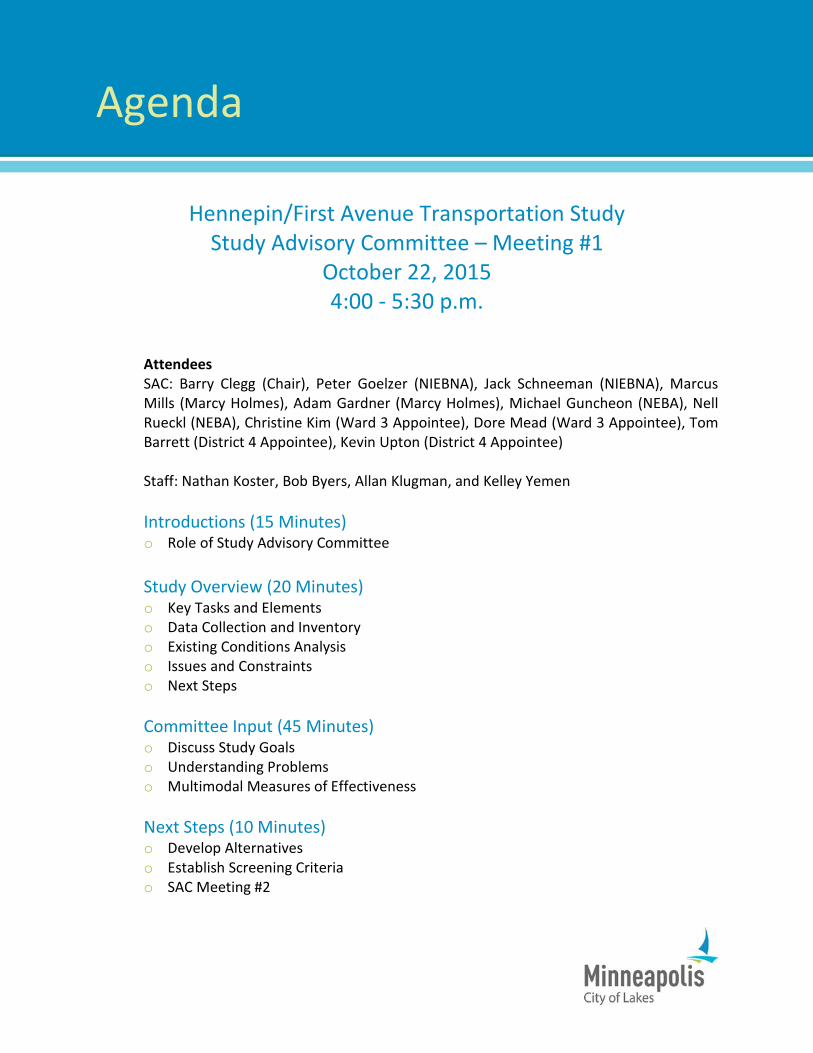
Agenda
Hennepin/First Avenue Transportation Study
Study Advisory Committee – Meeting #1 October 22, 2015 4:00 - 5:30 p.m.
Attendees SAC: Barry Clegg (Chair), Peter Goelzer (NIEBNA), Jack Schneeman (NIEBNA), Marcus Mills (Marcy Holmes), Adam Gardner (Marcy Holmes), Michael Guncheon (NEBA), Nell Rueckl (NEBA), Christine Kim (Ward 3 Appointee), Dore Mead (Ward 3 Appointee), Tom Barrett (District 4 Appointee), Kevin Upton (District 4 Appointee) Staff: Nathan Koster, Bob Byers, Allan Klugman, and Kelley Yemen Introductions (15 Minutes) o Role of Study Advisory Committee Study Overview (20 Minutes) o Key Tasks and Elements o Data Collection and Inventory o Existing Conditions Analysis o Issues and Constraints o Next Steps
Committee Input (45 Minutes) o Discuss Study Goals o Understanding Problems o Multimodal Measures of Effectiveness
Next Steps (10 Minutes) o Develop Alternatives o Establish Screening Criteria o SAC Meeting #2

Meeting Minutes
Hennepin/First Transportation Study Study Advisory Committee Meeting #1
October 22, 2015 - City of Lakes Room 101 Meeting attendees: See Attached
Introductions Committee member introduced themselves and indicated their association affiliation and primary mode transportation they use in the study area. City staff provided a brief overview of the role of the Study Advisory Committee (SAC), which included an outline of meeting expectations and responsibilities. Study Overview An overview of the study and activities conducted to date was provided by staff. SAC members asked for confirmation that all one-way streets within the study area will be evaluated and Nathan confirmed they were. It was requested by SAC members that the existing conditions graphics presented be provided electronically to the group for further review. A number of members asked if traffic violations or enforcement issues were evaluated or tracked, while noting that driver confusion is often the leading factor incorrect turns on the one-way streets. Staff noted that traffic violations and enforcement was not evaluated, but crash data was summarized by crash type to determine if drive confusion is a contributing factor in crashes. ACTION: Provide inventory and existing conditions materials to SAC members.
Committee Input Staff guided a discussion that focused on identifying the values, goals, and visions for the study area corridors. The key themes and input received from the TAC would serve as a guide for the development of screening criteria that will be used to narrow down a wide range of potential concepts to a smaller subset that will be considered for more detailed evaluation. Each SAC member was provided an opportunity to offer their input, after which the meeting was opened up for general discussion from all members. Below is a brief summary of the input and guidance provided by SAC members. • Encourage economic vitality (limit speeding) • Promote traffic calming • Reduce the amount of bicycle and pedestrian conflicts with cars • Reduce complexity of the transportation network • Provide enhanced pedestrian environment, offering opportunities for art, bus shelters, etc.

• Provide a safer pedestrian environment for pedestrians (e.g., 1st Ave: 4th St to 7th St) • Consider more equitable transportation system, with equal emphasis for modes • Offer space for bicycle and pedestrian mobility • Influence travel behavior to reduce speeds before it enters the study area (e.g., Hennepin
Bridge and Central Ave) • Reduce confusion and address dangerous intersection to promote livability
(i.e., consistency in street grid) • Enhance the comfort and convenience of non-motorized travel • Provide protection and buffer from motorized travel • Address mixture of one-way and two-way streets • Encourage transit use • Prioritize safe bicycle and pedestrian street crossings • Address signal timing that encourages speeding • Improve sight distances for non-motorized users • Understand that the area will increasingly grow a destination, not just a “cut-through” • Infrastructure and opportunities for motorized travel must still be provided for local
residents and businesses • Accommodations for trucks, buses, and emergency vehicles must be maintained • Evaluate inconsistencies with parking bays and bump-outs • Bicycle facilities should not be overlooked, part of greater network of connectivity to
downtown, regional park system, and University of Minnesota campus • Traffic calming will enhance opportunities for place-making • Streetcar is important improvement for the neighborhood and should be implemented in a
way that maintain consistency with local and regional visions • Motorized throughput and congestion should not be driving factor • Seek opportunities to address complex intersections (5th/Hennepin/Central,
7th/1st/Central, and 7th/Hennepin) • Evaluate opportunities to address “free-flowing” right turns that encourage speeding and
present conflicts with bicyclists and pedestrians • Identify gaps in the bicycle/pedestrian network (e.g., Main St: 1st Ave to Hennepin) • Evaluate best location for dedicated bicycle facilities
Next Steps Staff discussed the study’s next steps and indicated that the next meeting would likely occur in early December. SAC members asked for clarification for the anticipated topics that will be presented at the next meeting and staff stated that the study team would use the committee’s input to aid in the creation of screening criteria that would be applied to narrow down a range of concepts to be presented for discussion. The SAC also requested that meeting materials be provided in advance so that committee members would have adequate time for review and preparation. ACTION: Set next SAC meeting date as early as possible to accommodate schedules. ACTION: Provide meeting materials in advance of next SAC meeting to facilitate participation.

Agenda
Hennepin/First Avenue Transportation Study
Study Advisory Committee – Meeting #2 December 21, 2015
5:30 - 7:00 p.m.
Attendees SAC: Barry Clegg (Chair), Peter Goelzer (NIEBNA), Jack Schneeman (NIEBNA), Marcus Mills (Marcy Holmes), Adam Gardner (Marcy Holmes), Michael Guncheon (NEBA), Nell Rueckl (NEBA), Christine Kim (Ward 3 Appointee), Dore Mead (Ward 3 Appointee), Tom Barrett (District 4 Appointee), Kevin Upton (District 4 Appointee) Staff: Nathan Koster, Bob Byers, Allan Klugman, and Kelley Yemen Introductions (10 Minutes) o Agenda Review o Meeting #1 Minutes o Study Questions Study Overview (5 Minutes)
Evaluation Process (15 Minutes) o SAC Objectives o Fatal Flaws and Screening Evaluation
Concept Development (55 Minutes) o Approach and Phasing/Staging o Design Considerations o One-Way Concepts o Two-Way Concepts Next Steps (5 Minutes) o Develop Corridor Alternatives o Detailed Evaluation and Summary o SAC Meeting #3
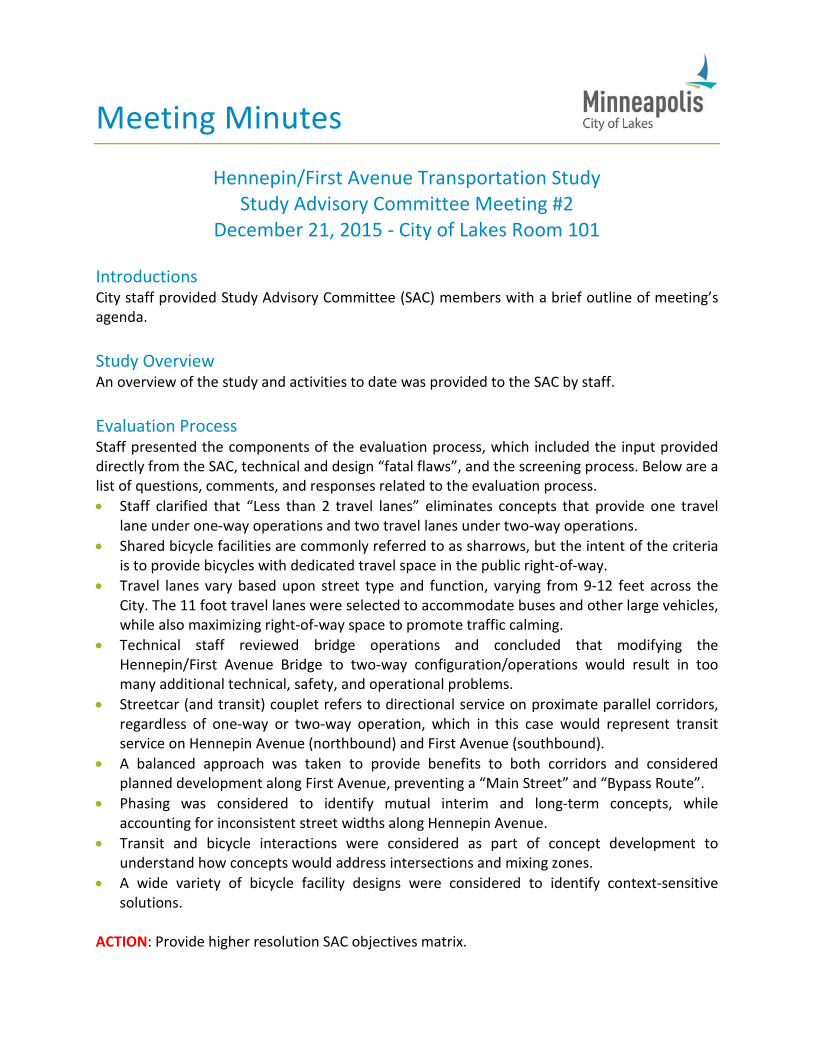
Meeting Minutes
Hennepin/First Avenue Transportation Study Study Advisory Committee Meeting #2
December 21, 2015 - City of Lakes Room 101 Introductions City staff provided Study Advisory Committee (SAC) members with a brief outline of meeting’s agenda. Study Overview An overview of the study and activities to date was provided to the SAC by staff. Evaluation Process Staff presented the components of the evaluation process, which included the input provided directly from the SAC, technical and design “fatal flaws”, and the screening process. Below are a list of questions, comments, and responses related to the evaluation process. • Staff clarified that “Less than 2 travel lanes” eliminates concepts that provide one travel
lane under one-way operations and two travel lanes under two-way operations. • Shared bicycle facilities are commonly referred to as sharrows, but the intent of the criteria
is to provide bicycles with dedicated travel space in the public right-of-way. • Travel lanes vary based upon street type and function, varying from 9-12 feet across the
City. The 11 foot travel lanes were selected to accommodate buses and other large vehicles, while also maximizing right-of-way space to promote traffic calming.
• Technical staff reviewed bridge operations and concluded that modifying the Hennepin/First Avenue Bridge to two-way configuration/operations would result in too many additional technical, safety, and operational problems.
• Streetcar (and transit) couplet refers to directional service on proximate parallel corridors, regardless of one-way or two-way operation, which in this case would represent transit service on Hennepin Avenue (northbound) and First Avenue (southbound).
• A balanced approach was taken to provide benefits to both corridors and considered planned development along First Avenue, preventing a “Main Street” and “Bypass Route”.
• Phasing was considered to identify mutual interim and long-term concepts, while accounting for inconsistent street widths along Hennepin Avenue.
• Transit and bicycle interactions were considered as part of concept development to understand how concepts would address intersections and mixing zones.
• A wide variety of bicycle facility designs were considered to identify context-sensitive solutions.
ACTION: Provide higher resolution SAC objectives matrix.

Concept Development Staff presented leading one-way and two-way concepts identified by study’s Technical Advisory Committee (TAC), composed of City, Hennepin County, Metro Transit, and MnDOT staff. Below are a list of questions, comments, and responses related to the evaluation process. • Any loss of parking will be detrimental to economic development. • Streetcar is planned to operate in mixed traffic. • A pedestrian zone along this type of corridor should be a minimum of 12 feet, while the
City’s sidewalk design guidelines indicate 15 feet is acceptable and 20 feet is recommended. • One-way concepts with three lanes of travel are not desired and would not calm traffic as
much as neighborhood desires. Traffic calming measures should start outside of the neighborhood and continue through. County indicated the bridge may be restriped in 2016.
• Flexible off-peak parking is often confusing and awkward, with compliance and enforcement problems. Avoid design similar to First Avenue N in downtown where pedestrian, bicycle, and parking conflicts create an undesirable conflict zones.
• The corridors do not necessarily have to be identical, variations or components could be incorporated during more detailed design.
• Traffic volumes and patterns indicated offsetting lane geometry for two-way operations would balance mobility and circulation, matching in with traffic volumes and patterns to/from the Hennepin/First Avenue Bridge.
• Center turn lane concept was considered, but not carried forward due to existing travel patterns and lack of mid-block access points requiring a continuous turn lane. This option will be re-evaluated during the detailed traffic analysis.
• Group discussed routing all bicycle facilities to First Avenue to/from the Hennepin/First Avenue Bridge. This concept introduces more intersection conflicts, circuitous and confusing bicycle routes, inconsistency with adopted bicycle plans, modal inequity, and would result in bicycles still riding on Hennepin Avenue’s sidewalks.
• Clear preference for protected bicycle facilities, particularly facilities incorporating physical separation with “greening” or other stormwater management elements.
• Evaluate and consider access modification to “half streets” along the Hennepin Avenue and Central Avenue corridors (i.e., 5th St, 6th St, etc.)
• Consider new two-way concept (“2-1C”) with three travel lanes, parking on both sides, and a raised cycletrack.
ACTION: Develop new concept “2-1C” and distribute updated materials. ACTION: Confirm the concepts to be carried forward for more detailed analysis. Next Steps Staff discussed the study’s next steps and indicated that the next meeting would likely occur in early part of 2016. Staff confirmed that meeting materials will be provided in advance so that committee members would have adequate time for review and preparation. ACTION: Set next SAC meeting date as early as possible to accommodate schedules. ACTION: Provide meeting materials in advance of next SAC meeting to facilitate participation.

Agenda
Hennepin/First Avenue Transportation Study
Study Advisory Committee – Meeting #3 May 2, 2016
5:30 - 7:00 p.m.
Attendees SAC: Barry Clegg (Chair), Peter Goelzer (NIEBNA), Jack Schneeman (NIEBNA), Marcus Mills (Marcy Holmes), Adam Gardner (Marcy Holmes), Michael Guncheon (NEBA), Nell Rueckl (NEBA), Christine Kim (Ward 3 Appointee), Dore Mead (Ward 3 Appointee), Tom Barrett (District 4 Appointee), Kevin Upton (District 4 Appointee) Staff: Nathan Koster, Bob Byers, Allan Klugman, and Kelley Yemen Introductions (5 Minutes) o Agenda Review o Meeting #2 Minutes o Study Questions Study Overview (5 Minutes) Traffic Analysis (15 Minutes)
Evaluation Summary and Conceptual Layouts (60 Minutes) o Overview o One-Way Concepts o Two-Way Concepts Next Steps (5 Minutes) o Present Study Findings to City/County Officials o Neighborhood, NEBA, and Advisory Committee Outreach

Meeting Minutes
Hennepin/First Avenue Transportation Study Study Advisory Committee Meeting #3 (Part I and II)
May 2 and 9, 2016 - City of Lakes Room 101 Introductions City staff provided Study Advisory Committee (SAC) members with a brief outline of meeting’s agenda. Study Overview An overview of the study and activities to date was provided to the SAC by staff. Traffic Analysis Staff presented the components of the traffic analysis, which was conducted for both existing and future conditions. This analysis included evaluation of the “no build” conditions, as well as the six leading concepts using VISSIM traffic modeling software to account for multimodal operations (i.e., transit, bike, and ped). Below are a list of questions, comments, and responses related to the evaluation process. • Attendees sought clarification of future traffic volumes and assumptions, noting that recent
improvements (e.g., 4th Street I-35W ramp) may relieve traffic volumes in the neighborhood. o Staff clarified that future traffic volumes were developed with consideration of active and
proposed development proposals, current traffic patterns, planned roadway improvements, and an understanding of downtown traffic patterns.
• Attendees asked if large mode shifts were assumed to account for potential reduction of motor vehicle demand. o Staff indicated that transit ridership data was incorporated as a part of the development of
future traffic volumes, understanding that this information provides insight into future modal demands. This analysis did not assume major changes to the way transportation is delivered (i.e., automated vehicles, etc.) or significant mode share changes. None of the concepts brought forward expanded capacity or specifically prioritized motorized vehicle throughput, which could lead to induced demand.
• Motorized vehicle traffic must be slowed as to not induce more demand in the future and incentivize driving over transit, walking, or biking. o Staff noted that transit must remain competitive from a travel time perspective to attract riders
who would otherwise travel by way of single occupancy vehicle. Transitway investments developed along congested corridors (e.g., Seattle’s South Lake Union Streetcar) may have difficulties attracting riders due to unreliable service and unpredictable travel times.
• Attendees indicated that future traffic volumes may overstate demand in area based upon lessons learned from I-35W bridge collapse, noting that commuters will always find routes.
• Evaluation summary indicates that congestion along the corridor is both a “pro” and a “con” for the neighborhoods and businesses, indicating that it should not be assumed as all bad.
• Congestion may negatively impact businesses, but vehicles traveling through the neighborhood at speeds approaching or exceeding 40 miles per hour does not support business either.

• Attendees indicated that current and future residents choose to live in the area to live a (more) car-free lifestyle, noting that most parking garages are relatively full during normal work hours.
• Would the bottleneck at Hennepin/Main be eliminated if the Hennepin Bridge were converted to two-lanes in each direction? o Staff indicated that this would most likely move the bottleneck across the river into downtown.
• There was a concern that the conversion to two-way would result in more turning movement in the neighborhood and that a “real world” test would be needed to fully understand the operations of the corridor. o Staff indicated that traffic volumes were estimated for two-way operations by evaluating
existing volumes and relying upon the origin-destination data collected in the June 2015. There are still concerns about two-way operations and the negative impact of vehicle congestion on transit service within and through the neighborhood.
• Why are the afternoon operations so much worse than the morning operations? o Larger afternoon traffic volumes and more non-work based trips during this period o Highest volumes concentrated on bridge out of downtown, whereas southbound morning
commute builds from side streets and maxes out across bridge into downtown o 1st Ave provides better intersection spacing, effectively meters in traffic from side streets,
better intersection spacing, has one less intersection, and does not have a six-legged intersection
o Hennepin Ave at Main St represents bottleneck from 3-Lanes to 2-Lanes under certain concepts evaluated
o Hennepin/Central/5th intersection is a complex six-legged intersection that introduces a bottleneck at Hennepin Ave and Central Ave
• Attendees presented the following questions related to the traffic modeling: o Has the 2015 (existing) traffic analysis been proven with real world timings? Has somebody
driven the routes at particular times to see if it measures up? Models were calibrated to the existing conditions and validated with existing controller signal timings, and traffic volumes. Field observations were performed to match observed queue lengths with the model.
o Has that input data for 2015 been changed to see if the analysis is accurate calculating times? The AM, PM and Off peak were modeled. The models included the existing signal timing and traffic volumes for those time periods. A weekend analysis was not completed, however based on observations and experience on many other corridors in Minneapolis, the weekend volumes are similar to a weekday off peak time period.
o Has this analysis software been used in other projects (Mpls. or otherwise) where its accuracy has been verified? The VISSIM software has been used on many projects within Minneapolis and is a standard industry traffic operation analysis tool used worldwide. Traffic modeling programs are a tool used to inform decisions and help with the evaluation process. Engineering judgement and many other factors/variables were also considered.
o What was the method of estimating future traffic volumes and has this been verified in other projects? There are 12 proposed or currently under construction redevelopment parcels in the study area. Future traffic volumes assume a 50% reduction in auto trips due to the availability of other modal options, but auto traffic is expected increase by approximately 10% in the study area.

Evaluation Summary Staff presented leading one-way and two-way concepts identified by study’s Technical Advisory Committee (TAC), composed of City, Hennepin County, Metro Transit, and MnDOT staff. Below are a list of questions, comments, and responses related to the evaluation process. • Center-running bridge concept may not be supported by DeLaSalle and Park Board due to location
of station. o Staff will provide an update on streetcar study to DeLaSalle and Park Board staff to better
understand their concerns. Center-running streetcar on the bridge allows for (and does not preclude) left-side or right-side running streetcar north/east of Main Street.
• Concepts must reflect long-term plan to extend streetcar further to the north along Central Ave. o Staff understands these plans, noting that this can be accomplished whether streetcar is left-
side or right-side running for either the one-way or two-way concepts. • Concepts do not yet consider potential State-Aid variance requests (e.g., narrowing travel lanes,
reducing curb reaction distance, etc.) that could further expand the pedestrian realm. • If two-way concept is carried forward for more detailed analysis, the following items must be
considered: o Restoring two-way operations along Hennepin Ave between 5th Street and 7th Street. o No left turns at Hennepin/Central/5th intersection. o Closure of vehicle access at 5th Street (maintain bike/ped movements). o Discuss opportunities related to redevelopment of Holiday/White Castle site. o Closure of 6th Street between Central Ave and Hennepin Ave.
ACTION: Continued coordinate with CPED staff regarding Holiday/White Castle redevelopment. ACTION: Determine potential closure of 6th Street and need for emergency vehicle access. ACTION: Identify left-turn volumes occurring at Hennepin/Central/5th intersection. Concept Layouts • All concepts must have interim solutions.
o This was a prerequisite for advancement for more detailed analysis. • Can lane widths be reduced below 11 feet?
o This area serves buses and trucks, thus there is a need for lanes wider than 10 feet. There are other measures to reduce visual lane widths, such as wider striping.
• Bicycle facilities similar to First Ave N in downtown are not preferred, but supportive of greening elements and sidewalk-level cycletracks.
• Three-lanes dedicated for vehicular traffic for the one-way concepts are not preferred and not supported, but there is openness to dedicated transit-only lanes. This provides a continuation of the high speed travel from the bridge and induces the continual growth of traffic in the neighborhood.
• Biggest problem with the one-way concepts is the left-side running streetcar. This design is not intuitive and puts transit facilities on both sides of the street.
• Parking will remain a big concern for businesses in the neighborhood relying upon pull-up parking in front of stores. There will need to be trade-offs when allocating space.
• Those in attendance unanimously stated their preference for the two-way configuration over one-way configuration, which has been consistent throughout all phases of the study. There is a desire to see an interim two-way concept implemented with signing, striping, and signal modifications.
• Split preferences between long-term two-way concept, split between 2-1B and 2-1C. • Staff reiterated that the study would not be providing recommendations and no capital projects
have been identified along Hennepin or First Avenues.

• The study will document the results of the analysis along with the pros and cons of each concept. Next Steps Documentation is expected to be complete by early June. The results of the study will be presented to management and elected officials during this timeframe. Outreach to the neighborhoods, business association, and the City’s Pedestrian and Bicycle Advisory Committees is expected in July. ACTION: Meeting materials and report will be posted to the study website as soon as possible.


