Embed Size (px)
Citation preview

Herbicides can stimulate plant growth
N CEDERGREENDepartment of Agricultural Sciences, Faculty of Life Science, University of Copenhagen, Denmark
Received 15 October 2007
Revised version accepted 13 March 2008
Summary
Low dose stimulations by toxicants have long been
observed. Great controversies exist concerning the
interpretation of these observations, spanning from
believing that they are a general stress response occur-
ring for all chemicals, to simply being an experimental
artefact resulting from poorly growing control plants or
from biomass allocation between plant parts. This study
investigates the growth response and biomass allocation
pattern of barley exposed to 10–15 doses of eight
different herbicides. The results show that the globally
most widely used herbicide, glyphosate, together with
the sulfonylurea, metsulfuron-methyl, can induce a real
stimulation in biomass growth of approximately 25%
when applied at doses corresponding to 5–10% field
rate. The other six herbicides tested did not induce
consistent hormesis, thereby undermining the theory of
hormesis being a general stress response. Biomass
allocations between plant parts did take place, but were
not the cause of the hormetic growth stimulations. The
results demonstrate that plant physiological responses to
low herbicide doses cannot be extrapolated from our
knowledge of effects of higher, commercially used,
doses. Other physiological mechanisms seem to be
triggered in the low dose-range, and the investigation
of these mechanisms poses new challenges for agrono-
mists, environmentalists and plant physiologists.
Keywords: hormesis, plant traits, trade-off between
traits, glyphosate, metsulfuron-methyl, growth stimu-
lation, herbicides, biphasic dose–response curves.
CEDERGREEN N (2008). Herbicides can stimulate plant growth. Weed Research 48, 429–438.
Introduction
It has been known for more than a century that some
substances at low doses can be beneficial, while they are
lethal at higher doses. This phenomenon was first called
the Arndt-Schulz law (Calabrese, 2005). Southam and
Erlich (1943) introduced the term hormesis to describe
the effect of an oak bark compound that enhanced
fungal growth at low doses but strongly inhibited it at
higher doses. The concept of hormesis has highly
controversial implications within the areas of environ-
mental and medical toxicology (Calabrese, 2005; Thayer
et al., 2005), as it questions the ways we set limit values
for pollutants and toxins. There are those who claim
hormesis is the rule rather than the exception and that it
represents an evolutionary-based adaptive response to
environmentally induced disruption in homeostasis
(Stebbing, 1998; Calabrese & Baldwin, 2001). Others
are more sceptical in terms of the generality of the
phenomenon, claiming that hormesis leading to an
increase in population fitness is not an evolutionary
expectation and that even though some traits might be
stimulated by low doses of stress, this stimulation will
occur at a cost (Forbes, 2000; Parsons, 2003). In fact,
very few studies have been performed trying to elucidate
the mechanisms behind the biphasic dose–response
relationships often encountered. Most reports on hor-
mesis come from studies designed to investigate some
other problem, most often high dose effects, and the
hormetic response is rarely more than noted (Streibig,
1980).
This is also the case for studies on the effect of
herbicides on plants (Streibig, 1980). Since herbicides are
one of the groups of chemicals we deliberately spread
into the environment in large quantities, understanding
how low doses affect the growth and physiology of
plants is of utmost importance, both to farmers and risk
assessors. Since the initiation of herbicide development
in the early years after the second world war, stimula-
tions of one trait or another in plants in response to low
Correspondence: Nina Cedergreen, Department of Agricultural Sciences, Faculty of Life Science, University of Copenhagen, Højbakkegard Alle 13,
2630 Tastrup, Denmark. Tel: (+45) 35 33 33 97; Fax: (+45) 35 28 34 78; E-mail: [email protected]
� 2008 The Author
Journal Compilation � 2008 European Weed Research Society Weed Research 48, 429–438

herbicide doses have been noted (references summarised
in Duke et al., 2006). Only a few studies have tried to
investigate the mechanisms behind the growth stimu-
lation; for those that did, the results were largely
inconclusive (Allender et al., 1997; Morre, 2000;
Appleby, 2001). Any sceptic could therefore, with good
reason, claim that the biphasic dose–response curves
reported in plant science are either a result of poorly
growing controls or of trade-offs between traits.
Regarding whether the occurrence of hormesis is real
or whether it is an experimental artefact, a recent
database study including 687 dose–response curves
divided between three plant- or algae species and 10
herbicides, showed treatment averages above the control
level in 25–76% of the dose–response curves, depending
on the species (Cedergreen et al., 2007). In some species,
hormesis therefore seems to happen more frequently
than would be predicted by chance. The study also
showed a rather large variance between the different
herbicides, in terms of which induced hormesis. Some
only did it in <20% of the curves analysed, while others
had significant biphasic dose–response curves in more
than 70% of the curves (Cedergreen et al., 2007). Hence,
these results indicate not only that (shoot) growth
stimulations do take place, but also that not all
herbicides are equally effective in inducing this growth
increase. The dose–response curves analysed were, as
most others reporting hormesis, not designed to inves-
tigate low dose effects. Hence, it cannot be excluded that
using more low doses could reveal a hormetic response
for all herbicides, confirming the theories of biphasic
dose–response curves being a general phenomenon
(Calabrese & Baldwin, 2001).
The question remains whether the observed growth
increase is real or just a result of trade-offs between
traits? Studies on insects have shown that low doses of
chemicals can enhance egg production, but that the
enhanced production of offspring was counterbalanced
by lower offspring survival (Fujiwara et al., 2002;
Zanuncio et al., 2003). Similar trade-offs between traits
could be expected in plants, which can allocate their
resources in ways to optimise their growth under stress
conditions. It is well known that plants allocate root
biomass in soil patches where the environment is
favourable in terms of water and nutrients, while
avoiding more unfavourable soil patches (Kleijn &
Van Groenendael, 1999; Wijesinghe & Hutchings,
1999). Sub-lethal concentrations of herbicides in soils
might therefore induce an increased allocation of bio-
mass to roots to promote the search for a more
favourable root habitat. In fact, for seven soil applied
herbicides, Wiedman and Appleby (1972) showed root
growth of oat and cucumber was increased at low
herbicide doses, while shoot growth was unaffected. For
the remaining four herbicides tested, both root and
shoot growth were affected (Wiedman & Appleby,
1972). Other allocation patterns might be seen for
sprayed plants. In most studies showing hormesis, only
one trait is measured. This is most often shoot biomass
growth, leaf length or leaf area (Wiedman & Appleby,
1972; Allender et al., 1997; Schabenberger et al., 1999;
Davies et al., 2003; Cedergreen et al., 2007). Any kind of
resource allocation can therefore not be evaluated from
these studies. Hence, it cannot be excluded that whole
plant biomass growth is unaffected in the �hormetic�dose-range, but that a change in root:shoot allocation,
an allocation of biomass between leaves and stems or an
increase in specific leaf area are causing the apparent
growth stimulation.
We therefore tested the following hypotheses: (i)
hormesis in plants is not a result of a real growth
increase, but rather a result of (a) poorly growing
control plants or (b) a trade-off between traits; (ii)
hormesis is a general stress response across chemicals
with different physiological mechanisms of action; (iii)
hormesis is independent of whether the chemical is
absorbed through leaves or roots.
To test these hypotheses, barley was grown in
hydroponic cultures and exposed to 10–15 doses of
eight herbicides, either through the root media or by
spraying. Each herbicide represented chemicals affecting
different molecular pathways in the plants, ranging from
compounds affecting photosynthesis to compounds
affecting the synthesis of amino acids or fatty acids or
preventing microtubule assembly. The dry weight
increase of both roots and shoots were measured at
harvest, together with leaf and stalk dry weight and
length.
Material and methods
Plants
Barley (Hordeum vulgare, L.) seeds var. Barke
(Saatzucht Josef Breun, Harzogenawach, Germany)
were sown in moistened vermiculite (Sorbix-fine ⁄Damolin, Garta, Copenhagen, Denmark) and placed
in a climate chamber (1.2 m · 1.2 m · 1.2 m) at a
day ⁄night temperature of 21 ⁄ 15�C and a 16 ⁄ 8 h light ⁄dark cycle (300–340 lmol m)1 s)1 Photosynthetic
Active Radiation). One week after sowing, when the
plants had two true leaves, the plants were removed
from the vermiculite, the roots were gently washed and
each plant was placed in a foam stopper (Bostik
baggrundsprofil, 16 mm, Bauhaus, Tastrup, Denmark)
fitted to a hole in a plastic plate covering a 650 mL pot
(diameter: 11 cm) with nutrient media. The composition
of the media is described in Pedas et al. (2005) with the
430 N Cedergreen
� 2008 The Author
Journal Compilation � 2008 European Weed Research Society Weed Research 48, 429–438
only modification of adding 0.15 lM MnSO4. Four
plants were placed in each pot. Ten plants were killed
and dried at 80�C for initial root and shoot dry weight
determination.
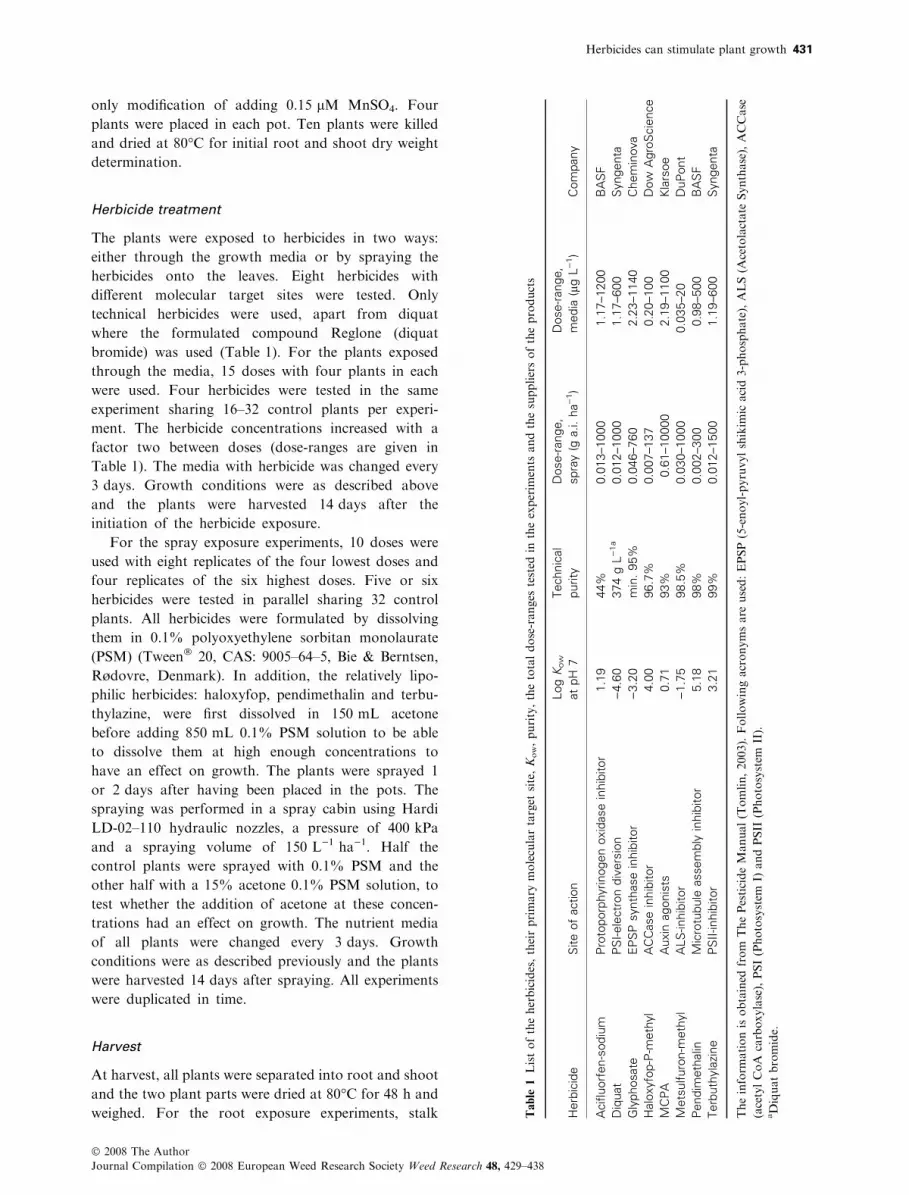
Herbicide treatment
The plants were exposed to herbicides in two ways:
either through the growth media or by spraying the
herbicides onto the leaves. Eight herbicides with
different molecular target sites were tested. Only
technical herbicides were used, apart from diquat
where the formulated compound Reglone (diquat
bromide) was used (Table 1). For the plants exposed
through the media, 15 doses with four plants in each
were used. Four herbicides were tested in the same
experiment sharing 16–32 control plants per experi-
ment. The herbicide concentrations increased with a
factor two between doses (dose-ranges are given in
Table 1). The media with herbicide was changed every
3 days. Growth conditions were as described above
and the plants were harvested 14 days after the
initiation of the herbicide exposure.
For the spray exposure experiments, 10 doses were
used with eight replicates of the four lowest doses and
four replicates of the six highest doses. Five or six
herbicides were tested in parallel sharing 32 control
plants. All herbicides were formulated by dissolving
them in 0.1% polyoxyethylene sorbitan monolaurate
(PSM) (Tween� 20, CAS: 9005–64–5, Bie & Berntsen,
Rødovre, Denmark). In addition, the relatively lipo-
philic herbicides: haloxyfop, pendimethalin and terbu-
thylazine, were first dissolved in 150 mL acetone
before adding 850 mL 0.1% PSM solution to be able
to dissolve them at high enough concentrations to
have an effect on growth. The plants were sprayed 1
or 2 days after having been placed in the pots. The
spraying was performed in a spray cabin using Hardi
LD-02–110 hydraulic nozzles, a pressure of 400 kPa
and a spraying volume of 150 L)1 ha)1. Half the
control plants were sprayed with 0.1% PSM and the
other half with a 15% acetone 0.1% PSM solution, to
test whether the addition of acetone at these concen-
trations had an effect on growth. The nutrient media
of all plants were changed every 3 days. Growth
conditions were as described previously and the plants
were harvested 14 days after spraying. All experiments
were duplicated in time.
Harvest
At harvest, all plants were separated into root and shoot
and the two plant parts were dried at 80�C for 48 h and
weighed. For the root exposure experiments, stalk Table
1Listoftheherbicides,theirprimary
moleculartarget
site,Kow,purity,thetotaldose-ranges
tested
intheexperim
ents
andthesuppliersoftheproducts
Herb
icid
eS
ite
of
action
Log
Kow
at
pH
7
Technic
al
purity
Dose-r
ange,
spra
y(g
a.i.
ha)
1)
Dose-r
ange,
media
(lg
L)
1)
Com
pany
Acifl
uorf
en-s
odiu
mP
roto
porp
hyrinogen
oxid
ase
inhib
itor
1.1
944%
0.0
13–1000
1.1
7–1200
BA
SF
Diq
uat
PS
I-ele
ctr
on
div
ers
ion
)4.6
0374
gL
)1a
0.0
12–1000
1.1
7–600
Syngenta
Gly
phosate
EP
SP
synth
ase
inhib
itor
)3.2
0m
in.
95%
0.0
46–760
2.2
3–1140
Chem
inova
Halo
xyfo
p-P
-meth
yl
AC
Case
inhib
itor
4.0
096.7
%0.0
07–137
0.2
0–100
Dow
Agro
Scie
nce
MC
PA
Auxin
agonis
ts0.7
193%
0.6
1–10000
2.1
9–1100
Kla
rsoe
Mets
ulfuro
n-m
eth
yl
ALS
-inhib
itor
)1.7
598.5
%0.0
30–1000
0.0
35–20
DuP
ont
Pendim
eth
alin
Mic
rotu
bule
assem
bly
inhib
itor
5.1
898%
0.0
02–300
0.9
8–500
BA
SF
Terb
uth
yla
zine
PS
II-inhib
itor
3.2
199%
0.0
12–1500
1.1
9–600
Syngenta
Theinform
ationisobtained
from
ThePesticideManual(Tomlin,2003).Followingacronymsare
used:EPSP(5-enoyl-pyruvylshikim
icacid3-phosphate),ALS(A
cetolactate
Synthase),ACCase
(acetylCoA
carboxylase),PSI(Photosystem
I)andPSII
(Photosystem
II).
aDiquatbromide.
Herbicides can stimulate plant growth 431
� 2008 The Author
Journal Compilation � 2008 European Weed Research Society Weed Research 48, 429–438

length, total leaf length and dry weight of each were also
measured on each plant. Leaf length was used instead of
leaf area, as the leaves coiled, which made leaf area
determinations inaccurate. Dry weight increase of roots
and shoots were calculated subtracting the average root
and shoot biomass of plants on the day of treatment of
15.5 ± 3.26 mg root plant)1 and 9.78 ± 1.48 mg shoot
plant)1 (mean ± SEM, n = 10).
Statistics
All data on biomass increase were described with
a classic monotonous four parameter logistic
dose–response model and with a biphasic logistic
dose–response model including a term for hormesis
(Cedergreen et al., 2005):
y ¼ cþ d � cþ f expð�1=xaÞ1þ ðx=eÞb
; ð1Þ
where y is the measured response, c is the lower limit at
infinite herbicide concentration ⁄dose, d is the upper
limit of the curve corresponding approximately to the
average of the control plants, f is the parameter
describing the degree of hormetic increase, a is a
parameter determining the slope of the hormetic
increase, e determines the lower limit of the concentra-
tion ⁄dose of 50% response decrease (EC ⁄ED50) and b is
proportional to the slope of the dose–response curve
around e (Cedergreen et al., 2005). As there are rarely
enough data to estimate a, its value was fixed to either
0.25, 0.5 or 1, which experience has shown to cover the
range of slope increase in most hormetic dose–response
curves in plants, and the value allowing the best fitting
curve of the three was chosen. Setting f to zero removes
the hormetic term f expð�1=xaÞ from the equation and
reduces it to the classic four parameter log-logistic
model with e equal to EC ⁄ED50. To minimise variance
inhomogeneity, an optimal Box-Cox transformation was
applied (Streibig et al., 1993). All data but one dataset
were described setting the lower limit (c) to zero,
assuming no dry weight increase of plants exposed to
infinite high herbicide concentrations. The only excep-
tion was the data on metsulfuron-methyl, which is a
slowly acting herbicide (Cobb, 1992a) and therefore has
a lower limit equal to the dry weight gained before the
herbicide affects photosynthesis. The two non-linear
models, with and without the hormetic term, were
compared by an F-test to determine which of the models
best described the data (Bates & Watts, 1988). If the
model including hormesis did not fit data better than
the three-parameter logistic model (P > 0.05), the
logistic model was chosen. For the data on acifluorfen,
MCPA, metsulfuron-methyl and pendimethalin-treated
plants in the spray experiments, the doses did not give an
adverse effect of more than approximately 30%. Hence,
these data could not be fitted to a sigmoid model.
Instead, each rate was compared to the untreated
control with a students t-test to detect significant growth
increases.
To test whether the allocation of biomass to roots
and shoots, leaves and stems in the plants treated with
low herbicide doses differed from the untreated control,
root:shoot ratio, leaf:stalk ratio, length-specific leaf dry
weight (DW cm)1) and length-specific stem weight
(DW cm)1) from treatments with an average dry weight
>90% of control plants were compared with the
controls with a students t-test. All analyses were made
using the language and environment R (R Development
Core Team, 2004) with the add-on package drc (http://
www.bioassay.dk) (Ritz & Streibig, 2005).
Results
Dry weight growth
The dry weight increases during the exposure period of
the herbicide-treated barley plants are given in Figs 1
and 2 and the parameters of the models fitted to the data
are given in Table 2. Plant growth did increase in some
experiments in response to low herbicide doses when
compared with control plant values. The growth of the
control plants did, however, also vary between experi-
mental times (Figs 1 and 2). For three of the four
experimental times with media exposure, the control
plants were not significantly different from each other
(ANOVA: P = 0.73), but for the fourth experiment the
control plant dry weight increased from the average of
0.184 ± 0.056 g dry weight plant)1 (n = 56) to
0.292 ± 0.045 g dry weight plant)1 (n = 16). A similar
observation was made for the spray experiments, where
control plants of the two first experiments were the same
(t-test: P = 0.34), but increased from 0.203 ± 0.050 g
dry weight plant)1 (n = 58) to 0.269 ± 0.041 g dry
weight plant)1 (n = 31) in the third experiment. There
was no difference in growth of control plants sprayed
with and without acetone (t-test, P > 0.05). As a
hormetic growth increase is evaluated in relation to the
control plants, the variation in the control plant growth
also affected the reproducibility of the herbicide induced
growth increase. Hence, when data were evaluated using
the control plants grown in the same growth chamber as
the treated plants, all herbicides except acifluorfen
induced a growth increase in at least one of the
experiments, but none induced it in all (Figs 1 and 2,
Table 2).
Evaluating all data in relation to the pooled control
plants for either the experiments with media exposure
(n = 72) or those with spray exposure (n = 89) gave
432 N Cedergreen
� 2008 The Author
Journal Compilation � 2008 European Weed Research Society Weed Research 48, 429–438

Fig. 1 The dry weight increase of barley plants exposed through the root media to increasing concentrations of eight different herbicides.
The experiments were repeated and data from each experiment were described with the best fitting model (Table 2, common controls).
Data from experiment one (black symbols, full curve) and experiment two (grey symbols, broken curve) are given as mean ± SE. The
average control across experiments was 0.21 ± 0.07 g dry weight plant)1 and is given by the horizontal line.
Fig. 2 The dry weight increase in barley plants sprayed with increasing concentrations of eight different herbicides. The experiments
were repeated and data from each experiment were described with the best fitting model (Table 2, common controls). For experiments that
could not be described with a dose–response model, data from each dose was compared by a t-test with either the controls of the experiments
(significant increase is marked with x) or the average control across all spray experiments (significant increase is marked with *). Data
from experiment one (black symbols, full curve) and experiment two (grey symbols, broken curve) are given as mean ± SE. The average
control across experiments was 0.23 ± 0.06 g dry weight plant)1 and is given by the horizontal line.
Herbicides can stimulate plant growth 433
� 2008 The Author
Journal Compilation � 2008 European Weed Research Society Weed Research 48, 429–438

Table
2Model
parametersofthebestfittingmodel
forwhole
plantdry
weightasafunctionofherbicideconcentrationordose
Herb
icid
eE
xposure
Experim
ent
contr
ol
Poole
dcontr
ol
bd
ef
am
ax
bd
ef
am
ax
Acifl
uorf
en
Media
11.5
6±
0.2
20.1
8±
0.0
157
±8
1.4
5±
0.2
60.1
9±
0.0
149
±10
Media
21.0
7±
0.2
50.2
0±
0.0
119
±5
0.9
8±
0.2
70.2
1±
0.0
1159
±48
Diq
uat
Media
11.2
3±
0.2
30.2
0±
0.0
190
±15
1.0
0±
0.2
70.2
1±
0.0
155
±14
Media
21.4
4±
0.2
40.1
9±
0.0
121
±3
0.0
74
±0.0
16
1–
1.4
3±
0.4
80.2
1±
0.0
119
±5
0.0
99
±0.0
34
0.2
50.2
6
Spra
y1
2.5
3±
0.5
50.2
5±
0.0
1170
±23
3.1
1±
0.6
70.2
3±
0.0
1201
±24
Spra
y2
0.9
8±
0.1
70.1
9±
0.0
169
±20
0.0
70
±0.0
27
10.2
31.1
4±
0.1
60.2
2±
0.0
197
±16
Gly
phosate
Media
11.3
8±
0.1
90.1
6±
0.0
113
±4
0.2
23
±0.0
67
0.5
0.2
61.5
8±
0.6
40.2
1±
0.0
118
±6
0.1
00
±0.0
60
0.5
0.2
5
Media
21.4
3±
0.1
50.2
6±
0.0
1113
±14
1.6
7±
0.4
40.2
1±
0.0
1100
±20
0.1
20
±0.0
32
0.2
50.2
7
Spra
y1
2.7
0±
0.5
60.2
8±
0.0
1354
±38
2.3
3±
0.4
80.2
3±
0.0
1310
±36
0.1
16
±0.0
19
0.2
50.3
0
Spra
y2
1.2
2±
0.2
60.1
9±
0.0
1499
±87
0.0
70
±0.0
17
10.2
51.2
0±
0.3
20.2
2±
0.0
1513
±103
0.0
38
±0.0
16
10.2
6
Halo
xyfo
pM
edia
11.2
6±
0.1
40.1
9±
0.0
113
±2
1.1
3±
0.3
30.2
1±
0.0
111
±3
Media
22.2
2±
0.5
00.1
8±
0.0
125
±4
0.7
2±
0.4
00.2
1±
0.0
111
±5
Spra
y1
0.8
9±
0.1
60.2
1±
0.0
16.7
±5.1
0.1
68
±0.1
28
10.2
31.1
9±
0.1
80.2
2±
0.0
119
±3
Spra
y2
6.2
4±
5.3
30.2
1±
0.0
141
±6
1.5
5±
0.5
00.2
3±
0.0
133
±6
MC
PA
Media
10.5
8±
0.1
00.1
6±
0.0
174
±60
0.1
28
±0.0
74
0.2
50.1
90.6
4±
0.1
40.2
1±
0.0
1139
±50
Media
20.7
8±
0.1
30.2
5±
0.0
1109
±30
1.1
5±
0.3
20.2
1±
0.0
1149
±40
Mets
ulfuro
nM
edia
1a
0.5
6±
0.1
20.1
6±
0.0
11.0
±0.9
0.2
82
±0.1
31
0.2
50.2
10.6
6±
0.2
30.1
9±
0.0
10.8
±1.3
0.4
51
±0.4
92
0.2
50.2
2
Media
2a
1.4
6±
0.2
50.3
0±
0.0
14.3
±5.7
1.3
8±
0.4
80.2
1±
0.0
12.9
±0.8
0.2
60
±0.0
55
0.2
50.3
2
Pendim
eth
alin
Media
10.8
8±
0.1
20.2
0±
0.0
134
±6
0.7
3±
0.1
80.2
1±
0.0
122
±7
Media
20.2
9±
0.1
00.2
0±
0.0
15.0
±0.2
0.2
9±
0.1
20.2
1±
0.0
111
±31
Terb
uth
yla
zine
Media
10.9
1±
0.1
60.1
5±
0.0
116
±6
0.4
0±
0.0
80.2
1±
0.0
12.5
±1.2
Media
22.3
1±
0.4
50.2
6±
0.0
145
±6
1.5
2±
0.5
10.2
1±
0.0
133
±9
0.1
71
±0.0
54
0.2
50.2
8
Spra
y1
1.9
3±
0.4
90.2
1±
0.0
1204
±32
0.0
3±
0.0
21
0.2
39
2.2
2±
0.5
50.2
3±
0.0
1214
±31
Spra
y2
2.0
5±
0.4
70.2
1±
0.0
1209
±30
1.7
6±
0.4
00.2
2±
0.0
0186
±27
Thecalculationsare
madeboth
usingexperim
entalcontrolsandusingpooledcontrols.Thesignificance
oftheparametersisgiven
inEqn(1).Forcurves
withhorm
esisthemaxim
um
response
isgiven
under
max(g
dry
weightincrease).Allparametersexcept
a,whichisfixed,andmaxwhichiscalculated,are
given
±SE.
aThecurves
werefitted
withlower
limitswhichwere0.037±
0.009and0.055±
0.004fordata
fitted
withexperim
entalcontrols,respectively,and0.045±
0.016and0.057±
0.016fordata
fitted
withpooledcontrols.
434 N Cedergreen
� 2008 The Author
Journal Compilation � 2008 European Weed Research Society Weed Research 48, 429–438

more consistent results (Tables 2 and 3). Using the
pooled control plants showed no hormesis for haloxyfop
and pendimethalin, hormesis in one out of four exper-
iments for acifluorfen, diquat and terbuthylazine and
significant hormesis in four out of four experiments for
glyphosate and metsulfuron-methyl (Tables 2 and 3). In
Table 3, the hormetic growth increase is calculated from
the difference between the control plant average, either
experimental or pooled, and the corresponding fitted
maximum value of the hormetic dose–response curves
(Table 2). The results are given as percentage of control
plant growth. For the spray experiments, which could
not be described with a dose–response model, the
maximum value was calculated as either a single
treatment or an average of treatments within a range
bordered by treatments with growth rates significantly
higher than the untreated control. These treatment doses
or dose-ranges were: 0.28 lg L)1 for the second metsul-
furon-methyl experiment and 1.95–15.6 lg L)1 for the
second pendimethalin experiment when compared with
experimental control plants. When compared to the
pooled control plants, it was 1.17–75 g a.i. ha)1 and
1.3–42 g a.i. ha)1 for the first acifluorfen and MCPA
experiments and 0.16–0.31 g a.i. ha)1 and 0.28 g
a.i. ha)1 for the first and second metsulfuron-methyl
experiments respectively.
Trade-off between traits
The root:shoot and leaf:stalk ratios, length-specific leaf
weight and stalk weights and total leaf and stalk length
of plants exposed to herbicide concentrations or doses
giving <10% adverse effect were compared with the
control plants, using a two-tailed t-test (Table 4). There
were inter-experimental variations between control
plants in the morphological endpoints (ANOVA:
P < 0.05), so comparisons were made between treated
plants and experimental control plants and pooled
control plants. The comparisons with pooled control
plants are shown. Using experimental control plants did
not change any of the over-all conclusions, but showed,
as for the growth endpoint, more variance among
replications (not shown).
The MCPA was the only herbicide which increased
the root:shoot ratio of the plants in all treatments
(Table 4). Terbuthylazine showed a similar trend, but
not significantly in all experiments. For glyphosate-
treated plants, the root:shoot ratio increased in sprayed
plants but not in plants exposed through the media.
Plants treated with acifluorfen, diquat, haloxyfop and
metsulfuron-methyl did not show any consistent trend in
root:shoot allocation when sprayed, but they all had a
tendency towards decreasing root:shoot ratio when
exposed to the herbicides through the media. Pendi-
methalin was the only herbicide inducing a significant
decrease in root:shoot ratio, though not significantly for
all experiments.
The shoot morphology was only measured on plants
exposed to herbicides through the media. The results
showed an increased leaf:stalk DW ratio for haloxyfop-
treated plants (Table 4). For the remaining herbicides
and endpoints, there were no consistent trends in terms
of significant changes in shoot resource allocation
patterns. It was notable, however, that specific stalk
length was constant and equal to the untreated controls
across all treatment.
Discussion
The study showed that certain herbicides can increase
barley biomass growth and that the growth stimulation
is not a consequence of trade-off between morphological
traits. Also, the hormesis was independent of whether
the plants were exposed to the herbicide through the
media or by spraying. Though all of the eight herbicides
showed tendencies towards hormesis in at least one of
the four experiments, the two herbicides glyphosate and
metsulfuron-methyl gave the most consistent responses,
with an approximate 25% increased in biomass at
harvest when compared with the pooled control plants.
These results confirm the database study, which included
both terrestrial and aquatic plants and algae, where
growth stimulations were observed for more than
70% of the dose–response curves for these two herbi-
cides (Cedergreen et al., 2007). Studies on both barn-
yard grass (Echinochloa crus-galli, L.) and Eucalyptus
Table 3 Size of the growth stimulation given as percentage of
control for the data which were best described with a model
including hormesis
Herbicide
Experiment control Pooled control
Media
exp.
Spray
exp.
Media
exp.
Spray
exp.
1 2 1 2 1 2 1 2
Acifluorfen – – – – – – 17 –
Diquat – 17 – 4 – 26 – –
Glyphosate 33 – – 15 20 31 33 13
Haloxyfop – – 0.3 – – – – –
MCPA 1 – – – – – 17a –
Metsulfuron 11 – – 39a 6 54 21a 29a
Pendimethalin – – – 19a – – – –
Terbuthylazine – – 2 – – 36 – –
The calculations are made both in relation to the average
experimental controls and in relation to the average pooled
controls.aFor data which could not be fitted to a dose-response model,
growth increase was determined from the dose-range containing
treatments significantly higher than controls (Two-tailed t-test,
P < 0.05).
Herbicides can stimulate plant growth 435
� 2008 The Author
Journal Compilation � 2008 European Weed Research Society Weed Research 48, 429–438

(Eucalyptus grandis, L.) also show growth stimulatory
effects of glyphosate (Schabenberger et al., 1999; Duke
et al., 2006) and another sulfonylurea, sulfosulfuron,
has initiated hormesis in several other species (Davies
et al., 2003). Hence, it seems that the globally most
widely used herbicide glyphosate and the large group of
sulfonylurea herbicides have the ability to stimulate
growth in a large range of species.
Low dose growth stimulations might have implica-
tions not only for non-target species, receiving spray
drift from herbicide-treated fields, but also for the weeds
growing under glyphosate-resistant genetically modified
crops, which will receive reduced and potentially growth
stimulating doses of glyphosate. Too little is yet known
about the cause and duration of the hormetic growth
stimulation to say whether it can be used to increase
crop production and quality. Presently, low glyphosate
doses are used to increase sucrose yield in sugarcane
(Osgood et al., 1981; Su et al., 1992; Robertson &
Donaldson, 1998) and there might be other situations
where its beneficial effects on plant physiology could be
commercially utilised. To the best of our knowledge,
low dose effects of sulfonylurea herbicides have not
been investigated; but it is clear that plant
physiological responses to low doses of both types of
herbicides cannot be extrapolated from our knowledge
of effects of higher, commercially used, doses. Other
physiological mechanisms are triggered in the low dose-
range and the investigation of these poses new chal-
lenges for agronomists, environmentalists and plant
physiologists.
The fact that some herbicides have the potential of
stimulating plant growth while others have not, under-
mines the theory of hormesis being a general stress
response (Stebbing, 1998; Calabrese & Baldwin, 2001),
at least for barley growing under the presented exper-
imental conditions. It is more likely that hormesis is
compound-specific and that the key should be found in
some physiological mechanisms that are only triggered
by some types of stress. Low production of reactive
oxygen species (ROS) have been proposed as a mech-
anism to enhance plant growth, possibly through
associated effect on Ca+ membrane transport (Appen-
roth et al., 1993; Allender et al., 1997; Kovalchuk et al.,
2003). But this theory was not confirmed in this study
where diquat, a known catalyst of ROS production, and
terbuthylazine, which increase ROS production through
the blocking of the electron transport of photosystem II,
did not show reproducible hormesis.
One could argue that since all herbicides, in at least
one experiment, could induce hormesis, it must be a
general phenomenon. But since this hormesis could not
be reproduced in the present test-system, it is believed to
be erratic. Even the most pronounced hormetic effects
Table 4 Morphological data of control and herbicide-treated plants within the potential hormetic zone, defined as concentrations ⁄ doseswhere plants have an average harvest biomass >90% of controls
Herbicide Exp
Media exposure Spray exposure
n
Max.
conc.
(lg L)1)
Root:shoot
DW ratio
Leaf:stalk
DW ratio
LSLW
(mg cm)1)
LSSW
(mg cm)1)
LL
(cm)
SL
(cm) n
Max. dose
(g a.i.
ha)1)
Root:shoot
DW ratio
Pooled control 71 0.48 ± 0.10 1.90 ± 0.38 1.39 ± 0.35 3.46 ± 0.84 75 ± 16 16 ± 5 89 0.40 ± .04
Acifluorfen 1 36 31 0.39 ± 0.07 2.25 ± 0.33 1.56 ± 0.31 3.78 ± 0.94 66 ± 8 12 ± 3 44 75 0.46 ± 0.05
2 36 3 0.45 ± 0.05 1.82 ± 0.32 1.35 ± 0.17 3.36 ± 0.93 74 ± 12 17 ± 5 32 75 0.35 ± 0.03
Diquat 1 35 16 0.38 ± 0.07 2.05 ± 0.32 1.50 ± 0.22 3.57 ± 0.91 72 ± 9 16 ± 3 32 9 0.40 ± 0.06
2 44 13 0.42 ± 0.12 2.04 ± 0.30 1.43 ± 0.19 3.59 ± 0.99 90 ± 13 19 ± 5 24 9 0.44 ± 0.06
Glyphosate 1 23 23 0.52 ± 0.14 3.53 ± 1.06 1.76 ± 0.58 3.62 ± 1.47 69 ± 26 15 ± 6 44 143 0.52 ± 0.06
2 36 156 0.45 ± 0.14 1.88 ± 0.39 1.47 ± 0.16 3.87 ± 0.92 84 ± 14 18 ± 4 36 143 0.44 ± 0.05
Haloxyfop 1 39 4 0.37 ± 0.07 2.90 ± 1.25 1.79 ± 0.77 3.44 ± 0.95 65 ± 9 13 ± 3 39 6 0.50 ± 0.17
2 35 2 0.46 ± 0.07 2.35 ± 0.73 1.33 ± 0.18 3.09 ± 0.97 76 ± 14 16 ± 5 32 6 0.36 ± 0.06
MCPA 1 35 156 0.58 ± 0.14 2.14 ± 0.34 1.39 ± 0.17 3.58 ± 1.25 62 ± 19 12 ± 4 43 140 0.43 ± 0.05
2 36 16 0.56 ± 0.10 1.93 ± 0.33 1.39 ± 0.15 3.51 ± 0.59 74 ± 14 16 ± 5 39 70 0.44 ± 0.04
Metsulfuron 1 20 1.0 0.46 ± 0.08 1.98 ± 0.51 1.43 ± 0.25 3.60 ± 0.87 74 ± 16 15 ± 4 40 1.3 0.45 ± 0.12
2 24 1.0 0.37 ± 0.09 2.03 ± 0.34 1.65 ± 0.25 4.28 ± 1.40 96 ± 16 19 ± 4 39 1.3 0.40 ± 0.05
Pendimethalin 1 26 1.7 0.40 ± 0.05 2.08 ± 0.44 1.52 ± 0.20 3.81 ± 0.63 71 ± 7 14 ± 2 40 31 0.38 ± 0.04
2 36 0.6 0.49 ± 0.20 2.10 ± 0.40 1.30 ± 0.29 3.53 ± 1.25 81 ± 18 15 ± 5 32 31 0.36 ± 0.03
Terbuthylazine 1 12 0.4 0.87 ± 0.29 0.83 ± 0.39 0.67 ± 0.41 3.62 ± 1.81 67 ± 12 17 ± 5 44 76 0.46 ± 0.08
2 26 0.8 0.51 ± 0.07 1.99 ± 0.43 1.50 ± 0.15 3.61 ± 0.82 84 ± 10 19 ± 4 36 76 0.40 ± 0.07
The maximal concentration ⁄ dose (Max. conc.) defining the hormetic zone is given together with the number of plants within the zone (n).
The morphological parameters measured are: root:shoot dry weight (DW) ratio, leaf:stalk dry weight ratio, length-specific leaf weight
(LSLW), length-specific stalk weight (LSSW), total leaf length (LL) and total stalk length (SL) given as mean ± SEM. Significant
differences were tested with a two-tailed t-test (P < 0.05); significant increases are denoted in bold, while significant decreases are given in
italics.
436 N Cedergreen
� 2008 The Author
Journal Compilation � 2008 European Weed Research Society Weed Research 48, 429–438

produced by glyphosate and metsulfuron-methyl, were
not consistently repeated, because of variations in
experimental control plants, demonstrating the impor-
tance of a large number of untreated controls in these
types of studies. All growth conditions were kept
constant for all experiments, except the ambient air
surrounding the climate chambers, where varying levels
of human activities might have affected the CO2
concentrations. The climate chambers were connected
to the ambient air of the climate chamber room by a
2 cm diameter hole, but it is uncertain whether this was
enough to keep CO2 concentrations sufficiently high.
Measurements of CO2 concentrations in greenhouses
with vigorous plant growth have shown values down
to 100 ppm (Personal observations). This could
have occurred in the climate chambers as well.
Therefore, it cannot be excluded that varying CO2
concentrations could have caused some of the
variation between experimental controls. Also the
effects of ethylene, which is produced by stressed
plants and sensed by neighbouring plants (Crozier
et al., 2000), might have affected the growth of control
plants.
The experiment showed few consistent biomass
allocation patterns and none related to the glyphosate
and metsulfuron-methyl-induced hormesis, apart from
the increased root:shoot ratio for glyphosate sprayed
plants. The most notable observation from the morpho-
logical data was the lack of response of MCPA, a
synthetic auxin, on leaf and stalk length and length-
specific leaf and stalk weight. Synthetic auxins are
known to increase cell elongation in both roots and
shoots, though at different concentrations (Cobb,
1992b), and have been used to study the mechanisms
behind auxin-induced hormesis (Allender et al., 1997;
Morre, 2000). The increased root:shoot ratio in MCPA-
treated plants indicate that both root and leaf MCPA
exposure primarily stimulated root growth. The con-
centration range in the media inducing the shift in
root:shoot ratio corresponds to those found to stimulate
root elongation in studies on other plant species (Cobb,
1992b).
Conclusion
The study shows that some herbicides, but not all, can
induce a real stimulation in biomass growth when
applied at doses corresponding to 5–10% field rate.
The growth stimulations are relatively small (c. 25% dry
mass increase) and their significance is therefore very
dependent on variations in control plant growth.
Biomass allocations between plant parts did take place
in plants treated with all herbicides, but these were not
the cause of the hormetic growth stimulations.
Acknowledgements
I greatly appreciate the help of BASF, Cheminova, Dow
AgroScience, DuPont, Klarsoe and Syngenta, for
providing technical herbicides and Saatzucht Josef
Breun for providing the Barke barley seeds. I am also
grateful to Jens C. Streibig for commenting on an earlier
version of the manuscript. This work was funded by the
Danish Research Agency, project 272–05–0022.
References
ALLENDER WJ, CRESSWELL GC, KALDOR J & KENNEDY IR
(1997) Effect of lithium and lanthium on herbicide induced
hormesis in hydrophonically-grown cotton and corn. Journal
of Plant Nutrition 20, 81–95.
APPENROTH KJ, AUGSTEN H, MATTNER A, TELLER S & DOHLER
G (1993) Effect of UVB irradiation on enzymes of nitrogen
metabolism in turions of Spirodela Polyrhiza (L:) Schleiden.
Journal of Biochemistry and Photobiology 18, 215–220.
APPLEBY AP (2001) The practical implications of hormetic
effects of herbicides on plants. Belle Newsletter, October
2001, 1–3.
BATES DM & WATTS DG (1988) Nonlinear Regression Analysis
and Its Applications. Wiley & Sons, NY, USA.
CALABRESE EJ (2005) Historical blunders: how toxicology got
the dose-response relationship half right. Cellular and
Molecular Biology 51, 643–654.
CALABRESE EJ & BALDWIN LA (2001) Hormesis: a generaliz-
able and unifying hypothesis. Critical Reviews in Toxicology
31, 353–424.
CEDERGREEN N, RITZ C & STREIBIG JC (2005) Improved
empirical models describing hormesis. Environmental Toxi-
cology and Chemistry 24, 3166–3172.
CEDERGREEN N, STREIBIG JC, KUDSK P, MATHIASSEN SK &
DUKE SO (2007) The occurrence of hormesis in plants and
algae. Dose–response 5, 150–162.
COBB A (1992a) The inhibition of amino acid biosynthesis. In:
Herbicides and Plant Physiology, 1st edn, 126–143. Chapman
& Hall, London.
COBB A (1992b) Auxin-type herbicides. In: Herbicides and
Plant Physiology, 1st edn, 82–125. Chapman & Hall,
London.
CROZIER A, KAMIYA Y, BISHOP G & YOKOTA T (2000) Biosyn-
thesis of hormones and elicitor molecules. In: Biochemistry
and Molecular Biology of Plants (eds. BB BUCHANAN, W
CRUISSEM&RLJONES), 1st edn, 850–928.AmericanSociety of
Plant Physiologists, Rockville, MD, USA.
DAVIES J, HONEGGER JL, TENCALLA FG et al. (2003) Herbicide
risk assessment for non-target aquatic plants: sulfosulfuron -
a case study. Pest Management Science 59, 231–237.
DUKE SO, CEDERGREEN N, VELINI ED & BELZ RG (2006)
Hormesis: is it an important factor in herbicide use and
allelopathy? Outlooks on Pest Management 17, 29–33.
FORBES VE (2000) Is hormesis an evolutionary expectation?
Functional Ecology 14, 12–24.
FUJIWARA Y, TAKAHASHI T, YOSHIOKA T & NAKASUJI F (2002)
Changes in egg size of the diamondback moth Phutella
xylostella (Lepidoptera: Yponomeutidae) treated with
Herbicides can stimulate plant growth 437
� 2008 The Author
Journal Compilation � 2008 European Weed Research Society Weed Research 48, 429–438

fenvalerate at sublethal doses and viability of the eggs.
Applied Entomology and Zoology 37, 103–109.
KLEIJN D & VAN GROENENDAEL JM (1999) The exploitation of
heterogeneity by a clonal plant in habitats with contrasting
productivity levels. Journal of Ecology 87, 873–884.
KOVALCHUK I, FILKOWSKI J, SMITH K & KOVALCHUK O (2003)
Reactive oxygen species stimulate homologous recombina-
tion in plants. Plant, Cell and Environment 26, 1531–1539.
MORRE DJ (2000) Chemical hormesis in cell growth: a
molecular target at the cell surface. Journal of Applied
Toxicology 20, 157–163.
OSGOOD RV, MOORE PH & GINOZA HS (1981) Differential dry
matter partitioning in sugar cane cultivars treated with
glyphosate. In: Eighth Annual Meeting of Plant Growth
Regulator Society of America, 97–98. The Plant Growth
Regulater Society, St. Petersburg, FL, USA.
PARSONS PA (2003) Metabolic efficiency in response to envi-
ronmental agents predicts hormesis and invalidates the linear
no-threshold premise: ionizing radiation as a case study.
Critical Reviews in Toxicology 33, 443–449.
PEDAS P, HEBBERN CA, SCHJOERRING JK, HOLM PE & HUSTED
S (2005) Differential capacity for high-affinity manganese
uptake contributes to differences between barley genotypes
in tolerance to low manganese availability. Plant Physiology
139, 1411–1420.
R DEVELOPMENT CORE TEAM (2004) R: A Language and
Environment for Statistical Computing. R Foundation for
Statistical Computing, Vienna, Austria.
RITZ C & STREIBIG JC (2005) Bioassay analyses using R.
Journal of Statistical Software 12, 1–22.
ROBERTSON MJ & DONALDSON RA (1998) Changes in the
components of cane and sucrose yield in response to drying-
off of sugarcane before harvest. Field Crops Research 55,
201–208.
SCHABENBERGER O, THARP BE, KELLS JJ & PENNER D (1999)
Statistics,-statistical test for hormesis and effective dosages in
herbicide dose response. Agronomy Journal 91, 713–721.
SOUTHAM CM & ERLICH J (1943) Effects of extract of western
red-cedar heartwood on certain wood-decaying fungi in
culture. Phytopathology 33, 517–524.
STEBBING ARD (1998) A theory for growth hormesis. Mutation
Research 403, 249–258.
STREIBIG JC (1980) Models for curve-fitting herbicide dose
response data. Acta Agriculturæ Scandinavia 30, 59–64.
STREIBIG JC, RUDEMO M & JENSEN JE (1993) Dose-response
curves and statistical models. In: Herbicide Bioassay (eds. JC
STREIBIG & P KUDSK), 1st edn, 29–55. CRC Press, Boca
Raton, FL, USA.
SU LY, DELACRUZ A, MOORE PH & MARETZKI A (1992) The
relationship of glyphosate treatment to sugar metabolism in
sugarcane - new physiological insights. Journal of Plant
physiology 140, 168–173.
THAYER KA, MELNICK R, BURNS K, DAVIS D & HUFF J (2005)
Fundamental flaws of hormesis for public health decisions.
Environmental Health Perspectives 113, 1271–1276.
TOMLIN CDS (2003) The E-Pesticide Manual. ed. CDS TOMLIN.
[2.2]. British Crop Protection Council, Surrey, UK.
WIEDMAN SJ & APPLEBY AP (1972) Plant growth stimulation
by sublethal concentrations of herbicides. Weed Research 12,
65–74.
WIJESINGHE DK & HUTCHINGS MJ (1999) The effects of
environmental heterogeneity on the performance of Glecho-
ma hederacea: the Interactions Between Patch Contrast and
Patch Scale. Journal of Ecology 87, 860–872.
ZANUNCIO TV, SERRAO JE, ZANUNCIO JC & GUEDES RNC
(2003) Permethrin-induced hormesis on the predator Sup-
putius cincticeps (Stal, 1860) (Heteroptera: Pentatomidae).
Crop Protection 22, 941–947.
438 N Cedergreen
� 2008 The Author
Journal Compilation � 2008 European Weed Research Society Weed Research 48, 429–438