Embed Size (px)
Citation preview

Major Herbicides in Ground Water: Results from the NationalWater-Quality Assessment
Jack E. Barbash,* Gail P. Thelin, Dana W. Kolpin, and Robert J. Gilliom
ABSTRACT are unlikely to “ensure adequate protection of groundwater”—but whose use is not cancelled on a nationalTo improve understanding of the factors affecting pesticide occur-basis (USEPA, 1991, 1993a). The first set of proposedrence in ground water, patterns of detection were examined for se-
lected herbicides, based primarily on results from the National Water- PMPs will focus on four herbicides that are used pri-Quality Assessment (NAWQA) program. The NAWQA data were marily for agricultural purposes; atrazine, simazine,derived from 2227 sites (wells and springs) sampled in 20 major hydro- alachlor, and metolachlor, hereafter referred to as thelogic basins across the USA from 1993 to 1995. Results are presented PMP herbicides. Cyanazine was originally included infor six high-use herbicides—atrazine (2-chloro-4-ethylamino-6-iso- the PMP list, but subsequently removed with the cancel-propylamino-s-triazine), cyanazine (2-[4-chloro-6-ethylamino-1,3,5- lation of its registration for all uses in December 1999triazin-2-yl]amino]-2-methylpropionitrile), simazine (2-chloro-4,6-bis-
(Jones, 2000). As the PMPs evolve, their analytical[ethylamino]-s-triazine), alachlor (2-chloro-N-[2,6-diethylphenyl]-N-scope may expand to include other pesticides and pesti-[methoxymethyl]acetamide), acetochlor (2-chloro-N-[ethoxymethyl]-cide transformation products (Browner, 1996).N-[2-ethyl-6-methylphenyl]acetamide), and metolachlor (2-chloro-N-
This paper summarizes data on the occurrence of the[2-ethyl-6-methylphenyl]-N-[2-methoxy-1-methylethyl]acetamide)—as well as for prometon (2,4-bis[isopropylamino]-6-methoxy-s-tri- four PMP herbicides and three additional herbicides inazine), a nonagricultural herbicide detected frequently during the ground water of the USA, and uses this information tostudy. Concentrations were ,1 mg L21 at 98% of the sites with detec- examine how the use, persistence, and mobility of thesetions, but exceeded drinking-water criteria (for atrazine) at two sites. compounds, as well as other factors such as well depthIn urban areas, frequencies of detection (at or above 0.01 mg L21 ) and study design influence the likelihood of detectingof atrazine, cyanazine, simazine, alachlor, and metolachlor in shallow pesticides in ground water. Most of the data were derivedground water were positively correlated with their nonagricultural
from sampling conducted between 1993 and 1995 as partuse nationwide (P , 0.05). Among different agricultural areas, fre-of the National Water-Quality Assessment (NAWQA)quencies of detection were positively correlated with nearby agricul-program of the U.S. Geological Survey (USGS).tural use for atrazine, cyanazine, alachlor, and metolachlor, but not
The principal objectives of the NAWQA program aresimazine. Multivariate analysis demonstrated that for these five herbi-cides, frequencies of detection beneath agricultural areas were posi- “to describe the status of and trends in the quality oftively correlated with their agricultural use and persistence in aerobic the Nation’s ground water and surface water resourcessoil. Acetochlor, an agricultural herbicide first registered in 1994 for and to link assessment of status and trends with anuse in the USA, was detected in shallow ground water by 1995, consis- understanding of the natural and human factors thattent with previous field-scale studies indicating that some pesticides affect the quality of water” (Gilliom et al., 1995, p. 2).may be detected in ground water within 1 yr following application. The NAWQA program measures the concentrations ofThe NAWQA results agreed closely with those from other multistate
a large number of pesticides and pesticide transforma-studies with similar designs.tion products, as well as a wide variety of other chemicalconstituents in ground water, surface water, stream sedi-ments, and aquatic biota in 59 major hydrologic basins,
The widespread use of synthetic organic pesticides or study units across the USA, representing approxi-over the past several decades has led to their fre- mately 60 to 70% of the water use in the Nation.quent detection in ground water (Barbash and Resek, The NAWQA program has involved the most geo-1996), surface water (Larson et al., 1997), aquatic biota graphically extensive study of pesticides and pesticideand sediment (Nowell et al., 1999), and the atmosphere transformation products in ground water of the USA(Majewski and Capel, 1995). Concerns about the poten- to be conducted in the past decade. Among the othertial impacts of pesticides on human health, as well as multistate studies carried out to date, only the Nationalon terrestrial and aquatic ecosystems, have led to the Pesticide Survey (NPS), conducted by the USEPA fromdevelopment of a variety of monitoring and manage- 1988 to 1990 (USEPA, 1992a), was of comparable geo-ment programs by state and federal agencies. For theprotection of ground water, the USEPA is proposing a
Abbreviations: a.i., active ingredient; CGAS, Ciba-Geigy Atrazinerule to require that individual states and tribes developStudy; DRASTIC, Depth to water, net Recharge, Aquifer media, Soilpesticide management plans (PMPs) for the use of pesti-media, Topography, Impact of the unsaturated zone, and hydrauliccides deemed to have a “high leaching potential”—and Conductivity of the aquifer; HAL, lifetime health advisory level; LUS,
for which national label or restricted use requirements land-use study (NAWQA study component); MCL, maximum con-taminant level; MDL, method detection limit; MMS, MetolachlorMonitoring Study; MWPS, Midwest Pesticide Study; NAWQA, Na-J.E. Barbash, U.S. Geological Survey (USGS), 1201 Pacific Ave.,tional Water-Quality Assessment; NAWWS, National Alachlor Well-Suite 600, Tacoma, WA 98402; G.P. Thelin and R.J. Gilliom, USGS,Water Survey; NPS, National Pesticide Survey; PMP, pesticide man-Placer Hall, 6000 J Street, Sacramento, CA 95819-6129; and D.W.agement plan; SUS, subunit survey (NAWQA study component); t1/2,Kolpin, USGS, 400 S. Clinton St., Box 1230, Iowa City, IA 52244.half-life for transformation in aerobic soil; USDA-ARS, U.S. Depart-Received 4 Jan. 2000. *Corresponding author ([email protected]).ment of Agriculture–Agricultural Research Service; USEPA, U.S.Environmental Protection Agency; USGS, U.S. Geological Survey.Published in J. Environ. Qual. 30:831–845 (2001).
831

832 J. ENVIRON. QUAL., VOL. 30, MAY–JUNE 2001
graphic scope. The NAWQA program builds upon the ground water beneath different land-use settings acrossthe nation (agricultural, urban, and mixed) with theresults from the NPS in several ways, including: (i) the
use of more sensitive analytical methods for pesticides geographic patterns of agricultural use of these com-pounds.and their transformation products; (ii) the incorporation
of chemical analyses for more recently introduced pesti-cides, additional pesticide transformation products and METHODSa broad range of other chemical constituents; and (iii)
Design of the Nationala focus on ground water quality, rather than well waterWater-QualityAssessmentquality. Barbash et al. (1999) provide a detailed compar-
ison of the design of the NAWQA program with those The ground water quality data summarized here are fromof other multistate studies of pesticides in ground water. the subunit survey and land-use study components of the
NAWQA program (Gilliom et al., 1995; Squillace et al., 1996).In addition to the four PMP herbicides, the sevenSubunit surveys [SUSs, originally termed study unit surveyscompounds examined in this paper include cyanazine,by Gilliom et al. (1995) and Squillace et al. (1996)] provideprometon, and acetochlor. Although as noted earlier,large-scale spatial assessments of the quality of water drawncyanazine was removed from the original PMP list fol-from aquifers representing current or future sources of drink-lowing the cancellation of its registration, discussioning water (referred to as drinking water aquifers in this paper).of the data for this compound was retained to further This is accomplished by sampling existing wells of widely vary-
illustrate how the use patterns and persistence of high- ing depths and selected springs—and thus, ground water ofuse pesticides influence the likelihood of their detection widely varying ages—across large sections of individual studyin ground water. Prometon is examined because it is units, referred to as aquifer subunits. Because their boundariesused almost exclusively for nonagricultural purposes are established by hydrogeologic rather than anthropogenic
features, most of the SUSs sample areas of mixed land use,(Capel et al., 1999) and was the herbicide detected mosti.e., areas where no single type of land use predominates.frequently in ground water beneath urban areas during
Land-use studies (LUSs) involve the sampling of eitherthe NAWQA program (Kolpin et al., 1998a). Inclusionexisting or newly installed wells to assess the quality of shallowof this herbicide thus expands the scope of this analysisground water in more limited areas dominated by specificbeyond predominantly agricultural pesticides. Aceto-types of land use. The LUSs target ground water rechargedchlor is an agricultural herbicide first introduced in the within approximately 10 yr before sampling; local understand-
USA in 1994 (Kolpin et al., 1996a) to partially replace ing of the hydrologic system (e.g., Cowdery, 1997), as well asthe use of atrazine and alachlor. Data on its occurrence concentrations of chlorofluorocarbons, 3H (tritium), 3He, andin ground water provide an indication of the time re- SF6 measured at selected sites (C.V. Price, USGS, personalquired for a pesticide to reach detectable concentrations communication, 2000) generally indicated that this objective
was met for most of the wells sampled during these studies.in ground water—if it does so at all—following initiationTo maintain a consistent level of effort from one year to theof its widespread use. Cyanazine, prometon, and aceto-next, the NAWQA program concentrates the majority of itschlor were also included because of their chemical simi-sampling into a 3-yr high-intensity phase in approximatelylarity to the PMP herbicides; cyanazine and prometon,one-third of the study units at any point in time. Long-termlike atrazine and simazine, are triazine compounds,variations in water quality are observed through the use of awhile acetochlor, like alachlor and metolachlor, is an ac- rotating cycle in each study unit—3 yr of intensive sampling
etanilide. followed by 6 yr of relatively low-intensity activity (GilliomAn earlier summary by Kolpin et al. (1998a) provided et al., 1995).
a preliminary overview of the occurrence data for 46 of This paper summarizes selected SUS and LUS results forthe 83 pesticides and pesticide transformation products wells and springs sampled from 1993 to 1995, during the first
round of 20 NAWQA study-unit investigations. The broadexamined in ground water by the NAWQA programgeographic distribution of the areas sampled (Barbash et al.,from 1993 to 1995. The present discussion—and the1999) ensured that these SUSs and LUSs covered a wide rangemore extensive report upon which it is based (Barbashof physiographic and climatic regions. Although the 1993–1995et al., 1999)—builds upon the Kolpin et al. (1998a) sum-LUSs focused on a variety of different land-use settings, onlymary by focusing more closely on seven of these com-those conducted in agricultural and urban (including subur-pounds from several different perspectives. For these ban) areas were sufficiently numerous to merit discussion here.
seven compounds, or various subsets thereof, this paper: Furthermore, the only LUSs or SUSs examined are those for(i) compares the ranges of observed concentrations with which 10 or more sites were sampled for pesticide analyses.existing drinking-water criteria; (ii) examines the extent As a result of applying these selection criteria, data fromto which frequencies of detection in shallow ground 2227 of the approximately 2558 wells and springs sampled for
pesticides from 1993 to 1995 were included in the presentwater during the NAWQA program were correlatedanalysis. The agricultural LUSs were focused on areas domi-with the use, mobility, and persistence of the herbicides,nated by the cultivation of specific field crops, pasture, oras well as with well depth; (iii) summarizes data fromorchards (Kolpin et al., 1998a), and selected using an agricul-this and other USGS studies to examine the timing oftural classification system developed for the NAWQA pro-acetochlor detections in ground water, relative to whengram by Gilliom and Thelin (1997). The urban LUSs werethe herbicide was first applied in the USA; (iv) uses conducted in major metropolitan areas, typically the largest
comparisons with the results from other multistate stud- within each study unit of interest. Maps showing the locationsies to infer how study design can influence the frequen- of the NAWQA study units and the specific areas sampledcies of pesticide detection in ground water; and (v) com- during the LUSs and SUSs have been provided by Barbash
et al. (1999), along with a tabular summary of the principalpares the spatial distributions of herbicide detections in

BARBASH ET AL.: MAJOR HERBICIDES IN GROUND WATER 833
design features of these studies, including their geographic gas chromatographic retention times and mass spectral peaksettings, hydrogeologic characteristics, types and numbers of areas, rather than concentration thresholds (Zaugg et al.,wells sampled, and median well depths. This table is also 1995). For this reason, concentrations reported for individualavailable on the World Wide Web at http://water.wr.usgs.gov/ pesticides in this and other publications from the NAWQApnsp/fy91sum.html. program are, in some instances, lower than the MDL for the
compound of interest (e.g., Domagalski et al., 1997; Kolpinet al., 1998a; Capel et al., 1999; Martin et al., 1999).Sampling and Chemical Analyses
In addition to the MDL data, Table 1 also summarizes theThe wells sampled for this investigation were either preex- frequencies of detection in ground water field blanks for the
isting or newly installed for the NAWQA Program using the seven herbicides during the period of sampling, and comparesselection methods or installation procedures described by La- these results with the frequencies of detection in all of thepham et al. (1995). All ground water samples were obtained ground water samples examined for this study. Each fieldusing the methods summarized by Koterba et al. (1995). Many blank consisted of pesticide-free water that was passed throughof the NAWQA sites were sampled more than once for pesti- the field sampling equipment after (i) a ground water samplecides during these studies, but the data discussed here include was taken and (ii) the sampling equipment was decontami-only one sample per site—typically the first one taken. Excep- nated using standard NAWQA procedures (Koterba et al.,tions to the latter approach occurred in two different situa- 1995). According to Martin et al. (1999), cross-contaminationtions. First, for those networks where the initial sampling (as observed and quantified in field blanks) need not be consid-involved only a subset of all the sites within the network, the ered in the interpretation of detections of an individual pesti-data used were those from the year when all of the wells in cide or pesticide transformation product in environmentalthe network were sampled for pesticides. Second, at sites samples if the ratio of the frequency of detection at any concen-where the first sampling involved analyses for only a subset tration in the environmental samples to the frequency of detec-of all the targeted pesticides and pesticide transformation tion at any concentration in field blanks is greater than 5.0.products (see below), the data used were those from the sam-
Based on this criterion, the detections in the field blanks (Ta-pling when analyses for the full suite of pesticides and transfor-ble 1) were at sufficiently low frequencies to conclude thatmation products of interest were carried out.cross-contamination did not interfere significantly with theDuring the 1993–1995 sampling period for the NAWQAinterpretation of the ground water data for any of the sevenProgram, chemical analyses were carried out for 76 pesticidesherbicides of interest.and 7 pesticide transformation products (Gilliom et al., 1999).
The data examined in this paper included detections belowThe method employed for the analysis of all seven herbicidesthe MDL for three of the seven herbicides of interest—of interest to this discussion involved solid-phase extractionprometon, simazine, and metolachlor. Furthermore, the re-onto C18 cartridges followed by capillary-column gas chroma-sults shown in Table 1 suggest that some of the detectionstography–mass spectrometry (Zaugg et al., 1995). The methodbelow the MDL (particularly some of those for prometondetection limits (MDLs) for the seven herbicides, listed inand simazine) may have been caused by cross-contamination.Table 1, were considerably lower than those for most otherHowever, because the methods introduced by Martin et al.large-scale studies of pesticide occurrence in ground water(1999) are based on the criteria described by Zaugg et al.(Barbash and Resek, 1996). However, the MDLs were deter-(1995)—rather than MDLs—for analyte detections, they ac-mined using standard procedures established by the USEPAcount for the potential influence of cross-contamination be-(1992b) to represent “the minimum concentration of a sub-low, as well as above, the MDL.stance that can be identified, measured, and reported with
All other factors being equal, studies that employ lower99% confidence that the compound concentration is greaterreporting limits for a given pesticide have generally observedthan zero” (Zaugg et al., 1995, p. 22).higher frequencies of its detection in ground water than studiesAs noted by Kolpin et al. (1998a), the MDLs for theusing higher reporting limits (e.g., Burkart and Kolpin, 1993;NAWQA program provide an indication of the relative sensi-Barbash and Resek, 1996). This inverse relation makes it diffi-tivities of the analytical methods to the different compoundscult to compare detection frequencies among different com-examined, but they were not used as thresholds for reportingpounds, different studies, or different phases of the same studydetections. Instead, pesticide detections were reported when
specific analytical identification criteria were met, based on if reporting limits are not uniform. To compensate for this,
Table 1. Method detection limits (MDLs), frequencies of detection at all concentrations and below the MDL in ground water samples(1993–1995), and frequencies of detection at all concentrations and below the MDL in ground water field blanks (1992–1995) duringthe NAWQA program for the seven herbicides of interest.
Frequency of detection Frequency of detectionin ground water samples‡ in ground water field blanks§
No. of No. ofsites All Detections field All Detections
Herbicide MDL† sampled‡ concentrations below MDL blanks§ concentrations below MDL
mg L21 % %Atrazine 0.001 2227 30.1 0 145 2.8 0Cyanazine 0.004 2227 1.0 0 145 0 0Prometon 0.018 2227 11.8 5.7 145 0.7 0.7Simazine 0.005 2227 14.3 2.8 145 1.4 1.4Acetochlor 0.002¶ 953 0.2 0 15 0 0Alachlor 0.002 2227 2.2 0 145 0 0Metolachlor 0.002 2227 11.7 0.6 145 1.4 0
† Data from Zaugg et al. (1995) for all compounds except acetochlor.‡ Data include all LUS and SUS sites discussed in this report.§ Data from Martin et al. (1999).¶ MDL value from Lindley et al. (1996).

834 J. ENVIRON. QUAL., VOL. 30, MAY–JUNE 2001
detection frequencies were computed on the basis of a com- 4. The estimated crop area to which the herbicide was ap-plied within each buffer was multiplied by a statewide estimatemon reporting limit for any such comparisons examined in
this paper. The reporting limit used here to compare results of the average rate of application of the active ingredient tothat crop (Gianessi and Anderson, 1996).among different compounds or different study components
for the NAWQA program was 0.01 mg L21. (Although the 5. The total amount of active ingredient applied within eachbuffer was computed as the sum of the amounts applied toMDL for prometon is 0.018 mg L21, the use of the data on
detections below the MDLs made it possible to use the 0.01 individual crops in the buffer.6. The total amount of active ingredient applied within themg L21 reporting limit for the herbicide in these comparisons.)
Because the MDLs for the NAWQA program were lower LUS network was calculated as the sum of the amounts appliedin the buffers surrounding all of the sites sampled in thethan or equal to those used by other multistate studies of
pesticide occurrence in ground water, when the NAWQA network.7. The total amount of active ingredient applied within allresults for an individual pesticide were compared with those
from another study, the reporting limit for the other study of the buffers in the LUS network was divided by the total areaof all the buffers to estimate the mass applied per unit area.was employed for the comparison (Barbash et al., 1999).
Although this approach may have underestimated the in-tensity of use for some compounds in areas dominated byEstimating Chemical Uselow-use crops (especially atrazine use on pasture), it was in-
To investigate statistical and geographic relations between tended to account for use on every crop for which use dataherbicide detections and use, quantitative estimates of the were available for each herbicide. This approach has beenintensity of chemical applications (i.e., the mass of active ingre- described in greater detail by Thelin and Gianessi (2000),dient applied per unit area) were assembled for three different who employed these methods to estimate pesticide use withinspatial scales; nationwide, countywide, and individual LUSs. individual drainage basins, rather than 1-km buffers.However, the finest spatial scale at which such informationcould be obtained in a consistent format nationwide was on
Use Estimates for Individual Countiesa countywide basis, and only for pesticide applications in ag-ricultural settings (Gianessi and Anderson, 1996). Estimates of Estimates of the total agricultural use of individual herbi-nonagricultural pesticide use were considerably more limited, cides per unit area of harvested cropland were also computedand available only at a national scale (Gianessi and Puffer, for each county of the USA, based on the work of Thelin and1990). As a result, geographic variations in herbicide use were Gianessi (2000). These estimates were obtained by addingonly examined for agricultural settings. Furthermore, among together the total amount of active ingredient applied to ag-the seven parent compounds of interest, quantitative nation- ricultural crops and pasture in the county (Gianessi and An-wide data on use in both agricultural and nonagricultural set- derson, 1996) and dividing by the total area of harvested crop-tings were available only for the four PMP herbicides and cyan- land and pasture in the county, based on the 1992 Census ofazine. Agriculture (U.S. Dep. of Commerce, 1995).
Agricultural herbicide use was computed for two spatialdomains. Using the methods described below, estimates of
Selection of Data on Herbicide Propertiesuse within a circle, or buffer of 1 km radius surrounding eachof the sites sampled for the agricultural LUSs were calculated The soil organic C partition coefficient, or Koc, is a measureto examine statistical correlations between herbicide use and of the tendency of a compound to partition into soil organicdetection frequencies during these studies. [Data from one of C from aqueous solution, and was therefore used to provide athe SUSs were included in the analysis because this SUS, quantitative, inverse indication of herbicide mobility in groundconducted in central Nebraska, involved the sampling of shal- water. For this paper, half-lives for transformation in aerobiclow ground water in an area dominated by row-crop agricul- soil were used to quantify persistence, rather than the moreture (Barbash et al., 1999.)] The intensity of herbicide use was commonly cited field dissipation half-lives, because aerobicalso calculated on a countywide basis for the construction of soil half-lives are not affected by offsite transport, and aremaps displaying geographic patterns of herbicide detection measured under conditions that are more controlled thanand use across the nation. those employed for field dissipation studies (USDA-ARS,
1995; Barbash and Resek, 1996).Table 2 summarizes data on Koc and aerobic soil half-lifeUse Estimates for Agricultural Land-Use Studies
for the seven herbicides. Although several comprehensiveFor each agricultural LUS, an estimate of agricultural use summaries of these properties have been published for pesti-
was obtained for each herbicide through the following pro- cides (e.g., Kenaga, 1980; Nash, 1988), the parameter valuescedure. in the table were taken from two of the most widely cited and
readily available compilations of such data, the USDA-ARS1. Using a geographic information system, the 1-km buffersPesticide Properties Database (USDA-ARS, 1995), and thesurrounding the individual sampling sites were superimposedUSEPA Pesticide Environmental Fate “One-Line Summar-on USGS land-use and land-cover data (USGS, 1990) to com-ies” (USEPA, 1993b, 1994a,b,c, 1995, 1996a,b), the latter sopute the area of each buffer mapped as agriculture, includingnamed for their brevity. The data in Table 2 demonstrate theorchards, vineyards, and pasture, based on the Anderson Levelconsiderable variability in parameter values that have beenII classification system (Anderson et al., 1976).reported for many of these compounds, sometimes spanning2. For each of the crops to which the herbicide may havean order of magnitude or more.been applied, county-based data from the 1992 Census of
For each herbicide, Table 2 lists the Koc and aerobic soilAgriculture (U.S. Dep. of Commerce, 1995) were used tohalf-life values selected for the statistical analyses. In mostestimate the area of the crop harvested within each 1-kminstances, this value was the one recommended by the authorsbuffer.of the USDA-ARS (1995) database. For the aerobic soil half-3. The area of each crop within each buffer was multipliedlife, when multiple values were available for a given herbicideby a statewide estimate of the percentage of that crop to which
the herbicide was applied (Giannesi and Anderson, 1996). but none was recommended, the value measured in a loam

BARBASH ET AL.: MAJOR HERBICIDES IN GROUND WATER 835
Table 2. Soil organic C partition coefficients (Koc ) and half-livessoil (silty loam, loamy silt, or silty clay loam) was the onefor transformation in aerobic soils for the seven herbicidesselected. Both transformation rate (e.g., Nash, 1988) and, forof interest.many compounds, Koc (e.g., Bailey and White, 1964; Schwar-
zenbach et al., 1993), are known to vary considerably with Half-life for transformationKoc in aerobic soiltemperature, but the temperature of measurement was seldom
provided for either parameter by the sources consulted Range of values Range of valuesSelected in sources Selected in sources(USDA-ARS, 1995; USEPA, 1993b, 1994a,b,c, 1995, 1996a,b)—
Herbicide value† consulted‡ value† consulted‡a situation commonly encountered in the literature (Barbashand Resek, 1996). mL/g days
Atrazine 147 38–288 146 21–330Cyanazine 218 40–235 17 10–98Prometon 95 32–300 932 .365, 932Statistical AnalysesSimazine 140 103–230 91 36–234
Simple linear correlations, Spearman rank correlations, and Acetochlor 239§ 74–428 14§ 8–110Alachlor 124 43–209 |21 14–21multiple linear regression were employed to examine statisti-Metolachlor 70 22–307 26 26, 67cal relations between the frequencies of herbicide detection
in shallow ground water during the LUSs and a variety of † Values obtained from USDA-ARS (1995) for all compounds exceptacetochlor. See text for methods used to select data from among multipleexplanatory variables. (All statistical tests were evaluated at avalues in data sources. No temperature(s) of measurement provided insignificance level [a] of 0.05.) Unlike simple linear correlations USDA-ARS (1995) for either Koc or half-life in aerobic soil.
and multiple linear regressions, which are both parametric ‡ Data obtained from USDA-ARS (1995) and USEPA (1993b; 1994a,b,c;1995; 1996a,b). Temperature(s) of measurement seldom provided fortechniques, Spearman rank correlations are nonparametric.either Koc or half-life in aerobic soil.A nonparametric analogue to a standard correlation coeffi-
§ Data obtained from USEPA (1994a).cient for the relation between two variables, Spearman’s r iscomputed by replacing the individual values for each variablewith their respective ranks among the other values for that the NAWQA study are shown in Fig. 1. For each herbi-variable, and then computing a correlation coefficient (r) using cide, these results are presented for four sampling com-the ranks, rather than the original data (Helsel and Hirsch, ponents; shallow ground water sampled in agricultural1992). areas (agricultural LUSs), urban areas (urban LUSs),
These analyses focused on the LUS results, rather than and areas of mixed land use (SUSs sampling shallowthose from the SUSs, for two reasons. First, the effects of ground water), and deeper ground water sampled inpesticide use (the variable of principal interest in this analysis)
areas of mixed land use (deeper SUSs). An SUS wason ground water quality are more likely to be evident inconsidered to have sampled shallow ground water “ifshallow ground water than in deeper aquifers. Second, rela-the wells sampled showed evidence of being influencedtions between occurrence and use are more easily discernedby recent recharge and were of generally comparablein areas of relatively homogeneous land use than in those withdepth to LUS wells in the same area” (Gilliom et al.,mixed land use.
As is often the case for anthropogenic contaminants in 1998, p. 8).environmental media, the frequencies of herbicide detection Consistent with observations reported by previousamong the different LUS areas were strongly skewed toward large-scale studies of pesticide concentrations in groundlow values. The intensities of agricultural use among the LUS water (Barbash, 1995), 98% of the detections of theareas were similarly distributed. To obtain distributions that seven herbicides were at concentrations ,1 mg L21.more closely approximated normality, both parameters were Consequently, water-quality criteria for the protectiontherefore subjected to a log transformation before examining of drinking water (USEPA, 2000) were rarely exceededall parametric statistical relations between occurrence and use
(Fig. 1). Among the seven herbicides, exceedances ofin agricultural areas for the NAWQA study. To accomodatemaximum contaminant levels (MCLs) or lifetime healththis transformation, in all cases where an herbicide was notadvisory levels (HALs) during the NAWQA study oc-detected at or above 0.01 mg L21 in a particular agriculturalcurred at two of the 2227 sites of interest, and only forLUS, its detection frequency was assigned a value of 1%
(smaller than the lowest nonzero detection frequency for any atrazine. Both sites were shallow (LUS) wells; one wasof the herbicides in any of the LUSs) before the transformation located in an agricultural area and the other was usedwas applied. Similarly, for every agricultural LUS in which for drinking water in an urban area. However, simplethe total agricultural use of a given herbicide within the 1-km assessments of risk based solely on comparisons of con-buffers surrounding all sampled sites was zero, the agricultural taminant concentrations with drinking-water quality cri-use was assigned a value of 0.001 kg of active ingredient per teria should be viewed with caution because, for a vari-square kilometer (smaller than the smallest use value for any
ety of reasons described elsewhere (e.g., Kolpin et al.,herbicide in any LUS network) to accomodate the log transfor-1998a; Barbash et al., 1999; Gilliom et al., 1999), usemation. Five sites for which agricultural use data were notof these criteria may underestimate the health risks toavailable, out of a total of 995 sites, were excluded from thishumans or aquatic organisms.analysis (Barbash et al., 1999).
Frequencies of DetectionRESULTS AND DISCUSSIONOf the seven herbicides of interest, all but acetochlorConcentrations in Relation to were among the 10 pesticides or pesticide transforma-Drinking-Water Quality Criteria tion products detected most often in ground water dur-
ing the 1993–1995 NAWQA sampling (Kolpin et al.,The concentrations at which the seven herbicideswere detected in ground water from 1993 to 1995 during 1998a; Barbash et al., 1999; USGS, 1999). Frequencies

836 J. ENVIRON. QUAL., VOL. 30, MAY–JUNE 2001
of detection at or above 0.01 mg L21 in ground water Variations in the frequencies of detection among thedifferent herbicides and study components provide cluesare shown in Fig. 2. These results are displayed for
the same four study components examined in Fig. 1. regarding the effects of a variety of natural and anthro-
Fig. 1. Concentrations of herbicides measured in ground water at individual sites during the NAWQA investigation, in relation to drinking-water quality criteria (USEPA, 2000). Lifetime health advisory level (HAL) shown for herbicides for which no maximum contaminant level(MCL) has been established. (Neither criterion has yet been established for acetochlor.) Overall percentage of sites with no detections givenabove the not detected symbols for each herbicide. Number of sites sampled for each study component given in Fig. 2. LUSs, land-use studies;SUSs, subunit surveys.
Fig. 2. Frequencies of herbicide detection in ground water from 1993 to 1995, by study component, during the NAWQA investigation. Numbersof sites sampled for acetochlor given in brackets. LUSs, land-use studies; SUSs, subunit surveys.
BARBASH ET AL.: MAJOR HERBICIDES IN GROUND WATER 837
General Relations between Occurrencepogenic factors on the likelihood of detecting these com-and Land-Use Settingpounds in ground water. The influences of several of
these factors are examined below. Atrazine was the herbicide detected in ground watermost frequently during all of the NAWQA study com-
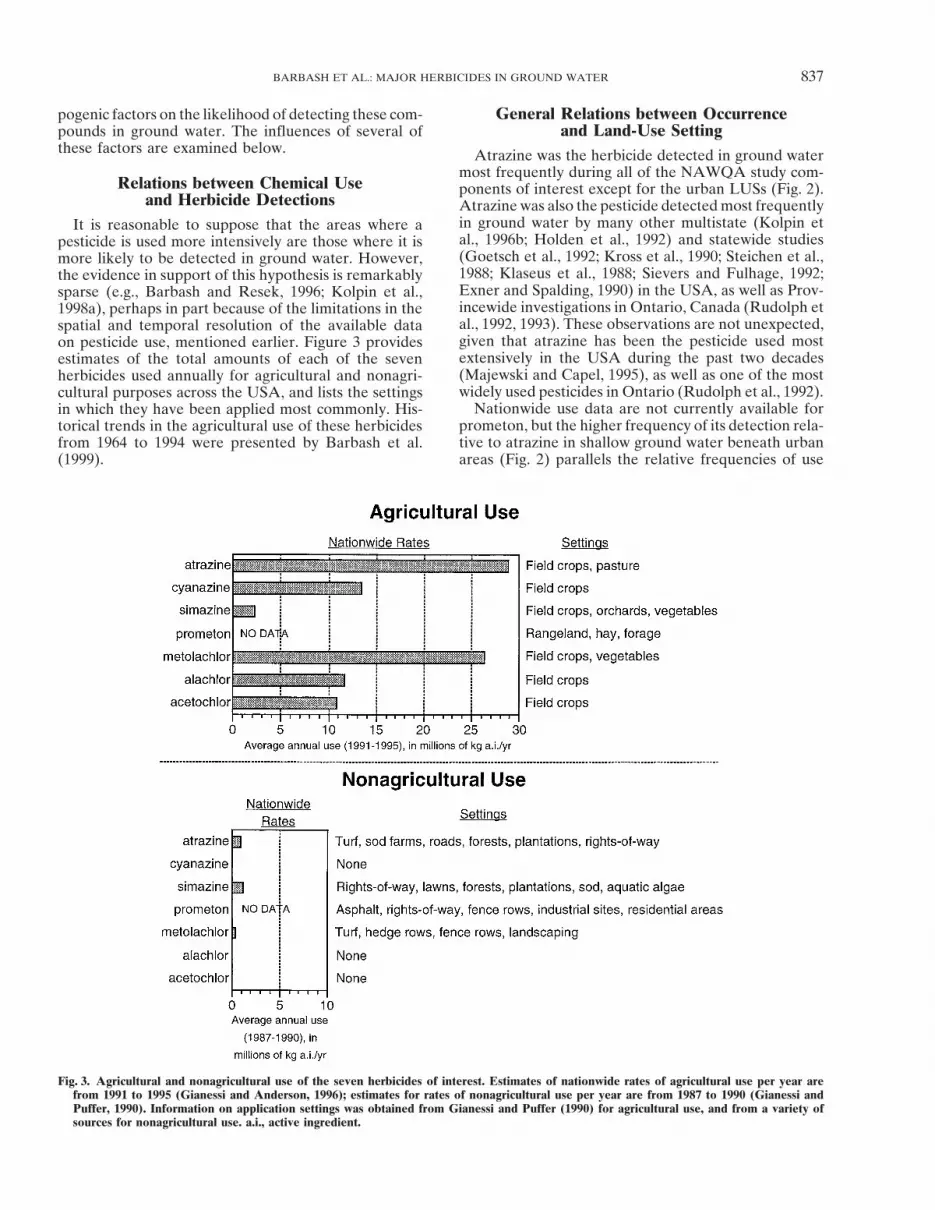
Relations between Chemical Use ponents of interest except for the urban LUSs (Fig. 2).and Herbicide Detections Atrazine was also the pesticide detected most frequently
in ground water by many other multistate (Kolpin etIt is reasonable to suppose that the areas where aal., 1996b; Holden et al., 1992) and statewide studiespesticide is used more intensively are those where it is(Goetsch et al., 1992; Kross et al., 1990; Steichen et al.,more likely to be detected in ground water. However,1988; Klaseus et al., 1988; Sievers and Fulhage, 1992;the evidence in support of this hypothesis is remarkablyExner and Spalding, 1990) in the USA, as well as Prov-sparse (e.g., Barbash and Resek, 1996; Kolpin et al.,incewide investigations in Ontario, Canada (Rudolph et1998a), perhaps in part because of the limitations in theal., 1992, 1993). These observations are not unexpected,spatial and temporal resolution of the available datagiven that atrazine has been the pesticide used moston pesticide use, mentioned earlier. Figure 3 providesextensively in the USA during the past two decadesestimates of the total amounts of each of the seven(Majewski and Capel, 1995), as well as one of the mostherbicides used annually for agricultural and nonagri-widely used pesticides in Ontario (Rudolph et al., 1992).cultural purposes across the USA, and lists the settings
Nationwide use data are not currently available forin which they have been applied most commonly. His-prometon, but the higher frequency of its detection rela-torical trends in the agricultural use of these herbicidestive to atrazine in shallow ground water beneath urbanfrom 1964 to 1994 were presented by Barbash et al.
(1999). areas (Fig. 2) parallels the relative frequencies of use
Fig. 3. Agricultural and nonagricultural use of the seven herbicides of interest. Estimates of nationwide rates of agricultural use per year arefrom 1991 to 1995 (Gianessi and Anderson, 1996); estimates for rates of nonagricultural use per year are from 1987 to 1990 (Gianessi andPuffer, 1990). Information on application settings was obtained from Gianessi and Puffer (1990) for agricultural use, and from a variety ofsources for nonagricultural use. a.i., active ingredient.

838 J. ENVIRON. QUAL., VOL. 30, MAY–JUNE 2001
may also be extensive in agricultural areas, albeit fornoncrop applications.
The detection in urban areas of cyanazine (Fig. 1 and2), an herbicide used only in agricultural settings (Fig.3), may have been the result of historical applications,atmospheric deposition, or transport from nearby appli-cation areas, either in the air (for example, via spraydrift) or in ground water. Similarly, atrazine and meto-lachlor may also have reached the shallow ground waterin the urban areas by atmospheric or subsurface trans-port from nearby agricultural applications. Indeed, de-tections of cyanazine, atrazine, metolachlor, and alachlorin rainfall and stormwater runoff in a small urban water-shed in Minneapolis, MN, where none of the compoundshad been applied (Capel et al., 1998), as well as theresults from other studies (e.g., Nations and Hallberg,1992; Rawn et al., 1998; Hoffman et al., 2000), demon-strate that these and other pesticides may be carried byatmospheric transport from nearby application areasinto watersheds where they are not used. For simazine,the similarity between the agricultural and urban areaswith respect to detection frequencies in shallow groundwater (Fig. 2) is consistent with the fact that the nation-wide use of this herbicide was nearly as high in nonagri-cultural settings as in agricultural locations at the timeof sampling (Fig. 3).
Comparisons of the results from the NAWQA investi-gation with those from other multistate studies reinforcethe relations between herbicide detections and land-usesetting described above. Figure 4 displays such compari-sons for atrazine and metolachlor. Similar plots wereprovided by Barbash et al. (1999) for cyanazine, pro-meton, simazine, and alachlor, but not included herebecause of space considerations. Atrazine and meto-lachlor were selected for display both because they werethe most intensively used triazine and acetanilide herbi-cides, respectively, at the time of sampling (Fig. 3), andbecause the results for these compounds from the differ-ent multistate studies illustrate some of the potentialeffects of study design on pesticide detection frequen-cies (discussed in a later section).
Fig. 4. Frequencies of herbicide detection in ground water for the Since, as noted earlier, valid comparisons of detectionmultistate studies in relation to reporting limits for (a ) atrazine, frequencies among different compounds or studies mayand (b ) metolachlor. CGAS, Ciba-Geigy Atrazine Study (Balu et be carried out only after correcting for variations inal., 1998); LUSs, land-use studies; MMS, Metolachlor Monitoring
reporting limits, frequencies of herbicide detection inStudy (Roux et al., 1991); MWPS, Midwest Pesticide Study (Kolpinet al., 1995); NAWWS, National Alachlor Well-Water Survey ground water are presented in Fig. 4 relative to the(Holden et al., 1992); NPS, National Pesticide Survey (USEPA, reporting limits for each study. Results from six multi-1990, 1992a); SUSs, subunit surveys; t1/2, half-life for transformation state studies are shown: the NAWQA study, the USGSin aerobic soil.
Midwest Pesticide Study (MWPS; Kolpin et al., 1996b),the NPS (USEPA, 1990, 1992a), the National Alachlorof the two herbicides in residential settings. AccordingWell-Water Survey (NAWWS; Holden et al., 1992), theto Whitmore et al. (1992), in 1990, prometon was appliedCiba-Geigy Atrazine Study (CGAS; Balu et al., 1998),outdoors in residential areas 1 281 000 times, while atra-and the Metolachlor Monitoring Study (MMS; Roux etzine was applied 477 000 times. Other studies also haveal., 1991). Owing to the availability of all the resultsobserved close associations between urban land use andfrom the NAWQA and MWPS investigations, the dataprometon occurrence in ground water (e.g., Burkart andfrom these two studies are presented as continuous fre-Kolpin, 1993), including several conducted as part ofquency distributions relative to different hypothetical re-the NAWQA program (Christenson and Rea, 1993;porting limits, rather than as point values. The NAWQAAtor and Ferrari, 1997; Kolpin et al., 1998a). The rela-data are displayed for three study components in thetively frequent detection of prometon during the ag-
ricultural LUSs, however (Fig. 2), indicates that its use figure; shallow ground water in agricultural and urban

BARBASH ET AL.: MAJOR HERBICIDES IN GROUND WATER 839
may also explain why atrazine was detected relativelyareas (agricultural and urban LUSs, respectively) andfrequently in some areas with low agricultural usedrinking water aquifers (all SUSs). Although the MWPS(Fig. 5).has involved several rounds of sampling between 1991
The considerable scatter in the data shown in Fig. 5and 1994, the data from the 1992 sampling (Kolpin et(and the correspondingly low R2 and Spearman’s r val-al., 1995) are shown in Fig. 4 because the 1992 MWPSues) indicates that, as might be expected, herbicidesampling design was the one most closely resemblingdetection frequencies in shallow ground water are con-that of the NAWQA study (Barbash et al., 1999).trolled by other factors in addition to use. Multiple re-As noted earlier for the NAWQA data alone (Fig.gression analysis was therefore employed to explore the2), the relative frequencies of detection among the threeinfluence of some of these other explanatory variables.NAWQA study components and the MWPS, NAWWS,
and NPS investigations, shown in Fig. 4, are consistentInfluence of Herbicide Properties and Wellwith patterns of atrazine and metolachlor use. In accord
Depth on Herbicide Detectionswith the fact that their nationwide agricultural use ex-ceeded their nonagricultural use by at least an order of All other natural and anthropogenic factors beingmagnitude at the time of sampling (Fig. 3), frequencies equal, the likelihood of detecting a pesticide in groundof detection of both herbicides were highest for the water, compared with another, is directly related to itsstudies that focused primarily on agricultural areas, i.e., mobility in the aqueous phase and its persistence inthe NAWQA agricultural LUSs and the MWPS. soil. Although the results from a number of field and
laboratory studies support this hypothesis, patterns ofpesticide detection derived from large-scale ground wa-Statistical Relations between Occurrence andter monitoring investigations often do not. By contrast,Use in Urban and Agricultural Areaswell depth, one of the parameters examined most fre-
In the urban LUSs, the frequencies of detection of quently in relation to pesticide detections, has com-the four PMP herbicides and cyanazine at or above 0.01 monly been found to vary inversely with the frequencymg L21 among all of the 318 sites sampled were positively of detection (Barbash and Resek, 1996). The data fromcorrelated with their respective intensities of nonagri- the NAWQA program provide an opportunity to deter-cultural use across the nation (Barbash et al., 1999). mine the extent to which frequencies of herbicide detec-This relation was found to be statistically significant tion in ground water are correlated with these variables.among the five compounds (R2 5 0.85; P 5 0.026; simple Initial analysis of the NAWQA LUS results by Kolpinlinear correlation between untransformed variables). et al. (1998a) using Spearman rank correlations indi-
cated that among the 20 pesticides detected at or aboveAmong the 39 agricultural LUSs, the relations ob-0.01 mg L21 in shallow ground water beneath agriculturalserved between frequencies of detection at or aboveareas, the frequencies of detection were significantly0.01 mg L21 in ground water and the intensity of agricul-related to the agricultural use and subsurface mobilitytural use for the five herbicides (Fig. 5) were qualita-(Koc ) of the compounds (P , 0.05, Spearman rank corre-tively similar to those reported by, or determined fromlation), but not to their field dissipation half-lives.the results of previous investigations (Barbash and Re-Through an examination of mutivariate correlations,sek, 1996). Frequencies of detection were generallythis paper extends the analysis of Kolpin et al. (1998a)lower in areas of low use for all of the herbicides, whilefor the four PMP herbicides and cyanazine to examinethe highest detection frequencies were usually encoun-the degree to which their detection frequencies in shal-tered in areas of more intensive use. Areas with higherlow ground water beneath agricultural areas were re-use, however, also tended to show greater variability inlated to their agricultural use, Koc and aerobic soil half-detection frequencies than areas with lower use. Thus,lives (Table 2), as well as the median well depths of thein general, high use was a necessary, but not a sufficientsampled networks (Barbash et al., 1999). As with thecondition for the frequent detection of an herbicide inprevious multivariate analysis of the NAWQA LUSshallow ground water beneath agricultural areas.data presented by Kolpin et al. (1998a), and for theStatistically significant linear correlations betweenreasons discussed earlier, these computations were car-detection frequencies and use among the agriculturalried out following the log transformation of all variables.LUSs were observed for atrazine and metolachlor (P ,
The multiple regression results indicate that the fre-0.003), but not for simazine, alachlor, or cyanazine (Fig.quencies with which the PMP herbicides and cyanazine5). When these relations were examined from a nonpar-
ametric perspective, however, they were found to be were detected in shallow ground water during the ag-ricultural LUSs were significantly correlated with theirstatistically significant for atrazine, metolachlor, ala-
chlor, and cyanazine (P , 0.02; Spearman rank correla- aerobic soil half-lives and their agricultural use in theindividual LUSs (P # 0.0001 for each parameter), buttions), but not simazine, suggesting that the relations
for alachlor and cyanazine may have been nonlinear. not with their Koc (P 5 0.19) or the median well depthof the sampled networks (P 5 0.72). Overall, however,The absence of a significant correlation between detec-
tion frequency and use for simazine (Fig. 5) was caused, variations in agricultural use and aerobic soil half-lifeaccounted for ,40% of the observed variability in de-in part, by its relatively high frequencies of detection
in some of the study areas with lower agricultural use—a tection frequencies (adjusted R2 5 0.36 for the regres-sion with all four parameters, as well as for the regres-potential consequence of its extensive use in nonagricul-
tural settings (Fig. 3). Substantial nonagricultural use sion with use and half-life alone).

840 J. ENVIRON. QUAL., VOL. 30, MAY–JUNE 2001
Fig. 5. Frequencies of herbicide detection in shallow ground water for NAWQA land-use studies conducted in agricultural areas, in relation tototal agricultural use within a 1-km radius of all sites sampled for each study. Studies with zero use assigned a value of 0.001 kg a.i. per squarekilometer to accomodate log scale (see text). a.i., active ingredient; R2, coefficient of determination for linear correlation; r, Spearman’s rankcorrelation coefficient; t1/2, half-life for herbicide transformation in aerobic soil. *, ** Statistically significant at the 0.05 and 0.001 probabilitylevels, respectively.
Both Fig. 4 and Fig. 5 illustrate the significant relation The nonsignificant correlations of herbicide detectionfrequencies with Koc and median well depth were likelybetween herbicide detection frequencies and persis-
tence identified by the multiple regression model. In caused in part by the relatively narrow range spannedby both explanatory variables. The lack of significantboth figures, maximum frequencies of herbicide detec-
tion at a given reporting limit (Fig. 4) or intensity of correlation between detection frequencies and Koc dur-ing the multivariate correlation analysis is in markeduse (Fig. 5) are generally lower for compounds with
shorter aerobic soil half-lives. (The herbicides are ar- contrast to the significant, inverse relation observed byKolpin et al. (1998a) between the two parameters forranged in order of decreasing persistence in both fig-
ures.) This trend is corroborated by the results from a the NAWQA LUS data. However, this contrast is notnecessarily surprising. Only five herbicides were exam-study involving the sampling of 88 municipal wells in
Iowa, during which the frequencies of detection of trans- ined for the present case, with Koc values varying byonly a factor of three (Table 2), while Kolpin et al.formation products, relative to those of their respective
parent compounds (acetochlor, alachlor, metolachlor, (1998a) examined all 20 pesticides detected at or above0.01 mg L21 in the agricultural LUSs—a set of com-atrazine, and cyanazine), were found to increase with
decreasing persistence of the parent compound (Kolpin pounds for which Koc values spanned more than twoorders of magnitude. Similarly, as with the nonsignifi-et al., 1998b).

BARBASH ET AL.: MAJOR HERBICIDES IN GROUND WATER 841
cant relation seen here between herbicide detection fre- ment (Aller et al., 1987). However, the frequencies ofquencies and the median depths of the wells in the herbicide detection during the NAWWS were similarsampled networks, a lack of a significant correlation to those during the NAWQA SUSs (Fig. 4; Barbash etbetween herbicide detection frequencies in near-surface al., 1999), an observation that is consistent with theaquifers and well depths during the first year of the limited success with which the DRASTIC system hasMWPS was attributed by Burkart and Kolpin (1993) to been shown to predict actual ground water contamina-the relatively narrow range of well depths examined tion in the past (Barbash and Resek, 1996).during their study.
Geographic Relations betweenInfluence of Time Elapsed Since Application Occurrence and Use(Acetochlor Results)
The statistical analyses of the NAWQA data for fiveAs noted earlier, acetochlor was first registered for of the herbicides of interest, discussed earlier, indicated
use in the USA in 1994. Chemical analyses for the herbi- the extent to which frequencies of detection in shallowcide during the NAWQA LUSs and SUSs began in June ground water were related to their use in agriculturalof that year (Martin et al., 1999). By the end of 1995, (Fig. 5) and nonagricultural settings. As a complementanalyses for acetochlor had been carried out at 953 of to this approach, Fig. 6 displays relations between usethe 2227 NAWQA LUS and SUS sites of interest (Fig.and occurrence from a geographical, rather than a statis-2). The herbicide was detected in two of the sampledtical perspective. As with Fig. 4, the data for only twowells, both of which were located in areas of known useof the seven herbicides, atrazine and metolachlor, were(Barbash et al., 1999). In other USGS studies, based onselected for display because of space limitations. Bar-a reporting limit of 0.05 mg L21, acetochlor was notbash et al. (1999) presented maps of this type for six ofdetected in the 38 shallow wells sampled by the MWPSthe herbicides of interest, i.e., all but acetochlor.in the summer of 1994 (Kolpin et al., 1996b), but was
Countywide use data are shown in Fig. 6 in relationdetected in shallow ground water during the statewideto the median intensity of agricultural use among allsampling in Iowa in the summers of 1995 (Kolpin et al.,counties in the USA with reported use of the compound1997) and 1996 (Kolpin et al., 1998b). These observa-of interest, i.e., (i) no estimated countywide use (white);tions provide large-scale support for the results from(ii) countywide use greater than zero, but less than theseveral field-scale studies (discussed by Barbash andmedian value among all counties with reported useResek, 1996) indicating that some pesticides may reach(tan); and (iii) countywide use greater than or equal toshallow ground water in detectable concentrationsthe median value (light brown). As noted elsewherewithin the first year following their initial application.(Barbash and Resek, 1996; Larson et al., 1997; Barbashet al., 1999), some distortion can occur when pesticideInfluence of Study Designuse data are displayed on a countywide basis. In areasThe data shown in Fig. 4 display remarkable agree- where pesticide applications take place in only a rela-ment among the results from different multistate investi-tively small portion of a given county, for example, thegations conducted with similar designs, once variationsareal extent of application will be exaggerated on thein reporting limits among studies are accounted for.map, especially in areas such as the western USA whereConversely, some of the results shown in Fig. 4 suggestcounties tend to be larger than in other regions of thethat, as has been previously noted (Barbash and Resek,country.1996), studies targeting areas of higher risk for pesticide
Each sampling network in Fig. 6 is classified, by sym-contamination are likely to detect the compounds ofbol shape, according to the four NAWQA study compo-interest more frequently than studies employing a morenents of interest—shallow ground water in agriculturalrandomized sampling design. Both the CGAS and theareas (agricultural LUSs), urban areas (urban LUSs),MMS explicitly focused their sampling on areas deemedand areas of mixed land use (shallow SUSs); and deepervulnerable to ground water contamination from surfaceaquifers (deeper SUSs). Detection frequencies in thesources, while the NAWQA, MWPS, and NPS investi-individual NAWQA sampling networks are displayedgations selected their sampling sites at random afterrelative to the median value among all of the networksstratifying according to variables such as land use, wellwith one or more detections of the compound of interest,type, and hydrogeologic setting. This pronounced con-i.e., (i) not detected (blue); (ii) detection frequencytrast in the criteria used to select sampling sites is likelygreater than zero but less than the median value amongto be the reason why, even after accounting for varia-all networks with detections (yellow); and (iii) detectiontions in reporting limits, the frequencies of atrazine andfrequency greater than or equal to the median valuemetolachlor detection by the CGAS and MMS, respec-among all networks with detections (red). To providetively, were so much higher than those observed by thethe most complete picture of geographic variations inNAWQA, MWPS, or NPS investigations (Barbash etoccurrence, the frequencies of detection shown in Fig.al., 1999).6 incorporate all detections for each herbicide, and thusThe NAWWS also employed a stratified random de-were not adjusted to a common reporting limit for thesign (Holden et al., 1992), but one for which wells weretwo compounds. Consequently, these maps cannot bemore likely to be sampled in areas where ground wateremployed to compare detection frequencies betweenwas deemed to be more vulnerable to contamination,
based on the DRASTIC system for vulnerability assess- atrazine and metolachlor in specific areas; as noted ear-

842 J. ENVIRON. QUAL., VOL. 30, MAY–JUNE 2001
Fig. 6. Frequencies of herbicide detection in ground water for the NAWQA study in relation to agricultural use (Gianessi and Anderson, 1996);(a ) atrazine, (b ) metolachlor. LUSs, land-use studies; SUSs, subunit surveys.
BARBASH ET AL.: MAJOR HERBICIDES IN GROUND WATER 843
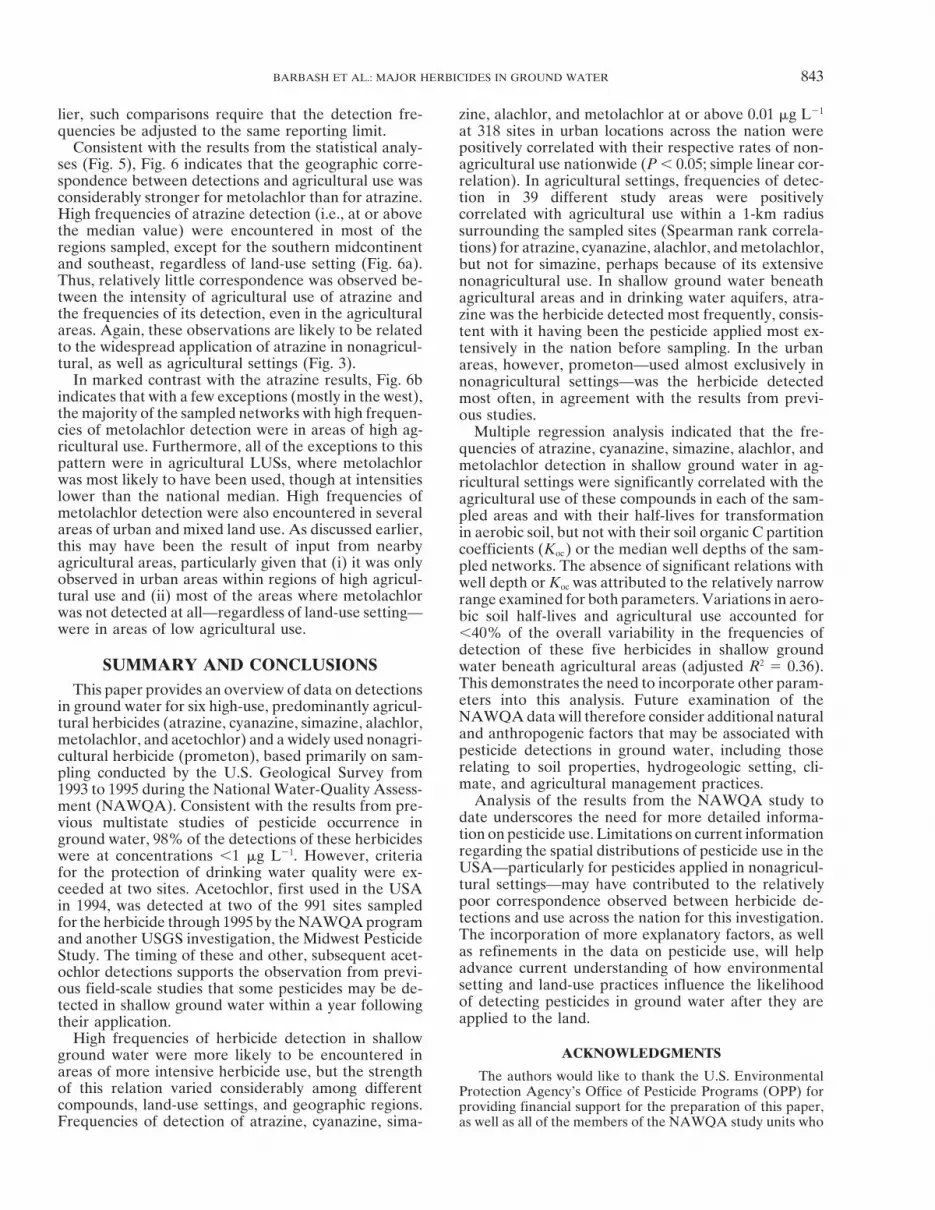
lier, such comparisons require that the detection fre- zine, alachlor, and metolachlor at or above 0.01 mg L21
at 318 sites in urban locations across the nation werequencies be adjusted to the same reporting limit.Consistent with the results from the statistical analy- positively correlated with their respective rates of non-
agricultural use nationwide (P , 0.05; simple linear cor-ses (Fig. 5), Fig. 6 indicates that the geographic corre-spondence between detections and agricultural use was relation). In agricultural settings, frequencies of detec-
tion in 39 different study areas were positivelyconsiderably stronger for metolachlor than for atrazine.High frequencies of atrazine detection (i.e., at or above correlated with agricultural use within a 1-km radiusthe median value) were encountered in most of the surrounding the sampled sites (Spearman rank correla-regions sampled, except for the southern midcontinent tions) for atrazine, cyanazine, alachlor, and metolachlor,and southeast, regardless of land-use setting (Fig. 6a). but not for simazine, perhaps because of its extensiveThus, relatively little correspondence was observed be- nonagricultural use. In shallow ground water beneathtween the intensity of agricultural use of atrazine and agricultural areas and in drinking water aquifers, atra-the frequencies of its detection, even in the agricultural zine was the herbicide detected most frequently, consis-areas. Again, these observations are likely to be related tent with it having been the pesticide applied most ex-to the widespread application of atrazine in nonagricul- tensively in the nation before sampling. In the urbantural, as well as agricultural settings (Fig. 3). areas, however, prometon—used almost exclusively in
In marked contrast with the atrazine results, Fig. 6b nonagricultural settings—was the herbicide detectedindicates that with a few exceptions (mostly in the west), most often, in agreement with the results from previ-the majority of the sampled networks with high frequen- ous studies.cies of metolachlor detection were in areas of high ag- Multiple regression analysis indicated that the fre-ricultural use. Furthermore, all of the exceptions to this quencies of atrazine, cyanazine, simazine, alachlor, andpattern were in agricultural LUSs, where metolachlor metolachlor detection in shallow ground water in ag-was most likely to have been used, though at intensities ricultural settings were significantly correlated with thelower than the national median. High frequencies of agricultural use of these compounds in each of the sam-metolachlor detection were also encountered in several pled areas and with their half-lives for transformationareas of urban and mixed land use. As discussed earlier, in aerobic soil, but not with their soil organic C partitionthis may have been the result of input from nearby coefficients (Koc ) or the median well depths of the sam-agricultural areas, particularly given that (i) it was only pled networks. The absence of significant relations withobserved in urban areas within regions of high agricul- well depth or Koc was attributed to the relatively narrowtural use and (ii) most of the areas where metolachlor range examined for both parameters. Variations in aero-was not detected at all—regardless of land-use setting— bic soil half-lives and agricultural use accounted forwere in areas of low agricultural use. ,40% of the overall variability in the frequencies of
detection of these five herbicides in shallow groundSUMMARY AND CONCLUSIONS water beneath agricultural areas (adjusted R2 5 0.36).
This demonstrates the need to incorporate other param-This paper provides an overview of data on detectionseters into this analysis. Future examination of thein ground water for six high-use, predominantly agricul-NAWQA data will therefore consider additional naturaltural herbicides (atrazine, cyanazine, simazine, alachlor,and anthropogenic factors that may be associated withmetolachlor, and acetochlor) and a widely used nonagri-pesticide detections in ground water, including thosecultural herbicide (prometon), based primarily on sam-relating to soil properties, hydrogeologic setting, cli-pling conducted by the U.S. Geological Survey frommate, and agricultural management practices.1993 to 1995 during the National Water-Quality Assess-
Analysis of the results from the NAWQA study toment (NAWQA). Consistent with the results from pre-date underscores the need for more detailed informa-vious multistate studies of pesticide occurrence intion on pesticide use. Limitations on current informationground water, 98% of the detections of these herbicidesregarding the spatial distributions of pesticide use in thewere at concentrations ,1 mg L21. However, criteriaUSA—particularly for pesticides applied in nonagricul-for the protection of drinking water quality were ex-tural settings—may have contributed to the relativelyceeded at two sites. Acetochlor, first used in the USApoor correspondence observed between herbicide de-in 1994, was detected at two of the 991 sites sampledtections and use across the nation for this investigation.for the herbicide through 1995 by the NAWQA programThe incorporation of more explanatory factors, as welland another USGS investigation, the Midwest Pesticideas refinements in the data on pesticide use, will helpStudy. The timing of these and other, subsequent acet-advance current understanding of how environmentalochlor detections supports the observation from previ-setting and land-use practices influence the likelihoodous field-scale studies that some pesticides may be de-of detecting pesticides in ground water after they aretected in shallow ground water within a year followingapplied to the land.their application.
High frequencies of herbicide detection in shallowACKNOWLEDGMENTSground water were more likely to be encountered in
areas of more intensive herbicide use, but the strength The authors would like to thank the U.S. Environmentalof this relation varied considerably among different Protection Agency’s Office of Pesticide Programs (OPP) forcompounds, land-use settings, and geographic regions. providing financial support for the preparation of this paper,
as well as all of the members of the NAWQA study units whoFrequencies of detection of atrazine, cyanazine, sima-

844 J. ENVIRON. QUAL., VOL. 30, MAY–JUNE 2001
bution of water-quality conditions. U.S. Geol. Surv. Circ. 1112.were responsible for selecting the sampling sites, installing theAvailable online at http://water.usgs.gov/pubs/circ1112/ (verifiedwells, collecting the water samples, providing their pesticide18 Jan. 2001).occurrence data, and offering local expertise on their respec-
Gilliom, R.J., J.E. Barbash, D.W. Kolpin, and S.J. Larson. 1999. Test-tive study areas. The authors would also like to thank Toming water quality for pesticide pollution. Environ. Sci. Technol.Nolan, George Groschen (USGS), Richard Lowrance (USDA- 33:164A–169A. Available online at http://pubs.acs.org/ hotartcl/est/
ARS), and three anonymous reviewers for providing very 99/apr/test.html (verified 31 Jan. 2001).constructive and valuable comments, and Arty Williams, Gilliom, R.J., D.K. Mueller, and L.H. Nowell. 1998. Methods forCharles Evans and John Simons (OPP) for their additional comparing water-quality conditions among National Water-Qual-input. ity Assessment study units, 1992–1995. U.S. Geol. Surv. Open-File
Rep. 97-589. Available online at http://water.wr.usgs.gov/pnsp/rep/ofr97589/ (verified 18 Jan. 2001).REFERENCES
Gilliom, R.J., and G.P. Thelin. 1997. Classification and mapping ofAller, L., T. Bennett, J.H. Lehr, R. Petty, and G. Hackett. 1987. agricultural land for National Water-Quality Assessment. U.S.
DRASTIC: A standardized system for evaluating ground water Geol. Surv. Circ. 1131. Available online at http:// ca.water.usgs.gov/pollution potential using hydrogeologic settings. USEPA Rep. 600/ pnsp/circ1131/ (verified 31 Jan. 2001).2-87/035. USEPA, R.S. Kerr Environ. Research Lab., Ada, OK. Goetsch, W.D., D.P. McKenna, and T.J. Bicki. 1992. Statewide survey
Anderson, J.R., E.E. Hardy, J.T. Roach, and R.E. Witmer. 1976. A for agricultural chemicals in rural, private water-supply wells inland use and land cover classification system for use with remote Illinois. Illinois Dep. of Agric., Bureau of Environ. Programs,sensor data. U.S. Geol. Surv. Prof. Pap. 964. Springfield, IL.
Ator, S.W., and M.J. Ferrari. 1997. Nitrate and selected pesticides in Helsel, D.R., and R.M. Hirsch. 1992. Statistical methods in waterground water of the Mid-Atlantic Region. U.S. Geol. Surv. Water resources. Studies in Environ. Sci. 49. Elsevier, New York, NY.Resour. Invest. Rep. 97-4139. Hoffman, R.S., P.D. Capel, and S.J. Larson. 2000. Comparison of
Bailey, G.W., and J.L. White. 1964. Review of adsorption and desorp- pesticides in eight U.S. urban streams. Environ. Toxicol. Chem.tion of organic pesticides by soil colloids, with implications concern- 19:2249–2258.ing pesticide bioactivity. J. Agric. Food Chem. 12:324–331. Holden, L.R., J.A. Graham, R.W. Whitmore, W.J. Alexander, R.W.
Balu, K., P.W. Holden, L.C. Johnson, and M.W. Cheung. 1998. Sum- Pratt, S.K. Liddle, and L.L. Piper. 1992. Results of the Nationalmary of Ciba Crop Protection groundwater monitoring study for Alachlor Well Water Survey. Environ. Sci. Technol. 26:935–943.atrazine and its degradation products in the United States. In L.G. Jones, J. 2000. Cyanazine; cancellation order. Fed. Regist. (6 Jan.Ballantine et al. (ed.) Triazine herbicides: Risk assessment. ACS 2000). 65:771–773.Symp. Ser. 683:227–238. Kenaga, E.E. 1980. Predicted bioconcentration factors and soil sorp-Barbash, J.E. 1995. Pesticides in ground water: Current understandingtion coefficients of pesticides and other chemicals. Ecotoxicol. En-of distribution and major influences. U.S. Geol. Surv. Fact Sheetviron. Saf. 4:26–38.FS-244-95. Available online at http://ca.water.usgs.gov/pnsp/gw/
Klaseus, T.G., G.C. Buzicky, and E.C. Schneider. 1988. Pesticides and(verified 18 Jan. 2001).groundwater: Surveys of selected Minnesota wells. Minn. Dep. ofBarbash, J.E., and E.A. Resek. 1996. Pesticides in ground water:Health, Minneapolis, MN, and Minn. Dep. of Agric., St. Paul, MN.Distribution, trends, and governing factors. Pesticides in the Hydro-
Kolpin, D.W., J.E. Barbash, and R.J. Gilliom. 1998a. Occurrence oflogic System Series, Vol. 2. CRC Press, Boca Raton, FL.pesticides in shallow ground water of the United States: InitialBarbash, J.E., G.P. Thelin, D.W. Kolpin, and R.J. Gilliom. 1999.results from the National Water-Quality Assessment Program. En-Occurrence of major herbicides in ground water of the Unitedviron. Sci. Technol. 32:558–566. Available online at http://ca.water.States: Results from sampling by the U.S. Geol. Surv. Water Re-usgs.gov/pnsp/ja/est32/ (verified 18 Jan. 2001).sour. Invest. Rep. 98-4245. Available online at http://water.wr.usgs.
Kolpin, D.W., D.A. Goolsby, and E.M. Thurman. 1995. Pesticides ingov/pnsp/rep/wrir984245/ (verified 18 Jan. 2001).near-surface aquifers: An assessment using highly sensitive analyti-Browner, C.M. 1996. Pesticides and ground water state managementcal methods and tritium. J. Environ. Qual. 24:1125–1132.plan regulation: Proposed rule. Fed. Regist. (26 June 1996). 61:
Kolpin, D.W., S.J. Kalkhoff, D.A. Goolsby, D.A. Sneck-Fahrer, and33260–33301.E.M. Thurman. 1997. Occurrence of selected herbicides and herbi-Burkart, M.J., and D.W. Kolpin. 1993. Hydrologic and land-use factorscide degradation products in Iowa’s ground water, 1995. Groundassociated with herbicides and nitrate in near-surface aquifers. J.Water 35:679–688.Environ. Qual. 22:646–656.
Kolpin, D.W., B.K. Nations, D.A. Goolsby, and E.M. Thurman. 1996a.Capel, P.D., M. Lin, and P.J. Wotzka. 1998. Wet atmospheric deposi-Acetochlor in the hydrologic system in the midwestern Unitedtion of pesticides in Minnesota, 1989–1994. U.S. Geol. Surv. WaterStates, 1994. Environ. Sci. Technol. 30:1459–1464.Resour. Invest. Rep. 97-4026.
Kolpin, D.W., E.M. Thurman, and D.A. Goolsby. 1996b. OccurrenceCapel, P.D., A.H. Spexet, and S.J. Larson. 1999. Occurrence andof selected pesticides and their metabolites in near-surface aquifersbehavior of the herbicide prometon in the hydrologic system. Envi-of the midwestern United States. Environ. Sci. Technol. 30:335–340.ron. Sci. Technol. 33:674–680.
Kolpin, D.W., E.M. Thurman, and M. Linhart. 1998b. The environ-Christenson, S.C, and A. Rea. 1993. Ground-water quality in the Okla-mental occurrence of herbicides: The importance of degradates inhoma City urban area. p. 589–611. In W.M. Alley (ed.) Regionalground water. Arch. Environ. Contam. Toxicol. 35:385–390.ground-water quality. Van Nostrand Reinhold, New York, NY.
Koterba, M.T., F.D. Wilde, and W.W. Lapham. 1995. Ground-waterCowdery, T.K. 1997. Shallow ground-water quality beneath croplanddata-collection protocols and procedures for the National Water-in the Red River of the North Basin, Minnesota and North Dakota,Quality Assessment Program: Collection and documentation of1993–1995. U.S. Geol. Surv. Water Resour. Invest. Rep. 97-4001.water-quality samples and related data. U.S. Geol. Surv. Open-Domagalski, J.L., N.M. Dubrovsky, and C.R. Kratzer. 1997. PesticidesFile Rep. 95-399.in the San Joaquin River, California: Inputs from dormant sprayed
Kross, B.C., G.R. Hallberg, D.R. Bruner, R.D. Libra, K.D. Rex,orchards. J. Environ. Qual. 26:454–465.L.M.B. Weih, M.E. Vermace, L.F. Burmeister, N.H. Hall, K.L.Exner, M.E., and R.F. Spalding. 1990. Occurrence of pesticides andCherryholmes, J.K. Johnson, M.I. Selim, B.K. Nations, L.S. Seigley,nitrate in Nebraska’s ground water. Univ. of Nebraska Water Cen-D.J. Quade, A.G. Dudler, K.D. Sesker, M.A. Culp, C.F. Lynch,ter, Inst. of Agric. and Natural Resources, Lincoln, NE.H.F. Nicholson, and J.P. Hughes. 1990. The Iowa state-wide ruralGianessi, L.P., and J.E. Anderson. 1996. Pesticide use in U.S. cropwell-water survey water quality data: Initial analysis. Tech. Inf.production: National data report (February 1995, revised AprilSer. 19. Iowa Dep. of Natural Resources, Iowa City, IA.1996). National Center for Food and Agric. Policy, Washington,
Lapham, W.W., F.D. Wilde, and M.T. Koterba. 1995. Ground-waterDC.data-collection protocols and procedures for the National Water-Gianessi, L.P., and C. Puffer. 1990. Herbicide use in the United States.Quality Assessment Program: Selection, installation, and documen-Resources for the Future, Washington, DC.tation of wells, and collection of related data. U.S. Geol. Surv.Gilliom, R.J., W.M. Alley, and M.E. Gurtz. 1995. Design of the Na-
tional Water-Quality Assessment Program: Occurrence and distri- Open-File Rep. 95-398.
BARBASH ET AL.: MAJOR HERBICIDES IN GROUND WATER 845
Larson, S.J., P.D. Capel, and M.S. Majewski. 1997. Pesticides in surface 90-015. USEPA, Office of Pesticides and Toxic Substances, Wash-ington, DC.waters: Distribution, trends, and governing factors. Pesticides in
the Hydrologic System Series, Vol. 3. CRC Press, Boca Raton, FL. U.S. Environmental Protection Agency. 1991. Pesticides and ground-water strategy. USEPA Rep. 21T-1022. USEPA, Office of Pesti-Lindley, C.E., J.T. Stewart, and M.W. Sandstrom. 1996. Determination
of low concentrations of acetochlor in water by automated solid- cides and Toxic Substances, Washington, DC.U.S. Environmental Protection Agency. 1992a. Another look–phase extraction and gas chromatography with mass-selective de-
tection. J. Assoc. Off. Anal. Chem. Int. 79:962–966. national survey of pesticides in drinking water wells: Phase 2 Rep.USEPA Rep. 579/09-91/020. Available from National Tech. Inf.Majewski, M.S., and P.D. Capel. 1995. Pesticides in the atmosphere:
Distribution, trends, and governing factors. Pesticides in the Hydro- Service, Springfield, VA, as NTIS Rep. PB 91-125765. U.S. Gov.Print. Office, Washington, DC.logic System Series, Vol. 1. CRC Press, Boca Raton, FL.
Martin, J.D., R.J. Gilliom, and T.L. Schertz. 1999. Summary and U.S. Environmental Protection Agency. 1992b. Guidelines establish-ing test procedures for the analysis of pollutants (App. B, Part 136,evaluation of pesticides in field blanks collected for the National
Water-Quality Assessment Program, 1992–1995. U.S. Geol. Surv. Definition and procedures for the determination of the methoddetection limit). U.S. Code of Fed. Reg., Title 40:565–567.Open-File Rep. 98-412. Available online at http://water.wr.usgs.
gov/pnsp/rep/ofr98412.pdf (verified 31 Jan. 2001). U.S. Environmental Protection Agency. 1993a. Guidance for pesti-cides and ground water state management plans. USEPA Rep.Nash, R.G. 1988. Dissipation from soil. p. 131–169. In R. Grover (ed.)
Environmental chemistry of herbicides, Vol. 1. CRC Press, Boca 735-B-93-005a. USEPA, Office of Prevention, Pesticides, and ToxicSubstances, Washington, DC.Raton, FL.
Nations, B.K., and G.R. Hallberg. 1992. Pesticides in Iowa precipita- U.S. Environmental Protection Agency. 1993b. Pesticide environmen-tal fate one-line summary—Prometon. USEPA Office of Pesticidetion. J. Environ. Qual. 21:486–492.
Nowell, L.H., P.D. Capel, and P.D. Dileanis. 1999. Pesticides in stream Programs, Environ. Fate and Effects Div., Washington, DC.U.S. Environmental Protection Agency. 1994a. Pesticide environmen-sediment and aquatic biota: Distribution, trends and governing
factors. Pesticides in the Hydrologic System Series, Vol. 4. CRC tal fate one-line summary—Acetochlor. USEPA Office of PesticidePrograms, Environ. Fate and Effects Div., Washington, DC.Press, Boca Raton, FL.
Rawn, D.R., T.H.J. Halldorson, and D.C.G. Muir. 1998. Atmospheric U.S. Environmental Protection Agency. 1994b. Pesticide environmen-tal fate one-line summary—Alachlor. USEPA Office of Pesticidetransport and deposition, an additional input pathway for atrazine
to surface waters. In L.G. Ballantine et al. (ed.) Triazine herbicides: Programs, Environ. Fate and Effects Div., Washington, DC.U.S. Environmental Protection Agency. 1994c. Pesticide environmen-Risk assessment. ACS Symp. Ser. 683:158–176.
Roux, P.H., K. Balu, and R. Bennett. 1991. A large-scale retrospective tal fate one-line summary—Metolachlor. USEPA Office of Pesti-cide Programs, Environ. Fate and Effects Div., Washington, DC.ground water monitoring study for metolachlor. Ground Water
Monit. Rev. 11:104–114. U.S. Environmental Protection Agency. 1995. Pesticide environmen-tal fate one-line summary—Cyanazine. USEPA Office of PesticideRudolph, D., J. Goss, A. Graham, G. Kachanoski, M. Scafe, D. As-
pinall, R. van den Broek, S. Clegg, D. Barry, and J. Stimson. 1992. Programs, Environ. Fate and Effects Div., Washington, DC.U.S. Environmental Protection Agency. 1996a. Pesticide environmen-Ontario farm groundwater quality survey winter 1991/92. Univ. of
Waterloo Centre for Ground Water Res., Waterloo, ON, Canada. tal fate one-line summary—Atrazine. USEPA Office of PesticidePrograms, Environ. Fate and Effects Div., Washington, DC.Rudolph, D., J. Goss, A. Graham, G. Kachanoski, M. Scafe, D. As-
pinall, R. van den Broek, S. Clegg, D. Barry, and J. Stimson. 1993. U.S. Environmental Protection Agency. 1996b. Pesticide environmen-tal fate one-line summary—Simazine. USEPA Office of PesticideOntario farm groundwater quality survey summer 1992. Univ. of
Waterloo Centre for Ground Water Res., Waterloo, ON, Canada. Programs, Environ. Fate and Effects Div., Washington, DC.U.S. Environmental Protection Agency. 2000. Drinking water stan-Schwarzenbach, R.P., P.M. Gschwend, and D.M. Imboden. 1993. Envi-
ronmental organic chemistry. John Wiley & Sons, New York, NY. dards and health advisories. USEPA Rep. 822-B-00-001. USEPA,Office of Water, Washington, DC. Available online at http://Sievers, D.M., and C.D. Fulhage. 1992. Survey of rural wells in Mis-
souri for pesticides and nitrate. Ground Water Monit. Rev. 12: www.epa.gov/ost/drinking/standards/dwstandards.pdf (verified 19Jan. 2001).142–150.
Squillace, P.J., J.S. Zogorski, W.G. Wilber, and C.V. Price. 1996. U.S. Geological Survey. 1990. Land use and land cover digital datafrom 1:250,000- and 1:100,000-scale maps. U.S. Geological SurveyPreliminary assessment of the occurrence and possible sources of
MTBE in groundwater in the United States, 1993–1994. Environ. data user guide, no. 4. Available online at ftp://www-nmd.usgs.gov/pubLULC/lulcguide/dug4lulc.txt (verified 31 Jan. 2001).Sci. Technol. 30:1721–1730.
Steichen, J., J. Koelliker, D. Grosh, A. Heiman, R. Yearout, and V. U.S. Geological Survey. 1999. Pesticides in surface and ground waterof the United States: Summary of results of the National Water-Robbins. 1988. Contamination of farmstead wells by pesticides,
volatile organics, and inorganic chemicals in Kansas. Ground Water Quality Assessment Program (NAWQA) Pesticide National Syn-thesis Project. Available online at http://water.wr.usgs.gov/pnsp/Monit. Rev. 8:153–159.
Thelin, G.P., and L.P. Gianessi. 2000. Method for estimating pesticide allsum (last update 23 Sept. 1998; accessed 5 Feb. 1999; verified19 Jan. 2001).use for county areas of the conterminous United States. U.S. Geol.
Surv. Open-File Rep. 00-250. Available online at http://water.wr. Whitmore, R.W., J.E. Kelly, and P.L. Reading. 1992. National homeand garden pesticide use survey. Vol. 1. Executive summary, results,usgs.gov/pnsp/rep/ofr00250/ (verified 19 Jan. 2001).
U.S. Department of Agriculture–Agricultural Research Service. 1995. and recommendations. Research Triangle Inst. Rep. RTI/5100/17-01F. Research Triangle Inst., Research Triangle Park, NC.Pesticide properties database. Available online at http://wizard.
arsusda.gov/acsl/ppdb.html (last update May, 1995; accessed 11 Zaugg, S.D., M.W. Sandstrom, S.G. Smith, and K.M. Fehlberg. 1995.Methods of analysis by the U.S. Geological Survey National WaterMar. 1998; verified 31 Jan. 2001).
U.S. Department of Commerce. 1995. 1992 Census of Agriculture– Quality Laboratory—determination of pesticides in water by C-18solid-phase extraction and capillary-column gas chromatography/Geographic Area Series 1B, U.S. Summary and County Level Data,
1992. U.S. Dep. of Commerce, Bureau of the Census, Washing- mass spectrometry with selected-ion monitoring. U.S. Geol. Surv.Open-File Rep. 95-181. Available online at http://wwwnwql.cr.ton, DC.
U.S. Environmental Protection Agency. 1990. National survey of pest- usgs.gov/Public/pubs/OFR95-181/OFR-95-181.html (verified 19Jan. 2001).icides in drinking water wells: Phase 1 Rep. USEPA Rep. 570/9-


