Embed Size (px)
Citation preview

arX
iv:1
009.
5390
v1 [
astr
o-ph
.CO
] 2
7 Se
p 20
10
The far-infrared–radio correlation at z < 0.5 1
Herschel-ATLAS: The far-infrared–radio correlation at
z < 0.5⋆
Matt J. Jarvis1†, D.J.B. Smith2, D.G. Bonfield1, M.J. Hardcastle1, J.T. Falder1,
J.A. Stevens1 R.J. Ivison3, R. Auld4, M. Baes5, I.K. Baldry6, S.P. Bamford2,
N. Bourne2, S. Buttiglione7, A. Cava8, A. Cooray9, A. Dariush4, G. de Zotti7,
J.S. Dunlop10, L. Dunne2, S. Dye4, S. Eales4, J. Fritz5, D.T. Hill11,
R. Hopwood12, D.H. Hughes13, E. Ibar3, D.H. Jones14, L. Kelvin11,
A. Lawrence10, L. Leeuw15, J. Loveday16, S.J. Maddox2, M.J. Micha lowski10,
M. Negrello12, P. Norberg10, M. Pohlen4, M. Prescott6, E.E. Rigby2, A. Robotham11,
G. Rodighiero7, D. Scott17, R. Sharp14, P. Temi15, M.A. Thompson1,
P. van der Werf18, E. van Kampen19, C. Vlahakis18, G. White12,201Centre for Astrophysics, Science & Technology Research Institute, University of Hertfordshire, Hatfield, Herts, AL10 9AB, UK2Centre for Astronomy and Particle Theory, School of Physics & Astronomy, The University of Nottingham, University Park, Nottingham,NG7 1HR, UK3UK Astronomy Technology Centre, Royal Observatory, Edinburgh, EH9 3HJ, UK4School of Physics & Astronomy, Cardiff University, Queen Buildings, The Parade, Cardiff, CF24 3AA, UK5Sterrenkundig Observatorium, Universiteit Gent, Krijgslaan 281 S9, B-9000 Gent, Belgium6Astrophysics Research Institute, Liverpool John Moores University, Twelve Quays House, Egerton Wharf, Birkenhead, CH41 1LD, UK7INAF–Osservatorio Astronomico di Padova, Vicolo Osservatorio 5, I-35122, Padova, Italy8Instituto de Astrofısica de Canarias (IAC) and Departamento de Astrofısica de La Laguna (ULL), La Laguna, Tenerife, Spain9Department of Physics and Astronomy, University of California, Irvine, CA 92697, USA10SUPA, Institute for Astronomy, University of Edinburgh, Royal Observatory, Blackford Hill, Edinbugh EH9 3HJ, UK11SUPA, School of Physics and Astronomy, University of St. Andrews, North Haugh, St. Andrews, KY16 9SS, UK12Department of Physics and Astronomy, The Open University, Walton Hall, Milton Keynes, MK7 6AA, UK13Instituto Nacional de Astrofısica Optica y Electronica (INAOE), Aptdo. Postal 51 y 72000 Puebla, Mexico14Anglo-Australian Observatory, PO Box 296, Epping, NSW 1710, Australia15Astrophysics Branch, NASA Ames Research Center, Mail Stop 2456, Moffett Field, CA 94035, USA16Astronomy Centre, Department of Physics and Astronomy, School of Maths and Physical Sciences, Pevensey II Building,University of Sussex, Falmer, Brighton, BN1 9QH, UK17Department of Physics and Astronomy, University of British Columbia, 6224 Agricultural Road, Vancouver, BC, V6T1Z1, Canada18Leiden Observatory, Leiden University, P.O. Box 9513, NL - 2300 RA Leiden, The Netherlands19European Southern Observatory, Karl-Schwarzschild-Strasse 2, D-85748, Garching bei Munchen, Germany20The STFC Rutherford Appleton Laboratory, Didcot, Oxfordshire, UK
29 September 2010

Mon. Not. R. Astron. Soc. 000, 000–000 (0000) Printed 29 September 2010 (MN LATEX style file v2.2)
ABSTRACT
We use data from the Herschel-ATLAS to investigate the evolution of the far-infrared–radio correlation over the redshift range 0 < z < 0.5. Using the total far-infrared lu-minosity of all > 5σ sources in the Herschel-ATLAS Science Demonstration Field andcross-matching these data with radio data from the Faint Images of the Radio Skyat Twenty-Centimetres (FIRST) survey and the NRAO VLA Northern Sky Survey(NVSS), we obtain 104 radio counterparts to the Herschel sources. With these datawe find no evidence for evolution in the far-infrared–radio correlation over the redshiftrange 0 < z < 0.5, where the median value for the ratio between far-infrared and radioluminosity, qIR, over this range is qIR = 2.40± 0.12 (and a mean of qIR = 2.52± 0.03accounting for the lower limits), consistent with both the local value determined fromIRAS and values derived from surveys targeting the high-redshift Universe. By com-paring the radio fluxes of our sample measured from both FIRST and NVSS we showthat previous results suggesting an increase in the value of qIR from high to low redshiftmay be the result of resolving out extended emission of the low-redshift sources withrelatively high-resolution interferometric data, although AGN contamination couldstill play a significant role.
We also find tentative evidence that the longer wavelength, cooler dust is heated byan evolved stellar population which does not trace the star-formation rate as closely asthe shorter wavelength <
∼250 µm emission or the radio emission, supporting suggestions
based on detailed models of individual galaxies.
Key words: galaxies: evolution – infrared: galaxies – radio continuum: galaxies
1 INTRODUCTION
The relation between far-infrared emission and the ra-dio emission from galaxies at all redshifts is surprisinglytight (de Jong et al. 1985; Helou et al. 1985; Condon 1992;Garrett 2002) and leads to the conclusion that both trace re-cent star-formation, in the local and distant Universe. Thefar-infrared emission is believed to arise from the thermalemission of dusty clouds surrounding regions of star forma-tion, whereas the radio emission arises from cosmic-ray elec-trons accelerated in supernova remnants of the dying stars,which emit synchrotron radiation.
It is however unclear why there should be such a cor-relation between the thermal far-infrared emission and thenon-thermal radio emission over such a wide range of galaxytypes and masses, from starburst systems to more normalgalaxies. As a result of this, many models resort to a rel-atively significant amount of fine tuning, such as assuminga much stronger magnetic field than what is estimated viaminimum energy arguments (e.g. Thompson et al. 2006). Afull discussion of such arguments is beyond the scope of thispaper; however, we refer to the reader to Lacki et al. (2009)and Lacki & Thompson (2009) who provide a detailed dis-cussion of the various physical interpretations of the far-infrared–radio correlation (FIRC).
Observationally, recent work has concentrated on ex-ploring the FIRC as a function of redshift, mainly be-cause of the preponderance of deep Spitzer and radiodata over relatively small < 10 square degree areas (e.g.Appleton et al. 2004; Frayer et al. 2006; Ibar et al. 2008;Murphy et al. 2009; Micha lowski et al. 2010; Sargent et al.
⋆ Herschel is an ESA space observatory with science instrumentsprovided by European-led Principal Investigator consortia andwith important participation from NASA† Email: [email protected]
2010; Bourne et al. 2010). This has led to several authorssuggesting that the FIRC remains unchanged out to highredshift (z>∼1.5) (e.g. Sargent et al. 2010), whereas otherssuggest a shallow decrease in the ratio between far-infraredluminosity and radio luminosity (e.g. Seymour et al. 2009).Constraining the evolution of the FIRC is important asit may help our understanding of the physical mechanismwhich results in such a tight correlation between the ther-mal and non-thermal emission. For example, metallicity andtemperature evolution would effect the far-infrared luminos-ity but not necessarily the radio synchrotron emission, whereas an evolution in the magnetic field strength would alterthe radio emission. Furthermore, evolution of the gas den-sity and the scale height of a galactic disk may also influ-ence both emission mechanisms (e.g. Helou & Bicay 1993;Niklas & Beck 1997).
The Balloon-borne Large Aperture Submillimetre Tele-scope (BLAST; Devlin et al. 2009) experiment followed bythe launch of the Herschel Space Observatory (Pilbratt et al.2010) open up the possibility of fully investigating theFIRC using spectral energy distributions which have beenmeasured with far-infrared and sub-millimetre photome-try. The first of these concentrated on the relatively deepfields of the extended Chandra Deep Field South withBLAST (Ivison et al. 2010a) and GOODS-North with Her-
schel (Ivison et al. 2010b). Both of these studies find evi-dence for a modest evolution in the FIRC from low-redshiftthrough to the high-redshift Universe, although if confinedsolely to the far-infrared selected galaxies in these samplesthe evidence for evolution is not as significant.
However, we are still lacking a statistically significantsample of objects which can be used to determine the formof the FIRC in the low-redshift (0.05 < z < 0.2) Universe.Yun, Reddy & Condon (2001) used data from the Infrared
Astronomical Satellite (IRAS; Neugebauer et al. 1984) com-

The far-infrared–radio correlation at z < 0.5 3
bined with the NRAO VLA Northern Sky Survey (NVSS;Condon et al. 1998) to investigate the FIRC in the very low-redshift Universe (i.e. z < 0.05) and found that in theirsample of 1809 galaxies > 98 per cent were consistent witha simple linear FIRC. The next step is obviously to push be-yond these very low redshifts and to fill the gap in the mea-surements of the FIRC between the Yun, Reddy & Condon(2001) sample at z < 0.05 and those conducted on smallerfields at higher redshifts (z > 0.5).
We are now in a position to do this with the dataacquired as part of the Herschel Astrophysical Tera-HertzLarge Area Survey (H-ATLAS; Eales et al. 2010). H-ATLASis the largest open time key project on the Herschel Space
Observatory. The survey aims to map 550 deg2 at five wave-lengths from 100 − 500 µm to 5σ point source sensitivities,including confusion noise, of 132, 126, 32, 36 and 45 mJy at100, 160, 250, 350 and 500 µm respectively. The main scien-tific goals are to gain a complete understanding of galaxiesin the relatively low-redshift Universe (e.g. Dye et al. 2010;Amblard et al. 2010), to study the evolution of rare objects,such as active galactic nuclei (AGN; Serjeant et al. 2010;Hardcastle et al. 2010; Bonfield et al. 2010) and galaxy clus-ters, and also to act as a unique data set for finding distantlensed galaxies (Negrello et al. 2010). In this paper we mea-sure the FIRC using the Science Demonstration Phase of theH-ATLAS survey which covers ∼ 14 degree2 over an equato-rial field centred at 09h05m30s, +0030′00′′, correspondingto one of the fields within the Galaxy and Mass Assembly(GAMA; Driver et al. 2009) Survey which has a wealth ofother multi-wavelength data.
The paper is arranged as follows: In Section 2 we dis-cuss how our sample was selected using far-infrared datafrom Herschel, along with optical, near-infrared and radiodata. In Section 3 we measure the FIRC and investigatehow this may evolve with redshift and whether there is anydependence on either radio or far-infrared luminosity. In Sec-tion 4 we present our conclusions. Throughout the paper weuse a concordance cosmology with H0 = 70 km s−1 Mpc−1,ΩM = 0.3 and ΩΛ = 0.7.
2 SAMPLE SELECTION
For this study we use the H-ATLAS Science Demonstra-tion Phase (SDP) data. Full details of the Spectral andPhotometric Imaging Receiver (SPIRE; Griffin et al. 2010)and Photodetector Array Camera (PACS; Poglitsch et al.2010) data reduction for the H-ATLAS data can be foundin Pascale et al. (2010) and Ibar et al. (2010) respectively.The H-ATLAS 5σ source catalogue (Rigby et al. 2010) wassubsequently cross-matched with the Sloan Digital Sky Sur-vey Data Release 7 (SDSS; Abazajian et al. 2009) and theUnited Kingdom Infrared Deep Sky Survey Large Area Sur-vey (UKIDSS-LAS; Lawrence et al. 2007). Full details ofthe cross-matching procedure can be found in Smith et al.(2010); however to summarize, we use the SDSS DR7 r-bandcatalogue, limited to r 6 22.4, and perform a likelihood ratioanalysis (Sutherland & Saunders 1992) on all possible coun-terparts within 10 arcseconds of the 250 µm positions (thebeamsize at 250 µm is 18 arcseconds). The likelihood ratiomethod relies on using not only positional offsets, but alsomagnitude information – both of the counterparts and of the
Figure 1. Integrated far-infrared luminosity versus redshift forthe > 5σ sources from the H-ATLAS SDP field. The small dotsdenote all of the H-ATLAS sources which we use for the stackingof the radio data (see Section 2.4), while the filled circles denotethose sources with > 5σ radio detections for which we can calcu-late the FIRC directly. The open circles represent those sourceswith L1.4GHz > 1023 W Hz−1, i.e. in the AGN-luminosity regime,and the open stars are those objects with morphological signs ofAGN activity in the radio maps (see Section 3).
full catalogue – to determine the ratio of the probability thatan optical source is related to the 250 µm source to the prob-ability that the optical source is unrelated. One can then usethese values to determine a reliability, R, which estimatesthe probability that a given source is the true counterpartto the Herschel object. The likelihood ratio accounts for thefact that not all Herschel sources will be detected in theSDSS r-band data, due to many galaxies residing at higherredshift than the SDSS is sensitive to, and also possibly dueto dust obscuration. In what follows, we only consider those2334 sources with reliable counterparts (R > 0.8) to theHerschel-selected catalogue.
2.1 Spectroscopic and Photometric redshifts
For our study on the evolution of the FIRC, redshift in-formation for all of the sources is crucial. For the brighterobjects in our sample we are able to use the SDSS spectro-scopic redshifts, for the fainter sources we use the year 1and 2 data from the Galaxy and Mass Assembly (GAMA)survey (Driver et al. 2010) where available. The target se-lection for the GAMA survey was r < 19.4 or z < 18.2or KAB < 17.6, full details of the target selection and thetarget priorities can be found in Baldry et al. (2010) andRobotham et al. (2010) respectively. The combination of theSDSS and GAMA redshift surveys results in 877 sourceshaving spectroscopic redshifts.
Using the combination of SDSS ugriz and UKIDSS-LAS Y JHK data we determine photometric redshiftsfor the sources without spectroscopic redshifts. We usedthe publicly available annz (Collister & Lahav 2004)photometric redshift code, using spectroscopic redshiftsfrom the SDSS, GAMA (Driver et al. 2010), DEEP2(Davis et al. 2007), zCOSMOS (Lilly et al. 2007) and2SLAQ (Cannon et al. 2006). This allows us to construct

4 M. J. Jarvis et al.
a spectroscopic training set with large numbers of objects(> 1000 per bin of unit magnitude or 0.1 in redshift) up tor-band magnitudes r < 23 and redshifts z < 1.0, i.e. to ap-proximately the photometric depth of SDSS and UKIDSS-LAS. Further details of the photometric redshifts can befound in Smith et al. (2010). For our analysis we alwaysuse the spectroscopic redshift, where available, in prefer-ence to the photometric redshifts which have a typical errorof ∆z/(1 + z) ∼ 0.03. In all cases where we has a spec-troscopic redshift, this agreed with the photometric redshiftwithin the uncertainties.
2.2 The radio data
Based on this Herschel catalogue, with optical identifica-tions, we measured radio fluxes directly from the imagingdata of both the NVSS and the Faint Images of the Ra-dio Sky at Twenty-one centimetres (FIRST; Becker et al.1995) at the position of the optical galaxy. The NVSS hasa typical rms flux-density of 0.45 mJy and has the benefitthat it was carried out in VLA D-Array and therefore hasa resolution of around ∼ 45 arcsec which is larger than theexpected size of any individual galaxy within the H-ATLASgalaxy sample. As such we expect little flux to be missed orresolved out using the NVSS. On the other hand the FIRSTsurvey with a 5-arcsec beam is deeper than NVSS (rms =0.15 mJy) but may miss extended flux, particularly at thelow-redshift end of our source distribution. We therefore usethe NVSS survey to measure the radio fluxes at the positionsof the H-ATLAS sources with spectroscopic or photometricredshifts z < 0.2 and the FIRST survey to measure the ra-dio fluxes of sources with z > 0.2, where the FIRST beamequates to a galaxy size of >
∼16 kpc. We include all sourceswith a flux-density S1.4GHz > 5 times the background noiselevel determined using each individual 5×5 arcmin2 cut-outaround each source. We note that only two of the sourceswith direct radio detections at > 5σ lie above a redshift ofz = 0.2 Therefore this split makes little difference to theresults presented in this paper, but may be important whencomparing to results which investigate the FIRC at higherredshifts. To summarise, our sample is comprised of all ob-jects detected at > 5σ in the H-ATLAS catalogue, with radiocounterparts detected at > 5σ above the local backgroundrms from the NVSS (z < 0.2) and FIRST (z > 0.2) ra-dio surveys. It is possible that the lower resolution NVSSsurvey could suffer from some source confusion, where mul-tiple sources contribute to the measured flux of the object.We checked for this using the higher resolution FIRST datato identify whether there was more than one source withinthe NVSS beam, and where this was deemed to be an issue(< 5 per cent) the FIRST maps was used to measure theflux. We also checked for extended emission associated withAGN as detailed in Section 3.
2.3 Far-infrared luminosities
Far-infrared luminosities were derived using two methods.The first uses a simple modified blackbody fit to the threeSPIRE bands at 250, 350 and 500µm, and the PACS data at100 and 160µm where available. We fixed the dust emissivityindex to β = 1.5 and varied the temperature over the range
10 < T < 50 K, following Dye et al. (2010). As in Dye et al.(2010) we find a median temperature of T = 26 K. For eachsource we measured the integrated far-infrared luminosity(8 − 1000 µm) and the rest-frame 250 µm luminosity. Wealso fit the data with an emissivity index of β = 2, whichgave a median temperature of T = 23 K, again consistentwith Dye et al. (2010). However, the integrated far-infraredluminosities derived for both fits were consistent within theuncertainties with a median offset of +0.07 dex in integratedfar-infrared luminosity for β = 1.5 compared to those fitwith β = 2.
It is widely acknowledged that simple modified black-body fits may underestimate the total far-infrared emission,particularly at the short wavelength end of the spectrum.For this reason we also determine the far-infrared lumi-nosity of our sources using the comprehensive set of star-burst SEDs from Siebenmorgen & Krugel (2007), in a simi-lar way to Symeonidis et al. (2008). All star-burst and Ultra-luminous Infrared Galaxy (ULIRG) SEDs were consideredto fit the data1. We use all three SPIRE data points and thePACS detections where available. In the absence of a detec-tion at the PACS wavebands we use the 2σ upper limit toconstrain the SED to lie below these values. We note thatno shorter wavelength data is available for the H-ATLASfield at the present time. We find that the templates pro-vide far-infrared luminosities approximately 0.7 dex moreluminous than the corresponding modified blackbody fits,although the monochromatic luminosities at the rest-framewavelengths covered by the SPIRE data are consistent, asexpected. For the purposes of this paper we use the far-infrared luminosities determined from the full SED fits usingthe templates from Siebenmorgen & Krugel (2007) and forthe monochromatic luminosities we use the modified black-body fits, although we emphasise that these are consistentbetween the two methods.
Fig. 1 shows the distribution of our sources on thefar-infrared luminosity versus redshift plane, which demon-strates that we are able to sample the z < 0.2 Universe suffi-ciently well for individual sources to investigate the form ofthe FIRC with this sample. We use stacking of the radio data(Sec. 2.4) to determine whether our findings at z < 0.2 areconsistent with the average sources properties up to z ∼ 0.5and beyond, by comparing with previous results in the lit-erature (e.g. Ivison et al. 2010a,b; Bourne et al. 2010).
We also use the results described in Hardcastle et al.(2010) to obtain the far-infrared luminosities for thosesources which are strongly detected at radio wavelengthsbut which fall below the 5σ detection limit of our Herschel
catalogue, and thus do not make it into our sample. Thecombination of these allows us to probe to lower and higherradio luminosities at all redshifts, thus negating some of thebiases inherent to selecting in a single band. We show thesefor completeness; however, we do not use them in calculatingthe FIRC.
In Fig. 2 we show the correlation between the far-infrared luminosity and the rest-frame 1.4 GHz radio lu-minosity. We assume a radio spectral index of α = 0.82, as
1 see http://www.eso.org/∼rsiebenm/sb models2 We use the definition of spectral index such that the radio fluxdensity Sν ∝ ν−α, where ν is the frequency.

The far-infrared–radio correlation at z < 0.5 5
Figure 2. Integrated far-infrared luminosity versus rest-frame1.4 GHz radio luminosity of the high-reliability 250 µm detectedsources in the H-ATLAS SD field with radio cross-identifications> 5σ above the local noise in the NVSS and FIRST images. NVSSfluxes were used for the sources at redshifts z < 0.2 and FIRSTfor those sources with z > 0.2, as explained in the text. The openstars represent those sources with morphological signs of AGNactivity (see Section 3) and the open circles denote those sourceswith L1.4GHz > 1023 W Hz−1, and thus have a high probabilityof AGN contamination in their radio emission. The arrows denotethe 5σ upper limits in the radio luminosity from the NVSS andFIRST.
found for submillimetre galaxies by Ibar et al. (2010), forthe 104 objects (72 with spectroscopic redshifts and 32 withphotometric redshifts) which lie above our flux limit in H-ATLAS and with > 5 σ detections in the radio maps. Onecan easily see the strong correlation between the far-infraredand radio emission in our sample, with the best fit relationlog
10LFIR = (17.8 ± 0.7) + (0.42 ± 0.07) log
10L1.4GHz for
those sources with L1.4 GHz < 1023 W Hz−1 (see Section 3).
2.4 Stacking
For those sources detected at Herschel wavelengths butwhich fall below our 5σ threshold from the radio data, wealso perform a stacking analysis on the NVSS and FIRSTradio images to obtain statistical detections. To do this wefollowed the technique of White et al. (2007), which clipsthe image at 5σ around the median value and then com-bines the individual images weighted by their variance (seealso Falder et al. 2010). The stacked images are generated invarious bins of far-infrared luminosity and redshift to allowdirect comparisons to those sources with direct detections.Again we do not use these to derive the median and meanvalues for the FIRC but just as a guide so the reader canjudge for consistency.
3 THE FAR-INFRARED RADIO
CORRELATION
The FIRC we use here is defined as the logarithmic ra-tio of the integrated far-infrared flux, SIR, determined fromrest-frame wavelengths 8 − 1000 µm (following Bell 2003;
Ivison et al. 2010a), and the rest-frame 1.4 GHz k-correctedflux density, S1.4GHz such that qIR = log10[(SIR/3.75 ×
1012)/(S1.4GHz)] and is dimensionless. SIR has units ofW m−2, 3.75 × 10¹² Hz is the normalising frequency (Helouet al. 1985) and S1.4GHz has units of W m−2 Hz−1. FollowingIvison et al. (2010a), we also calculate the monochromaticrelationship between the k-corrected emission at 250µm (us-ing our modified blackbody fit) and 1.4 GHz (using a spec-tral index of α = 0.8), hereafter q250.
Contamination in the sample from radio-luminous AGNwould preferentially decrease the value of qIR. The ra-dio luminosity at which AGN begin to dominate thesource population occurs around L1.4GHz
>∼1023 W Hz−1 (e.g.
Mauch & Sadler 2007; Wilman et al. 2008). Inspecting theFIRST radio images we find that nine of the sources in oursample show clear signs of AGN activity, i.e. jet-like phenom-ena. All of these sources have radio luminosities L1.4GHz >1023 W Hz−1 and qIR values below the sample mean, aswould be expected for an AGN dominated source. We omitthese nine sources from all subsequent analyses, even thoughthe effect they would have on our results is negligible. Allobjects with radio luminosities L1.4 GHz > 1023 W Hz−1 arerepresented with open symbols in all figures.
3.1 Redshift dependence of the far-infrared–radio
correlation
In Fig. 3 we show the qIR parameter as a function of redshiftfor all of the objects in our sample with > 5σ detections at1.4 GHz. If we consider this entire sample then we obtain amean value of qIR = 2.15±0.09 and median qIR = 2.22±0.11.We also measure the mean and median values of qIR after ex-cluding the radio sources with obvious signs of AGN activityand those above L1.4 GHz > 1023 W Hz−1. Unsurprisinglythis leads to a larger value of the mean, qIR = 2.33±0.09 andmedian qIR = 2.40±0.12. To estimate the effect of the lowerlimits in our measurement of the value for qIR we use theKaplan-Meier estimator (Feigelson & Nelson 1985), which isa maximum likelihood estimator to calculate the mean in thepresence of lower or upp limits (see e.g. Sajina et al. 2008).Using this method we find a mean of qIR = 2.52±0.03. Theseare consistent with the value of qIR measured in the verylocal Universe (Yun, Reddy & Condon 2001) using IRAS
data, who found qIR = 2.34 ± 0.01, although we note thatYun, Reddy & Condon (2001) calculated the value of qIRbased on the 40 < λ < 120 µm wavelength range only.Bourne et al. (2010) also discuss this point and suggest thatthe difference between the value of qIR measured in this lim-ited wavelength ranged compared to the total infrared lumi-nosity is ∼ 0.3 dex for an M51 template SED, but note thatthis is subject to large variations due to different relativecontribution from cooler dust. We use our models to findwhat range this correction spans and we also find a mediandifference of 0.3 dex with a standard deviation of 0.4 dexin the fra-infrared luminosity; thus the consistency remainsat the 2 σ level with the results of Yun, Reddy & Condon(2001). Comparing with the results of Bell (2003), who usedthe bolometric far-infrared luminosity of local galaxies, andfound qIR = 2.64, we find that our results are slightly lower,but again within 2 σ. Our value of qIR is also in good agree-ment with the values measured at higher redshift by variousauthors (e.g. Ivison et al. 2010a,b; Sargent et al. 2010) who

6 M. J. Jarvis et al.
Figure 3. The FIRC versus redshift for our complete sample.Solid circles denote the sources with L1.4GHz 6 1023 W Hz−1,whereas the open circles represent the sources with L1.4GHz >1023 W Hz−1, i.e. the radio luminosity at which AGN begin todominate the source population. The dashed line is the weightedmean value of qIR for the L1.4GHz < 1023 W Hz−1 sources andthe grey shaded region shows the standard deviation on qIR. Thearrows denote the 5σ lower limits based on the upper limits fromthe radio data.
find values in the range 2.4 < qIR < 2.8. Some find evidencefor an increase in qIR towards low redshift (e.g. Bourne et al.2010), but our data do not support this; we return to thispoint in Section 3.2.1.
Fig. 4 shows the value of q250 against redshift for oursample. Only considering those objects with L1.4GHz <1023 W Hz−1, we determine a mean q250 = 1.78 ± 0.04and median q250 = 1.84 ± 0.05, similar to the values quotedby Ivison et al. (2010a) with the k-correction applied. Usingthe lower limits and the Kaplan-Meier estimator we find amean q250 = 2.01 ± 0.04. However, we find that the disper-sion on q250 is a factor of two tighter than the correspondingdispersion for qIR. This suggests that the flux measured atrest-frame 250 µm is possibly more closely related to theradio emission than the integrated far-infrared luminosity,although we note that the larger dispersion could be due tothe large uncertainties of the complete SED due to our lackof direct detections in the PACS observations, particularlyfor the sources lying close to the flux-density limit at SPIREwavelengths.
However, there are reasons why we might expect tosee a larger dispersion in qIR than in q250. For example,Dunne et al. (2000b) showed that the relationship betweenthe radio emission and the 850µm emission measured withSCUBA has significantly more scatter than in the similar re-lationship between radio emission and the far-infrared emis-sion determined from a fit to the SED which includes datafrom IRAS. Similarly, Vlahakis et al. (2007) showed thatthe relation between 850µm emission and radio emissionhas significantly more scatter than the relationship between60µm and 1.4 GHz. Both suggest that this could be dueto the presence of cold dust which dominates the emissionat sub-millimetre wavelengths, but which is not as stronglyassociated with massive star formation. Given that our to-tal far-infrared luminosities are largely constrained by the
Figure 4. The q250–radio correlation as a function of red-shift. The open circles denote those sources with L1.4 GHz >1023 W Hz−1. The dashed line is the weighted mean value of q250for the L1.4GHz < 1023 W Hz−1 sources, and the grey shaded re-gion shows the standard deviation on q250. The arrows denote the5σ lower limits based on the upper limits from the radio data.
longer wavelength SPIRE data points, then we would ex-pect the scatter in these value to be larger than the scatterin monochromatic luminosities derived at 250 µm which inthis scenario would more closely trace the dust heated byyoung stars.
This explanation can also be reconciled with detailedstudies of individual galaxies. Using Herschel observationsof M81, Bendo et al. (2010) recently found evidence thatthe longer wavelength (160-500µm) emission traces dustwith temperature 15-30 K which is heated by evolved stars,whereas the shorter wavelength (∼ 70µm) emission is domi-nated by dust heated by young stars in star-forming regions.Furthermore, in a sample of nearby galaxies observed withSpitzer, Calzetti et al. (2010) also found evidence that asone moves to longer wavelengths, the conversion to a star-formation rate becomes more uncertain with the dispersionincreasing by a factor of ∼ 2 moving from 24µm to 70µm,although Appleton et al. (2004) find the opposite to be true,this could possibly due to the wide redshift range, 0 < z < 1(and thus luminosity range) in the Appleton et al. study.Thus, it appears that we may be seeing this effect on theFIRC, where the radio emission remains a robust tracer ofthe star-formation rate but the longer wavelength Herschel
data has an increasing contribution to the emission fromdust heated by evolved stellar populations, compared to theheating by young massive stars (see also Rowan-Robinson2003; Bell 2003).
3.2 Luminosity dependence of the
far-infrared–radio correlation
With the large number of objects available to us due to thehigh-sensitivity of the Herschel Space Observatory, we areable to investigate the form of the far-infrared radio correla-tion over a range of redshifts, far-infrared luminosities andradio luminosities. However, both the far-infrared data andthe radio data are derived from flux-density limited par-

The far-infrared–radio correlation at z < 0.5 7
ent images and any analysis is susceptible to Malmquistbias, where the higher redshift sources are biased towardsthe most luminous sources, and Eddington-type bias forsignal-to-noise limited catalogues. Therefore, following bothSargent et al. (2010) and Ivison et al. (2010b) we split oursample into three radio luminosity bins (Fig. 5) and threefar-infrared luminosity bins (Fig. 6) and determine the meanand median value for qIR in each of these bins.
3.2.1 Binning in radio luminosity
Fig. 5 shows that there is very little evidence for strongevolution in the FIRC over the redshift range 0 < z < 0.5 inany of the individual radio luminosity bins, where a constantvalue of qIR is consistent with the data. We also find similarresults when using q250. However, we find that the mean(and median) values of qIR (q250) decrease with increasingradio luminosity from qIR = 2.55 ± 0.11 (q250 = 2.23 ± 0.10)for L1.4GHz < 1022W Hz−1 to qIR = 2.35 ± 0.11 (q250 =1.93 ± 0.04) for 1022 < (L1.4GHz / W Hz−1)< 1023, throughto qIR = 2.33 ± 0.24 (q250 = 1.81 ± 0.06) for L1.4GHz >1023W Hz−1. The most straightforward explanation of thisis that there is an increasing fraction of AGN as we push tohigher radio luminosities.
Another possibility is that the increase in qIR and q250towards low redshift could be caused by the increasing prob-ability of resolving out extended structure with relativelyhigh-resolution radio data. We do not believe that this is anissue with our sample as we have restricted ourselves to usingthe low-resolution NVSS at z < 0.2 and only use the FIRSTsurvey at the higher redshifts z > 0.2. However, this couldoffer an explanation of the increase in qIR towards low red-shift seen with surveys targeting the high-redshift Universe.At high redshift (z > 0.5) short baseline observations arenot as important, due to the fact that distant star-forminggalaxies are relatively compact (e.g. Muxlow et al. 2005) andare fully resolved with longer baselines, whereas short base-lines are needed for studying lower redshift galaxies whichhave larger angular extent on the sky. This extended emis-sion would be resolved without short baselines and radio fluxwould be missed, this in turn would increase the FIRC tohigher values. In Fig. 8 we show the ratio of the flux-densitiesfrom NVSS and FIRST as a function of redshift. One canimmediately see that at z < 0.2 the FIRST survey has miss-ing flux when compared to the NVSS. Such a selection effectcould explain the recent results which suggest an increase inqIR towards low (z < 0.5) redshift (e.g. Bourne et al. 2010).Therefore, a combination of AGN contamination, and theresolving out of extended radio emission, could be respon-sible for the observed increase in qIR towards low redshiftbased on deep field data which uses higher resolution radioimaging.
However, if we return to the explanation in Section 3.1in which the longer wavelength emission has an increas-ing contribution from evolved stars (Rowan-Robinson 2003;Calzetti et al. 2010), then we would expect the low-redshiftsources to exhibit less correlation with the radio emissiondue to the fact that our data necessarily probe longer rest-frame wavelengths. This would not have a large effect withinour dataset which is limited to z < 0.2 for direct detections,however when considering the evolution from z ∼ 1 throughto z ∼ 0, this could explain the increase in qIR towards the
Figure 8. The ratio of the flux-densities from the NVSS andFIRST survey as a function of redshift for radio sources in oursample with > 4σ detections in both surveys. Those sources iden-tified as AGN from their radio morphology are denoted by openstars.
low redshifts, where there is an increased relative contribu-tion to the total far-infrared luminosity from dust heated byevolved stars.
We therefore suggest that the evidence for an increasein the FIRC towards low redshifts found by previous au-thors (e.g. Bourne et al. 2010) can be explained by one ora combination of resolving-out extended radio emission inhigh-resolution radio data coupled with an increased contri-bution from dust heated by evolved stars at progressivelylower redshifts.
3.2.2 Binning in far-infrared luminosity
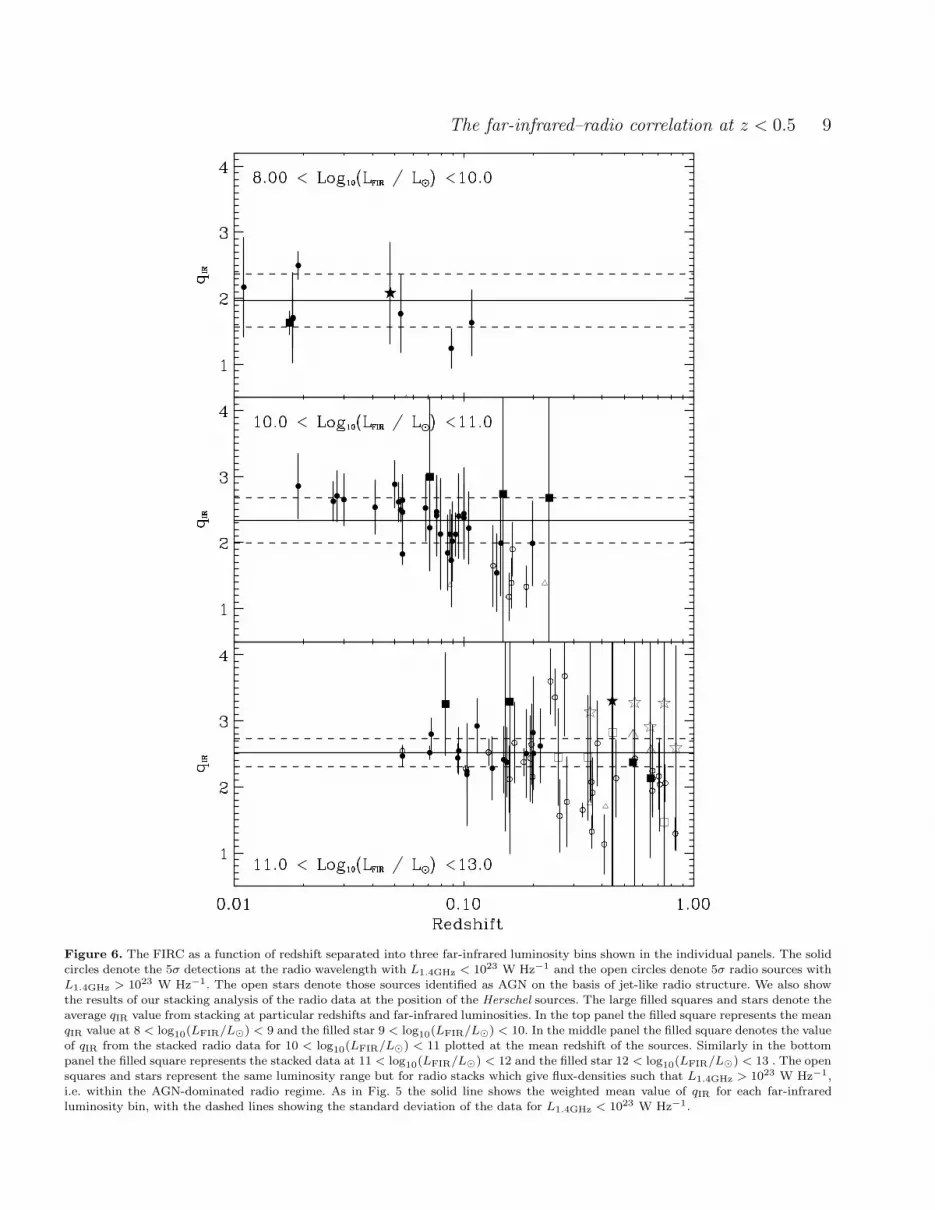
Figs. 6 and 7 show the qIR and q250 parameters as a functionof redshift, split into bins of far-infrared luminosity, respec-tively. We find no evidence that the mean qIR or q250 in-crease with far-infrared luminosity, with all values betweenbins consistent within 1 σ. However, it is also apparent thatthere is evidence for a negative trend in qIR and q250 as afunction of redshift in at least the most populated bin inLFIR at 10 < log
10(LFIR/ L ⊙) < 11. In addition, we find
that the stacked radio data provide values for qIR ad q250which closely resemble the values, within the uncertainties,on the individually detected sources, thus we can also be con-fident that we are not suffering any significant bias againstsources falling below our 5σ radio detection limit.
One explanation for this negative trend with redshiftis that any enhanced contribution to the radio emissionfrom AGN activity in these sources would also decreasethe value of qIR and q250, and possibly increase the scat-ter. This obviously plays some part in the observed trendas the open circles in Fig. 6, denoting the sources withL1.4 GHz > 1023 W Hz−1, all lie below the mean values of qIRand q250. For those sources with L1.4 GHz < 1023 W Hz−1
only a very minor enhancement of the radio flux would beneeded to cause the observed offset. Using the radio contin-uum simulation of Wilman et al. (2008) we determine howmany low-luminosity AGN would be expected over the red-

8 M. J. Jarvis et al.
Figure 5. The FIRC as a function of redshift separated into three radio luminosity bins shown in the individual panels. The solid circlesdenote the 5σ detections at the radio wavelength, the open stars denote those sources identified as AGN on the basis of jet-like radiostructure and the open triangles denote those object selected at radio wavelengths from Hardcastle et al. (2010). The solid horizontalline shows the weighted mean value of qIR for all non-AGN sources with L1.4GHz < 1023 W Hz−1, and the dashed horizontal lines arethe 1σ standard deviation of the same sources.
shift range 0 < z < 0.2, where our sources with low valuesof qIR reside, and also with 1020 < L1.4 GHz/W Hz−1 <1022. We find that we expect ∼ 1 − 2 radio-quiet AGN orlow-luminosity FR-I type (Fanaroff & Riley 1974) sourcesper square degree above the 5σ radio flux-density limitof NVSS, thus in the SDP field we would expect 15–30sources where an AGN is contributing to the radio emis-sion at L1.4GHz < 1023 W Hz−1. Thus it is entirely plau-
sible that low-luminosity AGN could lower the value ofqIR for a small fraction of the sources in our sample. Fur-thermore, low-level AGN activity has been found to berelatively common in late-type galaxies (e.g. Filho et al.2006; Desroches & Ho 2009). Follow-up observations acrossseveral wavebands could be used to test this, e.g. high-resolution radio maps or deep X-ray imaging.
The far-infrared–radio correlation at z < 0.5 9
Figure 6. The FIRC as a function of redshift separated into three far-infrared luminosity bins shown in the individual panels. The solidcircles denote the 5σ detections at the radio wavelength with L1.4GHz < 1023 W Hz−1 and the open circles denote 5σ radio sources withL1.4GHz > 1023 W Hz−1. The open stars denote those sources identified as AGN on the basis of jet-like radio structure. We also showthe results of our stacking analysis of the radio data at the position of the Herschel sources. The large filled squares and stars denote theaverage qIR value from stacking at particular redshifts and far-infrared luminosities. In the top panel the filled square represents the meanqIR value at 8 < log10(LFIR/L⊙) < 9 and the filled star 9 < log10(LFIR/L⊙) < 10. In the middle panel the filled square denotes the valueof qIR from the stacked radio data for 10 < log10(LFIR/L⊙) < 11 plotted at the mean redshift of the sources. Similarly in the bottompanel the filled square represents the stacked data at 11 < log10(LFIR/L⊙) < 12 and the filled star 12 < log10(LFIR/L⊙) < 13 . The opensquares and stars represent the same luminosity range but for radio stacks which give flux-densities such that L1.4GHz > 1023 W Hz−1,i.e. within the AGN-dominated radio regime. As in Fig. 5 the solid line shows the weighted mean value of qIR for each far-infraredluminosity bin, with the dashed lines showing the standard deviation of the data for L1.4GHz < 1023 W Hz−1.

10 M. J. Jarvis et al.
Figure 7. q250 as a function of redshift separated into three far-infrared luminosity bins shown in the individual panels. The symbolsare the same as in Fig. 6.
4 CONCLUSIONS
We have used the H-ATLAS Science Demonstration Phasedata to investigate the evolution of the FIRC over theredshift range 0 < z < 0.5. Using a combination of thefar-infrared data from H-ATLAS and the radio data fromthe FIRST and NVSS we find no evidence for evolutionin the FIRC, with a median qIR = 2.40 ± 0.12 over theredshift range 0 < z < 0.5. This is consistent with pre-vious work at z ∼ 0 (e.g. Yun, Reddy & Condon 2001),as well as studies focused on much higher redshifts (e.g.
Ibar et al. 2008; Sargent et al. 2010; Ivison et al. 2010a,b;Bourne et al. 2010), in addition to empirical models basedon radio and far-infrared luminosity functions (e.g. Wilmanet al. 2010).
Splitting the sample into bins of radio luminosityshows that in our far-infrared selected sample the FIRCis consistent with being constant with radio luminosity forsources restricted to the regime where star-forming sys-tems dominate the source counts, i.e. those with L1.4GHz <1023 W Hz−1. We find that the dispersion in qIR is a fac-tor of two higher than the dispersion for q250. This could

The far-infrared–radio correlation at z < 0.5 11
be explained if the longer wavelength emission, i.e. in thesub-millimetre regime, was not produced from massive starformation and thus does not trace the same physical mecha-nism as the radio or the mid- to far-infrared emission. Suchan effect has been found for lower redshift galaxies wherethe SEDs have been studied in detail (e.g. Bendo et al. 2010;Calzetti et al. 2010). This would imply that when calculat-ing star-formation rates using Herschel photometry it maybe more accurate to restrict this to just using the shorter,rest-frame < 250 µm, data. However, we cannot entirely ruleout the possibility of low-level AGN activity contributing tothe radio emission and this would lower the value of qIR. Wealso suggest that the increased dispersion in the value of qIRcould be linked to an increasing uncertainty in the models,which are less well constrained than the monochromatic fluxat 250 µm, where we have data close to the rest-frame wave-length of interest. Deeper observations with PACS and/orobservations at submm wavelengths could test which expla-nation is the more important.
We also conclude that the increase in the ratio of far-infrared to radio luminosity towards low redshift found inprevious work may be partly due to the relatively high spa-tial resolution of the radio data used. Such data would beginto resolve out extended emission from the large angular sizegalaxies which become more dominant in the low-redshiftUniverse. Future work combining the H-ATLAS survey withlower frequency Giant Metrewave Radio Telescope (GMRT)data at 325 MHz and the Low Frequency Array (LOFAR;Morganti et al. 2010) survey data will also allow us to in-vestigate the FIRC over a larger range in redshift, due tothe increase in depth of the radio data, and as a function ofradio spectral index. This may provide important clues as tothe link between the synchrotron emission traced by the ra-dio data and the thermal emission traced by the H-ATLASdata.
5 ACKNOWLEDGMENTS
MJJ acknowledges support from an RCUK fellowship andMJH thanks the Royal Society for support. JSD acknowl-edges the support of the Royal Society via a Wolfson Re-search Merit award, and also the support of the EuropeanResearch Council via the award of an Advanced Grant. TheHerschel-ATLAS is a project with Herschel, which is anESA space observatory with science instruments providedby European-led Principal Investigator consortia and withimportant participation from NASA. The H-ATLAS websiteis http://www.h-atlas.org/ U.S. participants in Herschel-ATLAS acknowledge support provided by NASA througha contract issued from JPL.
This work used data from the UKIDSS DR5 andthe SDSS DR7. The UKIDSS project is defined inLawrence et al. (2007) and uses the UKIRT Wide FieldCamera (WFCAM; Casali et al. 2007). Funding for theSDSS and SDSS-II has been provided by the Alfred P. SloanFoundation, the Participating Institutions, The NationalScience Foundation, the U.S. Department of Energy, the Na-tional Aeronautics and Space Administration, the JapaneseMonbukagakusho, the Max Planck Society and the HigherEducation Funding Council for England.
GAMA is a joint European-Australasian project
based around a spectroscopic campaign using the Anglo-Australian Telescope. The GAMA input catalogue is basedon data taken from the Sloan Digital Sky Survey and theUKIRT Infrared Deep Sky Survey. Complementary imagingof the GAMA regions is being obtained by a number of in-dependent survey programs including GALEX MIS, VSTKIDS, VISTA VIKING, WISE, Herschel-ATLAS, GMRTand ASKAP providing UV to radio coverage. GAMA isfunded by the STFC (UK), the ARC (Australia), the AAO,and the participating institutions. The GAMA website is:http://www.gama-survey.org/ .
REFERENCES
Abazajian K. N., et al., 2009, ApJS, 182, 54Amblard, A., et al. 2010, arXiv:1005.2412Appleton, P. N., et al. 2004, ApJS, 154, 147Baldry, I. K., et al. 2010, MNRAS, 404, 86Becker, R. H., White, R. L., & Helfand, D. J. 1995, ApJ,450, 559
Bell, E. F. 2003, ApJ, 586, 794Bendo, G. J., et al. 2010, arXiv:1005.1889Bonfield, D. G., et al. MNRAS, submittedBourne, N., Dunne, L., Ivison, R. J., Maddox, S. J., Dick-inson, M., & Frayer, D. T. 2010, arXiv:1005.3155
Calzetti, D., et al. 2010, ApJ, 714, 1256Cannon R., et al., 2006, MNRAS, 372, 425Casali, M., et al. 2007, A&A, 467, 777Chapman, S. C., Helou, G., Lewis, G. F., & Dale, D. A.2003, ApJ, 588, 186
Collister, A. A., & Lahav, O. 2004, PASP, 116, 345Condon, J. J. 1992, ARA&A, 30, 575Condon, J. J., Cotton, W. D., Greisen, E. W., Yin, Q. F.,Perley, R. A., Taylor, G. B., & Broderick, J. J. 1998, AJ,115, 1693
Davis M., et al., 2007, ApJL, 660, L1de Jong, T., Klein, U., Wielebinski, R., & Wunderlich, E.1985, A&A, 147, L6
Devlin, M. J., et al. 2009, Nature, 458, 737Desroches, L.-B., & Ho, L. C. 2009, ApJ, 690, 267Dye, S., et al. 2010, arXiv:1005.2411Driver, S. P., et al. 2009, Astronomy and Geophysics, 50,5.12
Driver, S. P., et al. 2010, MNRAS, submittedDunne, L., Eales, S., Edmunds, M., Ivison, R., Alexander,P., & Clements, D. L. 2000,MNRAS, 315, 115
Dunne, L., Clements, D. L., & Eales, S. A. 2000, MNRAS,319, 813
Eales, S., et al. 2010, PASP, 122, 499Falder, J. T., et al. 2010, MNRAS, 405, 347Fanaroff, B. L., & Riley, J. M. 1974, MNRAS, 167, 31PFeigelson, E. D., & Nelson, P. I. 1985, ApJ, 293, 192Filho, M. E., Barthel, P. D., & Ho, L. C. 2006, A&A, 451,71
Frayer, D. T., et al. 2006, AJ, 131, 250Garrett, M. A. 2002, A&A, 384, L19Griffin, M. J., et al. 2010, arXiv:1005.5123Hardcastle M. J., et al., 2010, MNRAS, submittedHelou, G., Soifer, B. T., & Rowan-Robinson, M. 1985,ApJL, 298, L7

12 M. J. Jarvis et al.
Helou, G., Khan, I. R., Malek, L., & Boehmer, L. 1988,ApJS, 68, 151
Helou, G., & Bicay, M. D. 1993, ApJ, 415, 93Hickey S., Jarvis, M.J., Bunker A.J., Sharp R., SymeonidisM., 2010, MNRAS, submitted
Ibar, E., et al. 2008, MNRAS, 386, 953Ibar, E., Ivison, R. J., Best, P. N., Coppin, K., Pope, A.,Smail, I., & Dunlop, J. S. 2010, MNRAS, 401, L53
Ibar E., et al. 2010, MNRAS, submittedIvison, R. J., et al. 2010a, MNRAS, 402, 245Ivison, R. J., et al. 2010b, arXiv:1005.1072Lacki, B. C., Thompson, T. A., & Quataert, E. 2009,arXiv:0907.4161
Lacki, B. C., & Thompson, T. A. 2009, arXiv:0910.0478Lawrence A., et al., 2007, MNRAS, 379, 1599Lilly S. J., et al., 2007, ApJS, 172, 70Mauch, T., & Sadler, E. M. 2007, MNRAS, 375, 931Micha lowski, M., Hjorth, J., & Watson, D. 2010, A&A, 514,A67
Morganti, R., et al. 2010, arXiv:1001.2384Murphy, E. J., Chary, R.-R., Alexander, D. M., Dickinson,M., Magnelli, B., Morrison, G., Pope, A., & Teplitz, H. I.2009, ApJ, 698, 1380
Muxlow, T. W. B., et al. 2005, MNRAS, 358, 1159Negrello M., et al., 2010, Science, submittedNeugebauer, G., et al. 1984, ApJL, 278, L1Niklas, S., & Beck, R. 1997, A&A, 320, 54Oyaizu H., Lima M., Cunha C. E., Lin H., Frieman J, Shel-don E. S., 2008, ApJ, 674, 768
Pascale E., et al. 2010, MNRAS, submittedPilbratt, G. L., et al. 2010, arXiv:1005.5331Poglitsch, A., et al. 2010, arXiv:1005.1487Rigby, E., et al. 2010, MNRAS, submittedRobotham, A., et al. 2010, Publications of the Astronomi-cal Society of Australia, 27, 76
Rowan-Robinson, M. 2003, MNRAS, 344, 13Sajina, A., et al. 2008, ApJ, 683, 659Sargent, M. T., et al. 2010, ApJL, 714, L190Siebenmorgen, R., & Krugel, E. 2007, A&A, 461, 445Serjeant, S., et al. 2010, arXiv:1005.2410Seymour, N., Huynh, M., Dwelly, T., Symeonidis, M., Hop-kins, A., McHardy, I. M., Page, M. J., & Rieke, G. 2009,MNRAS, 398, 1573
Smith, D. J. B., et al. 2010, arXiv:1007.5260Sutherland, W., & Saunders, W. 1992, MNRAS, 259, 413Symeonidis, M., Willner, S. P., Rigopoulou, D., Huang, J.-S., Fazio, G. G., & Jarvis, M. J. 2008, MNRAS, 385, 1015
Thompson, T. A., Quataert, E., Waxman, E., Murray, N.,& Martin, C. L. 2006, ApJ, 645, 186
Vlahakis, C., Eales, S., & Dunne, L. 2007, MNRAS, 379,1042
White, R. L., Helfand, D. J., Becker, R. H., Glikman, E.,& de Vries, W. 2007, ApJ, 654, 99
Wilman, R. J., et al. 2008, MNRAS, 388, 1335Wilman, R. J., Jarvis, M. J., Mauch, T., Rawlings, S., &Hickey, S. 2010, MNRAS, 405, 447
Yun, M. S., Reddy, N. A., & Condon, J. J. 2001, ApJ, 554,803
![Co-doped La[sub 0.5]Sr[sub 0.5]TiO[sub 3−δ]: Diluted magnetic oxide system with high Curie temperature](https://img.pdfslide.net/doc/110x75/635feeb087d94554380e1bf9/co-doped-lasub-05srsub-05tiosub-3d-diluted-magnetic-oxide-system-with.jpg)


2 Cu 3 O 7−δ](https://img.pdfslide.net/doc/110x75/6353bf5cec9212cb1a0f7fd5/field-dependent-behavior-of-ac-susceptibility-in-y-08-ca-02ba-05-sr-052.jpg)


