Embed Size (px)
Citation preview
Heterozygous Deficiency of Endoglin Decreases Insulinand Hepatic Triglyceride Levels during High Fat DietDaniel Beiroa1, Amparo Romero-Pico1, Carmen Langa2, Carmelo Bernabeu2, Miguel Lopez1,
Jose M. Lopez-Novoa3, Ruben Nogueiras1*, Carlos Dieguez1*
1 Department of Physiology, School of Medicine-CIMUS – Instituto de Investigaciones Sanitarias (IDIS), CIBER Fisiopatologia de la Obesidad y Nutricion (CIBERobn),
University of Santiago de Compostela, Santiago de Compostela, A Coruna, Spain, 2 Centro de Investigaciones Biologicas, Consejo Superior de Investigaciones Cientıficas
(CSIC), and Centro de Investigacion Biomedica en Red de Enfermedades Raras (CIBERER), Madrid, Spain, 3 Renal and Cardiovascular Physiopathology Unit, Department of
Physiology and Pharmacology, University of Salamanca and Instituto de Investigaciones Biomedicas de Salamanca (IBSAL), Campus Miguel de Unamuno, Salamanca, Spain
Abstract
Endoglin is a transmembrane auxiliary receptor for transforming growth factor-beta (TGF-beta) that is predominantlyexpressed on proliferating endothelial cells. It plays a wide range of physiological roles but its importance on energybalance or insulin sensitivity has been unexplored. Endoglin deficient mice die during midgestation due to cardiovasculardefects. Here we report for first time that heterozygous endoglin deficiency in mice decreases high fat diet-induced hepatictriglyceride content and insulin levels. Importantly, these effects are independent of changes in body weight or adiposity. Atmolecular level, we failed to detect relevant changes in the insulin signalling pathway at basal levels in liver, muscle oradipose tissues that could explain the insulin-dependent effect. However, we found decreased triglyceride content in theliver of endoglin heterozygous mice fed a high fat diet in comparison to their wild type littermates. Overall, our findingsindicate that endoglin is a potentially important physiological mediator of insulin levels and hepatic lipid metabolism.
Citation: Beiroa D, Romero-Pico A, Langa C, Bernabeu C, Lopez M, et al. (2013) Heterozygous Deficiency of Endoglin Decreases Insulin and Hepatic TriglycerideLevels during High Fat Diet. PLoS ONE 8(1): e54591. doi:10.1371/journal.pone.0054591
Editor: Raul M. Luque, University of Cordoba, Spain
Received June 7, 2012; Accepted December 14, 2012; Published January 15, 2013
Copyright: � 2013 Beiroa et al. This is an open-access article distributed under the terms of the Creative Commons Attribution License, which permitsunrestricted use, distribution, and reproduction in any medium, provided the original author and source are credited.
Funding: This work has been supported by grants from Ministerio de Educacion y Ciencia (CD: BFU2011; ML: RyC-2007-00211; RN: RYC-2008-02219 and SAF2009-07049; GS: RYC-2009-04972, SAF2010-15881 and SAF2010-19347; JML-N: SAF2010-15881; CB: SAF2010-61827), Xunta de Galicia (ML: 10PXIB208164PR and RN:2010/14), Junta de Castilla y Leon (Excellence Group GR100) Fondo Investigationes Sanitarias (ML: PS09/01880), Centro de Investigacion Biomedica en Red (CIBER)de Fisiopatologıa de la Obesidad y Nutricion (CIBERobn), CIBER de Enfermedades Raras (CIBERER) and Red de Investigacion Cooperativa en Enfermedades Renales(REDinREN). CIBERobn, CIBERER and RETIC REDinREN are initiatives of the Instituto de Salud Carlos III (ISCIII) of Spain supported by FEDER funds. The researchleading to these results has also received funding from the European Community’s Seventh Framework Programme under grant agreements (CD, ML and RN:FP7/2007-2013: nu 245009: NeuroFAST, and RN: ERC-2011-StG-OBESITY53-281408). The funders had no role in study design, data collection and analysis, decisionto publish, or preparation of the manuscript.
Competing Interests: The authors have declared that no competing interests exist.
* E-mail: [email protected] (RN); [email protected] (CD)
Introduction
Endoglin (Eng) is a transmembrane homodimeric glycoprotein
(180 kDa) identified in human vascular endothelial cells where it is
highly expressed [1]. Eng is also expressed in many other cells
types including smooth muscle cells, mesangial cells, fibroblasts,
hepatocytes, and keratinocytes [2]. Eng functions as a non-
signaling coreceptor of the transforming growth factor beta (TGF-
b) modulating its responses [2,3].
Eng modulates processes mainly related to vascular physiology
and pathophysiology [2]. Eng plays a key role in endothelium-
mediated vascular reactivity as it regulates the expression of
endothelial nitric oxide synthase (eNOS), and consequently the
synthesis of nitric oxide (NO) [4–6] and the expression of
cyclooxygenase 2 (COX-2) [7]. Eng expression increases during
alterations in vascular structure and function as during embryo-
genesis, inflammation and wound healing [8] and it is necessary
for endothelial cell survival during hypoxia [9]. Eng is required for
normal angiogenesis during fetal development as Eng null
embryos die at 10–11.5 days due to vascular and cardiac
abnormalities [9–11]. Eng also modulates various processes
involved in the regulation of angiogenesis in the adult including
tumor growth [12–16]. Furthermore, Eng appears involved in the
vascular repair carried out by blood mononuclear cells [17] and is
associated to hypertension during pregnancy [18,19].
Mutations in the endoglin gene leading to endoglin haploinsuf-
ficiency are the cause of the Hereditary Hemorrhagic Telangiec-
tasia (HHT) type 1 [20,21]. Interestingly, gene expression
fingerprinting of blood outgrowth endothelial cells demonstrated
that compared to healthy subjects, HHT1 patients show 20% of
deregulated genes (upregulated or down regulated) that are
involved in metabolic homeostasis [22]. Supporting the link
between Eng and metabolism, a relationship between plasma
levels of Eng and glycemia was recently found in diabetic patients
[23]. In addition, endoglin deficiency is related to endothelial
dysfunction [2] and there is a clear association between endothelial
dysfunction and alterations in glucose metabolism or metabolic
syndrome [24,25]. In spite of these evidences, the endogenous role
of Eng on energy balance or glucose metabolism is largely
unknown. The present study is the first one aimed to investigate
the metabolic phenotype of mice haploinsufficient for Eng (Eng+/2)
in normal conditions or when challenged with high fat diet.
PLOS ONE | www.plosone.org 1 January 2013 | Volume 8 | Issue 1 | e54591
Endoglin and Diet-Induced Insulin Resistance
PLOS ONE | www.plosone.org 2 January 2013 | Volume 8 | Issue 1 | e54591
Materials and Methods
AnimalsGeneration and genotyping of Eng+/2 mice on a C57Bl/6
background was previously described [11,26]. Mice were kept in
ventilated rooms, in a pathogen-free facility under conditions of
controlled temperature (23uC), humidity (50%) and illumination
(12-hour light/12-hour dark cycle). All studies were performed in
parallel in Eng+/2 and Eng+/+ littermate male mice of 4–6 months
of age (20–25 g). After weaning, mice were fed a standard chow
diet, and after 8 weeks, the diet was changed to high fat diet (HFD,
Research Diets 12451; 45% fat, 4.73 kcal/g, Research Diets, New
Brunswick, NJ) during 16 weeks. All animal procedures performed
were approved by the University of Salamanca Animal Care and
Use Committee and by the Animal Committee at the University of
Santiago de Compostela. All the experiments were performed in
agreement with the Rules of Laboratory Animal Care and
International Law on Animal Experimentation.
Determination of body composition and energy balanceWhole body composition was measured using NMR imaging
(Whole Body Composition Analyzer; EchoMRI, Houston, TX).
Animals were monitored in a custom 12-cage indirect calorimetry,
food intake and locomotor activity monitoring system (TSE
LabMaster, TSE Systems, Germany) as previously described
[27,28]. Mice were acclimated for 48 hr to the test chambers and
then were monitored for an additional 48 hr. Data collected from
the last 48 hr was used to calculate all parameters for which results
are reported.
Quantitative reverse transcriptase PCR (qRT-PCR) analysisRNA was extracted using TrizolH reagent (Invitrogen) accord-
ing to the manufacturer’s instructions and two micrograms of total
RNA were used for each RT reaction and cDNA synthesis was
performed using SuperScriptTM First-Strand Synthesis System
(Invitrogen) and random primers as previously described [29].
Negative control reactions, containing all reagents except the
sample were used to ensure specificity of the PCR amplification.
For the analysis of gene expression we used real-time reverse-
transcription polymerase chain reaction (RT-PCR) analyses
performed in a fluorescent temperature cycler (TaqManH; Applied
Biosystems; Foster City, CA, USA) following the manufacturer’s
instructions [29,30]. Five hundred ng of total RNA were used for
each RT reaction. The PCR cycling conditions included an initial
denaturation at 50uC for 10 min followed by 40 cycles at 95uC for
15 sec; 60uC for 1 min. The oligonucleotide specific primers and
probes were: G6Pase Fw 59-CCA GGT CGT GGC TGG AGT
CT-39, Rv 59-TGT AGA TGC CCC GGA TGT G-39, 59-FAM-
CAG GCA TTG CTG TGG CTG AAA CTT TCA G-TAM-39;
and PEPCK1 Fw 59-CCA CAG CTG CTG CAG AAC AC-39,
Rv 59-GAA GGG TCG CAT GGC AAA-39, 59-FAM-AGG GCA
AGA TCA TCA TGC ACG ACC C-TAM-39. For the analysis of
the data, the input value of the gene expression was standardized
to the 18S value for each sample of each group and was expressed
compared with the average value for the control group.
Western blot analysisWestern blots were performed as previously described [28,31].
Briefly, total protein lysates from liver (20 mg), muscle (20 mg), and
WAT (15 mg) were subjected to SDS-PAGE, electrotransferred
onto a polyvinylidene difluoride membrane and probed with
antibodies against NFkB, PTEN, AKT, pAKT (Ser473), (Cell
Signaling, Danvers, MA), and Glut4 (Santa Cruz Biotechnology,
Santa Cruz, CA). Recombinant human endoglin tagged with the
hemagglutinin (HA) epitope was detected with 12CA5 monoclonal
antibody (Roche Diagnostics, Mannheim, Germany). As a loading
control, monoclonal antibodies to b-actin (clone AC-15, Sigma)
were used. For primary antibody detection we used horseradish
peroxidase-conjugated secondary antibodies and chemilumines-
cence (Thermo Scientific). We used eight mice per group and the
protein levels were normalized to b-actin for each sample.
Glucose and insulin tolerance testsBlood glucose levels were measured with an Accucheck
glucometer (Roche) after an intraperitoneal injection of either
2 mg/g D-glucose (Sigma) or 0.75 U/kg insulin (Sigma-Aldrich)
[32]. Area under the curve (AUC) values were determined and
data were analyzed with one-way ANOVA and post-hoc analysis
as previously described [27]. GTT and ITT AUC curves were also
analyzed with two-way ANOVA using as factors genotype and
diet.
TG content in liverThe extraction procedure for tissue TG was adapted from
methods described previously [28]. Livers (aprox 200 mg) were
homogenized for 2 min in ice-cold chloroform-methanol (2:1, vol/
vol). TG were extracted during 5-h shaking at room temperature.
For phase separation, H2SO4 was added, samples were centri-
fuged, and the organic bottom layer was collected. The organic
solvent was dried using a Speed Vac and redissolved in
chloroform. TG (Randox Laboratories LTD, UK) content of
each sample was measured in duplicate after evaporation of the
organic solvent using an enzymatic method.
Levels of plasma metabolites and hormonesPlasma glucose was measured by the glucose oxidase method
(Glucose and Triglyceride Spinreact, Spain). Plasma nonesterified
fatty acids (NEFA) concentrations were determined using a kit from
Wako (US); triacylglycerol (TG) and cholesterol were determined
using a kit from Randox Laboratories (LTD, UK). Plasma insulin
levels were measured by a previously described RIA [27].
Data Analysis and StatisticsValues are plotted as the mean 6 SEM for each genotype.
Statistical significance was determined by Student’s t -test. A P
value less than 0.05 was considered statistically significant.
Results
Eng+/2 mice fed a standard diet do not show metabolicalterations
Age-matched male WT and Eng+/2 mice of 4 weeks of age were
maintained on standard diet for 8 weeks to assess their metabolic
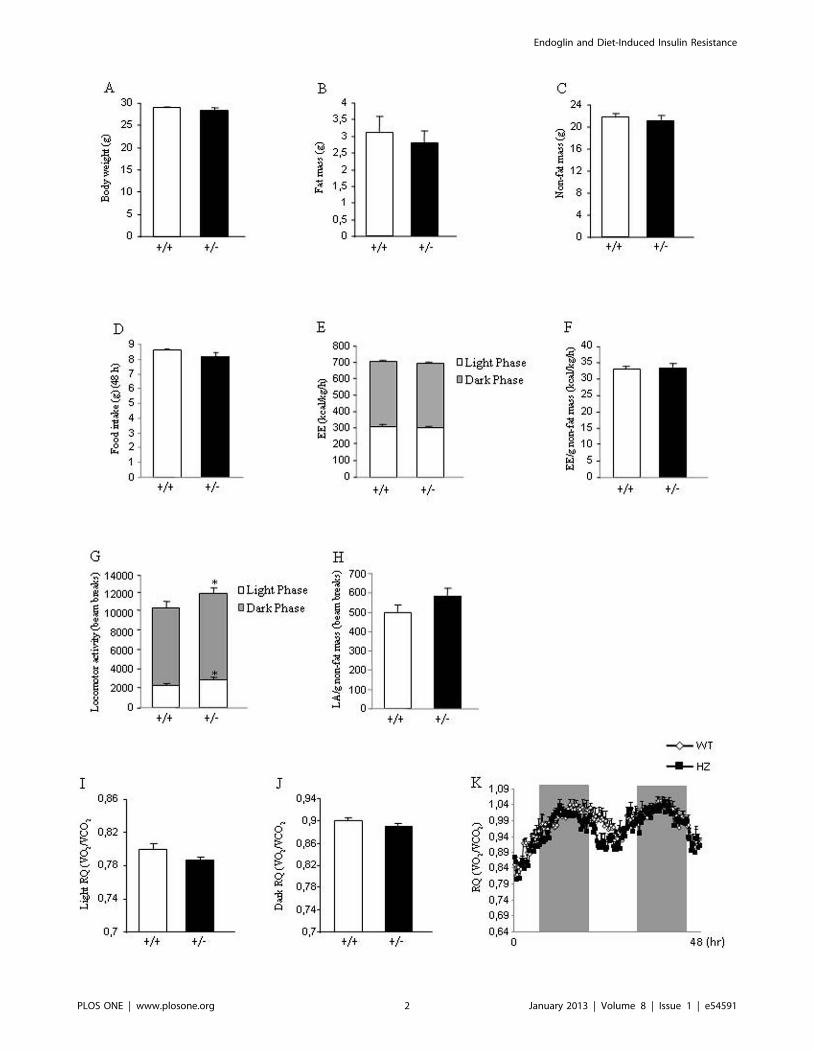
Figure 1. Body weight, body composition, food intake, and metabolic parameters in mice fed a standard diet. Body weight (A), fatmass (B), non-fat mass (C), food intake (D), total energy expenditure (E), energy expenditure corrected by non-fat mass (F), total locomotor activity (G),locomotor activity corrected by non-fat mass (H), respiratory quotient during light phase (I), respiratory quotient during dark phase (J), and 48 hprofile of RQ (K) in 8-week male wild type and endoglin heterozygous mice fed a standard diet. Measurements were done during 48 h. n = 6–8.*p,0.05.doi:10.1371/journal.pone.0054591.g001
Endoglin and Diet-Induced Insulin Resistance
PLOS ONE | www.plosone.org 3 January 2013 | Volume 8 | Issue 1 | e54591
phenotypes. No body weight differences were found between both
genotypes (Figure 1A). Consistently, body composition (fat mass
and non fat mass) (Figure 1B and 1C) and food intake (Figure 1D)
were not altered. Indirect calorimetry was used to determine
locomotor activity, energy expenditure and respiratory quotient
(RQ). Energy expenditure remained unchanged when WT and
Eng+/2 mice were fed a standard diet (Figure 1E–1F). Although a
slight but significant increase in the locomotor activity of Eng+/2,
as compared to WT mice, was observed (Figure 1G), this increase
was not found when locomotor activity was corrected by grams of
non-fat mass (Figure 1H). In addition, the RQ did not show any
statistical difference during the light (Figure 1I and 1K) or dark
phase (Figure 1J and 1K).
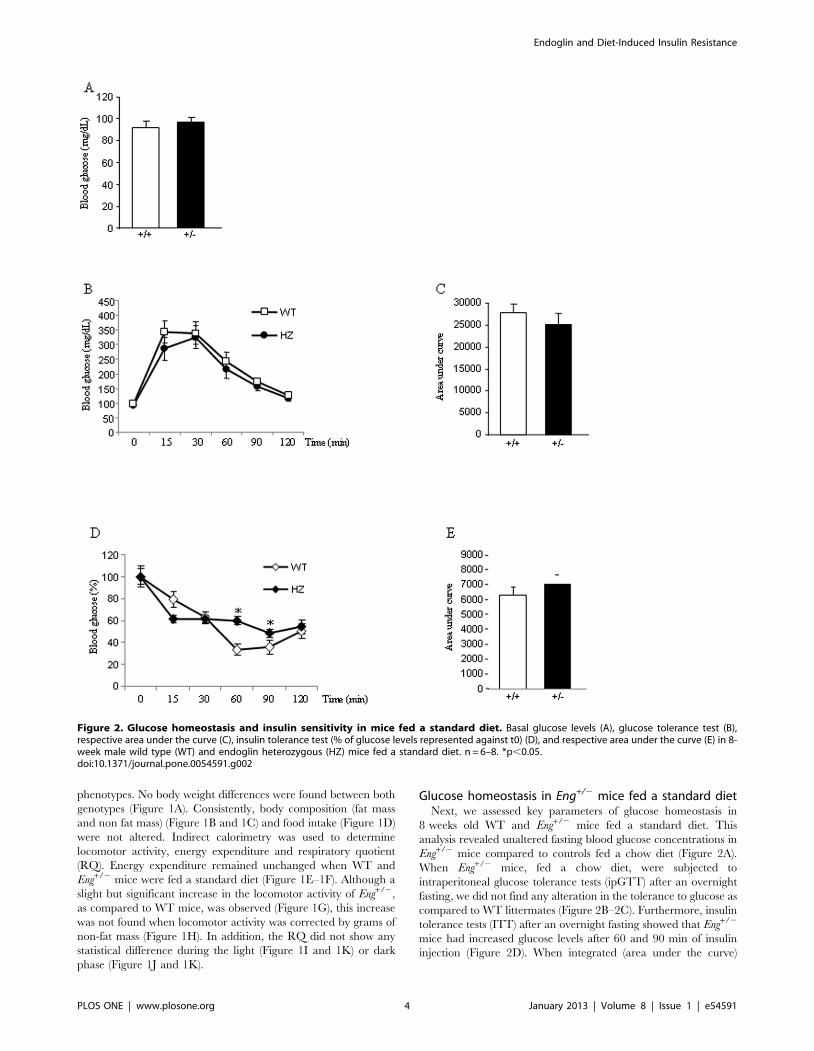
Glucose homeostasis in Eng+/2 mice fed a standard dietNext, we assessed key parameters of glucose homeostasis in
8 weeks old WT and Eng+/2 mice fed a standard diet. This
analysis revealed unaltered fasting blood glucose concentrations in
Eng+/2 mice compared to controls fed a chow diet (Figure 2A).
When Eng+/2 mice, fed a chow diet, were subjected to
intraperitoneal glucose tolerance tests (ipGTT) after an overnight
fasting, we did not find any alteration in the tolerance to glucose as
compared to WT littermates (Figure 2B–2C). Furthermore, insulin
tolerance tests (ITT) after an overnight fasting showed that Eng+/2
mice had increased glucose levels after 60 and 90 min of insulin
injection (Figure 2D). When integrated (area under the curve)
Figure 2. Glucose homeostasis and insulin sensitivity in mice fed a standard diet. Basal glucose levels (A), glucose tolerance test (B),respective area under the curve (C), insulin tolerance test (% of glucose levels represented against t0) (D), and respective area under the curve (E) in 8-week male wild type (WT) and endoglin heterozygous (HZ) mice fed a standard diet. n = 6–8. *p,0.05.doi:10.1371/journal.pone.0054591.g002
Endoglin and Diet-Induced Insulin Resistance
PLOS ONE | www.plosone.org 4 January 2013 | Volume 8 | Issue 1 | e54591
Endoglin and Diet-Induced Insulin Resistance
PLOS ONE | www.plosone.org 5 January 2013 | Volume 8 | Issue 1 | e54591
glucose levels in Eng+/2 mice fed a chow diet failed to show
significant differences compared with WT control mice (Figure 2E).
Eng+/2 mice fed a HFD show normal body weight andmetabolic phenotype
Age-matched male WT and Eng+/2 mice of 8 weeks of age were
maintained on HFD (45% kcal fat, 4.73 kcal/g) for 16 wk to assess
their metabolic phenotypes. No differences in body weight were
found between Eng+/2 and WT mice when they were fed a HFD
(Figure 3A). Consistently, body composition analysis with quan-
titative NMR revealed that Eng+/2 mice fed a HFD gained a
similar amount of fat (Figure 3B) and non-fat mass (Figure 3C)
compared to WT mice after 16 weeks with HFD. Food intake was
also very similar between both genotypes (Figure 3D). Energy
expenditure remained unchanged when WT and Eng+/2 mice
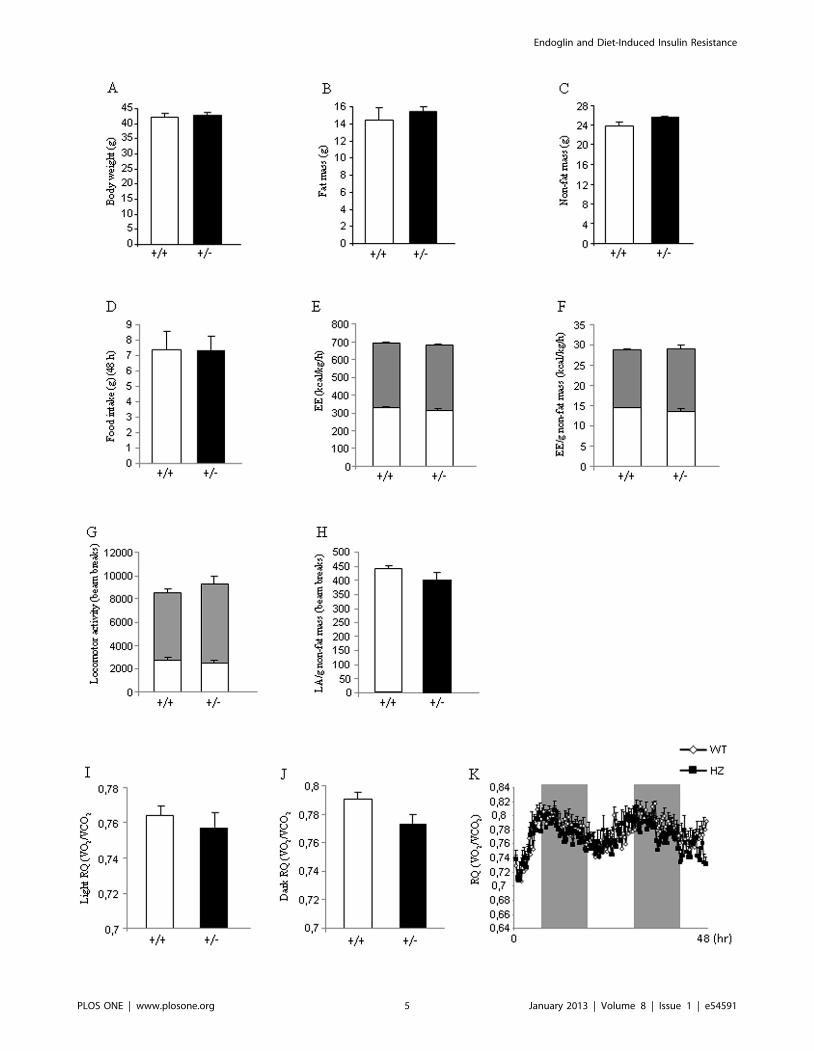
Figure 3. Body weight, body composition, food intake, and metabolic parameters in mice fed a high fat diet. Body weight (A), fat mass(B), non-fat mass (C), food intake (D), total energy expenditure (E), energy expenditure corrected by non-fat mass (F), total locomotor activity (G),locomotor activity corrected by non-fat mass (H), respiratory quotient during light phase (I), respiratory quotient during dark phase (J), and 48 hprofile of RQ (K) in male wild type and endoglin heterozygous mice fed a high fat diet for 16 weeks. Measurements were done during 48 h. n = 6–8.doi:10.1371/journal.pone.0054591.g003
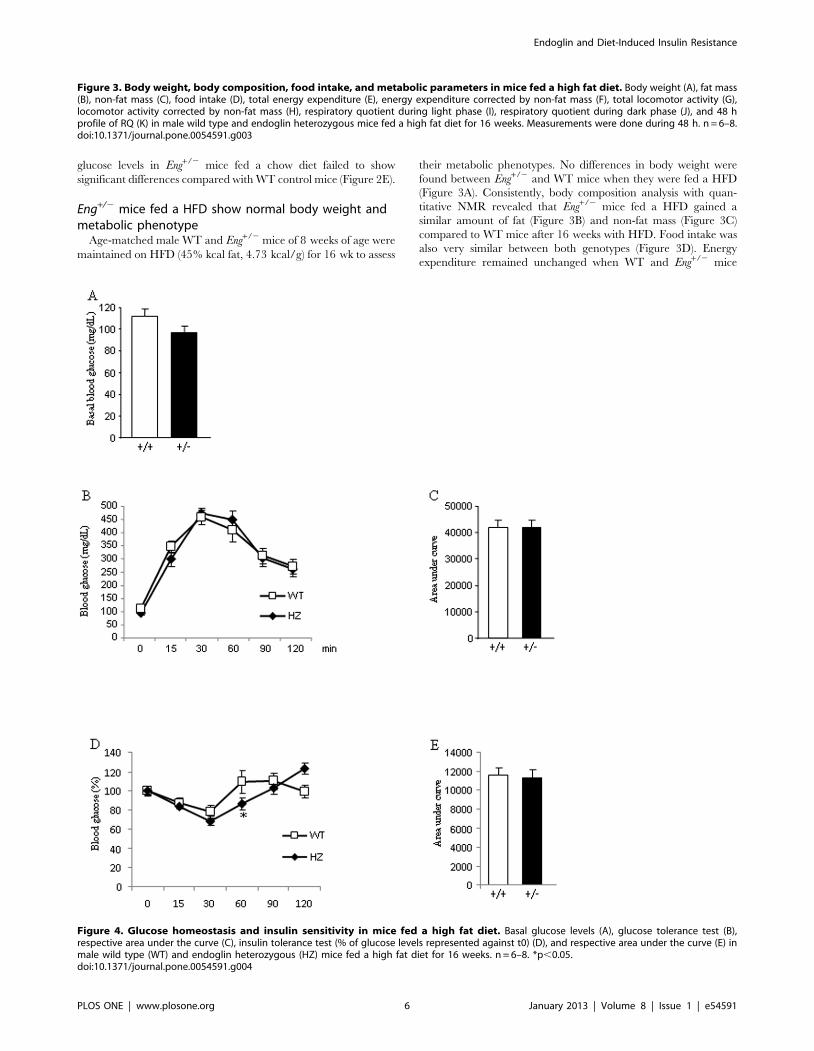
Figure 4. Glucose homeostasis and insulin sensitivity in mice fed a high fat diet. Basal glucose levels (A), glucose tolerance test (B),respective area under the curve (C), insulin tolerance test (% of glucose levels represented against t0) (D), and respective area under the curve (E) inmale wild type (WT) and endoglin heterozygous (HZ) mice fed a high fat diet for 16 weeks. n = 6–8. *p,0.05.doi:10.1371/journal.pone.0054591.g004
Endoglin and Diet-Induced Insulin Resistance
PLOS ONE | www.plosone.org 6 January 2013 | Volume 8 | Issue 1 | e54591
Endoglin and Diet-Induced Insulin Resistance
PLOS ONE | www.plosone.org 7 January 2013 | Volume 8 | Issue 1 | e54591
were fed a HFD (Figure 3E–3F). No changes were observed in the
total locomotor activity between WT and Eng+/2 mice (Figure 3G).
A similar result was observed when locomotor activity was
corrected by grams of non-fat mass (Figure 3H). The RQ did
not show any statistical difference during the light (Figure 3I and
3K) or dark phase (Figure 3J and 3K).
Glucose homeostasis in Eng+/2 mice fed a HFDAfter an overnight fast, plasma glucose levels did not differ
between WT and Eng+/2 mice fed a HFD (Figure 4A). After an
overnight fast, a GTT failed to reveal significant differences in
glucose tolerance between both genotypes (Figure 4B–4C). To
further investigate the endogenous role of Eng in the control of
glucose metabolism, mice were subjected to an ITT after an
overnight fast. After 60 min of insulin injection, glucose values in
Eng+/2 mice were lower than in WT mice, but no differences were
found at the other time points (Figure 4D). When integrated (area
under the curve) glucose levels in Eng+/2 mice fed a HFD failed to
show any significant differences when compared with WT control
mice (Figure 4E).
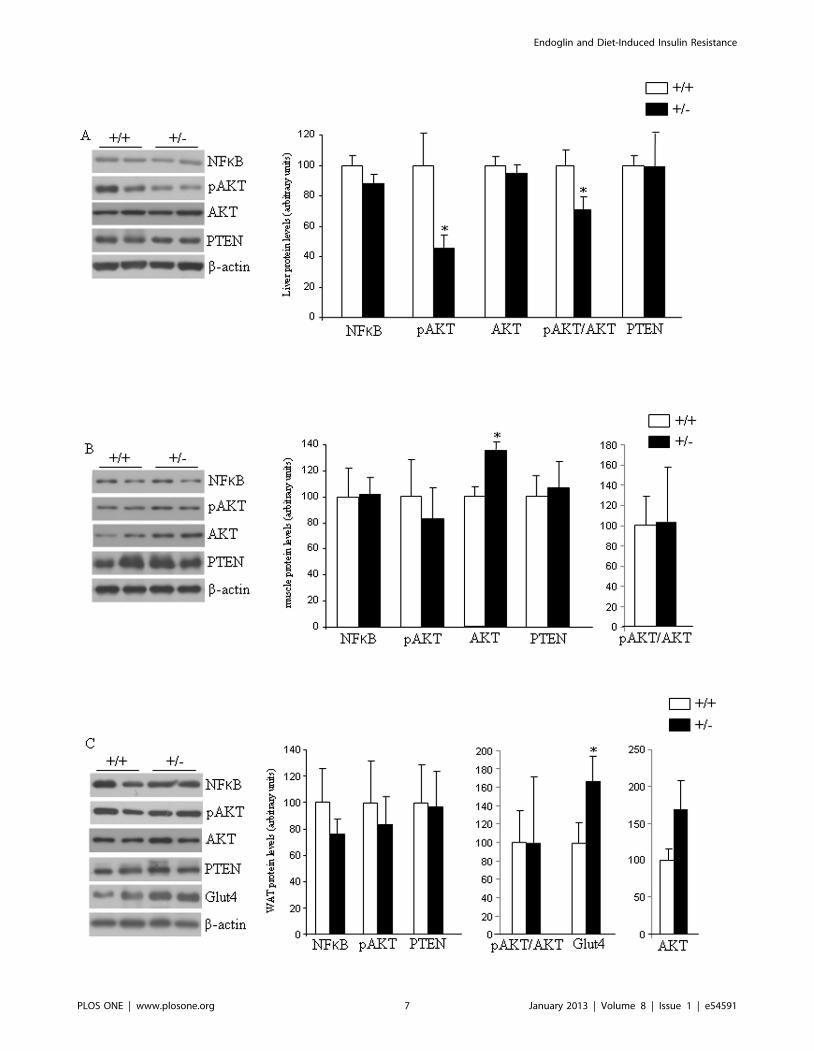
Next, we determined whether Eng interferes with the expression
of insulin-signaling components by measuring transcription factor
nuclear factor-kappaB (NFkB), pAKT, AKT, and phosphatase
and tensin homolog (PTEN) protein levels in liver, skeletal muscle
and adipose tissue samples. In the liver we found decreased levels
of AKT phosphorylation (Ser473) and the ratio pAKT/AKT,
whereas no changes were detected in NFkB, AKT or PTEN
(Figure 5A). In muscle, protein levels of these four factors were
unaffected by the partial lack of Eng (Figure 5B). In the white
adipose tissue (WAT), we also failed to detect changes in protein
levels of NFkB, pAKT, AKT, ratio pAKT/AKT, and PTEN
(Figure 5C). However, we found increased levels of glucose
transporter 4 (Glut4) in the WAT of Eng+/2 mice fed a HFD in
comparison to WT mice (Figure 5C).
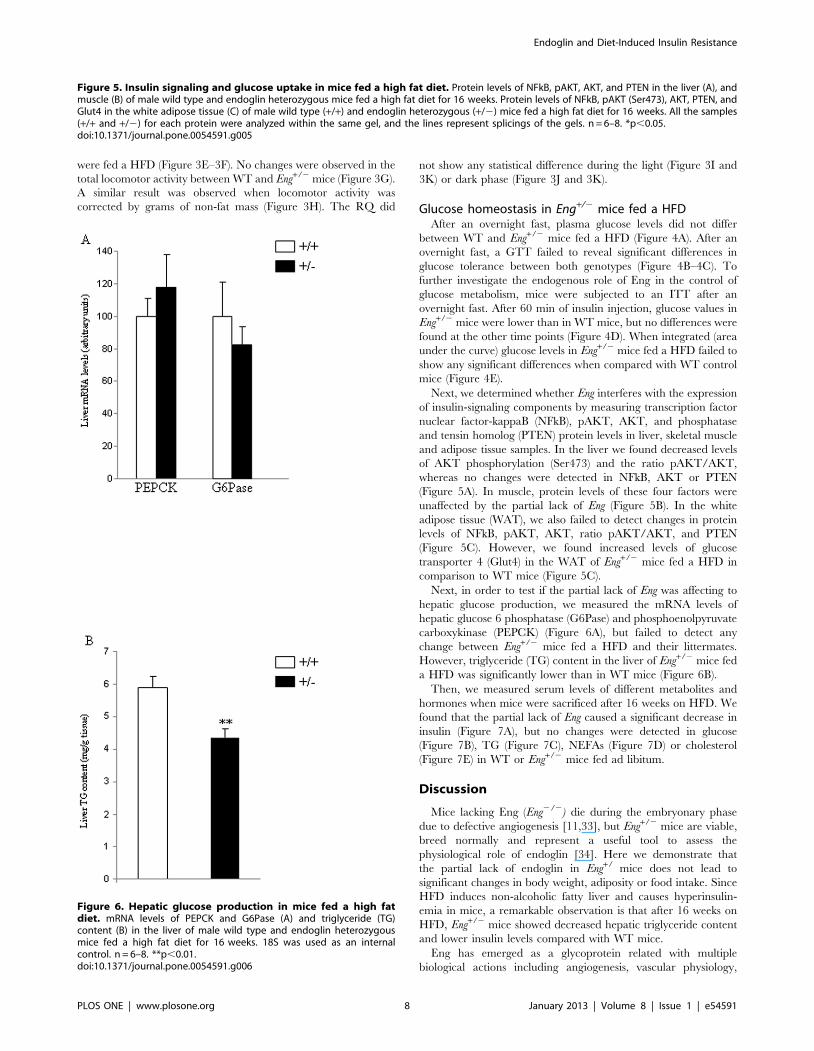
Next, in order to test if the partial lack of Eng was affecting to
hepatic glucose production, we measured the mRNA levels of
hepatic glucose 6 phosphatase (G6Pase) and phosphoenolpyruvate
carboxykinase (PEPCK) (Figure 6A), but failed to detect any
change between Eng+/2 mice fed a HFD and their littermates.
However, triglyceride (TG) content in the liver of Eng+/2 mice fed
a HFD was significantly lower than in WT mice (Figure 6B).
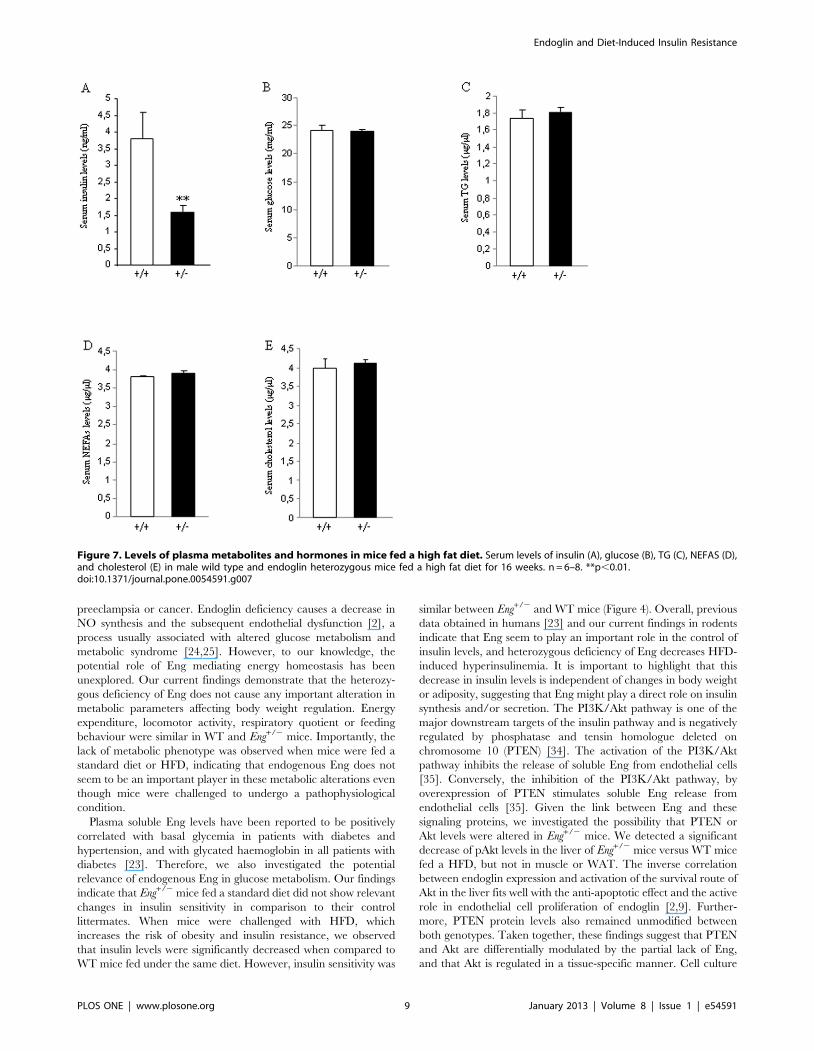
Then, we measured serum levels of different metabolites and
hormones when mice were sacrificed after 16 weeks on HFD. We
found that the partial lack of Eng caused a significant decrease in
insulin (Figure 7A), but no changes were detected in glucose
(Figure 7B), TG (Figure 7C), NEFAs (Figure 7D) or cholesterol
(Figure 7E) in WT or Eng+/2 mice fed ad libitum.
Discussion
Mice lacking Eng (Eng2/2) die during the embryonary phase
due to defective angiogenesis [11,33], but Eng+/2 mice are viable,
breed normally and represent a useful tool to assess the
physiological role of endoglin [34]. Here we demonstrate that
the partial lack of endoglin in Eng+/ mice does not lead to
significant changes in body weight, adiposity or food intake. Since
HFD induces non-alcoholic fatty liver and causes hyperinsulin-
emia in mice, a remarkable observation is that after 16 weeks on
HFD, Eng+/2 mice showed decreased hepatic triglyceride content
and lower insulin levels compared with WT mice.
Eng has emerged as a glycoprotein related with multiple
biological actions including angiogenesis, vascular physiology,
Figure 5. Insulin signaling and glucose uptake in mice fed a high fat diet. Protein levels of NFkB, pAKT, AKT, and PTEN in the liver (A), andmuscle (B) of male wild type and endoglin heterozygous mice fed a high fat diet for 16 weeks. Protein levels of NFkB, pAKT (Ser473), AKT, PTEN, andGlut4 in the white adipose tissue (C) of male wild type (+/+) and endoglin heterozygous (+/2) mice fed a high fat diet for 16 weeks. All the samples(+/+ and +/2) for each protein were analyzed within the same gel, and the lines represent splicings of the gels. n = 6–8. *p,0.05.doi:10.1371/journal.pone.0054591.g005
Figure 6. Hepatic glucose production in mice fed a high fatdiet. mRNA levels of PEPCK and G6Pase (A) and triglyceride (TG)content (B) in the liver of male wild type and endoglin heterozygousmice fed a high fat diet for 16 weeks. 18S was used as an internalcontrol. n = 6–8. **p,0.01.doi:10.1371/journal.pone.0054591.g006
Endoglin and Diet-Induced Insulin Resistance
PLOS ONE | www.plosone.org 8 January 2013 | Volume 8 | Issue 1 | e54591
preeclampsia or cancer. Endoglin deficiency causes a decrease in
NO synthesis and the subsequent endothelial dysfunction [2], a
process usually associated with altered glucose metabolism and
metabolic syndrome [24,25]. However, to our knowledge, the
potential role of Eng mediating energy homeostasis has been
unexplored. Our current findings demonstrate that the heterozy-
gous deficiency of Eng does not cause any important alteration in
metabolic parameters affecting body weight regulation. Energy
expenditure, locomotor activity, respiratory quotient or feeding
behaviour were similar in WT and Eng+/2 mice. Importantly, the
lack of metabolic phenotype was observed when mice were fed a
standard diet or HFD, indicating that endogenous Eng does not
seem to be an important player in these metabolic alterations even
though mice were challenged to undergo a pathophysiological
condition.
Plasma soluble Eng levels have been reported to be positively
correlated with basal glycemia in patients with diabetes and
hypertension, and with glycated haemoglobin in all patients with
diabetes [23]. Therefore, we also investigated the potential
relevance of endogenous Eng in glucose metabolism. Our findings
indicate that Eng+/2 mice fed a standard diet did not show relevant
changes in insulin sensitivity in comparison to their control
littermates. When mice were challenged with HFD, which
increases the risk of obesity and insulin resistance, we observed
that insulin levels were significantly decreased when compared to
WT mice fed under the same diet. However, insulin sensitivity was
similar between Eng+/2 and WT mice (Figure 4). Overall, previous
data obtained in humans [23] and our current findings in rodents
indicate that Eng seem to play an important role in the control of
insulin levels, and heterozygous deficiency of Eng decreases HFD-
induced hyperinsulinemia. It is important to highlight that this
decrease in insulin levels is independent of changes in body weight
or adiposity, suggesting that Eng might play a direct role on insulin
synthesis and/or secretion. The PI3K/Akt pathway is one of the
major downstream targets of the insulin pathway and is negatively
regulated by phosphatase and tensin homologue deleted on
chromosome 10 (PTEN) [34]. The activation of the PI3K/Akt
pathway inhibits the release of soluble Eng from endothelial cells
[35]. Conversely, the inhibition of the PI3K/Akt pathway, by
overexpression of PTEN stimulates soluble Eng release from
endothelial cells [35]. Given the link between Eng and these
signaling proteins, we investigated the possibility that PTEN or
Akt levels were altered in Eng+/2 mice. We detected a significant
decrease of pAkt levels in the liver of Eng+/2 mice versus WT mice
fed a HFD, but not in muscle or WAT. The inverse correlation
between endoglin expression and activation of the survival route of
Akt in the liver fits well with the anti-apoptotic effect and the active
role in endothelial cell proliferation of endoglin [2,9]. Further-
more, PTEN protein levels also remained unmodified between
both genotypes. Taken together, these findings suggest that PTEN
and Akt are differentially modulated by the partial lack of Eng,
and that Akt is regulated in a tissue-specific manner. Cell culture
Figure 7. Levels of plasma metabolites and hormones in mice fed a high fat diet. Serum levels of insulin (A), glucose (B), TG (C), NEFAS (D),and cholesterol (E) in male wild type and endoglin heterozygous mice fed a high fat diet for 16 weeks. n = 6–8. **p,0.01.doi:10.1371/journal.pone.0054591.g007
Endoglin and Diet-Induced Insulin Resistance
PLOS ONE | www.plosone.org 9 January 2013 | Volume 8 | Issue 1 | e54591
and animal studies have also related NF-kB activity in the
pathogenesis of insulin signalling [36]. We failed to detect any
significant change in NF-kB protein levels in the liver, muscle or
WAT between WT and Eng+/2 mice, indicating that this
transcription factor was not regulated by Eng.
At the cellular level, insulin stimulates glucose uptake by
inducing the translocation of the glucose transporter 4 (GLUT4)
from intracellular storage sites to the plasma membrane, where the
transporter facilitates the diffusion of glucose into muscle and
adipocytes [37]. Therefore, we assessed the protein levels of the
glucose transporters in WAT, and found that Glut4 protein levels
were significantly higher in Eng+/2 mice fed a HFD when
compared to their control littermates. The importance of GLUT4
expression for maintaining glucose homeostasis and insulin
sensitivity has been extensively addressed in different animal
models [38], and its essential role is reflected by the phenotype
caused by the deficiency or over-expression of GLUT4 in mice
[39]. Since Eng+/2 mice present reduced insulin levels under HFD,
the higher levels of Glut4 detected in the WAT of these mice could
be a compensatory mechanism to the lower insulin levels. Another
key aspect on diet-induced obesity is the increased amount of fatty
acids in the liver [40]. Total hepatic TG content was lower in
Eng+/2 mice than in control mice fed a HFD. Overall, our data
might suggest a defect in insulin production in beta cells from
Eng+/2 mice fed a HFD. Further studies using isolated islets will be
necessary to clarify this aspect. Indeed, we cannot rule out the
possibility that other factors important for insulin might be also
affected in Eng+/2 mice. In this regard, a comparative gene
expression analysis revealed that in endothelial cells from HHT1
patients, 20% of the deregulated genes (down or upregulated)
respect to cells from healthy subjects were involved in general
metabolism [22]. Among these genes it is worth mentioning the
presence of several members of the solute carrier (SLC) protein
family. This family contains over 300 membrane transport
proteins, including the glucose transporters Glut-1 (SLC2A1) and
Glut-4 (SLC2A4). Thus, in HHT1 cells, electroneutral cation-Cl
cotransporter SLC12A2 (Na-K-Cl cotransporter), mitochondrial
carrier SLC25A29 (mitochondrial carnitine/acylcarnitine carrier
protein CACL), fatty acid transport protein SLC27A3 (fatty acid
transport protein 3), nucleoside-sugar transporter SLC35A5
(UDP-sugar transporter protein) and basolateral iron transporter
SCL40A1 (ferroportin 1) were downregulated, whereas nucleo-
side-sugar transporters SLC35B2 (39-phosphoadenosine 59-phos-
phosulfate transporter) and SLC35D3 (fringe connection-like
protein 1) were upregulated respect to controls. In addition to
the evident involvement of these carrier proteins in the general
metabolism, some of them have been reported to be involved in
insulin-dependent metabolic pathways [41–43], thus supporting
the link between Eng and insulin. Further studies will be necessary
to address this issue.
In summary, we conclude that Eng has a physiological role in
the regulation of insulin levels and hepatic lipid content,
particularly under challenged environmental conditions. The
decreased insulin levels and lower hepatic lipid content seem to
be independent of changes in body weight or adiposity. These
findings expand our knowledge on the physiological effects
controlled by Eng, and identify Eng as a potentially important
physiological mediator of metabolism.
Acknowledgments
We thank Dr. Michelle Letarte for giving us the Eng+/2 mice and Annette
Duwell for the care and genotyping of the laboratory animals.
Author Contributions
Conceived and designed the experiments: CB ML JML-N RN CD.
Performed the experiments: DB AR-P CL. Analyzed the data: DB AR-P
CL. Contributed reagents/materials/analysis tools: DB AR-P CL CB ML
JML-N RN CD. Wrote the paper: RN CD.
References
1. Gougos A, Letarte M (1990) Primary structure of endoglin, an RGD-containing
glycoprotein of human endothelial cells. J Biol Chem 265: 8361–8364.
2. Lopez-Novoa JM, Bernabeu C (2010) The physiological role of endoglin in the
cardiovascular system. Am J Physiol Heart Circ Physiol 299: H959–974.
3. Cheifetz S, Bellon T, Cales C, Vera S, Bernabeu C, et al. (1992) Endoglin is a
component of the transforming growth factor-beta receptor system in human
endothelial cells. J Biol Chem 267: 19027–19030.
4. Jerkic M, Rivas-Elena JV, Prieto M, Carron R, Sanz-Rodriguez F, et al. (2004)
Endoglin regulates nitric oxide-dependent vasodilatation. FASEB J 18: 609–611.
5. Santibanez JF, Letamendia A, Perez-Barriocanal F, Silvestri C, Saura M, et al.
(2007) Endoglin increases eNOS expression by modulating Smad2 protein levels
and Smad2-dependent TGF-beta signaling. J Cell Physiol 210: 456–468.
6. Toporsian M, Gros R, Kabir MG, Vera S, Govindaraju K, et al. (2005) A role
for endoglin in coupling eNOS activity and regulating vascular tone revealed in
hereditary hemorrhagic telangiectasia. Circ Res 96: 684–692.
7. Jerkic M, Rivas-Elena JV, Santibanez JF, Prieto M, Rodriguez-Barbero A, et al.
(2006) Endoglin regulates cyclooxygenase-2 expression and activity. Circ Res 99:
248–256.
8. Torsney E, Charlton R, Parums D, Collis M, Arthur HM (2002) Inducible
expression of human endoglin during inflammation and wound healing in vivo.
Inflamm Res 51: 464–470.
9. Li C, Issa R, Kumar P, Hampson IN, Lopez-Novoa JM, et al. (2003) CD105
prevents apoptosis in hypoxic endothelial cells. J Cell Sci 116: 2677–2685.
10. Arthur HM, Ure J, Smith AJ, Renforth G, Wilson DI, et al. (2000) Endoglin, an
ancillary TGFbeta receptor, is required for extraembryonic angiogenesis and
plays a key role in heart development. Dev Biol 217: 42–53.
11. Bourdeau A, Dumont DJ, Letarte M (1999) A murine model of hereditary
hemorrhagic telangiectasia. J Clin Invest 104: 1343–1351.
12. Jerkic M, Rodriguez-Barbero A, Prieto M, Toporsian M, Pericacho M, et al.
(2006) Reduced angiogenic responses in adult Endoglin heterozygous mice.
Cardiovasc Res 69: 845–854.
13. Bernabeu C, Lopez-Novoa JM, Quintanilla M (2009) The emerging role of
TGF-beta superfamily coreceptors in cancer. Biochim Biophys Acta 1792: 954–
973.
14. Perez-Gomez E, Del Castillo G, Juan Francisco S, Lopez-Novoa JM, Bernabeu
C, et al. (2010) The role of the TGF-beta coreceptor endoglin in cancer.
ScientificWorldJournal 10: 2367–2384.
15. ten Dijke P, Goumans MJ, Pardali E (2008) Endoglin in angiogenesis and
vascular diseases. Angiogenesis 11: 79–89.
16. Nassiri F, Cusimano MD, Scheithauer BW, Rotondo F, Fazio A, et al. (2011)
Endoglin (CD105): a review of its role in angiogenesis and tumor diagnosis,
progression and therapy. Anticancer Res 31: 2283–2290.
17. van Laake LW, van den Driesche S, Post S, Feijen A, Jansen MA, et al. (2006)
Endoglin has a crucial role in blood cell-mediated vascular repair. Circulation
114: 2288–2297.
18. Parrish MR, Murphy SR, Rutland S, Wallace K, Wenzel K, et al. (2010) The
effect of immune factors, tumor necrosis factor-alpha, and agonistic autoanti-
bodies to the angiotensin II type I receptor on soluble fms-like tyrosine-1 and
soluble endoglin production in response to hypertension during pregnancy.
Am J Hypertens 23: 911–916.
19. Gilbert JS, Gilbert SA, Arany M, Granger JP (2009) Hypertension produced by
placental ischemia in pregnant rats is associated with increased soluble endoglin
expression. Hypertension 53: 399–403.
20. McAllister KA, Grogg KM, Johnson DW, Gallione CJ, Baldwin MA, et al.
(1994) Endoglin, a TGF-beta binding protein of endothelial cells, is the gene for
hereditary haemorrhagic telangiectasia type 1. Nat Genet 8: 345–351.
21. Shovlin CL (2010) Hereditary haemorrhagic telangiectasia: pathophysiology,
diagnosis and treatment. Blood Rev 24: 203–219.
22. Fernandez LA, Garrido-Martin EM, Sanz-Rodriguez F, Ramirez JR, Morales-
Angulo C, et al. (2007) Therapeutic action of tranexamic acid in hereditary
haemorrhagic telangiectasia (HHT): regulation of ALK-1/endoglin pathway in
endothelial cells. Thromb Haemost 97: 254–262.
23. Blazquez-Medela AM, Garcia-Ortiz L, Gomez-Marcos MA, Recio-Rodriguez
JI, Sanchez-Rodriguez A, et al. (2010) Increased plasma soluble endoglin levels
as an indicator of cardiovascular alterations in hypertensive and diabetic
patients. BMC Med 8: 86.
24. Fornoni A, Raij L (2005) Metabolic syndrome and endothelial dysfunction. Curr
Hypertens Rep 7: 88–95.
Endoglin and Diet-Induced Insulin Resistance
PLOS ONE | www.plosone.org 10 January 2013 | Volume 8 | Issue 1 | e54591
25. Hsueh WA, Lyon CJ, Quinones MJ (2004) Insulin resistance and the
endothelium. Am J Med 117: 109–117.
26. Rodriguez-Pena A, Eleno N, Duwell A, Arevalo M, Perez-Barriocanal F, et al.
(2002) Endoglin upregulation during experimental renal interstitial fibrosis in
mice. Hypertension 40: 713–720.
27. Czyzyk TA, Nogueiras R, Lockwood JF, McKinzie JH, Coskun T, et al. (2010)
kappa-Opioid receptors control the metabolic response to a high-energy diet in
mice. FASEB J 24: 1151–1159.
28. Nogueiras R, Perez-Tilve D, Veyrat-Durebex C, Morgan DA, Varela L, et al.
(2009) Direct control of peripheral lipid deposition by CNS GLP-1 receptor
signaling is mediated by the sympathetic nervous system and blunted in diet-
induced obesity. J Neurosci 29: 5916–5925.
29. Gonzalez CR, Caminos JE, Vazquez MJ, Garces MF, Cepeda LA, et al. (2009)
Regulation of visceral adipose tissue-derived serine protease inhibitor by
nutritional status, metformin, gender and pituitary factors in rat white adipose
tissue. J Physiol 587: 3741–3750.
30. Vazquez MJ, Gonzalez CR, Varela L, Lage R, Tovar S, et al. (2008) Central
resistin regulates hypothalamic and peripheral lipid metabolism in a nutritional-
dependent fashion. Endocrinology 149: 4534–4543.
31. Velasquez DA, Martinez G, Romero A, Vazquez MJ, Boit KD, et al. (2011) The
central Sirtuin 1/p53 pathway is essential for the orexigenic action of ghrelin.
Diabetes 60: 1177–1185.
32. Lee SJ, Kim JY, Nogueiras R, Linares JF, Perez-Tilve D, et al. (2010) PKCzeta-
regulated inflammation in the nonhematopoietic compartment is critical for
obesity-induced glucose intolerance. Cell Metab 12: 65–77.
33. Li DY, Sorensen LK, Brooke BS, Urness LD, Davis EC, et al. (1999) Defective
angiogenesis in mice lacking endoglin. Science 284: 1534–1537.
34. Mahmoud M, Upton PD, Arthur HM (2011) Angiogenesis regulation by
TGFbeta signalling: clues from an inherited vascular disease. Biochem SocTrans 39: 1659–1666.
35. Cudmore MJ, Ahmad S, Sissaoui S, Ramma W, Ma B, et al. (2012) Loss of Akt
activity increases circulating soluble endoglin release in preeclampsia: identifi-cation of inter-dependency between Akt-1 and heme oxygenase-1. Eur Heart J
33: 1150–1158.36. Arkan MC, Hevener AL, Greten FR, Maeda S, Li ZW, et al. (2005) IKK-beta
links inflammation to obesity-induced insulin resistance. Nat Med 11: 191–198.
37. Kahn BB, Flier JS (2000) Obesity and insulin resistance. J Clin Invest 106: 473–481.
38. Pessin JE, Saltiel AR (2000) Signaling pathways in insulin action: moleculartargets of insulin resistance. J Clin Invest 106: 165–169.
39. Graham TE, Kahn BB (2007) Tissue-specific alterations of glucose transport andmolecular mechanisms of intertissue communication in obesity and type 2
diabetes. Horm Metab Res 39: 717–721.
40. Carobbio S, Rodriguez-Cuenca S, Vidal-Puig A (2011) Origins of metaboliccomplications in obesity: ectopic fat accumulation. The importance of the
qualitative aspect of lipotoxicity. Curr Opin Clin Nutr Metab Care 14: 520–526.41. Wu Q, Ortegon AM, Tsang B, Doege H, Feingold KR, et al. (2006) FATP1 is
an insulin-sensitive fatty acid transporter involved in diet-induced obesity. Mol
Cell Biol 26: 3455–3467.42. Casimir M, Lasorsa FM, Rubi B, Caille D, Palmieri F, et al. (2009)
Mitochondrial glutamate carrier GC1 as a newly identified player in the controlof glucose-stimulated insulin secretion. J Biol Chem 284: 25004–25014.
43. Nishi Y, Fujimoto S, Sasaki M, Mukai E, Sato H, et al. (2011) Role ofmitochondrial phosphate carrier in metabolism-secretion coupling in rat
insulinoma cell line INS-1. Biochem J 435: 421–430.
Endoglin and Diet-Induced Insulin Resistance
PLOS ONE | www.plosone.org 11 January 2013 | Volume 8 | Issue 1 | e54591


