Embed Size (px)
Citation preview

THE ANATOMICAL RECORD 238:277-286 (1994)
High Field Magnetic Resonance Imaging of Normal and Pathologic Human Medulla Oblongata
M. VANDERSTEEN, E. BEULS, J. GELAN, P. ADRIAENSENS, L. VANORMELINGEN, Y. PALMERS, AND G. FRELING
Department of Anatomy (M.V., E.B., L.V., Y.P.) and Institute for Material Research (J.G., P A . ) , Limburg University, Diepenbeek, and Department of Radiology, St. Jansziekenhuis,
Genk (Y.P.), Belgium; Department of Neurosurgery (E.B.) and Department of Neuropathology (G.F.), University Hospital, Maastricht, The Netherlands
ABSTZUCT High field proton magnetic resonance (MR) imaging has been applied to depict the MR appearance of the normal excised human cervicomedullary junction, based on which neuropathologic specimens can be described. More specifically, two normal cases and one case of Chiari deformity were imaged in the transverse, sagittal, and coronal dimensions using a 9.4 Tesla vertical bore magnet. The MR images of the normal spec- imens reveal most of the neuroanatomical microstructures described in literature. An accurate description of the Chiari deformity could be made by comparing the MR reference images with those of the pathologic spec- imen. All MR detected abnormalities were confirmed by histopathology, by which no additional lesions could be found. o 1994 Wiley-Liss, Inc.
Key words: Magnetic resonance imaging, Brain stem, Neuroanatomy, Ar- nold-Chiari deformity
Recent progress in NMR microscopy (Pykett, 1982; Budinger et al., 1984; Kuhn, 1990; Moonen et al., 1990; Riederer, 1992) suggests new possibilities for many branches of science and medicine. These new opportunities make it necessary to investigate the appearance of microscopic tissue structures in NMR images and to study natural contrast phenomena and mechanisms at the microscopic level. Conventional optical microscopy gives high in-plane resolution, but requires sectioning and staining of tissue specimens. NMR microscopy has lower resolution, but is capable of generating images in the three orthogonal dimen- sions of optically opaque objects without staining and sectioning. Correlation between NMR microscopic images and the corresponding optical micrographs combines the advantages of these two techniques and provides additional information on tissue characteris- tics.
The MR appearance of the internal architecture of the spinal cord and lower brainstem is relatively unknown, since in vivo and in vitro studies with clinical units reveal little detail (Bradley, 1991; Carvlin et al., 1989; Curtin et al., 1989; Flannigan et al., 1985; Hirsch et al., 1988; Ho et al., 1989; Solsberg et al., 1990a,b). An introductory high field investiga- tion of the normal human spinal cord and cervicomed- ullary junction, exhibiting high neuroanatomic de- tails, has recently been published (Beuls et al., 1993). The purpose of this study is to build up a detailed MR neuroanatomical reference of the normal human medulla oblongata, allowing us to make an inventory of abnormalities observed in the images of a Chiari malformation. h rnn* .iX,T, n.Ir , T c l P T X T O
MATERIALS AND METHODS The first normal specimen, containing the upper cer-
vical spinal segment and the caudal half of the medulla oblongata, was taken from a 70-year-old woman, 36 hours postmortem and fixed in 10% formalin for 2 weeks. The second specimen, containing the entire me- dulla oblongata, was preserved in the department of neuroanatomy in 10% formalin for several years. The pathologic specimen came from a 56-year-old female patient, 24 hours postmortem, with a well-documented Chiari malformation, who died from non-neurological cause. This pathologic specimen was fixed in 10% for- malin for 2 weeks before the MR investigation. Since imaging techniques in general require the physical im- mobilization of the sample, all the human medulla ob- longata specimen were treated with 10% formalin, re- ducing the water mobility in tissue (Thickmann et al., 1983) but increasing its physical stability. To confirm the MR findings, the pathologic specimen was sec- tioned and stained for histopathologic control after- wards.
In order to combine the advantages of sensitivity and resolution in high field MR with an optimal contrast, instrumental parameters were selected to produce es- sentially proton-density images (repetition time (TR) = 2,000 ms and echo time (TE) = 16-18 ms) for which an adequate long repetition time is required. For the
Received May 19, 1993; accepted August 2, 1993. Address reprint requests to M. Vandersteen, Department of Anat-
omy - LUC, Universitaire Campus, B-3590 Diepenbeek, Belgium.
278 M. VANDERSTEEN ET AL.
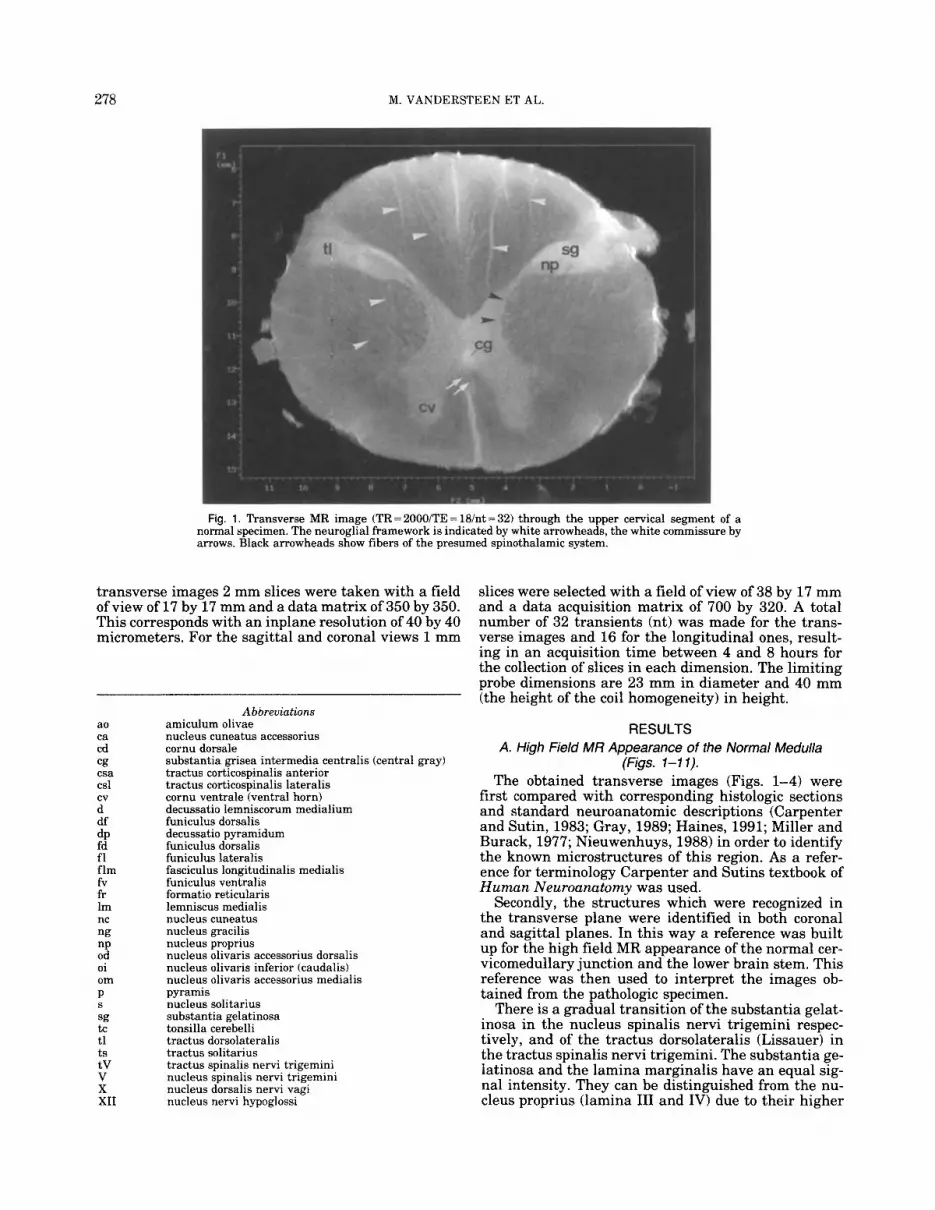
Fig. 1. Transverse MR image (TR=200O/TE=lB/nt=32) through the upper cervical segment of a normal specimen. The neuroglial framework is indicated by white arrowheads, the white commissure by arrows. Black arrowheads show fibers of the presumed spinothalamic system.
transverse images 2 mm slices were taken with a field of view of 17 by 17 mm and a data matrix of 350 by 350. This corresponds with an inplane resolution of 40 by 40 micrometers. For the sagittal and coronal views 1 mm
ao ca cd cg csa csl
d df
fd fl flm fv fr lm nc ng nP od oi om P
sg tc tl ts tV V X XI1
cv
dP
S
A bbreuiations amiculum olivae nucleus cuneatus accessorius cornu dorsale suhstantia grisea intermedia centralis (central gray) tractus corticospinalis anterior tractus corticospinalis lateralis cornu ventrale (ventral horn) decussatio lemniscorum medialium funiculus dorsalis decussatio pyramidum funiculus dorsalis funiculus lateralis fasciculus longitudinalis medialis funiculus ventralis formatio reticularis lemniscus medialis nucleus cuneatus nucleus gracilis nucleus proprius nucleus olivaris accessorius dorsalis nucleus olivaris inferior (caudalis) nucleus olivaris accessorius medialis pyramis nucleus solitarius substantia gelatinosa tonsilla cerebelli tractus dorsolateralis tractus solitarius tractus spinalis nervi trigemini nucleus spinalis nervi trigemini nucleus dorsalis nervi vagi nucleus nervi hypoglossi
slices were selected with a field of view of 38 by 17 mm and a data acquisition matrix of 700 by 320. A total number of 32 transients (nt) was made for the trans- verse images and 16 for the longitudinal ones, result- ing in an acquisition time between 4 and 8 hours for the collection of slices in each dimension. The limiting probe dimensions are 23 mm in diameter and 40 mm (the height of the coil homogeneity) in height.
RESULTS A. High Field MR Appearance of the Normal Medulla
(Figs. 1-1 I ) . The obtained transverse images (Figs. 1-4) were
first compared with corresponding histologic sections and standard neuroanatomic descriptions (Carpenter and Sutin, 1983; Gray, 1989; Haines, 1991; Miller and Burack, 1977; Nieuwenhuys, 1988) in order to identify the known microstructures of this region. As a refer- ence for terminology Carpenter and Sutins textbook of Human Neuroanatomy was used.
Secondly, the structures which were recognized in the transverse plane were identified in both coronal and sagittal planes. In this way a reference was built up for the high field MR appearance of the normal cer- vicomedullary junction and the lower brain stem. This reference was then used to interpret the images ob- tained from the pathologic specimen.
There is a gradual transition of the substantia gelat- inosa in the nucleus spinalis nervi trigemini respec- tively, and of the tractus dorsolateralis (Lissauer) in the tractus spinalis nervi trigemini. The substantia ge- latinosa and the lamina marginalis have an equal sig- nal intensity. They can be distinguished from the nu- cleus proprius (lamina 111 and IV) due to their higher

MR NEUROANATOMY HUMAN MEDULLA OBLONGATA 279
Fig. 2. Transverse MR image (TR=2.000/TE=18/nt=32) of a normal specimen at the level of the decussatio pyramidum.
signal intensity (Fig. 1). In the craniocaudally consec- utive transverse images, as well as in the longitudinal slices, the volume of the dorsal horn (cornu dorsale) is seen to increase gradually as the dorsal horn is re- placed by the spinal nucleus of the trigeminal nerve. The caudal half of this nucleus is laminated with lam- inae I and I1 showing a higher signal intensity than laminae I11 and IV (Fig. 2). The observed differences in signal intensity in the first four laminae of the dorsal horn and nucleus spinalis nervi trigemini might be ex- plained by their cytoarchitecture and by the degree of myelination of the fibers they contain: laminae I and I1 are composed of small and relatively tightly packed cells and characterized by the presence of numerous small unmyelinated and thinly myelinated fibers. The cells of lamina I11 and IV are larger and more scattered and these laminae contain more myelinated fibers (Carpenter). The tractus dorsolateralis of Lissauer and the tractus spinalis nervi trigemini, which are mainly composed of unmyelinated (80%) and poorly myeli- nated fibers (Carpenter), show a relatively high signal intensity but can be distinguished from the periphery of the dorsal horn and nucleus spinalis nervi trigemini, having an even higher signal intensity.
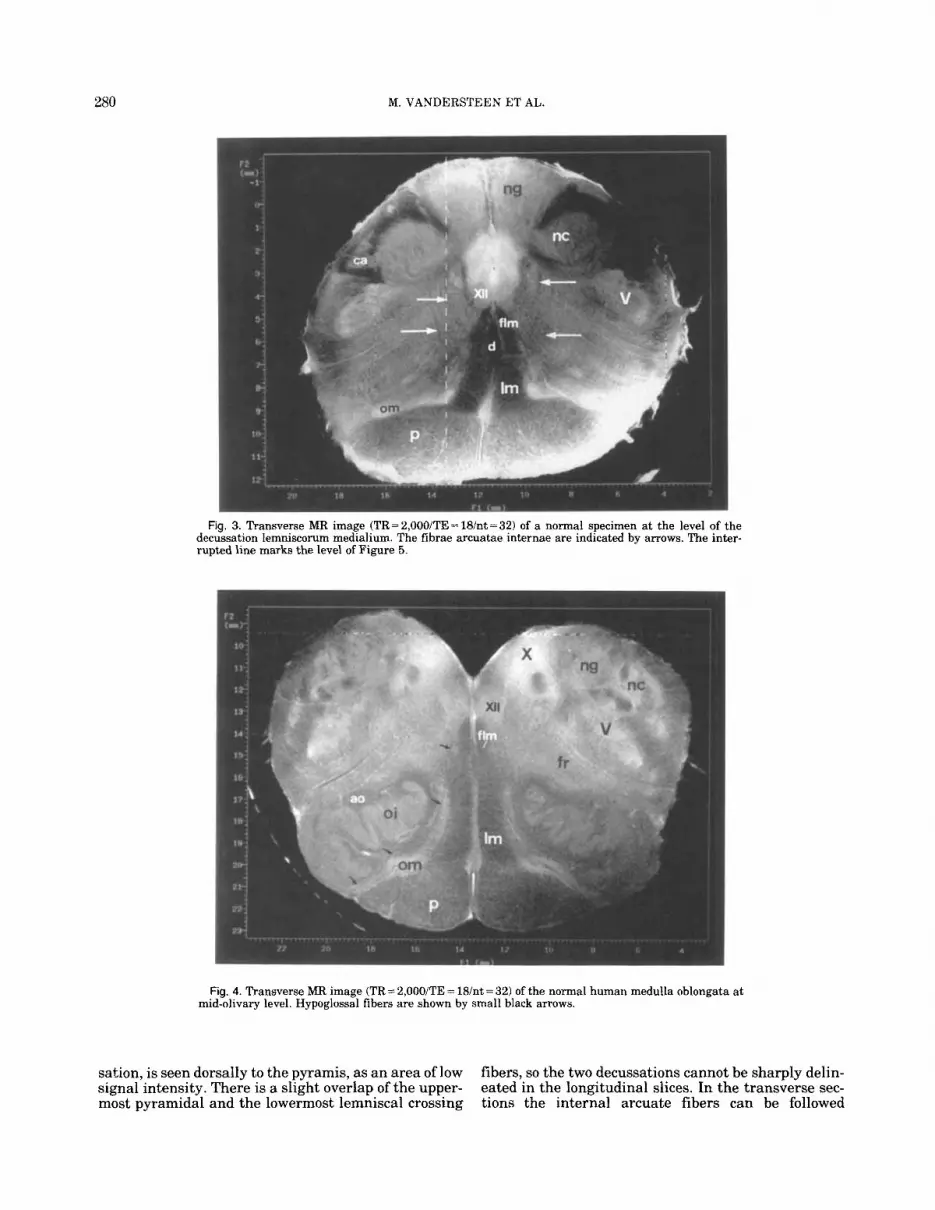
Halfway, the medulla oblongata the trigeminal nu- cleus loses its lamination and decreases in volume (Fig. 3). As a consequence, neither the nucleus nor the trac- tus can be followed cranially in the longitudinal im- ages through the upper part of the medulla although they are still identifiable in the transverse slices (Fig. 4). One of the most conspicuous features of the spinomedullary transition is the pyramidal decussa- tion. In the transverse section through the pyramids (Fig. 31, the corticospinal tracts show a typical neuro-
glial framework of high signal intensity, the myeli- nated fibers themselves show low signal intensity. In consecutive transverse slices, the low intensity fibers run in interdigitating bundles towards the lateral cor- ticospinal tract, crossing anterior to the central gray. The distance between the upper- and lowermost cross- ing fibers is approximately 12 mm. Although in the transverse slices through the upper cervical segment the signal intensity of the fibers of the lateral cortico- spinal tract is similar to the signal intensity of the surrounding fibers of the lateral funiculus, the location of the former can be distinguished by its typical neu- roglial framework (Fig. 1).
The spatial extent and the topographic relations of the pyramidal decussation are best visualized in the longitudinal images (Figs. 5-10). In the sagittal sec- tions, the dorsocaudal direction of the crossed fibers is clearly depicted (Fig. 6) and a certain degree of soma- totopic organization is visible: the upper fibers migrate more dorsally than the lower ones. Caudally to the oblique corticospinal fibers, nearly horizontally ori- ented strands of low signal intensity pass through the base of the dorsal horn. These fibers are also identifi- able in coronal (Fig. 10) and transverse sections (Fig. 1). They are interpreted as fibers of the spinothalamic tract on their way to the anterior white commissure. Cranially to the descending pyramidal fibers, fibrae arcuatae internae (Figs. 5 , 6) are seen to ascend from the ventral parts of the dorsal nuclei towards the ven- trally located lemniscal decussation (Fig. 6). The heavily myelinated internal arcuate fibers show low signal intensity and have a somewhat less steep course than the pyramidal fibers. The decussatio lemnisco- rum, which is located cranially to the pyramidal decus-
280 M. VANDERSTEEN ET AL.
Fig. 3. Transverse MR image (TR=2,000/TE=18/nt=32) of a normal specimen at the level of the decussation lemniscorum medialium. The fibrae arcuatae internae are indicated by arrows. The inter- rupted line marks the level of Figure 5.
Fig. 4. Transverse MR image (TR= 2,00O/TE = 18/nt = 32) of the normal human medulla oblongata at mid-olivary level. Hypoglossal fibers are shown by small black arrows.
sakion, is seen dorsally to the pyramis, as an area of low signal intensity. There is a slight overlap of the upper- most pyramidal and the lowermost lemniscal crossing
fibers, so the two decussations cannot be sharply delin- eated in the longitudinal slices. In the transverse sec- tions the internal arcuate fibers can be followed

MR NEUROANATOMY HUMAN MEDULLA OBLONGATA 281
through the formatio reticularis as they curve around the central gray (Fig. 3). The lemnisci mediales, aris- ing from the lemniscal decussation can be followed through the upper part of the medulla as paramedian bands with little signal intensity (Fig. 10). The poste- rior column nuclei from which the fibrae arcuatae in- ternae arise, can be distinguished from the surround- ing fasciculi due to their higher signal intensity (Figs. 3-8, 11). The caudal end of the nucleus cuneatus is projecting from the dorsal gray column; this continuity is lost at higher levels. The topographic relation of the cuneate and gracile nuclei are best illustrated in con- secutive coronal slices: since their upper ends deviate dorsally they are never entirely depicted in one single image.
The nucleus cuneatus accessorius is seen in the three spatial dimensions as a zone of high signal intensity, laterally to the nucleus cuneatus (Figs. 3, l l) . The ven- tral horns are separated from the central gray by the decussating corticospinal fibers as is accurately shown in coronal slices (Fig. 9). The separated ventral horn gradually decreases in volume. The nucleus su- praspinatus and the nucleus spinalis accessorius can- not be distinguished in the MR images. Rostrally to the pyramidal decussation the gray matter can no longer be delineated from the surrounding white matter tracts. This is the transitional zone between the well defined gray butterfly and the scattered formatio re- ticularis. The latter is shown as a diffuse, poorly delin- eated area with zones of higher signal intensity tra- versed by numerous dark patterns, caused by myelinated fibers, passing through (Fig. 10). In the medullary formatio reticularis some discrete cell ag- gregations form distinctive reticular nuclei. None of these nuclei can be distinguished from the surround- ings in the MR images.
The nucleus ambiguus, a cell accumulation lying in the medullar reticular formation halfway between the spinal trigeminal nucleus and the olivary complex, cannot be detected in the MR images.
The central part of the gray matter surrounding the central canal is displaced dorsally towards the floor of the fourth ventricle: this displacement is well visual- ized in the paramedian sagittal section (Fig. 7). Ros- trally to the lemniscal decussation some inhomogene- ities are seen in the central gray (Figs. 3, 4, 7). The nucleus nervi hypoglossi has a lower signal intensity than the rest of the central gray and can therefore be identified. This nucleus is composed of large motorneu- rons and heavily myelinated axons, a feature which is expected to be responsible for the hypo intense appear- ance of the nucleus. The hypoglossal fibers, showing no signal intensity, can be followed through the formatio reticularis: they pass medially to the medial lemniscus and the pyramis and emerge between the pyramis and the oliva (Fig. 4).
First dorsally and in a more cranial plane dorsolat- erally to the hypoglossal nucleus there is a zone of high intensity: here, the nucleus intercalatus, the nucleus dorsalis nervi vagi and the nucleus solitarius are situ- ated. These three nuclei, having an equally high signal intensity cannot be further distinguished in the MR images. All three contain unmyelinated and thinly my- elinated fibers, hence their hyper intense appearance. In the paramedian sagittal section (Fig. 71, the hypo-
glossal nucleus gives the false impression of extending more rostrally than the vagal nerve complex: however the upper end of the latter is bent dorsolaterally and is therefore depicted in the next slice more laterally. The vagal nerve complex reaches one mm more caudally and rostrally than the hypoglossal nerve.
Ventrolaterally to the vagal nerve complex, a well delineated circular area of low signal intensity is seen (Fig. 4). Its diameter is approximately 1 mm. This is the tractus solitarius which is surrounded by a nucleus of the same name. The dorso- and ventrolateral parts of this nucleus are visible as hyper intense zones. In coro- nal slices the convergence of the left and the right trac- tus solitarius and the fusion, caudally to the fourth ventricle of the medial parts of their nuclei is depicted (Fig. 11).
At olivary levels the nucleus olivaris inferior, the nucleus olivaris accessorius medialis and dorsalis, hav- ing a higher signal intensity than their surroundings, can be identified. Their extent and topographical rela- tions are best visualized in longitudinal slices: the dis- tance between the upper and lowermost part of the inferior olivary nucleus is 14 mm (Fig. 8). The lower end of the nucleus olivaris accessorius medialis reaches 2 mm beyond the inferior olivary nucleus. The nucleus olivaris accessorius dorsalis is only seen dorsally to the central part of the inferior olivary nucleus. Between the principal and the accessory olivary nuclei a zone of very low signal intensity is seen: this is caused by the amiculum olivae, composed of myelinated fibers which mainly end in the inferior nucleus. Apart from the lem- niscal and pyramidal tracts and the tractus solitarius, only the fasciculus longitudinalis medialis (Figs. 3, 4, 9, 10) can be distinguished from the surroundings due to its low signal intensity. The location of other tracts (spinocerebellar and vestibulospinal and anterolateral system) can be indicated, although the tracts them- selves cannot be seen.
€3. High Field MR Appearance of the Medulla Oblongata in a Chiari-Deformity
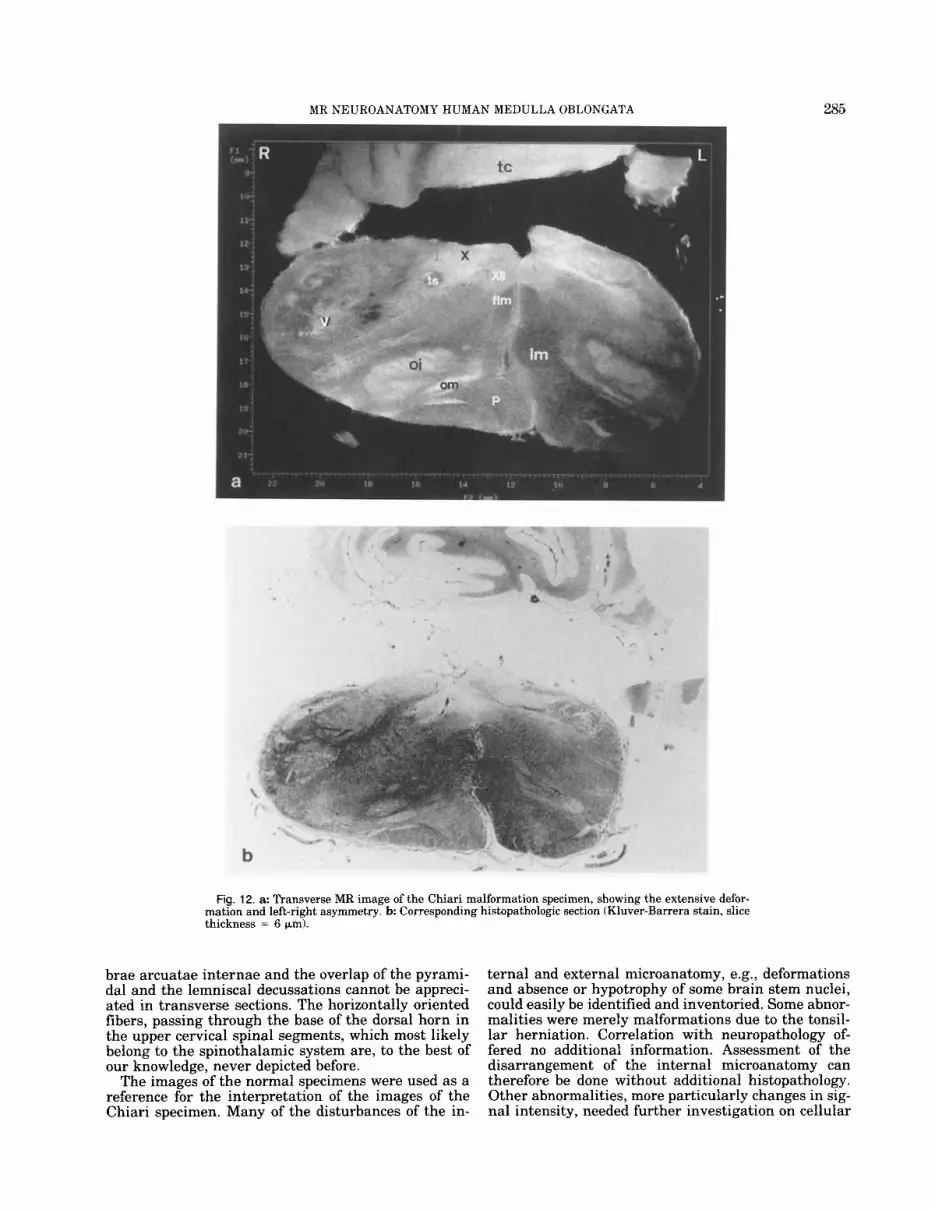
The specimen contains the medulla and the herni- ated right cerebellar tonsil which lies against the dor- sal surface of the right half of the medulla (Fig. 12a). The latter is extremely deformed: there is a flattening anteroposteriorly to 213 of the normal dimensions, which is clearly caused by the cerebellar hernia. In the axial plane the total transverse diameter of the me- dulla oblongata is normal, compared to the normal specimen, but there is a considerable left-right asym- metry, the left half being much smaller than the right half (Fig. 12,a). This abnormality cannot simply be ex- plained by the tonsillar hernia. Elongation of the spec- imen can be appreciated in sagittal slices (Fig. 13): the length of the inferior olivary nucleus is increased to 17.5 mm (14 mm in the normal specimen).
Although not shown in detail, the following observa- tions were made in the consecutive transverse MR slices.
The nucleus spinalis nervi trigemini, which lies in its normal position and is clearly “laminated” on the right side, is underdeveloped and not laminated on the left side with a distinct dorsolaterally displacement.
In the transverse slice through the pyramidal decus- sation only fibers from the left pyramid are seen to

Figs. 5-8.

MR NEUROANATOMY HUMAN MEDULLA OBLONGATA 283
Fig. 9. Coronal MR image (TR = 2,000iTE = l8int = 16) of the cervi- comedullary junction through the ventral horns and the pyramidal decussation.
Fig. 10. Coronal MR image (TR = 2,OOOiTE = 18/nt= 16) of the cer- vicomedullary junction 2 mm dorsal to Figure 9, through both the pyramidal and the lemniscal decussations. Presumed fibers of the spinothalamic system are indicated by black arrowheads.
cross over to the right corticospinal tract. At higher levels the left pyramis is seen to be considerably larger than the right.
The nucleus cuneatus and gracilis appear to be nor- mal on the right side. On the left side the nucleus cu- neatus is hypoplastic with an increased signal inten- sity. The fibrae arcuatae internae are only seen on the right side. The medial lemniscus on the left side is broadened but has its normal signal intensity; on the right side it appears underdeveloped and shows an in-
Fig. 5. Sagittal MR image (TR = 2,000/TE = 18int = 16) through the normal human cervicomedullary junction. Arrows indicate the fibrae arcuatae internae. The location of this section is indicated in Figure 3.
creased signal intensity. The nucleus cuneatus acces- sorius can only be identified on the right side.
The forrnatio reticularis appears normal on both sides.
In the central gray, the hypoglossal nucleus can bi- laterally be identified due to its lower signal intensity. In the dorsolateral vagal nerve complex, the lateral part of the nucleus solitarius can only be distinguished from the tract on the right side; on the left side the nucleus is absent resulting in little contrast between the tract and its surroundings.
The inferior olivary nucleus is flattened and elon- gated, the accessory olivary nuclei are rather small.
All these findings were confirmed by directed histo- pathology (Fig. 12,b).
DISCUSSION Fig. 6. Sagittal MR image (TR= 2,0001TE = 18int = 16) 1 mm medial
to Figure 5. Fibrae arcuatae internae are indicated by arrows, pre- sumed fibers of the spinothalamic system by arrowheads.
In magnetic resonance imaging of biomedical speci- mens, contrast depends on the intrinsic tissue NMR- characteristics, i.e., proton (mostly mobile water) den-
Fig. 7. Paramedian sagittal MR image (TR=2,000/TE= 18/nt= 16) sity, "1 and T2 reiaxation rates, as well as on the instrumental parameters allowing to select for T1-,
i% MR observable, lipid Protons (Kamman et a!., 1984; Bottomley et al., 1984; Pykett, 1982) was exper-
1 mm medial to Figure 6.
human medulla oblongata through the olivary complex, 3 mm lateral to the midline.
Fig, 8, Saggital MR image (TR=2,000/TE = 18/nt= 16) of a normal T2-, Or concentration weighting. The absence Of

284 M. VANDERSTEEN ET AL.
Fig. 1 1. Coronal MR image (TR= 2,000iTE = 18int = 16) through the dorsal part of the medulla oblongata.
imentally confirmed for all medulla oblongata speci- mens by means of 'H-NMR.
On 10% formalin treatment, the T2-values for white (114 ms) and gray (87 ms) matter in human spinal cord specimen are reduced to 150% and ?70%, respectively, of the original values and equalized to 260 ms (Carvlin et al., 1989). This was experimentally confirmed in our lab for the medulla oblongata by means of a T2-calcu- lated image from a set of multi-echo images. The spin density is less affected by fixation: gray and white mat- ter values are reduced to ?96 and +90% of their orig- inal values (Carvlin et al., 1989). Therefore, high field MR-investigations using essentially spin-density pa- rameters, generate images with excellent resolution and contrast. The long repetition time is furthermore efficiently exploited by using the scrambled multislice technique during data acquisition. Besides an optimal contrast, the main advantage of this experimental pa- rameter setting is the absence of T1 weighting in the micrographs, allowing to compare them with similar images acquired at different magnetic field strengths. This could make the images suitable as a reference for future clinical imaging.
The differences in signal intensity between the mi- crostructures of the medulla spinalis and medulla ob- longata specimens, as they are seen in these proton density high field MR-investigation, are a function of the content of mobile water. Gray matter is known to
have approximately 12% more free water than white matter and subsequently has a higher spin density (Enzmann et al., 1990): gray matter nuclei are there- fore shown as zones of relatively high signal intensity. The protons of the myelin membrane themselves do not contribute to the MR signal, but the content of mobile water is reduced by the presence of myelin (Teresi et al., 1989). Therefore, gray matter nuclei with different myelin concentrations emit a different signal intensity and can be distinguished: the hypoglossal nucleus, con- taining heavily myelinated fibers, shows less signal than the surrounding vagal nuclei complex. It is also the base for the distinction of laminae I and I1 from laminae I11 and IV in the dorsal horn.
The signal intensity of the white matter tracts is a direct reflection of their degree of myelination: heavily myelinated tracts such as the lemniscus medialis and the fasciculus longitudinalis medialis, emit no signal, while the tractus dorsolateralis, which contains mainly unmyelinated fibers, has a relatively high signal in- tensity. The neuroglial framework shows a high signal intensity, reflecting a high content of mobile water. It is depicted simultaneously with the gray nuclei and white matter tracts and in some areas it is possible to distinguish typical regional patterns.
To interpret the transverse of the normal specimen, standard histologic sections were used for the identifi- cation of the microstructures: the details shown in the MR images are comparable with low magnification light microscopy although cellular detail remain be- yond the limits of MR investigation. Nevertheless it provides within hours serial 1 mm sections of the entire specimen which simultaneously depict gray matter nu- clei, white matter tracts and neuroglial framework. Due to the thickness of the slice, a certain volume of the specimen is imaged and there is some superposition of structures. To demonstrate a comparable amount of structures, light microscopy requires longer prepara- tion time, irreversibly cutting of the specimen and sev- eral staining techniques. Neuroglial cells for instance are difficult to demonstrate by light microscopy and require selective staining techniques: in routine mi- croscopy preparations, only their nuclei are visualized. On the other hand, microscopic examination with se- lective staining enables visualization of a number of structures which are not visible in MR images (e.g., formatio reticularis nuclei, nucleus ambiguus). Histol- ogy is also required for the distinction between arteries and veins, since all blood vessels appear similarly dark in MR images probably due to the presence of para- magnetic iron ions and the formation of blood clots.
The great advantage over microscopy lies in the pos- sibility of high field MR investigation to generate im- ages of the same specimen in different plane orienta- tions. The longitudinal images, although they cannot be interpreted without a detailed analysis of the trans- verse sections, offer additional information about the topographic relation of the identified microstructures and the course of fibers and blood vessels. Especially coronal sections are very rare in literature. Transi- tional zones such as the change of the central gray butterfly in the formatio reticularis, are particularly well visualized in coronal and sagittal sections. Some known morphologic features can only be demonstrated in longitudinal images: the ascending course of the fi-
MR NEUROANATOMY HUMAN MEDULLA OBLONGATA 285
Fig. 12. a: Transverse MR image of the Chiari malformation specimen, showing the extensive defor- mation and left-right asymmetry. b Corresponding histopathologic section (Kluver-Barrera stain, slice thickness = 6 pm).
brae arcuatae internae and the overlap of the pyrami- dal and the lemniscal decussations cannot be appreci- ated in transverse sections. The horizontally oriented fibers, passing through the base of the dorsal horn in the upper cervical spinal segments, which most likely belong to the spinothalamic system are, to the best of our knowledge, never depicted before.
The images of the normal specimens were used as a reference for the interpretation of the images of the Chiari specimen. Many of the disturbances of the in-
ternal and external microanatomy, e.g., deformations and absence or hypotrophy of some brain stem nuclei, could easily be identified and inventoried. Some abnor- malities were merely malformations due to the tonsil- lar herniation. Correlation with neuropathology of- fered no additional information. Assessment of the disarrangement of the internal microanatomy can therefore be done without additional histopathology. Other abnormalities, more particularly changes in sig- nal intensity, needed further investigation on cellular

286 M. VANDERSTEEN ET AL.
Fig. 13. Sagittal MR image of the Chiari malformation specimen through the olivary complex, illustrating the tonsillar hernia and the elongation of the specimen. Cf. Figure 8.
level. Histopathology may also reveal discrete lesions, which are invisible in MR images: a mild cellular loss in the inferior olivatory complex was found by micro- scopic investigation, although its signal intensity ap- peared to be normal in the MR images. In the case of pathology, MR microanatomy and histopathology are undoubtedly complementary as methods of investiga- tion. MR images can be used to screen a specimen and to direct the histopathology towards the affected areas.
CONCLUSIONS Although cellular details are still beyond the limits
of MR, the transverse images at 9,4 Tesla are compa- rable to low magnification light microscopic images, allowing us to define the high field MR appearance of the normal cervicomedullary transition. All the known characteristic features (Carpenter; Gray) of the cervi- comedullary transition could be detected in the trans- verse as well as in the longitudinal sections of which only a few are published in neuroanatomic literature. Moreover, specimen preparation is limited to fixation, leaving it intact and suitable for microscopy. For the pathologic specimen all the abnormalities observed in the MR images were confirmed by histopathology,
which did not reveal any additional abnormalities. In conclusion MR microscopy, offering high resolution im- ages in the three spatial dimensions in a nondestruc- tive manner, might become a useful complementary morphologic screening method.
LITERATURE CITED Beuls, E., J . Gelan, M. Vandersteen, P. Adriaensens, L. Vanormelin-
gen, and Y. Palmers 1993 Microanatomy of the excised human spinal cord and the cervicomedullary junction examined with high-resolution MR imaging at 9.4 tesla. Am. J . Neuroradiol., 143599-707.
Bottomley, P.A., H.R. Hart, Jr., W.A. Edelstein, J.F. Schenck, L.S. Smith, W.M. h u e , O.M. Mueller, and R.W. Redington 1984 Anat- omy and metabolism of the normal human brain studied by mag- netic resonance a t 1.5 tesla. Radiology, 150:441-446.
Bradley, W.G. 1991 MR of the brain stem: a practical approach. Ra- diology, 179:319-332.
Budinger, T.F., and P.C. Lauterbur 1984 Nuclear magnetic resonance technology for medical studies. Science, 226:288-297.
Carpenter, M.B., and J. Sutin 1983 Human Neuroanatomy, 8th ed. Williams and Wilkins, Baltimore, pp. 307-357.
Carvlin. M.J.. R. Asato. D.B. Hacknev. E. Kassab. and P.M. Joseuh 1989 High resolution MR of the spinal cord in’humans and rats. Am. J . Neuroradiol. 10:13-17.
Curtin, A.J., D.W. Chakares, R. Bulas, C.P. Boesel, M. Finneran, and E. Flint 1989 MR imaging artifacts of the axial internal anatomy of the cerivcal suinal cord. Am. J. Neuroradiol.. 152:835-842.
Enzmann, D.R., R.L: DeLaPaz, and J.B. Rubin 1990 Magnetic Reso- nance of the Spine. C.V. Mosby, St. Louis, pp. 108-126.
Flannigan, R.D., W.G. Bradley, J.C. Mazziotta, W. Rauschning, J.R. Bentson, R.B. Luikin, and G.B. Hieshima 1985 Magnetic reso- nance imaging of the brainstem: normal structure and basic func- tional anatomy. Radiology, 154:375-383.
Haines, D.E. 1991 Neuroanatomy An Atlas of Structures, Sections and Systems, 3th ed. Urban & Schwarzenberg, Munich, pp. 83- 95.
Hirsch, W.L., S.S. Kemp, A.J. Martinez, H. Curtin, R.E. Latchaw, and G. Wolf 1988 Anatomy of the brainstem: correlation of in vitro MR images with histologic sections. Am. J . Neuroradiol., 10:923- 928.
Ho, P.S.P., S. Yu, L.F. Czervionke, L.A. Sether, M. Wagner, P. Pech, and V.M. Haughton 1989 MR appearance of gray and white mat- ter at the cervicomedullary region. Am. J . Neuroradiol., 10:1051- 1055.
Kamman, R.L., K.G. Go, F.A.J. Muskiet, G.P. Stomp, P. Van Dijk, and H.J.C. Berendsen 1984 Proton spin relaxation studies of fatty tissue and cerebral white matter. Magn. Reson. Imaging, 2:211- 220.
Kuhn, W. 1990 NMR microscopy-fundamentals, limits and possible applications. Angew. Chem. Int. Ed. Engl., 29:l-19.
Miller, R.A., and E. Burack 1977 Atlas of the Central Nervous System in Man, 2nd ed. Williams and Wilkins, Baltimore.
Moonen, C.T.W., P.C.M. Van Zijl, J.A. Frank, D. Le Bihan, and E.D. Becker 1990 Functional magnetic resonance imaging in mede- cine and physiology. Science, 250.53-61.
Nieuwenhuys, R., J . Voogd, and C. Van Huyzen 1988 The Human Central Nervous System, 2nd ed. Springer-Verlag, Baltimore, pp. 92-102.
Pykett, I.A. 1982 NMR imaging in medecine. Sci. Am., 246:54-64. Riederer, S.J. 1992 Resource letter MI-1: medical imaging. Am. J . - -
Physiol., 8:682-693. Solsberrr. M.D.. D. Fournier. and D.G. Potts 1990a MR imaging of the
ex&ed human brainstem: a correlative neuroanatomic-study. Am. J. Neuroradiol., 11:1003-1013.
Solsberg, M.D., C. Lemaire, L. Resch, and D.G. Potts 1990b High resolution MR imaging of the cadaveric human spinal cord: nor- mal anatomy. Am. J. Neuroradiol., 11:3-7.
Teresi, L.M., D. Hovda, A.B. Seeley, K. Nitta, and R.B. Lufkin 1989 MR imaging of experimental demyelination. Am. J . Neuroradiol., 10:307-314.
Thickmann, D.I., H.L. Kundel, and G. Wolf 1983 Nuclear magnetic resonance characteristics of fresh and fixed tissue: the effect of elapsed time. Radiology, 148r183-185.
Williams, P.L., R. Warwick, M. Dyson, and L. Bannister 1989 Gray’s Anatomy, 37th ed. Churchill Livingstone, New-York, pp. 949- 957.


![[Adenomyomatosis of the gallbladder: pathologic and clinical features, therapeutic indications]](https://img.pdfslide.net/doc/110x75/63606476251922d58a099d11/adenomyomatosis-of-the-gallbladder-pathologic-and-clinical-features-therapeutic.jpg)


