Embed Size (px)
Citation preview

Global and Planetary Change 116 (2014) 10–29
Contents lists available at ScienceDirect
Global and Planetary Change
j ourna l homepage: www.e lsev ie r .com/ locate /g lop lacha
High-level landscapes along the margin of southern East Greenland—Arecord of tectonic uplift and incision after breakup in the NE Atlantic
Johan M. Bonow a,b,⁎, Peter Japsen b, Troels F.D. Nielsen b
a Södertörn University, SE-141 89 Huddinge, Swedenb Geological Survey of Denmark and Greenland (GEUS), Øster Voldgade 10, 1350 Copenhagen, Denmark
⁎ Corresponding author. Södertörn University, HuddingE-mail addresses: [email protected], johan.bonow@
0921-8181/$ – see front matter © 2014 Elsevier B.V. All rihttp://dx.doi.org/10.1016/j.gloplacha.2014.01.010
a b s t r a c t
a r t i c l e i n f oArticle history:Received 7 March 2013Received in revised form 12 December 2013Accepted 22 January 2014Available online 29 January 2014
Keywords:East Greenlandpeneplainuplifterosion surfacesubsidencepassive margincenozoicNorwayNorth Atlanticdenudation chronology
Elevated plateaux and deeply incised valleys characterise the large-scale landscapes along the East Greenlandmargin as in many elevated, passive continental margins around the world. The absence of syn- or post-riftrocks in, for example, the mountains of Norway, hampers the assessment of the age of these landscapes and ofthe present-day elevation. The mountains of southern East Greenland (68–71°N), however, expose thick basaltsthat were extruded onto a largely horizontal lava plain near sea level during breakup of the NE Atlantic at thePaleocene–Eocene transition.We take advantage of these favourable geological conditions to investigate the up-lift history after continental breakup. In particular, it is clear that present-day elevations of these basalts up to3.7 km above sea level (a.s.l.) were reached after breakup. We have mapped regional erosion surfaces and inte-grated the information about the landscape with the stratigraphic record (i.e. stratigraphic landscape analysis).The analysis led to the following relative denudation chronology for southern East Greenland: At breakup, themargin subsided and underwent km-scale burial. Around the Eocene–Oligocene transition, the first phase ofuplift, tilting and subsequent erosion led to the formation of an extensive, low-relief erosion surface (theUpper Planation Surface, UPS) that was graded towards the base level of the adjacent ocean before the eruptionof Miocene lavas onto that surface. A second uplift that most likely occurred after the Miocene produced a newerosion surface (the Lower Planation Surface, LPS) by incision below the UPS. Finally, a third event in the lateCenozoic lifted the UPS and the LPS to their present elevations of up to 3 and 2 km a.s.l., respectively and shapedthe present-day valleys and fjords by incision of rivers and glaciers below the LPS. The general picture of land-scape development is highly similar to West Greenland and the common characteristics between the steppedlandscapes in East Greenland and those on the conjugate margin in Scandinavia lead us to conclude that themountains of Norway also formed after the North Atlantic breakup.
© 2014 Elsevier B.V. All rights reserved.
1. Introduction
The large-scale landscapes in East Greenland are characterised by anelevated plateau at 2 to 3 km above sea level (a.s.l.) and by deep valleysincised below the main plateau (Figs. 1–4; Ahlmann, 1941; Brooks,1979, 1985). Such landscapes with stepped surfaces are commonalong passive margins worldwide (Jessen, 1943; Japsen et al., 2012a;Green et al., accepted for publication), but the origin of such elevatedplateaux remains a topic of great controversy, just like the origin ofthe elevated passive continental margins. Alternative viewpoints sug-gest that the elevated margins are: (a) remnants of old orogens(Nielsen et al., 2009a); (b) permanent uplifts somehow related to riftingand break-up (Swift et al., 2008; Sacek et al., 2012); and (c) young fea-tures caused by episodic burial and uplift after rifting and breakup andthat their formation is due to build-up of stress related to changes inplate motion long after breakup (Japsen et al., 2012a,b).
e, SE-141 89, Sweden.telia.com (J.M. Bonow).
ghts reserved.
The controversy can be exemplified with the debate about the or-igin of the margins around the North Atlantic with conflicting viewson West Greenland (Redfield, 2010; Green et al., 2011), East Green-land (Thomson et al., 1999; Johnson and Gallagher, 2000; Swiftet al., 2008; Pedersen et al., 2012; Japsen et al., 2013) and Scandina-via (Lidmar-Bergström and Bonow, 2009; Nielsen et al., 2009b;Chalmers et al., 2010; Gabrielsen et al., 2010; Steer et al., 2012; Hallet al., 2013). The key issue concerns the elevated topography withthe plateau surfaces: when and how were the surfaces formed,when did they reach their present elevation and what does the an-swer to that question tell us about the properties of the Earth atdepth?
Whereas the age of rocks can readily be determined using radioac-tive methods, the age of mountains as topographic features cannot beeasily estimated. This is particularly difficult in many areas around theNorth Atlantic compared to other continental margins because glacialerosion has often removed any cover (if ever deposited) that couldhave defined the maximum age of the topography. In contrast, thestudy area in southern East Greenland, between Kangerlussuaq andScoresby Sund (c. 68–71°N; Figs. 2–4), contains Jurassic–Neogene

-5000 -3000 -1000 1000 3000 m0
0 500 1000 km
60°N30
°W
60°W
Sca
ndin
avia
Scotland
LabradorSea
Gre
enla
nd
depth (b.s.l.) elevation (a.s.l.)
Fig. 1. Elevation of bedrock onshore and bathymetry offshore in the North Atlantic domain. A common feature of the elevated margins is that they have one or several elevated plateausurfaces that are dissected by deeply incised valleys; e.g. Norway (Gjessing, 1967; Lidmar-Bergström et al., 2000, 2013), Scotland (Hall, 1987), West Greenland (Bonow et al., 2006a,b),Baffin Island (Kleman, 2008) and East Greenland (Ahlmann, 1941; this study). Note themuch higher elevation in East Greenland compared toWest Greenland. The load of the Greenlandice sheet causes a depression of up to 800 m in central Greenland whereas peripheral bulging caused by the ice load has a negligible effect on the elevation of Greenland's margins(Medvedev et al., 2013). Study area in southern East Greenland marked by dashed line.Elevation data source: Amante and Eakins (2009).
11J.M. Bonow et al. / Global and Planetary Change 116 (2014) 10–29
rocks which document the conditions prior to, during and after theonset of spreading in theNE Atlantic at the Paleocene–Eocene transition(~56 Ma), when massive flood basalts were extruded across the areaduring rapid subsidence (Fig. 5; Brooks and Nielsen, 1982; Nunns,1983; Larsen et al., 1989; Pedersen et al., 1997; Larsen and Saunders,1998; Larsen and Tegner, 2006; Henriksen et al., 2009; Brooks, 2011).Today, marinemid-Paleocene sediments of the Sediment Bjerge Forma-tion occur at elevations up to 1.4 km a.s.l. near Pyramiden in theKangerlussuaq Basin (A. Whitham, pers.comm.; 2013). Southern EastGreenland is thus highly suitable for deciphering the tectonic and land-scape history.
This study takes advantage of these favourable geological condi-tions to investigate the uplift history after continental breakup. Wedo so by identifying and mapping erosion surfaces and by integrat-ing the information about the landscape with the stratigraphicrecord; i.e. stratigraphic landscape analysis as introduced byLidmar-Bergström et al. (2013). This approach enables us to puttight constraints on a relative denudation chronology for centralEast Greenland that defines when the plateau surfaces were formedand when they reached their present elevation. In a paper parallelto this (Japsen et al., 2014–in this issue), the results presentedhere are integrated with thermochronological data. We finally dis-cuss the implications of our results in this study for other highly el-evated passive continental margins that do not have the samedetailed geological control.
2. Observations of large-scale landscapes as input for conclusionsabout base-level changes in the past
Extensive upland plains around the globe have been interpreted inclassic geomorphological papers as erosional surfaces graded towardsthe ultimate base level and subsequently uplifted (Davis, 1899; Penck,1924; King, 1967). Similar observations and conclusions were made bygeomorphologists during the 20th century for the margins in the NorthAtlantic domain, including Scandinavia, Scotland, Newfoundland, BaffinIsland and East Greenland (Fig. 1; Reusch, 1901; Ahlmann, 1919, 1941;Jessen, 1943; Holtedahl, 1953; George, 1966; Brookes, 1977). They allregarded the elevation of the plateaux and the valleys incised below theplateaux to be the result of uplift during the late Cenozoic. Similar conclu-sions were reached in later studies of large-scale landforms in WestGreenland (Bonow et al., 2006a,b), in Scandinavia (Lidmar-Bergströmet al., 2007, 2013) and NE Brazil (Bonow et al., 2009). More recently,Steer et al. (2012) suggested that low-relief surfaces at high elevation inwestern Norway have been formed by glacial head-ward erosion bycirque retreat, although this was refuted by Hall et al. (2013), whoshowed evidence that glacial erosion acts to dissect plateaux rather thancreate them.
We have used detailed mapping of extensive erosion surfaces thatcut across rocks of different age and resistance to investigate the evolu-tion of elevated passive continental margins. Analysis of landscapes inScandinavia (e.g. Lidmar-Bergström et al., 2000, 2007, 2013; Bonow

Fig. 2.Geological map of southern East Greenland. Modified after Larsen et al. (1989, 2002, 2005a,b), Pedersen et al. (1997), Tegner et al. (1998, 2008), Storey et al. (2004) and Henriksenet al. (2009). Locations of photos in Fig. 3 and profile in Fig. 10 are indicated. PWB: Prinsen af Wales Bjerge.
12 J.M. Bonow et al. / Global and Planetary Change 116 (2014) 10–29
et al., 2003),West Greenland (Bonow, 2005; Bonow et al., 2006a,b) andNE Brazil (Bonow et al., 2009; Japsen et al., 2012b) has led us to con-clude that fluvial erosion to base level is fundamental for understandingthe formationof extensive, low-relief surfaces. Base levels controlfluvialerosion and the ultimate base level is sea level. A local base level can alsobe highly important as, for example, a resistant layer or in an internaldrainage basin (Fjellanger and Etzelmüller, 2003; Babault et al., 2005).Where a study area is known to have been near the sea at the time a pe-neplain formed (as in the case of the post-rift development of marginsadjacent to opening oceans) the most obvious choice of base level issea level (see Japsen et al., 2009). Resistant rocks (as described above)will affect the transient landscape, but their influence will diminishthrough time (e.g. Fig. 2 in Japsen et al., 2009). The process of valleywidening and the removal of material by river systems (e.g. Ahnert,1998; Bonow et al., 2007; Lidmar-Bergström et al., 2007) eventually re-sults in a large-scale, low-relief erosion surface with a low slope gradi-ent; a planation surface (one type of peneplain). We describe suchdenudational planes of low relative relief (b200 m), either horizontalor inclined, with different characteristics as flat, hilly, or flat withscattered hills as peneplains (see Green et al., 2013). Valley incisionbelow a peneplain surface is evidence of further lowering of base level(uplift of the landmass or drop in sea level), with subsequent formationof new valley floors and valley widening, grading to sea level and thuspossibly to the formation of a new low-relief erosion surface. Landscapescharacterised by surfaces that appear in steps are common on all conti-nents, not only in formerly glaciated areas (Japsen et al., 2009, 2012a;Green et al., 2013). The height difference between the valley floor and
the overlying surface therefore indicates the amount of uplift or dropin base level (Fig. 6).
We apply stratigraphic landscape analysis which is based on: (a) therelationship between peneplains in crystalline basement and theircover rocks of different ages; (b) the cross-cutting relationships be-tween such re-exposed peneplains and epigene peneplains (ones thathave never been covered); and (c) the occurrence of valleys incisedbelow peneplains (see Fig. 7). Where possible, e.g. in East Greenland,we also study peneplains across sedimentary or volcanic rocks. Strati-graphic landscape analysis has been successfully developed and usedin Scandinavia e.g. by Lidmar-Bergström et al. (2013) to identify differ-ent Phanerozoic episodes of erosion, uplift and subsidence (cf. Lidmar-Bergström, 1982, 1988, 1996; Lidmar-Bergström et al., 2000, 2007).
Japsen et al. (2006) provided new insight into the nature ofuplifted peneplains in a study from centralWest Greenland that inte-grated observations from the geological record with the results ofstratigraphic landscape analysis (Bonow et al., 2006a,b) and thermalhistory reconstructions based on thermochronological data (Japsenet al., 2005). It was possible to demonstrate that the extensive plana-tion surfaces in West Greenland formed after the start of sea-floorspreading in the Labrador Sea in the Paleocene that they were gradedto base level (the adjacent sea) during the Oligocene–Miocene andthat km-thick successions of rock were removed during peneplainformation. Consequently, it was concluded that the present-dayelevation of these surfaces is due to uplift that happened after theirformation and that uplift began in the late Miocene, many tens ofmillions of years after continental breakup.

A
B
Fig. 3.Oblique aerial photographs illustrating themain characteristics of the landscape in southernEast Greenlandwith large uplandplains anddeeply incised valleys. A:Gåseland. Lookingnorth-west across the inner part of Gåsefjord to the extensive plateau (the Upper Planation Surface, UPS; Fig. 5) that here cuts across the Main Basalts (Geikie Plateau Formation, c.1.9 km a.s.l.). Theundulating basement surface (hilly relief) in the foreground is covered bybasalts of theMilne Land Formation. The extent of elevatedvalley benches (the Lower PlanationSurface, LPS) is restricted and can be identified only in the far background (cf. Fig. 11). Detail from oblique aerial photograph 654-G-N, no. 12159, 1950. © KMS, Denmark. B: Geikie Plateau.Looking north-west across a landscape characterised by sharp ridges and scattered, partly ice-covered remnants of theUPS that cuts across theMain Basalts (Skrænterne Formation) at thesouthern edge of the Geikie Plateau (c. 2 km a.s.l.). Location of photographs in Fig. 2. Detail from oblique aerial photograph B-NV 661–10649, 1948. © KMS, Denmark.
13J.M. Bonow et al. / Global and Planetary Change 116 (2014) 10–29
The observation that the large-scale landscapes of the WestGreenlandmargin are similar in many respects to those of other elevat-ed, passive continental margins around the world (Japsen et al., 2012a),leads us to the general suggestion that the formation of all such elevatedmargins is unconnected to rifting and breakup and that their topogra-phy formed later (Bonow et al., 2007; Japsen et al., 2012a). This viewis contrary to earlier ideas that elevated passive margins are steady-state landscapes (e.g. Ollier and Pain, 1997; Brown et al., 2000; Bishop,2007; Nielsen et al., 2009a,b).
3. Methods
The study area was visited twice as part of the present investigation.In 2008 fieldworkwasmade onMilne Land, including helicopter recon-naissance further north and across Jameson Land. A field camp wasestablished in the Kangerlussuaq area (Sødalen) in 2009 and helicopterflights weremadewith ground stops along Kangerlussuaq, into the areasouth of Kangerlussuaq, to Kap Edvard Holm and toWatkins Bjerge andGunbjørn Fjeld in the north (Fig. 2).
Weused a digital elevationmodelwith c. 30-metre resolution (ASTERdata) as input data (Fig. 4) and found that a 100 m contour map gives areasonable picture of the general landscape features such as flats,escarpments and deeply incised valleys (cf. Bonow, 2004, p. 8–9). Weconstructed a contour map from the elevation data as the primary inputfor the surface mapping. A contour map shows the full three-dimensional picture of the landscape whereas the relief along a topo-graphical profile depends on the location and azimuth of the transect.To support the mapping we used profiles and we therefore divided thestudy area into a square grid of profiles, spaced 25 km apart. The topo-graphical profiles extracted along the grid lines, as well as the contourmap were plotted in a scale of 1:250,000, so that a direct comparisoncould be made during mapping. We also extracted maximum andminimum heights along these profiles in a swath 50 km wide. Theswath profiles were plotted together with the topographical profile(Fig. 8). In total, we cross-analysed 32 profiles with a total length ofc. 10,000 km.
Themapping of the surfaceswas initiated in core areaswith low, rel-ative relief and only minor valleys that were defined from the contour

Fig. 4. 3D elevation model of southern East Greenland based on ASTER digital elevation data (c. 30 by 30 m resolution). The model is vertically shaded to enhance the slopes. The WagerPlateau and the Geikie Plateau,which combine to form a slightly tilted upland plateauwith elevations between c. 2500m a.sl. (purple) and 2000m a.s.l. (red) are dominant features of thelandscape in the central part of the study area and in the Scoresby Sund area. The plateaux are dissected by deeply-incised valleys which are filledwith large glaciers at present. The lengthof the foreground of the figure is about 500 km and the geographical location of the 3D model can be seen from the index map and from Fig. 2.
Igtertivâ Fm49 Ma
Kap Brewster Fm?Miocene, ?23–?5 Ma
Vindtop Fm14 Ma
Undatedpictrites
Kangerlussuaq Scoresby Sund Milne LandS N
PWB Fm53 Ma
Skrænterne Fm
KI51 Ma
SI56 Ma
Rømer Fjord Fm
Geikie Plateau Fm
Milne Land Fm
Coastalsuccession
Inlandsuccession
Kap Dalton GroupLutetian, 47-44 Ma (Kap Dalton)?Lutetian – Rupelian,?48-28 (Savoia Halvø)
Kangerlussuaq GroupAlbian – Selandian,105 – ~60 Ma
Charcot Bugt FmMiddle Jurassic, 170–160 Ma
Marine sediment
Central intrusive complexPalaeogene
Sediment
Igneous rock
Late volcanicsYpressian and younger, <54 Ma
Main BasaltsLatest Thanetian – earliest Ypressian,56–55 Ma
Lower Basalts/Nansen Fjord Fm Selandian – Thanetian, ~60–56 Ma
Crystaline basement
BT47 Ma
Precambrian Caledonian
Breakup
Plume
Angular unconformity
Peneplain
Etch surface
M
M
M
M
M
UPS
LPS
M
Fig. 5. Stratigraphy of the main geological units as mentioned in the text and extent of the erosion surfaces (this study) for the Kangerlussuaq, Scoresby Sund and Milne Land area(68–70.5°N). Volcanic stratigraphy after Hansen et al. (2002) (based on Nielsen et al., 1981; Larsen et al., 1989, 1999, 2013; Hansen et al., 1995; Storey et al., 1996; Pedersen et al.,1997; Tegner et al., 1998; Heister et al., 2001; Storey et al., 2004). Sediment stratigraphy after Hassan (1953), Nunns (1983), Larsen et al. (2002; 2005), Nøhr-Hansen and Piasecki(2002), Surlyk (2003) and Nøhr-Hansen (2012). Tectonic events after Nunns (1983), Dam et al. (1998) and Nielsen et al. (2006). Ages of intrusive complexes after Riishuus et al.(2008) and Tegner et al. (2008). Archaean gneiss basement near Kangerlussuaq was reworked in the Proterozoic whereas the basement rocks around Scoresby Sundwere reworked dur-ing the Caledonian orogeny (Higgins and Leslie, 2008; Nutman et al., 2008). Abbreviations. BT: Borgtinderne; KI: Kangerlussuaq Intrusion; LPS: Lower Planation Surface; PWB: Prinsen afWales Bjerge; SI: Skaergaard Intrusion; UPS: Upper Planation Surface; LPS: Lower Planation Surface.
14 J.M. Bonow et al. / Global and Planetary Change 116 (2014) 10–29

Sea level
uplift c. 1 km uplift c. 2 kmTime
UPS
A B C D E
LPSBasement Uplift SubsidenceVindtop FmBasalt
Fig. 6. Conceptual sketch illustrating the formation of the elevated plateaux in the study area. A: Extrusion of basalt during subsidence. B: Formation of an erosion surface (in this case, theUpper Planation Surface, UPS) by erosion to base level (the level of the adjacent sea) after uplift and block tilting; extrusion of themiddleMiocene lavas of the Vindtop Formation (Storeyet al., 2004) onto the UPS. C: Uplift of the UPS, with subsequent incision of valleys. D: Development of a new erosion surface (the Lower Planation Surface, LPS) by incision and by valleywidening towards the newly formed base level. The UPS becomes dissected by fluvial backward erosion as well as by valley widening. E: Uplift of both UPS and LPS with subsequent in-cision of valleys below the LPS that later became reshaped by glacial erosion.
15J.M. Bonow et al. / Global and Planetary Change 116 (2014) 10–29
map (and with support from oblique aerial photographs where avail-able). In such areas the maximum height along each swath coincideswith the topographical profile. The same surface can also be mappedin areas that are much more dissected by glacial or fluvial erosionwith support from the profiles. The edge of a surface is located wherea rapid change of inclination is observed on the contour map. Theexact slope angle used to define the rapid change varies due to bedrockstrength, but in a study of a crystalline basement area in southernNorway, the slope was found to be 6.5° (Bonow et al., 2003) and asimilar value was observed in a study in central West Greenland(Bonow et al., 2006b). The combination of profiles and contour mapidentifies offsets within a surface, e.g. across faults (Lidmar-Bergström,1988; Bonow et al., 2006b).
Surfaces incised below a plateau can be identified using theminimumheight along profiles as such surfaces are controlled by fluvialerosion to a lower base level. In summary, we identified levels of thelow-relief surfaces on the map and on the profiles. The interpretationsmade on the contourmapwere cross-checked fromprofiles to ascertainthat the interpretations were consistent. Finally, mapped surfaces werecomparedwith geological maps (Bengaard and Henriksen, 1984;Myerset al., 1988; GEUS, 2007) to assure that erosion surfaces could bedifferentiated from any structural surfaces.
4. Geological context
To understand the large-scale landscape development in southernEast Greenland, it is important to appreciate the tectonic history
Sea
UPSUPS
LPS
Milne Land/Gåseland
Incised valley ES
Basement Basalt Jurassic Cover
LPS
Fig. 7. Sketch of erosion surfaces and incised valleys and their relationships to basementand cover rocks in the Milne Land and Gåseland area. ES: etch surface (pre-Jurassic orpre-basalt age), UPS: Upper Planation Surface (post-basalt age), LPS: Lower PlanationSurface (post-basalt and also post-UPS age).
revealed by the geological record and the post-volcanic structures(Figs. 2 and 5).
4.1. Basement and cover rocks
Precambrian andCaledonianmetamorphic and intrusive rocksmakeup the crystalline basement around Kangerlussuaq and Scoresby Sund,respectively (e.g. Higgins and Leslie, 2008; Nutman et al., 2008;Henriksen et al., 2009). In the north, the study area overlaps with thepost-Caledonian sedimentary basin in NE Greenland; a Triassic–Creta-ceous succession crops out on southern Jameson Land and southern Liv-erpool Land and Middle Jurassic sandstones onlap the crystallinebasement on eastern Milne Land (Larsen et al., 1989; Surlyk, 2003;Henriksen et al., 2009). In the Kangerlussuaq Basin, the Lower Creta-ceous succession rests on the basement south of Christian IV Fault(below Christian IV Gletscher) whereas the Paleogene succession restson the basement north of the fault (Larsen and Whitham, 2005).Throughout the area, the earliest basalt flows (see below) rest partlyon the basement.
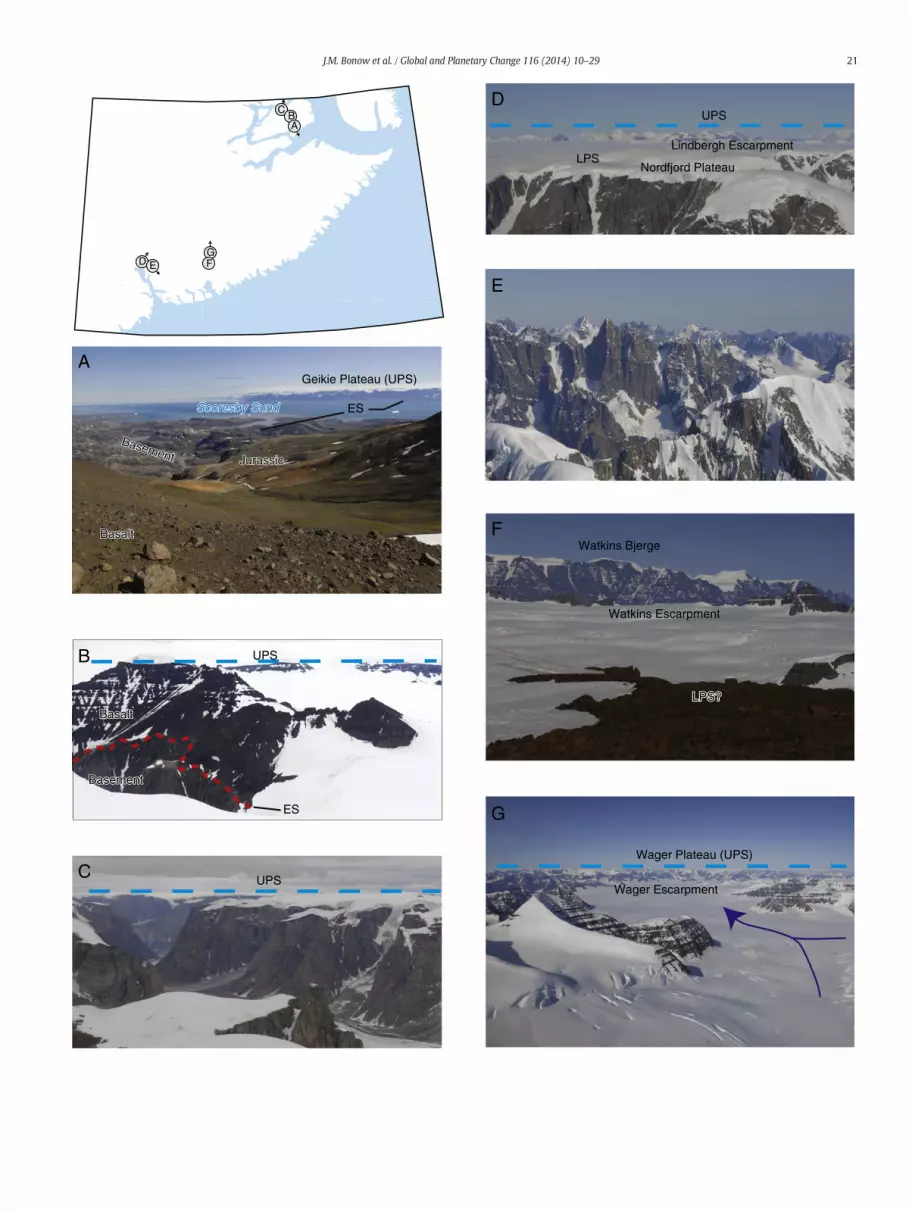
The basement is deeply weathered to kaolinitic saprolites at thecontact with the sedimentary cover in the Milne Land–Gåseland area(Birkelund and Perch-Nielsen, 1976; Larsen et al., 1989). When thesaprolites are stripped from such a weathered surface, the surface ischaracterised by distinct hills separated by small valleys following thefracture systems. This hilly relief basement surface was buried belowthe early lavas and the basalts eventually also covered the basementhighland on Milne Land up to 1800 m above the present sealevel (Fig. 9). A few steep-sided valleys of pre-basalt age have beenpreserved on the border of a fault-controlled escarpment between thebasement high and the Mesozoic basin (maximum relief 700 m;Larsen et al., 1989).
4.2. Sediments and volcanic rocks of the Kangerlussuaq Basin
North-east of Kangerlussuaq, the Kangerlussuaq Basin exposes a c. 1km thick, Lower Cretaceous to Paleocene sedimentary and volcanic suc-cession that accumulated on the Precambrian basement at the westernmargin of the seaway between Greenland and the British Isles (e.g.Wager, 1947; Soper et al., 1976; Nielsen, 1981; Nielsen et al., 1981;Larsen and Whitham, 2005; Larsen et al., 2005a,b; Nøhr-Hansen,2012). The succession documents a transgression during an Albianphase of continental rifting, followed by shallow-marine depositionthat dominated during the Cretaceous until intense rifting and deep-marine deposition occurred in the latest Cretaceous and early Paleocene(Larsen and Whitham, 2005; Nøhr-Hansen, 2012). Dam et al. (1998)argued that the impact of the Iceland plume controlled rapid upliftand fluvial erosion in the mid-Paleocene and that subsequent subsi-dence was contemporaneous with the first volcanic extrusions. Theuplift caused rotation and erosional truncation of the sediments below
Topography along Maximum topography alongswath between coordinates7610000 and 7660000
Minimum topography alongswath between coordinates7610000 and 7660000
4
(m)
(km a.s.l.)
? ? ? ?LPS
Kangerlussuaq
Nansen Fjord
Domkirkefjeldet (D)B
7685000
7660000
7635000
7610000
7585000
7560000
710000 735000 760000 785000 810000 835000 860000 885000 910000
710000 735000 760000 785000 810000 835000 860000 885000 910000
3
2
1
0
D D
AA
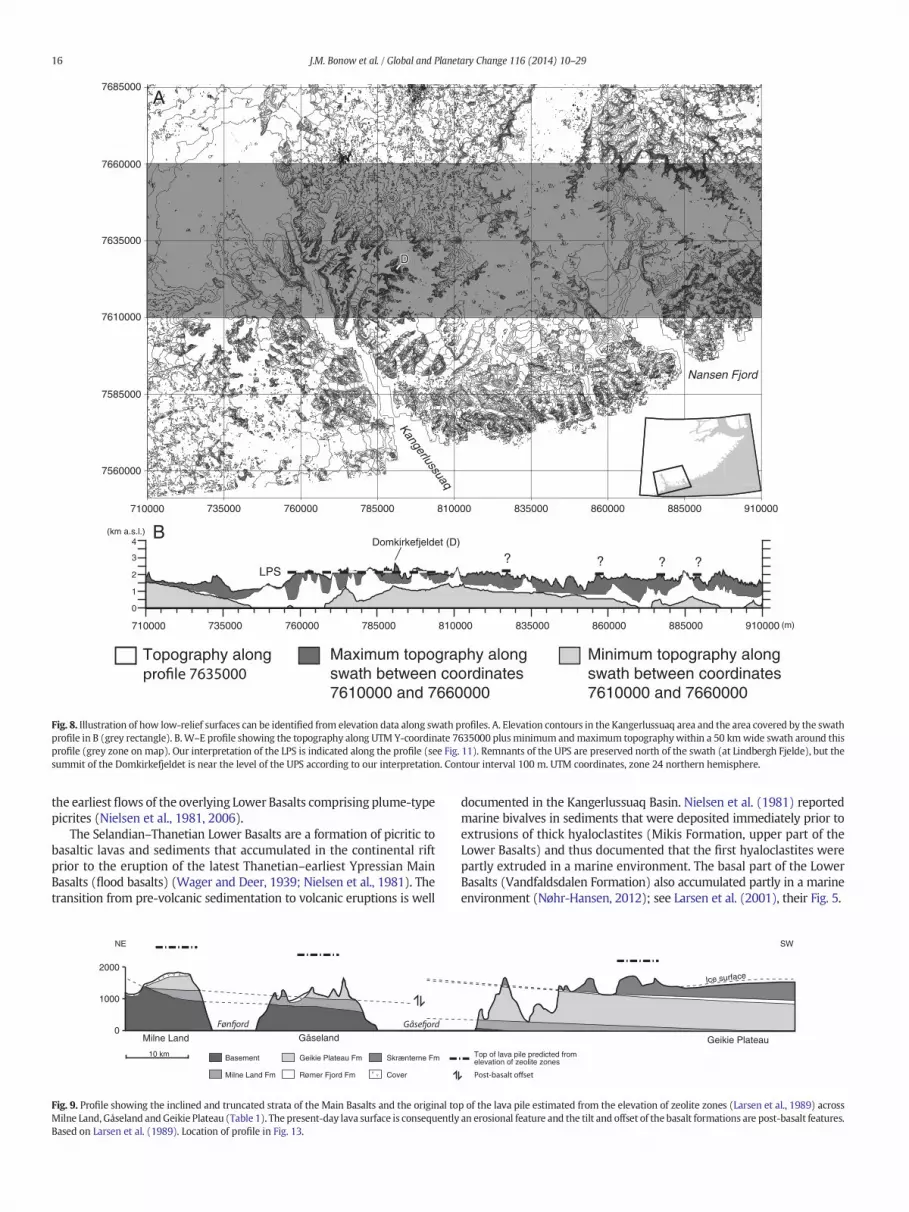
Fig. 8. Illustration of how low-relief surfaces can be identified from elevation data along swath profiles. A. Elevation contours in the Kangerlussuaq area and the area covered by the swathprofile in B (grey rectangle). B.W–E profile showing the topography along UTM Y-coordinate 7635000 plusminimum andmaximum topographywithin a 50 kmwide swath around thisprofile (grey zone on map). Our interpretation of the LPS is indicated along the profile (see Fig. 11). Remnants of the UPS are preserved north of the swath (at Lindbergh Fjelde), but thesummit of the Domkirkefjeldet is near the level of the UPS according to our interpretation. Contour interval 100 m. UTM coordinates, zone 24 northern hemisphere.
16 J.M. Bonow et al. / Global and Planetary Change 116 (2014) 10–29
the earliest flows of the overlying Lower Basalts comprising plume-typepicrites (Nielsen et al., 1981, 2006).
The Selandian–Thanetian Lower Basalts are a formation of picritic tobasaltic lavas and sediments that accumulated in the continental riftprior to the eruption of the latest Thanetian–earliest Ypressian MainBasalts (flood basalts) (Wager and Deer, 1939; Nielsen et al., 1981). Thetransition from pre-volcanic sedimentation to volcanic eruptions is well
0
1000
2000
GåselandMilne Land
10 km Basement
Milne Land Fm
Geikie Plateau Fm
Rømer Fjord Fm
Skrænterne Fm
Cover
v v v vv
v
vv
vv
NE
Fig. 9. Profile showing the inclined and truncated strata of the Main Basalts and the original toMilne Land, Gåseland andGeikie Plateau (Table 1). The present-day lava surface is consequentlyBased on Larsen et al. (1989). Location of profile in Fig. 13.
documented in the Kangerlussuaq Basin. Nielsen et al. (1981) reportedmarine bivalves in sediments that were deposited immediately prior toextrusions of thick hyaloclastites (Mikis Formation, upper part of theLower Basalts) and thus documented that the first hyaloclastites werepartly extruded in a marine environment. The basal part of the LowerBasalts (Vandfaldsdalen Formation) also accumulated partly in a marineenvironment (Nøhr-Hansen, 2012); see Larsen et al. (2001), their Fig. 5.
Geikie Plateau
SW
Top of lava pile predicted fromelevation of zeolite zones
Ice surface
p of the lava pile estimated from the elevation of zeolite zones (Larsen et al., 1989) acrossan erosional feature and the tilt and offset of the basalt formations are post-basalt features.

17J.M. Bonow et al. / Global and Planetary Change 116 (2014) 10–29
4.3. Main Basalts
The Main Basalts (flood basalts) erupted during the main volcanicphase that lasted less than 1Myr and accompanied the breakup at the Pa-leocene–Eocene transition (~56 Ma; Larsen and Tegner, 2006; Storeyet al., 2007). Net subsidence dominated the area during the eruption ofthe Main Basalts with no evidence for crustal upwarping at this time(Wager, 1947; Brooks and Nielsen, 1982; Brooks, 1985, 2011; Larsenet al., 1989; Pedersen et al., 1997; Larsen and Tegner, 2006). The succes-sion attains a vertical thickness of more than 6 km in the central coastalarea and thins inland to 2–3 km; the basalts cover about 65,000 km2
and reach far inland from Blosseville Kyst (Pedersen et al., 1997).Pedersen et al. (1997) investigated the lavas between Kangerlussuaq
and Scoresby Sund by multi-model photogrammetry and profile sam-pling and established a three-dimensional framework for the lava geom-etry. They found no evidence for major unconformities within the MainBasaltswhereas tilting of large blocks occurred far inland during the erup-tion of the Lower Basalts. Pedersen et al. (1997) observed syn-volcanic,small-scale faulting of only a few tens of metres within the Main Basaltsand they noted that individual lava flows covered up to thousands ofsquare kilometres (Larsen et al., 1989). Pedersen et al. (1997, p. 567)therefore concluded that the lava flows of the Main Basalts eruptedonto a “largely horizontal lava plain without significant relief”.
The four formations of the Main Basalts extend over much of thestudy area:Milne Land, Geikie Plateau, Rømer Fjord and Skrænterne For-mations (Larsen et al., 1989; Pedersen et al., 1997). Pedersen et al.(1997) estimated that a differential sagging (N2 km) of the coastalareas took place during the emplacement of the lavas and suggestedthat this indicated focusing of the magmatic production into a develop-ing rift zone close to the present coast. Amajor coastal flexure developedin the Kangerlussuaq region by the collapse of the attenuated crust sub-sequent to the extrusion of the flood basalts (Nielsen and Brooks, 1981).
4.4. Younger lava formations
Three basalt formations of limited extent post-date theMain Basalts(Fig. 5):
Prinsen af Wales Bjerge Formation, early Eocene, c. 53 Ma (Hansenet al., 2002). These lavas overlie the Milne Land Formation at
0
1
2
3W
UPS
Elevation along profile
Maximum elevation in corridor
25 km
StenoBræ
Marine sediment
Mid-Miocene to Recent sediment
Late Oligocene – mid-Miocene sediment
Eocene – Late Oligocene sediment
Subaerially erupted Paleogene basalt
Oceanic basement
Mesozoic sediment
M
5: Kap Dalton Group4: Igtertivâ Fm3: Skrænterne Fm2: Rømer Fjord Fm1: Geikie Plateau Fm
3
2
1 54
3
M
M
Fig. 10. Onshore–offshore profile illustrating post-breakup, differential vertical movements oerupted onto a largely horizontal lava plain (Pedersen et al., 1997). The presence of marine inthe flood basalts, the early Eocene Igtertivâ Formation (Soper and Costa, 1975; Tegner et al., 19tions. Today the Igtertivâ Formationwithmarine incursions is exposed at Kap Daltonwithin a grof the older lavas of the Skrænterne Formation are now exposed at 1500m a.s.l. (Larsen et al., 19at the time of the extrusion of the Igtertivâ Formation. Drilling at ODP Site 118 documented subSaunders (1998) document that the lavas off Blosseville Kyst also erupted subaerially. Consequrepresents differential, vertical movements after breakup. Offshore profile from Larsen (1990).
~2 km a.s.l., north of the head of Kangerlussuaq where both forma-tions are capped by a fluviatile conglomerate and by lava flows of un-known age.Igtertivâ Formation, early Eocene, c. 49 and 44Ma (Soper and Costa,1975; Larsen et al., 1989, 2013; Tegner et al., 2008). This formationoccurs in small grabens at Kap Dalton below and interbedded withpartly marine sediments of the Bopladsdalen Formation of the KapDalton Group (see below). Sediment layers are commonly presentbetween the lava flows and some layers containmarinemicrofossils(Fig. 10). Themain part of the succession below the sediments of theBopladsdalen Formation is dated at 49.09 ± 0.48 Ma while a lavaflow intercalated with sediments of the Bopladsdalen Formationhas an age of 43.77 ± 1.08 Ma (Larsen et al., 2013).The Main Basalts bounding the graben to the NW are nearly flat-lying and belong to the Geikie Plateau, Rømer Fjord andSkrænterne Formations, indicating a downthrow of the grabensuccession in excess of 1500 m (Larsen et al., 1989). The lavasof the Igtertivâ Formation are not cut by any dykes, in contrastto the surrounding lavas where cross-cutting NE-running dykesare frequent (Watt, 1975). The majority of the dykes were in-truded before the main graben-forming faulting took place(Watt et al., 1976) and because of compositional similaritiesthese dykes were considered to have fed the Igtertivâ Formation(Larsen et al., 1989). Larsen et al. (2013) concluded that the ma-jority of the faults that cut the succession at Kap Dalton and theformation of the exposed small graben are younger than the sed-iments preserved in the graben. The Main Basalts at Kap Daltonwere thus below sea level at the time of the extrusion of theIgtertivâ Formation and the present elevation of theMain Basaltsat this location consequently shows that rock uplift of at least1500 m affected the margin after breakup as also pointed outby Clift et al. (1998).
Vindtop Formation, middle Miocene, c. 14–13 Ma (Storey et al.,2004). These lava flows crop out on nunataks within an area ofabout 18 km2 between 2.7 and 2.9 km a.s.l.
E
0
1
1
2
2
3
3
4
5
6
7
8
9
Ele
vatio
n(k
m)
Dep
th(k
m)
KapDalton
COT
Mid-Miocene Unconformity
f the Paleogene basalts. Studies of the Main Basalts along Blosseville Kyst show that theycursions in some of the Lower Basalts (e.g. Nielsen et al., 1981) and in the uppermost of98) also implies that the landscape was low-lying near sea level during the volcanic erup-aben that was downfaulted from a position above the adjacentmountainswhere the lavas89; Larsen and Saunders, 1998). TheMain Basalts at Kap Daltonwere thus below sea levelaerially erupted lavas 3.1 km below the seabed (~63°N; Larsen et al., 1993) and Larsen andently, the large lateral variation of the elevation/depth of the basalts along Blosseville KystLocation in Fig. 2.

18 J.M. Bonow et al. / Global and Planetary Change 116 (2014) 10–29
4.5. Intrusions
Tegner et al. (1998, 2008) compiled evidence about the timing of themainly Eocene, alkaline intrusions along southern East Greenland thatoccur up to 100 km inland and found that they mainly crop out in tec-tonic and magmatic lineaments orthogonal to the rifted margin. Southof Kangerlussuaq (c. 67–67.5°N), the intrusions are confined to threetime windows at 56–54, 50–47 and 37–35 Ma. Along Kangerlussuaq(c. 68–68.5°N), the ages of the plutons span from 56 to 40 Ma and tothe north (c. 68.5–69°N), intrusions range from 52 to 36 Ma. Two im-portant intrusives are:
Skaergaard Intrusion (55.6 Ma; Brooks, 2011). The intrusion isemplaced into the basal portion of the flood basalts (the MilneLand Formation) on the east side of Kangerlussuaq, near thepresent-day coast (e.g. Brooks and Nielsen, 1982; Larsen andTegner, 2006). Larsen and Tegner (2006) investigated the pres-sure under which the intrusion crystallized–and thus its burialhistory–by analysing e.g. fluid inclusions in quartz and theminer-al assemblage in the granophyres. They inferred that an estimat-ed pressure increase from the basal to the upper part of theintrusion was due to progressive burial during the cooling of theintrusion and contemporaneous outpouring of 5–6 km of overly-ing flood basalts.
Kangerlussuaq Alkaline Complex (50 Ma; Brooks, 2011). The mainconstituent is the Kangerlussuaq Intrusion which covers about800 km2 on the west side of Kangerlussuaq (e.g. Wager, 1965;Riishuus et al., 2008). Riishuus et al. (2008) presented a model ofthe emplacement of the Kangerlussuaq Intrusion below a roof of 3to 4 km of flood basalts.
4.6. Post-volcanic sediments
Scattered remnants of a previously more widespread, fluvial toshallow-marine, post-volcanic succession are exposed at Kap Daltonand at Savoia Halvø (e.g. Hassan, 1953; Birkenmajer, 1972; Larsenet al., 1989; Birkenmajer and Jednorowska, 1997; Larsen et al., 2002,2005a; Nøhr-Hansen, 2012).
Kap Dalton Group; Bopladsdalen and Krabbedalen Formations(middle Eocene–early Oligocene; Larsen et al., 2002, 2005a). Thesefine-grained deposits are exposed at both locations and at KapDalton they rest on and inter-finger with the down-faulted lavas ofthe Igtertivâ Formation. Larsen et al. (2005a) studied the sedimentsat Kap Dalton and showed that the area suffered subaerial erosionsubsequent to the extrusion of the basalts, leading to formation ofan irregular relief, dissected by fluvial channels that eventuallywere buried below shallow-marine sediments during early middleEocene transgression. The presence of clean quartz sandstoneswith-in the early post-basaltic succession indicates that areaswith little orno basaltic cover became periodically exhumed. At Savoia Halvø, themarine sediments of the Krabbedalen Formation are of earlyOligocene age (Larsen et al., 2002, S. Piasecki, pers. comm., 2009).Kap Brewster Formation (?Miocene; Hassan, 1953). These marinedeposits overlie the basalts at one small locality on Savoia Halvø.The deposits consist of breccia, conglomerate and sandstone ofdominantly basaltic material and are older than some of thefaulting in the area (Larsen et al., 1989). Hassan (1953) tentative-ly assigned a Miocene age to these deposits based on the macro-fossils and this age has still to be confirmed (Larsen et al., 2002).
4.7. Elevation of the land surface during the eruption of the flood basalts
The Lower Basalts include basal hyaloclastiteswithmarine incursionsand waterlain tuffs that occur up to 2 km above the base of these flowsand they are overlain by up to 5 km of flood basalts (Main Basalts) thatare capped by marine sediments (Igtertivâ Formation and Kap DaltonGroup) (see above). These observations demonstrate that the lavas accu-mulated near sea level during the earliest volcanic eruptions and thatsubsidence during the eruption of the Main Basalts kept pace with theoutpouring lavas, so that the land surface at the end of the eruptionsremained at or near sea level. Because the Main Basalts erupted onto alargely horizontal lava plain without significant relief (Pedersen et al.,1997), the conditions at Kap Dalton during the later eruption of thelava flows of the Igtertivâ Formation, can be considered as representativefor Blosseville Kyst.
The balance between subsidence and accumulation follows from theeasy access frommagma chambers in the crust to the eruption sites forthe flood basalts that occur throughout the region. Tectonic reconstruc-tions demonstrate that the crust was thinned at breakup (Nielsen andBrooks, 1981) and the emplacement of dyke swarms recalls the sheeteddyke complexes of ophiolites. The tectonic regime at that timewas thusextensional and this resulted in subsidence of the base of the basalts.
The flood basalts in East Greenland are all equilibrated in and tappedfrom replenishment, tapping and fractionation (RTF) magma chambersat crustal pressures (Larsen et al., 1989). The bulk compositions of the ba-salts are evolved and they have complementary cumulates within or atthe base of the continental crust. As much as 50% of the original mass ofmantle-equilibrated basalt would have crystallized to reach the composi-tion of the extruded basalts. So, at the timewhen the lavas build up on thesurface, they were tapped from magma chambers below the lava fieldsand neither rise nor subsidence of the land surface should be anticipated.
At present, it is not possible tomake up a total mass balance, but thestratigraphic evidence demonstrates that subsidence and accumulationof extrusives kept pace, so that the land surface remained near sea levelduring the eruption of the flood basalts. This conclusion has beenreached by previous workers and for example Brooks (1985, 2011)concluded that the presence of marine fossils near the top of the lavasuccession in the Scoresby Sund region (Igtertivâ Formation and KapDalton Group) showed that the thickening of the lava pile was balancedby the deepening of the basin (Fig. 10).
These results closelymatch the interpretation of the verticalmotionsof the spreading system offshore SE Greenland presented by Hopperet al. (2003). According to these authors, the ridge system was initiallyclose to sea level for at least 1 Myr despite a reduction in magmaticproductivity over this time interval. They explain this observation bydynamic support to the ridge by a small component of active upwellinginto a pre-existing lithospheric thin spot as a thin sheet. Exhaustion ofthe thin sheet led to rapid subsidence of the spreading system and achange from subaerial to shallow marine and, finally, to deep marineextrusion in ~2 Myr.
4.8. Regional zeolite zones
Zeolites are late stage minerals that fill cavities in basalts and theprogress of zeoliteminerals depend on temperature. Zeolite isograds de-lineating regionally extensive mineral zones occur throughout most ofthe Main Basalts between Scoresby Sund and Kangerlussuaq (Larsenet al., 1989; Neuhoff et al., 1997). Mineralogical zones define the post-extrusive isograds in the area, are essentially uniform in thicknessthroughout the province and transgress lava stratigraphy. Neuhoff et al.(1997) studied the pronounced discordance between dips of zeoliteisograds (c. 2.5°SE) and lava flows (4°–11°SE) in the coastal flexurezone and suggested that the tilting of the lava pilewas pre-zeolite forma-tion and syn-volcanic due to the progressive focussing of volcanismalong the coast. Neuhoff et al. (1997) explained the pronounced dip ofthe isograds with post-metamorphic deformation associated with dikes

19J.M. Bonow et al. / Global and Planetary Change 116 (2014) 10–29
and faults near the continental margin. According to Neuhoff et al.(1997), zeolitisation occurred rapidly during and just after the bulk ofvolcanism because basalt porosity was rapidly reduced after zeolite for-mation and thus limiting groundwater flow and further developmentof the zeolites. Isograds represent levels of equal thermal alterationand, according to Larsen et al. (1989), the absence of the shallow andless altered zeolite zones may be explained by the removal of thesezones by erosion.
The amount of section removed since the formation of the zeolitezones was shown to vary between 250 and 1850 m at six locationsstudied by Larsen et al. (1989) and by Neuhoff et al. (1997) (Table 1).We calculated the amount of erosion by subtracting the depths to theisograds below the present surface from the reference depths belowthe paleo-surface as established by Larsen et al. (1989) based on ageothermal gradient of 40 °C/km. The minimum amount of removedsection would increase to 800 m if the paleo-geothermal gradient wasonly 30 °C/km (Larsen et al., 1989).
The results show that minimal erosion (400 m) has taken placeacross the Geikie Plateau and Gronau Nunatakker. Larsen et al. (1989)noted that the lost lavas across the Geikie Plateau are mainly of theSkrænterne Formation and that this formation probably extended fur-ther in the direction towards Milne Land. The authors also entertainthe possibility that there was an overlying sequence of alkaline lavasequivalent to what is now known as the Prinsen afWales Bjerge Forma-tion (Hansen et al., 2002) and that possible feeder dykes for such lavasare present in the area. However, the estimated erosion increases to700 and 900 m towards the north across Gåseland and Milne Land in
Table 1Zeolite isograds in southernEast Greenland based on thework of Larsen et al. (1989) andNeuhozeolitisation.
Reference
(A)Isograddepth
b p–surf.(m)
(B)Isograddepthb surf.
(m)
(C)
Isogradelev.
(m asl)
(D)
Rem.sect.(m)
(E)
Rockuplift(m)
(BIsogdepb s
(m
(A)Isograddepth
b p–surf.(m)
(B)Isograddepthb surf.
(m)
(C)
Isogradelev.
(m asl)
(D)
Rem.sect.(m)
(E)
Rockuplift(m)
(BIsogdepb s
(m
Zeolite free 0Chabazite + thomsonite 400 100 2600 300 3000Analcime 1400 1100 1600 300 3000 2Mesolite – scoleicite 1600 4Heulandite + stilbite 2300 10Laumonite 2500
3000300Mean value
Reference
Zeolite free 0Chabazite + thomsonite 400 0 1900 400 2300Analcime 1400 1000 900 400 2300 7Mesolite – scoleicite 1600 1150 750 450 2350Heulandite + stilbite 2300Laumonite 2500 2200 –100 300 2400
2338388Mean value
Gronau NunatakkerSummit 2700 m asl
Geikie PlateauSummit 1900 m asl
(A) Isograd reference depth below paleo-surface assuming a paleogeothermal gradient of 40 °(B) Isograd depth below present surface. Data from Neuhoff et al. (1997) (Gronau Nunatakker(C) Isograd elevation. Data from Larsen et al. (1989) (Geikie Plateau, Gåseland, Milne Land) or(D) Removed section = A − B.(E) Rock uplift = A + C. Upper limit assuming paleo-surface near sea level.b: below, elev: elevation, p-surf: paleo-surface, Rem. sect.: removed section.
agreement with the gradual truncation of the basalt units in that direc-tion (Fig. 9; see Larsen et al., 1989). Consistent with this, Larsen et al.(1989) concluded that the zeolitisation had a regional character andthat it took place after the tilting of the lava sequence and before erosionhad planed the sequence down to its present level.
Towards the southern limits of the main area of flood basalts, theamount of erosion based on the zeolite isograds becomes significant atLindbergh Fjelde and Nansen Fjord and reaches 1250 and 1850 m,respectively. The amount of section removed increases by 900 m overthe 35 km between Gronau Nunatakker and Lindbergh Fjelde. The in-crease agrees well with the dip of the basalts of 2° towards GronauNunatakker (Pedersen et al., 1997). According to Neuhoff et al. (1997)this cover consisted of parts of the Geikie Plateau Formation, theRømer Fjord and Skrænterne Formations.
4.9. Post-volcanic structures
Substantial, post-volcanic movements caused considerable changesin the geometry of the Main Basalts (e.g. Brooks and Nielsen, 1982;Brooks, 1985; Pedersen et al., 1997). Pedersen et al. (1997) identifiedthesemovements andmapped several tectonic blockswith dips varyingfrom 1 to 2° N-NE in inland areas to 12°SE at the coast.
Pedersen et al. (1997) identified a nearly horizontal inland plateaubetween Lindbergh Fjelde and Gronau Nunatakker (Fig. 6), with flowdips less than 2°. Remnants of mildly alkaline basalts on several highnunataks suggest that the area may have been covered by such lavaswhich have been removed by erosion.
ff et al. (1997). Estimates of amounts of sections removed and rock uplift (upper limit) after
)radth
urf.)
(C)
Isogradelev.
(m asl)
(D)
Rem.sect.(m)
(E)
Rockuplift(m)
(B)Isograddepthb surf.
(m)
(C)
Isogradelev.
(m asl)
(D)
Rem.sect.(m)
(E)
Rockuplift(m)
)radth
urf.)
(C)
Isogradelev.
(m asl)
(D)
Rem.sect.(m)
(E)
Rockuplift(m)
(B)Isograddepthb surf.
(m)
(C)
Isogradelev.
(m asl)
(D)
Rem.sect.(m)
(E)
Rockuplift(m)
50 2750 1150 415050 2550 1150 415000 2000 1300 4300 400 850 1900 3150
700 550 1800 30503100185042001200
00 1100 700 2500 500 1300 900 2700
27009002500700
Lindbergh FjeldeSummit 3000 m asl
Nansen FjordSummit 1250 m asl
GåselandSummit 1800 m asl
Milne LandSummit 1800 asl
C/km (Larsen et al., 1989)., Lindbergh Fjelde, Nansen Fjord) or calculated as summit elevation − C.calculated as summit elevation − B.

Fig. 11. Erosion surfaces, escarpments and fault blocks in East Greenland. An etch surface (ES, see also explanation in text) is identified in the northern part of the study area (see Fig. 3A).The Upper Planation Surface (UPS) cuts the basement and the Paleogene Main Basalts, as well as across blocks tilted by post-basalt movements (e.g. Lindbergh Block, cf. Pedersen et al.,1997). This shows that the UPS was formed by erosion in post-basalt times. We also identify distinct blocks (e.g. the Gåseland Block) where the UPS is vertically offset relative to the ad-jacent areas. We interpret this as an indicator of tectonic movements after the formation of the UPS. The LPS extends over wide areas at the head of Kangerlussuaq, but it occurs only asvalley benches on southern Milne Land and in the areas west of Milne Land. Geology in background, legend in Fig. 2. See online map for further details.
20 J.M. Bonow et al. / Global and Planetary Change 116 (2014) 10–29
Brooks (1979, 1985) used geological and geomorphological evi-dence to introduce the concept of the “Kangerlussuaq dome” (Fig. 2).He argued that about 3 km of basalt had accumulated above thepresent-day summit of Domkirkefjeldet during the initial event of lavaeruption and net subsidence and that the dome surface formed subse-quently by uplift culminating around Domkirkefjeldet where the topof the basalts reached about 6 km a.s.l. Brooks used young apatitefission-track ages published by Gleadow and Brooks (1979) to showthat the dome was already deeply eroded by 35 Ma and concludedthat the dome most likely formed around the time of emplacement ofthe Kangerlussuaq Intrusion around 50 Ma. Brooks (1985, 2011) and
Fig. 12. Photos from the study areawith indexmap of photo locations. A.Milne Land looking socharacterised by distinct hills, up to 100m high. In the foreground, the ES emerges from belowThe age of the ES is thus different on either side of Scoresby Sund, but shape alone cannot bestripped. The upper planation surface (UPS) cuts across the Paleogene basalt. The UPS extendTheUPS (blue dashed line) cuts across Paleogene basalt and forms a plateau at c. 1800m a.s.l. Thweathered. This etch surface is re-exposed in the inner parts of Scoresby Sund. C. Milne Land loplateau at 1900m a.s.l. D. Inner part of Kangerlussuaq looking north-east to the Lower Planationfurther inland, across the Eocene basalts of the Prinsen afWales Bjerge Formation (Hansen et al.far distance. It separates the LPS from the rather dissected UPS (developed across basalts) on twhile the UPS reaches about 3000 m a.s.l. E. Inner part of Kangerlussuaq looking south to alpinBlosseville Kyst and no remnants of planation surfaces are preserved in these landscapes. F. Eastment (formed in basalt) along the edge of Watkins Bjerge. The escarpment trends generally Wfault. G. Watkins Bjerge looking north. The ice-filled valley is part of a major fluvial paleo-draPlateau and the Wager Escarpment are seen in the distance. The UPS is highly dissected in the
Pedersen et al. (1997) suggested that a large block occupying morethan 1500 km2 in Watkins Bjerge, represents the flank of “theKangerlussuaq dome”. Here the basalts reach up to 3.7 km a.s.l. andthe basalts within the block tilt as much as 4°NE away from centre ofthe presumed “Kangerlussuaq dome”.
The Ocean Drilling Program (ODP) Leg 152 off SE Greenland docu-mented subaerially erupted lavas 3.1 km below seabed (~63°N; Larsenet al., 1993). Onshore southern East Greenland, theflood basalts eruptedonto a largely horizontal lava plain near sea level (see above), but todaythese lavas reach 3.7 km a.s.l. at Gunbjørn Fjeld, the highestmountain inGreenland. Consequently, post-breakup, differential vertical
uth-east across Scoresby Sund. The etch surface (ES) is developed in basement rocks and isa Jurassic cover, while on the other side of Scoresby Sund it is overlain by Paleogene basalt.used to distinguish the two surfaces from each other in areas where the cover has beens south of Scoresby Sund where it is known as the Geikie Plateau. B. Central Milne Land.e basement–basalt contact (red dashed line) is highly irregular and the basement is deeplyoking north across Øfjord (note the icebergs). The UPS cuts across basement and forms aSurface (LPS, here known as theNordfjord Plateau)which cuts across basement rocks and,, 2002). A several hundredmetre high escarpment, the Lindbergh Escarpment is seen in thehe Lindbergh Block above the escarpment. The elevation of the LPS is about 2000 m a.s.l.,e relief around Domkirkefjeldet. Alpine topography is the dominant landscape type alongside of Christian IV Gletscher looking north to the ~1.5 km high erosionalWatkins Escarp-–E but is winding showing that it is an erosional feature and not primarily controlled by ainage system that heads generally northwards, away from the present coast. The Wagerforeground along the escarpment, but forms the extensive Wager Plateau in the distance.
Geikie Plateau (UPS)
ES
JurassicJurassic
BasaltBasalt
BasementBasement Jurassic
Basalt
Basement
Scoresby SundScoresby SundScoresby Sund
UPS
BasaltBasalt
BasementBasement
ES
Basalt
Basement
UPS
LPS
UPS
Lindbergh Escarpment
Nordfjord Plateau
Watkins Bjerge
Watkins Escarpment
LPS?LPS?LPS?
Wager Plateau (UPS)
Wager Escarpment
A
B
C
D
E
F
G
AB
C
FG
D E
21J.M. Bonow et al. / Global and Planetary Change 116 (2014) 10–29

835000 860000 885000 910000 935000 960000 985000
ESE
UPS
ES
Milne LandWNW
Jurassic
Maximum topographyalong swath
Topography
Minimum topographyalong swath
UPS
UTM X
4(km)
0123
LPSUPS
Alpine relief
NNE
SkærgaardIntrusion
4 SSW(km)
0123
7575000 7600000 7625000 7650000 7675000 7700000UTM Y
LindberghEscarpment
?
7575000 7600000 7625000 7650000 7675000 7700000 7725000 7750000 7775000 7800000 7825000 7850000 7875000 7900000
4 SSW(km)
NNEUPSWatkinsEscarpment
Alpine reliefAlpine relief
UPS UPS UPS
IED
Gåseland Block
Watkins Block
UTM Y0123 Wager Plateau
.Gunbjørn Fjeld Watkins Fault
Wager Escarpment
ab
c
A
B
CFig. 9
Fig. 13. Topographical profiles combined with maximum and minimum topography within swaths covering 25 km on each side of the topographical line. A. SSW–NNE profile betweenNansen Fjord andGåseland. The geology along the profile is dominantly basalt, except for north of point 7825000where the bedrock is basement. Theprofile illustrates the presence of twotectonic blocks, theWatkins Block and theGåseland Blockwhich havemoved vertically after formation of the UPS. TheWatkins Escarpment is erosional and is a distinct landscape feature.B. SSW–NNEprofile along the eastern side of Kangerlussuaq. The geology in the south is dominated by basement rocks and the Skaergaard Intrusion but, north of point 7640000 the profileintersects basalt. The profile illustrates the relationship between the LPS, the UPS and the erosional Lindbergh Escarpment that separates the two surfaces. No surfaces or surface remnantshave been identified in the coastal areaswhere glacial erosion has resulted in alpine relief. C.WNW–ESE profile acrossMilne Land. Thebasement rocks on easternMilne Land are cappedbybasalt in the summits and by Jurassic sediments on the eastern slope towards Scoresby Sund. The Jurassic cover, directly onto basement, constrains theminimumage for this deeplyweath-ered ES in this area. The profile also illustrates the geometrical relationship between the near-horizontal UPS that cuts off the inclined ES. The UPS is therefore younger than the ES. TheUPSis slightly offset across Rødefjord, which is probably related to movements of the Gåseland Block to the south. Upper Planation Surface (UPS): stippled blue line, Lower Planation Surface(LPS): stippled orange line, etch surface (ES): stippled red line. Numbers on the length axis refer to (m) in UTM zone 24. IED: area with inaccurate elevation data. Location of profilesindicated in the index map.
22 J.M. Bonow et al. / Global and Planetary Change 116 (2014) 10–29
movements with a magnitude of more than 6 km have shaped thepresent-day geometry of the large igneous province along the EastGreenland margin (Fig. 10).
5. Stratigraphic landscape analysis
5.1. Mapping of peneplains
We identified extensive etch surfaces (ES) formed by the deepweathering of basement rocks and two other surfaces of regional extentand low relative relief that we identified as planation surfaces: theUpper Planation Surface (UPS) and the Lower Planation Surface (LPS)(Fig. 11 and map at the scale of 1:500,000 in the supplement online). Inthe followingwe show that the UPS and the LPS cut across rocks of differ-ent ages and resistances and that they therefore are erosional features.
We also identify and name significant erosional escarpments (Lind-bergh, Wager andWatkins Escarpments) and our mapping reveals thatthe surfaces, especially the UPS, are tilted along or offset across linea-ments (Fig. 11). This observation is important because it shows thatfaults have been active after the formation of the UPS. We are thusable to identify faults (one is named here, Watkins Fault) and four tec-tonic blocks that are limited by such faults (Gåseland, Kap Dalton, Lind-bergh and Watkins Blocks; Fig. 11). Finally, we identify pre-glacialdrainage patterns and evidence for significant glacial erosion in someareas and formation of alpine relief (Figs. 12 and 13).
5.1.1. Etch surface (ES)The deeply weathered surfaces that formed prior to the eruption of
the Paleogene basalts are important in the context of this study becausethey can be used to establish an erosional and depositional, pre-basalthistory of themargin. However, in detail they can occasionally be identi-fied as a pre-Middle Jurassic surface (e.g. on parts of Milne Land) or as apre-mid-Paleocene surface (e.g. onMilne Land and Gåseland). However,a detailed analysis of these surfaces is beyond the scope of this paper and,as they are similar in character, we treat them as one etch surface (ES).
The ES that extends across the crystalline basement in the northernpart of the study area is characterised by distinct hills that are a fewhundred metres high and limited by narrow valleys along old fracturesystems (cf. Birkelund and Perch-Nielsen, 1976; Larsen et al., 1989).Such “hilly relief surfaces” are formed in a warm, humid climate bydeepweathering of the landscape, followed by stripping of the saprolitecover (e.g. Lidmar-Bergström et al., 1997; Bonow, 2005). The ES is rec-ognized over wide areas of Milne Land and Gåseland (Figs. 3, 11 and12) and also along the southern coast of Scoresby Sund, where base-ment is exposed below themore widespread Main Basalts. The hilly re-lief characteristics of the basement can be observed both in areaswithout cover rocks and also in areas where the basement/cover rockcontact can be followed as an unconformity in exposed hillsides in thelandscape (Fig. 3A). The ES occurs at different elevations in the land-scape, from sea level up to 1800 m a.s.l. (Larsen et al., 1989), wherethe ES is cut off by the UPS (Figs. 12 and 13). In areas near cover rocks,the crystalline basement has a glacial overprint, for example striationsand chattermarks. This shows that glacial erosion has played a signifi-cant role in the stripping of the Mesozoic–Paleogene cover.
5.1.2. Upper Planation Surface (UPS)We have mapped the UPS across an area of about 75,000 km2 be-
tween Kangerlussuaq and Scoresby Sund where a significant part ofthe plateau is known as the Geikie Plateau. A previously unnamed pla-teau areawe name theWager Plateau (Figs. 11 and 13). The elevation ofthe UPS is between 2 and 3 km a.s.l. over most of the study area(Fig. 14). In general, the UPS is best preserved inlandwhile it is severelydissected or totally obliterated in the coastal areas. We infer that theUPS exists beneath the many local icecaps which cover a significantpart of the study area. To reach that conclusion, we have complementedthe identification of the UPS on digital elevation data by inspection ofaerial photographs to identify the flat rock surfaces that emerge alongthe rimof the ice-caps (Fig. 3). In other cases, nunatakswithminor rem-nants of flat surfaces occur and such areas are marked as “UPS inferred”on the map in Fig. 11.

Fig. 14. Elevations and the general trend of elevation of the UPS and LPS along Blosseville Kyst. The UPS is coherent across wide areas and is generally tilted towards the north with thehighest elevations around Christian IV Gletscher and the Watkins Block. The LPS extends over wide areas at the head of Kangerlussuaq but only as elevated valley benches aroundMilne Land. The red question marks indicate areas where the coherent elevation of the summits indicate that they are near the LPS, however, these areas are dominated by alpine reliefwithout surface remnants. UPS: upper planation surface. LPS: lower planation surface. Location of profiles in Fig. 13 is shown.
23J.M. Bonow et al. / Global and Planetary Change 116 (2014) 10–29
The UPS can be followed from profile to profile across different rocktypes (e.g. basement and basalt onMilne Land) (Fig. 7), so theUPS is notcontrolled by lithology. The surface cuts across rocks of different ages, inparticular across the Caledonian basement and the Main Basalts(Figs. 12 and 13). In some areas, there is hardly any angular unconformi-ty between the UPS and underlying basalt flows (e.g. GronauNunatakker; Fig. 11) whereas there is a pronounced unconformityalong a profile from the Geikie Plateau to Milne Land (Fig. 9; Larsenet al., 1989; Pedersen et al., 1997). Around Gåseland and Milne Land,the UPS also truncates the hilly relief (Fig. 12A).
5.1.3. Lower planation surface (LPS)The LPS is well-defined across the basement and basalt along the
inner part of Kangerlussuaq at about 2 km a.s.l. (Figs. 11 and 12D).The surface can be mapped with high confidence only in a rathersmall area, c. 50 km by 50 km and includes the Nordfjord Plateau. To-wards NE, the Lindbergh Escarpment is a clear feature that separatesthe LPS from the UPS (Fig. 12D), although there are 10–30 km betweenthe area where the LPS is exposed and the escarpment that borders theUPS. There are only few nunataks in the intervening area which is al-most entirely covered by ice. We mapped some areas as “inferred LPS”where there is a lack of fairly large flat areas, but where correlations be-tween profiles allow connection between small flat surface occurrences.The low elevation of the LPS compared to the UPS and the erosional es-carpments between the UPS and the LPS, show that the LPS formed byerosion below the UPS.
A consistent level of summits in the profiles indicates that the LPSmay have extended further east along the escarpment bordering
Watkins Block and the Wager Plateau, for example east of Christian IVGletscher and along the present coast, from Kangerlussuaq to ScoresbySund (Figs. 8, 11 and 14).We did, however, not identify anyflat surfacesin these areas, whereas the LPS is readily identified in the area aroundMilne Land (Figs. 3 and 11), where it forms valley benches at approxi-mately 1 km a.s.l.
5.1.4. Erosional escarpments
5.1.4.1. Wager Escarpment. The Wager Plateau (part of the UPS) islimited on its southern flank by a c. 1 km high escarpment, the WagerEscarpment (Figs. 11 and 12G).We interpret this escarpment as primar-ily erosional as it is winding, but its origin is probably scarp retreat fromthe east–west trending fault, the Watkins Fault, that offsets the WagerPlateau relative to the Watkins Block.
5.1.4.2. Watkins Escarpment. The southern flank ofWatkins Bjerge formsa major and exceptionally high (1.5 km) escarpment, the WatkinsEscarpment (Figs. 11 and 12F). The escarpment separates the summitlevel (near the UPS) from a lower level in the terrain which we inferto be near the LPS (see above). We interpret the escarpment to be anerosional feature as there is no change in lithology and because it iswinding and thus that it is not fault controlled. Itwasmost likely formedby scarp retreat after movements along the Christian IV Fault (cf. Larsenand Whitham, 2005).
5.1.4.3. Lindbergh Escarpment. The escarpment NE of Kangerlussuaq, theLindbergh Escarpment, is less pronounced, but it rises a few hundred

24 J.M. Bonow et al. / Global and Planetary Change 116 (2014) 10–29
metres above the ice-covered plateau of the LPS and is clearly visible inthe landscape (Figs. 11 and 12D). The escarpment is in many partsabrupt, but the high degree of dissection and its highly irregular appear-ance makes it sometimes difficult to establish its precise position. It ismost likely erosional, similar to the Watkins Escarpment and to theWager Escarpment, as the same type of basalt is present on both sidesof the escarpment and it thus does not reflect differences in bedrockresistance.
5.1.5. Tectonic and erosional features
5.1.5.1. Gåseland Block. Gåseland Block is located on the innermost partof the Gåseland peninsula (Figs. 3A, 11 and 13). The block is down-faulted along the inner part of Rødefjord compared to the remnants ofUPS identified on the NW side of the fjord. It is possible that MilneLand to the north constitutes another fault block.
5.1.5.2. Kap Dalton Block.Kap Dalton Block is situated along the northernpart of Blosseville Kyst, between the coastline and Steno Bræ (glacier)and is 25–30 km wide. The drainage pattern of this glacier is peculiaras it runs parallel to the coast for more than 100 km. Kap Dalton Blockis slightly tilted towards the coast and the summit may be part of theUPS (Figs. 3B, 10 and 11).
5.1.5.3. Lindbergh Block. Lindbergh Block lies west of Watkins Block andit is bordered by the Christian IV Gletscher in the east (Figs. 11, 12D and13B). It is, like Watkins Block, limited by a fault to the north (maybe acontinuation of the Watkins Fault), but the escarpment there is not aspronounced as Watkins Fault limiting the northern side of Watkinsblock. The southern flank of the Lindbergh Block is limited by the ero-sional Lindbergh Escarpment (Fig. 12D). It is possible that the Lindberghand the Watkins Blocks constitute one single block that has beendissected by the Christian IV Gletscher.
5.1.5.4. Watkins Block. Watkins Block contains the high summit ofGunbjørn Fjeld and it is the most salient topography within the studyarea (Figs. 11, 12F and 13). The block consists of Watkins Bjerge and iswell defined on its northern side along a west–east trending glacial val-ley, which we interpret to follow a fault, the Watkins Fault. However,the Watkins Fault seems to fade towards the west, as high topographyis also present north of the west–east trending glacial valley. Thesteep, erosional Watkins Escarpment limits the block to the south. Thelimit of the block is poorly defined in the east while it is clearly con-trolled by Christian IV Gletscher with the inferred fault (Larsen andWhitham, 2005) in the west. We interpret the summits of the WatkinsBlock to be near the UPS because they can be correlatedwith the UPS onthe Wager Plateau via the profiles. These observations imply thatWatkins Block moved significantly in post-UPS time.
We have, furthermore, identified and mapped a paleo-drainage sys-tem at high elevations in the area aroundWatkins and Lindbergh Blocks(Figs. 11 and 12G). These patterns of fluvial valley systems were notedby Brooks (1985), but not mapped in detail. We note that the paleo-drainage points in a generally northwards direction, away from thepresent coast (Fig. 11) and that it has an ordinary, fluvial dendritic pat-tern. At present these valleys arefilledwith glaciersflowing northwardsand the original valleys have been deepened andwidened. The drainagedirection eventually changes towards the south as the valleys connectto the southward-flowing Christian IV Gletscher that drains into theAtlantic at the southern edge of Blosseville Kyst (Fig. 11). This flow pat-tern shows that the original drainage pattern has been altered and thatthe water divide has moved from a position closer to the present coastto a more inland position, further north-west.
The mountains in the coastal regions are dominated by alpine reliefcharacterised by glacial erosional forms such as cirques, horns andarêtes and deep glacial valleys. This erosion has resulted in total destruc-tion of any preglacial plateaux.
5.2. Denudation chronology and magnitude of uplift
5.2.1. Constraints on the timing of the formation of the UPS and the LPSTheUPS and LPS are regionally extensive, low-relief surfaces that cut
across rocks of different ages and resistance, in particular across theMain Basalts. We thus interpret them to be erosion surfaces (pene-plains; cf. Green et al., 2013 and references therein) and infer thatthey were graded to the general base level during the time of their for-mation. This must have happened after the extrusions of the basalts,after the onset of sea-floor spreading in the NE Atlantic and after anevent of regional tilting of the basalt flows (cf. Fig. 9; Pedersen et al.,1997). Our preferred interpretation is that the base level to whichthese surfaces were gradedwas the level of the adjacent Atlantic Ocean.
The stratigraphy off South-East Greenland (c. 63°N) provides furtherinsight into the denudation chronology of the margin (Ocean DrillingProject, leg 152, site 918; Larsen et al., 1994b). Larsen et al. (1994b)thus found that the lower Eocene sediments at site 918 indicated lowsedimentation rates with limited terrigenous influx before a middle Eo-cene–upper Oligocene hiatus, whereas the sudden and strong influx ofcoarse clastic turbidites at this site during the late Oligocene may havebeen triggered by an uplift of the innermargin. These observations indi-cate that a mid-Cenozoic uplift event caused regional tilting of the ba-salts, deep erosion of the margin and ultimately, formation of the UPSand LPS (see also Larsen and Saunders, 1998). The uplift of the marginthat led to the formation of the UPS thus occurred between about45 Ma and about 30 Ma. The regional extent of the UPS betweenKangerlussuaq and Scoresby Sund (Figs. 3, 11 and 12) suggests thatthe surface formed during a long time span dominated by stable base-level conditions.
It is possible to further constrain the timing for the formation of theUPS and LPS due to the presence of themiddleMiocene lava flows of theVindtop Formation (14–13 Ma) that overlie the Main Basalts in a smallarea along the southern rim of theWager Plateau (Figs. 2 and 11; Storeyet al., 2004; S. Watt, pers. com. 2012). Two observations are essential:first, that the Vindtop Formation (2.7–2.9 km a.s.l.) is located abovethe UPS (mapped at 2.6 km a.s.l. near the outcrop of the Vindtop Fm,Fig. 14). Second that both the UPS and the LPS are regional in extentand thus needed significant time to develop. In West Greenland the re-gional UPS peneplain needed 20 Ma to develop (Japsen et al., 2006) sowe find it unlikely that both UPS and LPS could have developed afterthe middle Miocene (in which case the Vindtop Formation would bebelow the UPS). We therefor conclude that the Vindtop Formationerupted onto the UPS, and thus that UPS formed after 45Ma and before14Ma. Furthermore, our preferred interpretation is that the uplift eventthat initiated the formation of the LPS most likely happened after theeruption of the Vindtop Formation. There are, however, no geologicalconstraints confirming this age, but the age of the LPS is constrainedto be younger than the UPS, and the regional extend of the UPS impliesthat significant timemust have been available for its formation and thusthat the formation of themore restricted LPSmust have started relative-ly late. Thus when estimating the time interval for the formation of theLPS, some key aspects must be accounted for; namely: (1) the time toproduce the LPS; (2) a phase of regional uplift of the LPS; and (3) timeto destruct the uplifted LPS, creating alpine relief and incised valleys.
A tighter time constrain for the LPS is offered by integrating withAFTA data (Japsen et al., 2014–in thi issue).
5.2.2. Estimation of the amount of upliftOur interpretation of the UPS and the LPS as erosion surfaces graded
to former sea levels implies that their present elevation can be used toestimate the amount of net uplift since their formation. The amount ofuplift is equal to the vertical distance between the present elevation ofthe UPS or LPS relative to the present base level; i.e. the sea. The pres-ence of two elevated erosion surfaces across southern East Greenland,moreover, implies that phases of uplift affected the margin in post-UPS time; i.e. since the middle Miocene. Each uplift phase inevitably

25J.M. Bonow et al. / Global and Planetary Change 116 (2014) 10–29
led to valley incision by rivers, initiating new phases of planationtowards sea level; first the LPS and then the present-day valleys.
The vertical distance between the UPS and the LPS is thus an esti-mate of the amount of uplift in thefirst phase of post-UPS upliftwhereasthe elevation of the LPS provides an estimate of the uplift in the secondphase. Our results show that the magnitude of the first phase of upliftwas about 1 km over most of the study area, but that the magnitudewas about 1.5 km along the southern side of Watkins Block (Fig. 14).The second phase had a magnitude of 2 km in the Kangerlussuaq areaand 1 km around Milne Land.
5.2.3. Relative denudation chronologyAs demonstrated in Section 4, the land surface of southern East
Greenland remained near sea level during the eruption of the Main Ba-salts and the character of the UPS and the LPS is best explained by thesesurfaces being graded to base level at sea level during the time of theirformation. Miller et al. (2005) showed that eustatic sea-level fall hasbeen less than 100 m since 50 Ma, so the inferred changes of surfaceelevation since breakup are much larger than can be explained by alowered sea level change only. Medvedev et al. (2013) analysed the in-fluence of the ice-sheet loading in the central part of Greenland and thecarving of the fjord systems on the evolution of the topography by nu-merical modelling processes backward in time. They found that periph-eral bulging causedby the loadof theGreenland ice sheet is insignificantwhereas glacial carving can cause uplift of up to 1.2 km. Medvedev thusconcluded that much of Greenland's topography is not caused by ice-related processes and that the origin of the pre-glacial mountain chainswas enigmatic. A tectonic trigger is therefore needed to explain thepresent relief. We suggest that the formation of the planation surfacesand their present elevation can best be explainedwith the following rel-ative chronology of events (Figs. 5 and 6):
(1) Denudation andweathering of the basement in pre-Middle Ju-rassic and pre-mid-Paleocene times led to the formation ofdeeply-weathered basement surfaces characterised by hillyrelief (ES). Rifting, subsidence and burial in the Cretaceous toPaleocene generated the Kangerlussuaq Basin.
(2) Short-lived uplift in the mid-Paleocene due to the impact ofthe Iceland plume caused rotation and erosional truncationof the sediments below the earliest flows of the Lower Basaltsthat were partly extruded in a marine environment.
(3) Breakup of the NE Atlantic at the Paleocene–Eocene transitionat c. 56 Ma was accompanied by the extrusion of the Main Ba-salts during rapid subsidence (Fig. 6A).
(4) Syn-volcanic tilting of the lava sequence took place due to pro-gressive focusing of volcanism at and beyond the coast. Subsi-dence and burial during mid-Eocene eruption of the latevolcanics (the Igtertivâ Formation with marine incursions) anddeposition of sediments (fluvial to shallow-marine deposits ofthe Kap Dalton Group) continued.
(5) Mid-Cenozoic uplift (sometime between 45 and 30 Ma), regionaltilting and erosion led to the formation of the UPS near sea levelbefore the middle Miocene (Fig. 6B).
(6) The mid-Miocene Vindtop Formation extruded onto the UPS(Fig. 6B).
(7) Post-mid-Miocene uplift of the UPS by c. 1 km across most of thestudy area resulted in valley incision below the UPS, dissectionand tilting of the UPS and subsequent formation of the LPS nearsea level. Watkins Block and Lindbergh Block were uplifted byup to 1.5 km along their southern edges in this phase and thenorthward tilting of the blocks induced drainage in that direction(Fig. 6C, D).
Uplift of the UPS and LPS by c. 2 km in the Kangerlussuaq area andc. 1 km in the Milne Land area followed by valley incision and glacialerosion led to the formation of the present-day landscape (Fig. 6E).
6. Discussion
6.1. Formation and preservation of planation surfaces
The UPS is well preserved in areas with resistant basement rocks(e.g. Milne Land) and also in areas covered with basalt at some distancefrom the coast (e.g. theWager Plateau). This contrastswithWestGreen-land where the equivalent UPS is best preserved in basement rocks,while basalt areas are much more dissected (e.g. on Nuussuaq; Bonowet al., 2006a). TheUPS in East Greenland is at significantly greater eleva-tions than inWest Greenland. The higher elevationsmay also be the ex-planation for the better preservation of the UPS in East Greenlandbecause it is well established that landscapes, sometime called “relictsurfaces”, are preserved beneath non-erosive cold-based ice (Kleman,1994; Kleman and Hättestrand, 1999). The LPS is best preserved inareas of basement rocks (e.g. the Nordfjord Plateau), while areaswhere we were able to infer only the presence of the LPS, coincidewith areas covered by basalts or sedimentary rocks that are at lowerelevation and thusmore prone to experiencewet based and erosive gla-cial conditions. These areas are also close to the present coast, which fa-vours the development of cirque glaciers with subsequent formation ofalpine relief. Similar landscape patterns are observed inWest Greenland(Bonow et al., 2006a,b) and in western Scandinavia (Lidmar-Bergströmet al., 2000, 2007; Hall et al., 2013).
6.2. Estimation of removed section and rock uplift from zeolite isograds
We have concluded that the UPS was formed after a phase of upliftand erosion that followed the deposition of Paleogene volcanics andsediments. Zeolite isograds represent levels of equal thermal alterationand the absence of the shallow and less altered zeolite zonesmay be ex-plained by the removal of these zones by erosion (Larsen et al., 1989).Estimates on the amount of erosion based on the absence of zeolitezones (Table 1) thus provides a lower limit on the amount of section re-moved during formation of the UPS.
TheUPS is well-defined across Geikie Plateau and over Gåseland andMilne Land and the estimated amounts of erosion based on zeolitezones (400 and 700–900 m, respectively) are thus minimum estimatesof the section removed in these areas during the formation of the UPS.At Lindbergh Fjelde, theUPS coincideswith the summits and this allowsus to conclude that this surface formed after tilting of the basalts and re-moval of a cover of aminimum of 1250m. Nansen Fjord is in the coastalzone where the UPS cannot be identified.
We can use the zeolitisation (which happened pre-UPS) to estimatean upper limit for net rock uplift. The upper limit case corresponds to asituation where the paleo-surface during zeolite formation was close tosea level and thus to net subsidence during the eruption of the MainBasalts (Table 1). In this model, rock uplift equals summit elevationplus the amount of removed section; e.g. Gronau Nunatakker 3000 =2700 + 300 m. The upper limit of rock uplift varies from 2.3 km atGeikie Plateau to 4.2 km at Lindbergh Fjelde.
6.3. The “Kangerlussuaq dome” and other structures
Dome-shaped topographic features are common in recently upliftedareas such as southern Norway (the Southern Scandes) and southernSweden (the South Swedish Dome, e.g. Lidmar-Bergström et al., 2000,2013) and Nuussuaq, West Greenland (Bonow et al., 2006a). In ourstudy area the “Kangerlussuaq dome” (Fig. 2) has been discussed in sev-eral papers (Wager, 1947; Brooks, 1979, 1985, 2011; Pedersen et al.,1997). However, the “Kangerlussuaq dome” as identified by Brooks(1979, 1985) is not a topographical dome in the present landscape,but rather a geological structure, formed by the complex interaction ofuplift and erosion since the emplacement of the Kangerlussuaq Intru-sion in early Eocene (Figs. 2 and 5). The present topography in our

26 J.M. Bonow et al. / Global and Planetary Change 116 (2014) 10–29
study area is instead dominated by near-horizontal erosion surfaces andby deeply incised valleys.
Previous studies have suggested that Watkins Bjerge (and henceWatkins Block) is at the northern edge of the “Kangerlussuaq dome”(Brooks, 1985, 2011; Pedersen et al., 1997). We want to point out thatthe high elevation of these mountains is unrelated to the early Eoceneland surface and that the present topography is the combined resultof: (1) a first uplift event leading to planation and formation of theUPS by truncation of all Paleogene structures; (2) a second event lead-ing to uplift of the UPS, block tilting and erosion to form the LPS southof the Watkins Escarpment and finally (3) a third uplift event leadingto the elevation of the present landscape.
The 4° tilting of the lava flows towards the north in the WatkinsBlock (Pedersen et al., 1997) is consistent with our interpretation thatthe summits here once were a continuation of the Wager Plateau.
The UPS dips slightly towards the north in the area of LindberghFjelde–Gronau Nunatakker, but the dip is steeper in the LindberghFjelde area (the Lindbergh Block; Fig. 11). This interpretation is consis-tent with the results of Pedersen et al. (1997), who showed that the ba-salts are virtually horizontal around Gronau Nunatakker whereas thebasalts are tilted 2° in Lindbergh Fjelde.
Brooks (e.g. 2011) considered the Nordfjord Plateau at the head ofKangerlussuaq to be a pre-basalt surface, but our mapping shows thatthis plateau coincides with the LPS which also truncates the basalts atPrinsen af Wales Bjerge.
6.4. Drainage patterns
It is well known from analyses of the pattern of the large valley sys-tems in southern Norway that the water divide has migrated towardsthe east, away from the present coast (e.g. Ahlmann, 1919). At high el-evations (c. 1500 m a.s.l.), broad and shallow valleys slope away fromthe Norwegian coast and cross the present water divide. However,migrating knick points from west-flowing rivers that end in the NorthAtlantic have successively captured the east flowing rivers (whichhave lower gradients). The river courses therefore form agnor valleys(fish-hook valleys) (e.g. Reusch, 1901; Ahlmann, 1919; Bonow et al.,2003 and references therein). The conjugate margin of East Greenland,especially in the Kangerlussuaq–Scoresby Sund area shows a similarvalley pattern.
Well-developed agnor valleys characterise the drainage pattern onthe Lindbergh andWatkins Blocks (Fig. 12G). These old patterns of fluvi-al valley systems were noted by Brooks (1985) who thought that theyhad developed as superimposed drainage in response to the uplift ofthe “Kangerlussuaq dome”. However, due to the poor quality of themaps available to him, Brookswas unable to carry out a detailed analysis.Our favoured explanation for these northward-flowing systems and theformation of the agnor valleys is that thewater divide was previously lo-cated close to the present coast and that it has migrated northwards dueto late uplift. We thus speculate that the initial water divide that formedafter the first uplift of the UPS is now lost due to post-UPS erosion andthus that the maximum post-UPS uplift was south of Watkins Block.
6.5. Timing and magnitude of tectonic events
We used AFTA data to identify three Cenozoic events of uplift andexhumation in central West Greenland, starting between 36 and 30Ma, between 11 and 10 Ma and between 7 and 2 Ma (Japsen et al.,2006). We were also able to correlate these events to the developmentand subsequent uplift of two regional planation surfaces (also namedUPS and LPS). The evidence presented here does not allow us toestablish the timing of uplift in detail, but the relative denudation chro-nology for southern East Greenland that we established from the strat-igraphic landscape analysis overlaps with that for West Greenland (seeSection 2).
Wefind that theUPS in southern East Greenlanddeveloped between45 and 14 Ma whereas the timing for the formation of this surface inWest Greenland was between ~35 and ~10 Ma. Thus the formation ofthe UPS in bothWest and East Greenland could be synchronous. Signif-icant time with a relatively stable base level was thus available to formthe UPS in both West and East Greenland. The landscape in WestGreenland was at a low elevation until ~10 Ma when an uplift of 1 kmof the UPS led to the incision of the LPS and formation of the major val-leys. The uplift of the UPS in East Greenland and subsequent formationof the LPS happened after 14 Ma—again comparable toWest Greenland.The LPS in southern East Greenland, extends across larger areas of theLPS in central West Greenland. This indicates either that a longer timewas available for the formation of this surface in the east or that the for-mation of the surface was faster due to the presence of less resistantrocks (see above). The final phase of uplift in West Greenland was inthe latest Neogene and a similar timing for uplift in East Greenlandseems likely; at least we can say that it happened several millions ofyears after the onset of formation of the LPS that began after 14Ma. Gla-cial erosion, with enhanced erosion in valleys (e.g. Sugden, 1974) hascertainly contributed to isostatic compensation and further uplift ofthe surfaces, but cannot explain the full amount of uplift (Medvedevet al., 2008).
6.6. Comparison with the Norwegian margin
A wide range of geological observations show that the margin ofsouthern East Greenland was low-lying at the time of breakup andthus that the present-day relief is a consequence of events that hap-pened long after breakup, a conclusion that has been reached by previ-ous studies in East Greenland (e.g. Brooks, 1979, 1985, 2011; Bott, 1987;Larsen, 1990; Larsen and Marcussen, 1992; Clift et al., 1998; Larsen andSaunders, 1998). It is, however, only the present study that has clarifiedthat the elevated plateaux in southern East Greenland and the deeplyincised valleys below the plateaux are the result of three uplift phasesthat happened millions of years after breakup and that the present-day mountains were shaped after the mid-Miocene.
This is interesting because elevated plateaux and incised valleys alsocharacterise the large-scale landscape part of the conjugate margin inNorway (e.g. Lidmar-Bergström et al., 2000, 2013). The similarity ofthe two margins, both characterised by stepped surfaces, suggests thatit is likely that the mountains of Norway may also have reached theirpresent elevation in the late Cenozoic, long after the Atlantic breakup(cf. Bonow et al., 2007).
Previous studies of the large-scale landscapes in Norway (e.g.Reusch, 1901; Ahlmann, 1919) have reached similar conclusions, i.e.that the plateau surfaces there (the paleic relief; Lidmar-Bergströmet al., 2000) were formed by erosion to base level during the Cenozoicand that the surfaces reached their present elevation after uplift in thelate Cenozoic (Lidmar-Bergström et al., 2013 and references therein).The absence of cover rocks younger than Devonian on the crystallinebasement in these mountains (Sigmond et al., 1984), makes the timingof these events difficult to determine. Many geoscientists who are unfa-miliar with the principles of large-scale geomorphology and strati-graphic landscape analysis have, therefore, remained sceptical (e.g.Nielsen et al., 2009a).
Steer et al. (2012) estimated that 300–400 m was eroded off thehigh-elevation, low-relief surfaces in mid- and south Norway by glacialerosion during the Pliocene and Quaternary. On the contrary we findthat glacial erosion in East Greenland has limited effect on the surfaces,but is focussed along the fjords. The surfaces are mainly “relict surfaces”and their preservation can most likely be explained by non-erosive,cold-based ice concluded frommany studies of plateau surfaces in Scan-dinavia and North America (cf. Sugden, 1978; Rea et al., 1996; Klemanand Stroeven, 1997; Kleman and Hättestrand, 1999; Hall et al., 2013).The presence of the basaltic flows of the mid-Miocene Vindtop forma-tion at high elevation, above the UPS, documents that this regional
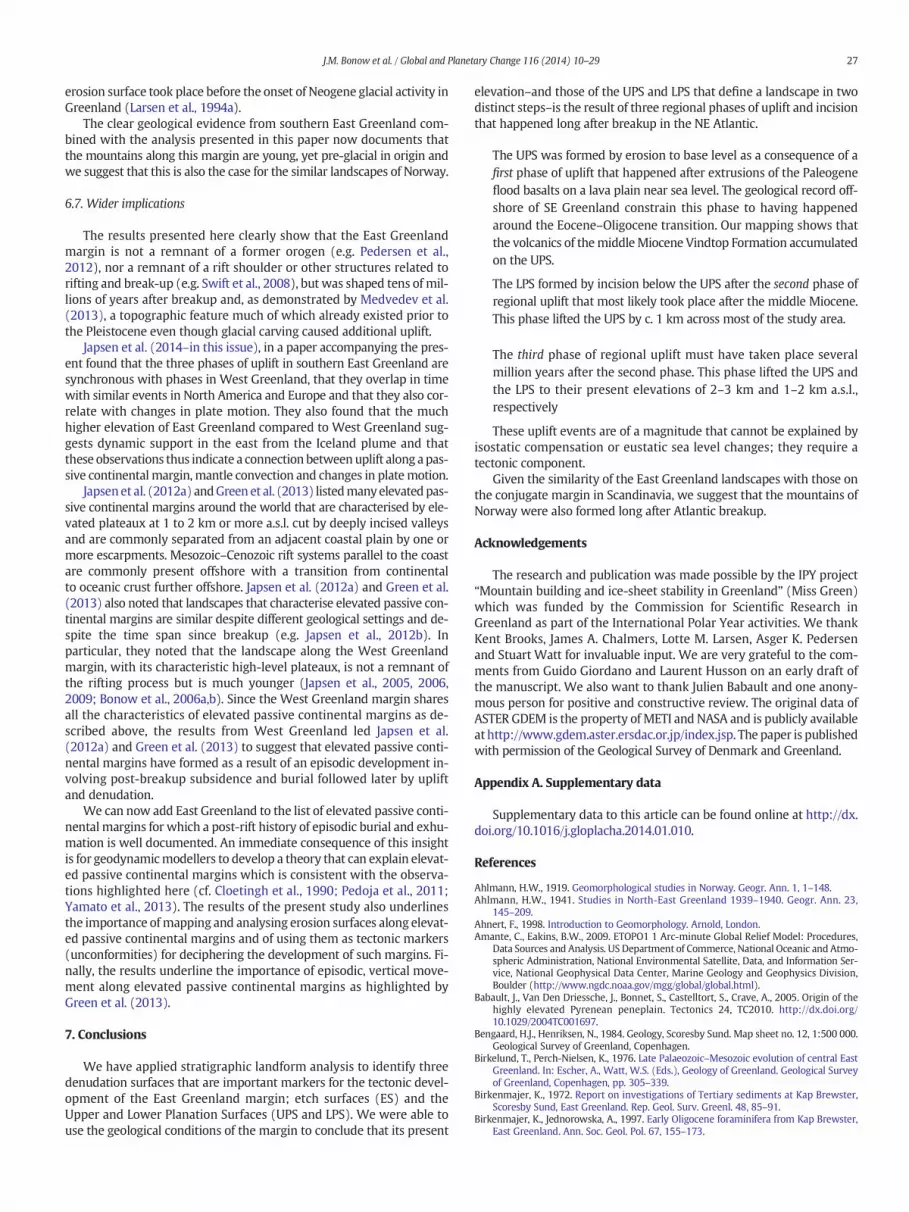
27J.M. Bonow et al. / Global and Planetary Change 116 (2014) 10–29
erosion surface took place before the onset of Neogene glacial activity inGreenland (Larsen et al., 1994a).
The clear geological evidence from southern East Greenland com-bined with the analysis presented in this paper now documents thatthe mountains along this margin are young, yet pre-glacial in origin andwe suggest that this is also the case for the similar landscapes of Norway.
6.7. Wider implications
The results presented here clearly show that the East Greenlandmargin is not a remnant of a former orogen (e.g. Pedersen et al.,2012), nor a remnant of a rift shoulder or other structures related torifting and break-up (e.g. Swift et al., 2008), but was shaped tens of mil-lions of years after breakup and, as demonstrated by Medvedev et al.(2013), a topographic feature much of which already existed prior tothe Pleistocene even though glacial carving caused additional uplift.
Japsen et al. (2014–in this issue), in a paper accompanying the pres-ent found that the three phases of uplift in southern East Greenland aresynchronous with phases in West Greenland, that they overlap in timewith similar events in North America and Europe and that they also cor-relate with changes in plate motion. They also found that the muchhigher elevation of East Greenland compared to West Greenland sug-gests dynamic support in the east from the Iceland plume and thatthese observations thus indicate a connection betweenuplift along apas-sive continental margin, mantle convection and changes in platemotion.
Japsen et al. (2012a) andGreen et al. (2013) listedmanyelevatedpas-sive continental margins around the world that are characterised by ele-vated plateaux at 1 to 2 km or more a.s.l. cut by deeply incised valleysand are commonly separated from an adjacent coastal plain by one ormore escarpments. Mesozoic–Cenozoic rift systems parallel to the coastare commonly present offshore with a transition from continentalto oceanic crust further offshore. Japsen et al. (2012a) and Green et al.(2013) also noted that landscapes that characterise elevated passive con-tinental margins are similar despite different geological settings and de-spite the time span since breakup (e.g. Japsen et al., 2012b). Inparticular, they noted that the landscape along the West Greenlandmargin, with its characteristic high-level plateaux, is not a remnant ofthe rifting process but is much younger (Japsen et al., 2005, 2006,2009; Bonow et al., 2006a,b). Since the West Greenland margin sharesall the characteristics of elevated passive continental margins as de-scribed above, the results from West Greenland led Japsen et al.(2012a) and Green et al. (2013) to suggest that elevated passive conti-nental margins have formed as a result of an episodic development in-volving post-breakup subsidence and burial followed later by upliftand denudation.
We can now add East Greenland to the list of elevated passive conti-nental margins for which a post-rift history of episodic burial and exhu-mation is well documented. An immediate consequence of this insightis for geodynamicmodellers to develop a theory that can explain elevat-ed passive continental margins which is consistent with the observa-tions highlighted here (cf. Cloetingh et al., 1990; Pedoja et al., 2011;Yamato et al., 2013). The results of the present study also underlinesthe importance ofmapping and analysing erosion surfaces along elevat-ed passive continental margins and of using them as tectonic markers(unconformities) for deciphering the development of such margins. Fi-nally, the results underline the importance of episodic, vertical move-ment along elevated passive continental margins as highlighted byGreen et al. (2013).
7. Conclusions
We have applied stratigraphic landform analysis to identify threedenudation surfaces that are important markers for the tectonic devel-opment of the East Greenland margin; etch surfaces (ES) and theUpper and Lower Planation Surfaces (UPS and LPS). We were able touse the geological conditions of the margin to conclude that its present
elevation–and those of the UPS and LPS that define a landscape in twodistinct steps–is the result of three regional phases of uplift and incisionthat happened long after breakup in the NE Atlantic.
The UPS was formed by erosion to base level as a consequence of afirst phase of uplift that happened after extrusions of the Paleogeneflood basalts on a lava plain near sea level. The geological record off-shore of SE Greenland constrain this phase to having happenedaround the Eocene–Oligocene transition. Our mapping shows thatthe volcanics of themiddleMiocene Vindtop Formation accumulatedon the UPS.
The LPS formed by incision below the UPS after the second phase ofregional uplift that most likely took place after the middle Miocene.This phase lifted the UPS by c. 1 km across most of the study area.
The third phase of regional uplift must have taken place severalmillion years after the second phase. This phase lifted the UPS andthe LPS to their present elevations of 2–3 km and 1–2 km a.s.l.,respectively
These uplift events are of a magnitude that cannot be explained byisostatic compensation or eustatic sea level changes; they require atectonic component.
Given the similarity of the East Greenland landscapes with those onthe conjugate margin in Scandinavia, we suggest that the mountains ofNorway were also formed long after Atlantic breakup.
Acknowledgements
The research and publication was made possible by the IPY project“Mountain building and ice-sheet stability in Greenland” (Miss Green)which was funded by the Commission for Scientific Research inGreenland as part of the International Polar Year activities. We thankKent Brooks, James A. Chalmers, Lotte M. Larsen, Asger K. Pedersenand Stuart Watt for invaluable input. We are very grateful to the com-ments from Guido Giordano and Laurent Husson on an early draft ofthe manuscript. We also want to thank Julien Babault and one anony-mous person for positive and constructive review. The original data ofASTER GDEM is the property of METI and NASA and is publicly availableat http://www.gdem.aster.ersdac.or.jp/index.jsp. The paper is publishedwith permission of the Geological Survey of Denmark and Greenland.
Appendix A. Supplementary data
Supplementary data to this article can be found online at http://dx.doi.org/10.1016/j.gloplacha.2014.01.010.
References
Ahlmann, H.W., 1919. Geomorphological studies in Norway. Geogr. Ann. 1, 1–148.Ahlmann, H.W., 1941. Studies in North-East Greenland 1939–1940. Geogr. Ann. 23,
145–209.Ahnert, F., 1998. Introduction to Geomorphology. Arnold, London.Amante, C., Eakins, B.W., 2009. ETOPO1 1 Arc-minute Global Relief Model: Procedures,
Data Sources and Analysis. US Department of Commerce, National Oceanic and Atmo-spheric Administration, National Environmental Satellite, Data, and Information Ser-vice, National Geophysical Data Center, Marine Geology and Geophysics Division,Boulder (http://www.ngdc.noaa.gov/mgg/global/global.html).
Babault, J., Van Den Driessche, J., Bonnet, S., Castelltort, S., Crave, A., 2005. Origin of thehighly elevated Pyrenean peneplain. Tectonics 24, TC2010. http://dx.doi.org/10.1029/2004TC001697.
Bengaard, H.J., Henriksen, N., 1984. Geology, Scoresby Sund. Map sheet no. 12, 1:500 000.Geological Survey of Greenland, Copenhagen.
Birkelund, T., Perch-Nielsen, K., 1976. Late Palaeozoic–Mesozoic evolution of central EastGreenland. In: Escher, A., Watt, W.S. (Eds.), Geology of Greenland. Geological Surveyof Greenland, Copenhagen, pp. 305–339.
Birkenmajer, K., 1972. Report on investigations of Tertiary sediments at Kap Brewster,Scoresby Sund, East Greenland. Rep. Geol. Surv. Greenl. 48, 85–91.
Birkenmajer, K., Jednorowska, A., 1997. Early Oligocene foraminifera from Kap Brewster,East Greenland. Ann. Soc. Geol. Pol. 67, 155–173.

28 J.M. Bonow et al. / Global and Planetary Change 116 (2014) 10–29
Bishop, P., 2007. Long-term landscape evolution: linking tectonics and surface processes.Earth Surf. Process. Landf. 32, 329–365.
Bonow, J.M., 2004. Palaeosurfaces and Palaeovalleys on North Atlantic Previously GlaciatedPassiveMargins—Reference Forms for Conclusions on Uplift and Erosion. (Ph.D. thesis)Stockholm University, Stockholm.
Bonow, J.M., 2005. Re-exposed basement landforms in the Disko region,West Greenland-disregarded data for estimation of glacial erosion and upliftmodelling. Geomorphology72, 106–127.
Bonow, J.M., Lidmar-Bergström, K., Näslund, J.O., 2003. Palaeosurfaces and major valleysin the area of the Kjølen Mountains, southern Norway-consequences of uplift andclimatic change. Norw. J. Geogr. 57, 83–101.
Bonow, J.M., Japsen, P., Lidmar-Bergström, K., Chalmers, J.A., Pedersen, A.K., 2006a.Cenozoic uplift of Nuussuaq and Disko, West Greenland-elevated erosion surfacesas uplift markers of a passive margin. Geomorphology 80, 325–337.
Bonow, J.M., Lidmar-Bergström, K., Japsen, P., 2006b. Palaeosurfaces in central WestGreenland as reference for identification of tectonic movements and estimation oferosion. Global Planet. Chang. 50, 161–183.
Bonow, J.M., Lidmar-Bergström, K., Japsen, P., Chalmers, J.A., Green, P.F., 2007. Elevatederosion surfaces in central West Greenland and southern Norway: their significancein integrated studies of passive margin development. Norw. J. Geol. 87, 197–206.
Bonow, J.M., Japsen, P., Green, P.F., Cobbold, P.R., Pedreira, A.J., Lilletveit, R., Chiossi, D.,2009. Post-rift landscape development of north-east Brazil. Geol. Surv. Den. Greenl.Bull. 17, 81–84.
Bott, M.H.P., 1987. The continental margin of central East Greenland in relation to NorthAtlantic plate tectonic evolution. J. Geol. Soc. London 144, 561–568.
Brookes, I.A., 1977. Geomorphology and Quaternary geology of the Codroy Lowland andadjacent plateaus, southwest Newfoundland. Can. J. Earth Sci. 14, 2101–2120.
Brooks, C.K., 1979. Geomorphological observations at Kangerdlugssuaq, East Greenland.Greenl. Geosci. 1, 3–21.
Brooks, C.K., 1985. Vertical crustal movements in the Tertiary of central East Greenland: acontinental margin at a hot-spot. Z. Geomorphol. 54, 101–117.
Brooks, C.K., 2011. The East Greenland rifted volcanic margin. Geol. Surv. Den. Greenl.Bull. 24 (96 pp.).
Brooks, C.K., Nielsen, T.F.D., 1982. The E Greenland continental margin: a transitionbetween oceanic and continental magmatism. J. Geol. Soc. London 139, 265–275.
Brown, R.W., Gallagher, K., Gleadow, A.J.W., Summerfield, M.A., 2000. Morphotectonic evo-lution of the South Atlanticmargins of Africa and South America. In: Summerfield, M.A.(Ed.), Geomorphology and Global Tectonics. Wiley, Chichester, pp. 255–281.
Chalmers, J.A., Green, P., Japsen, P., Rasmussen, E.S., 2010. The Scandinavian mountainshave not persisted since the Caledonian orogeny. A comment on Nielsen et al.(2009a). J. Geodyn. 50, 94–101.
Clift, P.D., Carter, A., Hurford, A.J., 1998. The erosional and uplift history of NE Atlantic pas-sive margins; constrains on a passing plume. J. Geol. Soc. London 155, 787–800.
Cloetingh, S.A.P.L., Gradstein, F.M., Kooi, H., Grant, A.C., Kaminski, M., 1990. Plate reorga-nization; a cause of rapid late Neogene subsidence and sedimentation around theNorth Atlantic. J. Geol. Soc. London 147, 495–506.
Dam, G., Larsen, M., Sørensen, J.C., 1998. Sedimentary response to mantle plumes: impli-cations from Paleocene onshore successions, West and East Greenland. Geology 26,207–210.
Davis, W.M., 1899. The geographical cycle. Geogr. J. 14, 481–504.Fjellanger, J., Etzelmüller, B., 2003. Stepped palaeosurfaces in southern Norway—interpre-
tation of DEM-derived topographic profiles. Norw. J. Geogr. 57, 102–110.Gabrielsen, R.H., Faleide, J.I., Pascal, C., Braathen, A., Nystuen, J.P., Etzelmuller, B.,
O'Donnell, S., 2010. Reply to discussion of Gabrielsen et al. (2010) by Nielsen et al.(this volume): latest Caledonian to present tectonomorphological development ofsouthern Norway. Mar. Petrol. Geol. 27, 1290–1295.
George, T.N., 1966. Geomorphic evolution in Hebridean Scotland. Scott. J. Geol. 2, 1–34.GEUS 2007. Geological maps of North and North-East Greenland. 1:250 000. Geological
Survey of Denmark and Greenland, Copenhagen.Gjessing, J., 1967. Norway's paleic surface. Norw. J. Geogr. 21, 69–132.Gleadow, A.J.W., Brooks, C.K., 1979. Fission-track dating, thermal histories and tectonics of
igneous intrusions in East Greenland. Contrib. Mineral. Petrol. 71, 45–60.Green, P.F., Japsen, P., Chalmers, J.A., Bonow, J.M., 2011. Thermochronology, erosion sur-
faces and missing section in West Greenland. J. Geol. Soc. London 168, 817–829.Green, P.F., Lidmar-Bergström, K., Japsen, P., Bonow, J.M., Chalmers, J.A., 2013. Stratigraph-
ic landscape analysis, thermochronology and the episodic development of elevatedpassive continental margins. Geological Survey of Denmark and Greenland Bulletin2013/30 150 pp.
Hall, A.M., 1987. Weathering and Relief Development in Buchan, Scotland. Chichester,John Wiley & Sons 991–1005.
Hall, A.M., Ebert, K., Kleman, J., Nesje, A., Ottesen, D., 2013. Selective glacial erosion on theNorwegian passive margin. Geology 1–4.
Hansen, H., Rex, D.C., Guise, P.G., Brooks, C.K., 1995. 40Ar/39Ar ages on early Tertiary ba-salts from the Scoresby Sund area, East Greenland. Newsl. Stratigr. 32, 103–116.
Hansen, H., Pedersen, A.K., Duncan, R.A., Bird, D.K., Brooks, C.K., Fawcett, J.J., Gittins, J.,Gorton, M., O'Day, P., 2002. Volcanic stratigraphy of the southern Prinsen af WalesBjerge region, East Greenland. In: Jolley, D.W., Bell, B.R. (Eds.), The North Atlantic Ig-neous Province. Stratigraphy, Tectonic, Volcanic and Magmatic Processes. Geol. Soc.Spec. Publ., 197, pp. 183–218.
Hassan, M.Y., 1953. Tertiary faunas from Kap Brewster, East Greenland. Medd. Grønland111, 653–656.
Heister, L.E., O'Day, P.A., Brooks, C.K., Neuhoff, P.S., Bird, D.K., 2001. Pyroclastic depositswithin the East Greenland Tertiary flood basalts. J. Geol. Soc. London 158, 269–284.
Henriksen, N., Higgins, A.K., Kalsbeek, F., Pulvertaft, T.C.R., 2009. Greenland from Archeanto Quaternary. Descriptive text to the 1995 Geological map of Greenland. Geol. Surv.Den. Greenl. Bull. 18 (126 pp).
Higgins, A.K., Leslie, A.G., 2008. Architechture and evolution of the East GreenlandCaledonies—an introduction. In: Higgins, A.K., Gilotti, J.A., Smith, M.P. (Eds.), TheGreenland Caledonides. Evolution of the Northeast Margin of Laurentia. Geol. Soc.Am. Memoir, pp. 29–53.
Holtedahl, O., 1953. On the oblique uplift of some northern lands. Norw. J. Geogr. 14,132–139.
Hopper, J.R., Dahl-Jensen, T., Holbrook, W.S., Larsen, H.C., Lizarralde, D., Korenaga, J., Kent,G.M., Kelemen, P.B., 2003. Structure of the SE Greenland margin from seismic reflec-tion and refraction data: implications for nascent spreading center subsidence andasymmetric crustal accretion during North Atlantic opening. J. Geophys. Res. SolidEarth 108.
Japsen, P., Green, P.F., Chalmers, J.A., 2005. Separation of Palaeogene and Neogene uplifton Nuussuaq, West Greenland. J. Geol. Soc. London 162, 299–314.
Japsen, P., Bonow, J.M., Green, P.F., Chalmers, J.A., Lidmar-Bergström, K., 2006. Elevated,passive continental margins: long-term highs or Neogene uplifts? New evidencefrom West Greenland. Earth Planet. Sci. Lett. 248, 315–324.
Japsen, P., Bonow, J.M., Green, P.F., Chalmers, J.A., Lidmar-Bergström, K., 2009. Formation,uplift and dissection of planation surfaces at passive continental margins—a new ap-proach. Earth Surf. Proc. Land. 34, 683–699.
Japsen, P., Chalmers, J.A., Green, P.F., Bonow, J.M., 2012a. Elevated, passive continentalmargins: not rift shoulders, but expressions of episodic, post-rift burial and exhuma-tion. Global Planet. Chang. 90–91, 73–86.
Japsen, P., Bonow, J.M., Green, P.F., Cobbold, P.R., Chiossi, D., Lilletveit, R., Magnavita, L.P.,Pedreira, A.J., 2012b. Episodic burial and exhumation history of NE Brazil after open-ing of the South Atlantic. Geol. Soc. Am. Bull. 124, 800–816.
Japsen, P., Green, P.F., Chalmers, J.A., 2013. The mountains of North-East Greenland arenot remnants of the Caledonian topography. A comment on Pedersen et al. (2012).Tectonophysics 589, 234–238 (Tectonophysics 589, 234–238).
Japsen, P., Green, P.F., Bonow, J.M., Nielsen, T.F.D., 2014. From volcanic plains to glaciatedpeaks: burial and exhumation history of southern East Greenland after opening of theNE Atlantic. Global Planet. Chang. 116, 91–114 (in this issue).
Jessen, O., 1943. Die Randschwellen der Kontinente. Petermanns Geogr. Mitteilungen 241,1–205.
Johnson, K., Gallagher, K., 2000. A preliminary Mesozoic and Cenozoic denudation historyof the North East Greenland onshore margin. Global Planet. Chang. 24, 303–309.
King, L.C., 1967. The Morphology of the Earth, 2nd edition. Oliver & Boyd, Edinburgh.Kleman, J., 1994. Preservation of landforms under ice sheets and ice caps. Geomorphology
9, 19–32.Kleman, J., 2008. Geomorphology: where glaciers cut deep. Nat. Geosci. 1 (6), 343–344.Kleman, J., Hättestrand, C., 1999. Frozen-bed Fennoscandian and Laurentide ice sheets
during the Last Glacial Maximum. Nature 402, 63–66.Kleman, J., Stroeven, A.P., 1997. Preglacial surface remnants and Quaternary glacial re-
gimes in northwestern Sweden. Geomorphology 19, 35–54.Larsen, H.C., 1990. The East Greenland shelf. In: Grantz, A., Johnson, L., Sweeney, J.F. (Eds.),
The Arctic Ocean Region. The Geology of North America, Boulder, Colorado,pp. 185–210.
Larsen, H.C., Marcussen, C., 1992. Sill-intrusion, flood basalt emplacement and deep crust-al structure of the Scoresby Sund region, East Greenland. In: Storey, B.C., Alabaster, T.,Pankhurst, R.J. (Eds.), Magmatism and the Causes of Continental Break-up. Geol. Soc.Spec. Publ., 68, pp. 365–386.
Larsen, H.C., Saunders, A.D., 1998. Tectonism and volcanism at the southeast Greenlandrifted margin: a record of plume impact and later continental rupture. In: Saunders,A.D., Larsen, H.C.,Wise Jr., S.W. (Eds.), Proceedings of the Ocean Drilling Program, Sci-entific Results, pp. 503–533.
Larsen, R.B., Tegner, C., 2006. Pressure conditions for the solidification of the Skaergaardintrusion: eruption of East Greenland flood basalts in less than 300,000 years. Lithos92, 181–197.
Larsen, M., Whitham, A., 2005. Evidence for a major sediment input point into the Faroe–Shetland Basin from the Kangerlussuaq region of southern East Greenland. In: Doré,A.G., Vining, B. (Eds.), Petroleum Geology: North-West Europe and Global Perspec-tives—Proceedings of the 6th Petroleum Geology Conference. Geological Society,London, pp. 913–922.
Larsen, L.M., Watt, W.S., Watt, M., 1989. Geology and petrology of the Lower Tertiary pla-teau basalts of the Scoresby Sund region, East Greenland. Grønl. Geol. Unders. Bull.169 (164 pp.).
Larsen, H.C., Saunders, A.D., Clift, P.D., 1993. Ocean Drilling Program Leg 152 PreliminaryReport East Greenland Margin. College Station, Texas.
Larsen, H.C., Saunders, A.D., Clift, P.D., Beget, J., Wei, W., Spezzaferri, S., 1994a. Seven mil-lion years of glaciation in Greenland. Science 264, 952–955.
Larsen, H.C., Saunders, A.D., Clift, P.D., et al., 1994b. Summary and principal results. Pro-ceedings of the Ocean Drilling Program, Initial Reports. Ocean Drilling Program. Col-lege Station, TX, pp. 279–292.
Larsen, L.M., Waagstein, R., Pedersen, A.K., Storey, M., 1999. Trans-Atlantic correlation ofthe Palaeogene volcanic successions in the Faeroe Islands and East Greenland.J. Geol. Soc. London 156, 1081–1095.
Larsen, M., Bjerager, M., Nedkvitne, T., Olaussen, O., Preuss, T., 2001. Pre-basaltic sedi-ments (Aptian–Paleocene) of the Kangerlussuaq Basin, southern East Greenland.Geol. Greenl. Surv. Bull. 189, 99–106.
Larsen, M., Piasecki, S., Stemmerik, L., 2002. The post-basaltic Paleogene and Neo-gene sediments at Kap Dalton and Savoia Halvø. Geol. Greenl Surv. Bull. 191,103–110.
Larsen, M., Nøhr-Hansen, H., Whitham, A., Kelly, S.R.A., 2005a. Stratigraphy of the pre-basaltic sedimentary succession of the Kangerlussuaq Basin. Volcanic basins of theNorth Atlantic. Rep. Geol. Surv. Den. Greenl. 62 (139 pp.).
Larsen, M., Heilmann-Clausen, C., Piasecki, S., Stemmerik, L., 2005b. At the edge of a newocean: post-volcanic evolution of the Palaeogene Kap Dalton Group, East Greenland.
29J.M. Bonow et al. / Global and Planetary Change 116 (2014) 10–29
In: Doré, A.G., Vining, B. (Eds.), Petroleum Geology. North-West Europe and GlobalPerspectives—Proceedings of the 6th Petroleum Geology Conference. Geol. Soc.Lond. pp. 923–932.
Larsen, L.M., Pedersen, A.K., Sørensen, E.V., Watt, W.S., Duncan, R.A., 2013. Stratigraphyand age of the Eocene Igtertivâ Formation basalts, alkaline pebbles and sedimentsof the Kap Dalton Group in the graben at Kap Dalton, East Greenland. Geol. Soc.Den. Bull. 61, 1–18.
Lidmar-Bergström, K., 1982. Pre-Quaternary geomorphological evolution in southernFennoscandia. Sver. Geol. Unders. C785.
Lidmar-Bergström, K., 1988. Denudation surfaces of a shield area in south Sweden. Geogr.Ann. 70A, 337–350.
Lidmar-Bergström, K., 1996. Long term morphotectonic evolution in Sweden. Geomor-phology 16, 33–59.
Lidmar-Bergström, K., Bonow, J.M., 2009. Hypotheses and observations on the origin ofthe landscape of southern Norway—a comment regarding the isostasy–climate–erosion hypothesis by Nielsen et al. 2008. J. Geodyn. 48, 95–100.
Lidmar-Bergström, K., Olsson, S., Olvmo, M., 1997. Palaeosurfaces and associated sap-rolites in southern Sweden. In: Widdowson, M. (Ed.), Palaeosurfaces: Recogni-tion, Reconstruction and Environmental Interpretation. Geol. Soc. Spec. Publ,120, pp. 95–124.
Lidmar-Bergström, K., Ollier, C.D., Sulebak, J.C., 2000. Landforms and uplift history ofsouthern Norway. Global Planet. Chang. 24, 211–231.
Lidmar-Bergström, K., Näslund, J.-O., Ebert, K., Neubeck, T., Bonow, J.M., 2007. Cenozoiclandscape development on the passive margin of northern Scandinavia. Norw.J. Geol. 87, 181–196.
Lidmar-Bergström, K., Bonow, J.M., Japsen, P., 2013. Stratigraphic landscape analysis andgeomorphological paradigms: Scandinavia as an example of Phanerozoic uplift andsubsidence. Global Planet. Chang. 100, 153–171.
Medvedev, S., Hartz, E.H., Podladchikov, Y.Y., 2008. Vertical motions of the fjord regions ofcentral East Greenland: impact of glacial erosion, deposition, and isostasy. Geology36, 539–542. http://dx.doi.org/10.1130/G24638A.1.
Medvedev, S., Souche, A., Hartz, E.H., 2013. Influence of ice sheet and glacial erosion onpassive margins of Greenland. Geomorphology 193, 36–46. http://dx.doi.org/10.1016/j.geomorph.2013.03.029.
Miller, K.G., Kominz, M.A., Browning, J.V., Wright, J.D., Mountain, G.S., Katz, M.E.,Sugarman, P.J., Cramer, B.S., Christie-Blick, N., Pekar, S.F., 2005. The Phanerozoic re-cord of global sea-level change. Science 310, 1293–1298.
Myers, J.S., Dawes, P.R., Nielsen, T.F.D., 1988. Geology, Kangerdlugssuaq, map sheet no. 13,1:500,000. Geological Survey of Greenland, Copenhagen.
Neuhoff, P.S., Watt,W.S., Bird, D.K., Pedersen, A.K., 1997. Timing and structural relations ofregional zeolite zones in basalts of the East Greenland continental margin. Geology25, 803–806.
Nielsen, T.F.D., 1981. The ultramafic cumulate series, Gardiner complex, East Greenland-cumulates in a shallow level magma chamber of a nephelinitic volcano. Contrib. Min-eral. Petrol. 76, 60–72.
Nielsen, T.F.D., Brooks, C.K., 1981. The E. Greenland rifted continental margin—an exami-nation of the coastal flexure. J. Geol. Soc. London 138, 559–568.
Nielsen, T.F.D., Soper, N.J., Brooks, C.K., Faller, A.M., Higgins, A.K., Matthews, D.W., 1981.The pre-basaltic sediments and the Lower Basalts at Kangerdlgssuaq, East Greenland:their stratigraphy, lithology, palaeomagnetism and petrology. Medd. GrønlandGeosci. 6, 1–25.
Nielsen, T.F.D., Turkov, V.A., Solovova, I.P., Kogarko, L.N., Ryabchikov, I.D., 2006. AHawaiian beginning for the Iceland plume: modelling of reconnaissance data forolivine-hostedmelt inclusions in Palaeogene picrite lavas from East Greenland. Lithos92, 83–104.
Nielsen, S.B., Gallagher, K., Leighton, C., Balling, N., Svenningsen, L., Jacobsen, B.H.,Thomsen, E., Nielsen, O.B., Heilmann-Clausen, C., Egholm, D.L., Summerfield, M.A.,Clausen, O.R., Piotrowski, J.A., Thorsen, M.R., Huuse, M., Abrahamsen, N., King, C.,Lykke-Andersen, H., 2009a. The evolution of western Scandinavian topography: a re-view of Neogene uplift versus the ICE (isostasy–climate–erosion) hypothesis.J. Geodyn. 47, 72–95.
Nielsen, S.B., Gallagher, K., Egholm, D., Clausen, O.R., Summerfield, M.A., 2009b. Reply tocomment regarding the ICE-hypothesis. J. Geodyn. 48, 101–106.
Nøhr-Hansen, H., 2012. Palynostratigraphy of the Cretaceous–lower Palaeogene sedimen-tary succession in the Kangerlussuaq Basin, southern East Greenland. Rev. Palaeobot.Palynol. 178, 59–90.
Nøhr-Hansen, H., Piasecki, S., 2002. Paleocene sub-basaltic sediments on Savoia Halvø,East Greenland. Geol. Greenl. Surv. Bull. 191, 111–116.
Nunns, A.G., 1983. Plate tectonic evolution of the Greenland–Scotland Ridge and sur-rounding regions. In: Bott, M.H.P., Talwani, S.S.M., Thiede, J. (Eds.), Structure and De-velopment of the Greenland–Scotland Ridge. New Methods and Concepts. PlenumPress, pp. 11–30.
Nutman, A.P., Kalsbeek, F., Friend, C.R.L., 2008. The Naqssugtoqidian orogen in South-EastGreenland: evidence for Palaeoproterozoic collision and plate assembly. Am. J. Sci.308, 529–572.
Ollier, C.D., Pain, C.F., 1997. Equating the basal unconformity with the palaeoplain: amodel for passive margins. Geomorphology 19, 1–15.
Pedersen, A.K., Watt, M., Watt, W.S., Larsen, L.M., 1997. Structure and stratigraphy of theEarly Tertiary basalts of the Blosseville Kyst, East Greenland. J. Geol. Soc. London 154,565–570.
Pedersen, V.K., Nielsen, S.B., Gallagher, K., 2012. The post-orogenic evolution of the North-east Greenland Caledonides constrained from apatite fission track analysis and in-verse geodynamic modelling. Tectonophysics 530–531, 318–330.
Pedoja, K., Husson, L., Regard, V., Cobbold, P.R., Ostanciaux, E., Johnson, M.E., Kershaw, S.,Saillard, M., Martinod, J., Furgerot, L., Weill, P., Delcaillau, B., 2011. Relative sea-levelfall since the last interglacial stage: are coasts uplifting worldwide? Earth Sci. Rev.108, 1–15.
Penck, W., 1924. Die morphologische Analyse. Geographische Abhandlungen. 2. ZweiteReihe, Berlin.
Rea, B.R., Whalley, W.B., Rainey, M.M., Gordon, J.E., 1996. Blockfields, old or new? Evi-dence and implications from some plateaus in northern Norway. Geomorphology15, 109–121.
Redfield, T.F., 2010. On apatite fission track dating and the Tertiary evolution of WestGreenland topography. J. Geol. Soc. London 167, 261–271.
Reusch, H., 1901. Nogle bidrag till forstaaelsen af hvorledes Norges dale og fjelde erblevene til. Nor. Geol. Unders. 32, 124–263.
Riishuus, M.S., Peate, D.W., Tegner, C., Wilson, J.R., Brooks, C.K., 2008. Petrogenesis ofcogenetic silica–oversaturated and–undersaturated syenites by periodic recharge ina crustally contaminated magma chamber: the Kangerlussuaq Intrusion, East Green-land. J. Petrol. 49, 493–522.
Sacek, V., Braun, J., van der Beek, P., 2012. The influence of rifting on escarpment migra-tion on high elevation passive continental margins. J. Geophys. Res. 117.
Sigmond, E.M.O., Gustavson, M., Roberts, D., 1984. Berggrunnskart over Norge,1:1000000. Norges Geologiske Undersøkelse, Trondheim.
Soper, N.J., Costa, L.I., 1975. Palynological evidence for the age of Tertiary basalts and post-basaltic sediments at Kap Dalton, central East Greenland. Geol. Surv. Greenland Rep.80, 123–127.
Soper, N.J., Higgins, A.C., Downie, C., Matthews, D.H., Brown, P.E., 1976. Late Cretaceous–early Tertiary stratigraphy of the Kangerdlugssuaq area, east Greenland, and theage of opening of the north-east Atlantic. J. Geol. Soc. London 132, 85–104.
Steer, P., Huismans, R.S., Valla, P.G., Gac, S., Herman, F., 2012. Bimodal Plio–Quaternaryglacial erosion of fjords and low-relief surfaces in Scandinavia. Nat. Geosci. 5,635–639.
Storey, M., Duncan, R.A., Larsen, H.C., Pedersen, A.K., Waagstein, R., Larsen, L.M., Tegner, C.,Lesher, C.E., 1996. Impact and rapid flow of the Iceland plume beneath Greenland at61 Ma. EOS 77, 839.
Storey, M., Pedersen, A.K., Stecher, O., Bernstein, S., Larsen, H.C., Larsen, L.M., Baker, J.A.,Duncan, R.A., 2004. Long-lived postbreakup magmatism along the East Greenlandmargin: evidence for shallow-mantle metasomatism by the Iceland plume. Geology32, 173–176.
Storey, M., Duncan, R.A., Tegner, C., 2007. Timing and duration of volcanism in the NorthAtlantic Igneous Province: implications for geodynamics and links to the Icelandhotspot. Chem. Geol. 241, 264–281.
Sugden, D.E., 1974. Landscape of glacial erosion in Greenland and their relationship to ice,topography and bedrock conditions. Inst. Br. Geogr. Spec. Publ. 7, 177–195.
Sugden, D.E., 1978. Glacial erosion by the Laurentide ice sheet. J. Glaciol. 20, 367–391.Surlyk, F., 2003. The Jurassic of East Greenland: a sedimentary record of thermal sub-
sidence, onset and culmination of rifting. In: Ineson, J., Surlyk, F. (Eds.), The Juras-sic of Denmark and Greenland. Geol. Surv. Denmark Greenland Bull, 1,pp. 659–722.
Swift, D.A., Persano, C., Stuart, F.M., Gallagher, K., Whitham, A., 2008. A reassessment ofthe role of ice sheet glaciation in the long-term evolution of the East Greenlandfjord region. Geomorphology 97, 109–125.
Tegner, C., Duncan, R.A., Bernstein, S., Brooks, C.K., Bird, D.K., Storey, M., 1998. 40Ar–39Argeochronology of Tertiary mafic intrusions along the East Greenland rifted margin:relation to flood basalts and the Iceland hotspot track. Earth Planet. Sci. Lett. 156,75–88.
Tegner, C., Brooks, C.K., Duncan, R.A., Heister, L.E., Bernstein, S., 2008. 40Ar–39Ar ages of in-trusions in East Greenland: rift-to-drift transition over the Iceland hotspot. Lithos101, 480–500.
Thomson, K., Green, P.F., Whitham, A.G., Price, S.P., Underhill, J.R., 1999. New constraintson the thermal history of North-East Greenland from apatite fission-track analysis.Geol. Soc. Am. Bull. 111, 1054–1068.
Wager, L.R., 1947. Geological investigations in East Greenland. Part IV. Stratigraphy andtectonics of Knud Rasmussen Land and the Kangerdlugssuaq, East Greenland.Medd. Grønland 105, 1–64.
Wager, L.R., 1965. The form and internal structure of the alkaline Kangerdlugssuaq intru-sion. Mineral. Mag. 34, 487–497.
Wager, L.R., Deer, W.A., 1939. Geological investigations in east Greenland. Part III. The pe-trology of the Skaergaard intrusion, Kangerdlugssuaq, East Greenland. Medd.Grønland 105 (4) (352 pp).
Watt, M., 1975. Photo-reconnaissance of the Blosseville Kyst between Steward Ø andSøkongen Bugt, central East Greenland. Rapp. Grønl. Geol. Unders. 75, 91–95.
Watt, W.S., Soper, N.J., Watt, M., 1976. Reconnaissance mapping of the northernBlosseville Kyst between Kap Brewster and Kap Dalton, central East Greenland.Rapp. Grønl. Geol. Unders. 80, 120–122.
Yamato, Y., Husson, L., Becker, T.W., Pedoja, K., 2013. Passive margins getting squeezed inthe mantle convection vice. Tectonics 32, 1559–1570. http://dx.doi.org/10.1002/2013TC003375.


