Embed Size (px)
Citation preview

High-Resolution Anterior Segment Optical Coherence
Tomography and Ophthalmic Applications
by
Rahul Yadav
Submitted in Partial Fulfillment
of the
Requirements for the Degree
Doctor of Philosophy
Supervised by
Professor Geunyoung Yoon
The Institute of Optics Arts, Sciences and Engineering
Edmund A. Hajim School of Engineering and Applied Sciences
University of Rochester Rochester, New York.
2012

ii
Dedication
This thesis is dedicated to my parents and teachers who have motivated me to pursue
science.

iii
Biographical Sketch
Rahul Yadav was born in the village of Matora about 100 km north east of New
Delhi, India on February 15, 1982. After finishing high school at Dewan public
school Meerut UP, India, he went to the Indian Institute of Technology, Delhi at New
Delhi, India in 2002 to pursue Bachelor of Technology in Engineering Physics. In the
fall of 2006, he joined the Institute of Optics at the University of Rochester to pursue
his graduate studies in optical engineering. He joined the advanced physiological
optics laboratory under the supervision of Professor Geunyoung Yoon in May 2007
and pursued research in intraocular imaging. His research interests lie in developing
advanced imaging systems for the anterior segment of the eye and use them to
understand ophthalmic diseases.
The following publications were a result of work conducted during doctoral study
• R. Yadav, R. Kottaiyan, K. Ahmad and G. Yoon, “Epithelium and Bowman’s layer
thickness and light scatter in keratoconic cornea evaluated using ultrahigh resolution
OCT,” accepted for publication in J. Biomed. Opt.
• R. Kottaiyan, G. Yoon, Q. Wang, R. Yadav, J. M. Zavislan and J. V. Aquavella,
“Integrated multimodal metrology for objective and non invasive tear evaluation,”
Ocular Surface 10(1) 43-50 (2012)
• R.Yadav, K. Lee, J. P. Rolland, J. M. Zavislan, J. V. Aquavella and G. Yoon,

iv
“Micrometer axial resolution OCT for corneal imaging,” Biomed. Opt. Express 2(11)
3037-3046 (2011)
• R. Yadav, K. Ahmad and G. Yoon, “Scanning system design for large scan depth
anterior segment optical coherence tomography,” Opt. Lett. 35(11) 1774-1776 (2010)
• S. Koh, C. Tung, J. V. Aquavella, R. Yadav, J. M. Zavislan and G. Yoon, “Simultaneous
measurement of tear film dynamics using wavefront sensor and optical coherence
tomography,” Invest. Ophthalmol. Vis. Sci. 51(7) 3441-3448 (2010)

v
Acknowledgements
First and foremost, I would like to thank my advisor Prof. Geunyoung Yoon for his
constant guidance through the course of my thesis research. He has been a great
mentor and motivator who encouraged me to perform my best throughout my
research work. It has been a great pleasure for me to be a part of his lab for the last
five years.
I am grateful to the members of my thesis committee, Prof. Edward Brown, Prof.
Jannick Rolland, Prof. Holly B. Hindman and Prof. Wayne H. Knox for their valuable
time and inputs. I would particularly like to thank Prof. Rolland for expanding my
understanding of OCT through interactions with her and her group members. I would
also like to thank Prof. Hindman for helping to improve my understanding of the
clinical aspects of my research.
I am also thankful to all my collaborators: Prof. Rick Libby, Prof. James Zavislan and
Prof. James Aquavella. Prof. Libby for providing us mouse models to test and
demonstrate the OCM systems; Prof. Zavislan and Prof. Aquavella for their
contribution towards the development of micrometer axial resolution OCT. A special
acknowledgement is due to Dr. Kyesung Lee for providing the spectrometer design
used in the micrometer resolution OCT, and for the numerous discussions that have
helped me learn a lot about the OCT technique.
I have been very fortunate to have great current and past lab members, Ramkumar

vi
Sabesan, Len Zheleznyak, Ranjini Kottaiyan, Cynthia Tung, Shizuka Koh, Minghan
Chen, Brett Sternfield, Aixa Alacron, Ashutosh Richchariya, Haewon Jung, Lana
Nagy, Myoung Joon Kim, Je-Sun Oh, Amy Lam, Amanda Kingston and Sushma
Bhusal, who made the lab a great place to work in. Particularly, I would like to
acknowledge Ramkumar Sabesan, my immediate senior in the lab: he was a great
friend and office-mate, and helped me get oriented in the lab as well as in Rochester
and also Len Zheleznyak, my other office-mate, with whom I had numerous fruitful
discussions. Special thanks to Ranjini Kottaiyan for her willingness to be a test
subject for optimizing OCT system performance and for her assistance with patient
management.
I would also like to acknowledge the technical staff at the Center for Visual Science
for their assistance in diverse areas of my research. A very special thanks is due to
Kamran Ahmad for his great help in developing software applications for all the
systems I built: without his help, none of my research would have been possible.
Thanks are also due to Marty Gira for his assistance in all my electronic and
mechanical needs, and to Ted Tweitmeyer for his inputs on electronics. Chris
Freemesser has been very helpful in resolving IT related issues in the lab, his help is
gratefully acknowledged. I am thankful to John Miller and Ken Madison from the
River Campus workshop for helping with numerous machine jobs. I thank Donna
Shannon and Jeffrey Harder for their assistance in mouse handling for mouse cornea
imaging experiments.

vii
I would also like to thank my colleagues in the Flaum Eye Institute ground floor:
Robin Sharma, Ben Masella, Melissa Geng, Lu Yin, Alf Dubra, Yusufu Sulai,
Hongxin Song, Jesse Schallek and Jeniffer Hunter, for making the environment at the
eye institute a pleasant one. Acknowledgement is also due to my first year homework
buddies, Krishanu Shome and Prashant Baveja, who made the late nights slogging
through problem sets less painful.
I am thankful to the administrative staff of the Center for Visual Science, Flaum Eye
Institute and the Institute of Optics for helping with numerous aspects such as
ordering items, taking care of paperwork and deadlines and answering all my related
questions. This includes Teresa Williams, Dolly Aiken, Debbie Shannon, Sara
Peterson, Michele Schultz, Marina Fabian, Joan Christian, Gina Kern, Lissa Cotter
and Betsy Benedict.
I owe my sincerest gratitude to my professors at the Indian Institute of Technology,
Delhi, Prof. K. Thyagarajan, Prof. B.P. Pal and Prof M.R. Shenoy, for introducing me
to optics and motivating me to pursue it further.
Finally, I would like to acknowledge the support of my family and friends, without
which I would not be what I am today. My parents have taught me to always believe
in myself and to do the things I consider right. They, along with my brother, have
loved and supported me through all my decisions, and I cannot thank them enough for
that. I am thankful to my parents-in-law and brother-in-law for their love, in
particular, my father-in-law for the interesting ophthalmology discussions, and my

viii
mother-in-law for her food parcels. I am grateful for the love and support of my wife
Amrita Yadav, it has kept me going even through difficult times. She has also been a
very willing subject to test the performance of my OCT systems. Lastly thanks to all
my friends, especially Karan Mehrotra, Krishanu Shome, Mahul Chakraborty,
Nilotpal Ghosh, Rashmi Sriram, Robin Sharma, Supriya Ravichandran and
Wreetabrata Kar who have made my stay in Rochester a fun and memorable one.

ix
Abstract
Despite advances in optical coherence tomography (OCT) there is still demand for
further improvements in axial and lateral resolution, imaging depth and speed. The
objectives of this dissertation were to develop advanced OCT systems that overcome
some of the current limitations of this technique and to advance our understanding of
the mechanism of human accommodation and corneal diseases by imaging the
anterior segment of the eye.
A large scan depth OCT (imaging depth > 10 mm) was developed for improving our
understanding of accommodation. Novel scanning optics, where scanning beams are
incident normal to the four ocular surfaces (anterior and posterior cornea and lens
surface) was used in the system, to maximize the OCT signal. In-vivo imaging was
carried out in two young normal subjects and the four anterior segment ocular
surfaces could be visualized. Six millimeter diameter posterior lens surface could be
imaged without the need for pupil dilation. Reduction in anterior chamber depth,
increase in lens thickness and decrease in radius of curvature in both lenticular
surfaces was observed with accommodation.
An ultrahigh axial resolution OCT was developed to quantify structural changes in
corneal diseases. The system, based on spectral domain OCT principle, used a
broadband supercontinuum light source (375 nm at center wavelength of 812.5 nm)
and was assembled in free space to avoid image degradation due to dispersion. A
spectrometer based on modified Czerny Turner configuration was used to achieve

x
relatively large scan depth (~1 mm). The experimentally measured axial resolution of
the system was 1.1 µm in corneal tissue, which allowed for the visualization and
quantification of individual corneal layers in normal and diseased corneas. The
clinical viability of the system was proven through a study on structural changes in
the epithelium and Bowman’s layer of keratoconic eyes.
In-vivo cellular imaging capability, using an optical coherence microscope, was
demonstrated by imaging stromal keratocytes and endothelial cells in the mouse
cornea. The system provided large working distance (30.5 mm) and also has the
potential of achieving larger field if imaging speed could be improved. Thus creating
the possibility of performing non-invasive follow up investigation on the cellular
structure in the mouse eyes.
These advanced OCT systems have successfully overcome the limitations of currently
available OCT systems, by providing better axial and lateral resolution and imaging
depth. With improved performance these systems can help us in understanding the
diseases pertaining to the anterior segment of the eye.

xi
Contributors and Funding Sources
This work was supervised by a dissertation committee consisting of Professor
Geunyoung Yoon (advisor) from the Flaum Eye Institute, Professor Jannick Rolland
from the Institute of Optics, Professor Wayne Knox from the Institute of Optics and
Professor Holly Hindman from the Flaum Eye Institute.
Portions of sections 3.1, 3.2, 3.3 and 3.4 have been published in – R. Yadav, K.
Ahmad, G. Yoon, “Scanning system design for large scan depth anterior segment
optical coherence tomography,” Opt. Lett. 35, 1774-1776 (2010). The control
software for the swept source OCT was developed by Kamran Ahmad from the
Center for Visual Science, University of Rochester, with the directions provided by
the author.
Portions of Section 4.1, 4.2 and 4.3 pertaining to the design of the micrometer
resolution OCT system have been published as – R. Yadav, K. S. Lee, J. P. Rolland,
J. M. Zavislan, J. V. Aquavella, G. Yoon, “Micrometer axial resolution OCT for
corneal imaging,” Biomed. Opt. Express 2, 3037-3046 (2011). The spectrometer
design for micrometer resolution OCT was adapted from the design proposed by Dr.
Kyesung Lee and Prof. Jannick Rolland from the Institute of Optics, University of
Rochester and Dr. Kevin Thompson from Synopsy Inc. Dr. Kyesung Lee and Prof.
Jannick Rolland also advised the author in the system design of micrometer resolution
OCT. The control software for the micrometer resolution OCT system was developed
xii
by Kamran Ahmad, with the inputs from the author.
A manuscript including portions of section 4.4 pertaining to the application of the
OCT system to study corneal layers in keratoconus eyes has been published as – R.
Yadav R. Kottaiyan, K. Ahmad and G. Yoon, “Epithelium and Bowman’s Layer
Thickness and Light Scatter in Keratoconic Cornea Evaluated Using Ultrahigh
Resolution OCT.” J. Biomed. Opt. 17(11), 116010 (2012). Patient consenting for
experiments in section 4.4 was carried out partly by Jeanette Zavislan and partly by
Ranjini Kottaiyan.
In Chapter 5 the mice were anesthetized by Donna Shannon. The OCM control
software was developed by Kamran Ahmad, with the inputs from the author. The
mouse stereotaxic was designed and built by Marty Gira of the Center for Visual
Science University of Rochester.
Unless mentioned above or in the thesis, the research presented here was all
performed by the author.
The research done for this thesis was supported by the research grants provided by
National Institute of Health (National Eye Institute), Research to Prevent Blindness,
Center for Emerging and Innovative Sciences and Bausch & Lomb.

xiii
Table of Contents
Title page i
Dedication ii
Biographical Sketch iii
Acknowledgements v
Abstract ix
Contributors and Funding Sources xi
Table of Contents xiii
List of Tables xviii
List of Figures xix
Chapter 1 1 Introduction
1.1 Background 1
1.2 Ophthalmic applications of OCT 5
1.2.1 Retinal OCT 5
1.2.2 Anterior segment OCT 9
1.3 Thesis overview 13
1.4 Accommodation 15
1.5 Corneal anatomy 20
1.6 Corneal cellular structure 25
1.7 Thesis outline 28

xiv
References 30
Chapter 2 44 Theory of OCT
2.1 Introduction 44
2.2 Low coherence interferometry 47
2.3 Time Domain OCT 53
2.4 Fourier Domain OCT 57
2.4.1 Theory of FDOCT 57
2.4.2 Image artifacts in FDOCT 60
2.4.3 Implementations of FDOCT 62
2.5 System design considerations 65
2.5.1 Axial resolution of OCT 65
2.5.2 Imaging depth 69
2.5.3 Sample scanning 72
2.5.4 Imaging speed 73
2.6 Summary 75
References 76
Chapter 3 79 Large scan depth anterior segment OCT
3.1 Introduction 79

xv
3.2 Scan design for improving SNR 83
3.3 Image distortion 85
3.4 Imaging performance in model eye 89
3.5 Imaging performance in the real eye 93
3.6 Anterior segment biometric changes with accommodation 96
3.6.1 Experimental protocol 96
3.6.2 Results 98
3.6.3 Discussion 101
3.7 Conclusions 105
References 106
Chapter 4 110 Micrometer axial resolution OCT for corneal imaging
4.1 Introduction 110
4.2 System design 113
4.2.1 Light source 113
4.2.2 Spectrometer 114
4.2.3 Optical system layout 117
4.2.4 k-space remapping and dispersion compensation 119
4.3 System performance 120
4.3.1 Axial and lateral resolution and depth sensitivity 120
4.3.2 Validation of thickness measurements with the OCT 121
4.3.3 In-vivo imaging of the human cornea 122

xvi
4.4 Structural changes in the epithelium and Bowman’s layer in
keratoconus eyes studies using micrometer resolution OCT 125
4.4.1 Experimental methods 127
4.4.2 Results 131
4.4.3 Discussion 135
4.5 Conclusion 139
References 140
Chapter 5 146 Optical coherence microscopy for cellular imaging in cornea
5.1 Introduction 146
5.2 System Design 151
5.2.1 Light source 152
5.2.2 Spectrometer 152
5.2.3 Beam delivery system 153
5.3 System Performance 155
5.3.1 Lateral resolution 155
5.3.2 Axial resolution 157
5.3.3 Imaging speed 158
5.4 In-vivo imaging in the living mouse cornea 160
5.5 Conclusions 164
References 165

xvii
Chapter 6 170 Summary and conclusions
6.1 Summary 170
6.2 Future directions 174
6.2.1 Lens shape change with age 174
6.2.2 Accommodating intraocular lens efficacy 175
6.2.3 Disease diagnosis in keratoconus suspects 175
6.2.4 Teardrop efficacy for dry eye 177
6.2.5 Contact lens design 177
6.2.6 In-vivo cellular imaging in human cornea 178
References 179

xviii
List of Tables
Table Title Page no.
3.1 Biometric changes in the anterior segment with accommodation in two young patients
100
4.1 Patient characteristics 128
5.1 Improvements in the signal collection by using the new CMOS sensor
159
xix
List of Figures
Figure Title Page no.
1.1 The imaging range and resolution of various biomedical imaging modalities (Adapted from W. Drexler and J.G. Fujimoto, Optical coherence tomography: technology and applications, Springer-Verlag Berlin Heidelberg 2008)
2
1.2 The schematic of the anterior segment of the human eye (Adapted from NEI)
10
1.3 Schematic of the three proposed theories on mechanism of accommodation (a) Helmholtz’s theory, (b) Tscherning/ Schachar’s theory and (c) Coleman’s theory
17
1.4 The structure of cornea showing all the six layers of the cornea (Adapted from Gray’s Anatomy)
21
2.1 Schematic of a typical fiber optic based OCT system (Adapted from W. Drexler and J.G. Fujimoto, Optical Coherence Tomography: Technology and Applications, Springer-Verlag Berlin Heidelberg 2008)
45
2.2 Schematic of a Michelson interferometer 48
2.3 Graphical representation of the low coherence interferometer signal. The interferometer signal is a sum of the DC term and interference term. The DC term is a constant, which does not depend on the optical time delay. While interference term is the product of the sinusoidal signal resulting from interference fringes and the coherence function, which determines fringe visibility. Overall the signal is an electronic pulse in time
50
2.4 Relationship between light source spectrum and interference signal obtained by the system. For a narrow linewidth light source the coherence function is broad so the interference is observed over a large optical path length differences while for a broad bandwidth light source the coherence function is narrow and interference is observed over a small optical path length difference
52
2.5
Illustration of an A-scan resulting from TDOCT with discrete reflectors (a) the real reflectivity profile in the sample, each

xx
interface acts as a delta function, (b) the detector signal a function of reference mirror location, each electronic pulse corresponds to a reflection site (c) the resulting A-scan after obtaining the envelope of the detector signal (Adapted from W. Drexler and J.G. Fujimoto, Optical Coherence Tomography: Technology and Applications, Springer-Verlag Berlin Heidelberg 2008)
55
2.6 Illustration of an A-scan resulting from FDOCT with discrete reflectors. Besides the peaks obtained for the reflective interfaces, there are mirror image terms, DC term and autocorrelation terms which lead to artifacts in the image (Adapted from W. Drexler and J.G. Fujimoto, Optical Coherence Tomography: Technology and Applications, Springer-Verlag Berlin Heidelberg 2008)
60
2.7 Schematic of a spectral domain OCT 63
2.8 Schematic of a swept source OCT 64
2.9 The comparison of the PSF obtained from an ideal Gaussian spectrum and a practical spectrum of a light source used in OCT systems (a). The deviation of the spectral shape from the ideal Gaussian shape leads to sidelobes and broadening in the PSF (b)
66
2.10 Three common scan geometries used in OCT systems, the sector scan, telecentric scan and concentric scan (Adapted from W. Drexler and J.G. Fujimoto, Optical Coherence Tomography: Technology and Applications, Springer-Verlag Berlin Heidelberg 2008)
73
3.1 (a) Conventional telecentric scan geometry (b) Scan geometry to achieve normal incidence on the posterior and anterior surface of the lens
84
3.2 The schematic of the scanning system, blue beams are incident nearly normal to the two corneal surfaces and anterior lens surface, red beams are incident nearly normal to the posterior lens surface. Concave mirror1 and focusing lens are assembled by combining semicircular halves of two different optical elements represented in gray and black. Concave mirror2 is a one-piece optical element and is same as the portion of concave mirror1, which is used for imaging the posterior surface of the lens. Zoomed in view shows the paths travelled inside the eye by the scanning beams
85

xxi
3.3 The simulated image, showing half of the eye, for (a)
telecentric scan (b) Anterior lens imaging system (c) posterior lens imaging system. ACS: Anterior Corneal Surface, PCS: Posterior Corneal Surface, ALS: Anterior Lens Surface, PLS: Posterior Lens Surface
87
3.4 The schematic of the distortion correction method. As a one-time measurement a flat surface was placed at the same location as the vertex of the anterior cornea. The difference between the profiles obtained for the first surface of the eye and the perfectly flat surface provides information on residual optical path lengths (dn). This information was use with the experimentally measured lateral coordinates (y1n,z1n) and slope (un) angle to come up with the corrected profile of the first interface
88
3.5 Schematic of the model eye which was constructed by an artificial cornea and lens made of PMMA. The dimension were matched with the Gullstrand model eye
90
3.6 The schematic of the large scan depth OCT 91
3.7 Images of the model eye obtained by (a) telecentric scan (b) Anterior lens imaging system (c) posterior lens imaging system. The arrow shows the reference mirror location. The DC term and mirror images were removed manually from the images
92
3.8 Distortion corrected surface profiles; solid curves represent the raw profile and dashed curves are circular curves fitted to the raw data. The dimensions obtained from curve fitting, shown in black, are compared with actual values shown in parenthesis
93
3.9 The voltage signal given to the scanning mirror, so that both anterior and posterior lens surface can be imaged in a single scanner sweep. The positive voltages were used for imaging the anterior lens surface while negative voltages were used for posterior lens surface
94
3.10 (a) A typical image obtained by the large scan depth OCT. The left side of the image is obtained from the anterior lens surface system while the right side of the image is obtained by posterior lens surface system. (b) The distortion corrected surface profiles obtained by the system and the fitted curves
95
xxii
3.11 The experimental protocol to measure biometric changes in
the anterior segment with accommodation. Since working distance of large scan depth OCT was small, accommodation was stimulated in the other eye. (a) relaxed state (b) accommodated state. L1: 2D lens to acute target at infinity, L2: -5D trials lens to stimulate accommodation. Accommodation leads to involuntary convergence of the eye so a fixation spot was provided to the imaged eye. When accommodation stimulus was provided the subject was asked to translate the target laterally and bring the fixation spot at the center of the target. This ensured that the gaze of the imaged eye was always towards the system
97
3.12 The surface profiles obtained by the system at 0 D in blue and 5 D in red for the two subjects (a) and (b) respectively
99
4.1 The spectrum of the supercontinuum light source. The blue shaded portion was used for imaging
114
4.2 The spectrometer PSF for two wavelengths separated by the required spectral resolution calculated from Eq. 4.1 for (a) 625 nm (b) 700 nm (c) 800 nm (d) 900 nm (e) 1000 nm
116
4.3 Spectral resolution predicted by ray tracing compared with required spectral resolution. The spectral resolution requirement is satisfied at all wavelengths except between 625 nm and 690 nm
117
4.4 Full schematic of the OCT system. C: Collimator, BF: Bandpass filter, BS: Beamsplitter, VND: Variable neutral density filter, SM: Scanning mirror, OL: Objective lens, S: Sample, M: Reference mirror, FL: Focusing lens, CM1: First concave mirror, G: Linear grating, CM2: Second concave mirror, CL: Cylindrical lens, D: Linescan CCD
118
4.5 (a) The axial PSF of the OCT measured experimentally by a mirror in the sample arm shown in blue, the PSF estimated theoretically from the envelope of spectral interference fringes shown in dashed red. The FWHM of the axial PSF is estimated to be 1.52 mm in air, which corresponds to 1.11 mm in corneal tissue. (b) Sensitivity roll off of the system evaluated by measuring the axial PSF at different depths
121

xxiii
4.6
The images obtained for the photoresists (n = 1.6) of thickness (a) 0.91 mm (b) 1.36 mm (c) 3.37 mm and (d) 4.40 mm and the peaks for photoresist thickness of (e) 0.91 mm (f) 1.36 mm (g) 3.37 mm and (h) 4.40 mm
122
4.7 OCT image of the cornea from a normal patient. TL: Tear Layer, EP: Epithelium, BL: Bowman’s Layer, SR: Stroma, DM: Descemet’s Membrane, EN: Endothelium
124
4.8 (a) Image of the contact lens wearer’s cornea three minutes after a drop of artificial tear was instilled in the subject’s eye, (b) Zoom-in view of the PLTF, two interfaces can be clearly visualized, (c) Zoom-in view of the PoLTF, two interfaces are distinguishable
125
4.9 OCT image analysis. Corneal image obtained by the OCT system showing corneal top layers. TF: Tear film, EL: Epithelium, BL: Bowman’s layer, SR: Stroma. (b) The white dashed curves indicate the identified interfaces of the epithelium and Bowman’s layer. Thickness profiles were obtained by measuring radial distances as shown by the arrows. Sensitivity normalized signal intensity averaged over a region 2.5 mm wide and of thickness of 20 µm and 10 µm respectively, shown in shaded gray, in epithelium and Bowman’s layer was used to measure light scatter. See Figure 4.10 (a) for an un-annotated version of the same image
130
4.10 Images obtained by the system for a normal (a) and three KC patients (b), (c) and (d) with increasing corneal coma, a measure of disease severity. A reduction in the epithelium and Bowman’s layer thickness can be seen for KC eyes. In most severe KC patient (d) the interfaces of Bowman’s layer with epithelium and stroma are difficult to distinguish. Hyper-reflective centers, visible as white patches, can be seen in the Bowman’s layer in one of the KC patient (c)
132
4.11 Scatter plot showing mean epithelium (a) and Bowman’s layer (b) thickness plotted against corneal coma (4 mm pupil size) where corneal coma was used to represent the KC disease severity. The epithelium and Bowman’s layer thickness in KC eyes was significantly smaller than normal eyes (p = 0.023 for epithelium and p = 0.006 for Bowman’s layer). A negative correlation was observed between epithelium thickness and disease severity (R2 = 0.50) while no correlation was found for Bowman’s layer thickness (R2 =
133
xxiv
0.15)
4.12 Scatter plot showing epithelium (a) and Bowman’s layer (b) thickness variability plotted against corneal coma (4 mm pupil size). The thickness variability was significantly higher in epithelium (p = 0.004) but not in Bowman’s layer (p = 0.090). The correlation with disease severity was statistically strong for epithelium (R2 = 0.61), but weak for Bowman’s layer (R2 = 0.08)
133
4.13 The plot showing local epithelial thickness (a) and Bowman’s layer thickness (b), averaged over the subjects, as a function of the lateral distance from the apex for normals and two KC groups. KC group1 has eyes with corneal coma (4 mm pupil) < 1 µm while KC group 2 eyes have corneal coma > 1 µm. A clear pattern of inferior epithelial thinning was found in both the KC groups with the inferior thinning being significantly larger in KC group 2. The epithelial thickness in the inferior cornea was significantly smaller than the superior cornea only for KC group 2 (p = 0.001). No specific pattern was observed in the Bowman’s layer thickness profile for all the groups
134
4.14 Bar graph comparing scatter in epithelium (a) and Bowman’s layer (b) for normal and KC eyes. The increase in scatter was statistically significant (p = 0.036) only for the Bowman’s layer
135
5.1 The graph showing the axial and lateral resolution of OCT and IVCM as function of the NA of the objective lens
149
5.2 OCM system schematic 154
5.3 The spot diagram and two point PSF of the system measured
using ray tracing at 5 field positions starting from center to 1mm
156
5.4 The image of a CMOS sensor obtained by the OCM. The distance between the two bright squares was 2.2 mm
157

xxv
5.5
The axial PSF of the OCM measured experimentally by a mirror in the sample arm shown in blue, the PSF estimated theoretically from the envelope of spectral interference fringes shown in dashed red. The FWHM of the axial PSF is estimated to be 4.4 µm in air corresponding to 3.2 µm in corneal tissue. Theoretically predicted PSF had FWHM of 4 µm in air. The mismatch could be because of the dispersion mismatch between the sample and reference arm and improper k-space remapping
158
5.6 Three views of the mouse stereotaxic system used to minimize the eye movement. The system consists of the ear/cheek plugs, nose holder and bitebar to hold the head steady
161
5.7 En face images showing the cellular structure in the (a) epithelium, (b) stroma and (c) endothelium obtained using OCM. The images for epithelium and endothelium are in log scale while the images for keratocytes are in linear scale. These images are compared with the previously obtained images of (d) epithelium, (e) stroma and (f) endothelium obtained using IVCM (Labb´e et al. Current Eye Research, 31:501–509, 2006)
163
5.8 3D rendering of the stroma in the mouse eye at the junction of cornea and limbus
164

1
Chapter 1 Introduction
1.1 Background Developments in medical imaging technologies have led to improved diagnosis and
clinical management of the diseases. These technologies have also helped in
advancing our understanding of the pathogenesis of the disease and enabled the
development of novel treatment therapies. Figure 1.1 compares various biomedical
imaging techniques in terms of resolution and imaging range. Minimally invasive
imaging techniques, such as X-ray computed tomography (CT) [1], magnetic
resonance imaging (MRI) [2], radioisotope positron emission tomography (PET) [3]
and ultrasound biometry (UBM) [4] have revolutionized medical research during the
past decades by providing three-dimensional visualization of biological tissues in-
vivo. However, their spatial resolution is typically limited from tens of micrometers
to a few millimeters in standard clinical practice, hence visualizing smaller structures
in a biological sample is difficult using these techniques. On the other hand, optical
imaging techniques such as conventional confocal, fluorescence and two or multi
photon microscopy [5] can obtain images with high axial (<10 µm) and transverse

2
(<1 µm) resolution, but their depth penetration (<1 mm) and field of view (<0.5 mm)
are limited.
Figure 1.1 The imaging range and resolution of various biomedical imaging modalities (Adapted from W. Drexler and J.G. Fujimoto, Optical coherence tomography: technology and applications,
Springer-Verlag Berlin Heidelberg 2008)
Optical Coherence Tomography (OCT) is a powerful biomedical imaging technique,
capable of generating two dimensional cross sectional and three dimensional
volumetric images of the living biological tissue at micrometer scale resolution
noninvasively [6,7]. The main advantages that OCT provides over other imaging
modalities mentioned above are its high axial resolution (1-10 µm) and faster imaging
speed (~400,000 A-scans/s) with increased depth penetration (>10 mm) and large
field of view (>10 mm). Pertaining to these advantages, OCT has been useful under
clinical situations where excisional biopsies cannot be performed. Moreover, its high
3
resolution helps in detecting smaller features, which would otherwise be
unidentifiable under standard biopsy examination, and its high speed allows us to
monitor dynamic biological processes in real time.
OCT is based on low coherence interferometry, a technique, which was used in the
1980s for measuring optical echoes and backscatter in optical fibers [8,9]. Fercher et
al. first demonstrated the biological application of a low coherence interferometer to
measure the axial length of the eye in 1988 [10]. First OCT imaging was
demonstrated in 1991 by Huang et al. [6], where human retina and coronary artery
were visualized ex vivo with an axial resolution of 15 µm. Subsequently in 1993, in-
vivo retinal imaging using OCT was carried out independently by Fercher et al. [11]
and Swanson et al [12]. Shortly after that in-vivo imaging of the anterior segment of
the eye was demonstrated by Izzat et al. in 1994 [13]. Due to the robustness of OCT
in the clinical settings, Carl Zeiss Meditec introduced the technology commercially in
1996 and since then OCT has become a standard diagnostic tool in the eye clinic.
By using long wavelength light sources [14], the application of OCT imaging was
extended to tissues which are highly scattering such as in dermatology [15,16],
dentistry [17,18] and intravascular imaging [19]. By means of flexible imaging
probes OCT imaging was also integrated with endoscopy [20,21]. A number of
applications of OCT were developed for functional imaging, such as, Doppler OCT
for gathering blood flow information simultaneously with tissue images [22],
polarization sensitive OCT for measuring tissue birefringence [23] and tissue

4
absorption measurement with a spectroscopic OCT [24]. In 1999 Drexler et al.
demonstrated first ultrahigh resolution OCT with submicron axial resolution using a
supercontinuum light source, since then the axial resolution of OCT systems has
improved from a typical axial resolution of 10-15 µm to 0.7-5 µm.
For about a decade after the introduction of OCT in 1991, the principal
implementation of OCT was time domain OCT (TDOCT), where the mirror in the
reference arm is translated axially to obtain the structural information at different
depths [6]. In the last decade the technology has moved towards Fourier domain OCT
[7] where the reference arm is kept stationary and the depth information is obtained
by taking the Fourier transform of the spectrally resolved interference fringes in the
detection arm. Although the first implementation of Fourier domain OCT was carried
out in 1995 by Fercher et al. [7], suggesting that this approach allows for much faster
scanning rates, the approach did not receive wide popularity in the OCT community
until 2003 when the advantage of improved signal to noise ratio (SNR) in this
approach was proven [25,26,27]. Since then Fourier domain OCT has revolutionized
the area of OCT with the realization of high-speed 3D volumetric imaging [28] where
the imaging speeds are now reaching up to 5,000,000 A-scans/s [29]. Also with the
advent of broadband light sources, ultrahigh resolution (<4µm axial resolution)
imaging has become a norm in the research community [30]. These new
developments have revolutionized the scope of OCT and new applications are being
found for this robust imaging modality in various areas of medicine. The work done

5
for this thesis has been mainly targeted towards ophthalmic applications of OCT;
hence from hereon we will be mainly focusing on ophthalmic OCT.
1.2 Ophthalmic applications of OCT
Ophthalmology and vision science are the fields where OCT has been used most
successfully. It has now become a standard care device for diagnosing and monitoring
diseases of the eye. There are two main reasons for the success of OCT in imaging
the eye. Firstly since the ocular tissue is clear and transparent, it offers an ideal
medium for the OCT light beam to pass through and access anterior and posterior
segment of the eye for imaging. Secondly the size of the structures in the eye matches
well with the typical imaging range and resolution provided by the OCT. The
ophthalmic OCT systems are generally characterized into retinal OCT and anterior
segment OCT, based on the portion of the eye they are used for imaging.
1.2.1 Retinal OCT
Retina is the photosensitive tissue at the back of the eye, which senses the image
formed by the optics of the eye. As the light strikes the retina it causes a series of
chemical and electrical processes that result in the triggering of nerve impulses to be
sent to the brain for image perception. Retina is composed of ten different layers, with
nine of these being the layers of neurons connected by synapses. The only
photosensitive neurons among these are the photoreceptor cells which are composed
of rods and cone cells. The tenth layer, retinal pigment epithelium, nourishes the

6
photoreceptor cells. The neural signal generated by the photoreceptor layers
undergoes processing in the other layers before being sent to the brain. A healthy
retina is essential in maintaining a good visual function. Hence clinicians have always
been interested in instruments capable of monitoring the retinal health with
minimized invasiveness.
Prior to the advent of retinal OCT, fundus photography and ultrasonography were
frequently used techniques in the clinic for diagnosing retinal diseases. Fundus
photography provided a direct en-face view of the fundus including retina, macula,
optic disc and the posterior pole [31]. The retinal diseases were diagnosed by visually
inspecting these fundus photographs. Combining this with angiography, by
intravenously injecting fluorescent dyes, provided high contrast images of the retinal
vasculature revealing blood flow dynamics in the retina [32,33]. This technique,
however, does not provide detailed information about retinal cross sectional anatomy
and has a poor resolution to visualize small features in the retina. Ultrasonography
can provide cross-sectional information of the retinal structure [34]. However the
resolution of these systems is typically around 150 µm, which does not allow for the
visualization of intraretinal layers. Hence its application is limited to just measuring
the changes in the overall retinal thickness. Moreover ultrasonography needs physical
contact with the eye for imaging. High frequency ultrasound did improve the axial
resolution of these systems to 20-30 µm [35], but due to attenuation of high frequency
sound waves in the ocular media their penetration depth was just about 4 mm,
limiting their application only to the anterior segment imaging. Scanning laser

7
ophthalmoscope (SLO) is another major ophthalmic device available for retinal
imaging, where a focused laser spot is raster scanned on the retina and the
backscattered light is collected to generate an en-face view of the fundus with high
transverse resolution [36]. However, the cross-sectional information on the
intraretinal layers can be obtained only by carrying out multiple measurements while
axially shifting the laser beam focal spot through the layers.
With the development of OCT there has been a revolution in the area of the
diagnostics and therapeutics of retinal disorders. This powerful technique can non-
invasively acquire cross-sectional images of the retina, in-vivo. The improvements in
the image acquisition speeds have allowed for three-dimensional rendering of retinal
volumes [37] with high axial and lateral resolution providing enhanced visualization
and interpretation of the intraretinal layers without the need for shifting the focus
[38,39]. Additional improvements in the segmentation algorithms [40,41] have
enabled better quantification and delineation of intraretinal layers, comparable or
better than that of conventional histopathology. Pertaining to these advantages OCT
has been commercialized and increasingly used to evaluate and manage a variety of
retinal diseases [42]. Successful applications include studying the mechanism of
glaucoma [43,44], age related macular degeneration [45], retinitis pigmentosa [46]
and Stargardt disease [47] and monitoring the efficacy of the therapy on these
diseases [48,49,50].

8
Retinal OCT is an evolving field and new technological developments are expanding
its applicability to new retinal diseases. Traditionally for the retinal OCT systems,
light sources emitting at 800 nm were used since the wavelength lies in the
transmission window of the ocular tissue and is invisible to the eye. However imaging
the deeper choroidal structures of retina was difficult due to higher light scatter at this
wavelength. Broadband light sources emitting at around 1050 nm have been
developed and used in retinal OCT to overcome this problem. Longer wavelength
light scatters less hence light penetration into the retina is enhanced and choroidal
structures can be visualized [51,52]. Long wavelength retinal OCT has a great
potential in early diagnosis of neovascularization in age related macular degeneration,
as the pathological signs first appear at the retinal pigment epithelium and choroidal
interface [53]. The long wavelength retinal OCT has also proven to be effective in
improving the OCT performance for cataract patients due to reduced losses from
scattering by the crystalline lens [54].
To visualize cellular structure in the retina the retinal OCT has been combined with
adaptive optics [55,56]. A diffraction limited focused spot on the retina was obtained
using a large stroke deformable mirror to correct for the ocular higher order
aberrations and a specially designed dispersion compensating lens to remove the
chromatic aberrations of the human eye. These adaptive optics OCT systems have
enabled three-dimensional visualization of microscopic blood vessels and cone
photoreceptor mosaic in the retina.

9
In terms of future developments in retinal OCT, integrating retinal OCT with
functional imaging holds a lot of promise. Combining retinal OCT with Doppler OCT
could be used for mapping of retinal vasculature network and flow dynamics [57].
Combining Doppler OCT with 3D visualization will ultimately lead to quantitative
mapping of the vascular network in the retina. Polarization sensitive retinal OCT can
be used to diagnose glaucoma related atrophy of the retinal nerve fiber layer by
measuring tissue birefringence [58]. There has also been an increasing interest to use
OCT based physiological measurements of the neural activation in the retina.
Physiological processes such as membrane depolarization, cell swelling and altered
metabolism lead to changes in the optical properties of the retina such as reflectivity
and scatter. Since OCT is sensitive to these changes it may be used to measure such
changes non-invasively. OCT can provide significant advantages over currently used
physiological test such as electroretinography and electrooculography, which have
limited depth selectivity and require physical contact with the biological tissue.
Physiological response to light stimulation in the retina has been demonstrated with
OCT [59]. Ultimately combining this with ultrahigh resolution AO OCT should make
studying physiological response of single cells in the retina possible.
1.2.2 Anterior segment OCT
The anterior segment of the eye is responsible for forming a sharp image on the
retina. It mainly consists of the cornea, aqueous humor, the iris and the crystalline
lens [60] (Figure 1.2). The cornea is the transparent front part of the eye, which
constitutes 70% of the optical power of the eye. The rest of the power is contributed

10
by the crystalline lens, which also has the capability to change its power to shift the
focus of the eye from far to near or vice versa. The iris controls the pupil size hence
regulating the amount of light entering the eye. Just like retina significant effort has
been put in to develop instruments to evaluate and monitor the health of the anterior
segment of the eye.
Figure 1.2. The schematic of the anterior segment of the human eye (Adapted from NEI)
The slit lamp biomicroscope has traditionally been and even currently is the primary
tool used in the clinic for anterior segment examination. However objective
quantitative assessment of the anterior segment structures by this technique is limited
because of its poor resolution (>50 µm) [61,62]. High frequency ultrasound has better
axial resolution than slit lamp (20-30 µm) [34], however this technique requires
touching the sample, causing inconvenience to patient. Although the first OCT was
developed for retinal imaging, it did not take long for the researchers to realize its
potential for use in the anterior segment. OCT can provide better resolution images of
the anterior segment than both the slit lamp and the ultrasound. Also being a non-
contact imaging modality, OCT is convenient for the patient and there is no risk for
contamination.

11
The retinal OCT technology had to be modified to suit for anterior segment
applications. To maximize the signal from the anterior segment, the beams were
focused in the anterior segment as opposed to retina. For avoiding strong reflections
from the air-cornea interface and image distortion, telecentric scan geometry was
used (see section 2.4.2). Initially most of anterior segment OCT systems used much
longer wavelength light sources (1310 nm) than those used for retinal OCT. This was
because the light absorption of the ocular media is much higher at 1310 nm, which
means that while imaging the anterior segment, the light reaching the retina is
significantly reduced. Hence the risk of damaging the retina is less and about 8 times
more power can be sent into the eye. Since the axial resolution of the OCT is directly
proportional to the wavelength used (see section 2.3) using smaller wavelengths
provide better axial resolution. Hence with the arrival of highly sensitive linescan
cameras, 800 nm wavelength light sources are also used for anterior segment imaging
[63]. This has led to the development ultrahigh resolution anterior segment OCT
[64,65,66], which is playing an instrumental role in corneal research.
Anterior segment OCT has been commercialized and used as a prominent diagnostic
and therapeutic tool in the eye clinic. It is now frequently used in the clinic to
measure the thickness map of the cornea [67]. These thickness maps can be used to
monitor corneal edema and endothelial function [68,69] and can reveal abnormal
patterns in the cornea resulting from diseases such as keratoconus [70,71]. Since a
weakened or thin corneal structure has high risk of developing keractesia or
progressive thinning and bulging forward of the cornea after refractive surgery, these
thickness maps can be used for pre surgical patient evaluation of the safety of corneal
refractive surgery [72]. OCT is also used post-operatively after refractive surgery to
monitor LASIK flap thickness and the residual stromal bed to diagnose any

12
complication that might result from the surgery [73]. Other applications of corneal
imaging with OCT include corneal power measurement [74] and quantifying corneal
scarring, dystrophy and opacity resulting from corneal surgery and diseases [64,75].
Anterior segment OCT has been proven effective for anterior chamber biometric
measurements. Surgeons performing phakic intraocular lens implantation are utilizing
this capability for phakic intraocular lens fitting. Phakic intraocular lens implantation
has recently become a popular procedure for correcting myopia, which cannot be
corrected by corneal procedures such as LASIK or PRK [76,77]. Unlike the cataract
surgery, in intraocular lens implantation the crystalline lens is not extracted, therefore
the fitting of the intraocular lens is very crucial and quite challenging. Improper
fitting of the intraocular lens might lead to complications such as cataract,
postoperative uveitis, postoperative elevated intraocular pressure, decentration,
symptomatic halos, and pupil ovalization [78,79,80]. Anterior segment OCT with the
capability to accurately carry out biometric measurement of the anterior chamber can
improve the precision of intraocular lens fitting [81,82] thus, enhancing the safety of
intraocular lens implantation.
The anterior segment biometry capability of the OCT has also been very useful in
early detection of angle closure glaucoma [83,84]. Angle closure glaucoma is a
leading cause of blindness around the world and occurs in the eyes with shallow
anterior chamber where the iris blocks aqueous fluid outflow. The main indication of
the blockage is a small anterior chamber angle (i.e. the angle between the cornea and
the iris). Prior to OCT, gonioscopy [85] was the primary device used for evaluating
anterior chamber angle. However gonioscopy, being a subjective instrument, required
13
extensive training for interpreting the images. OCT provides direct cross-sectional
visualization of the anterior chamber with high resolution, which enables accurate
objective assessment of the anterior angle.
Anterior segment OCT is an active area of research and new innovations are being
made to improve the technology further so that it could be used to solve clinical
problems which cannot be currently addressed due to device limitations. For future
anterior segment OCT systems there is great research thrust towards improving axial
and lateral resolution, imaging depth and speed. The work done for this thesis is
aimed at achieving these improvements in OCT for anterior segment research. In the
next section we will briefly overview the main aims of this thesis work.
1.3 Thesis Overview
The work done for this thesis aims at developing advanced OCT systems with
improved resolution and imaging depth to overcome the limitations of current
anterior segment OCT systems and use them to improve our understanding of the
mechanism of accommodation and corneal disease. The work can be divided into
three main aims.
The first aim of the proposed thesis was to develop an OCT system that can image
the entire anterior segment of the eye starting from the anterior corneal surface to the
posterior lens surface and use it to improve our understanding of human
accommodation. Accommodation is the process by which the eye changes its focus to
maintain a clear view of the objects at far as well as near. The eye realizes this by

14
changing the shape of the crystalline lens. Although it is well known that the lens
changes its shape during accommodation, exactly how it changes its shape is still
being debated. Most of the confusion arises due to the lack of the capability to image
the entire anterior segment in high resolution during single measurement and the
inability to visualize structures behind the iris. Our first aim is to overcome these
challenges and answer some of the current questions related to the mechanism of
accommodation.
The second aim of the proposed thesis was developing an OCT system with
improved axial resolution, which could quantify thickness profiles of individual
corneal layers and use it to characterize corneal diseases. Cornea is composed of six
different layers, which play a crucial role in maintaining a properly functioning
cornea (see section 1.5 for details). Dysfunction of these corneal layers can lead to
diseases such as keratoconus, dry eye and Fuch’s dystrophy. Hence to understand the
mechanism of these diseases and evaluate the efficacy of therapeutic interventions
imaging these corneal layers is important. Imaging these layers, however, has been
difficult due to limited resolution of the currently available imaging modalities.
Through our second aim we have overcome this limitation of the current OCT
systems by developing a micrometer axial resolution OCT, which can visualize all the
corneal layers in-vivo. We have also demonstrated the clinical viability of this OCT
by characterizing structural changes in the individual corneal layers with a corneal
disease, keratoconus.

15
The third aim of this thesis was to demonstrate the feasibility of in-vivo cellular
imaging in the cornea using an optical coherence microscope (OCM). In-vivo cellular
imaging in the cornea has traditionally been carried out using in-vivo confocal
microscope (IVCM). However the application of IVCM in clinical studies has been
limited because of its limited field size and working distance. OCM is a recently
developed cellular imaging technique to address the difficulties of IVCM. The
application of OCM, however, has been limited to ex-vivo imaging of extracted
tissue. The third aim of this thesis was set to demonstrate for the first time, the
feasibility of cellular imaging in mouse cornea in-vivo using an OCM.
In the rest of this chapter we will review the background of the problems addressed in
this thesis, including (1) the theories on the mechanism of human accommodation and
the difficulties in verifying these theories (2) the morphology of cornea and the
function of individual corneal layers and (3) the cellular structure of the cornea and
the challenges in imaging and quantifying it.
1.4 Accommodation
Accommodation is the eye’s ability to dynamically adjust its optical power to
maintain a clear image of an object as it changes distance from the eye. Despite
various theories being proposed, the mechanism of accommodation is still
controversial and there is a lack of consensus on which theory most accurately
describes the process.

16
By far the most widely accepted theory is the Helmholtz theory [86] as demonstrated
in Figure 1.3(a). Helmholtz suggested that when focusing at near, the contraction of
the circular muscle fibers of the ciliary muscle decreases the equatorial
circumlenticular space, which reduces zonular tension. This then allows the lens to
round up, resulting in an increase in optical power. In contrast, when relaxation of the
muscle occurs, an increase in the equatorial circumlenticular space and zonular
tension occurs which results in flattening the lens curvature (reduced lens power).
The limitation of Helmholtz theory, however, is that it is not consistent with the eye’s
negative shift of the spherical aberration observed during accommodation [87].
Tscherning proposed a mechanism, which is consistent with the change in spherical
aberration during accommodation. He suggested that that contraction of the ciliary
muscle leads to an increase in zonular tension due to the outward movement of the
ciliary body. This increased zonular tension results in the flattening of the periphery
of the lens while the central part of the lens bulges forward [88]. Schachar has
proposed a modification of Tscherning’s theory (Figure 1.3(b)), according to which,
during accommodation, instead of tension to increase uniformly on all the zonules,
the anterior and posterior zonules simultaneously relax while the equatorial zonules
stretch [89].
Yet another theory by Coleman mentions that lens, zonules and anterior vitreous form
a diaphragm between the anterior and vitreous chambers of the eye. Ciliary muscle
contraction creates a pressure gradient between the vitreous and aqueous

17
compartments causing anterior movement of the lens along with steepened radius of
curvature in the center of the lens and slight flattening of the peripheral lens (Figure
1.3(c)) [90]. This theory hence is a combination of both shape change and translation
of the crystalline lens. Although this concept has been applied to most of the current
accommodating intraocular lenses (IOL) available in the market, little objective
evidence for this phenomenon has been published.
Figure 1.3 Schematic of the three proposed theories on mechanism of accommodation (a)
Helmholtz’s theory, (b) Tscherning/Schachar’s theory and (c) Coleman’s theory.
18
To clarify the debates regarding mechanism of accommodation, studies have been
carried out on enucleated lenses, where stretching forces were applied on the lenses
through a mechanical set up mimicking the ciliary body/zonular complex. An
increase in focal length with stretching of the lens was observed in the young eyes in
one study [91], which is consistent with the Helmholtz’s theory of accommodation. In
another study supporting Schachar’s theory a steepening at the center and flattening at
the periphery with stretching the lens was observed [92].
There have also been studies using animals to understand the mechanism of
accommodation [93,94,95,96]. In rhesus monkeys the mechanism of accommodation
is similar to humans [97,98,99] and the development of presbyopia happens at around
the same relative age with similar etiology [100]. In these experiments the monkeys
were generally iridectomized and the accommodation was stimulated either
pharmacologically or by stimulating the nerve, which controls ciliary body movement
(Edinger-Westphal). A decrease in the lens diameter and a centripetally inward
movement of the ciliary processes has been observed with accommodation,
supporting the Helmholtz theory.
The natural, pharmacological and Edinger-Westphal accommodative response,
however, might be different, which can lead to errors in the measurement. Also there
might still be some difference in the accommodative response in the humans and
monkeys. Therefore direct visualization of the natural or artificial lens movement and
its shape changes during accommodation, in-vivo in the human eyes is the key to

19
these studies. In-vivo MRI studies have observed inward movement of the ciliary
body with accommodation in the human eyes, suggesting a decrease in the zonular
tension with accommodation [101]. The accuracy of the MRI measurements although
is limited due to the poor resolution of MRI (around 100 µm).
Most of the experimental evidence till now support the Helmholtz theory of
accommodation. To explain negative spherical aberration induction with
accommodation other factors such as GRIN (gradient refractive index) structure and
asphericity of the lens surfaces have been invoked [102,103]. The scope of these
studies however has been limited, as the experimental data on shape change of
crystalline lens with accommodation is scarce and limited to mostly extracted lenses.
Recently in-vivo measurement of these factors has been carried out using MRI [104]
and Scheimpflug photography [105,106]. However due to limited resolution the
measurements of MRI study are limited only thickness values while Scheimpflug
photography measurements require pupil dilation for measurement which can modify
the accommodative response.
OCT can be used for capturing high-resolution images of the anterior segment and
measure the lens asphericity with higher accuracy. Although the conventional OCT is
capable of imaging the crystalline lens [107], it cannot provide accurate information
on the axial movement of the lens during accommodation because of the absence of a
reference in an image e.g. cornea. To better understand the mechanism of
accommodation, the ability to image the entire anterior segment is necessary since
cornea could then be used as a reference to measure the axial motion of the lens.

20
However, according to Gullstrand eye model [108] the total axial length of the
anterior segment, from the apex of the anterior cornea to the posterior lens surface, is
approximately 7.7 mm (10.2 mm optical path length at n =1.33), which is
considerably large depth for a conventional OCT to image. There have been three
proposed methods to overcome this problem; (1) Increasing OCT imaging depth by
mirror image removal [109,110]. (2) Combining simultaneous images from two
different OCT systems at different wavelengths [111]. (3) Using an optical switch,
toggle between focusing at two different axial locations and accordingly match the
reference mirror location [112]. Imaging performance of all these methods is still
limited by relatively low SNR due to the reduced strength of OCT signal from the
peripheral area of the lens and the occlusion of lens periphery by iris. Dilation drops
can be used to unblock the lens periphery but the accommodative response with a
dilated pupil may not be identical to that with the natural pupil, moreover in elderly
patients it is often difficult to dilate the pupil. Hence a new method is required to
image the entire anterior segment of the eye using an OCT, with the capability of
imaging large lateral portion of the crystalline lens without pupil dilation.
1.5 Corneal Anatomy
Cornea is the transparent front part of the eye that accounts for about 70% of the
power of the eye. Hence maintaining a healthy and transparent cornea is critical for
obtaining a sharp image on the retina. Cornea maintains its transparency through a
21
uniform and well-organized microstructure, which is completely devoid of the blood
vessels. It gets its oxygen supply directly from the air while the nutrition is
predominantly provided by the aqueous humor.
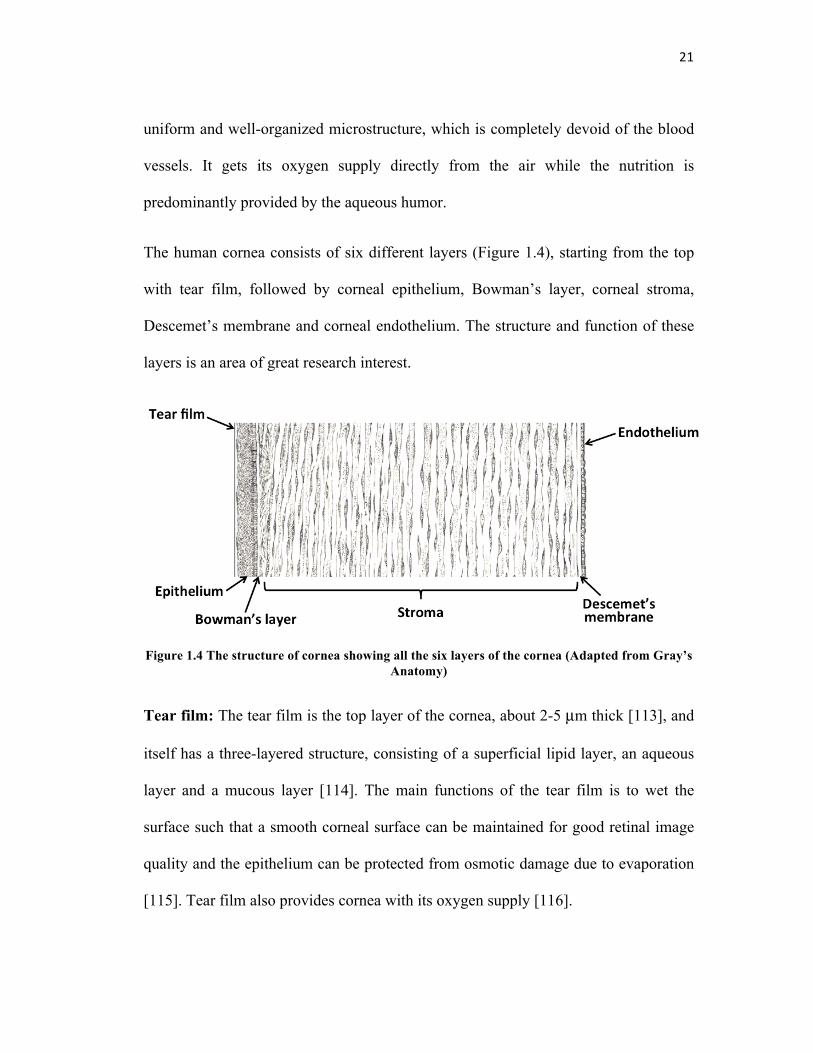
The human cornea consists of six different layers (Figure 1.4), starting from the top
with tear film, followed by corneal epithelium, Bowman’s layer, corneal stroma,
Descemet’s membrane and corneal endothelium. The structure and function of these
layers is an area of great research interest.
Figure 1.4 The structure of cornea showing all the six layers of the cornea (Adapted from Gray’s Anatomy)
Tear film: The tear film is the top layer of the cornea, about 2-5 µm thick [113], and
itself has a three-layered structure, consisting of a superficial lipid layer, an aqueous
layer and a mucous layer [114]. The main functions of the tear film is to wet the
surface such that a smooth corneal surface can be maintained for good retinal image
quality and the epithelium can be protected from osmotic damage due to evaporation
[115]. Tear film also provides cornea with its oxygen supply [116].

22
Corneal epithelium: Corneal epithelium is the layer underneath the tear film, which
is about 50 µm thick [117]. It is composed of about 6 cell layers where the cells are
constantly been shed and generated, such that the layer totally regenerates itself in
one or two weeks [118]. The cells are well packed and interdigitated [119]. This
makes the epithelium a remarkably efficient mechanical obstacle for anything that is
lipid insoluble [120] including potential infection causing microorganisms
Bowman’s layer: Bowman’s layer is located between the epithelium and the stroma
and is about 10-15 µm thick [117]. It is acellular and is composed of strong collagen
fibers [121], which makes this layer rigid thus helping the cornea in maintaining its
shape. It has been hypothesized that Bowman’s layer is formed by cytokine-mediated
interactions between corneal epithelial cells and keratocytes during early
development and continuing into adulthood [122].
Stroma: Stroma constitutes the bulk of the cornea; it is about 400 µm thick [117] and
is composed of about 200 plates of collagen fibrils. The fibers are arranged parallel to
each other in a lamella but are at right angles between the adjacent lamellae [123]. In
between the collagen fibers there is a sparse distribution of interconnected
keratocytes. Collagen fibers give strength and elasticity to the cornea to maintain its
shape. The arrangement and spacing of the collagen fibers is the key to maintaining
corneal transparency [124,125]. Corneal keratocytes generally stay dormant in the
stroma but become active after an injury or inflammation and start synthesizing the
components needed for wound healing [126].

23
Descemet’s membrane: Descemet’s membrane is an acellular layer located between
the stroma and the corneal endothelium. It is about 5-15 µm thick [117]. It acts as a
basement membrane for endothelium, anchoring it to the stroma and providing
support.
Corneal endothelium: Corneal endothelium is a 5 µm thick monolayer [117] at the
posterior surface of cornea. It controls the flow of solute and nutrients across the
posterior surface of the cornea from the aqueous humor to superficial surfaces of
cornea and flow of water from the cornea to the aqueous humor [127] so as to
actively maintain the cornea in the slightly dehydrated state as required to maintain
optical transparency.
All the individual corneal layers serve their functions and any defects or dysfunctions
in these layers lead to corneal diseases. For example dry eye, the most common eye
disease around the world, causes ocular discomfort and irritation due to improper tear
film [128]. The disease can be caused due to excess or insufficient tear production, or
degraded tear quality. Fuch’s dystrophy is a common corneal disease in older
patients, where degeneration of endothelium leads to corneal edema through the
influx of aqueous humor into the cornea [129]. Corneal edema leads to an increase in
light scatter, degrading the visual quality. In the advanced stages even epithelium
becomes edematous resulting in severely impaired vision. Keratoconus a degenerative
disorder associated with thinning and steepening of the cornea has been well known
to have a detrimental effect on the visual performance [130]. Thinning of the

24
epithelium [131,132,133,134] and breaks in the Bowman’s layer [135,136] along with
modification in cell shape and cell density [137,138] have been observed in this
disease.
To understand the mechanism of these diseases or to diagnose them before they
progress to a severe level, a method to monitor individual corneal layers in-vivo is
necessary. Hence there is a great need to develop imaging systems, which can
visualize and accurately quantify individual corneal layers. Doing this however has
been a challenge since these layers are as thin as 3-15 µm and difficult to image
reliably. Ultrasound systems lack the resolution to visualize individual layers, while
IVCM, although does have axial sectioning capability to resolve these layers, has a
limited field of view. Conventional OCT systems also lack the axial resolution to
precisely quantify the thickness of all the individual corneal layers. However, with the
advances in broadband light sources, images with axial resolution of a few microns
have been obtained using OCT for both the posterior [139,140] and anterior segments
[141] of the eye. The high resolution anterior segment OCT can now directly
visualize the individual corneal layers and has been used for studying the effect of
corneal pathologies on these layers such as the swelling of Descemet’s membrane for
diagnosis of Fuch’s Dystrophy [142] corneal response to hypoxia induced corneal
swelling [143] and in indirect tear film thickness measurement [144,145]. The axial
resolution of the OCT used in these studies was 3-4 µm, which is just a couple of
times smaller than the structures studied [101]. This may cause an increase in the
ambiguity of thickness measurement. Moreover, it has not been possible to directly

25
visualize the natural tear film over the human cornea that is estimated to be 2-5 µm
by interferometric methods [146]. Therefore, there is a need for developing OCT
systems with a higher axial resolution, which could accurately quantify thickness
profiles of corneal layers including the tear film and also study structural
characteristics of both normal and pathological corneas.
1.6 Corneal Cellular Structure
Understanding the interactions between individual cells provides information on the
functioning of any organ. This is also true for the eye where there is a research
interest in looking at the cellular structure of both the cornea and the retina to
understand ocular pathologies. As discussed in the previous section, cornea has three
layers consisting of cells, epithelium, stroma and endothelium. The cells in all these
layers perform critical functions to maintain a healthy and transparent cornea.
Cells in the corneal epithelium are arranged in around six layers where the closer the
cells are to the surface, the flatter they are. The cellular arrangement is highly packed
and interlocked, especially in the middle layers, making epithelium poorly permeable
to any lipid insoluble substance [119], thus providing protection to the cornea. This
tight arrangement is also partially responsible for the transparency of the epithelium
and any increase in the spacing between these cells leads to scatter or clouding in the
epithelium [147]. In diseases such as dry eye and keratoconus, the changes in the

26
shape and packing of the epithelial cells have been observed [137,138,148]. What
leads to these changes is still an active research topic. Keratocytes in the stroma play
important role in the corneal wound healing, the majority of the time these cells lie
dormant in the stroma, but after injury the keratocytes at the injury site undergo
apoptosis while the neighboring ones become active and migrate to the wound
location. They change into fibroblasts and start producing matrix metalloproteinases,
which results in tissue remodeling. Why does keratocytes apoptosis occur in stroma
due to injury or pathology is still a mystery. Keratocyte apoptosis is also observed in
certain degenerative diseases such as keratoconus [149] and the general belief is that
it is mediated by the cytokines secreted by the epithelial cells. The area however is
still in its infancy and further investigation is required to completely understand the
mechanism. Corneal endothelial cells are also a topic of great research interest. These
cells are post mitotic thus they cannot divide and the only way of tissue repair is by
enlargement of the size of these cells. Hence severe endothelial cell loss in a patient
can have serious consequences such as corneal edema. No treatment for endothelial
cell loss is currently present besides corneal transplant. New methods for corneal
transplant are being developed to improve the success rate of the surgery. Monitoring
the endothelial cell count postop is crucial in evaluating the efficacy of these
surgeries.
The capability to visualize the individual cells in the cornea can answer many of these
questions. The primary instrument that has been used for cellular imaging in cornea is
the in-vivo confocal microscope (IVCM) [150]. IVCM has been successful in

27
observing cellular structure in both the normal and diseased corneas. It has been used
for observing structural changes in corneal cells in keratoconus [151,152,153]
wherein a decrease in the cell density of keratocytes in the stroma and flattening
along with elongation of the epithelial cells has been observed. In dry eye [154] a
change in the density and shape of epithelial cells and also alteration in the corneal
innervation has been observed using IVCM. Changes in the reflectivity of keratocytes
after refractive surgery [155,156] has also been observed using IVCM.
However, since IVCM uses high NA objective lenses to achieve high axial and lateral
resolution, its field size and working distance both are small, limiting its application
to one time measurements of a small portion of the tissue. Optical coherence
microscopy (OCM), a modification of OCT with high lateral resolution, is also
capable of obtaining en face cellular level images of the tissue [157]. Due to the
inherent property of coherence gating OCM can achieve higher axial resolution than
IVCM, even with a relatively lower NA objective lens. Low NA objectives provide
benefits in terms of wider field size and longer working distance. Larger field size
enables monitoring global changes in the tissue, while longer working distance firstly
leaves enough space in front of the sample to some tracking system for locating the
portion on the sample being imaged and secondly facilitates non contact imaging.
Sample tracking provides the capability to do follow up measurements on the changes
in the same group of cells over a period of time. Full field ultrahigh resolution OCM
has been used for sub cellular imaging in extracted human cornea [158] however in-
vivo imaging has been difficult due to long exposure times over which involuntary

28
sample movement leads to image degradation. OCM measurements in animal models
where the patient movement can be minimized by anesthesia can still provide
important clinical information, as most of the novel surgical and therapeutic
interventions are initially tested by performing experiments in the animal models,
before being translated to the clinic and transgenic animal models with similar
structure as of humans are now widely used to study diseases mechanisms.
1.7 Thesis Outline
OCT as a biomedical diagnostic tool holds great potential in various areas of
medicine. Its highest clinical impact has been and continues to be in ophthalmology
where it is now a generic instrument, used on a regular basis in the clinic for
diagnosing diseases and following efficacy of therapeutic interventions. Despite this,
there is a growing demand for further improving the OCT technology in terms of
resolution, imaging depth and imaging speed so that its application could be extended
to many other ophthalmic diseases.
This thesis focuses on the new OCT instrumentation for the anterior segment of the
eye and the use of the system to improve our understanding the human
accommodation and corneal diseases. The basic outline of the thesis is as follow
Chapter 2 explains the fundamental physical concepts behind the OCT technology.
We will be discussing the general architecture of an OCT system and the design

29
considerations from both theoretical and practical aspects, which determine the
imaging performance.
Chapter 3 introduces large scan depth anterior segment OCT developed during the
thesis work and its potential application in understanding the mechanism of
accommodation. The design of a novel scanning method that improves the signal to
noise ratio from ocular surfaces is described. The potential to gain large imaging
depth and the ability to image larger lateral portions of the lens under natural pupil
condition are demonstrated.
Chapter 4 describes the micrometer axial resolution OCT that was developed to
image the individual corneal layers in-vivo. All design considerations are discussed in
details and performance evaluation is presented. A clinical study regarding the
changes in the epithelium and Bowman’s layers of keratoconic eyes is also included
in this chapter to demonstrate the clinical viability of this system.
Chapter 5 illustrates high axial and transverse resolution optical coherence
microscope for cellular imaging in the cornea. The chapter talks about design
considerations and performance validation of the system. Images obtained from the
living mouse cornea in-vivo are shown and possible improvements in the system are
discussed.
Chapter 6 summarizes the findings of this thesis and provides both scientific and
clinical significance of these findings. Future research and development directions for
this work are also discussed.
30
References
1. J. Ambrose and J. Hounsfield, “Computerized transverse axial tomography”, Br. J. Radiol. 46, 148–149 (1972).
2. T. Seiler, ‘‘Magnetic resonance imaging of the eye and orbit,’’ in Noninvasive Diagnostic Techniques in Ophthalmology, B. R. Masters, Ed., pp. 17–31, Springer-Verlag, New York (1990).
3. M. M. Ter-Pogossian, M. E. Phelps, E. J. Hoffman, N. A. Mullani, "A positron-emission transaxial tomograph for nuclear imaging (PET)", Radiology 114 (1), 89–98 (1975).
4. T. Olsen, “The accuracy of ultrasonic determination of axial length in pseudophakic eyes”, Acta Ophthalmol. 67, 141–144 (1990).
5. J. Powley, Handbook of Biological Confocal Microscopy, Plenum,New York (1995).
6. D. Huang, E. A. Swanson, C. P. Lin, J. S. Schuman, W. G. Stinson, W. Chang, M. R. Hee, Flotte, K. Gregory, C. A. Puliafito, and J. G. Fujimoto, ”Optical Coherence Tomography,” Science 254, 1178-1181 (1991).
7. A. F. Fercher, C. K. Hitzenberger, G. Kamp, and S. Y. Elzaiat, “Measurement of intraocular distances by backscattering spectral interferometry,” Opt. Comm. 117, 43-48 (1995).
8. K. Takada, I. Yokohama, K. Chida, and J. Noda, "New measurement system for fault location in optical waveguide devices based on an interferometric technique," Appl. Opt. 26, 1603-1606 (1987)
9. R. C. Youngquist, S. Carr, and D. E. N. Davis, “Optical coherence-domain reflectometry: a new optical evaluation technique,” Opt. Lett. 12, 158–160 (1987)
10. A. F. Fercher, K. Mengedoht, and W. Werner, "Eye-length measurement by interferometry with partially coherent light," Opt. Lett. 13, 186-188 (1988)
11. A. F. Fercher, C. K. Hitzenberger, W. Drexler, G. Kampand and H. Sattmann, “In vivo optical coherence tomography” Am. J. Ophth. 116(1), 113-114 (1993)
12. E. A. Swanson, J. A. Izatt, M. R. Hee, D. Huang, C. P. Lin, J. S. Schuman, C. A. Puliafito, and J. G. Fujimoto, "In vivo retinal imaging by optical coherence tomography," Opt. Lett. 18, 1864-1866 (1993)

31
13. J. A. Izatt, M. R. Hee, E. A. Swanson, C. P. Lin, D. Huang, J. S. Schuman, C. A. Puliafito and J. G. Fujimoto, “Micrometer-Scale Resolution Imaging of the Anterior Eye In Vivo With Optical Coherence Tomography,” Arch Ophthalmol. 112(12), 1584-1589 (1994)
14. M. E. Brezinski, G. J. Tearney, B. E. Bouma, J. A. Izzat, M. R. Hee, E. A. Swanson, J. F. Southern and J. G. Fujimoto, “Optical coherence tomography for optical biopsy: properties and demonstration of vascular pathology,” Circulation 93, 1206-1213 (1996)
15. J. Welzel, “Optical coherence tomography in dermatology: a review,” Skin Res. Technol. 7, 1–9 (2001)
16. M. C. Pierce, J. Strasswimmer, B. H. Park, B. Cense and J. F. de Boer, “Advances in Optical Coherence Tomography Imaging for Dermatology,” J. Invest. Dermatol. 123, 458–463 (2004)
17. B. Colston, U. Sathyam, L. DaSilva, M. Everett, P. Stroeve, and L. Otis, "Dental OCT," Opt. Express 3, 230-238 (1998)
18. A. Baumgartner, S. Dichtl, C.K. Hitzenberger, H. Sattmann, B. Robl, A. Moritz, A.F. Fercher and W. Sperr, “Polarization–Sensitive Optical Coherence Tomography of Dental Structures,” Caries Res. 34, 59-69 (2000)
19. I. K. Jang, B. E. Bouma, D. H. Kang, S. J. Park, S. W. Park, K. B. Seung, K. B. Choi, M. Shishkov, K. Schlendorf, E. Pomerantsev, S. L. Houser, H. T. Aretz and G. J. Tearney, “Visualization of Coronary Atherosclerotic Plaques in Patients Using Optical Coherence Tomography:Comparison With Intravascular Ultrasound,” J. Am. Coll. Cardiol. 39(4), 604-609 (2002)
20. G. J. Tearney, S. A. Boppart, B. E. Bouma, M. E. Brezinski, N. J. Weissman, J. F. Southern, and J. G. Fujimoto, "Scanning single-mode fiber optic catheter-endoscope for optical coherence tomography," Opt. Lett. 21, 543-545 (1996)
21. B. E. Bouma, G. J. Tearney, C. C. Compton and N. S. Nishioka, “High-resolution imaging of the human esophagus and stomach in vivo using optical coherence tomography,” Gastrointest. Endosc. 51(4), 467-474, (2000)
22. J. A. Izatt, M. D. Kulkarni, S. Yazdanfar, J. K. Barton, and A. J. Welch, "In vivo bidirectional color Doppler flow imaging of picoliter blood volumes using optical coherence tomography," Opt. lett. 22, 1439-1441 (1997)

32
23. J. F. de Boer, T. E. Milner, M. J. C. van Gemert, and J. S. Nelson, "Two-dimensional birefringence imaging in biological tissue by polarization-sensitive optical coherence tomography," Opt. Lett. 22, 934-936 (1997)
24. U. Morgner, W. Drexler, F. X. Kärtner, X. D. Li, C. Pitris, E. P. Ippen, and J. G. Fujimoto, "Spectroscopic optical coherence tomography," Opt. Lett. 25, 111-113 (2000)
25. R. Leitgeb, C. K. Hitzenberger, and A. F. Fercher, "Performance of fourier domain vs. time domain optical coherence tomography," Opt. Express 11, 889-894 (2003)
26. J. F. de Boer, B. Cense, B. H. Park, M. C. Pierce, G. J. Tearney, and B. E. Bouma, "Improved signal-to-noise ratio in spectral-domain compared with time-domain optical coherence tomography," Opt. Lett. 28, 2067- 2069 (2003)
27. M. A. Choma, M. V. Sarunic, C. H. Yang, and J. A. Izatt, "Sensitivity advantage of swept source and Fourier domain optical coherence tomography," Opt. Express 11, 2183-2189 (2003)
28. N. Nassif, B. Cense, B. Park, M. Pierce, S. Yun, B. Bouma, G. Tearney, T. Chen, and J. de Boer, "In vivo high-resolution video-rate spectral-domain optical coherence tomography of the human retina and optic nerve," Opt. Express 12, 367-376 (2004)
29. B. Potsaid, B. Baumann, D. Huang, S. Barry, A. E. Cable, J. S. Schuman, J. S. Duker, and J. G. Fujimoto, "Ultrahigh speed 1050 nm swept source Fourier domain OCT retinal and anterior segment imaging at 100,000 to 400,000 axial scans per second," Opt. Express 18, 20029-20048 (2010)
30. B. Cense, N. Nassif, T. Chen, M. Pierce, S. H. Yun, B. Park, B. Bouma, G. Tearney, and J. Boer, "Ultrahigh-resolution high-speed retinal imaging using spectral-domain optical coherence tomography," Opt. Express 12, 2435-2447 (2004)
31 Early Treatment Diabetic Retinopathy Study Research Group. Fundus photographic risk factors for progression of diabetic retinopathy: ETDRS report number 12. Ophthalmology 98, 823–833 (1991)
32. M. F. Rabb, T. C. Burton, H. Schatz and L. A. Yannuzzi, “Fluorescein angiography of the fundus: a schematic approach to interpretation,” Surv Ophthalmol 22, 387–403 (1978)
33. J. S.Slakter, L. A. Yannuzzi, D. R. Guyer, J. A. Sorenson and D. A. Orlock, “Indocyanine-green angiography.” Curr. Opin. Ophthalmol. 6, 25–32 (1995)

33
34. J. C. Lai, S. S. Stinnett and G. J. Jaffe, “B-scan ultrasonography for the detection of macular thickening.” Am J Ophthalmol. 136, 55–61 (2003)
35. C. J. Pavlin and F. S. Foster, “Ultrasound Biomicroscopy High-Frequency Ultrasound Imaging of the Eye at Microscopic Resolution,” Rad. Clin. N. Am. 36(6) 1047-1058 (1998)
36 R. H. Webb, G. W. Hughes, and F. C. Delori, “Confocal scanning laser ophthalmoscope,” Applied Optics, 26(8), 1492-1499 (1987)
37. M. Wojtkowski, V. Srinivasan, J. G. Fujimoto, T. Ko, J. S. Schuman, A. Kowalczyk and J. S. Duker, “Three-dimensional Retinal Imaging with High-Speed Ultrahigh-Resolution Optical Coherence Tomography,” Ophthalmology 112(10), 1734 –1746 (2005)
38. T. H. Ko, J. G. Fujimoto, J. S. Schuman, L. A. Paunescu, A. M. Kowalevicz, I. Hartl, W. Drexler, G. Wollstein, H. Ishikawa and J. S. Duker, “Comparison of Ultrahigh- and Standard-Resolution Optical Coherence Tomography for Imaging Macular Pathology,” Ophthalmology 112(11), 1922–1935 (2005)
39. M. G. Wirtitsch, E. Ergun, B. Hermann, A. Unterhuber, M. Stur, C. Scholda, H. Sattmann, T. H. Ko, J. G. Fujimoto and W. Drexler, “Ultrahigh Resolution Optical Coherence Tomography In Macular Dystrophy,” Am. J. Ophthalmol. 140(6), 976–983 (2005)
40. D. C. Fernández, H. M. Salinas, and C. A. Puliafito, “Automated detection of retinal layer structures on optical coherence tomography images,” Optics Express, 13(25), 10200-10216 (2005)
41. M. Mujat, R. Chan, B. Cense, B. Park, C. Joo, T. Akkin, T. Chen, and J. de Boer, “Retinal nerve fiber layer thickness map determined from optical coherence tomography images,” Optics Express, 13(23), 9480-9491 (2005)
42. E. M. Frohman, J. G. Fujimoto, T. C. Frohman, P. A. Calabresi, G. Cutter and L. J. Balcer, “Optical coherence tomography: a window into the mechanisms of multiple sclerosis,” Nat. Clin. Pract. Neuro. 4, 664-675 (2008)
43. J. S. Schuman, M. R. Hee, A. V. Arya, T. Pedut-Kloizman, C. A. Puliafito, J. G. Fujimoto and E. A. Swanson, “Optical coherence tomography: a new tool for glaucoma diagnosis,” Curr. Opin. Ophthalmol. 6(2), 89-95 (1995)
44. G. Wollstein, J. S. Schuman, L. L. Price, A. Aydin, P. C. Stark, E. Hertzmark, E. Lai, H. Ishikawa, C.Mattox, J. G. Fujimoto and L. A. Paunescu, “Optical Coherence
34
Tomography longitudinal Evaluation of Retinal Nerve Fiber Layer Thickness in Glaucoma,” Arch Ophthalmol. 123, 464-470, (2005)
45. Y. Chen, L. N. Vuong, J. Liu, J. Ho, V. J. Srinivasan, I. Gorczynska, A. J. Witkin, J. S. Duker, J. Schuman and J. G. Fujimoto, “Three-dimensional ultrahigh resolution optical coherence tomography imaging of age-related macular degeneration,” Opt. express 17(5), 4046-4060 (2009)
46. A. J. Witkin, T. H. Ko, J. G. Fujimoto, A. Chan, W. Drexler, J. S. Schuman, E. Reichel, and J. S. Duker, “Ultrahigh resolution optical coherence tomography assessment of photoreceptors in retinitis pigmentosa and related diseases,” Am. J. Ophthalmol. 142, 945-952 (2006).
47. E. Ergun, B. Hermann, M. Wirtitsch, A. Unterhuber, T. H. Ko, H. Sattmann, C. Scholda, J. G. Fujimoto, M. Stur, and W. Drexler, “Assessment of Central Visual Function in Stargardt’s Disease/Fundus Flavimaculatus with Ultrahigh-Resolution Optical Coherence Tomography,” Invest. Ophth. Vis. Sci. 46(1), 310-316 (2005)
48. R. J. Antcliff, D. J. Spalton, M. R. Stanford, E. M. Graham, T. J. Fytche and J. Marshall, “Intravitreal Triamcinolone for Uveitic Cystoid Macular Edema: An Optical Coherence Tomography Study,” Ophthalmol. 108, 765–772 (2001)
49. A. H. Rogers, A. Martidis, P. B. Greenberg and C. A. Puliafito, “Optical coherence tomography findings following photodynamic therapy of choroidal neovascularization”, Am. J. Ophthalmol. 134(4), 566-576 (2002),
50. A.S. Alamán, A. G. Layana, M. J. Maldonado, C. S. Gómez and A. A. Vidal “Using Optical Coherence Tomography to Monitor Photodynamic Therapy in Age Related Macular Degeneration”, Am. J. Ophthalmol. 140(1), 23.e1-23.e7 (2005)
51. B. Povazay, K. Bizheva, B. Hermann, A. Unterhuber, H. Sattmann, A. Fercher, W. Drexler, C. Schubert, P. Ahnelt, M. Mei, R. Holzwarth, W. Wadsworth, J. Knight, and P. St. J. Russell, “Enhanced visualization of choroidal vessels using ultrahigh resolution ophthalmic OCT at 1050 nm,” Optics Express, Vol. 11, Issue 17, pp. 1980-1986 (2003)
52 A. Unterhuber, B. Považay, B. Hermann, H. Sattmann, A. Chavez-Pirson, and W. Drexler, “In vivo retinal optical coherence tomography at 1040 nm – enhanced penetration into the choroid,” Opt. Express 13, 3252 (2005).
53. W.R. Green “Histopathology of age-related macular degeneration” Molecular Vision 1999; 5:27

35
54. B. Povazay, B. Hermann, A. Unterhuber, S.H.F. Zeiler, J.E. Morgan, C. Falkner-Radler, C. Glittneberg, S. Binder, W. Drexler, J. Biomed. Opt.12(4), 041211 (2011)
55. B. Hermann, E. J. Fernández, A. Unterhuber, H. Sattmann, A. F. Fercher, W. Drexler, P. M. Prieto, and P. Artal, “Adaptive-optics ultrahigh-resolution optical coherence tomography,” Optics Letters, Vol. 29, Issue 18, pp. 2142-2144 (2004)
56. Y. Zhang, J. Rha, R. Jonnal, and D. T. Miller , “Adaptive optics parallel spectral domain optical coherence tomography for imaging the living retina,” Optics Express, Vol. 13, Issue 12, pp. 4792-4811 (2005)
57. S. Yazdanfar, A. M. Rollins and Joseph A. Izatt, “In Vivo Imaging of Human Retinal Flow Dynamics by Color Doppler Optical Coherence Tomography,” Arch Ophthalmol. 2003;121(2):235-239
58. B. Cense, T. C. Chen, B. Hyle Park, M. C. Pierce and J. F. de Boer, “Invivo depth-resolved birefringence measurements of the human retinal nerve fiber layer by polarization-sensitive optical coherence tomography,” Opt. Lett., 27(18), 1610-1612 (2002)
59. K. Bizheva, R. Pflug, B. Hermann, B. Povazay, H. Sattmann, P. Qiu, E. Anger, H. Reitsamer, S. Popov, J. R. Taylor, A. Unterhuber, P. Ahnelt and W. Drexler, “Optophysiology: Depth-resolved probing of retinal physiology with functional ultrahigh-resolution optical coherence tomography,” PNAS, 103(13), 5066-5071, (2006).
60. B. Cassin and S. Solomon. Dictionary of Eye Terminology. Gainsville, Florida: Triad Publishing Company, 1990.
61. A. Konstantopoulos, P. Hossain, D. F. Anderson, “Recent advances in ophthalmic anterior segment imaging: a new era for ophthalmic diagnosis?” Br. J. Ophthalmol. 91, 551-557 (2007)
62. “Eye examination with slit lamp” Carl Zeis Meditec, AG, pp 7
63 B. J. Kałuzny, J. J. Kaluzny, A. Szkulmowska, I. Gorczyńska, M. Szkulmowski, T. Bajraszewski, P. Targowski, A. Kowalczyk, “Spectral optical coherence tomography: a new imaging technique in contact lens practice,” Ophthal. Physio. Opt. 26(2), 127–132 (2006)
64. V. Christopoulos, L. Kagemann, G. Wollstein, H. Ishikawa, M. L. Gabriele, M. Wojtkowski, V. Srinivasan, J. G. Fujimoto, J. S. Duker, D. K. Dhaliwal and J. S. Schuman, “In Vivo Corneal High-Speed, Ultra–High-Resolution Optical Coherence Tomography,” Arch Ophthalmol. 125(8), 1027-1035 (2007)

36
65. J. Wang, S. Jiao, M. Ruggeri, M. A. Shousha and Q. Chen, “In situ visualization of tears on contact lens using ultra high resolution optical coherence tomography,” Eye Cont. Lens. 35(2), 44–49 (2009)
66. R. Yadav, K. S. Lee, J. P. Rolland, J. M. Zavislan, J. V. Aquavella and G. Yoon, “Micrometer axial resolution OCT for corneal imaging,” Biomed Opt Ex.2(11), 3037-3046 (2011).
67. Y. Li, R. Shekhar and D. Huang, “Corneal Pachymetry Mapping with High-speed Optical Coherence Tomography,” Ophthalmology 113(5), 792-799 (2006)
68. B. A. Holden, G.W. Mertz, J.J. McNally, Invest. Ophthalmol. Vis. Sci. 24(2), 218, (1983)
69. H. Cheng, A.K. Bates, L. Wood and K. McPherson, Arch. Ophthalmol. 106(7), 920 (1988)
70. S. Haque, T. Simpson and L. Jones, “Corneal and epithelial thickness in keratoconus: A comparison of ultrasonic pachymetry, orbscan II, and optical coherence tomography,” J Refract Surg.22(5), 486-493 (2006).
71. Y. Li, O. Tan, R. Brass, J.L. Weiss and D. Huang, “Corneal Epithelial Thickness Mapping by Fourier-Domain Optical Coherence, Tomography in Normal and Keratoconic Eyes,” Ophthalmology, Aug 20, 2012 (e-published ahead of print)
72. C. M. P. Ponce, K. M. Rocha, S. D. Smith, R. R. Krueger, “Central and peripheral corneal thickness measured with optical coherence tomography, Scheimpflug imaging, and ultrasound pachymetry in normal, keratoconus-suspect, and post–laser in situ keratomileusis eyes,” J Cataract Refract Surg. 35(6), 1055–1062 (2009)
73. Y. Li, M. V. Netto, R. Shekhar, R. R. Krueger and D. Huang, “A Longitudinal Study of LASIK Flap and Stromal Thickness with High-speed Optical Coherence Tomography,” Ophthalmology 114, 1124 –1132, (2007)
74. M. Tang, Y. Li, M. Avila and D. Huang, “Measuring total corneal power before and after laser in situ keratomileusis with high-speed optical coherence tomography,” J. Cataract Refr. Surg. 32(11), 1843-1850 (2006)
75. L. S. Lim, H. T. Aung, T. Aung and D. T. H. Tan, “Corneal Imaging with Anterior Segment Optical Coherence Tomography for Lamellar Keratoplasty Procedures,” Am. J. Ophthalmol. 145(1), 81–90, (2008)

37
76. J. J. Perez-Santonja, J. L. Alio, I. Jimenez-Alfaro and M. A. Zato, “Surgical correction of severe myopia with an angle-supported phakic intraocular lens,” J Cataract Refract. Surg. 26, 1288- 1302 (2000)
77. G. Baikoff, J. L. Arne, Y. Bokobza et al., “Angle-fixated anterior chamber phakic intraocular lens for myopia of -7 to -19 diopters” J Refract Surg.14, 282- 293, (1998)
78. J. J. Perez-Santonja, M. T. Iradier, J. M. Benitez del Castillo, J. M. Serrano and M. A. Zato, “Chronic subclinical inflammation in phakic eyes with intraocular lenses to correct myopia.” J Cataract Refract Surg 22 183- 187, (1996)
79. Mimouni F, Colin J, Koffi V, Bonnet P. Damage to the corneal endothelium from anterior chamber intraocular lenses in phakic myopic eyes. Refract Corneal Surg, 7, 277- 281 (1991)
80. J. L. Alio, F. de la Hoz, J. J. Perez-Santonja, J. M. Ruiz-Moreno, J. A. Quesada, “Phakic anterior chamber lenses for the correction of myopia: a 7-year cumulative analysis of complications in 263 cases.” Ophthalmology,106458- 466 (1999)
81. J. Goldsmith, Y. Li, M. Chalita, V. Westphal, C. Patil, A. Rollins, J. Izatt, and D. Huang, “Anterior chamber width measurement by high-speed optical coherence tomography,” Am. J. Ophthalmol. 112(2), 238-244 (2005)
82. G. Baikoff, H. J. Jodai and G. Bourgeon, “Measurement of the internal diameter and depth of the anterior chamber: IOLMaster versus anterior chamber optical coherence tomographer,” J. Cataract Refr. Surg. 31(9), 1722-1728 (2005)
83. S. Radhakrishnan, J. Goldsmith, D. Huang, V. Westphal, D. Dueker, A. Rollins, J. Izatt and S. Smith, “Comparison of optical coherence tomography and ultrasound biomicroscopy for detection of narrow anterior chamber angles,” Arch. Ophthalmol. 123, 1053–1059 (2005)
84. M. Chalita, Y. Li, S. Smith, C. Patil, V. Westphal, A. Rollins, J. Izatt and D. Huang, “High-Speed Optical Coherence Tomography of Laser Iridotomy,” Ophthalmology 140(6), 1133-1136 (2005)
85. A. L. Coleman, F. Yu and S. J. Evans, “Use of gonioscopy in medicare beneficiaries before glaucoma surgery,” J. Glauc. 15(6), 486-493 (2006)
86. Helmholtz’s Treatise on Physiological Optics. Translated from the 3rd German ed. Southall JPC, ed. New York: Dover Publications, (1962)

38
87. H. Cheng, J. K. Barnett, A. S. Vilupuru, J. D. Marsack, S. Kasthurirangan, R. A. Applegate and A. Roorda, “A population study on changes in wave aberrations with accommodation,” Journal of Vision (2004) 4, 272-280
88. M. Tscherning Physiologic Optics: Dioptrics of the Eye, Functions of the Retina, Ocular Movements, and Binocular Vision, 2nd ed. Philadelphia: Keystone, 160–89 (1904)
89. R. A. Schachar, T. D. Black, R. L. Kash, D. P. Cudmore and D. J. Schanzlin “The mechanism of accommodation and presbyopia in the primate”, Ann Ophthalmol 27, 58–67, (1995)
90. J. Coleman, “On the hydraulic suspension theory of accommodation”, Trans Am Ophthalmol Soc. 84, 846–868 (1986)
91. A. Glasser and M. C. W. Campbell, “Presbyopia and the Optical Changes in the Human Crystalline Lens with Age,” Vision Res., 38(2), 209-229 (1998)
92. R. A. Schachar, “Qualitative Effect of Zonular Tension on Freshly Extracted Intact Human Crystalline Lenses: Implications for the Mechanism of Accommodation,” Invest. Ophthalmol. Vis. Sci., 45(8), 2691-2695 (2004)
93. M. A. Croft, A. Glasser, G. Heatley, J. McDonald, T. Ebbert, D. B. Dahl, N. V. Nadkarni and P. L. Kaufman, “Accommodative ciliary body and lens function in rhesus monkeys, I: normal lens, zonule and ciliary process configuration in the iridectomized eye” Invest. Ophthalmol. Vis. Sci. 47, 1076-1086 (2006)
94. Glasser, A., Wendt, M., Ostrin, L., 2006. Accommodative changes in lens diameter in rhesus monkeys. Invest. Ophthalmol. Vis. Sci. 47, 278-286.
95. L. A. Ostrin and A. Glasser, “Edinger-Westphal and pharmacologically stimulated accommodative refractive changes and lens and ciliary process movements in rhesus monkeys,” Exp. Eye Res. 84, 302-313, (2007)
96. A. Glasser and P.L. Kaufman, “The Mechanism of Accommodation in Primates,” Ophthalmology 106:863–872 (1999)
97. E. Lutjen-Drecoll, E. Tamm, P. L. Kaufman, “Age changes in rhesus monkey ciliary muscle: light and electron microscopy” Exp. Eye Res. 47, 885-899 (1988)
98. M. W. Neider, K. Crawford, P. L. Kaufman and L. Z. Bito, “In vivo videography of the rhesus monkey accommodative apparatus: age-related loss of ciliary muscle response to central stimulation” Arch. Ophthalmol. 108, 69-74 (1990)

39
99. J. F. Koretz, A. M. Bertasso, M. W. Neider, B. True-Gabelt and P. L. Kaufman, “Slit-lamp studies of the rhesus monkey eye. II Changes in crystalline lens shape, thickness and position during accommodation and aging” Exp. Eye Res. 45, 317-326 (1987)
100. L. Z. Bito, C. J. DeRousseau, P. L. Kaufman and J. W. Bito, “Age-dependent loss of accommodative amplitude in rhesus monkeys: an animal model for presbyopia” Invest. Ophthalmol. Vis. Sci. 23, 23-31 (1982).
101. S. A. Strenk, J. L Semmlow, L. M. Strenk, P. Munoz, J Gronlund-Jacob and J. K. DeMarco, “Age-Related Changes in Human Ciliary Muscle and Lens: A Magnetic Resonance Imaging Study,” Invest Ophthalmol Vis Sci. 40(l), 162-1169, (1999)
102. H.L. Liou, and N.A. Brennan, “Anatomically accurate, finite model eye for optical modeling,” J. Opt. Soc. Am.A 14(8), 1684–1695 (1997).
103. R. Navarro, F. Palos and L. M. Gonzalez, “Adaptive model of the gradient index of the human lens. II. Optics of the accommodating aging Lens,” J Opt Soc Am. 24(9), 2911–2920 (2007)
104. S. Kasthurirangan, E. L. Markwell, D. A. Atchison and J. M. Pope, “In-vivo study of changes in refractive index distribution in the human crystalline lens with age and accommodation,” Invest. Ophthalmol. Vis. Sci. 49(6) 2531-2540 (2008)
105. J. F. Koretz, C. A. Cook and P. L. Kaufman, “Accommodation and presbyopia in the human eye. Changes in the anterior segment and crystalline lens with focus,” Invest. Ophthalmol. Vis. Sci. 38, 569 –578, (1997)
106. M. Dubbelman, G.L. Van der Heijde and H.A. Weeber, “Change in shape of the aging human crystalline lens with accommodation,” Vis. Res. 45, 117–132, (2005)
107. A.L. Wong, C.K.S. Leung, R.N. Weinreb, A.K.C. Cheng, C.Y.L. Cheung, P.T.H. Lam, C.P. Pang and D.S.C. La, “Quantitaitve assessment of lens opacities with anterior segment optical coherence tomography,” Br. J. Ophthalmol. 93, 61-65, (2009)
108. Rabbetts, R.B., Bennett & Rabbetts’ Clinical Visual Optics Elsevier 2007
109. Y. Yasuno, S. Makita, T. Endo, G. Aoki, M. Itoh and T. Yatagai, “Simultaneous B–M-mode scanning method for real-time full range Fourier domain optical coherence tomography,” Applied Optics, 45(8), 1861-1865, (2006)
110. J. Jungwirth, B. Baumann, M. Pircher, E. Götzinger, and C. K. Hitzenberger, “Extended in vivo anterior eye-segment imaging with full-range complex spectral

40
domain optical coherence tomography”, Journal of Biomedical Optics 2009 Vol. 14(5)
111. C. Zhou, J. Wang and S. Jiao, “Dual channel dual focus optical coherence tomography for imaging accommodation of the eye” Optics Express 17(11), 8947-8955, (2009
112. M. Ruggeri, S.R. Uhlhorn, C. De Freitas, A. Ho, F. Manns, and J.M. Parel, “Imaging and full-length biometry of the eye during accommodation using spectral domain OCT with an optical switch,” Biomedical Optics Express, 3(7), 1506-1520 (2012)
113. P. E. King-Smith, B. Fink, R. Hill, K. Koelling and J. Tiffany. “The thickness of the tear film”, Curr. Eye Res. 29, 357 – 368 (2004).
114. E. Wolff, “The muco-cutaneous junction of the lid margin and the distribution of the tear fluid,” Trans. Ophthalmol. Soc. UK 66, 291–308 (1946)
115. J. P. Craig, “Structure and function of the preocular tear film. The tear film: structure, function and clinical examination,” Oxford: Butterworth Heinemann, 2002:18–50.
116. A. de Roetth, “Respiration of the cornea,” Arch. Ophthal. 44, 666 (1950)
117. Atchison D.A. and Smith J., Optics of the Human Eye (Elsevier 2002)
118. J. S. Friedenwald, J. S., and Buschke, W.:Mitotic and wound-healing activities of the corneal epithelium, Arch. Ophthal. 32: 410, (1944)
119. Pedler, C: The fine structure of the corneal epithelium, Exp. Eye Res. 1: 286, 1962.
120. Maurice, D. M.: The cornea and sclera, in Davson, H., editor: The eye. Vegetative physiology and biochemistry, New York and London, 1969, Academic Press, Inc.
121. Bettman JW Jr. Nature of Bowman’s layer. N Engl J Med 1970;282: 344.
122. S. E. Wilson, and J. Hong, “Bowman’s Layer Structure and Function Critical or Dispensable to Corneal Function? A Hypothesis,” Cornea 19(4): 417–420, 2000.
123. Y. Komai and T. Ushiki, “The Three-Dimensional Organization of Collagen Fibrils in the Human Cornea and Sclera,” Invest. Ophthalmol. Vis. Sci., 32(8), 2244-2258 (1991)

41
124. D. M. Maurice, “The structure and transparency of the cornea,” J. Physiol. 136, 263-286 (1957)
125. J. L. Cox, R. A. Farrell, R. W. Hart and M. E. Langham, “The transparency of the mammalian cornea,” J. Physiol. 210, 601-616 (1970)
126. I. C. Kuo, “Corneal wound healing,” Curr. Opinion Ophthalmol. 15(4), 311-315 (2004)
127. G. O. Waring, W. M. Bourne, H. F. Edelhauser and K. R. Kenyon, “The corneal endothelium. Normal and pathologic structure and function,” Ophthalmol. 89(6), 531-590, (1982)
128. S. C. Pflugfelder, A. Solomon and M. E. Stern, “The Diagnosis and Management of Dry Eye A Twenty-five–Year Review,” Cornea 19(5), 644–649 (2000)
129. S. E. Wilson and W. M. Bourne, “Fuch’s dystrophy,” Cornea 7(1), 2-18 (1988)
130. Y. S. Rabinowitz, “Keratoconus,” Surv Ophthalmol.42(4), 297–319 (1998).
131. K. Tsubota, Y. Mashima, H. Murata, N. Sato and T. Ogata, “Corneal epithelium in keratoconus,” Cornea.14(1), 77-83 (1995).
132. D. Z. Reinstein, T. J. Archer and M. Gobbe, “Corneal epithelium thickness profile in the diagnosis of keratoconus,” J. Refract. Surg.25(7), 604-610 (2009).
133. S. Haque, T. Simpson and L. Jones, “Corneal and epithelial thickness in keratoconus: A comparison of ultrasonic pachymetry, orbscan II, and optical coherence tomography,” J Refract Surg.22(5), 486-493 (2006).
134. Y. Li, O. Tan, R. Brass, J.L. Weiss and D. Huang, “Corneal Epithelial Thickness Mapping by Fourier-Domain Optical Coherence, Tomography in Normal and Keratoconic Eyes,” Ophthalmology, Aug 20, 2012 (e-published ahead of print)
135. T. Sherwin, N. H. Brookes, I. P. Loh, C. A. Poole and G. M. Clover, “Cellular incursion into Bowman’s membrane in the peripheral cone of the keratoconic cornea,” Exp Eye Res.74(4), 473-482 (2002).
136. S. Sawaguchi, T. Fukuchi, H. Abe, T. Kaiya, J. Sugar and B. Y. J. T. Yue, “Three-dimensional scanning electron microscopic study of keratoconus corneas,” Arch Ophthalmol.116(1), 62-68 (1998).
137. R. L. Niederer, D. Perumal, T. Sherwin and C. N. J. McGhee, “Laser scanning in vivo confocal microscopy reveals reduced innervation and reduction in cell density in

42
all layers of the keratoconic cornea,” Invest Ophthalmol Vis Sci.49(7), 2964-2970 (2008).
138. M. C. Mocan, P. T. Yilmaz, M. Irkec and M. Orhan, “In vivo confocal microscopy for the evaluation of corneal microstructure in keratoconus,” Curr Eye Res.33(11-12), 933–939 (2008).
139. R. Leitgeb, W. Drexler, A. Unterhuber, B. Hermann, T. Bajraszewski, T. Le, A. Stingl, and A. Fercher “Ultrahigh resolution Fourier domain optical coherence tomography”, Opt. Exp. 12(10), 2156-2165 (2004)
140. M. Wojtkowski, V. Srinivasan, T. Ko, J. G. Fujimoto, A. Kowalczyk, and J. S. Duker “Ultrahigh-resolution, high-speed, Fourier domain optical coherence tomography and methods for dispersion compensation”, Opt. Exp. 12(11), 2404-2422 (2004)
141. V. Christopoulos, L. Kagemann, G. Wollstein, H. Ishikawa, M. L. Gabriele, M. Wojtkowski, V. Srinivasan, J. G. Fujimoto, J. S. Duker, D. K. Dhaliwal and J. S. Schuman, “In Vivo Corneal High-Speed, Ultra–High-Resolution Optical Coherence Tomography” Ophthalmol. 125(8), (2007)
142. M. A. Shousha, V. L. Perez, J. Wang, T. Ide, S. Jiao, Q. Chen, V. Chang, N. Buchser, S. R. Dubovy, W. Feuer and S. H. Yoo “Use of Ultra-High-Resolution Optical Coherence Tomography to Detect In Vivo Characteristics of Descemet's Membrane in Fuchs' Dystrophy” Ophthalmol. 117(6), 1220-1227, (2010)
143. N. Hutchings, T. L. Simpson, C. Hyun, A. A. Moayed, S. Hariri, L. Sorbara and K. Bizheva, “Swelling of the Human Cornea Revealed by High-Speed, Ultrahigh-Resolution Optical Coherence Tomography”, Invest. Ophthalmol. Vis. Sci. 51(9), 4579-4584, (2010)
144. Jianhua Wang, Desmond Fonn, Trefford L. Simpson and Lyndon Jones, “Precorneal and Pre- and Postlens Tear Film Thickness Measured Indirectly with Optical Coherence Tomography” Invest. Ophthalmol. Vis. Sci. June 2003 vol. 44 no. 6 2524-2528
145. Qi Chen, Jianhua Wang, Aizhu Tao, Meixiao Shen, Shuliang Jiao and Fan Lu, “Ultrahigh-Resolution Measurement by Optical Coherence Tomography of Dynamic Tear Film Changes on Contact Lenses” Invest. Ophthalmol. Vis. Sci. April 2010 vol. 51 no. 4 1988-1993
146. P. Ewen King-Smith, Barbara Fink, Richard Hill, Kurt Koelling and John Tiffany. “The thickness of the tear film”, Current Eye Research, Volume 29, 357 – 368, Issue 4 & 5 October 2004.

43
147. D. M. Maurice, “The structure and transparency of the cornea,” J. Physio. 136: 263 (1957)
148. S. C. Pflugfelder, W. Farley, L. Luo, L. Z. Chen, C. S. de Paiva, L. C. Olmos, D. Li and M. E. Fini, “Matrix Metalloproteinase-9 Knockout Confers Resistance to Corneal Epithelial Barrier Disruption in Experimental Dry Eye,” Am. J. Path. 166(1), 61-71 (2005)
149. W. Kim, Y. S. Rabinowitz , D. M. Meisler and S. E. Wilson, “Keratocyte Apoptosis Associated with Keratoconus,” Exp. Eye Res. 69(5), 475-481 (1999)
150 J. C. Erie, S. V. Patel, J. W. McLaren, C. B. Nau, D. O. Hodge and W. M. Bourne, “Keratocyte density in keratoconus. A confocal microscopy study,” Am J Ophthalmol 134, 689–695 (2002)
151. J. G. Hollingsworth and N. Efron, “Observations of banding patterns (Vogt striae) in keratoconus: a confocal microscopy study” Cornea 24, 162–166 (2005)
152. O. O. Uçakhan, A. Kanpolat, N. Ylmaz and M. Özkan, “In vivo confocal microscopy findings in keratoconus,” Eye Contact Lens 32, 183–191 (2006)
153. K. H. Weed, C. J. Macewen, A. Cox amd C. N. McGhee, “Quantitative analysis of corneal microstructure in keratoconus utilising in vivo confocal microscopy,” Eye 21, 614–623 (2007)
154. J. M. Benitez del Castillo, M. A. S. Wasfy, C. Fernandez and J. Garcia-Sanchez, “An in vivo confocal masked study on corneal epithelium and subbasal nerves in patients with dry eye,” Invest. Ophth. Vis. Sci. 45, 3030-3035 (2004)
155. P. J. Pisella, O. Auzerie, Y. Bokobza, C. Debbasch and C. Baudouin, “Evaluation of corneal stromal changes in vivo after laser in situ keratomileusis with confocal microscopy,” Ophthalmology 108(10), 1744-1750 (2001)
156. J. A. Moilanen, M. H. Vesaluoma, L. J. Muller and T. M. Tervo, “Long-term corneal morphology after PRK by in vivo confocal microscopy,” Invest. Ophth. Vis. Sci. 44(3), 1064–1069 (2003)
157. J. A. Izatt, M. R. Hee, G. M. Owen, E. A. Swanson, and J. G. Fujimoto, "Optical coherence microscopy in scattering media," Opt. Lett. 19, 590-592 (1994)
158. T. Seiler, ‘‘Magnetic resonance imaging of the eye and orbit,’’ in Noninvasive Diagnostic Techniques in Ophthalmology, B. R. Masters, Ed.

44
Chapter 2 Theory of OCT
2.1 Introduction Following its invention in 1991, OCT has undergone rapid technological
development and is now considered a well-established technology. The physical
concepts behind OCT are well understood and numerous articles [1,2,3,4,5], reviews
[6,7] and books [8,9] that describe the theory of the technique have been published. In
this chapter we will review these fundamental theories and practical factors that
should be taken into consideration while designing an OCT system.
Imaging with any OCT system is essentially performed by measuring the magnitude
and echo time delay of backreflected or backscattered light from internal
microstructures in materials or tissue. Since the speed of light is much faster than the
response time of the photodetector it is difficult to measure this time delay directly.
Hence in OCT, the echo time delay is measured by interfering the light backscattered
from the tissue with the light that has travelled a known optical path length. This is
achieved by using a fiber based Michelson’s interferometer that uses a low coherence

45
light source, also known as a low coherence interferometer or white light
interferometer.
Figure 2.1. Schematic of a typical fiber optic based OCT system (Adapted from W. Drexler and J.G. Fujimoto, Optical Coherence Tomography: Technology and Applications, Springer-Verlag
Berlin Heidelberg 2008)
Figure 2.1 shows the schematic of a typical OCT system. Light from a low coherence
light source is directed into a 2×2 fiber-optic coupler that splits the incident optical
power into sample and reference arms. Light in the reference arm is made incident
upon a reference mirror, which redirects it back to the fiber output. In the sample arm
light coming out of the fiber output is made incident upon a scanning system, which
is designed to focus the beam on the sample and scan it laterally in one or two-
dimensional space. The backscattered light from the sample, through the same optical
scanning system, is coupled back into the sample arm fiber output. The light returning
from the sample and reference arms are mixed by the fiber coupler, and the

46
interference of the beams is measured on a light detector. The electronic signal from
the detector is sent to a computer and processed to provide the depth-resolved
reflectivity profile of the sample. This depth-resolved reflectivity profile of the
sample is termed as an A-scan. While scanning the focused spot across the sample
(B-scan), multiple such A-scans are acquired to produce a two-dimensional cross-
sectional image of the sample.
As mentioned in the section 1.1, there are two different types of OCT systems, time
domain OCT (TDOCT) and Fourier domain OCT (FDOCT). There are significant
differences between the two. For a TDOCT the light source is broadband and
continuous wave, the reference mirror is repetitively scanned in the axial direction for
axial scanning and a single channel detector obtains temporal interference fringes
formed by the interference of the reference beam and the beam reflected from a
scattering site in the sample. A-scans are obtained from the envelope of the temporal
interference signal.
In FDOCT systems, the reference mirror is kept fixed, while for axial scanning
spectral interference fringes of the beams returning from the reference mirror and all
the axial depths in the sample are obtained. A-scans are then obtained by taking the
Fourier transform of the spectral interference fringes. There are two different
modalities of FDOCT, spectral domain OCT (SDOCT) and swept source OCT
(SSOCT), which mainly differ in the method by which the spectral interference
fringes are obtained. SDOCT uses a broadband and continuous wave light source and

47
obtains the spectral interference fringes by dispersing the interference signal using a
spectrometer and detecting it on an arrayed detector. SSOCT on the other hand uses a
single channel detector but obtains the spectral interference fringes by using a tunable
light source, which has a narrow instantaneous line-width but rapidly sweeps its
wavelength in time. All these different types of OCT system, although differing in the
method of implementation, are based on low coherence interferometry and so to
understand the theory of OCT it is crucial to first understand the basics of low
coherence interferometry.
2.2 Low coherence interferometry
Low coherence interferometry or white light interferometry is a technique that has
been known since seventeenth century. It was first described by Sir Isaac Newton
[10] and has since been widely used in surface metrology and profilometry [11] and
thin film thickness measurement [12]. The first biological application of low
coherence interferometry was reported by Fercher et al. in 1988 for measurement of
the axial length of the eye [13]. Subsequently many other versions of low coherence
interferometry were developed for noninvasive measurement in biological tissue
[14,15] however its full potential for biological applications was realized only when
OCT was developed in 1991 [16].

48
Interferometry techniques measure the correlation between light backscattered from a
sample and light that traveled through a known distance or time delay. Figure 2.2
shows a schematic diagram of a simple Michelson interferometer where there is a
mirror in both reference and sample arm.
Figure 2.2 Schematic of a Michelson interferometer
For simplicity the electric fields will be assumed scalar in our analysis. The electric
field from the light source EI is split into the reference and sample beam by a 50/50
beamsplitter. The two beams travel different distances in the two arms of the
interferometer. The reflected beams from the reference, ER and sample arm, Es are
superimposed together by the beamsplitter. The electric field at the detector, ED, is
given as ( )1/ 2 ( ) ( )D R SE E t E t τ= + + , where τ is the optical time delay between the
reference and sample arm and is directly proportional to the optical path difference
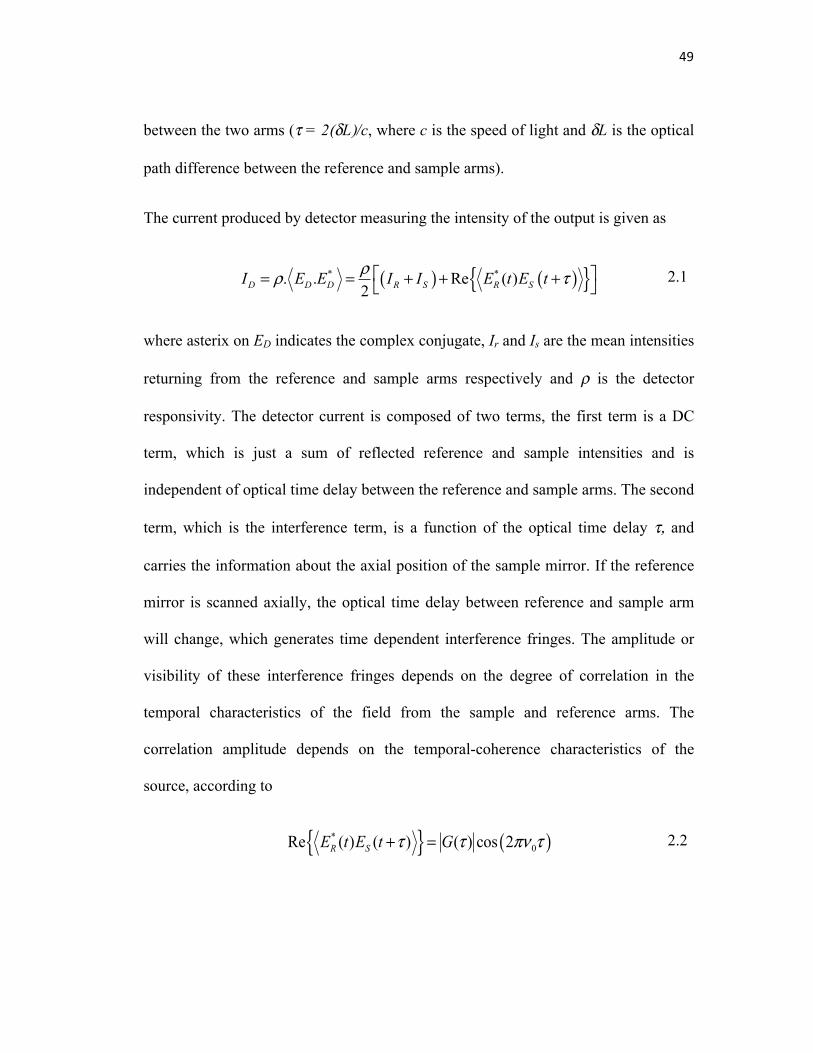
49
between the two arms (τ = 2(δL)/c, where c is the speed of light and δL is the optical
path difference between the reference and sample arms).
The current produced by detector measuring the intensity of the output is given as
( ) ( ){ }* *. . Re ( )2D D D R S R SI E E I I E t E tρρ τ⎡ ⎤= = + + +⎣ ⎦
where asterix on ED indicates the complex conjugate, Ir and Is are the mean intensities
returning from the reference and sample arms respectively and ρ is the detector
responsivity. The detector current is composed of two terms, the first term is a DC
term, which is just a sum of reflected reference and sample intensities and is
independent of optical time delay between the reference and sample arms. The second
term, which is the interference term, is a function of the optical time delay τ, and
carries the information about the axial position of the sample mirror. If the reference
mirror is scanned axially, the optical time delay between reference and sample arm
will change, which generates time dependent interference fringes. The amplitude or
visibility of these interference fringes depends on the degree of correlation in the
temporal characteristics of the field from the sample and reference arms. The
correlation amplitude depends on the temporal-coherence characteristics of the
source, according to
{ } ( )*0Re ( ) ( ) ( ) cos 2R SE t E t Gτ τ πν τ+ =
2.1
2.2

50
where ν0 is the center frequency of the source, and G(τ) is its complex temporal
coherence function. Hence combining Eq. 2.1 and 2.2 the expression for the detector
current is given as
ID = !2
IR + IS( ) + G(" ) cos(2#$0" )%& '(
Figure 2.3 demonstrates Eq. 2.3 graphically, the DC term is independent of optical
time delay and stays constant throughout. In the interference term there is the
modulus of the complex temporal coherence function, which is modulated by a
sinusoidal variation in the signal intensity due to interference between reference and
sample beams. The total detector current hence is an electronic pulse in time domain
whose shape is determined by the coherence function.
Figure 2.3 Graphical representation of the low coherence interferometer signal. The
interferometer signal is a sum of the DC term and interference term. The DC term is a constant, which does not depend on the optical time delay. While interference term is the product of the
sinusoidal signal resulting from interference fringes and the coherence function, which determines fringe visibility. Overall the signal is an electronic pulse in time
2.3

51
According to the Wiener–Khintchine theorem [17], G(τ) is related to the power
spectral density of the source, S(ν) by
0
( ) ( )exp( 2 )G S i dτ ν πτ ν∞
= −∫
This relationship is equivalent to a Fourier transform, since the spectrum will be zero
for negative frequencies. It follows then that the width of the temporal coherence
function is inversely proportional to the bandwidth of the light source being used.
Figure 2.4 demonstrates this phenomenon. For a coherent light source with narrow
bandwidth, the temporal coherence function will be broad, hence electric field is
correlated over a longer time and interference will be observed over a wide range of
path length differences between the reference and sample arm, while for a low
coherence light source with broad bandwidth, interference will be observed only over
a narrow range of path length differences.
As an illustrative example consider a light source with normalized Gaussian spectrum
where Δν is the half power bandwidth of the light source. The temporal coherence
function by Eq. 2.4 will be the Fourier transform of this spectrum and is given as
202 ln 2 /( ) exp 4ln 2S ν νπν
ν ν⎡ ⎤−⎛ ⎞= −⎢ ⎥⎜ ⎟Δ Δ⎝ ⎠⎢ ⎥⎣ ⎦
( )2
0( ) exp exp 22 ln 2
G jπ νττ πν τ⎡ ⎤Δ⎛ ⎞= − −⎢ ⎥⎜ ⎟⎝ ⎠⎢ ⎥⎣ ⎦
2.4
2.5
2.6

52
Figure 2.4 Relationship between light source spectrum and interference signal obtained by the
system. For a narrow linewidth light source the coherence function is broad so the interference is observed over a large optical path length differences while for a broad bandwidth light source the coherence function is narrow and interference is observed over a small optical path length
difference
The path length difference for which the electric field will be correlated is given by
the full width at half maximum (FWHM) of the temporal coherence function (G(τ) >
½). This path length difference is also known as the coherence length and from Eq.
2.6, is given by
202 ln2 1 2ln2
ccl λπ ν π λ
= =Δ Δ
Here λ0 is the center wavelength of the light source and Δλ is the wavelength related
spectral bandwidth. It is evident from Eq. 2.7 that coherence length is inversely
proportional to the bandwidth of the light source. Strong interference is only observed
2.7

53
when the path lengths of the reference and measurement arms are matched within the
coherence length of the light. Hence by increasing the bandwidth of the light source
the path lengths from which interference will be observed can be reduced. This
phenomenon is known as coherence gating and it lies at the crux of the image
formation in OCT systems.
2.3 Time domain OCT
Time domain OCT is a low coherence interferometer with lateral scanning capability
for tomographic imaging in the biological systems. Due to coherence gating in low-
coherence interferometry, the interference signal is only obtained from the part of the
sample, which is matched in optical path length, with the reference mirror, to within
the coherence length of the light source. By moving the reference mirror axially the
interference will be observed from different scattering interfaces. This information
can then be used to generate a profile of the longitudinal reflection sites.
Assuming that the sample just consists of a single scattering interface at the axial
position zS, then the current produced by the detector as a function of the reference
mirror location, zR can be obtained by substituting Eq. 2.6 and 2.2 in Eq. 2.1 and
substituting τ =2(zR-zS)/c, and 2πν0/c = k0(wave number).

54
[ ]
( )2
0
4
( )exp cos 2 ( )2 2 ln2
D R S
R SR S R S
I I I
k z zI I k z z
ρ
ρ
= +
⎡ ⎤⎧ ⎫Δ −⎛ ⎞⎪ ⎪⎢ ⎥+ −⎨ ⎬⎜ ⎟⎢ ⎥⎝ ⎠⎪ ⎪⎩ ⎭⎣ ⎦
where Δk is the bandwidth in wavenumbers. In case of a sample having n different
reflective interfaces at axial positions zSn, the detector current will be a sum of the
detector currents obtained from each interface. Hence Eq. 2.8 can be extended to a
multiple interfaced sample by simply summing the signal over the n different
interfaces
( )
1
2
01
4
( )exp cos 2 ( )2 2 ln 2
N
D R Snn
NR Sn
R Sn R Snn
I I I
k z zI I k z z
ρ
ρ
=
=
⎡ ⎤= +⎢ ⎥⎣ ⎦⎡ ⎤⎧ ⎫Δ −⎛ ⎞⎪ ⎪⎢ ⎥+ −⎨ ⎬⎜ ⎟⎢ ⎥⎝ ⎠⎪ ⎪⎩ ⎭⎣ ⎦
∑
∑
Consider a sample with 3 interfaces as shown in Figure 2.5a. Detector signal obtained
from Eq. 2.9, for this sample, as a function of zR is shown in Figure 2.5b. The detector
signal is offset by the DC term, which is the sum of the reference and sample
reflectivity. On top of that there are electronic pulses corresponding to each interface,
which are modulated by a carrier wave at a frequency proportional to the source
center wavenumber k0 and the scanning velocity of the reference mirror. The sample
reflectivity profile can be obtained from the envelope of this detector signal. The
presence of carrier provides a convenient modulation frequency for lock-in detection
[18], which allows for the rejection of the DC offset.
2.9
2.8

55
Figure 2.5. Illustration of an A-scan resulting from TDOCT with discrete reflectors (a) the real reflectivity profile in the sample, each interface acts as a delta function, (b) the detector signal a
function of reference mirror location, each electronic pulse corresponds to a reflection site (c) the resulting A-scan after obtaining the envelope of the detector signal (Adapted from W. Drexler
and J.G. Fujimoto, Optical Coherence Tomography: Technology and Applications, Springer-Verlag Berlin Heidelberg 2008)
Notice that the sample reflectivity profile obtained by the system (Figure 2.5c) is a
convolution of the real reflectivity profile (Figure 2.5a) with the source coherence
function, defined in Eq. 2.6. Hence the axial point spread function (PSF) of the
imaging system is the coherence function. The axial resolution of the TDOCT

56
depends on the full width at half maximum (FWHM) of the coherence function,
which is the same as the coherence length. For a source with Gaussian spectral
distribution, according to Eq. 2.7 the axial resolution, Δz will be given as
It can be seen that in contrast to conventional or confocal microscopy where axial
resolution is inversely proportional to the numerical aperture (NA) of the focusing
lens, in case of OCT it is completely independent of NA. The axial resolution is
directly proportional to the center wavelength squared of the light source and is
inversely proportional to the bandwidth. High axial resolution can be achieved by
using a light source with broader bandwidth and/or shorter center wavelength.
To generate a two-dimensional map of the reflection sites in the sample, the
magnitude and echo time delay of light at different lateral sections needs to be
measured. This is achieved by placing a high speed scanning mirrors in the sample
arm, which scan the focused spot in the two transverse directions. The transverse
resolution (Δx) of the OCT is determined by the focal spot size. The single point
transverse resolution is typically defined as the FWHM of the transverse point spread
function. For a focused Gaussian beam, the transverse spot can be defined as 1/e2
radius of the transverse response [19] and is given as
0.46xNA
λΔ =
202ln2z λ
π λΔ =
Δ
2.11
2.10

57
2.4 Fourier Domain OCT
2.4.1 Theory of FDOCT
Fourier domain OCT (FDOCT), proposed by Fercher et al. in 1995 [20], measures the
light echoes in the Fourier domain. Just as in TDOCT the output from the light source
in FDOCT is split into reference and sample arm. The reference mirror position is
kept stationary and instead the interference fringes are split into its spectral
components to obtain spectral interferogram (see section 2.3.3 for details spectral
interferogram measurement in FDOCT). Since the interference signal is split into its
spectral components, the light falling on the detector has a narrow linewidth. As
discussed in section 2.1, for light beam of narrow linewidth, interference is observed
over a larger optical path length difference. Hence in FDOCT the interference
between the light reflected from the reference and the sample is observed even when
the optical path difference between the two is much larger than the coherence length
of the light source. Therefore, there is no need to move the reference mirror axially.
The current produced at the detector as a function of wave number k is given as
( ) ( )( )
( ) ( )( )
1
1
1
( )4
( ) exp 2 ( ) exp 2 ( )4
( ) exp 2 ( ) exp 2 ( )4
N
D R Snn
N
Sn R Sn R Sn Rn
N
Sm Sn Sm Sn Sm Snn m
I S k R R
S k R R j k z z j k z z
S k R R j k z z j k z z
ρ
ρ
ρ
=
=
≠ =
⎡ ⎤⎛ ⎞= +⎢ ⎥⎜ ⎟⎝ ⎠⎣ ⎦
⎡ ⎤+ − − + −⎢ ⎥⎣ ⎦⎡ ⎤+ − − + −⎢ ⎥⎣ ⎦
∑
∑
∑
2.12

58
Where S(k) is the power spectral dependence of the light source, RSn is the reflectivity
of the nth interface in the sample. The first term in this expression is the DC offset
while the second one is the cross-correlation term, which contains the information
about the backscattering profile of the sample. These two terms are the same as the
terms present in Eq. 2.9 for TDOCT. The third expression is the autocorrelation term,
which arises due to the interference between the light reflected from the two
interfaces within the sample. This term is present only in FDOCT and arises due to
the narrow effective linewidth of the light falling on the detector in FDOCT, which
makes the interference between the beams reflected from the two different portions of
the sample possible.
It is the cross-correlation term that contains the information about the scattering
profile of sample. Depending on the optical path difference between the reference and
sample arm, the cross-correlation term will have a sinusoidal spectral modulation.
The frequency of this modulation is directly related to the echo time delay thus
producing different frequency modulations for different path differences. Therefore
after obtaining the wave-number dependent detector current from the OCT and
Fourier transforming it, the magnitude of the light signal from all the axial scan
locations of the sample can be obtained. Since all of the axial information is obtained
in one single acquisition, the slow process of axial mechanical movement of the
reference mirror is bypassed; hence the imaging speed in FDOCT is about 50-100
times faster than TDOCT. Besides improved imaging speed, FDOCT also provides
better SNR performance in comparison to TDOCT. As the interference fringes in

59
FDOCT are measured in the Fourier space on an array of detection channels, the peak
signal power for a particular interface adds coherently over these separate channels.
This provides an improvement in SNR, which is proportional to the number of
detection channels [3,4,5].
The Fourier transformed detector current is given as
( ) ( )( )
( ) ( )( )
1
1
1
( )8
( ) 2( ) 2( )4
( ) 2( ) 2( )8
N
D R Snn
N
Sn R Sn R Sn Rn
N
Sm Sn Sm Sn Sm Snn m
i G z R R
G z R R z z z z z z
G z R R z z z z z z
ρ
ρ δ δ
ρ δ δ
=
=
≠ =
⎡ ⎤⎛ ⎞= +⎢ ⎥⎜ ⎟⎝ ⎠⎣ ⎦
⎡ ⎤+ ⊗ + − + − −⎢ ⎥⎣ ⎦⎡ ⎤+ ⊗ + − + − −⎢ ⎥⎣ ⎦
∑
∑
∑
Figure 2.6 shows the A-scan obtained from the expression above. The apparent
location of each reflector in the sample is two times the real position. This can be
explained from the fact that it is the round-trip distance to each reflector that the
interferometer is measuring. This artifact can be corrected easily by specifying the
real axial coordinates z to be half the apparent axial location.
2.14
Just as in TDOCT, the reflectivity signal is convolved with the coherence function
G(z) hence each sample reflector appears broadened to a width of a coherence length.
Thus the axial resolution of the FDOCT is the same as that in the case of TDOCT and
is given by the same expression shown in Eq. 2.10.
z = z / 2
2.13
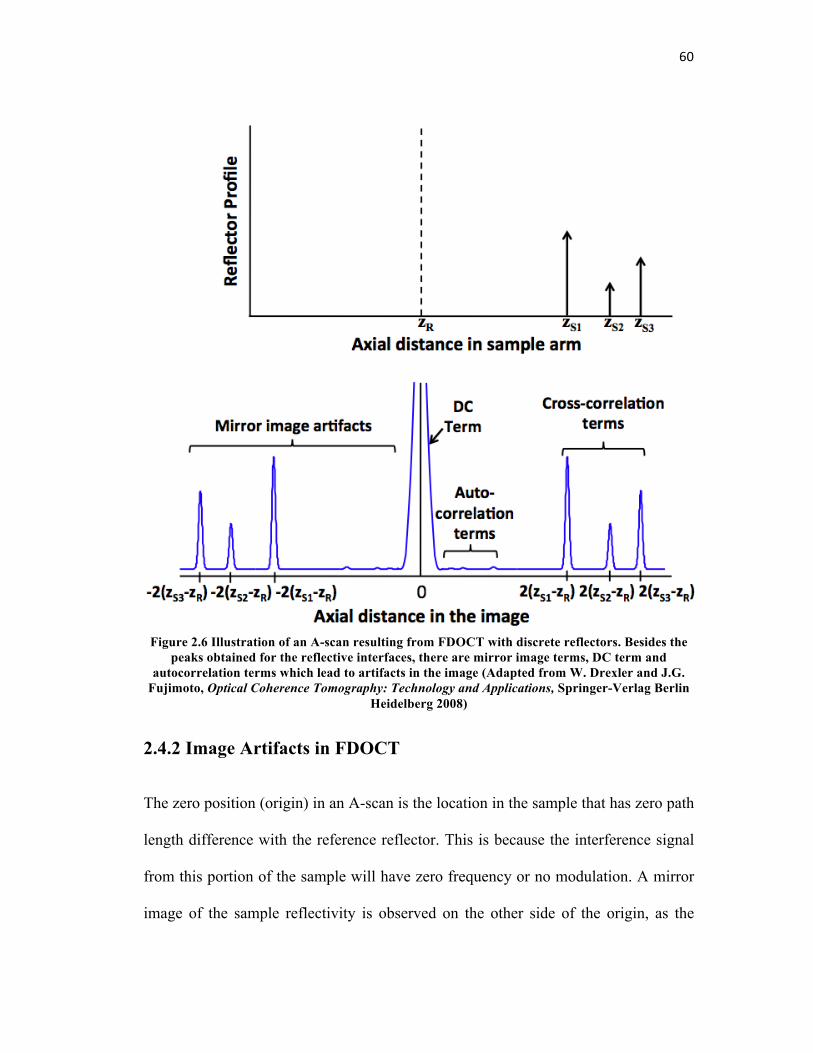
60
Figure 2.6 Illustration of an A-scan resulting from FDOCT with discrete reflectors. Besides the peaks obtained for the reflective interfaces, there are mirror image terms, DC term and
autocorrelation terms which lead to artifacts in the image (Adapted from W. Drexler and J.G. Fujimoto, Optical Coherence Tomography: Technology and Applications, Springer-Verlag Berlin
Heidelberg 2008)
2.4.2 Image Artifacts in FDOCT
The zero position (origin) in an A-scan is the location in the sample that has zero path
length difference with the reference reflector. This is because the interference signal
from this portion of the sample will have zero frequency or no modulation. A mirror
image of the sample reflectivity is observed on the other side of the origin, as the

61
interferometer is unable to distinguish between the signal generated due to positive or
negative path length difference between reference mirror and sample reflector. To
avoid this artifact the sample must always be kept such that all the reflectors in the
sample are at either positive or negative optical path length difference from the
reference.
The DC and the auto-correlation term in Eq. 2.12 also lead to artifacts in the image.
The DC term gives rise to a large peak centered at zero path length. Although the
FWHM value of the DC term is only as wide as the coherence length, there is
generally a lot of energy in the wings of the DC term, which can obscure the desired
cross correlation term. The autocorrelation terms may also give rise to artificial
signals. Since the distances between the reflectors in the sample are in general much
smaller than those between the sample reflectors and the reference mirror, the
autocorrelation terms are confined to near zero path-length position. Moreover the
light reflected from the scattering centers in the sample is generally much weaker
than the light reflected from the reference arm, the amplitude of autocorrelation terms
is small in comparison to the cross-correlation terms. However there could be
conditions when the light reflected from one of the scattering center in the sample is
comparable to the light reflected from the reference. In that case the amplitude of
autocorrelation term becomes significant. The best way to eliminate autocorrelation
term is to ensure that intensity from the reference arm is sufficiently larger than the
autocorrelation terms. The other benefit of keeping reference reflectivity high is the

62
amplification of the detected sample reflectivity due to a large gain factor arising
through reference reflectivity (RR) in the cross-correlation term in Eq. 2.13.
2.4.3 Implementations of FDOCT
FDOCT can be implemented in two different configurations, spectral domain OCT
(SDOCT) and swept source OCT (SSOCT). Both are based on the same physical
principle of measuring the spectral interference fringes but are different in the method
through which these interference fringes are measured.
Spectral Domain OCT
In SDOCT the spectral interference fringes are obtained by spatially separating the
frequencies using a spectrometer in the detection arm. Figure 2.7 shows the schematic
of a spectral domain OCT. The light coming back from the reference and sample arm
is mixed by the fiber coupler and is sent into the spectrometer where spatially
separated spectral components of the reference and sample arm interfere. The light
detection is carried out on an arrayed detector such as a charge coupled device (CCD)
or complimentary metal oxide semiconductor (CMOS) sensor. Since the CCD and
CMOS sensors have a limited dynamic range in comparison to a photodetector, the
SNR improvement provided by FDOCT over TDOCT is sacrificed slightly, as these
sensors saturate quickly with an increase in signal power. SDOCT however provides
better axial and lateral resolution in comparison to SSOCT as shorter wavelengths at
around 800 nm can be used for imaging. Most of the commercially available FDOCT

63
systems have traditionally been based on the SDOCT configuration mainly because
hardware used in these systems is cost effective and easy to implement.
Figure 2.7 Schematic of a spectral domain OCT
Swept Source OCT
In SSOCT the spectral interference fringes are obtained in time by changing the
instantaneous operating frequency of the light source. Figure 2.8 shows the schematic
of the SSOCT. A photodetector in the detection arm is used to measure spectral
interference fringes. Each A-scan is acquired when the tunable light source completes
one full sweep over its tuning bandwidth. Since the photodetector has a higher
dynamic range the SNR performance of SSOCT is better than SDOCT. Better SNR
performance has allowed these systems to achieve faster imaging speeds in
comparison with SDOCT. The imaging speeds in research grade SSOCT systems are
now reaching above a million A-scans per second [21]. The faster imaging speed

64
however has not translated into real time imaging due to the phase instabilities in the
frequency sweeps at high tuning speeds, which need correction offline after the data
has been acquired. Hardware implementation of these high-speed tunable lasers is
also quite complicated and expensive. Due to the absence of tunable light sources at
shorter wavelengths, these systems are generally implemented at 1300 nm
wavelength, hence the resolution provided by these systems is poor in comparison to
SDOCT.
Figure 2.8 Schematic of a swept source OCT
With the benefits FDOCT provides in the imaging speed and SNR it has become a
more popular OCT configuration these days. Since TDOCT has become obsolete,
from hereon we will only focus on the FDOCT systems.

65
2.5 System Design Considerations
Till now we have discussed the theoretical concepts that govern the performance of
an OCT system. There are various practical factors also, which should to be taken
into consideration while designing a system. In this section we will discuss how these
practical aspects are addressed to optimize imaging performance.
2.5.1 Axial Resolution of OCT
Eq. 2.10 gives the theoretical expression for axial resolution of an OCT system. In a
practical situation various other factors described below should also be considered
while designing a system for a particular axial resolution.
Spectral shape of the light source
Eq. 2.10 assumes the spectrum to be Gaussian, which is an ideal spectrum, as it does
not result in any side lobes for the axial PSF. Most of the practical light sources
however do not have a Gaussian spectrum. Their spectrum instead, has large
modulations, which results in side lobes and broadening of the axial PSF. Figure 2.9
shows this effect by comparing the PSF from a Gaussian spectrum and a practical
spectrum from a light source both having the same bandwidth. PSF broadening
results in reduction in axial resolution while the side lobes cause a reduction in the
sensitivity of the system, by transferring power from the PSF to the noise floor. Side
lobes can also lead to obscuration of a potential weak signal from an adjacent layer,
thus reducing the effective resolution. This problem can be overcome by using digital

66
or optical filters, which shape the modulation in the spectrum by suppressing certain
wavelengths [22,23]. Another method is to spatially disperse the spectrum and then
selectively suppressing certain wavelengths by spatially attenuating the dispersed
light [24].
Figure 2.9 The comparison of the PSF obtained from an ideal Gaussian spectrum and a practical spectrum of a light source used in OCT systems (a). The deviation of the spectral shape from the
ideal Gaussian shape leads to sidelobes and broadening in the PSF (b)

67
Bandwidth modification through OCT hardware
Even if the spectrum of the light source is a perfect Gaussian, the effective bandwidth
measured at the detector could be modified due to wavelength dependent
transmission of the optical components and spectral response of the detector. The
effective bandwidth can also be modified if chromatic aberration is present in the
OCT optics. Chromatic aberration causes different wavelengths to focus at different
axial positions in the sample. Hence a particular interface in the sample while in focus
for one wavelength might be out of focus for the other. This will result in a
wavelength dependent variation in effective sample reflectivity (Rs) for a particular
interface, leading to a change in the spectral shape and effective bandwidth detected.
To optimize the axial resolution the spectral shaping of the light should compensate
for these modifications in the spectrum.
Dispersion
Dispersion in any medium causes different frequencies to travel with a non-linearly
related phase velocities. If there is a mismatch in the dispersion in two arms then the
effective optical path lengths seen by different frequencies in the sample will be
different, leading to broadening of the axial PSF. Hence for optimal axial resolution
dispersion in the two arms should be matched. For anterior segment OCT generally
this can be achieved by just matching the optics in the two arms, in retinal OCT,
however, the dispersion arising due to the 25 mm of ocular media in front of retina
has to be compensated by using a matching dispersive media, for example 25 mm of

68
water [25]. Numerical methods for dispersion compensation in FDOCT have also
been proposed [26,27].
k-space remapping
In the FDOCT the Fourier transform of the spectral interferogram has to be carried
out in k-space. However the spectral interferogram is rarely sampled linearly in k-
space for both SDOCT and SSOCT. Taking the Fourier transform of the
interferogram obtained directly from the system will lead to broadening in the PSF.
To avoid this degradation, nonlinear phase of the measured interferogram has to be
corrected, by resampling the raw data obtained from the system, so that equally
spaced fringes in k-space can be obtained. Any error in this remapping will cause a
reduction in the axial resolution. Hence in SDOCT, spectrometer should be well
calibrated so that the position where each wavelength is falling is precisely known
while in SSOCT the instantaneous wavelength of the light source should be tracked
accurately while interference fringes are being detected.
Polarization mismatch between reference and sample arm
The fringe visibility of two interfering light beams depends not only on the
correlation between their associated fields but also on how well their polarization
states are matched. Perfectly matched polarization will result in perfect interference
with no loss in fringe visibility, while orthogonal polarizations will not interfere at all.
A wavelength dependent mismatch in polarization state in the sample and reference
arm, due to polarization dispersion or sample birefringence, can therefore lead to a

69
wavelength dependent change in fringe visibility. This will lead to modulations in the
envelope of the spectral interference fringes and reduce the axial resolution.
Therefore the polarization controllers are used in both the reference and sample arm
to optimize the interference signal.
2.5.2 Imaging Depth
The imaging depth of the FDOCT is fundamentally determined by the maximum
optical path difference between the reference mirror and a reflector in the sample arm
for which OCT signal can be obtained. However following factors can also affect the
imaging depth of an OCT system.
Sample scattering and absorption
OCT shines infrared light into the sample for imaging. While travelling through the
sample, light undergoes scattering and absorption. Both these processes lead to
increased loss in the reflected signal with depth. There is a depth beyond which the
signal coming back from the sample becomes smaller than the noise. The system then
is not capable of imaging any structural features. Hence absorption and scattering
parameters of the sample play a very important role in determining OCT imaging
depth. In anterior segment OCT generally the tissue to be imaged (cornea and
crystalline lens) is transparent. Hence this limitation is not very critical and other
factors discussed below become more dominant. For imaging the retina or skin this is
a major factor determining the imaging depth.

70
Objective lens depth of focus
The OCT signal is the strongest from the sample portions where the OCT beam is
focused. The signal reduces axially for the out of focus portions with the reduction in
signal being faster if the OCT beam goes out focus rapidly. To reduce this loss in
signal from out of focus portions, the NA of the focusing lenses in OCT is usually
kept small so that the depth of focus is increased. This however affects the lateral
resolution as smaller NA leads to a larger focal spot on the sample. Generally a
balance has to be maintained between the two parameters to achieve optimal image
quality.
Detection Linewidth
As mentioned in section 2.3.1, in FDOCT, an A-scan is obtained by measuring the
spectral interferogram. The spectrally split light however has a finite bandwidth,
which depends on the spectral resolution of the spectrometer in SDOCT and
instantaneous linewidth of the tunable light source in SSOCT. This means that the
signal obtained on the detector is a convolution of the ideal spectral interferogram
with a Gaussian function, which has the FWHM equal to the spectral
resolution/instantaneous linewidth δk. After Fourier transformation of the detector
signal, it can be seen that the A-scan will have an additional factor, which decreases
with axial depth. Mathematically this could be represented as

71
2 2 2
2
ˆ 4ln(2)( ).exp ( ) exp4ln(2)
FD D
z k ki z I kk
δδ
⎛ ⎞ ⎛ ⎞− ←⎯→ ⊗ −⎜ ⎟ ⎜ ⎟
⎝ ⎠ ⎝ ⎠
where z is the real axial coordinate and is defined as z = z / 2 (Eq. 2.14). The signal
obtained by the system hence falls off with depth. The imaging depth, defined as the
one side distance from the reference arm for which the sensitivity falls off to ½, from
Eq. 2.15 is given as
202ln(2) ln(2)ˆIDz k
λδ π δλ
= =
Where δλ is the detection linewidth in wavelength units. The imaging depth hence is
inversely proportional to the detection linewidth. Note that the expression for the
imaging depth is the same as half of the coherence length described in Eq. 2.7 where
the source bandwidth is replaced with the detection linewidth. From this observation
the depth dependent fall off factor of Eq. 2.15 in the OCT signal can physically be
attributed to the reduction in the visibility of the interference fringes for larger optical
path differences due to the limited coherence length corresponding to the detection
linewidth.
Spectral interferogram sampling
Even if the detection linewidth is narrow enough and objective lens depth of focus
large enough to allow for larger imaging depth, if the spectral interferogram is not
sampled correctly, this will lead to aliasing artifacts. Hence sampling the
interferogram adequately is critical for optimal system performance. Assuming that
2.16
2.15

72
spectral interferogram is measured over the spectral range Δk in wavenumber domain
(k-space) and sampled over M data points with an interval of skδ , then in the space
domain (z-space) the sampling interval will be ˆ 2 / (2 )s z kδ π= Δ , where the factor of
2 in the denominator arises due to the double pass factor. The imaging depth hence
will be given as
zmax =M2! sz =
"2! sk
= #02
4! s#
where λ0 is the center wavelength and δsλ is the sampling interval in the wavelength
units. Eq. 2.17 can be used to select appropriate sampling of the spectral
interferogram such that the aliasing artifact can be avoided in the OCT images.
2.5.3 Sample Scanning
A-scans in FDOCT are obtained directly by Fourier transforming the spectral
interferogram. B-scan or lateral scan is carried out by lateral point scanning of the
imaging beam on the sample. Figure 2.10 shows the three common B-scan
geometries, sector scan, telecentric scan and concentric scan that have been proposed
for OCT [9]. A sector scan sweeps the beam of light in a divergent fan, retinal OCT
generally employs sector scan, which matches with the spherical geometry of the
retina. Telecentric scanning geometry has all the chief rays on the sample side parallel
to the optical axis and perpendicular to the image plane. Telecentric geometry is the
most commonly used scanning method for lateral scanning in the anterior segment
2.17

73
OCT as it provides a flat imaging plane thus decreasing the amount of post processing
needed to display geometrically correct images. In concentric scanning the beams are
swept in a convergent fan, this geometry is not preferred as it restricts the field size
imaged on the sample and also for anterior segment imaging there is a strong specular
reflection from the anterior corneal surface, which saturates the detector.
Figure 2.10 Three common scan geometries used in OCT systems, the sector scan, telecentric
scan and concentric scan (Adapted from W. Drexler and J.G. Fujimoto, Optical Coherence Tomography: Technology and Applications, Springer-Verlag Berlin Heidelberg 2008)
2.5.4 Imaging speed
High speed OCT imaging is critical for carrying out in vivo real time imaging in
biological samples. Motion of a living sample during the measurement can
significantly degrade the SNR due to fringe washout and cause severe distortions in
the image. This has been one of the biggest limiting factors in carrying out 3D
volumetric imaging using OCT. With the development of highly sensitive
CCD/CMOS cameras and high-speed tunable lasers, there has been rapid

74
improvement in the imaging speed of OCT systems where whole sample image can
be acquired in such a small duration that all of the sample motion appears frozen in
time. This improvement has lead to the possibility of carrying out 3D imaging in a
living sample with minimal impact of motion artifacts [28]. Extremely fast imaging
speeds also enable repeated sequential acquisition of the images of the same place in
the sample, which could then be averaged in post-processing to improve the image
contrast. Moreover high speed OCT system is useful in quantifying the temporal
characteristics of the fast dynamic processes occurring in the sample.
In SDOCT the imaging speed is limited by the readout time of the linescan camera in
the spectrometer. In ophthalmic OCT strict restrictions on the incident power are
present for eye safety. At the same time fast imaging speed for real time image
display is also required. Hence for high speed OCT, the line scan camera for the
spectrometer must have a low noise, high sensitivity, and high dynamic range
CCD/CMOS sensor. The highest speed for a SDOCT that has been reported achieves
312,500 A-scans/s using a high speed CMOS camera [29].
For SSOCT the imaging speed depends on the speed at which the tunable laser can
sweep one frequency cycle. In a traditional swept laser the sweep rate was limited by
the finite buildup time of lasing from spontaneous emission. This enabled the SSOCT
to achieve A-scan rates of upto 115 KHz [30,31]. However with the introduction of
Fourier domain mode locked laser (FDML), there has been an order of magnitude
improvement in the A-scan speed. FDML is a rapidly scanning wavelength tunable

75
laser where the cavity roundtrip time is synchronized to the wavelength filter tuning
rate using about one km long delay line [32]. All the wavelengths lase in the cavity at
the same time hence the buildup time for lasing is avoided and much faster tuning
rates can be attained. Axial scan rates of up to 20MHz with a reasonable OCT image
quality have been recently demonstrated using a FDML laser operating at around
1300nm [33].
2.6 Summary
OCT is a biomedical imaging modality, which is based on low coherence
interferometry. It is a complicated optical system and to achieve optimal performance
various factors need to be taken into consideration. The main parameters that define
the performance of an OCT system include the axial and lateral resolution, imaging
depth and imaging speed. The axial resolution of the system depends on the
bandwidth of the light source while the lateral resolution is dependent on the spot size
on the sample. To obtain large imaging depth, the depth of focus of the OCT system
is kept high by using a small NA objective lens. In addition high spectral resolution of
detection is required to reduce the steepness of reduction in sensitivity with depth.
The speed of the OCT has exponentially increased in the past decade with the
advances in detectors and light sources, making 3D volumetric imaging using OCT
possible. New developments in the OCT technology are pushing these performance
parameters to higher limits.

76
References
1. Y. Pan, R. Birngruber, J. Rosperich, and R. Engelhardt, “Low-coherence optical tomography in turbid tissue: theoretical analysis” Applied Optics, 34(28), 6564-6574 (1995)
2. L. S. Dolin, “A theory of optical coherence tomography,” Radiophysics and quantum electronics 41(10), 850-873 (1998)
3 R. Leitgeb, C. Hitzenberger, and A. F. Fercher, “Performance of fourier domain vs. time domain optical coherence tomography,” Opt. Exp. 11(8), 889-894 (2003)
4. M. Choma, M. Sarunic, C. Yang, and J. Izatt, “Sensitivity advantage of swept source and Fourier domain optical coherence tomography,” Optics Express, 11(18), 2183-2189 (2003)
5. J. F. de Boer, B. Cense, B. H. Park, M. C. Pierce, G. J. Tearney, and B. E. Bouma, “Improved signal-to-noise ratio in spectral-domain compared with time-domain optical coherence tomography,” Opt. Lett. 28(21), 2067-2069 (2003)
6. A. F. Fercher, “Optical Coherence Tomography,” J. Biomed. Opt. 1(2), 157–173 (1996)
7. J. M. Schmitt, “Optical Coherence Tomography (OCT): A Review,” IEEE J. Sel. Top. Quant. Electron. 5(4), 1205-1215 (1999)
8. M. E. Brezinski, Optical coherence tomography Principles and applications, Academic Press, New York 97-146, 2006
9. W. Drexler, J. G. Fujimoto, Optical Coherence Tomography Technology and Applications, Springer-Verlag Berlin Heidelberg, 47-72, (2008)
10. J.G. Fujimoto, M.E. Brezinski, G.J. Tearney, S.A. Boppart, B. Bouma, M.R. Hee, J.F. Southern and E.A. Swanson, “Optical biopsy and imaging using optical coherence tomography,” Nature medicine, 1(9) 970- 972 (1995)
11. B. L. Danielson and C.Y. Boisrobert, ‘‘Absolute Optical Ranging Using Low Coherence Interferometry,’’ Appl. Opt., 30, 2975–2979 (1991).
12. M. Haruna, M. Ohmi, T. Mitsuyama, T. Tajiri, M. Maruyama, and M. Hashimoto, ‘‘Simultaneous Measurement of the Phase and Group Indices and the Thickness of Transparent Plates by Low-Coherence Interferometry,’’ Opt. Lett., 23, 966–968 (1998).

77
13. A. F. Fercher, K. Mengedoht, and W. Werner, “Eye-length measurement by interferometry with partially coherent light“ Optics Letters, 13(3), 186-188 (1988)
14. X. Clivaz, F. Marquis-Weible, R. P. Salathé, R. P. Novàk, and H. H. Gilgen, “High-resolution reflectometry in biological tissues,” Optics Letters, Vol. 17, Issue 1, pp. 4-6 (1992)
15. J. M. Schmitt, A. Knüttel, and R. F. Bonner, “Measurement of optical properties of biological tissues by low-coherence reflectometry,” Applied Optics, Vol. 32, Issue 30, pp. 6032-6042 (1993)
16. D. Huang, E. A. Swanson, C. P. Lin, J. S. Schuman, W. G. Stinson, W. Chang, M. R. Hee, T. Flotte, K. Gregory, C. A. Puliafito and J. G. Fujimoto, “Optical coherence tomography,” Science, 254, 1178-1181, (1991)
17. Joseph W. Goodman (1985). Statistical Optics. Wiley-Interscience
18. J. H. Scofield “Frequency domain description of a lock-in amplifier” Am. J. Phy. 62(2), 129-133, (1994)
19. T. Corle, G. Kino, Confocal scanning optical microscopy and related imaging systems (Academic Press, San Diego, 1996)
20. A.F. Fercher a, C.K. Hitzenberger a, G. Kamp a, S.Y. El-Zaiat, “Measurement of intraocular distances by backscattering spectral interferometry,” Volume 117, Issues 1–2, 15 May 1995, 43–48
21. T. Klein, W. Wieser, C.M. Eigenwillig, B.R. Biedermann, and R. Huber, “Megahertz OCT for ultrawide-field retinal imaging with a 1050nm Fourier domain mode-locked laser,” Optics Express, 19(4), 3044-3062 (2011)
22. R. Tripathi, N. Nassif, J. S. Nelson, B. H. Park, and J. F. de Boer, “Spectral shaping for non-Gaussian source spectra in optical coherence tomography,” Optics Letters, 27(6), 406-408 (2002)
23. A. C. Akcay, J. P. Rolland, and J. M. Eichenholz, “Spectral shaping to improve the point spread function in optical coherence tomography,” Optics Letters, 28(20), 1921-1923 (2003)
24 W. Drexler, “Ultrahigh-resolution optical coherence tomography,” Journal of Biomedical Optics 9(1), 47–74 (2004)

78
25. W. Drexler, C. K Hitzenberger, A. Baumgartner, O. Findl, H. Sattmann and A. F. Fercher, “Investigation of the dispersion effects in ocular media by multiple wavelength partial coherence interferometry,” Exp. Eye Res (1998) 66(1), 25-33
26. B. Cense, N. A. Nassif, T. C. Chen, M. C. Pierce, S. Yun, B. H. Park, B. E. Bouma, G. J. Tearney, J. F. de Boer, “Ultrahigh-resolution high-speed retinal imaging using spectral-domain optical coherence tomography,” Opt. Exp. 12(11) 2435-2447 (2004)
27. M. Wojtkowski, V. J. Srinivasan, T. H. Ko, J. G. Fujimoto, A. Kowalczyk and J. S. Duker, “Ultrahigh-resolution, high-speed, Fourier domain optical coherence tomography and methods for dispersion compensation,” Opt. Exp. 12(11) 2404- 2422 (2004)
28. M. W. Jenkins, D. C. Adler, M. Gargesha, R. Huber, F. Rothenberg, J. Belding, M. Watanabe, D. L. Wilson, J. G. Fujimoto, and A. M. Rollins, “Ultrahigh-speed optical coherence tomography imaging and visualization of the embryonic avian heart using a buffered Fourier Domain Mode Locked laser,” Opt. Express 15(10), 6251–6267 (2007).
29. B. Potsaid, I. Gorczynska, V. J. Srinivasan, Y.Chen, J. Jiang, A. Cable, and J. G. Fujimoto,“Ultrahigh speed Spectral / Fourier domain OCT ophthalmic imaging at 70,000 to 312,500 axial scans per second,” Opt. Express 16(19), 15149- 15169 (2008)
30. Y. Yasuno, V. Madjarova, S. Makita, M. Akiba, A. Morosawa, C. Chong, T. Sakai, K. Chan, M. Itoh, and T. Yatagai, Opt. Express 13, 10652 (2005).
31. W. Y. Oh, S. H. Yun, B. J. Vakoc, G. J. Tearney, and B. E. Bouma, Appl. Phys. Lett. 88, 103902 (2006).
32. R. Huber, M. Wojtkowski, and J. G. Fujimoto, “Fourier Domain Mode Locking (FDML): A new laser operating regime and applications for optical coherence tomography,” Opt. Express 14(8), 3225-3237 (2006).
33. W. Wieser, B. R. Biedermann, T. Klein, C. M. Eigenwillig and R. Huber, “Multi-Megahertz OCT: High quality 3D imaging at 20 million A-scans and 4.5 GVoxels per second,” Opt. Exp, 18(14), 14685-14704 (2010).
79
Chapter 3
Large scan depth anterior segment OCT
3.1 Introduction
Accommodation is the eye’s ability to change focus on objects from far to near or
vice versa. Although various theories for the mechanism of accommodation have
been proposed, it still remains controversial. By far the most widely accepted theory
is the Helmholtz’s theory suggesting that during accommodation contraction of the
ciliary muscle reduces zonular tension thus rounding up the lens, resulting in an
increase in optical power [1]. Tscherning proposed that contraction of the ciliary
muscle increases zonular tension resulting in peripheral flattening and central forward
bulging of the lens [2]. Schachar proposed a modification of Tscherning’s theory
wherein contraction of the ciliary muscle results in stretching of equatorial zonules
and relaxing of the anterior and posterior zonules [3]. Coleman mentioned ciliary
muscle contraction creates a pressure gradient between the vitreous and aqueous

80
compartments causing anterior movement of the lens along with steepened radius of
curvature in the center of the lens with slight flattening of the peripheral lens [4].
Experimental data in this area is equally controversial. Studies consistent with
Helmholtz’s theory include a high resolution MRI study showing lens rounding along
with reduction in the lens equatorial diameter [5] and a UBM study suggesting
forward and anterior movement of the ciliary process after ciliary muscle contraction
[6]. On the contrary a study consistent with Tscherning’s/Schachar’s theory showed
central steepening and peripheral flattening of excised lens on artificial stretching
using real time topography [7]. The observation of the eye’s negative shift of the
spherical aberration with accommodation [8] is also consistent with the
Tscherning’s/Schachar’s theory. GRIN distribution measurement in-vivo in the
crystalline lens using MRI has shown a reduction in peripheral lens refractive index
with accommodation [9]. This can explain the induction of negative spherical
aberration, while maintaining the validity of Helmholtz’s theory. However the lack of
information on changes in lens surface asphericity with accommodation makes it
difficult to confirm the validity of this hypothesis.
This limitation is due to the inability of current imaging systems to visualize
biometric changes in the anterior segment during accommodation at high resolution.
Anterior segment OCT (AS-OCT) has been suggested as one of the imaging modality
that can be used to image the crystalline lens and measure the shape changes in the
lens with accommodation. The movement of accommodating intraocular lenses

81
(IOLs) has already been studied with OCT [10,11], the real time shape change of the
crystalline lens during the process of accommodation has recently been observed
using OCT [12]. However these changes were observed over a relatively small lateral
portion due to occlusion by the iris. Also, imaging only the crystalline lens cannot
provide accurate information about total power changes during accommodation, since
the potential axial movement of the lens during accommodation can also contribute to
the power change significantly [13]. To better understand the mechanism of
accommodation, the ability to image the entire anterior segment is necessary as it
provides information about both axial movement and shape changes of the lens. The
cornea could then be used as a reference to measure the axial motion of the lens. Such
information on the shape changes of the crystalline lens and its axial movement with
accommodation will provide a more comprehensive foundation to validate the
theories of accommodation.
The total axial length of the anterior segment, from the apex of the anterior corneal
surface to the posterior lens surface, is approximately 7.7 mm (10.2 mm optical path
length at n =1.33) according to Gullstrand eye model [14]. As discussed in chapter 2,
the sensitivity of an OCT system decreases with depth due to finite linewidth of light
being detected and limited depth of focus of the objective lens. Due to this the signal
from the deeper ocular surfaces, especially the posterior surface of the lens is
considerably reduced. There is also reduction in the signal intensity from the
peripheral portions of the eye arising due to the scanning geometry used in AS-OCT.
Most of the AS-OCT systems use telecentric scan geometry in which the beam is

82
shined straight into the eye parallel to the optical axis. The angle of incidence on the
ocular surfaces especially the posterior surface of the crystalline lens increases as the
regions further away from the optical axis of the eye are scanned. With larger angles
of incidence, the direction of reflected light is much farther from the direction of the
incident beam. This leads to a significant reduction in the amount of backscattered
light collected by the OCT system. Thus the interference signal from these regions
becomes weak. The other limitation with using telecentric scan is the need for pupil
dilation to image a larger lateral portion of the lens as the iris blocks the OCT beams.
The accommodative response with a dilated pupil may not be identical to that with
the natural pupil and in elderly patients it is often difficult to dilate the pupil, thus
limiting the lateral view of the lens.
Various methods to improve the imaging depth of an OCT system has been proposed,
one of them increases OCT imaging depth by a factor of two by removing the mirror
image in OCT imaging [15,16]; another method involves combining simultaneous
images from two different OCT systems at different wavelengths [17]. Recently, a
new method has been proposed that uses an optical switch to shift focus at two
different axial locations and to match the reference mirror location, [18]. These
methods, although succeeding in improving the depth sensitivity, still suffer from low
SNR resulting from the reduced OCT signal strength from the peripheral sections of
the ocular surfaces and need pupil dilation for visualizing the lateral portions of the
lens.
83
In this chapter we present a new method of sample scanning for AS-OCT that
enhances SNR of OCT images by achieving nearly normal incidences across both the
lens surfaces. This improvement allows for imaging the entire anterior segment from
the anterior surface of the cornea to the posterior surface of the lens. The scanning
method proposed here also has the capability to image a larger lateral portion of the
posterior crystalline lens surfaces under the natural pupil condition.
3.2 Scan design for improving SNR
The Gullstrand-Emsley relaxed schematic eye model [14] was used for system
design. To achieve normal incidence on any surface the exit pupil of the system must
be located at the center of curvature of that surface. Since the centers of curvature of
the four ocular surfaces are not located at the same position, it is impossible to design
a radially symmetric optical system, which could achieve this. We, therefore, propose
an asymmetric system. Figure 3.1 demonstrates the idea behind our new scanning
system design. The scanning system is divided into two halves: one optimized to
achieve nearly normal incidence angles on the two corneal surfaces and the anterior
surface of the lens, the other optimized for the posterior surface of the lens. Two
semicircular halves from each system were combined together to form a single optical
system.

84
Figure 3.1 (a) Conventional telecentric scan geometry (b) Scan geometry to achieve normal incidence on the posterior and anterior surface of the lens
The complete schematic of the system is shown in Figure 3.2. The system design can
be divided into a pupil relay system and a focusing lens. The pupil relay is used so
that the exit pupil can be placed at the center of curvature of the lenticular surfaces,
while the focusing lens is used to focus the beams at the lenticular surfaces. The pupil
relay system has two concave mirrors; concave mirror1 is radially asymmetric,
formed by combining semicircular halves of two spherical concave mirrors with
different radii of curvature while concave mirror2 is radially symmetric spherical
mirror. The focusing lens is also radially asymmetric and constitutes of semicircular
halves from two plastic poly methyl methacrylate (PMMA) lenses that have aspheric
surface profiles on both sides. Zoomed in view in Figure 3.2 shows the way beams
are scanned on each of the four surfaces. For the posterior surface of the lens, the
beams can now scan a larger lateral portion without being blocked by the iris, which
allows for an increase in the lateral view of the posterior surface. It should be noted
that in one lateral scan only half of the anterior segment of the eye is imaged and to

85
image the other half the focusing lens and concave mirror1 need to be rotated by 180
degrees.
Figure 3.2 The schematic of the scanning system, blue beams are incident nearly normal to the
two corneal surfaces and anterior lens surface, red beams are incident nearly normal to the posterior lens surface. Concave mirror1 and focusing lens are assembled by combining
semicircular halves of two different optical elements represented in gray and black. Concave mirror2 is a one-piece optical element and is same as the portion of concave mirror1, which is used for imaging the posterior surface of the lens. Zoomed in view shows the paths travelled
inside the eye by the scanning beams
3.3 Image distortion
The raw images obtained from any OCT system have inherent refractive distortion.
During OCT image formation from the raw data it is assumed that the beams go
straight through the tissue without getting deflected. In reality, due to refraction of
light, the beams get deflected after entering the sample; these skew paths travelled by
86
the light beams are mapped onto a straight line in the OCT images, leading to
distortions in the image. In telecentric scanning, removing this distortion is relatively
straightforward. Since the beams in telecentric scanning are travelling parallel to the
optical axis, the first surface in the image remains undistorted. Using the curvature
profile obtained for the first surface and assuming appropriate refractive index for the
sample, the true surface profiles of the subsequent surfaces can be obtained using ray
tracing [19,20]. Due to the non-telecentric nature of our scanning method large
amounts of refractive distortion are expected in the images even for the first surface.
The expected distortion was theoretically evaluated using optical ray tracing software
(CodeV, Optical Research Associates). Figure 3.3 shows the expected raw images
from anterior and posterior lens surface scan geometries. Note that these images only
represent half of the anterior segment. We can clearly see that even the first surface is
distorted substantially. With no knowledge about the first interface it is difficult to
construct subsequent surfaces.
We therefore developed a new method to reconstruct the first surface of the eye. As a
one-time measurement for distortion correction, the system imaged a flat surface,
which was kept at the same position as the vertex plane of the front surface of the
cornea and perfectly perpendicular to the optical axis. The perpendicularity of the flat
interface was ensured by optimizing the signal obtained from the interface itself.

87
Figure 3.3 The simulated image, showing half of the eye, for (a) telecentric scan (b) anterior lens imaging system (c) posterior lens imaging system. ACS: Anterior Corneal Surface, PCS: Posterior Corneal Surface, ALS: Anterior Lens Surface, PLS: Posterior Lens Surface
Figure 3.4 shows the geometry of the distortion correction method. The relationship
between coordinates on the flat interface (y1n,z1n) and the coordinates on the first
sample surface, (y2n,z2n) is given by
3.1
where, un is the slope angle of the beam and dn is the optical path length that beam
needs to travel from flat interface to the sample. The subscript n denotes the A scan
value or lateral pixel value in the image.
To construct the sample surface profile we need to know the flat surface coordinates,
slope angle of the beam and the optical path length. The distorted surface profiles of
the flat interface and sample surface are measured by the system. By subtracting the
nnnn
nnnn
udzzudyy
cos12sin12
+=+=

88
sample surface profile from the flat surface profile the information on the residual
optical path lengths (dn) that the OCT beam has to travel to reach from the flat surface
to the cornea can be measured.
Figure 3.4. The schematic of the distortion correction method. As a one-time measurement a flat
surface was placed at the same location as the vertex of the anterior cornea. The difference between the profiles obtained for the first surface of the eye and the perfectly flat surface
provides information on residual optical path lengths (dn). This information was use with the experimentally measured lateral coordinates (y1n,z1n) and slope (un) angle to come up with the
corrected profile of the first interface
Since the flat surface is located at the same axial location as the position where apex
of the anterior corneal surface is to be kept, z1n can be assumed zero for all n. The
lateral coordinates y1n were obtained experimentally by placing the flat interface so
that one of its edges can be seen in the image. The flat interface was then moved
laterally by known amounts on a translation stage. The image of the flat interface was
acquired at each lateral location by the system and the number of lateral pixels by
which the edge shifted in the image was noted. These discrete values for physical

89
movement of the edge and lateral pixel shifts were then interpolated to come up with
the lateral coordinates (y1n) corresponding to each lateral pixel in the image.
The slope angle un was calculated by measuring the lateral coordinates for the flat
interface at two different axial locations (z1 and z2). Assuming the lateral coordinates
for an nth lateral pixel at z1 is yz1n and for z2 is yz2n then un will be given as
un = tan!1 yz1n ! yz2n
z1! z2"#$
%&' 3.2
These values for z1n, y1n, dn and un were then plugged in Eq. 3.1 to obtain the
coordinates for first interface in the sample. After obtaining the surface profile of the
first surface, the subsequent surface profiles can be obtained using ray tracing.
3.4 Imaging performance in model eye
To evaluate the performance of our scanning system and distortion correction
algorithm, a model eye was constructed by using an artificial cornea and lens, both
made of PMMA. Figure 3.5 shows the schematic of the model eye. The radii of
curvature of the anterior and posterior surface of the artificial cornea were 7.8 mm
and 6.5 mm respectively and central thickness of the cornea was 0.5 mm. The anterior
and posterior surfaces of the lens had radii of curvature of 10.0 mm and -6.0 mm,
respectively and the central thickness was 3.6 mm. The anterior lens surface was kept

90
at 3.5 mm from the posterior surface of the artificial cornea and the entire lens was
submerged in water.
3.5 Schematic of the model eye, which was constructed by an artificial cornea and lens made of
PMMA. The dimension were matched with the Gullstrand model eye
The images were obtained by a swept source OCT, the schematic of which is shown
in Figure 3.6. It consisted of an amplified swept laser operating at 4 KHz tuning
frequency (λ = 1300nm, δλ = 100 nm). 10% of the light coming out of the swept laser
is sent to a fiber based Mach-Zehnder interferometer that acts as a frequency clock,
monitoring the instantaneous frequency of the light source. 90% of the light goes into
the OCT system, where a circulator couples all the light coming from the light source
to a 50/50 fiber coupler. The fiber coupler splits the beam into reference and sample
arm. In the sample arm, the beam, through our custom scanning optics, is shined onto
the sample. In the reference arm the beam strikes the mirror and is directed back to
the fiber output. The beams coming from the two arms are mixed in the fiber coupler.
50% of the light then directly goes back to one input of a dual balanced detector while
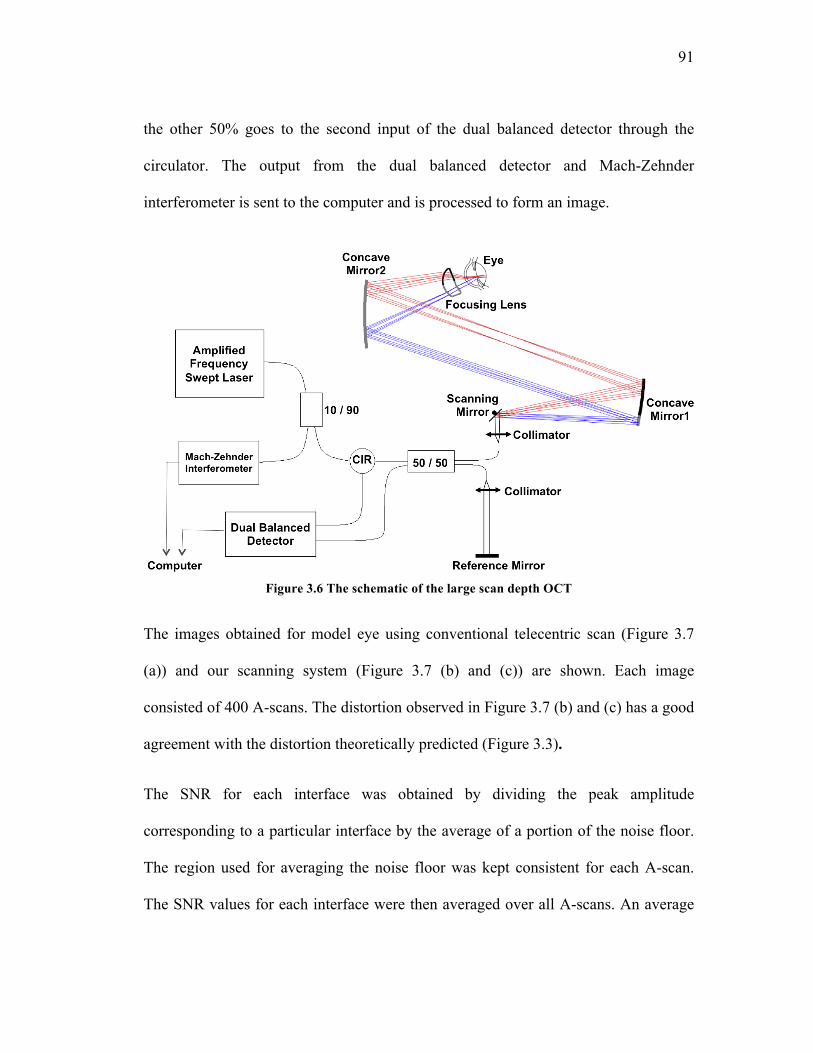
91
the other 50% goes to the second input of the dual balanced detector through the
circulator. The output from the dual balanced detector and Mach-Zehnder
interferometer is sent to the computer and is processed to form an image.
Figure 3.6 The schematic of the large scan depth OCT
The images obtained for model eye using conventional telecentric scan (Figure 3.7
(a)) and our scanning system (Figure 3.7 (b) and (c)) are shown. Each image
consisted of 400 A-scans. The distortion observed in Figure 3.7 (b) and (c) has a good
agreement with the distortion theoretically predicted (Figure 3.3).
The SNR for each interface was obtained by dividing the peak amplitude
corresponding to a particular interface by the average of a portion of the noise floor.
The region used for averaging the noise floor was kept consistent for each A-scan.
The SNR values for each interface were then averaged over all A-scans. An average

92
SNR improvement of 5dB and 12dB was obtained for the anterior and posterior
surface, respectively. For the posterior corneal surface SNR improvement of 4dB was
observed while 0.7 dB SNR improvement was observed for anterior corneal surface.
Figure 3.7 Images of the model eye obtained by (a) telecentric scan (b) anterior lens imaging
system (c) posterior lens imaging system. The arrow shows the reference mirror location. The DC term and mirror images were removed manually from the images
Figure 3.8 shows the distortion corrected surface profiles along with the fitted circular
curves. The distorted surface profiles in the raw images were obtained by using a
semi-automatic segmentation algorithm. The user defined a region of interest for each
interface where the algorithm searches for the pixel of highest intensity in each A-
scan. The obtained surface profiles were then corrected for distortion using the
algorithm explained in the previous section. The corrected surface profiles shown in
blue in Figure 3.7 were then fitted with circular curves shown in dashed red. The
fitted values in black are nearly identical to the actual values in parentheses with a
relatively small discrepancy. These errors might arise due to slight tilt and
decentration of the artificial cornea and lens in the model eye and the flat surface to

93
be used as reference. Better alignment of the model eye and reference flat surface
could improve the accuracy of the reconstruction algorithm
Figure 3.8 Distortion corrected surface profiles; solid curves represent the raw profile and dashed curves are circular curves fitted to the raw data. The dimensions obtained from curve
fitting, shown in black, are compared with actual values shown in parenthesis
3.5 Imaging performance in the real eye
After demonstrating the systems capability to image the entire anterior segment in the
model eye, in-vivo imaging was carried out in the real eye. In the real eye, to ensure

94
that both anterior lens scanning part and posterior lens scanning part image the same
portion of the eye, it is important to image both the anterior and posterior lens surface
in single measurement. To achieve this the signal shown in Figure 3.9 was given to
the scanning mirror. When the scanning mirror signal is negative the OCT beam is in
the posterior lens surface imaging portion of the scanning optics while when the
signal is positive the beam is in the anterior lens surface imaging portion.
Figure 3.9 The voltage signal given to the scanning mirror, so that both anterior and posterior
lens surface can be imaged in a single scanner sweep. The positive voltages were used for imaging the anterior lens surface while negative voltages were used for posterior lens surface
Figure 3.10(a) shows a typical image obtained by the system, right half of the image
is obtained from the posterior lens imaging system (when the scanning mirror signal
is negative) while the left half is obtained from anterior lens imaging system (when
the scanning mirror signal is positive).

95
Figure 3.10 (a) A typical image obtained by the large scan depth OCT. The left side of the image is obtained from the anterior lens surface system while the right side of the image is obtained by
posterior lens surface system. (b) The distortion corrected surface profiles obtained by the system and the fitted curves
Just as in the case of model eye, significant amount of distortion can be observed in
the images obtained from the model eye. The distorted surface profiles were obtained
by manually selecting the pixels on a particular interface. These profiles were then
corrected for distortion using the algorithm described in section 3.3 and are shown in
Figure 3.10(b). In the distortion correction, the refractive indices of 1.376, 1.33 and
1.401 were assumed for cornea, aqueous humor and lens [21]. The corrected profiles
were fitted with the circular curves for the corneal surface and conic curves for lens
surfaces. The manual selection process was repeated four times by the same observer
and the mean of the fitted radius of curvature and conic constant was obtained for

96
each interface. The mean radius of curvatures for the anterior and posterior corneal
surface were measured to be 7.70 mm and 7.45 mm respectively, while for anterior
and posterior lens surfaces were 10.47 mm and 6.30 mm respectively. The mean
conic constant for the anterior and posterior lens was 42.5 and -3.9 respectively.
3.6 Anterior segment biometric changes with
accommodation
To demonstrate the capability of the system to evaluate the lens shape changes with
accommodation, in-vivo imaging was carried out in two young subjects, age 25 and
27 years. The changes in the shape of the lens were quantified and compared with the
previous studies to validate the measurements.
3.6.1 Experimental protocol
Due to short working distance (6 mm) of large scan depth anterior segment OCT, it
was difficult to stimulate accommodation and carry out imaging in the same eye. As
the accommodative control mechanism in the two eyes is correlated [22], it is a
commonly used method to provide accommodation stimulus to one eye and
simultaneously image the other eye. Same method was used in our experiment
(Figure 3.11).

97
Figure 3.11. The experimental protocol to measure biometric changes in the anterior segment
with accommodation. Since working distance of large scan depth OCT was small, accommodation was stimulated in the other eye. (a) relaxed state (b) accommodated state. L1:
2D lens to acute target at infinity, L2: -5D trials lens to stimulate accommodation. Accommodation leads to involuntary convergence of the eye so a fixation spot was provided to
the imaged eye. When accommodation stimulus was provided the subject was asked to translate the target laterally and bring the fixation spot at the center of the target. This ensured that the
gaze of the imaged eye was always towards the system
The target was a Jewish star placed at 50 cm from the subjects, corresponding to -2D
vergence. A +2D lens was placed in front of the subject’s eye, to acute the target at
infinity. Subsequently, the accommodation was stimulated by putting trial lenses in
front of the eye. Involuntary convergence of the eyes due to accommodative stimulus
leads to the eye’s inward movement [23] resulting in tilting and lateral movement of
the lens and cornea (Figure 3.11(b)). Since the scanning optics is designed for eye
looking straight into the system, this tilt and shift causes errors in the estimation of

98
surface profiles. To ensure that the gaze of the eye been imaged is always towards the
imaging beam, a fixation spot was provided in the imaging path. Every time when a
new accommodation stimulus was given, the subject was asked to laterally translate
the accommodation stimulus such that fixation spot was always at the center of the
accommodation stimulus [24].
The accommodation stimulation was static at 0D and 5D. Images were obtained at the
at the frame rate of 3 frames/s. To minimize the patient’s head movement during the
measurement bite-bar was used. While aligning the subject, strong specular reflection
arising from the apex of the cornea was used as a reference to ensure that the imaging
is always carried out at the same location on cornea. Because strong reflection leads
to loss of information from the sample, before acquiring images the eye was moved
laterally by 0.5 mm to avoid saturating the reflection.
As outcome measures, the change in the radius of curvature and conic constant of the
two lenticular surfaces with accommodation along with the anterior chamber depth
and lens thickness were studied. Paired student’s t-test was performed to examine sta-
tistical significance (p < 0.05) of the changes in the outcome measures between the
two accommodation conditions.
3.6.2 Results
The large scan depth OCT was capable of visualizing all the four ocular surfaces in
both relaxed (0D) and accommodated (5D) states. A 3 mm radial section of the
posterior surface of the crystalline lens could be visualized without the need for pupil

99
dilation. The surface profiles obtained from the images were corrected for distortion.
Figure 3.12 (a) and (b) shows the surface profiles obtained by the system at 0 D in
blue and 5 D in red for the two subjects respectively. It can be seen that both corneal
surfaces are overlapping each other completely under the two accommodation
conditions. This indicates that the same portion of the eye was imaged in the two
measurements and the corneal surfaces did not change with accommodation as
expected. The anterior movement of the anterior lens surface with accommodation is
apparent in both the subjects while the apex of posterior lens surface stayed stationary
in one subject (Figure 3.12(a)) and moved slightly backwards in the other (Figure
3.12(b)).
Figure 3.12 The surface profiles obtained by the system at 0 D in blue and 5 D in red for the two
subjects (a) and (b) respectively
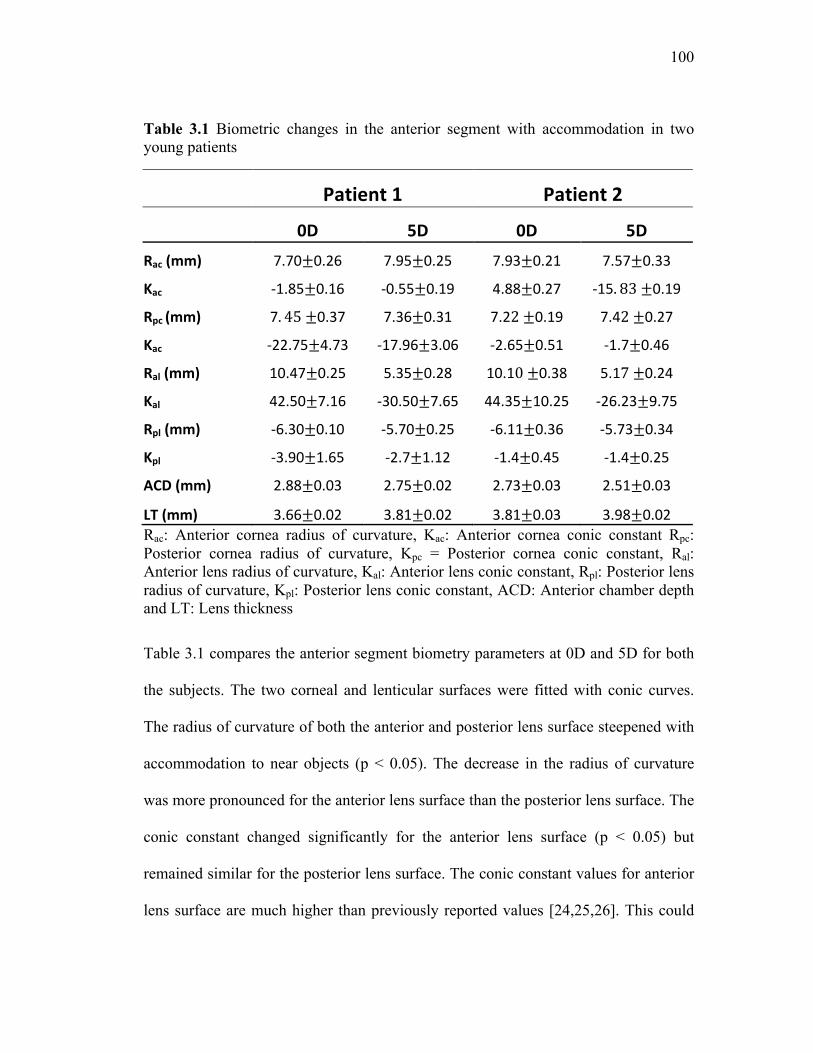
100
Table 3.1 Biometric changes in the anterior segment with accommodation in two young patients
Patient1 Patient2
0D 5D 0D 5DRac(mm) 7.70±0.26 7.95±0.25 7.93±0.21 7.57±0.33
Kac ‐1.85±0.16 ‐0.55±0.19 4.88±0.27 ‐15. 83±0.19
Rpc(mm) 7. 45±0.37 7.36±0.31 7.22±0.19 7.42±0.27
Kac ‐22.75±4.73 ‐17.96±3.06 ‐2.65±0.51 ‐1.7±0.46
Ral(mm) 10.47±0.25 5.35±0.28 10.10±0.38 5.17±0.24
Kal 42.50±7.16 ‐30.50±7.65 44.35±10.25 ‐26.23±9.75
Rpl(mm) ‐6.30±0.10 ‐5.70±0.25 ‐6.11±0.36 ‐5.73±0.34
Kpl ‐3.90±1.65 ‐2.7±1.12 ‐1.4±0.45 ‐1.4±0.25
ACD(mm) 2.88±0.03 2.75±0.02 2.73±0.03 2.51±0.03
LT(mm) 3.66±0.02 3.81±0.02 3.81±0.03 3.98±0.02Rac: Anterior cornea radius of curvature, Kac: Anterior cornea conic constant Rpc: Posterior cornea radius of curvature, Kpc = Posterior cornea conic constant, Ral: Anterior lens radius of curvature, Kal: Anterior lens conic constant, Rpl: Posterior lens radius of curvature, Kpl: Posterior lens conic constant, ACD: Anterior chamber depth and LT: Lens thickness
Table 3.1 compares the anterior segment biometry parameters at 0D and 5D for both
the subjects. The two corneal and lenticular surfaces were fitted with conic curves.
The radius of curvature of both the anterior and posterior lens surface steepened with
accommodation to near objects (p < 0.05). The decrease in the radius of curvature
was more pronounced for the anterior lens surface than the posterior lens surface. The
conic constant changed significantly for the anterior lens surface (p < 0.05) but
remained similar for the posterior lens surface. The conic constant values for anterior
lens surface are much higher than previously reported values [24,25,26]. This could

101
be because the fitting was done over only a 1.25 mm radial section, while the older
studies fit the curves over larger than 5 mm diameter. The anterior chamber depth
decreased and the thickness of the crystalline lens increased at 5D state (p < 0.05).
Most of the increase in the thickness of the lens was due to forward movement of the
anterior lens surface.
3.6.3 Discussion
Our proposed scanning method allowed for imaging the entire anterior segment of the
human eye starting from the anterior corneal surface to the posterior lens surface. All
the four ocular surfaces could be visualized in both relaxed and accommodated state.
Moreover the system successfully imaged the 3 mm radial section of the posterior
lens surface without the need for pupil dilation.
Due to the non-telecentric nature of the scanning system significant amounts of
distortion for all the four ocular surfaces were observed in the images. A novel
distortion correction algorithm hence was developed and applied successfully. The
distortion corrected surface profiles were fitted with the conic sections. The two
corneal and lenticular layers were fitted with with conic curves.
In the anterior segment biometric changes with accommodation, anterior movement
of the anterior lens surface was clearly observed for both the subjects while the
posterior lens surface stayed at the same location in one subject and moved slightly
backwards for the other. The radius of curvature of both the anterior and posterior
lens surface decreased with accommodation where the decrease in the radius of
102
curvature was more pronounced for the anterior lens surface than the posterior lens
surface. All the observations are consistent with the previous findings [27,28,29,30].
One of the controversies in the area of accommodation is the induction of negative
spherical aberration with accommodation when the overall power of the eye is
increased [8]. Potential answers to this question lie in the change in the GRIN index
and asphericity of the lenticular surfaces with accommodation. Most of the studies
examining lens asphericity have been on extracted crystalline lenses [25,26]. In-vivo
measurement on lens asphericity has been done using Scheimpflug camera [31],
however in Scheimpflug camera it is hard to image a wider lateral portion of the
posterior lens surface. Our large scan depth OCT system has an advantage that it can
image a wide portion of the posterior lens surface under the natural pupil condition
and can provide information on the posterior lens asphericity. In this study the change
in asphericity of both anterior and posterior lens was estimated with accommodation.
The conic constant for the anterior lens surface changed from a large positive value to
a large negative value in both the patients. Thus the surface changed from an oblate
ellipse to a hyperbola, indicating that the anterior lens surface becomes more flat in
the periphery with accommodation. This is consistent with the observation of
negative spherical aberration induction with accommodation. However, the fitting
was done over just a 1.25 mm radial section on one side of the apex of the crystalline
lens, hence further investigation is required to confirm this result. The posterior lens
surface conic constant stayed similar for both 0D and 5D accommodative state and
was negative. These results indicate that posterior lens surface contribution to the

103
overall lens power change and aberration change with accommodation is relatively
small. The hyperbolic surface profile of the accommodated lens surfaces is consistent
with similar previous observations in-vivo [30] and ex-vivo [26]. The conic constant
values obtained for posterior lens surface in this study are similar to these previous
findings, however the anterior lens surface conic constant values are much higher.
This could be because the fitting for anterior lens surface was carried out over only a
1.25 mm radial section.
Although not a significant change in the posterior lens surface was observed in this
study, the capability to image posterior lens surface could be used to study lens shape
change with age. It is known that the radius of curvature of both the anterior and
posterior lens surface increases with age. However the shift in best focus of the eye is
hypermetropic with age. This phenomenon is termed as the lens paradox and till now
there has been no concrete explanation for why it happens. The refractive index
changes [32,33] and surface asphericity [30] have been invoked to explain it but the
results obtained have not been able to explain the paradox. Our large scan depth OCT
could be used for better quantification of the posterior lens surface shape change with
age to explain lens paradox. Another area of interest for large scan depth OCT will be
to understand the efficacy of the accommodating intraocular lenses. Previous studies
have investigated the accommodative intraocular lens movement with
accommodation [10,11], however the measurement has been limited to just on axis
change of the anterior chamber depth. Our OCT can provide a more comprehensive

104
information in intraocular lens movement by quantify the changes in the cross-
sectional profile of accommodating intraocular lens with accommodation stimulation.
Although the large scan depth OCT has been successful in imaging the entire anterior
segment of the eye there are still some limitations left to be addressed. The system is
still not capable of imaging the wider lateral portion of the anterior lens surface
without dilation. Since the anterior lens surface plays a more prominent role in
changing the optical power of the eye with accommodation, it is important to image a
wider portion of the anterior lens surface with accommodation in natural pupil state.
It is extremely difficult to do this with an optical imaging technique, as the iris blocks
the view of the anterior lens surface. High resolution MRI is currently the only
technique that can look behind the iris [5,34] and holds the potential to overcome this
problem if its resolution improves in future.
The other limitation of the system is that in the distortion correction algorithm a
uniform refractive index of the crystalline lens is assumed, although it is known that
the crystalline lens refractive index has a GRIN distribution [9], where the refractive
index is higher in the center and smaller in the periphery. This assumption leads to
errors in the estimation of the surface profiles of the lens surfaces after distortion
correction. For more accurate distortion correction the GRIN distribution obtained in
the previous study [9] should be included in the distortion correction.
Yet another limitation of the system is that it only images half of the eye. To measure
the other half the asymmetric mirror and lens present in the scanning system needs to

105
be rotated on the optic axis by 180 degrees. By placing the two asymmetric optical
components on a motorized rotation stage and synchronizing the data acquisition
accordingly, this limitation could be overcome. Finally, the SNR performance of the
system from the peripheral cornea needs improvement as can be seen in Figure 3.11.
This loss of SNR is because of the limited instantaneous coherence length of the
tunable laser currently used. Using a tunable light source with improved line width
can overcome this limitation.
3.7 Conclusions
In this chapter we have demonstrated the feasibility of imaging the entire anterior
segment of the eye using a large scan depth OCT with novel scanning optics in the
sample arm. The scanning optics shines the beam normal to the ocular surfaces
leading to substantial improvements in the signal collection and depth penetration of
the OCT system. Moreover the capability to image a 3 mm radial section of the
posterior lens surface under natural pupil conditions was established using the large
scan depth OCT.
The system could successfully measure the biometric changes with accommodation in
two young normal subjects and the observed changes were consistent with the
previously published work. The changes in the anterior lens surface were more
pronounced than the posterior lens surface. The large scan depth OCT discussed in

106
this chapter can be a powerful tool for understanding the mechanism of
accommodation. The application of this technique can also be expanded to other areas
such as studying lens shape changes with age and evaluating the efficacy of
accommodating intraocular lenses.
References
1. Helmholtz’s Treatise on Physiological Optics. Translated from the 3rd German ed. Southall JPC, ed. New York: Dover Publications, (1962)
2. M. Tscherning Physiologic Optics: Dioptrics of the Eye, Functions of the Retina, Ocular Movements, and Binocular Vision, 2nd ed. Philadelphia: Keystone, 160–89 (1904)
3. R. A. Schachar, T. D. Black, R. L. Kash, D. P. Cudmore and D. J. Schanzlin “The mechanism of accommodation and presbyopia in the primate”, Ann. Ophthalmol. 27, 58–67 (1995)
4. J. Coleman, “On the hydraulic suspension theory of accommodation”, Trans. Am. Ophthalmol Soc. 84, 846–868 (1986)
5. S. A. Strenk, J. L. Semmlow, L. M. Strenk, P. Munoz, J. G. Jacob, and K. DeMarco, “Age-Related Changes in Human Ciliary Muscle and Lens: A Magnetic Resonance Imaging Study,” Invest. Ophth. Vis. Sci. 40, 1162-1168 (1999)
6. A. Glasser and P. L. Kaufman,“The Mechanism of Accommodation in Primates,” Ophthalmology 106, 863-872 (1999)
7. R. A. Schachar, “Qualitative effect of zonular tension on freshly extratcted intact human crystalline lenses: Implications for the mechanism of accommodation,” Invest. Ophth. Vis. Sci. 49, 2691-2695 (2004)
8. H. Cheng, J. K. Barnett, A. S. Vilupuru, J. D. Marsack, S. Kasthurirangan, R. A. Applegate and A. Roorda, “A population study on changes in wave aberrations with accommodation,” Journal of Vision 4, 272-280 (2004)
9. S. Kasthurirangan, E. L. Markwell, D. A. Atchison and J. M. Pope, “In vivo study of changes in refractive index distribution in the human crystalline lens with age and accommodation,” Invest. Ophth. Vis. Sci. 49, 2531-2540 (2008)
107
10. O. Findl, B. Kiss, V. Petternel, R. Menapace, M. Georgopoulos, G. Rainer, W. Drexler, “Intraocular lens movement caused by ciliary muscle contraction,” J. Cataract Refract. Surg. 29, 669–676 (2003)
11. C. Koeppl, O. Findl, R. Menapace, K. Kriechbaum, M. Wirtitsch, W. Buehl, S. Sacu, W. Drexler, “Pilocarpine-induced shift of an accommodating intraocular lens: AT-45 Crystalens,” J. Cataract Refract. Surg. 31, 1290–1297 (2005)
12. I., Grulkowski, M. Gora, M. Szkulmowski, I. Gorczynska, D. Szlag, S. Marcos, A. Kowalczyk, M. Wojtkowski, “Anterior segment imaging with Spectral OCT system using a high-speed CMOS camera,” Opt. Express 17, 4842-4858 (2009)
13. D. J. Coleman, S. K. Fish, “Presbyopia, accommodation, and the mature catenary,” Ophthalmology 108, 1544-1551 (2001)
14. Rabbetts, R.B., Bennett & Rabbetts’ Clinical Visual Optics Elsevier (2007)
15. Y. Yasuno, S. Makita, T. Endo, G. Aoki, M. Itoh and T. Yatagai, “Simultaneous B–M-mode scanning method for real-time full range Fourier domain optical coherence tomography,” Appl. Optics, 45, 1861-1865, (2006)
16. J. Jungwirth, B. Baumann, M. Pircher, E. Götzinger, and C. K. Hitzenberger, “Extended in vivo anterior eye-segment imaging with full-range complex spectral domain optical coherence tomography”, J. Biomed. Optics 14, 050501 (2009)
17. C. Zhou, J. Wang and S. Jiao, “Dual channel dual focus optical coherence tomography for imaging accommodation of the eye” Opt. Express 17, 8947-8955 (2009)
18. M. Ruggeri, S.R. Uhlhorn, C. De Freitas, A. Ho, F. Manns, and J.M. Parel, “Imaging and full-length biometry of the eye during accommodation using spectral domain OCT with an optical switch,” Biomed. Opt. Express 3, 1506-1520 (2012)
19. V. Westphal, A.M. Rollins, S. Radhakrishnan and J.A. Izatt, “Correction of geometric and refractive image distortions in optical coherence tomography applying Fermat’s principle,” Opt. Express, 10, 397-404 (2002)
20.A. Podoleanu, I. Charalambous, L. Plesea, A. Dogariu, R. Rosen, “Correction of distortions in optical coherence tomography imaging of the eye,” Phys. Med. Biol. 49, 1277–1294 (2004)
21. D. A. Atchison and J. Smith, Optics of the Human Eye, Elsevier (2002)

108
22. F. W. Campbell, “Correlation of accommodation between the two eyes,” J. Opt. Soc. Am. 50, 738-738 (1960)
23. E. F. Fincham and J. Walton, “The reciprocal actions of accommodation and convergence,” J. Physiol. 137, 488-508 (I957)
24. M. Dubbleman, G. L. Van der Heijde and H. A. Weeber, “Change in the shape of the aging human crystalline lens with accommodation,” Vision Res. 45, 117-132 (2005)
25. M. J. Howcroft and J. A. Parker, “Aspheric curvatures for the human lens,” Vision Res. 17, 1217-1223, (1977)
26. F. Mannsa, V. Fernandez, S. Zippera, S. Sandadia, M. Hamaouia, A. Hoc and J. Parel, “Radius of curvature and asphericity of the anterior and posterior surface of human cadaver crystalline lenses,” Exp. Eye Res. 78, 39–51, (2004)
27. N. P. Brown, “The change in shape and internal form of the lens of the eye on accommodation,” Exp Eye Res. 15, 441-459, (1974)
28. J. F. Koretz, C. A. Cook and P. L. Kaufman, “Aging of the human lens: changes in lens shape upon accommodation and with accommodative loss,” J. Opt. Soc. Am. A 19, 144-151 (2002)
29. M. Dubbelman, G.L. Van der Heijde, H.A. Weeber and G.F.J.M. Vrensen, “Changes in the internal structure of the human crystalline lens with age and accommodation,” Vision Res. 43, 2363–2375 (2003)
30. J. F. Koretz, G. H. Handelman and N. P. Brown, “Analysis of human crystalline lens curvature as a function of accommodative state and age,” Vision Res. 24, 1141-1151 (1984)
31. M. Dubbelman and G. L. Van der Heijde, “The shape of the aging human lens: curvature, equivalent refractive index and the lens paradox,” Vision Res. 41, 1867–1877 (2001)
32. B. K. Pierscionek, “Refractive index contours in the human lens,” Exp. Eye Res. 64, 887–893, (1997)
33. A. Glasser and M. C. W. Campbell, “Biometric, optical and physical changes in the isolated human crystalline lens with age in relation to presbyopia,” Vision Res., 39, 1991–2015, (1999)

109
34. C. E. Jones, D. A. Atchison, J. M. Pope, “Changes in Lens Dimensions and Re-fractive Index with Age and Accommodation,” Optometry Vision Sci. 84, 990-995, (2007)
110
Chapter 4 Micrometer axial resolution OCT for corneal imaging
4.1 Introduction
Despite many benefits provided by OCT in studying eye diseases, origin and
progression of some diseases are still difficult to investigate. This is due, in part, to
the lack of axial resolution that enables us to objectively quantify certain structures in
the eye. For the diseases pertaining to the cornea such as keratoconus, dry eye and
Fuch’s dystrophy, previous ex-vivo studies have suggested structural changes
occurring in the individual corneal layers such as the tear film, epithelium, Bowman’s
layer, and the Descemet’s membrane [1,2,3,4]. There has been growing interest in
visualizing these corneal layers in-vivo, so that the mechanisms of these diseases
could be understood in a more comprehensive way. However, the thickness of these
layers can be as thin as 3-15 µm [5], which makes it difficult to image them reliably
in-vivo. In-vivo confocal microscopy offers optical sectioning capability at cellular

111
level resolution [6,7]. Mostly though, its limited field of view, resulting from high
image magnification, makes it difficult to acquire wide area corneal images. Although
OCT can overcome this limitation at the cost of lateral resolution, standard anterior
segment OCT systems do not have sufficient axial resolution to precisely quantify the
thickness of all the individual corneal layers. Hence, it has been increasingly
important to further improve the axial resolution of the OCT for these applications.
With the advances in broadband light sources, images with axial resolution of a few
microns have been obtained using OCT for both the posterior segment [8,9] and the
anterior segment [10] of the eye. Such high resolution anterior segment OCT systems
can now directly visualize individual corneal layers like the Bowman’s layer and the
Descemet’s membrane in-vivo and have been used for studying the changes in these
layers resulting from Fuch’s Dystrophy [11] and hypoxia induced corneal swelling
[12]. OCT has also been used to indirectly measure tear film thickness [13,14]. The
axial resolution of the OCT systems used in these studies was 3-4 µm, which is just
two to five times smaller than the structures studied [1]. This may cause an increase
in the measurement variability and errors. Moreover, it has not been possible to
directly visualize the natural tear film over the human cornea that is estimated to be 2-
5 µm by interferometric methods [15]. Hence there is still a strong need for
improving the resolution of OCT systems so that all the layers in the cornea can be
visualized and accurately quantified.

112
While sub-micrometer axial resolution in OCT systems has been achieved using
broad bandwidth femtosecond or supercontinuum lasers with bandwidths larger than
350 nm [16,17,18], these systems were time domain systems. Fourier domain OCT
systems [19,20] provide improved sensitivity and imaging speed compared to time
domain systems [21,22,23] and hence are more suited for clinical applications. Using
bandwidths larger than 350 nm in Fourier domain systems however has been difficult
and to the best of our knowledge has not been reported to date.
In this chapter we will demonstrate a Fourier domain, micrometer axial resolution
OCT system, which is capable of visualizing all the individual layers in the cornea.
The system design and performance evaluation of the system will be described in
detail and the robustness of the system in a clinical environment will be demonstrated
through a clinical study that was carried out on keratoconus eyes. Keratoconus is a
disease, which is characterized by thinning and steepening of the central and/or para-
central cornea. Previous studies on keratoconus have shown changes in the individual
layers of cornea such as epithelial thinning [24,25,26,27,28], stromal thinning [20]
and incursion of fine cellular processes in the Bowman’s layer [29] along with
structural abnormalities and sharply edged defects [30,31]. Most of these studies,
barring studies on epithelial thinning using ultrasound imaging [22] and OCT [23,24],
were ex-vivo, limited primarily to corneal buttons obtained after penetrating
keratoplasty was performed on subjects with advanced KC. Since the micrometer
axial resolution OCT is capable of visualizing individual layers in the cornea in-vivo,
this capability allowed us to measure the above mentioned changes in the corneal

113
layers for KC patients with different disease severity under their natural state, thus
providing us a more comprehensive understanding of the underlying disease
pathogenesis and a method to objectively assess the disease progression.
4.2 System Design
4.2.1 Light source
The axial resolution of an OCT system is inversely proportional to the bandwidth and
proportional to the square of the center wavelength of the light source [32]. Using
small center wavelength for in-vivo human eye imaging could be hazardous [33] and
lead to patient discomfort, hence it is more suited to increase the bandwidth.
Supercontinuum light sources are ideal for providing large bandwidth along with high
spatial coherence. We hence used a broad bandwidth light (375 nm) filtered from a
laser supercontinuum source (Leukos SM-20) centered at 812.5 nm to achieve
ultrahigh axial resolution. Figure 4.1 shows the spectrum of the supercontinuum light
source and the portion of the spectrum used for the OCT imaging.

114
Figure 4.1 The spectrum of the supercontinuum light source. The blue shaded portion was used
for imaging
4.2.2 Spectrometer
The cornea is a curved surface with an average radius of curvature of 7.8 mm [34]. To
image a 4 mm wide lateral section around the apex of the cornea, an imaging depth of
at least 1 mm is required. The imaging depth of the spectral domain OCT, as
discussed in chapter 2, is directly proportional to the resolving power of the
spectrometer. Thus, to achieve the required imaging depth, designing a spectrometer
with high spectral resolution and wide spectral range is crucial. Czerny Turner
spectrometers, which are corrected for coma and where spherical aberration is
minimized by keeping the numerical aperture low, are ideal for such applications
[35,36,37]. This design works well in a traditional spectrometer where slits are used
since spot elongation caused by uncorrected astigmatism occurs along the direction of
the slit, resulting in negligible power loss. In our application, where a linescan camera

115
is used, the power loss is substantial due to the small pixel size (5×5 µm2), leading to
a reduction in signal to noise ratio. Recently, the design of a low cost spectrometer
based on a Czerny Turner configuration has been demonstrated where astigmatism is
corrected using a cylindrical lens placed before the detector [38]. A similar geometry
spectrometer was used for this study based on a different light source and detector.
The spectral resolution requirement of the spectrometer is given by the expression [4]
!" = " 2
4d 4.1
where d is the imaging depth, λ is the wavelength and δλ is the spectral resolution.
The spectral resolution requirement, as calculated from Eq. 4.1, changes from 0.096
nm at 625 nm to 0.250 nm at 1000 nm for 1 mm imaging depth. Assuming the
spectral resolution requirement to be 0.096 nm and the spectral range to be 375 nm,
the spectral data must be sampled over at least 3907 points (i.e. 375 nm/0.096 nm).
We used an 8160-pixel linescan camera (L803K, Basler), sampling the signal
sufficiently such that the system is limited by the spectral resolution obtained by the
spectrometer optics.
Ray tracing software CODE V (Synopsys Inc) was used to evaluate the spectral
resolution at five wavelengths (625 nm, 700 nm, 800 nm, 900 nm and 1000 nm). In
the CODE V spectrometer design file, two discrete wavelengths that are separated by
the required spectral resolution at that wavelength were defined and the PSF of the
system was calculated. Figure 4.2 shows the PSFs obtained. We can see that the

116
spectrometer can resolve two wavelengths separated by spectral resolution
requirement for all the wavelengths except at 625 nm.
Figure 4.2. The spectrometer PSF for two wavelengths separated by the required spectral
resolution calculated from Eq. 4.1 for (a) 625 nm (b) 700 nm (c) 800 nm (d) 900 nm (e) 1000 nm
Figure 4.3 shows the plot comparing the required spectral resolution for 1 mm
imaging depth, obtained by Eq. 4.1 with the actual spectral resolution of the optics.
Ideally the actual spectral resolution should be smaller than the required spectral
resolution for all wavelengths. We note that the spectrometer meets the resolution
requirement for all the wavelengths except from 600 nm to 690 nm. Hence there will
be fringe washout for these wavelengths. Fringes from the rest of the bandwidth will
still provide information about the sample. The effective bandwidth however will be
reduced, leading to a reduction in the axial resolution. The system hence meets the
criteria of imaging depth larger than 1 mm, though the effective bandwidth of the
system is reduced to 300 nm at 1 mm imaging depth, which yields a reduced axial
resolution.

117
Figure 4.3 Spectral resolution predicted by ray tracing compared with required spectral
resolution. The spectral resolution requirement is satisfied at all wavelengths except between 625 nm and 690 nm
4.2.2 Optical system layout
The OCT was built in free space to avoid reduction in axial resolution due to
dispersion induced by the optical fiber [39,40,41] and because of the lack of a readily
available fiber optic directional coupler for such a broad bandwidth light source.
Figure 4.4 shows the schematic of the OCT system. A near IR achromatic doublet
lens (Thorlabs, focal length = 35 mm, diameter = 25.4 mm) collimates the beam from
the supercontinuum source (Leukos, SM-20) and a bandpass filter, which is a
combination of a long pass (Semrock, model # BLP01-561R-25) and a short pass
filter (Omega Optical, model # 3RD1000SP), is used to select the spectrum from 625
nm to 1000 nm. The beam diameter was 6 mm and is controlled by an adjustable
diaphragm. The beam is then split into the sample and reference arm by a 50/50 cube

118
beamsplitter (Edmund Optics). In the sample arm, the beam is scanned on the sample
in telecentric geometry using a galvanometer based optical scanner (Cambridge
Technologies, model # 6220) and is focused by an objective lens (focal length = 60
mm, working distance = 56 mm, diameter = 25.4 mm) which has two achromatic
doublets with focal lengths 100 mm and 150 mm (Thorlabs) separated by 5 mm. In
the reference arm, an identical objective lens is used to focus the beam on the
reference mirror in order to match the dispersion between the two arms. A variable
neutral density filter (V-NDF) (Thorlabs) was placed in the reference arm to
maximize the fringe visibility. To match dispersion, an identical V-NDF set at
maximum transmission (OD = 0) was placed in the sample arm.
Figure 4.4. Full schematic of the OCT system. C: Collimator, BF: Bandpass filter, BS:
Beamsplitter, VND: Variable neutral density filter, SM: Scanning mirror, OL: Objective lens, S: Sample, M: Reference mirror, FL: Focusing lens, CM1: First concave mirror, G: Linear grating,
CM2: Second concave mirror, CL: Cylindrical lens, D: Linescan CCD

119
The two beams traveling back from the sample and reference arms are focused to
enter the spectrometer using the same lens as the objective. On entering the
spectrometer the beams are collimated by a concave mirror (Edmund Optics, focal
length = 200 mm and diameter = 50.8 mm). A diffraction grating (Richardson
gratings, 500 grooves/mm) disperses the collimated beam into its wavelength
components. These different wavelengths are then focused onto the linescan camera
using another concave mirror identical to the first one and an astigmatism correcting
cylindrical lens (Thorlabs, focal length = 100 mm). The raw data, through a frame
grabber (Bitflow Inc., Karbon CL), is transferred to a workstation (Dell, Precision
7400).
4.2.3. k-space remapping and dispersion compensation
To accurately sample the OCT signal linearly in k-space, we calibrated the
spectrometer experimentally. We first theoretically evaluated the positions of 41
different wavelengths between 600 nm and 1000 nm at 10 nm steps on the linescan
camera using CODE V. The positions of four different wavelengths (633 nm, 700 nm,
830 nm and 976 nm) were then measured on the linescan camera by placing laser line
filters in the beam path. The theoretically obtained spectral positions were then
linearly scaled and translated to match the experimentally measured positions to
account for tolerances in components and alignment associated with building the
system. The 41 data points were then interpolated to 8160 sample points, providing
equispaced data sampling in k-space.

120
Although the dispersion between the reference and sample arm was matched by using
identical optics in both the arms, for such a large bandwidth, even a small dispersion
mismatch can cause reduction in system performance. Hence, numerical dispersion
compensation [9] was implemented to achieve optimal performance.
4.3 System Performance
4.3.1 Axial and lateral resolution and depth sensitivity
The axial resolution of the OCT system was estimated by replacing the sample with a
flat mirror. To ensure that there is no degradation in the axial resolution due to errors
in k-space remapping and dispersion mismatch, theoretical axial point spread function
(PSF) was calculated as the Fourier transform of the envelope of the spectral
interference fringes. Figure 4.5(a) shows the measured axial PSF at the axial distance
of 0.16 mm in blue and the theoretical axial PSF in dashed red. The axial resolution,
estimated as the full width at half maximum (FWHM) of the measured PSF, was
1.52 µm in air, which corresponds to 1.11 µm in corneal tissue (n = 1.376) [5]. The
FWHM of the theoretical axial PSF was 1.45 µm in air (1.05 µm in corneal tissue)
and is in good agreement with that from the measured PSF, indicating that the system
achieves optimal axial resolution. The lateral resolution of the OCT, defined as the
focal spot size on the sample, was measured to be 25 µm on a CCD, which was 1.25
times the diffraction limited spot size of 20 µm.

121
Figure 4.5 (a) The axial PSF of the OCT measured experimentally by a mirror in the sample arm shown in blue, the PSF estimated theoretically from the envelope of spectral interference fringes shown in dashed red. The FWHM of the axial PSF is estimated to be 1.52 µ m in air,
which corresponds to 1.11 µ m in corneal tissue. (b) Sensitivity roll off of the system evaluated by measuring the axial PSF at different depths.
Figure 4.5(b) shows the axial PSF of the OCT system plotted at seven axial locations
up to 1.1 mm. A 21 dB roll off in the sensitivity of OCT from 0.16 mm to 1 mm
depth was observed. An axial resolution of 1.11 µm was maintained up to the depth
of 0.32 mm beyond which it starts to degrade with depth and is estimated to be 3.0
µm in tissue at the depth of 1 mm. The degradation in sensitivity and axial resolution
is due to limited spectral resolution of the spectrometer.
4.3.2 Validation of thickness measurements with the OCT
To validate the accuracy of the OCT system in estimating thickness, four reference
samples (photoresist spin coated on top of a silicon chip) with known thicknesses
were fabricated. The refractive index and thickness of the samples were measured
using an ellipsometer with refractive index estimated to be 1.61 and thicknesses
values being 0.91 µm, 1.36 µm, 3.37 µm and 4.40 µm. The images obtained for the
samples are shown in Figure 4.6.

122
Figure 4.6 The images obtained for the photoresists (n = 1.6) of thickness (a) 0.91 µ m (b) 1.36 µ m (c) 3.37 µ m and (d) 4.40 µ m and the peaks for photoresist thickness of (e) 0.91 µ m (f) 1.36 µ m (g)
3.37 µ m and (h) 4.40 µ m.
Since the thickness values are close to the axial resolution of the OCT, the images
were obtained after zero padding the interference signal to reduce the pixel separation
by five times. The two interfaces can be distinctively identified in all the samples
except the 0.91 µm thick sample. The photoresist thicknesses measured by OCT were
1.25±0.13 µm, 3.45±0.05 µm and 4.58±0.06 µm, obtained from five independent
measures along the surface of the sample. The ellipsometry and the OCT
measurements differ due to limited accuracy of the OCT measurement (0.1 µm).
4.3.3 In-vivo imaging of the human cornea
In-vivo OCT imaging was performed on human corneas. The research adhered to the
tenets of the Declaration of Helsinki. The protocol was approved by the Research
Subjects Review Board at the University of Rochester. Informed consent was

123
obtained from all participants after the purpose of the study and the procedures were
explained. The power of the light shined into the subject’s eye was 0.75 mW, which
is 80 times below the maximum permissible exposure as dictated by ANSI [34]. A
bite bar was used to minimize the subject’s head motion. Each image consists of 250
A-scans. Exposure time for each A-scan was 1 ms and the real time frame rate
obtained on the screen was 2 frames/s. Such a large exposure time is used because it
is difficult to focus all the light coming from the sample arm of the OCT on to the
linescan camera sensor (pixel size 5×5 µm2).
Figure 4.7 shows the image obtained by the system for a 4 mm section around the
apex of a normal cornea. The thin topmost layer in the image is the tear layer whose
mean thickness across the 4 mm section was measured to be 4.7±1.6 µm. The next
two layers, epithelium and Bowman's layer, had mean thicknesses of 49.7±1.4 µm
and 19.2±1.2 µm, respectively. The Bowman's layer is followed by the stroma, which
is made up of brightly reflecting centers that may be keratocytes. Below the stroma is
the Descemet's membrane followed by the endothelium. The Descemet's membrane
can be visualized as a thin strip in the lower portion of the cornea. The thickness of
this layer was measured to be 4.0±0.7 µm. The endothelium can be visualized as the
last bright boundary of the cornea. In these thickness estimates, we assumed the
refractive index of 1.401 for the epithelium [42] and an average corneal refractive
index of 1.376 for Bowman's layer and Descemet’s membrane [5]. The thickness
values obtained in our measurement lie within the previously reported values.
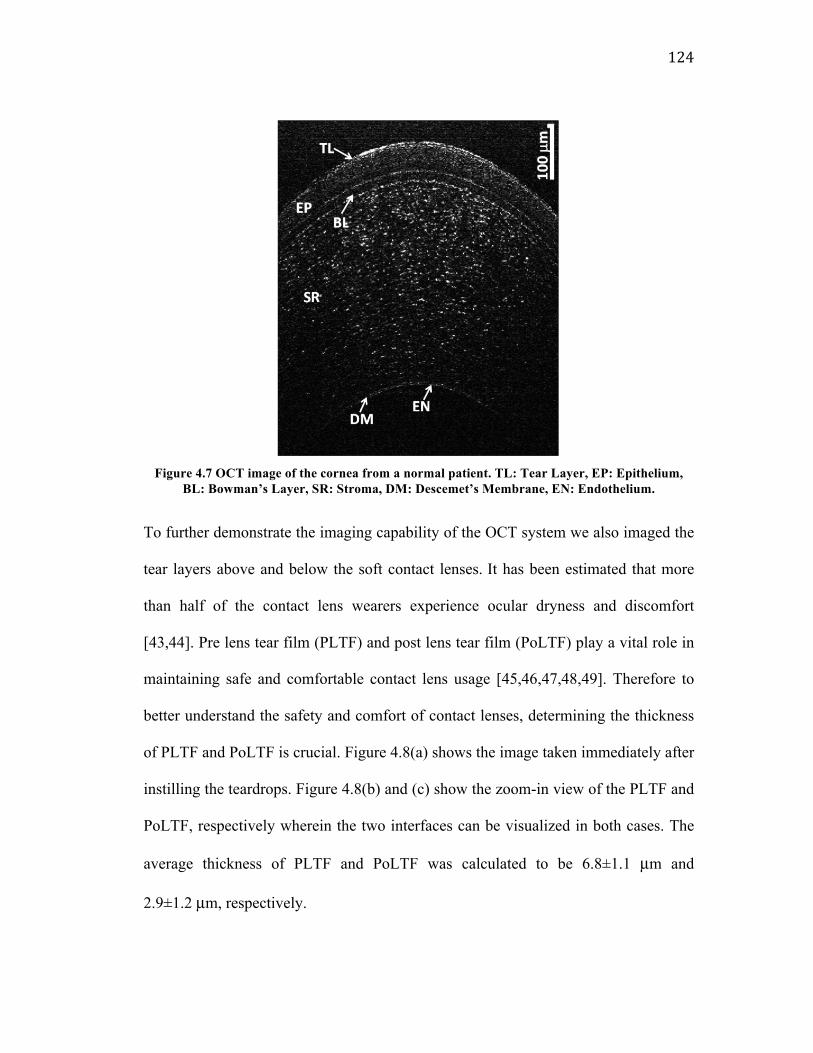
124
Figure 4.7 OCT image of the cornea from a normal patient. TL: Tear Layer, EP: Epithelium,
BL: Bowman’s Layer, SR: Stroma, DM: Descemet’s Membrane, EN: Endothelium.
To further demonstrate the imaging capability of the OCT system we also imaged the
tear layers above and below the soft contact lenses. It has been estimated that more
than half of the contact lens wearers experience ocular dryness and discomfort
[43,44]. Pre lens tear film (PLTF) and post lens tear film (PoLTF) play a vital role in
maintaining safe and comfortable contact lens usage [45,46,47,48,49]. Therefore to
better understand the safety and comfort of contact lenses, determining the thickness
of PLTF and PoLTF is crucial. Figure 4.8(a) shows the image taken immediately after
instilling the teardrops. Figure 4.8(b) and (c) show the zoom-in view of the PLTF and
PoLTF, respectively wherein the two interfaces can be visualized in both cases. The
average thickness of PLTF and PoLTF was calculated to be 6.8±1.1 µm and
2.9±1.2 µm, respectively.

125
Figure 4.8(a) Image of the contact lens wearer’s cornea three minutes after a drop of artificial
tear was instilled in the subject’s eye, (b) Zoom-in view of the PLTF, two interfaces can be clearly visualized, (c) Zoom-in view of the PoLTF, two interfaces are distinguishable.
4.4 Structural changes in the epithelium and
Bowman’s layer in keratoconus eyes studied using
micrometer resolution OCT
The clinical viability of the system was established through a study carried out on the
keratoconus patients using the system. Keratoconus (KC) is a degenerative disorder
of the eye where the cornea assumes a conical shape due to non-inflammatory
thinning and steepening of the central and/or para-central cornea [50,51]. The change
in corneal shape leads to the induction of significant amounts of higher order
aberrations in the eye, resulting in marked decrease in the image quality of the eye
[46]. One in 2000 individuals in the general population is affected by this disorder

126
[52]. Although the thinning of the stroma in KC eyes, particularly at the apex of the
cone, has been well characterized [47], the effect of the disease on other corneal
layers is still being investigated. Central epithelial thinning [20,21,22,23,24], and
breaks in Bowman’s layer along with incursion of fine cellular processes in the
Bowman’s layer [25,26,27] have been observed in previous studies on KC eyes. Most
of these changes in KC eyes have been observed ex-vivo, limited primarily to corneal
buttons obtained after penetrating keratoplasty was performed on subjects with
advanced KC. The capability to measure these changes in-vivo in patients with
different disease severity will provide us with a more comprehensive understanding
of the underlying disease pathogenesis and a method to objectively assess the disease
progression.
Recent studies have investigated corneal epithelium thickness profile in KC eyes in-
vivo using very high frequency ultrasound [22] and optical coherence tomography
(OCT) [23,24]. Central epithelium thinning [22,23,24] and donut pattern in the
thickness profile [22] were observed in these in-vivo studies. In-vivo confocal
microscope (IVCM), which provides cellular level resolution en face images of the
cornea, has also been commonly used in studying KC corneas [53,54]. Previous
studies using IVCM have shown changes in the density of epithelial cells [54,55] and
stromal keratocytes [55,56] in KC corneas. Increased haze/scatter in all the corneal
layers [54,57] has also been observed in the KC eyes. These findings suggest that any
change in corneal microstructure will disrupt its transparency, increasing light scatter.

127
Therefore, we measured backscatter in OCT as an indirect indicator of abnormal
biological changes.
Since our micrometer axial resolution OCT is capable of visualizing individual
corneal layers over a large field, we used it to investigate the changes in the thickness
and light scatter of corneal epithelium and Bowman’s layer in the KC eyes.
4.4.1 Experimental Methods
Eight patients (9 eyes) diagnosed with KC at the Department of Ophthalmology,
University of Rochester were recruited for the study. Since using fellow eyes of
patients for a study can lead to inaccuracy in statistical variance if the two eyes have
similar disease severity [58,59], only one eye of all the patients was used for the
study, except for one KC patient whose both eyes were included in the study as the
severity of the disease in the two eyes was considerably different. Eight eyes of eight
age matched normal subjects with no history of ocular surgery, no prior or current
ocular disease besides refractive error served as controls. The protocol was approved
by the Research Subjects Review Board at the University of Rochester. Informed
consent was obtained from all participants after the purpose of the study and the
procedures were explained. Corneal topography and keratometry values of all the
eyes were obtained using a combined slit-scanning elevation topography and Placido
disc system (Orbscan II; Bausch & Lomb Surgical, Rochester, NY). Keratometry
readings have traditionally been used as the indicator of disease severity and
classifying KC into mild, moderate and severe KC [60]. However in our study there

128
was an overlap in the keratometry readings of mild KC and normal. We hence
decided to use corneal coma, the most dominant aberration in the KC eyes as a
measure of the disease severity [61,62,63]. The corneal aberrations were calculated
from the corneal elevation maps obtained by the topography data. The severity of KC
was assessed based on the root mean square (RMS) of the horizontal and vertical
corneal coma over a 4 mm pupil. The clinical measures for the subjects are shown in
Table 4.1.
Table 4.1 Patient characteristics
Keratoconus (Range)
(n = 9) Normals (Range)
(n = 8)
Age (years) 40.5 ± 13.3 (24 – 58) 37.1 ± 13.3 (25 – 55)
Corneal Astigmatism (D) 4.6 ± 2.6 (0.2 – 9.4) 1.3 ± 0.6 (0.4 – 2.4)
Max K (D) 53.0 ± 7.0 (45.4 – 65.5) 45.1 ± 2.0 (41.9 – 47.9)
Min K (D) 48.4 ± 5.7 (40.2 – 57.5) 43.8 ± 2.1 (40.8 – 46.4)
Corneal Coma (µm) 1.2 ± 0.75 (0.3 – 3.4) 0.2 ± 0.1 (0.1 – 0.3)
Central Corneal Thickness (µm)
443.2± 32.4 (406.4 – 487.2)
511.2± 36.4 (462.2 – 546.5)
Based on the previous observations of central epithelial thinning [20,21,22,23,24],
and irregular thinning and breaks in Bowman’s layer with incursion of fine cellular
processes in the Bowman’s layer [25,26,27] and increased haze in epithelium and
Bowman’s layer [54,57], in KC corneas, the outcome measures for this study include
the differences in the average thickness, thickness variability and the amount of light
129
scatter of the normal and KC eyes along the superior-inferior sections of the cornea.
Here light scatter was used as a metric to quantify the structural modifications for
example due to cellular incursions in the epithelium and Bowman’s layer.
Image analysis was carried out using custom-developed Matlab based software
(Figure 4.9). The first step was to obtain surface profiles of epithelium and Bowman’s
layer in each of the images. The procedure for surface profile generation started with
manual selection of 11 different points on the interface of each layer by the user.
These data points were then spline interpolated to generate an initial estimate of each
interface in the image. Subsequently, around the initial estimate, the algorithm
searched for the pixels with highest signal intensity in a region of ± 5 pixels for the
tear-epithelium interface and ± 10 pixels for the epithelium-Bowman’s layer interface
and the Bowman’s layer-stroma interface. The region to search for anterior epithelial
layer was kept smaller to avoid bias from the tear-air interface. The peak intensity
pixels were then fitted with a fifth order polynomial to obtain the final interface
profile. Refractive distortion correction was carried out on the profiles using ray
tracing [64], providing true surface profiles. From the distortion corrected surface
profiles, the thickness profile of the epithelium and Bowman’s layer were quantified
by measuring the thickness along the radial direction at each corneal position (Figure
4.9). For both the estimation of physical thickness and refractive distortion correction,
the refractive index of 1.401 for the epithelium [38] and an average corneal refractive
index of 1.376 for Bowman's layer [5] were assumed for normal as well as KC

130
corneas at the OCT source wavelength. Thickness variability was evaluated by
calculating the standard deviation of thickness profile.
Figure 4.9 OCT image analysis. Corneal image obtained by the OCT system showing corneal top layers. TF: Tear film, EL: Epithelium, BL: Bowman’s layer, SR: Stroma. (b) The white dashed
curves indicate the identified interfaces of the epithelium and Bowman’s layer. Thickness profiles were obtained by measuring radial distances as shown by the arrows. Sensitivity
normalized signal intensity averaged over a region 2.5 mm wide and of thickness of 20 µm and 10 µm respectively, shown in shaded gray, in epithelium and Bowman’s layer was used to measure
light scatter. See Figure 4.10 (a) for an un-annotated version of the same image
For evaluating the light scatter in biological tissue using OCT images, mean of the
OCT signal intensity corresponding to backward scatter can be used [20]. However,
since the sensitivity of the OCT system reduces when the relative distance between
the sample and the reference mirror location is increased, a sample when placed at a
position closer relative to the reference mirror location appears brighter than when it
is positioned a little further. To correct for this variation, the signal intensity was first
normalized by the experimentally measured axial position dependent sensitivity of the
OCT system. The light scatter was then quantified as the mean of the sensitivity
normalized signal intensity values in a region of 2.5 mm width and optical thickness
(refractive index × physical thickness) of 20 µm and 10 µm in the center of the
epithelium and Bowman’s layer respectively. Paired student’s t-test was performed to

131
examine statistical significance (p<0.05) in the outcome measures between two
groups, while one-way analysis of variance (ANOVA) test was performed when
comparing more than two groups.
4.4.3 Results
OCT imaging performance in normal and KC eyes
Representative corneal images obtained with the system for a normal (Figure 4.10(a))
and three KC patients (Figs. 4.10(b)-(d)) with increasing disease severity
demonstrated the feasibility of the OCT to visualize the epithelium and Bowman’s
layer in both groups. Qualitatively, it can be seen that in KC patients, the thickness of
both epithelium and Bowman’s layer is smaller than in the normal subject. An
increase in the amount of backscatter in both the layers can also be observed.
Interestingly, in the most severe KC (Figure 4.10(d)), the signal from the cornea is
weak and the interface of the Bowman’s layer with epithelium and stroma is difficult
to distinguish. In two of the nine KC eyes measured in this study, the Bowman’s layer
could not be visualized. In such eyes the entire thickness from the tear film to the
stroma was assumed to be epithelium and these eyes were excluded in our analysis on
the Bowman’s layer.

132
Figure 4.10 Images obtained by the system for a normal (a) and three KC patients (b), (c) and (d)
with increasing corneal coma, a measure of disease severity. A reduction in the epithelium and Bowman’s layer thickness can be seen for KC eyes. In most severe KC patient (d) the interfaces
of Bowman’s layer with epithelium and stroma are difficult to distinguish. Hyper-reflective centers, visible as white patches, can be seen in the Bowman’s layer in one of the KC patient (c).
Thickness and thickness variability of epithelium and Bowman’s layer
Mean ± standard deviation of the average thickness across the epithelial layer was
found to be 45.2±7.5 µm in KC and 51.6±3.8 µm in normal eyes, with the difference
in thickness between the two groups being statistically significant. Similarly, the
Bowman’s layer in KC eyes was significantly thinner (13.1±2.1 µm) than normal
eyes (16.7±2.6 µm). The epithelium and Bowman’s layer thicknesses were plotted
against corneal coma, to examine their correlation with disease severity. For the KC
group, a negative correlation was found between the average epithelium thickness and
corneal coma (R2 = 0.50) (Figure 4.11(a)) while a weak correlation was observed for
the Bowman's layer (R2 = 0.15) (Figure 4.11(b)). No correlation was found for the
normal group.

133
Figure 4.11 Scatter plot showing mean epithelium (a) and Bowman’s layer (b) thickness plotted against corneal coma (4 mm pupil size) where corneal coma was used to represent the KC disease severity. The epithelium and Bowman’s layer thickness in KC eyes was significantly smaller than normal eyes (p = 0.023 for epithelium and p = 0.006 for Bowman’s layer). A negative correlation was observed between epithelium thickness and disease severity (R2 = 0.50) while no correlation was found for Bowman’s layer thickness (R2 = 0.15).
The thickness variability was significantly higher in KC eyes for epithelium (5.0±3.4
µm in KC and 1.1±0.7 µm in normal eyes), but did not differ for the Bowman’s layer
(1.7±1.3 µm in KC and 1.0±0.4 µm in normal eyes). The thickness variability
increased with severity of KC for epithelium (R2 = 0.61) (Figure 4.12(a)) while weak
correlation was observed for the Bowman’s layer (R2 = 0.08) (Figure 4.12(b)).
Figure 4.12 Scatter plot showing epithelium (a) and Bowman’s layer (b) thickness variability
plotted against corneal coma (4 mm pupil size). The thickness variability was significantly higher in epithelium (p = 0.004) but not in Bowman’s layer (p = 0.090). The correlation with disease
severity was statistically strong for epithelium (R2 = 0.61), but weak for Bowman’s layer (R2 = 0.08).

134
Figure 4.13 shows characteristic thickness profiles of the two layers across the
±1.5 mm lateral distance from the apex along the superior-inferior direction. To take
the effect of the disease severity into account, the KC group of 9 eyes was divided
into two groups, KC group1 and KC group2, consisting of 5 and 4 eyes respectively,
using an arbitrary threshold criterion of 1 µm corneal coma. The thickness of the
epithelium in the normal group showed almost no changes over the 3 mm diameter
cornea (Figure 4.13(a)). In both the KC groups, the epithelial thickness of inferior
cornea including around apex was smaller than the superior region, although when
statistical analysis was performed using one-way ANOVA, no significant difference
was found in any of the groups (Figure 4.13(a)). For the Bowman’s layer, no
characteristic pattern in the thickness profile was observed for both normal and KC
groups (Figure 4.13(b)).
Figure 4.13 The plot showing local epithelial thickness (a) and Bowman’s layer thickness (b), averaged over the subjects, as a function of the lateral distance from the apex for normals and two KC groups. KC group1 has eyes with corneal coma (4 mm pupil) < 1 µm while KC group 2 eyes have corneal coma > 1 µm. A pattern of inferior epithelial thinning was found in both the
KC groups, however on performing the one-way ANOVA test no statistical difference in the local epithelium was observed in any of the groups. No specific pattern was observed in the Bowman’s
layer thickness profile for all the groups.

135
Light Scatter in epithelium and Bowman’s layer
Light scatter in the epithelium averaged over all subjects in the KC and normal eyes
was 28.7±13.5 and 22.5±7.1 in arbitrary units, respectively (Figure 4.14(a)).
However, this increase in scatter for KC eyes was statistically insignificant. For the
Bowman’s layer, the scatter in the KC eyes was also larger than the normals with the
values of 31.6±16.1 in KC and 20.1±4.7 in normal eyes (Fig 4.14(b)). This difference
was statistically significant (p<0.05) although no correlation was observed with
disease severity.
Figure 4.14 Bar graph comparing scatter in epithelium (a) and Bowman’s layer (b) for normal
and KC eyes. The increase in scatter was statistically significant (p = 0.036) only for the Bowman’s layer.
4.4.4 Discussion
Our custom-developed OCT was capable of visualizing the epithelium and Bowman's
layer in detail in both the KC and normal eyes in-vivo, which enabled us to precisely
characterize the two thin layers in both the groups and study the differences. A 4 mm

136
wide vertical corneal section around the apex was imaged. Since the cone is a
protrusion in the KC cornea, the cone location in the KC eye should be same as the
corneal apex. Our findings hence are based on the data from around the cone. We
expect that the trends found in the present study would become less dominant in
corneal areas further away from the cone.
Average thickness of both epithelium and Bowman's layer over a 4 mm cross-section
around the apex of the cone was significantly reduced for KC eyes. This is consistent
with the previous observation of central epithelial thinning using histopathology
[20,21], very high frequency digital ultrasound arc scanner [22] and in-vivo OCT
[23,24] and irregular thinning of Bowman’s layer using ex-vivo scanning electron
microscopy [25,27]. Moreover in the present study, we further investigated the impact
of disease severity on the corneal layers represented by corneal coma, the most
dominant higher order aberration present in the KC eyes [52]. The epithelium
thickness showed a negative correlation (R2 = 0.50) with the KC severity (Figure
4.11(a)) while no correlation was observed for the Bowman's layer thickness (Figure
4.11(b)).
The increase in the variability of the thickness profile of epithelium over the central 4
mm of the KC corneas was significant compared to the normal group. A positive
correlation between the corneal coma and epithelium thickness variability was
observed (R2 = 0.61) (Figure 4.12 (a)). In both KC groups, we also found a pattern in
the epithelium thickness profile around the apex that the epithelium thickness along

137
the inferior cornea from the apex was reduced in comparison to the superior cornea
(Figure 4.13 (a)). However, no statistically significant difference in the epithelial
thickness at different lateral locations on the cornea was found using one-way
ANOVA test. Our hypothesis to explain this finding of inferior thinning in epithelium
is as follows. It has been suggested that corneal epithelium may modify itself to
compensate for corneal surface distortions and maintain a spherical anterior corneal
surface [22]. KC leads to the bulging of the cornea towards the inferior side. Thus, the
inferior thinning of the epithelium occurs to compensate for this inferior stromal
bulging so that the deviations of the corneal surface from a smooth spherical profile
can be minimized. Further investigation using a wider field of OCT imaging in a
larger sample size however is required to confirm this hypothesis.
The very high frequency digital ultrasound arc scanner study [22] observed a donut
ring pattern in the KC epithelium thickness profile with thinning in the center and
thickening in the periphery. This pattern, however, was observed over a wider lateral
zone (10 mm in diameter) compared to the present study. It will be interesting to
examine if a wider field OCT images the same pattern at the peripheral cornea.
The correlation between Bowman's layer thickness variability and corneal coma was
insignificant (R2 = 0.08). No specific trend was found in the thickness profile of the
Bowman's layer for both KC and normal eyes. Irregular thinning of the Bowman’s
layer has been observed in previous histopathological studies [24], which suggests
that there should be an increase in the thickness variability of Bowman’s layer for KC

138
eyes. In the current study increased Bowman’s layer thickness variability was found
but this increase was statistically insignificant. It should be noted in Figure 4.12(b)
that one of the KC patients has significantly higher Bowman’s layer thickness
variability than normals, suggesting that on increasing the sample size of the study an
increase in thickness variability in Bowman’s layer may be found.
Scatter in the epithelium and Bowman's layer was quantified as the mean of the
sensitivity normalized intensity profile in the OCT images. A significant increase in
the scatter was observed only in the Bowman's layer for the KC patients. The axial
sensitivity was measured experimentally by replacing the sample with a flat mirror.
However, we cannot rule out other potential contribution including intensity variation
due to strong specular reflection around the apex of the cone and speckle. This
increased backscatter in Bowman’s layer was previously found as the increased haze
in the IVCM measurements in the KC cornea [54,57]. With the increase in
backscatter for Bowman’s layer it also becomes increasingly difficult to distinguish
its boundary with the epithelium and stroma. This observation is consistent with the
previous histopathological observation of cellular incursions of epithelial and stromal
cells into the Bowman’s layer [25]. Two KC eyes in our study did not show a clear
Bowman's layer and were excluded from this analysis.
Clinical interest in exploring new methods to allow for detection of subclinical KC
has been increasingly growing as this ability is critical in corneal refractive surgery to
avoid development of post-operative ectasia [65,66] It may also provide opportunity

139
to at least halt disease progression using therapeutic interventions such as corneal
collagen crosslinking [67] before KC develops further and causes severe degradation
in visual function. We found a correlation between disease severity and epithelium
thickness and thickness variability, and also discovered a possible trend in the
epithelium thickness profile. It would be important to investigate whether such subtle
structural differences in corneal layers could be used to screen KC suspects.
4.5 Conclusion
In this chapter we demonstrated a micrometer axial resolution spectral domain OCT
with a custom developed astigmatism corrected spectrometer based on Czerny Turner
design. The axial resolution of 1.11 µm in corneal tissue was achieved with the
thickness measurement accuracy verified using photoresist layer samples. In-vivo
human corneal imaging was carried out that indicated the feasibility of quantifying
the thickness of the individual corneal layers including the tear film, the Bowman’s
layer, the Descemet’s membrane and the epithelium by the system.
The clinical viability of the micrometer axial resolution OCT was confirmed by
observing structural differences in the epithelium and Bowman's layer of the normal
and KC cornea using an ultrahigh resolution OCT. These structural differences can be
useful in improving our understanding of the underlying mechanisms of keratoconus
and may provide new clinical metrics for early diagnosis of the disease.

140
Micrometer resolution OCT can be a powerful tool enabling us to improve our
knowledge of the etiology and progression of corneal and ocular surface diseases.
References
1. J. H. Krachmer, R. S. Feder and M. W. Belin, “Keratoconus and related non-inflammatory corneal disorders,” Surv Ophthalmol.28(4), 293-322 (1984).
2. Y. S. Rabinowitz, “Keratoconus,” Surv Ophthalmol.42(4), 297–319 (1998).
3. S. C. Pflugfelder, A. Solomon and M. E. Stern, “The Diagnosis and Management of Dry Eye, A Twenty-five–Year Review,” Cornea 19(5): 644–649, (2000).
4. S. E. Wilson, W. M. Bourne, “Fuch’s Dystrophy,” Cornea 7(1), 2-18 (1988)
5. D. A. Atchison and J. Smith, Optics of the Human Eye (Elsevier 2002).
6. Jalbert, F. Stapleton, E. Papas, D.F. Sweeney and M. Coroneo, “In vivo confocal microscopy of Cornea,” Br. J. Ophthalmology 87, 225-236 (2003).
7. R. L. Niederer, D. Perumal, T. Sherwin, and C. N. J. McGhee, “Laser Scanning In Vivo Confocal Microscopy Reveals Reduced Innervation and Reduction in Cell Density in All Layers of the Keratoconic Cornea,” Invest Ophthalmol Vis Sci.49, 2964–2970 (2008).
8. R. Leitgeb, W. Drexler, A. Unterhuber, B. Hermann, T. Bajraszewski, T. Le, A. Stingl, and A. Fercher “Ultrahigh resolution Fourier domain optical coherence tomography,” Opt. Express 12, 2156-2165 (2004).
9. M. Wojtkowski, V. Srinivasan, T. Ko, J. Fujimoto, A. Kowalczyk, and J. Duker “Ultrahigh-resolution, high-speed, Fourier domain optical coherence tomography and methods for dispersion compensation,” Opt. Express 12, 2404-2422 (2004).
10. V. Christopoulos, L. Kagemann, G. Wollstein, H. Ishikawa, M. L. Gabriele, M. Wojtkowski, V. Srinivasan, J. G. Fujimoto, J. S. Duker, D. K. Dhaliwal and J. S. Schuman, “In Vivo Corneal High-Speed, Ultra–High-Resolution Optical Coherence Tomography,” Arch. Ophthalmol. 125, 1027-1035 (2007).
11. M. A. Shousha, V. L. Perez, J. Wang, T. I., S. Jiao, Q. Chen, V. Chang, N. Buchser, S. R. Dubovy, W. Feuer and S. H. Yoo “Use of Ultra-High-Resolution

141
Optical Coherence Tomography to Detect In Vivo Characteristics of Descemet's Membrane in Fuchs' Dystrophy,” Am. Aca. Ophthalmol. 117, 1220-1227 (2010).
12. N. Hutchings, T. L. Simpson, C. Hyun, A. A. Moayed, S. Hariri, L. Sorbara and K. Bizheva, “Swelling of the Human Cornea Revealed by High-Speed, Ultrahigh-Resolution Optical Coherence Tomography,” Invest. Ophthalmol. Vis. Sci. 51, 4579-4584 (2010).
13. J. Wang, D. Fonn, T. L. Simpson and L. Jones, “Precorneal and Pre- and Postlens Tear Film Thickness Measured Indirectly with Optical Coherence Tomography,” Invest. Ophthalmol. Vis. Sci. 44, 2524-2528 (2003).
14. Q. Chen, J. Wang, A Tao, M. Shen, S. Jiao and F. Lu, “Ultrahigh-Resolution Measurement by Optical Coherence Tomography of Dynamic Tear Film Changes on Contact Lenses,” Invest. Ophthalmol. Vis. Sci. 51, 1988-1993 (2010).
15. P. E. King-Smith, B. Fink, R. Hill, K. Koelling and J. Tiffany. “The thickness of the tear film,” Curr. Eye Res. 29, 357 – 368 (2004).
16. W. Drexler, U. Morgner, F. X. Kartner, C. Pitris, S. A. Boppart, X. D. Li, E. P. Ippen, and J. G. Fujimoto, “In vivo ultrahigh-resolution optical coherence tomography,” Opt. Lett. 24, 1221-1223 (1999).
17. B. Povazay, K. Bizheva, A. Unterhuber, B. Hermann, H. Sattmann, A. F. Fercher, W. Drexler, A. Apolonski, W. J. Wadsworth, J. C. Knight, P. S. J. Russell, M. Vetterlein, and E. Scherzer, “Submicrometer axial resolution optical coherence tomography,” Opt. Lett. 27, 1800-1802 (2002).
18. Y. Wang, Y. Zhao, J. S. Nelson, Z. Chen, and R. S. Windeler, “Ultrahigh-resolution optical coherence tomography by broadband continuum generation from a photonic crystal fiber,” Opt. Lett. 28, 182-184 (2003).
19. A. F. Fercher, C. K. Hitzenberger, G. Kamp, and S. Y. Elzaiat, “Measurement of intraocular distances by backscattering spectral interferometry,” Opt. Comm. 117, 43-48 (1995).
20. G. Hausler and M. W. Linduer, “Coherence radar and spectral radar-new tools for dermatological diagnosis,” J. Biomed. Opt. 3, 21-31 (1998).
21. R. Leitgeb, C. K. Hitzenberger, and A. F. Fercher, “Performance of Fourier domain vs. time domain optical coherence tomography,” Opt. Express 11, 889-894 (2003).

142
22. J. F. de Boer, B. Cense, B. H. Park, M. C. Pierce, G. J. Tearney, and B. E. Bouma, “Improved signal-to-noise ratio in spectral-domain compared with time-domain optical coherence tomography,” Opt. Lett. 28, 2067- 2069 (2003).
23. M. A. Choma, M. V. Sarunic, C. H. Yang, and J. A. Izatt, “Sensitivity advantage of swept source and Fourier domain optical coherence tomography,” Opt. Express 11, 2183-2189 (2003).
24. M. W. Scroggs and A. D. Proia, “Histopathological variation in keratoconus,” Cornea.11(6), 553-559 (1992).
25. K. Tsubota, Y. Mashima, H. Murata, N. Sato and T. Ogata, “Corneal epithelium in keratoconus,” Cornea.14(1), 77-83 (1995).
26. D. Z. Reinstein, T. J. Archer and M. Gobbe, “Corneal epithelium thickness profile in the diagnosis of keratoconus,” J. Refract. Surg.25(7), 604-610 (2009).
27. S. Haque, T. Simpson and L. Jones, “Corneal and epithelial thickness in keratoconus: A comparison of ultrasonic pachymetry, orbscan II, and optical coherence tomography,” J Refract Surg.22(5), 486-493 (2006).
28. Y. Li, O. Tan, R. Brass, J.L. Weiss and D. Huang, “Corneal Epithelial Thickness Mapping by Fourier-Domain Optical Coherence, Tomography in Normal and Keratoconic Eyes,” Ophthalmology, Aug 20, 2012 (e-published ahead of print)
29. T. Sherwin, N. H. Brookes, I. P. Loh, C. A. Poole and G. M. Clover, “Cellular incursion into Bowman’s membrane in the peripheral cone of the keratoconic cornea,” Exp Eye Res.74(4), 473-482 (2002).
30. A. J. Tuori, I. Virtanen, E. Aine, R. Kalluri, J. H. Miner and H. M. Uusitalo, “The immunohistochemical composition of corneal basement membrane in keratoconus.” Curr Eye Res.16(8), 792-801 (1997).
31. S. Sawaguchi, T. Fukuchi, H. Abe, T. Kaiya, J. Sugar and B. Y. J. T. Yue, “Three-dimensional scanning electron microscopic study of keratoconus corneas,” Arch Ophthalmol.116(1), 62-68 (1998).
32. W. Drexler, “Ultrahigh-resolution optical coherence tomography,” J. Biomed. Opt. 9, 47–74 (2004)
33. ANSI Z136.1 (2007).
34. B. Rabbetts, Bennett & Rabbetts’ Clinical Visual Optics (Elsevier 2007).
143
35. M. Czerny, and A. F. Turner, “On the Astigmatism of Mirror Spectrometers,” Z. Phys. 61, 792–797 (1930).
36. B. Shafer, L. R. Megill, and L. Droppleman, “Optimization of the Czerny-Turner spectrometer,” J. Opt. Soc. Am. 54, 879–887 (1964).
37. Q. Xue, S. Wang, and F. Lu, “Aberration-corrected Czerny-Turner imaging spectrometer with a wide spectral region,” Appl. Opt. 48, 11–16 (2009).
38. K. Lee, K. P. Thompson, and J. P. Rolland “Broadband astigmatism-corrected Czerny–Turner spectrometer,” Opt. Express 18, 23378-23384 (2010).
39. W. Drexler, C. K. Hitzenberger, A. Baumgartner, O. Findl, H. Sattmann and A. F. Fercher, “Investigation of Dispersion Effects in Ocular Media by Multiple Wavelength Partial Coherence Interferometry,” Exp. Eye Res. 66, 25-33 (1998).
40. C. K. Hitzenberger, A. Baumgartner and A. F. Fercher “Dispersion induced multiple signal peak splitting in partial coherence interferometry,” Opt. Commun. 154, 179-185 (1998).
41. C. K. Hitzenberger, A. Baumgartner, W. Drexler, and A. F. Fercher “Dispersion Effects in Partial Coherence Interferometry: Implications for Intraocular Ranging,” J. Biomed. Opt. 4, 144-151 (1999).
42. S. Patel, J. Marshall and F. W. Fitzke, “Refractive index of the human corneal epithelium and stroma,” J. Refract. Surg. 11, 100-105 (1995).
43. B. E. Caffery, D. Richter, T. Simpson, D. Fonn, M. Doughty, K. Gordon, “The prevalence of dry eye in contact lens wearers: part 2 of the Canadian Dry Eye Epidemiology study,” Invest. Ophthalmol. Vis. Sci. 37, S72 (1996).
44. M. J. Doughty, D. Fonn, D. Richter, T. Simpson, B. Caffery and K. Gordon, “A patient questionnaire approach to estimating the prevalence of dry eye symptoms in patients presenting to optometric practices across Canada,” Optom Vis Sci. 74, 624–631 (1997).
45. G. T. Timberlake, M. G. Doane and J. H. Bertera, “Short-term, low-contrast visual acuity reduction associated with in vivo contact lens drying,” Optom Vis Sci. 69, 755-760 (1992).
46. R. Tutt, A. Bradley, C. Begley and L. N. Thibos, “Optical and visual impact of tear break-up in human eyes,” Invest Ophthalmol Vis Sci 41, 4117–4123 (2000).

144
47. T. Hayashi and I. Fatt, “A lubrication theory model of tear exchange under a soft contact lens,” Am J Optom Physiol Opt. 53, 101–103 (1976).
48. L. Wagner, K. Polse and R. Mandell. “Tear pumping and edema with soft contact lenses,” Invest Ophthalmol Vis Sci. 19, 1397–1400 (1980).
49. S. A. Little and A. S. Bruce, “Postlens tear film morphology, lens movement and symptoms in hydrogel lens wearers,” Ophthalmic Physiol Opt. 14, 65–69 (1994).
50. J. H. Krachmer, R. S. Feder and M. W. Belin, “Keratoconus and related non-inflammatory corneal disorders,” Surv Ophthalmol.28(4), 293-322 (1984).
51. Y. S. Rabinowitz, “Keratoconus,” Surv Ophthalmol.42(4), 297–319 (1998).
52. H. Hofstetter, “A keratoscopic survey of 13,395 eyes,” Am J Optom Acad Optom.36(1), 3-11 (1959).
53 R. L. Niederer, D. Perumal, T. Sherwin and C. N. J. McGhee, “Laser scanning in vivo confocal microscopy reveals reduced innervation and reduction in cell density in all layers of the keratoconic cornea,” Invest Ophthalmol Vis Sci.49(7), 2964-2970 (2008).
54 M. C. Mocan, P. T. Yilmaz, M. Irkec and M. Orhan, “In vivo confocal microscopy for the evaluation of corneal microstructure in keratoconus,” Curr Eye Res.33(11-12), 933–939 (2008).
55 J. C. Erie, S. V. Patel, J. W. McLaren, C. B. Nau, D. O. Hodge and W. M. Bourne, “Keratocyte density in keratoconus. A confocal microscopy study,” Am J Ophthalmol.134(5), 689–695 (2002)
56 J. Y. F. Ku, R. L. Niederer, D. V. Patel, T. Sherwin and C. N. J. McGhee, “Laser scanning in vivo confocal analysis of keratocyte density in keratoconus,” Ophthalmol.115(5), 845–850 (2008).
57 N. Effron and J.G. Hollingsworth, “New perspective on keratoconus as revealed by corneal confocal microscopy,” Clin. & Exp. Optom.91(1) 34-55 (2008)
58. F. Ederer, “Shall we count numbers of eyes or numbers of subjects?” Arch Ophthalmol.89(1), 1-2 (1973).
59 J. Katz, “Two eyes or one? The data analyst's dilemma.” Ophthalmol Surg.19(8), 585-589 (1988).

145
60. K. Zadnik, J. T. Barr, M. O. Gordon and T. B. Edrington, “Biomicroscopic signs and disease severity in keratoconus: Collaborative longitudinal evaluation of keratoconus (CLEK) study group,” Cornea.15(2), 139-146 (1996).
61. N. Maeda, T. Fujikado, T. Kuroda, T. Mihashi, Y. Hirohara, K. Nishida, H. Watanabe and Y. Tano, “Wavefront Aberrations Measured with Hartmann-Shack Sensor in Patients with Keratoconus,” Ophthalmol.109(11), 1996–2003 (2002).
62. M. Gobbe and M. Guillon, “Corneal wavefront aberration measurements to detect keratoconus patients,” Cont lens anterior eye.28(2), 57-66 (2005)
63. J. L. Alió and M. H. Shabayek, “Corneal higher order aberrations: a method to grade keratoconus,” J Refract Surg.22(6), 549-545 (2006).
64. A. Podoleanu, I. Charalambous, L. Plesea, A. Dogariu and R. Rosen, “Correction of distortions on optical coherence tomography imaging of the eye,” Phys Med Biol.49(7), 1277–1294 (2004).
65.T. Seiler and A. W. Quurke, “Iatrogenic keratectasia after LASIK in a case of forme fruste keratoconus,” J Cataract Refract Surg.24(7), 1007-1009 (1998).
66. J. B. Randleman, M. Woodward, M. J. Lynn and R. D. Stulting, “Risk assessment for ectasia after corneal refractive surgery,” Ophthalmol.115(1), 37-50 (2008).
67. G. Wollensak, “Crosslinking treatment of progressive keratoconus: new hope,” Curr Opin Ophthalmol.17(4), 356–360 (2006)
146
Chapter 5 Optical coherence microscopy for cellular imaging in cornea
5.1 Introduction
Histopathological analysis of cellular and subcellular features in the diseased tissue
has allowed for the diagnosis and management of diseases pertaining to different
organs in the human body [1]. In ophthalmology, histopathological analysis of tissues
obtained from the eye is a standard procedure used in the clinic for diagnosing
diseases such as intraocular tumors and conjunctival lesions [2,3,4]. For the corneal
diseases such as keratoconus, herpes keratitis and Fuchs dystrophy, histological
analysis of the donor corneal buttons after corneal transplant has provided valuable
information on the mechanism of the diseases [5,6,7]. Moreover, corneal histology
has also been widely used in the laboratory for studying the cellular structural and
functional changes with disease progression or therapeutic interventions in animal
models [8,9]. Histopathological investigations however have their limitations. These
techniques are highly invasive involving physically removing the tissue from the

147
subject. This can introduce artifacts in the measurements, as the tissue is no longer in
its natural state and starts to undergo biological changes. Also mostly these
measurements are only one time and do not permit sequential imaging of the evolving
disease processes in the same subject. This leads to errors, as the biological processes
in each individual could be different.
In-vivo cellular imaging capability in cornea hence is desired as this can overcome
the limitations mentioned above. The advent of in-vivo confocal microscope (IVCM)
[10,11,12,13] has enabled imaging of the cellular structure in the human and animal
eyes in-vivo. Since its introduction IVCM has been successful in studying micro-
structural changes in the diseased corneas which includes changes in the density and
shape of corneal cells in keratoconus [14,15] and dry eye [16] and during wound
healing response after refractive surgery [17,18]. However, since IVCM uses high
NA objective lenses (typically 0.7-1.2) to achieve high axial (3-5 µm) and lateral
(approximately 1 µm) resolution, its field size and working distance both are limited.
Limited field size (generally 0.4 by 0.4 mm) makes it difficult to observe global
changes in the tissue microstructure. Limited working distance leads to two
limitations. Firstly it requires that the tissue be touched for measurement, which is
inconvenient for the patient. Secondly it leaves no room for tracking the sample in
order to estimate which part of the tissue was imaged in a measurement, thus it
difficult to do follow-up measurements with IVCM on the same portion of the cornea.

148
Standard OCT, although having large field and working distance, generally lacks the
lateral resolution to image cellular structure in the tissue, as it uses small NA
objective lenses to achieve higher imaging depth. Optical coherence microscope
(OCM), a variation of OCT where a larger NA objective lens is used to improve the
lateral resolution [19,20,21,22], has been shown to have the capability to image cells
in the cornea ex-vivo [23,24]. The high NA requirement however is not as
pronounced in OCM as it is in IVCM, therefore it could be useful in overcoming the
limitations of IVCM.
To understand why NA requirement is not as strict in OCM, consider the axial and
lateral resolution required for any imaging system to image cells in the cornea. The
cell size in the cornea varies depending on the layer of cornea, in epithelium the cell
size is estimated to be around 10-20 µm [25], in stroma the cells (stromal keratocytes)
are estimated to be around 8-15 µm with the cell separation varying from 35 µm to
120 µm [26] and in endothelium the size varies from 17-21 µm [27]. The Nyquist
limit for resolution in the worst-case scenario, i.e. for stromal keratocytes, hence is
4 µm. The general rule of thumb for imaging a certain feature size is to have a
resolution twice below the Nyquist limit. Hence lateral resolution of at least 2 µm is
necessary to image these cells. For the axial resolution the Nyquist limit of 4 µm
should be sufficient to avoid any interference in the image due to light coming from
the out focus portions of the sample.

149
Figure 5.1 shows the dependence of the lateral and axial resolution of the IVCM and
OCM as a function of the NA of the objective lens used. The expression for the
lateral resolution (dx) of IVCM and OCM is the same and is given as [28]
here λ is the wavelength of light used. In Figure 5.1 it is shown as the solid blue
curve.
Figure 5.1 Graph showing the axial and lateral resolution of OCT and IVCM as function of the
NA of the objective lens
dx = 0.46!NA
1
5.1
2

150
The expression for axial resolution (dz) for IVCM is given as [25]
5.2
where n is the refractive index of the medium. The solid red curve in Figure 5.1
shows the IVCM axial resolution. It can be seen that the lateral resolution of 2 µm can
be achieved with NA = 0.24. However, this relatively low NA in IVCM leads to
degradation of axial resolution to larger than 20 µm. Thus, to achieve the axial
resolution of 4 µm the IVCM needs to use objective lens of NA larger than 0.5.
For OCM, the axial resolution is same as that of OCT and as discussed in chapter 2, is
given as
where Δλ is the light source bandwidth and λ0 is the center wavelength. From Eq. 5.3
it can be seen that for OCM the axial resolution is independent of the NA of the
objective lens, this is because of the inherent property of coherence gating used in
OCT/OCM for axial sectioning. OCM hence can achieve high axial resolution while
using a small NA objective lens. In Figure 5.1 OCM axial resolution is plotted as a
red dashed curve, it can be seen that OCM can achieve an axial and lateral resolution
of 2 µm with an objective of 0.24 NA. With relatively smaller NA objective lens
large field of view and working distance can be achieved. Thus OCM has the
dz = 1.4n!NA2
202ln2z λ
π λΔ =
Δ5.3
151
capability to visualize cellular structure in cornea and at the same time can overcome
the limitations of the IVCM.
OCM hence has the potential to non-invasively observe global changes in the ocular
tissue over a large field of view. With larger working distance it becomes possible in
OCM to track the portion of the sample imaged precisely, thus providing the
capability to monitor chronic changes as the disease progresses or therapeutic
interventions are applied. Smaller NA also allows for simultaneous optical sectioning
of the sample without the need for sequential axial scanning. OCM has been used to
image cells in extracted human and animal corneas [12,13]. In-vivo cellular imaging
with OCM however has been difficult. This is because the image acquisition time of
OCM is slow; therefore subject movement, while the image acquisition is happening,
leads to a loss of information. In this chapter we will present an OCM, capable of
carrying out in-vivo cellular imaging in a living mouse cornea non-invasively.
5.2 System Design
The OCM system was based on a free space spectral domain OCT. The objective was
to achieve lateral resolution better than 2 µm and axial resolution better than 4 µm.
System design primarily involved choosing the right light source and spectrometer,
and beam delivery system design, so that the objectives can be achieved.

152
5.2.1 Light source
To achieve high axial resolution a broadband SLD (Superlum T-870) with a
bandwidth of 180 nm and center wavelength of 870 nm was used. The
supercontinuum light source used for micrometer axial resolution OCT could have
provided better axial resolution, but was not used because its pulse repetition rate was
just 20 KHz, which would have limited the fastest achievable A-scan rate to be just
20,000 A-scans/s. Also the relative intensity in each pulse of the supercontinuum was
variable. This leads to variability in the signal intensity between each A-scan causing
noise in the images if the system was used at short exposure time. This noise was not
observed in the micrometer resolution OCT described in chapter 4 because the
integration time of the linescan camera used in that system was 1 ms corresponding to
the integration of 20 pulses for each A-scan. If an A-scan rate of faster than 10,000 A-
scans/s was used this noise factor becomes evident and caused degradation in image
quality.
5.2.2 Spectrometer
The spectrometer used for OCM had the same optical design as the one used for
micrometer resolution OCT. The limitation of this spectrometer design was the poor
signal collection at the line scan camera (pixel size 5×5 µm2). As mentioned in
section 2.4 for SDOCT designing a spectrometer with high spectral resolution is
crucial for obtaining high imaging depth. Hence such a small pixel size line-scan
camera was used in micrometer resolution OCT to achieve high spectral resolution.

153
The imaging depth of the OCM however is already limited due to the small depth of
focus of the high NA objective lens used. Hence, the spectrometer for OCM does not
need to have a large spectral resolution. This allowed us to use a larger pixel size
camera, which will have larger light collection efficiency and higher sensitivity.
Hence Basler sprint 4096 CMOS line-scan camera with a pixel size of 10×10 µm2
was used in the spectrometer. A detailed analysis on improvements in power
collection and imaging speed of the system resulting from this change in the
spectrometer design is there in section 5.3.3.
5.2.3 Beam delivery system
The optical design of the OCM was primarily focused at achieving 2 µm lateral
resolution. Since the light source with a bandwidth of 180 nm was used for imaging,
chromatic aberration can severely degrade the lateral resolution. Since lenses used for
focusing and collimating the beam are the main source of chromatic aberration, the
OCM system was designed based on mirrors except for an apochromatic objective
lens for focusing the beam on the sample. The apochromatic design of the objective
lens was well corrected for chromatic aberration. Figure 5.2 shows the schematic of
the system.
The beam coming out of the fiber output of the SLD was collimated by a 12.5 mm
focal length off-axis parabolic mirror. The beam was split into sample and reference
arms with a 30/70 cube beamsplitter, with 30% light going into the sample arm and
70% of light going into the reference arm. In the sample arm the beam fell on the

154
galvo mirrors for transverse scanning and went to the objective lens through two
concave mirrors. The two concave mirrors before the objective lens served two
purposes. Firstly, since the objective lens back focal plane was inside the lens the two
concave mirrors form an optical relay system to place the scanning mirror plane at the
back focal plane of the objective lens for telecentric scanning. Secondly the two
concave mirrors magnified the beam diameter of the OCT so that the NA of better
than 0.24 can be maintained.
For the same reason related to chromatic aberration mentioned above, pupil relay was
carried out with mirrors instead of lenses. To minimize other system aberrations
relatively long focal length of the mirrors were used (300 mm and 500 mm).
Figure 5.2 OCM system schematic

155
The objective lens used was a Mitutoyo, 10X, NIR planar apochromatic, infinity
corrected lens. It has NA of 0.26, which provides lateral resolution better than 2 µm,
and a maximum field of view of 2.4 mm. The lens was specifically designed to have a
large working distance of 30.5 mm. An identical lens was kept in the reference arm to
match the dispersion between the sample and the reference arm. The light beams
coming back from the two arms were sent into the spectrometer, identical to the one
used in the micrometer resolution OCT with the difference being the line-scan
camera.
5.3 System Performance
5.3.1 Lateral Resolution
The lateral resolution was first evaluated using ray tracing. As the design of the real
objective was not available, a perfect objective lens was used in place of the Mitutoyo
lens, assuming the optical performance of the Mitutoyo lens to be diffraction limited.
Figure 5.3 shows spot diagram (top row) calculated using Code V showed all the rays
to be confined well within the airy disk for a full field of 2 mm, suggesting that the
system is diffraction limited for such a large field.

156
Figure 5.3 The spot diagram and two point PSF of the system measured using ray tracing at 5
field positions starting from center to 1mm
The two-point PSF, i.e. the convolution of the PSF with two points on the image
plane, was also evaluated to estimate the lateral resolution based on diffraction limit.
Figure 5.3 bottom row shows the two-point PSF for two points separated by 1.7 µm.
The two points on the image plane can be clearly delineated, suggesting that the
lateral resolution of the system is at least 1.7 µm over a field of 2 mm. This however
could be slightly worse if the real objective lens design was used in the analysis.
The lateral resolution was also estimated experimentally by imaging a CMOS sensor
with the pixel size of 2.2 µm. Figure 5.4 shows the image obtained. All the individual
pixels can be visualized, suggesting the lateral resolution to be better than 2.2 µm.
The unusually large separation between each pixel could be because of the lenslet
array that is placed in front of the sensor to optimize power collection. This resolution

157
was tested only at the central 100 by 100 µm2 of the field and it is not clear if the
system will be able to maintain this performance for a 2 by 2 mm2 field.
Figure 5.4 The image of a CMOS sensor obtained by the OCM. The distance between the two
bright squares was 2.2 mm
5.3.2 Axial Resolution
The axial resolution was evaluated experimentally by placing a flat mirror in the
sample arm and measuring the FWHM of the observed peak, while the theoretically
predicted axial resolution was estimated from the envelope of the interference pattern.
Figure 5.5 shows the axial PSF obtained experimentally (blue curve) and predicted
theoretically (red curve). The experimentally measured axial resolution, i.e. the
FWHM of the axial PSF, was 4.4 µm in air, which corresponds to 3.2 µm in the
corneal tissue. The theoretically predicted axial resolution was 2.9 µm in corneal
tissue. The disparity between the two values could be because of improper k-space
remapping and the residual dispersion mismatch between reference and sample arm.

158
Figure 5.5 The axial PSF of the OCM measured experimentally by a mirror in the sample arm
shown in blue, the PSF estimated theoretically from the envelope of spectral interference fringes shown in dashed red. The FWHM of the axial PSF is estimated to be 4.4 µm in air corresponding
to 3.2 µm in corneal tissue. Theoretically predicted PSF had FWHM of 4 µm in air. The mismatch could be because of the dispersion mismatch between the sample and reference arm
and improper k-space remapping.
5.3.3 Imaging Speed
The imaging speed of a SDOCT depends on the exposure time of the linescan
camera. The basic spectrometer optical design used for OCM was the same as the one
used for micrometer resolution OCT, the difference is in the camera used for
detecting the light and the light source bandwidth. Significant decrease in the
exposure time of the linescan camera (increase in imaging speed) was observed after
using the new light source and camera.
The smaller bandwidth of the light source used for OCM is expected to provide a
two-fold improvement in imaging speed. This could be explained as follows. For the
same amount of power sent into the eye, the power per wavelength (power spectral

159
density) is higher for a smaller bandwidth light source than for the larger bandwidth
one. Hence when the spectrometer disperses the light into its spectral components the
power falling on each pixel of the line-scan camera is increased. Higher incident
power on the camera requires smaller camera integration time to provide similar SNR
performance, resulting in an improvement in imaging speed. Since the SLD has a
bandwidth of 180 nm, which is about half of the 375 nm bandwidth used with
supercontinuum source for micrometer resolution OCT, in OCM we expect a two-
fold improvement in the imaging speed.
Table 5.1 Improvements in the signal collection by using the new CMOS sensor
Micrometer
Resolution OCT OCM Improvement
factor
Bandwidth (nm) 375 180 2.08
Pixel Size (µm2) (Encircled Energy) 5X5 (30%) 10X20 (90%) 3
Beamsplitter (Reflection/Transmission) 50/50 30/70 1.4
Also an improvement in signal collection is expected because of the larger camera
pixel size and vertical binning (section 5.2.2). From ray tracing it was evaluated that
the energy falling on a 20 µm by 10 µm pixel of the sprint line-scan camera was
about three times larger than the light falling on a 5 µm by 5 µm pixel size of the
L803K. To improve the signal collection in OCM a 30/70 beamsplitter was used to
split the beam into the sample and reference arm instead of a 50/50 beamsplitter. So

160
70% of the light reflected from sample is now going into the detector instead of 50%
in micrometer resolution OCT. Hence improvement by a factor of 1.4 is expected.
Table 5.1 summarizes these improvements
Combining these three factors together we expected the overall improvement in the
signal collection of the spectrometer to be (2×3×1.4) 8.4 times. In micrometer
resolution OCT the exposure time of 1 ms was used for imaging. While carrying out
imaging in OCM we realized that 50 µs of exposure time was sufficient to carry out
imaging, which was a 20 times improvement in the acquisition speed in comparison
to micrometer resolution OCT. The performance of the system was better than
expected. One reason for this could be that since much smaller lateral portion of the
cornea around the apex was imaged by the OCM the power coming back from the
sample might be larger. The difference in the quantum efficiency of the CCD and
CMOS detector might also lead to this disparity. With 50 µs of exposure time used
for linescan camera, the imaging was carried out at an A-scan rate of 20,000 A-
scans/s.
5.4 In-vivo imaging in the living mouse cornea
In-vivo imaging of the mouse cornea was carried out after anesthetizing the animal.
To image the cells in a particular layer of the mouse cornea, the mice were moved
axially using a translation stage to bring the corneal layer into focus.

161
While carrying out three-dimensional imaging with OCT the motion artifacts are a
major limitation. A mouse stereotaxic hence was used to limit the head movement of
the animal. Although the animal was anesthetized during the imaging sessions, due to
the breathing and heart-beating activity there is a significant axial and lateral eye
movement. Since point scanning geometry involves obtaining consecutive B-scans as
the sample is scanned and placing them side by side to form an en face image of the
tissue, if there is a lateral movement of the sample between two consecutive B-scans,
the structural information is lost. To overcome this problem we manufactured a
stereotaxic system shown in Figure 5.6, which minimized the movement of the
sample. It consisted of a bite-bar, two ear/cheek plugs and a nose holder so positioned
that during the imaging session the head of the animal stayed relatively stationary and
completely independent of the movement of the rest of the body.
Figure 5.6 Three views of the mouse stereotaxic system used to minimize the eye movement. The
system consists of the ear/cheek plugs, nose holder and bitebar to hold the head steady.

162
Figure 5.7 (a), (b) and (c) show the representative images obtained by the system for
the epithelial layer, stroma and endothelium respectively. The field sizes in these
images are 100×100 µm2, 200×200 µm2 and 100×100 µm2, respectively for the three
layers. Although the cells in the epithelium are about 8-15 µm in size (four times
larger than the lateral resolution of the system) it was difficult to visualize any
cellular structure in the epithelium. This could be because when epithelial layer is
brought into focus for imaging, the light reflected from the top surface, due to high
refractive index difference between cornea and air, is so high that it saturates the
detector. To avoid saturating the detector either the incident power or camera
integration time is reduced. However by doing that the signal coming from the inner
parts of the layer is also reduced, degrading the SNR of the system and leading to
difficulty in visualizing the cellular structure in the epithelium.
In both the stroma and the endothelium, the cellular structure was clearly visualized.
The keratocytes in the stroma can be identified as the white patches over the dark
background. In the endothelial layer the hexagonal arrangement of the cells was seen.
The cell density of keratocytes in the stroma and the endothelial cells was estimated
to be 9186 cells/mm3 and 1658 cells/mm2 respectively. These cell density measured
by OCM have a good agreement with the previously reported values [29,30].

163
Figure 5.7 En face images showing the cellular structure in the (a) epithelium, (b) stroma and (c) endothelium obtained using OCM. The images for epithelium and endothelium are in log scale
while the images for keratocytes are in linear scale. These images are compared with the previously obtained images of (d) epithelium, (e) stroma and (f) endothelium obtained using
IVCM (Labb´e et al. Current Eye Research, 31:501–509, 2006)
Another benefit of OCM over IVCM is the ability to obtain 3D volumetric images of
the cornea without the need for shifting the focus. Figure 5.8 shows a 3D rendering of
mouse stroma over a 400 µm by 400 µm region at the junction of the cornea and the
limbus. In the corneal region, corresponding to the top corner of the image, we can
see 3 dimensional arrangement of the corneal keratocytes visualized as white spots.
Along the periphery, which will be the limbus, we can see the arrangement of dense
collagen lamellae in the azimuthal orientation. The diameter of the collagen lamellae
was measured to be about 2 µm, which matches well with the previously published
data [31,32].

164
Figure 5.8 3D rendering of the stroma in the mouse eye at the junction of cornea and limbus
5.5 Conclusions
An OCM with 3 µm axial and 2 µm lateral resolution was demonstrated. It also has a
large working distance of 30.5 mm, which makes the system completely noninvasive
(no requirement of contacting the eye) and allows tracking the portion of sample
being imaged so that follow up imaging can be carried out. The system was capable
of visualizing the cellular structure in the stroma and endothelium in a living mouse
eye. Due to strong reflection from the air and tear interface it was difficult to visualize
cellular structure in the epithelium.

165
The imaging field of the system is currently small (0.4 mm by 0.4 mm), however this
is not an optical limitation but arises because of the limited imaging speed of the
system. The optical performance of the system stays diffraction limited for five times
larger field of view in OCM (2 mm). As a future work to improve the robustness of
the system the imaging speed of the system has to be increased, possibly by using
Fourier domain mode locked lasers with A-scan rates now reaching 1.37 MHz [33].
For wide field imaging, even at such high speeds subject motion artifacts in the
images are expected. Therefore motion correction algorithms will need to be applied
[34,35,36] or the other option would be to concurrently correct for eye movement
through eye tracking, while image acquisition is happening [37,38].
We have demonstrated, for the first time, the feasibility of imaging cells in the cornea
in-vivo using OCM. In future with improved imaging speed and wide field this
technology could play a pivotal role in furthering our understanding of the corneal
diseases.
References 1. Chapter 11 in: Mitchell, Richard Sheppard; Kumar, Vinay; Abbas, Abul K.; Fausto, Nelson. Robbins Basic Pathology. Philadelphia: Saunders. ISBN 1-4160-2973-7. 8th edition.
2. M. J. Hogan, J. A. Alvardo and J. E. Weddell. 1971. Histology of the Human Eye. W. B. Saunder Co., Philadelphia.
3 P. Tosi, M. Cintorino, P. Toti, V. Ninfo, M. C. Montesco, R. Frezzotti, T. Hadjistilianou, A. Acquaviva, and P. Barbini, “Histopathological evaluation for the prognosis of retinoblastoma,” Ophthalmic Genetics, 10(3), 173-177 (1989)

166
4. P. T. Finger, P. Latkany, M. Kurli and C. Jacob, “The Finger iridectomy technique: small incision biopsy of anterior segment tumours,” Br J Ophthalmol. 89, 946–949 (2005)
5. V. M. Borderie, M. Baudrimont, A. Vallee, T. L. Ereau, F. Gray and L. Laroche, “Corneal Endothelial Cell Apoptosis in Patients with Fuchs’ Dystrophy,” Invest. Ophthalmol. Vis. Sci. 41(9), 2501-2505 (2000).
6. P. Toti, G. M. Tosi, C. Traversi, K. Schurfeld, C. Cardone and A. Caporossi, “CD-34 Stromal Expression Pattern in Normal and Altered Human Corneas,” Ophthalmol. 109(6), 1167–1171 (2002).
7. Scroggs MW, Proia AD. Histopathological variation in keratoconus. Cornea. 1992;11:553-559.
8. H. Gao, M. E. Pennesi, X. Qiao, M. N. Iyer, S. M. Wu, E. R. Holz and W. F. Mieler, “Intravitreal Moxifloxacin: Retinal Safety Study with Electroretinography and Histopathology in Animal Models,” Invest. Ophthalmol. Vis. Sci. 47(4), 1606-1611 (2006)
9. Lixing W. Reneker, Amy Bloch, Leike Xie, Paul A. Overbeek and John D. Ash, “Induction of corneal myofibroblasts by lens-derived transforming growth factor b1 (TGFb1): A transgenic mouse model,” Brain Res. Bull. 81, 287–296, (2010)
10. P. Furrer, J. M. Mayer and R. Gurny, “Confocal microscopy as a tool for the investigation of the anterior part of the eye,” J Ocul Pharmacol Ther. 13, 559–78 (1997)
11. W. M. Petroll, H. D. Cavanagh and J. V. Jester, “Clinical confocal microscopy,” Curr Opin Ophthalmol. 9, 59–65 (1998)
12. I. Jalbert, F. Stapleton, E. Papas, D.F. Sweeney and M. Coroneo, “In-vivo confocal microscopy of Cornea,” Br. J. Ophthalmology 87, 225-236 (2003)
13. R. L. Niederer, D. Perumal, T. Sherwin, and C. N. J. McGhee, “Laser Scanning In-vivo Confocal Microscopy Reveals Reduced Innervation and Reduction in Cell Density in All Layers of the Keratoconic Cornea,” Invest. Ophth. Vis Sci. 49, 2964–2970 (2008)
14. J. C. Erie, S. V. Patel, J. W. McLaren, C. B. Nau, D. O. Hodge and W. M. Bourne, “Keratocyte density in keratoconus. A confocal microscopy study,” Am J Ophthalmol 134, 689–695 (2002)

167
15. J. G. Hollingsworth and N. Efron, “Observations of banding patterns (Vogt striae) in keratoconus: a confocal microscopy study” Cornea 24, 162–166 (2005)
16. J. M. Benitez del Castillo, M. A. S. Wasfy, C. Fernandez and J. Garcia-Sanchez, “An in-vivo confocal masked study on corneal epithelium and subbasal nerves in patients with dry eye,” Invest. Ophth. Vis. Sci. 45, 3030-3035 (2004)
17. P. J. Pisella, O. Auzerie, Y. Bokobza, C. Debbasch and C. Baudouin, “Evaluation of corneal stromal changes in-vivo after laser in situ keratomileusis with confocal microscopy,” Ophthalmology 108, 1744-1750 (2001)
18. J. A. Moilanen, M. H. Vesaluoma, L. J. Muller and T. M. Tervo, “Long-term corneal morphology after PRK by in-vivo confocal microscopy,” Invest. Ophth. Vis. Sci. 44, 1064–1069 (2003)
19. J. A. Izatt, M. R. Hee, G. M. Owen, E. A. Swanson and J. G. Fujimoto, “Optical coherence microscopy in scattering media,” Opt. Lett. 19(8), 590-592 (1994)
20. J. P. Rolland, P. Meemon, S. Murali, K. P. Thompson, and K. Lee, “Gabor-based fusion technique for Optical Coherence Microscopy,” Opt. Exp. 18(4), 3632-3642 (2010)
21. Kye-Sung Lee,1,* Kevin P. Thompson,2 Panomsak Meemon,1 and Jannick P. Rolland, “Cellular resolution optical coherence microscopy with high acquisition speed for in-vivo human skin volumetric imaging,” Opt. Lett. 36(12) 2221-2223 (2011)
22. K. Lee, H. Zhao, S. F. Ibrahim, N. Meemon, L. Khoudeir and J. P. Rolland, “Three-dimensional imaging of normal skin and nonmelanoma skin cancer with cellular resolution using Gabor domain optical coherence microscopy,” J. Biomed. Opt. 17(12), 126006 (2012)
23 M. Akiba, N. Maeda, K. Yumikake, T. Soma and K. Nishida, “Ultrahigh-resolution imaging of human donor cornea using full-field optical coherence tomography,” J. Biomed. Opt. 12(4), 041202 (2007)
24. Q. Wu, B. E. Applegate, and A. T. Yeh, “Cornea microstructure and mechanical responses measured with nonlinear optical and optical coherence microscopy using sub-10-fs pulses,” Biomed. Opt. exp. 2(5), 1135-1146 (2011)
25. A. C. Romano, E. M. Espana, S. H. Yoo, M. T. Budak, J. M. Wolosin and S. C. G. Tseng, “Different Cell Sizes in Human Limbal and Central Corneal Basal Epithelia Measured by Confocal Microscopy and Flow Cytometry,” Invest. Ophth. Vis. Sci. 44, 5125-5129 (2003)
168
26. J. I. Prydal, F. Franc, P. N. Dilly, M. G. Kerr Muir, M. C. Corbett and J. Marshall, “Keratocyte density and size in conscious humans by digital image analysis of confocal images,” Eye (Lond). 12, 337-42 (1998)
27. R. W. Yee, M, Matsuda, R. O. Schultz and H. F. Edelhauser, “Changes in the normal corneal endothelial cellular pattern as a function of age,” Curr. Eye Res. 4, 671 – 678 (1985)
28. S. Inoue, Foundations of confocal scanned imaging in light microscopy. In Handbook of Biological Confocal Microscopy, 2nd Ed. J. B. Pawley, Plenum Press: New York, 1–16 (1995).
29. J. Song, Y. G. Lee, J. Houston, W. M. Petroll, S. Chakravarti, H. D. Cavanagh and J. V. Jester, “Neonatal Corneal Stromal Development in the Normal and Lumican-Deficient Mouse,” Invest. Ophthalmol. Vis. Sci. 44(2), 548-557 (2003)
30. A. Behndig, K. Karlsson, T. Brannstrom, M. L. Sentman, and Stefan L. Marklund, “Corneal Endothelial Integrity in Mice Lacking Extracellular Superoxide Dismutase,” Invest. Ophthalmol. Vis. Sci. 42(12), 2784-2788 (2001)
31. F. M. Polack, “Morphology of the cornea. I. Study with silver stains,” Am. J. Ophthalmol. 51, 1051–1056 (1961)
32. Y. Komai and T. Ushiki, “The three-dimensional organisation of collagen fibrils in the human cornea and sclera,” Invest. Ophthalmol. Vis. Sci. 32, 2244–2258 (1991)
33. T. Klein, W. Wieser, C.M. Eigenwillig, B.R. Biedermann, and R. Huber, “Megahertz OCT for ultrawide-field retinal imaging with a 1050nm Fourier domain mode-locked laser,” Optics Express, 19(4), 3044-3062 (2011)
34. M. Pircher, E. Götzinger, H. Sattmann, R.A. Leitgeb and C.K. Hitzenberger, “In vivo investigation of human cone photoreceptors with SLO/OCT in combination with 3D motion correction on a cellular level,” Optics Express, 18(13), 13935-13944 (2010)
35. J. Lee, V. Srinivasan, H. Radhakrishnan, and D.A. Boas, “Motion correction for phase-resolved dynamic optical coherence tomography imaging of rodent cerebral cortex,” Optics Express, 19(22), 21258-21270 (2011)
36. M.F. Kraus, B. Potsaid, M.A. Mayer, R. Bock, B. Baumann, J.J. Liu, J. Hornegger and J.G. Fujimoto, “Motion correction in optical coherence tomography

169
volumes on a per A-scan basis using orthogonal scan patterns,” Biomedical Optics Express, 3(6), 1182-1199 (2012)
37. A.T. Dutchkowski, Eye tracking methodology: theory and practice, second edition, Springer-Verlag, London Limited 2007
38. M. Stetter, R.A. Sendtner and G.T. Timberlake, “A novel method for measuring saccade profiles using the scanning laser ophthalmoscope,” Vision Res. 36(13),1987-1994 (1996)

170
Chapter 6
Summary and Conclusions
6.1 Summary
This thesis work has demonstrated three advanced OCT systems developed to
overcome the limitations of the currently available systems in terms of imaging depth,
axial resolution and lateral resolution. These improvements have expanded the
clinical applicability of OCT in ophthalmology and also improved our understanding
of human accommodation and corneal diseases as well as the possibility of cellular
imaging. There were three main goals achieved in this thesis.
Firstly a large scan depth OCT with high resolution has been demonstrated and
used to study the mechanism of accommodation by visualizing the biometric
changes in the eye during accommodation. A novel sample scanning method in the
OCT system was developed where the fundamental idea is to shine beam normal to
the ocular surfaces instead of traditional telecentric scanning method. This leads to an

171
increase in the amount of light scattered back to the system from the ocular surfaces,
resulting in improving SNR. Also, since the beams enter the eye at oblique angles,
they are able to bypass the pupil and illuminate the peripheral portions of the
posterior lens surface which are otherwise is occluded by the iris in traditional OCT
scanning. The system performance was first tested on a model eye. SNR
improvement of 0.7 dB, 4 dB, 5 dB and 12 dB over traditional scanning was observed
for anterior cornea, posterior cornea, anterior lens and posterior lens surface
respectively. However, due to non-telecentric nature of beam scanning, significant
image distortion was observed for all the ocular surfaces. To correct the distortion, a
new distortion correction method was successfully developed to extract the true
surfaces profiles. In-vivo imaging was carried out in the human eyes and both the
corneal and lens surfaces were visualized. Especially, a wide posterior lens surface of
6 mm in diameter was imaged without the need for pupil dilation. Biometric changes
in the anterior segment with accommodation were measured from OCT images
captured in two young eyes. These changes include a decrease in anterior chamber
depth and increase in lens thickness. The radius of curvature of the both the anterior
and posterior lens surfaces decreased with accommodation. The decrease in radius of
curvature of the anterior lens surface was much higher than the posterior lens surface.
All these observations were consistent with the previous literature, indicating the
feasibility of using this system to carry out a clinical study to understand the
mechanism of accommodation.

172
Secondly, a micrometer resolution ocular surface OCT was developed for
ultrahigh resolution imaging of individual corneal layers in-vivo and used to
characterize the diseased cornea. The high axial resolution was achieved by using a
broad bandwidth (375 nm) supercontinuum light source. The system was constructed
in free space to avoid dispersion induced degradation in image quality. Also, to obtain
high imaging depth (1 mm) a custom spectrometer based on modified Czerny Turner
configuration with a broad spectral range and high spectral resolution (0.1 nm at 625
nm to 0.25 nm at 1000 nm) was designed and built. The axial resolution of the system
was estimated to be 1.1 µm in the corneal tissue. The system was able to achieve an
imaging depth of larger than 1 mm although the sensitivity dropped significantly from
35 dB at 0.16 mm to 20 dB at 1.1 mm axial depth. The axial resolution also degraded
with imaging depth (from 1.1 µm at 0.16 mm axial depth to 2.9 µm at 1.1 mm axial
depth). In-vivo imaging of the living human corneas was carried out and it was
demonstrated that the OCT is capable of visualizing all the individual corneal layers.
The robustness of the system was further demonstrated through a clinical study on
quantifying the structural changes in the epithelium and Bowman’s layers in eyes
with keratoconus. A reduction in the thickness and increase in the thickness
variability of epithelium and Bowman’s layer were observed in keratoconic eyes. It
was found that these parameters had a strong correlation with disease severity. A
clear pattern of thinning of the epithelium at the apex and inferior cornea was
measured. Compared to normal cornea increased scatter was observed in epithelium

173
and Bowman’s layer of the keratoconic cornea, however the increase was statistically
significant only for the Bowman’s layer.
Thirdly the feasibility of in vivo cellular imaging of the living mouse cornea
using an optical coherence microscope (OCM) was demonstrated. In vivo
confocal microscope (IVCM), the most popular technique for cellular imaging of the
cornea has limited field size and working distance. Smaller field size means its
applicability is limited to measurements of a small portion of the cornea while small
working distance firstly requires touching the eye and secondly makes it difficult to
locate the same portion of the sample repetitively for follow up studies. A prototype
OCM that allowed for similar image quality as IVCM, while maintaining larger
working distance and field size, was developed. The system achieved an axial
resolution of 3.2 µm in the corneal tissue. The lateral resolution of the system was
theoretically predicted to be 1.7 µm and was validated to be better than 2.2 µm. From
in-vivo imaging of the mouse cornea, stromal keratocytes, collagen lamellae in the
limbus and the endothelial cells were visualized clearly. The system was also capable
of obtaining volumetric images of the stroma, which visualized the orientations of
keratocytes in the cornea and collagen lamellae in the limbus.
The work done for this thesis will have a significant impact in the area of
ophthalmology and vision science. Advanced OCT systems for ophthalmic
applications have been demonstrated, which could be used in visualizing ocular
structures that were difficult to visualize previously. The utility of these advanced

174
OCT systems in addressing new clinical problems has been established through our
studies on the mechanism of human accommodation and keratoconus. The
improvements in OCT technology demonstrated in this thesis are not only relevant to
the presented applications but can also affect various other areas of ophthalmology
and vision science as we will discuss in the following future work section. Moreover,
the design principles for OCT system development described in this thesis could be
directly used or refined by future researchers for building identical or improved OCT
systems, which will further expand the applicability of OCT to ocular diseases.
6.2 Future Directions
New developments and findings achieved in this thesis work have unveiled new
possibilities of solving clinical problems in the area of ophthalmology. In this section,
potential future applications of OCT and OCM are discussed.
6.2.1 Lens shape change with age
Lens paradox [1] is the observation that with increasing age the radius of curvature of
the lens surfaces becomes small but there is no myopic shift in the best refraction of
the subject [2]. To explain the lens paradox, theoretical models of the lens with
decrease in the refractive index with age have been proposed [3]. However no
significant reduction in the refractive index of the ageing lens has been
experimentally observed [4,5].

175
The measurement of the steepening in the radius of curvature of the ageing lens that
has lead to lens paradox, has mostly been carried out using Scheimpflug photography
[6,7,8]. Since in Scheimpflug photography the anterior lens surface is seen refracted
by the cornea and posterior lens surface is seen refracted through cornea and anterior
lens surface, issues have been raised that due to distortion from cornea the radius of
curvature of the lens surfaces appear steeper in the images [9]. The accuracy of the
distortion correction algorithm for large scan depth OCT has been proven on the
model eye. Therefore large scan depth OCT has the potential to accurately quantify
the radius of curvature changes of the lens surfaces with age, to explain lens paradox.
6.2.2 Accommodating intraocular lens efficacy
The accommodating intraocular lenses are designed to overcome presbyopia by
changing optical power dynamically just like the young human crystalline lens.
Previous studies have looked at the movement of these intraocular lenses in the eyes
with pharmacologically induced accommodation [10,11,12] using partial coherence
interferometry. These measurements however were limited to single on-axis
estimation of the anterior chamber depth, providing information only on the axial
movement of the intraocular lens. To have a more comprehensive understanding of
the intraocular lens movement full cross-sectional profile measurement of the
intraocular lens is required. Large scan depth OCT can be used to carry out these
measurements in the pseudophakic eyes with accommodating intraocular lenses.
176
6.2.3 Disease diagnosis in keratoconus suspects
The ability to accurately detect subtle differences in structures in the epithelium and
Bowman’s layer using micrometer resolution OCT can enable us to improve
sensitivity and specificity of keratoconus screening under clinical settings. The
detection of subclinical keratoconus is one of the major safety issues to avoid
postoperative development of ectasia after corneal laser refractive surgery [13,14].
Also there is great interest in halting the progression of the disease in keratoconus
suspects by increasing the strength of the cornea using corneal crosslinking [15].
Recently Reinstein et al. have suggested corneal epithelium thickness profile as one
of the parameter to be used for detecting early keratoconus, based on three case
studies of suspected keratoconus patients [16]. It is well known that the corneal
epithelium can easily regenerate its cells and remodel to establishing a smooth and
symmetrical corneal surface, which compensates for irregularity on stromal surface
[17]. Since keratoconus involves stromal thinning and steepening, it is probable that
in keratoconus patients the epithelium may modify itself to compensate for this
deformation. This hypothesis is consistent with the increased epithelium thickness
variability and a specific pattern in the epithelium thickness profile observed in the
present study. It would be interesting to further investigate if the subtle changes in the
epithelium thickness, thickness variability and thickness profile can be used to detect
keratoconus suspects.

177
6.2.4 Teardrop efficacy for dry eye
Dry eye is the disease associated with insufficient tear in the eye, either due to lack of
tear production or high tear evaporation that causes ocular discomfort and poor image
quality of the eye. To date, dry eye cannot be cured and the mainstay for the treatment
currently is prescribing artificial teardrops. A variety of teardrops are available in the
market, however the evaluation of the suitability of a teardrop for a patient remains
subjective. Micrometer resolution OCT can be used to objectively evaluate the
efficacy of the teardrops by monitoring if normal tear film thickness and volume is
maintained after adding the teardrop in the dry eye patients.
6.2.5 Contact lens design
Micrometer resolution OCT can also be used to objectively assess the contact lens
wearing comfort. The contact lens modifies the tear film by splitting it into pre lens
tear film (PLTF) and post lens tear film (PoLTF). Tear layer provide the oxygen
supply to the cornea and any blockage to this oxygen supply to the cornea due to
contact lens wear will cause ocular irritation and discomfort. Therefore to maintain a
safe and comfortable contact lens wear, it is important that a good circulation of
PLTF and PoLTF can be maintained over the contact lens [18,19,20]. Various new
types of contact lenses commercially available in the market, are specifically
designed to have higher wettability to sustain adequate PLTF and PoLTF. However it
has been difficult to test their efficacy objectively as it is difficult to visualize PLTF
and PoLTF directly. We have shown that micrometer resolution OCT has the

178
capability of visualizing the two layers, thus it can be used to study the dynamics of
PLTF and PoLTF for investigating the safety and comfort of different types of
contact lenses.
6.2.6 In-vivo cellular imaging in human cornea
We have demonstrated the capability to carry out in vivo cellular imaging in the
mouse cornea using OCM. The ultimate goal will be to upgrade the system so that in
vivo cellular imaging in the human cornea can be carried out. The system has to be
designed such that any artifacts arising due to patient movement could be avoided.
One way of doing this is to increase the imaging speed of the OCT such that any
patient movement during the image acquisition will appear frozen in time. With the
development of FDOCT, there has been an exponential increase in the speed of the
OCT with the fastest speed achieved by an OCT system for in-vivo imaging now
reaching 1.37 million A-scans/s using a Fourier domain mode locked laser [21,22].
However these systems are based on swept source and use longer wavelengths, hence
the axial and lateral resolution will be sacrificed. Also even at such speeds 3D
volumetric cellular images with a field size of 1 mm by 1 mm will be obtained in
about a second. Therefore the subject motion artifacts will still be there; hence motion
correction algorithms will need to be applied [23,24.25]. Another way for correcting
the motion correction will be to do eye tracking concurrently while image acquisition
is going on and then register images later on while post processing [26,27].

179
The system’s current capability of in-vivo cellular imaging in an animal model can
itself have a strong impact in ophthalmology. Almost all the novel surgical and
therapeutic interventions are initially tested by performing experiments in the animal
models, before being translated to the clinic. Imaging animal eyes is crucial in order
to test the safety and efficacy of such medical interventions.
To conclude, the research work for this dissertation has led to the development of
advanced OCT systems with improved axial resolution, lateral resolution and imaging
depth. This has pushed the limits of OCT technology to newer applications in
ophthalmology and vision science. The potential of these OCT systems to be useful in
answering clinical and scientific question was successfully established by studying
human accommodation and keratoconus. The applicability of these systems however
is not just limited to these applications and can be extended to a variety of other
ophthalmology and vision science related clinical and scientific problems.
Researchers can also use the design concepts discussed in this work to further
advance OCT technology, which will again lead to improving our ability to explore
more challenging clinical issues that have not been possible to resolve.
References
1. J. F. Koretz, G. H. Handelman, “The lens paradox and image formation in accommodating human eyes,” Topics in Aging Research in Europe 6, 57–64 (1986)
2. F. J. Slataper, “Age norms of refraction and vision,” Arch. Ophthalmol. 43, 466–

180
481 (1950)
3. G. Smith, D. A. Atchison, B. K. Pierscionek, “Modeling the power of the aging human eye,” J. Opt. Soc. Am. A-Optics and Image Science 9, 2111–2117 (1992)
4. B.K. Pierscionek, “Refractive index contours in the human lens,” Exp. Eye Res. 64, 887–893 (1997)
5. A. Glasser, M. C. W. Campbell, “Biometric, optical and physical changes in the isolated human crystalline lens with age in relation to presbyopia,” Vision Res. 39, 1991–2015 (1999)
6. N. Brown, “The change in lens curvature with age,” Exp. Eye Res. 19, 175–183 (1974)
7. D. Olbert, “Problems of lens biometry by Scheimpflug photos,” Lens Res. 5, 73–81 (1988)
8. J. M. Sparrow, A. J. Bron, N. A. Brown, H. A. Neil, “Biometry of the crystalline lens in early-onset diabetes. Br. J. Ophthalmology 74, 654–660 (1990)
9. M. Dubbelman and G.L. Van der Heijde, “The shape of the aging human lens: curvature, equivalent refractive index and the lens paradox,” Vision Res. 41, 1867–1877 (2001)
10. O. Findl, B. Kiss, V. Petternel, R. Menapace, M. Georgopoulos, G. Rainer, W. Drexler, “Intraocular lens movement caused by ciliary muscle contraction ,”J. Cataract Refract. Surg. 29, 669–676 (2003)
11. C. Koeppl, O. Findl, R. Menapace, K. Kriechbaum, M. Wirtitsch, W. Buehl, S. Sacu, W. Drexler, “Pilocarpine-induced shift of an accommodating intraocular lens: AT-45 Crystalens,” J. Cataract Refract. Surg. 31, 1290–1297 (2005)
12. J. Hancox, D. Spalton, C. Heatley, H. Jayaram and J. Marshall, “Objective measurement of intraocular lens movement and dioptric change with a focus shift accommodating intraocular lens,” J. Cataract Refract. Surg. 32, 1098-1103 (2006)
13. T. Seiler, A. W. Quurke, “Iatrogenic keratectasia after LASIK in a case of forme fruste keratoconus,” J. Cataract Refract. Surg. 24, 1007-1009 (1998)
14. J. B. Randleman, M. Woodward, M. J. Lynn, R. D. Stulting, “Risk assessment for ectasia after corneal refractive surgery,” Ophthalmology 115, 37-50 (2008)
15. G. Wollensak, “Crosslinking treatment of progressive keratoconus: new hope,” Curr. Opin. Ophthalmol. 17, 356–360 (2006)

181
16.D. Z. Reinstein, T. J. Archer, M. Gobbe, “Corneal epithelial thickness profile in the diagnosis of keratoconus,” J. Refract. Surg. 25, 604-610 (2009)
17. C. H. Dohlman, “The Function of the Corneal Epithelium in Health and Disease The Jonas S. Friedenwald Memorial Lecture,” Invest. Ophthalmol. Vis. Sci. 10, 383-407 (1971)
18. T. Hayashi, I. Fatt, “A lubrication theory model of tear exchange under a soft contact lens,” Am. J. Optom. Physiol. Opt. 53, 101–103 (1976)
19. L. Wagner, K. Polse, R. Mandell, “Tear pumping and edema with soft contact lenses,” Invest. Ophthalmol. Vis. Sci. 19, 1397–1400 (1980)
20. S. A. Little, A. S. Bruce, “Postlens tear film morphology, lens movement and symptoms in hydrogel lens wearers,” Ophthalmic Physiol. Opt. 14, 65–69 (1994)
21. T. Klein, W. Wieser, C.M. Eigenwillig, B.R. Biedermann, and R. Huber, “Megahertz OCT for ultrawide-field retinal imaging with a 1050nm Fourier domain mode-locked laser,” Opt. Express 19, 3044-3062 (2011)
22. W. Wieser, B. R. Biedermann, T. Klein et al., “Multi-Megahertz OCT: High quality 3D imaging at 20 million A-scans and 4.5 GVoxels per second,” Opt. Express 18, 14685-14704 (2010)
23. M. Pircher, E. Götzinger, H. Sattmann, R.A. Leitgeb and C.K. Hitzenberger, “In vivo investigation of human cone photoreceptors with SLO/OCT in combination with 3D motion correction on a cellular level,” Opt. Express 18, 13935-13944 (2010)
24. J. Lee, V. Srinivasan, H. Radhakrishnan, and D.A. Boas, “Motion correction for phase-resolved dynamic optical coherence tomography imaging of rodent cerebral cortex,” Opt. Express 19, 21258-21270 (2011)
25. M.F. Kraus, B. Potsaid, M.A. Mayer, R. Bock, B. Baumann, J.J. Liu, J. Hornegger and J.G. Fujimoto, “Motion correction in optical coherence tomography volumes on a per A-scan basis using orthogonal scan patterns,” Biomed. Opt. Express 3, 1182-1199 (2012)
26. A.T. Dutchkowski, Eye tracking methodology: theory and practice, second edition, Springer-Verlag, London Limited (2007)
27. M. Stetter, R.A. Sendtner and G.T. Timberlake, “A novel method for measuring saccade profiles using the scanning laser ophthalmoscope,” Vision Res. 36, 1987-1994 (1996)


