Embed Size (px)
Citation preview

Copyright 2003 by the Genetics Society of America
High-Resolution Crossover Maps for Each Bivalent of Zea mays UsingRecombination Nodules
Lorinda K. Anderson,*,1 Gregory G. Doyle,† Brian Brigham,* Jenna Carter,* Kristina D. Hooker,*Ann Lai,* Mindy Rice* and Stephen M. Stack*
*Department of Biology, Colorado State University, Fort Collins, Colorado 80523 and†Department of Agronomy, University of Missouri, Columbia, Missouri 65211
Manuscript received April 11, 2003Accepted for publication June 17, 2003
ABSTRACTRecombination nodules (RNs) are closely correlated with crossing over, and, because they are observed
by electron microscopy of synaptonemal complexes (SCs) in extended pachytene chromosomes, RNsprovide the highest-resolution cytological marker currently available for defining the frequency and distri-bution of crossovers along the length of chromosomes. Using the maize inbred line KYS, we prepared anSC karyotype in which each SC was identified by relative length and arm ratio and related to the properlinkage group using inversion heterozygotes. We mapped 4267 RNs on 2080 identified SCs to producehigh-resolution maps of RN frequency and distribution on each bivalent. RN frequencies are closelycorrelated with both chiasma frequencies and SC length. The total length of the RN recombination mapis about twofold shorter than that of most maize linkage maps, but there is good correspondence betweenthe relative lengths of the different maps when individual bivalents are considered. Each bivalent has aunique distribution of crossing over, but all bivalents share a high frequency of distal RNs and a severereduction of RNs at and near kinetochores. The frequency of RNs at knobs is either similar to or higherthan the average frequency of RNs along the SCs. These RN maps represent an independent measure ofcrossing over along maize bivalents.
MAIZE (Zea mays L.) is one of the first model organ- ern 1967; de la Torre et al. 1986; Jones 1987; Shermanisms in which the power of genetics was produc- and Stack 1995).
tively merged with cytology to create the new field of One way to relate linkage maps to the structure ofcytogenetics (reviewed by Rhoades 1984). The ability chromosomes is to observe the location and frequencyto recognize all 10 maize chromosomes in pachytene of crossing over along chromosomes by means othersquash preparations was key for relating each chromo- than linkage analysis. To a degree this has been accom-some to a specific linkage group (McClintock 1931, plished in squash preparations by observing the number1933; Rhoades and McClintock 1935). Subsequently, and positions of chiasmata on late diplotene-diakinesismaize chromosome cytology has remained a fertile field bivalents (Jones 1987). Unfortunately, for most species,for investigation (e.g., Dawe et al. 1994; Freeling and including maize, this is a relatively inaccurate, low-reso-Walbot 1994; Bass et al. 2000; Muehlbauer et al. 2000; lution method because (1) twists can be mistaken forSadder and Weber 2002) that has been accompanied chiasmata, (2) nearby chiasmata may not be resolved,by the development of sophisticated maize linkage maps (3) chromosomes are comparatively short when chias-(e.g., Davis et al. 1999; Sharopova et al. 2002). However, mata are visible, and (4) it is difficult to relate mostintegration of linkage maps with chromosome structure bivalents to specific pairs of chromosomes (Stack et al.has been difficult in maize (as well as in other organisms) 1989; Sherman and Stack 1995; Stevenson et al. 1998).because crossing over is not evenly distributed along Another method for cytologically assessing crossing overthe length of chromosomes. For example, crossing over has been developed recently using fluorescent antibod-is typically uncommon in heterochromatin and centro- ies to label MLH1p, a mismatch repair protein that ismeres compared to euchromatin (e.g., Mather 1939; present at crossover sites during pachytene (Baker etfor reviews see Comings 1972; Resnick 1987), and even al. 1996; Hunter and Borts 1997; Anderson et al.in euchromatin, where the bulk of crossing over occurs, 1999; Moens et al. 2002). Because MLH1 signals appearthe frequency of crossing over can vary considerably as discrete fluorescent foci on pachytene bivalents thatfrom one part of a chromosome to another (e.g., South- are 5–10 times longer than bivalents at diakinesis, MLH1
foci can be mapped at higher resolution than chiasmatacan. However, the application of this technique to map-
1Corresponding author: Department of Biology, Colorado State Uni- ping crossovers has been limited to birds and mammalsversity, Fort Collins, CO 80523.E-mail: [email protected] so far (e.g., Pigozzi 2001; Froenicke et al. 2002), per-
Genetics 165: 849–865 (October 2003)

850 L. K. Anderson et al.
grown in a temperature-controlled greenhouse with supple-haps because the antibodies were raised to mammalianmental lighting. All inversion heterozygotes were in KYS back-MLH1 proteins, and these antibodies do not bind toground.their plant counterparts (our observations). While rep- Diakinesis chromosome squashes: Anthers containing diaki-
resenting a significant improvement over chiasmata to nesis-stage cells were fixed for 1–24 hr in 1:3 acetic ethanol.map crossover events, analysis of MLH1 fluorescent foci After clearing the anthers for 1–5 min in 45% acetic acid, the
meiotic cells were squeezed out of the anthers in a fresh dropis still limited by the resolution of the light microscope.of 45% acetic acid and squashed lightly under a siliconized coverThe highest-resolution method available to map theglass. The cover glass was removed using dry ice, the slide wasfrequency and location of crossover events cytologicallyallowed to air dry, and chromosomes were stained with 2%
remains analysis of late recombination nodules (RNs; aceto-orcein under a cover glass with brief heating over ansometimes abbreviated as LNs) on synaptonemal com- alcohol lamp. After staining, cover glasses were removed byplexes (SCs; e.g., Carpenter 1975; reviewed by Zickler inverting the slide over 95% ethanol. Before the preparations
dried, new cover glasses were mounted with Euparal. Com-and Kleckner 1999; Anderson and Stack 2002). RNsplete sets in which all chromosomes were separate and inter-are proteinaceous ellipsoids, �100 nm in their longestpretable were photographed using a �100 PlanApo objectivedimension, which lie on SCs (that is, pachytene biva- and a digital camera attached to an Olympus Provis light
lents). RNs are closely correlated with crossovers and microscope.lie at sites where chiasmata will form later (Carpenter Pachytene SC spreads: SC spreads were prepared on plastic-
coated slides as described by Stack and Anderson (2002).1975, 1979; von Wettstein et al. 1984; Marcon andSC spreads were stained with 2% uranyl acetate followed byMoens 2003). The proposed role of RNs as molecularReynold’s lead citrate (UP) or with 33% silver nitrate (Sher-factories for crossing over has been corroborated re-man et al. 1992). The slides were scanned using phase lightcently by work showing that the MLH1 protein is a microscopy, and good SC spreads on plastic were picked up
component of late RNs (Moens et al. 2002). The high onto 50- or 75-mesh grids. The grids were examined in an AEIresolution of RN analysis is due not only to the observa- 801 electron microscope, and SC spreads without detectable
stretching and with kinetochores were photographed at a mag-tion of RNs on relatively long pachytene chromosomes,nification of �1600 or �2500. In total, 2080 individual SCsbut also to the small size of RNs compared to chiasmatafrom 290 sets were identified and mapped with regard to RNs.(0.1 �m vs. 1 �m, respectively) and to the use of electronBoth total RN number and total SC set length (the combined
microscopy to resolve RNs. length of all SCs in a cell) could be assessed for 206 of theseThe most useful cytological maps of crossing over are SC sets. In the remainder of the sets, certain of the SCs could
those in which every bivalent can be identified unequivo- not be identified, usually due to unclear or missing kineto-chores. Some SCs had a small amount of asynapsis, particularlycally and related to a specific linkage group. This hasnear the ends, and may have been in the very earliest stagesnot been possible in many organisms, and, in lieu ofof diplotene.this, some studies have pooled crossover data from chro- Measurements: Electron microscope negatives were scanned
mosomes of similar size and arm ratios (Southern into a computer using a Hewlett-Packard ScanJet 4c and Adobe1967; Anderson et al. 1999). In other studies, it was Photoshop (version 5.0) software. Montages of SC spreads
were assembled using Adobe Photoshop. Proper tracing ofpossible to identify some of the bivalents using eithereach SC and the position of kinetochores and RNs were deter-a combination of relative lengths and arm ratios (e.g.,mined directly from the negatives using a �8 magnifying loupeLaurie and Jones 1981; Pigozzi 2001) or fluorescenceand recorded onto prints of the montages. One lateral ele-in situ hybridization of chromosome-specific sequences ment from each SC was measured in micrometers using the
(Lynn et al. 2002; Tease et al. 2002). Thus far, only two computer program MicroMeasure (Reeves 2001). Total SCstudies have mapped crossing over on every bivalent in length varied from set to set, but the relative length of SCs
and SC arms, i.e., arm ratios, within each set remained consis-a set, one using RNs on tomato SCs that were identifiedtent. SCs were identified by relative lengths (percentages ofby relative lengths, arm ratios, and patterns of hetero-total SC length for the set) and arm ratios (length of the longchromatin (Sherman and Stack 1995) and the otherarm divided by length of the short arm). RNs were recognized
using MLH1 foci on mouse autosomal SCs after chromo- using criteria of size, shape, staining intensity, and associationsome-specific painting (Froenicke et al. 2002). Here with SC as described by Stack and Anderson (2002). RNwe report such an analysis in maize. For this, we first positions were measured and expressed as a percentage of
the arm length from the centromere. Using average lengthsprepared an SC karyotype on the basis of relative lengthsfor each of the 10 SCs and their average arm ratios, each ofand arm ratios for the maize inbred line Kansas Yellowthe SCs was divided into 0.2-�m segments, and each observedSaline (KYS). Each SC was identified and related to a RN was placed into one of these segments on the basis of its
specific maize chromosome and linkage group. Most SC original relative position from the centromere. For those SCsidentifications were verified using inversion heterozygotes. in which an arm was not divisible by two, the most proximal
interval was made 0.3 �m rather than 0.2 �m. After compilingWe then determined the frequency and distribution ofthe RN data, the genetic map length of each SC was calculatedRNs (crossing over) on each of the 10 maize SCs.by determining the average number of RNs per SC and thenmultiplying by 50 (one RN � one crossover � 50 cM).
Statistics: The program Minitab (version 13) was used forMATERIALS AND METHODSstatistical analyses and for preparing histograms. The smooth-ing (Lowess) lines were based on the histograms (MinitabPlants: Maize inbred KYS and heterozygotes for inversions
1d, 2i, 3c, 4c, 5d, 6b, 7a, 8c, 9b, and 10a (Doyle 1994) were degree of smoothing � 0.1; steps � 0).

851RN Crossover Maps in Maize
Figure 1.—Complete setof silver-stained spread SCsfrom maize KYS. Each SChas been identified by itsrelative length and arm ra-tio and numbered accord-ingly. Arrows indicate thelocation of RNs. The twoRNs on the short arm of SC6 are so close together thatthey would likely result in astructure that would be in-terpreted as a single chi-asma during diakinesis. Lat-eral element thickeningscan be observed on severalSCs (e.g., 1S, 2S, 7S, 10L).Such thickenings are morecommonly observed with sil-ver staining than with ura-nyl acetate-lead citrate stain-ing. K, kinetochore; S, shortarm; L, long arm. Bar, 5 �m.
RESULTS in relative length between 2 (or sometimes 3) SCs wasminimal, but the arm ratios were noticeably different.SC karyotype: SC spreads were prepared by exposingThe average relative length and average arm ratio forprotoplasts to a hypotonic solution containing a smalleach ranked SC from the 30 sets are presented in Tableamount of nonionic detergent (Stack and Anderson1 along with the same information for five other karyo-2002). During this procedure, the cytoplasm as well astypes produced from squashes, three-dimensional re-the chromatin surrounding each SC decondenses toconstructions, and SC spreads. Except for absolute totalbecome almost invisible, while SCs and RNs are rela-lengths of complete sets and the arm ratio of SC 6tively unaffected (Figure 1). Dispersion of the chroma-that carries the NOR, the similarity of the karyotypes istin means that such features as chromomeres and knobsstriking. Overall, the SCs decrease gradually in averageare not visible to help identify SCs. In addition, therelative length from SC 1 (14.8%) to SC 10 (6.8%), butnucleolus is usually dispersed in these preparations, sothe length positions of SC 4 and SC 5 have been reversedit is not possible to detect the association of the nucleo-to reflect the standard pachytene chromosome karyo-lus with the nucleolus organizer (NOR) on the shorttype. With regard to arm ratios, each ranked SC grouparm of SC 6 (McClintock 1934). This means that SCis statistically different from the SC group immediatelyidentification must rely on relative length and arm ratio.preceding or succeeding it (P � 0.002, two-sample t-test).Arm ratios can be determined only when kinetochoresThus, each SC in a set can be identified accurately onare visible in SC spreads that are probably in mid- tothe basis of its relative length and arm ratio.late pachytene.
To verify that our SC identifications were consistentTo prepare the karyotype, SC spreads were selectedwith the genetic linkage groups, we analyzed spreads ofusing the following criteria: (1) each of the 10 SCs couldSCs from plants that were heterozygous for one of thebe followed along its entire length, (2) the kinetochorefollowing inversions: 1d, 2i, 3c, 4c, 5d, 6b, 7a, 8c, 9b, orwas visible on each SC, and (3) SCs were not visibly10a (Figure 2; Doyle 1994). Unfortunately, obtainingstretched. Thirty sets of SCs that met these criteria werespreads that contained inversion loops along with distin-measured for lengths and arm ratios. Then SCs in eachguishable kinetochores on each SC proved to be diffi-set were ordered according to their relative lengths. Ifcult. For example, no SC spreads from the inversionnecessary, the order of an SC was changed so that theheterozygotes In8c and In10a fulfilled these two criteria,arm ratios for each SC were consistent with pachyteneand only 27 SC sets (In1d � 2; In2i � 6; In3c � 3; In4c � 4;maps (Table 1). Out of the (10 � 30 �) 300 SC lengthIn5d � 2; In6b � 1; In7a � 5; In9b � 4) for the otherpositions, 55 (18%) were changed on the basis of the
arm ratio data. For most of these changes, the difference inversion heterozygotes could be used to verify the SC

852 L. K. Anderson et al.
TABLE 1
Comparison of selected karyotypes for maize
Chromosome squashesSC spreads3D fluorescence:
Chromosome or McClintock Longley (1939); Dawe et al. 3D sections:SC rank et al. (1981) Rhoades (1950) (1992, 1994) Gillies (1973) Gilles (1981) This work
1 14.9 (1.27) 14.8 (1.30) 15.8 (1.30) 14.2 (1.26) 14.9 (1.24) 14.8 (1.27)2 12.0 (1.20) 12.1 (1.26) 12.3 (1.68) 12.4 (1.20) 11.9 (1.15) 11.9 (1.08)3 11.2 (2.03) 11.7 (2.01) 10.8 (2.06) 11.1 (2.03) 11.3 (2.06) 11.2 (2.02)4 10.6 (1.57) 10.6 (1.59) 10.0 (1.39) 10.8 (1.68) 10.5 (1.62) 10.7 (1.56)5 10.7 (1.16) 10.7 (1.20) 10.1 (1.08) 10.9 (1.21) 11.0 (1.13) 10.8 (1.10)6 8.9 (3.14) 8.4 (3.22) 9.5 (3.41) 9.2 (3.01) 9.1 (2.75) 8.9 (2.63)7 8.4 (2.58) 8.3 (2.72) 9.0 (2.38) 8.5 (2.38) 8.8 (2.67) 8.7 (2.76)8 8.8 (3.29) 8.3 (3.26) 8.2 (2.83) 8.8 (2.92) 8.2 (2.99) 8.5 (3.04)9 7.7 (1.82) 8.1 (1.85) 7.4 (1.69) 8.0 (1.89) 7.7 (2.09) 7.7 (1.92)
10 6.7 (2.83) 6.9 (2.80) 6.7 (2.31) 6.2 (2.43) 6.5 (2.54) 6.8 (2.43)
Average total — 556 — 353 421 331length of sets (�m)
No. of observations — 28 2 5 14 30
The karyotypes were prepared using a variety of techniques including light microscopy of pachytene chromosome squashes,deconvolution-based, three-dimensional fluorescence light microscopy of intact pachytene nuclei, three-dimensional electronmicroscopic reconstructions of pachytene nuclei from serial thin sections, or electron microscopy of SC spreads. In all cases,primary microsporocytes from maize inbred KYS were used. For each karyotype, the average relative length of each SC is presentedfirst as a percentage of the total length of the SC set, followed by the average arm ratio in parentheses.
identifications (Figure 2). Because an inversion loop even if not all of the SCs could be individually identified(usually because of the absence of discernible kineto-with associated asynapsis on its borders can alter the
expected relative length and arm ratio for the inversion chores). These complete sets of SCs averaged 20.7 RNsper SC set, a difference of �1% when compared toloop SC, the nine normal chromosomes in a set were
identified using relative lengths and arm ratios, with using RN averages for individual SCs. Thus, using RNs,we estimate that the total map length for maize inbredthe “missing” SC being identified as the SC with the
inversion loop. For each of the eight inversion heterozy- KYS is between (20.5 RNs � 50 cM/RN �) 1025 cMand (20.7 RNs � 50 cM/RN �) 1035 cM.gotes in which this test was possible, the identification
of the inversion loop SC corresponded with the appro- Chiasma frequency per cell: To compare rates ofcrossing over in KYS maize determined from RNs topriate chromosome. This result confirms that our SC iden-
tifications are consistent with established linkage groups. those determined from chiasmata, we analyzed at least50 squashes of chromosome sets at diakinesis from eachWe examined 290 sets of SCs with RNs and were able
to identify 2080 (�72%) individual SCs (Table 2, Figure of 5 plants (Figure 4) and at least 10 SC spreads fromeach of 10 plants (Table 3). No single plant was analyzed3). Some SCs were easier to identify than others, so
the number of each SC analyzed for RNs varies. For for both chiasmata and RNs. Each plant, regardless ofthe method of analysis, demonstrated large cell-to-cellexample, SC 2, a long SC with an arm ratio near 1.0,
and SC 10, the shortest SC, were relatively easy to iden- variability (up to twofold) in the number of crossoversobserved. While there were no significant differencestify, and as a result, we made 247 observations of each.
In contrast, the number of observations for SC 6 and among plants in variance for chiasmata or for RNs (Bart-lett’s test and Levene’s test, P � 0.2), there were signifi-SC 7 was lower (n � 176 and 178, respectively) because
they are similar in both relative length and arm ratio cant differences among plants in the mean numberof crossovers per cell on the basis of both chiasmataand more difficult to distinguish from one another.
Nevertheless, these data represent the highest number (ANOVA; P � 0.001) and RNs (ANOVA; P � 0.001).Because the plants were all from the same inbred strainof observations of RNs on individual SCs made for any
organism except tomato (Sherman and Stack 1995). and presumably had the same genetic makeup, we ex-plored the possibility that environmental conditionsRN frequency per cell: On the basis of the average
frequency of RNs per SC, there is an average of 20.5 were responsible for the differences in mean crossoverfrequency. The plants analyzed for chiasmata were allRNs per cell (Table 2). To verify that this number is
representative, we examined 239 complete sets of SCs exposed to the same greenhouse conditions during thesummer of 2002. The RN data were accumulated overin which each SC could be analyzed for RN frequency,

853RN Crossover Maps in Maize
used. Bivalents with two crossovers were observed moreoften for chiasmata than for RNs, while bivalents withthree or more crossovers were observed more often forRNs than for chiasmata. The difference in resolutionof the two techniques may contribute to these observeddiscrepancies.
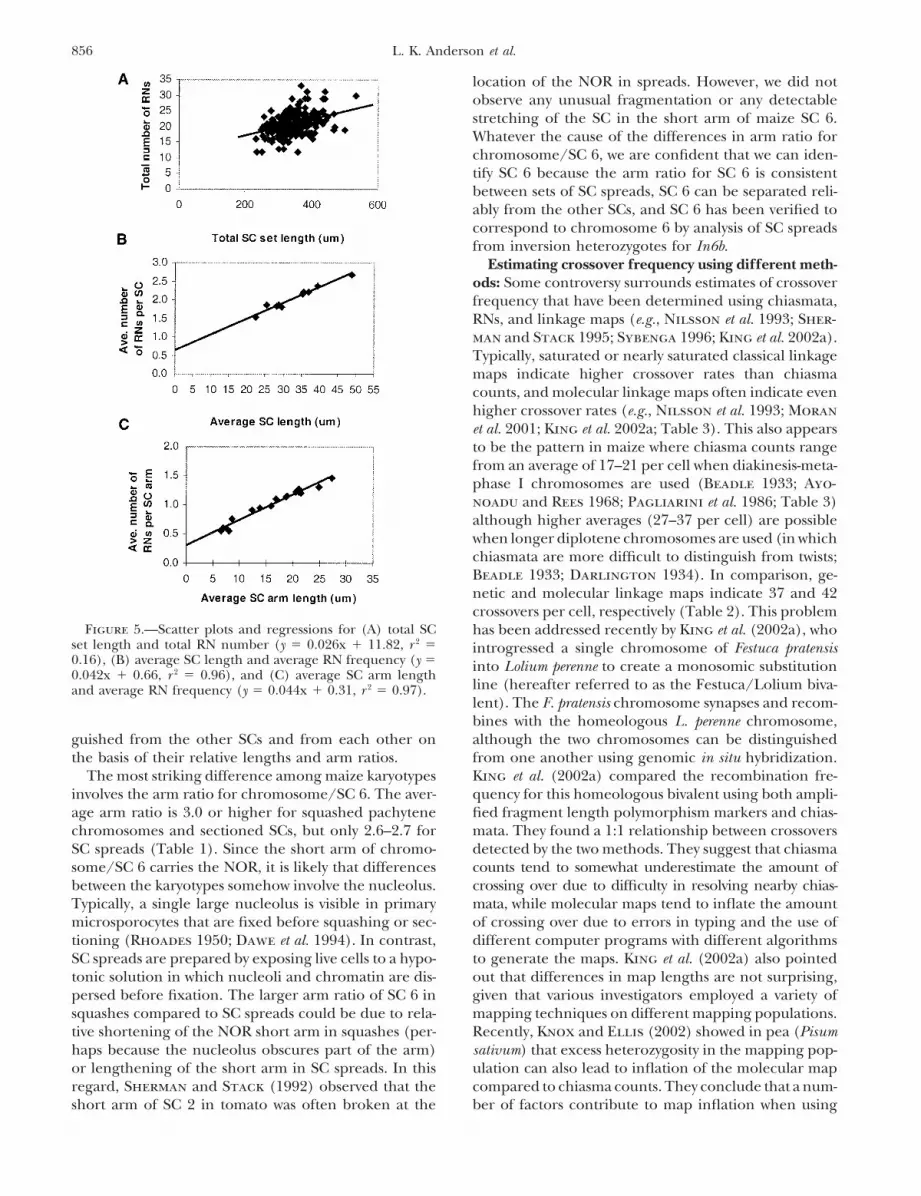
Relationship between RN frequency and SC length:For 206 SC sets, we were able to determine both totalRN number and total SC set length (although not allSCs could be identified in each spread; Figure 5A). Theslope of the regression is significantly different fromzero [total RNs � (0.026 � total SC length) � 11.8, P �0.001, r 2 � 16.3%]. Thus, SC set length and RN numberper set are positively related, with �16% of the variationin RN number explained by SC set length.
When the 10 maize bivalents are considered sepa-rately (n � 2080 SCs, Tables 1 and 2), there is a strongpositive relationship between average RN frequency andaverage SC length, with 96% of the variability in averageRN frequency related to average SC length [Figure 5B;y � (0.042 � SC length) � 0.66, r 2 � 96.2%]. A similarrelationship is observed when average SC arm lengthsare compared to the average number of RNs per arm
Figure 2.—Complete SC spread stained with uranyl acetate- [Figure 5C, y � (0.044 � SC length) � 0.31, r 2 � 96.5%].lead citrate from a maize plant heterozygous for In7a. Each For both regressions, the slope and y-intercept are sig-SC has been labeled at the kinetochore (K) with the appro-
nificantly different from zero (P � 0.001). Thus, averagepriate SC number on the basis of its relative length and armRN frequency is closely correlated with individual SCratio. The inversion loop in the long arm of SC 7 can be seen
in the lower left of the spread. Kinetochores from different length, whether one considers arm lengths separatelySCs are often fused (6K and 8K, 1K and 10K, 4K and 5K). or bivalent length as a whole.There are no obvious lateral element thickenings on any of Distribution of RNs along SCs: Histograms showingthe SCs. Bar, 5 �m.
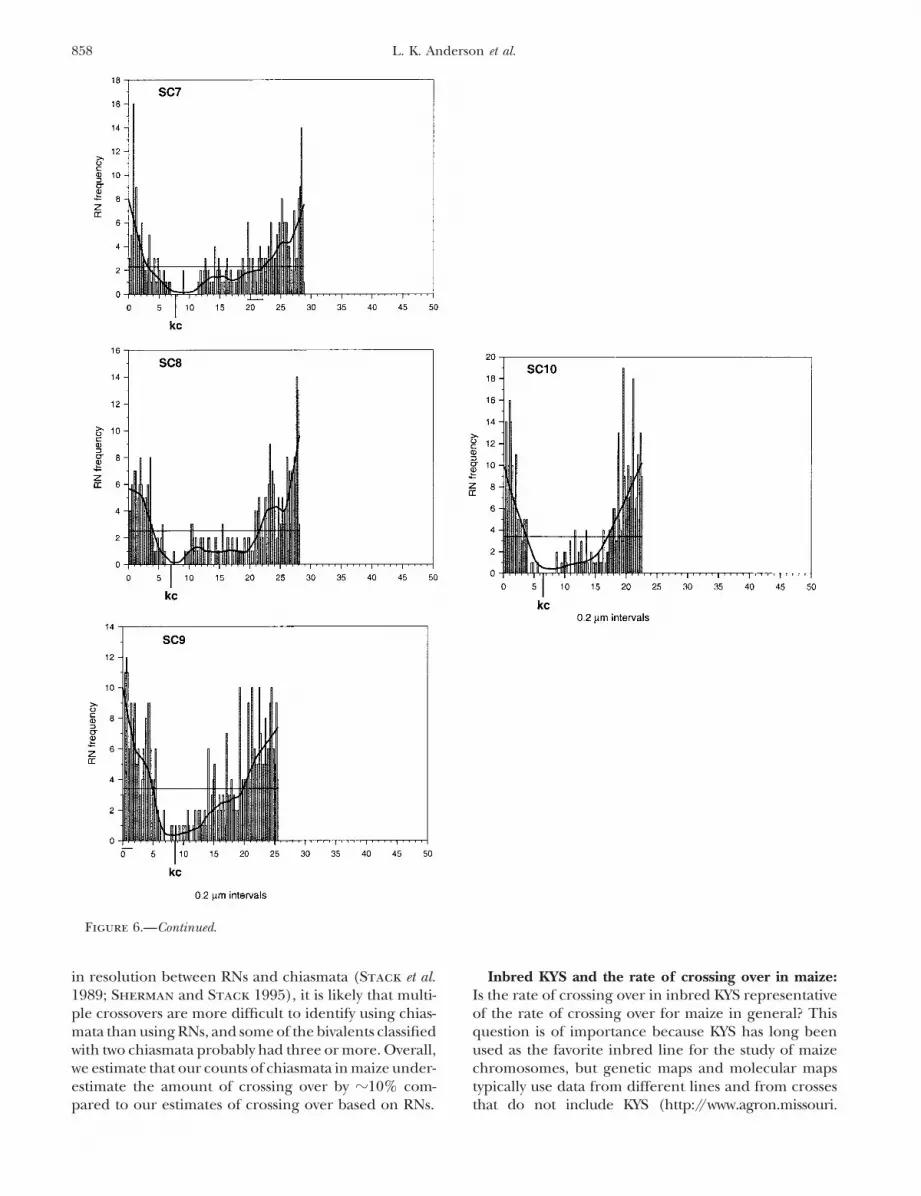
the distribution of RNs along each SC are presented inFigure 6. Each SC is represented by the x-axis with theshort arm to the left and the kinetochore (kc) markedfour years from 1998 to 2002, again using plants grown
in the same greenhouse. SC spreads from 8 of the 10 with a vertical line beneath the axis. Each SC is dividedinto 0.2-�m segments with the number of RNs observedplants were prepared in the summer (April–September)
and SC spreads from 2 of the plants were prepared in in each segment represented by a vertical bar. Two linesare superimposed over each distribution. One is athe fall (October–March). The average number of RNs
per cell was 19.8 and 21.5 for the 2 winter-grown plants smoothing (Lowess) line derived from the data (Cleve-land 1979), which shows the general trend of crossingand 17.0–23.1 for the 8 summer-grown plants. Although
the data are limited, this pattern of RN numbers does over along each SC. The smoothing line minimizes varia-tion regardless of whether the variation is caused bynot support the hypothesis that environmental factors
are responsible for the differences in RN numbers ob- sampling errors or by localized differences in crossoverfrequency. The second superimposed line is horizontalserved.
Because the ranges of values for chiasmata and for and represents the average number of RNs observedper 0.2-�m interval for each SC. Intervals that differRNs were similar among plants (even though there were
significant differences in mean crossover frequency considerably from the horizontal lines represent hot(above average) or cold (below average) regions foramong plants), the data for chiasmata and RNs were
pooled separately and compared. The average number crossing over.All of the SCs share the general characteristics of aof RNs per cell was �10% higher (20.6) than the average
number of chiasmata (18.9; Table 3). In addition to high frequency of RNs in distal regions (including thevery ends of SCs) and a low frequency of RNs in proximaldetermining the average number of crossovers per cell,
we also examined the frequencies of bivalents with 0, regions, i.e., around kinetochores (Figures 6 and 7).The distributions of RNs on SCs 2, 4, and 9 indicate1, 2, and 3 or more RNs and chiasmata (Table 3). The
frequencies of bivalents with zero and one crossover per that a few RNs occur within kinetochores. This is anartifact due to compiling data from SCs that vary some-cell were the same whether RNs or chiasmata were used.
However, the frequency of bivalents with two or more what in arm ratios and plotting the distributions on an“average” SC. While RNs sometimes occur quite closecrossovers differed depending on the method of analysis

854 L. K. Anderson et al.
TABLE 2
Predicted map length based on the average number of RNs per SC compared toclassical genetic and molecular (IBM) linkage maps
SC Genetic mapa,b IBM mapa,c
No. of SCs Average Equivalent Equivalent EquivalentSC no. observed no. of RN cMd cM RNe cMf RNe
1 216 2.69 134.3 258 5.2 325.3 6.52 247 2.37 118.4 224 4.5 204.2 4.13 189 2.22 110.9 216 4.3 228.4 4.64 196 2.14 107.1 172 3.4 228.3 4.65 203 2.21 110.6 185 3.7 202.6 4.16 176 1.81 90.6 144 2.9 164.2 3.37 178 1.86 93.0 128 2.6 188.7 3.88 194 1.80 90.2 177 3.5 189.2 3.89 234 1.85 92.7 178 3.6 193.9 3.9
10 247 1.54 76.9 174 3.5 157.4 3.1Total 2080 20.5 1024.7 1856 37.1 2082.2 41.8
a From http://www.agron.missouri.edu/cMapDB/cMap.html (March 2003).b Genetic map is the classical genetic map, compiled by Ed Coe from cooperators.c IBM is an intermated B73/Mo17 recombinant inbred high-resolution molecular map.d The average number of RNs � 50 cM/RN.e Centimorgans divided by 50.f This molecular map includes recombination events from three meioses (K. Cone, personal communication),
so the centimorgans presented on the web site have been divided by 3 here for the purpose of comparisonusing the standard definition of centimorgans (Tamarin 2002).
to the kinetochore, we did not observe any RNs that segments contain 48% (2061/4271) of all RNs observedwhile the most proximal segments contain 4% (156/were clearly within kinetochores (Figure 7). In addition
to the general trends in the distribution of crossing over 4271) of all RNs observed. Thus, over the same SClength, distal regions have 12 times more crossing overthat all SCs share, each SC also has a distinct pattern
of RNs along its length. than proximal regions do.Maize KYS has five knobs, two on short arms (1S, 9S)To quantify the difference in RN frequency between
distal and proximal segments, we divided each SC arm and three on long arms (5L, 6L, 7L; Dawe et al. 1992;Chen et al. 2000). The location of each knob is indicatedinto five equal (20%) segments, pooled the total num-
ber of RNs observed for all of the most distal segments, by a horizontal line beneath the appropriate SC in Fig-ure 6. Overall, the frequency of RNs in knob regions isand pooled the total number of RNs for all proximal
segments. The combined distal segments for all SCs either about the same as the average for the SC as awhole (5L, 6L, 7L) or higher (1S, 9S). This is particularlyrepresent (0.20 � 331 �m total SC length �) 66.2 �m
in length as do the combined proximal segments. If true for the knob on the tip of the short arm of SC 9,which has a frequency of RNs that is twice as high asRNs were distributed evenly along the length of all SCs,
then each 20% segment would have �20% of the total the average for SC 9 (7 vs. 3.4 RNs per 0.2-�m interval).In contrast, the NOR region on the short arm of SC 6number of RNs observed. Instead, the most-distal SC
Figure 3.—Close-up of SC 9 from a set of SCsstained with uranyl acetate-lead citrate. A smallportion of the distal end of the long arm is asy-napsed, indicating that the SC has begun desy-napsis and is in the earliest stage of diplotene. SC9 has one RN (inset a) in the short arm. Thedispersed chromatin around SC 9 is visible as anamorphous coating. A portion of SC 2 with anRN (inset b) is also shown. Double-headed arrowsshow the same RNs at higher magnification ininsets. K, kinetochore. Bar, 2 �m (1 �m in insetsa and b).

855RN Crossover Maps in Maize
different maize lines, aside from the observation thatthe number and location of heterochromatic knobs mayvary (Longley 1939; McClintock et al. 1981; Dempsey1994). However, while the presence of knobs can affectthe length and arm ratios of mitotic chromosomes, thepresence or absence of knobs has little effect on therelative length and arm ratios of SCs because hetero-chromatin is underrepresented in SC length (Stack1984; Jones and de Azkue 1993). Thus, it is likely thatthe KYS SC karyotype applies in large measure to allmaize lines.
Within animal and plant species (including maize)and even within individuals, there may be as much asa twofold variation in the absolute lengths of sets of pachy-Figure 4.—Diakinesis chromosome squash from maize KYS.
The counted number of chiasmata is indicated next to each tene chromosomes or SCs. However, the relative lengthbivalent. With the exception of chromosome 6 that is associ- and arm ratio for each chromosome or SC in a set remainsated with the nucleolus (N), none of the chromosomes can constant (Moses et al. 1977; Gillies 1981; Shermanbe identified. Bar, 10 �m.
and Stack 1992; our observations). This indicates thateach chromosome/SC in a set responds in a propor-tional way to changes in the length of the entire set.has a slightly reduced level of RNs compared to the
Chromosome numbering in maize is based primarilyaverage for SC 6 (1.6 vs. 2.2 RNs per 0.2-�m interval),on relative length with the longest chromosome num-but this lower level could be due to its proximity to thebered 1, ranging down to the shortest numbered 10.kinetochore (Figure 6).However, in each karyotype reported for maize, chro-mosome/SC 5 is slightly longer than chromosome/SC
DISCUSSION 4 (Table 1). This discontinuity in numbering arose be-cause maize chromosomes were numbered initially us-SC identification: We have prepared a karyotype foring mitotic chromosomes that differ slightly in relativeSCs from KYS maize on the basis of relative lengths andlength from pachytene chromosomes (McClintockarm ratios (Figure 1; Table 1). This SC karyotype is very1929; Rhoades 1955; Carlson 1988). In addition, chro-similar to other maize pachytene karyotypes that havemosome/SC 8 is longer than chromosome/SC 7 inbeen prepared using a number of different techniquessome karyotypes but not in others (Table 1). These(aceto-carmine-stained pachytene chromosome squashes,differences in relative length between different maize4�,6-diamidino-2-phenyindole-stained intact pachytenekaryotypes are small and may represent either measure-nuclei, three-dimensional reconstructions of pachytenement error or natural variation within populations. Innuclei from serial thin sections, and SC spreads). Theeither case, these chromosomes are still readily distin-inbred KYS line of maize generally has been used inguished from each other on the basis of differences inthese studies because KYS pachytene chromosomes sep-their arm ratios. In addition, we were able to verify thearate well during squashing and spreading, making themidentity of SCs 1, 2, 3, 4, 5, 6, 7, and 9 using inversioneasier to analyze than pachytene chromosomes fromheterozygotes. Although not verified by inversion het-many other maize lines (Dempsey 1994; our unpub-erozygotes, our identification of SCs 8 and 10 is alsolished observations). In any case, there is little difference
in the basic pachytene chromosome karyotype between firm because both SC 8 and SC 10 can be readily distin-
TABLE 3
Comparison of crossover frequency for maize KYS using chiasmata and RNs
No. of cells Mean no. of RNs No. of bivalents with 0–6 crossoversa
(bivalents) or chiasmata (SD)observed and range 0 1 2 3 4–6
RNs 151 20.6 (3.3) 14 363 743 312 7810 plants (1510) 13–33 (0.9) (24.0) (49.2) (20.7) (5.2)Chiasmata 278 18.9 (2.5) 31 667 1673 402 75 plants (2780) 12–26 (1.1) (24.0) (60.2) (14.5) (0.3)P valuesb �0.001 0.56 0.97 �0.001 �0.001 �0.001
a Numbers in parentheses represent percentages.b Student’s t-test using mean frequency of bivalent type per cell.
856 L. K. Anderson et al.
location of the NOR in spreads. However, we did notobserve any unusual fragmentation or any detectablestretching of the SC in the short arm of maize SC 6.Whatever the cause of the differences in arm ratio forchromosome/SC 6, we are confident that we can iden-tify SC 6 because the arm ratio for SC 6 is consistentbetween sets of SC spreads, SC 6 can be separated reli-ably from the other SCs, and SC 6 has been verified tocorrespond to chromosome 6 by analysis of SC spreadsfrom inversion heterozygotes for In6b.
Estimating crossover frequency using different meth-ods: Some controversy surrounds estimates of crossoverfrequency that have been determined using chiasmata,RNs, and linkage maps (e.g., Nilsson et al. 1993; Sher-man and Stack 1995; Sybenga 1996; King et al. 2002a).Typically, saturated or nearly saturated classical linkagemaps indicate higher crossover rates than chiasmacounts, and molecular linkage maps often indicate evenhigher crossover rates (e.g., Nilsson et al. 1993; Moranet al. 2001; King et al. 2002a; Table 3). This also appearsto be the pattern in maize where chiasma counts rangefrom an average of 17–21 per cell when diakinesis-meta-phase I chromosomes are used (Beadle 1933; Ayo-noadu and Rees 1968; Pagliarini et al. 1986; Table 3)although higher averages (27–37 per cell) are possiblewhen longer diplotene chromosomes are used (in whichchiasmata are more difficult to distinguish from twists;Beadle 1933; Darlington 1934). In comparison, ge-netic and molecular linkage maps indicate 37 and 42crossovers per cell, respectively (Table 2). This problem
Figure 5.—Scatter plots and regressions for (A) total SC has been addressed recently by King et al. (2002a), whoset length and total RN number (y � 0.026x � 11.82, r 2 � introgressed a single chromosome of Festuca pratensis0.16), (B) average SC length and average RN frequency (y � into Lolium perenne to create a monosomic substitution0.042x � 0.66, r 2 � 0.96), and (C) average SC arm length
line (hereafter referred to as the Festuca/Lolium biva-and average RN frequency (y � 0.044x � 0.31, r 2 � 0.97).lent). The F. pratensis chromosome synapses and recom-bines with the homeologous L. perenne chromosome,although the two chromosomes can be distinguishedguished from the other SCs and from each other on
the basis of their relative lengths and arm ratios. from one another using genomic in situ hybridization.King et al. (2002a) compared the recombination fre-The most striking difference among maize karyotypes
involves the arm ratio for chromosome/SC 6. The aver- quency for this homeologous bivalent using both ampli-fied fragment length polymorphism markers and chias-age arm ratio is 3.0 or higher for squashed pachytene
chromosomes and sectioned SCs, but only 2.6–2.7 for mata. They found a 1:1 relationship between crossoversdetected by the two methods. They suggest that chiasmaSC spreads (Table 1). Since the short arm of chromo-
some/SC 6 carries the NOR, it is likely that differences counts tend to somewhat underestimate the amount ofcrossing over due to difficulty in resolving nearby chias-between the karyotypes somehow involve the nucleolus.
Typically, a single large nucleolus is visible in primary mata, while molecular maps tend to inflate the amountof crossing over due to errors in typing and the use ofmicrosporocytes that are fixed before squashing or sec-
tioning (Rhoades 1950; Dawe et al. 1994). In contrast, different computer programs with different algorithmsto generate the maps. King et al. (2002a) also pointedSC spreads are prepared by exposing live cells to a hypo-
tonic solution in which nucleoli and chromatin are dis- out that differences in map lengths are not surprising,given that various investigators employed a variety ofpersed before fixation. The larger arm ratio of SC 6 in
squashes compared to SC spreads could be due to rela- mapping techniques on different mapping populations.Recently, Knox and Ellis (2002) showed in pea (Pisumtive shortening of the NOR short arm in squashes (per-
haps because the nucleolus obscures part of the arm) sativum) that excess heterozygosity in the mapping pop-ulation can also lead to inflation of the molecular mapor lengthening of the short arm in SC spreads. In this
regard, Sherman and Stack (1992) observed that the compared to chiasma counts. They conclude that a num-ber of factors contribute to map inflation when usingshort arm of SC 2 in tomato was often broken at the

857RN Crossover Maps in Maize
Figure 6.—Histograms showing the distribution of RNs along the length of each maize SC. Each SC is represented on thex-axis with the short arm to the left and the position of the kinetochore (kc) marked with a vertical line. The positions of theNOR (6S) and knobs (1S, 5L, 6L, 7L, 9S) are indicated as short horizontal bars beneath the x-axis. The histogram bars representthe total observed number of RNs in each 0.2-�m SC length interval. Superimposed over each distribution is a thick smoothingline that shows the general trend of the RN distribution as well as a thinner horizontal line that represents the average numberof RNs in each 0.2-�m interval.
molecular markers and that chiasmata and RNs yield zero or one RN (Table 3). When higher categories ofcrossing over are compared, the number of bivalentsgood estimates of crossover frequency.
Here, we show that in KYS maize the frequency of chias- with two chiasmata is higher than the number of biva-lents with two RNs, while the number of bivalents withmata compares well with the frequency of RNs, particularly
when the frequency of homologous pairs with zero or three or more chiasmata is lower than the number ofbivalents with three or more RNs. Given the differenceone chiasma is compared with the frequency of SCs with
858 L. K. Anderson et al.
Figure 6.—Continued.
in resolution between RNs and chiasmata (Stack et al. Inbred KYS and the rate of crossing over in maize:Is the rate of crossing over in inbred KYS representative1989; Sherman and Stack 1995), it is likely that multi-
ple crossovers are more difficult to identify using chias- of the rate of crossing over for maize in general? Thisquestion is of importance because KYS has long beenmata than using RNs, and some of the bivalents classified
with two chiasmata probably had three or more. Overall, used as the favorite inbred line for the study of maizechromosomes, but genetic maps and molecular mapswe estimate that our counts of chiasmata in maize under-
estimate the amount of crossing over by �10% com- typically use data from different lines and from crossesthat do not include KYS (http://www.agron.missouri.pared to our estimates of crossing over based on RNs.

859RN Crossover Maps in Maize
mans et al. 1997), rye grass (Karp and Jones 1982), pea(Hall et al. 1997), and mouse (Koehler et al. 2002).Because the average difference in chiasma frequencythat we observed between different lines in maize areminor (only 1–2 per cell), it is likely that all of the lineswould have overall RN distributions similar to KYS. Onthe other hand, it is possible that there could be signifi-cant differences if one examines only a small portionof any particular SC, particularly in proximal regionsthat have few RNs and where the addition or subtractionof only a few RNs would have larger effects than in distalregions where most RNs were observed.
Figure 7.—Portions of three maize SCs stained with uranyl The frequency of RNs and SC length: We found aacetate-lead citrate. (a, b) RNs can occur at the very distal tippositive correlation between total SC set length and theof an SC (arrows). Stain precipitate (small arrowhead) is muchtotal number of RNs per SC set in maize with �16% ofdarker than RNs and has sharp edges. Thickenings of lateral
elements are present in a and b. (c) Rarely, an RN (arrow) the variation in RN number explained by variations incan be observed close to the kinetochore (large arrowhead). SC set length (r 2 � 0.16; Figure 5). Similar relationshipsBar, 1 �m. have been reported for humans and certain strains of
mice (r 2 � 0.13–0.33; Lynn et al. 2002), and reanalysisof the data from Sherman and Stack (1995) indicatesedu/maps.html). Since no other maize line has beenthat a similar relationship also holds in tomato (r 2 �analyzed for RNs, comparisons of RN numbers in differ-0.13). However, there is only a weak relationship be-ent lines currently are not possible. However, as antween SC set length and number of MLH1 foci foralternative, we compared chiasma frequencies betweenmales of the mouse inbred strain C57BL/6 (r 2 � 0.04),KYS and three other commonly used inbred lines (W22,although females of this strain do show a positive rela-B73, Mo17) and a B73/Mo17 hybrid (the cross used totionship (Froenicke et al. 2002; Lynn et al. 2002). Lynnprepare the IBM map, an intermated B73/Mo17 recom-et al. (2002) showed that the pachytene substage didbinant inbred high-resolution molecular map). Wenot affect SC set length for humans, and similar r 2 valuesfound a 12% difference in average number of chiasmata(13–16%) for other species suggest that this might beper cell between lines with the least (Mo17) and thetrue for these species as well. However, it has beenmost chiasmata (W22) with the other lines (KYS, B73,frequently (but not always) noted that SC sets are longerand the B73/Mo17 hybrid) falling in between (Tablein early pachytene than in late pachytene (e.g., Moses4). Our results are consistent with those of a numberet al. 1977; Maguire 1978; Gillies 1981). Since it isof investigators who have found differences in recombi-likely that the number of RNs does not change duringnation frequency among inbred lines and crosses forpachytene (Sherman and Stack 1995), any variationmaize (e.g., Pagliarini et al. 1986; Beavis and Grant
1991; Fatmi et al. 1993; Williams et al. 1995; Timmer- in SC length due to pachytene substage could obscure
TABLE 4
Comparison of the mean number of chiasmata for four different inbred lines and ahybrid between two inbred lines (B73/Mo17)
No. of bivalents witha
Inbred No. of cells Mean no. ofline (bivalents) chiasmata (SD) 0 chiasmata 1 chiasmata 2 chiasmata �3 chiasmata
W22 267 21.2 (1.9) 2 303 1758 607(2670) (0.1) (11.3) (65.8) (22.7)
B73/Mo17 267 21.0 (1.8) 1 267 1892 510(2670) (0.0) (10.0) (70.9) (19.1)
B73 270 20.9 (2.2) 10 355 1753 582(2700) (0.4) (13.1) (64.9) (21.6)
KYS 278 18.9 (2.5) 31 667 1673 409(2780) (1.1) (24.0) (60.2) (14.7)
Mo17 283 18.5 (1.8) 15 607 1983 225(2830) (0.5) (21.4) (70.1) (8.0)
Five plants from each line were sampled. The mean number of chiasmata varies significantly between lines(ANOVA, P � 0.001) as do the variances (Levene’s P � 0.001).
a Numbers in parentheses represent percentages.

860 L. K. Anderson et al.
TABLE 5
Comparison of SC length from spreads, number of crossovers (based on RNs or MLH1 foci), and number of bivalentarms for male meiotic cells from mouse, humans, tomato, and maize
Average no.Genome size Average SC set crossovers No. No. of
Species (1C pg) length (�m) per set of SCs SC arms References
Mouse 3.3 148–170 21.5–24.9 19 19 Gregory (2001); Froenicke et al.(2002); Koehler et al. (2002)
Human 3.5 290 49.1 22 44 Gregory (2001); Lynn et al. (2002)Chicken 1.25 203 65.0 38 41 Rahn and Solari (1986); Gregory
(2001); Pigozzi (2001)Tomato 1.03 229 21.9 12 23a Sherman and Stack (1995);
Bennett et al. (2000)Maize 2.73 331 20.5 10 20 Bennett et al. (2000); this workLily 35.2 3149 55 12 14 Anderson et al. (1985); Stack et al.
(1989); Bennett et al. (2000)
a The short arm of chromosome 2 is totally heterochromatic so this arm is excluded here.
the relationship between SC set length and the number tionally large genomes and chromosomes have long SCsand more crossing over (although the relation is notof RNs. With this caveat, these data suggest that variation
in total SC set length within a species is related to varia- proportional), possibly because crossover interferenceattenuates enough on long SCs to permit additionaltion in the total amount of crossing over. Also support-
ing this conclusion is the observation that some female crossover events (see lily, Table 5). Finally, the strengthof crossover interference may differ from one group toanimals have more crossing over than male animals (e.g.,
zebrafish: Singer et al. 2002) as well as longer total SC another; e.g., budding yeast with 16 short SCs has �100crossovers (Paques and Haber 1999). Thus, while it isset lengths (humans: Bojko 1985; Wallace and Hulten
1985; Speed and Chandley 1988; Tease et al. 2002). clear that crossing over is tightly regulated, it is equallyclear that a number of factors may be involved in thisDoes the relationship between SC length and RN
frequency hold between species; i.e., do species with regulation and that not all factors may operate in the sameway in different species (Anderson and Stack 2002).longer total SC lengths necessarily have more RNs? The
answer appears to be no (Table 5). Even though SC How is the rate of crossing over controlled for individ-ual bivalents in a set? It has been recognized for somelength is closely correlated with genome size (flowering
plants: Anderson et al. 1985; bony fish, reptiles, mam- time that relative chromosome length is positively corre-lated with the level of crossing over and chiasma forma-mals, but not birds: Peterson et al. 1994) and genome
size varies greatly among eukaryotes, the number of tion within a species (e.g., Muller 1916; Darlington1934; Mather 1937). More recently, in-depth studiescoding genes is relatively constant. Since most crossing
over takes place within genes, the frequency of crossing have been done on recombination frequency in tomato,chicken, mouse, and maize in which individual bivalentsover between species is better correlated with the num-
ber of genes than with total genome size (Thuriaux 1977 were identified and examined for RNs or MLH1 foci.All four studies revealed a strong positive correlationand many subsequent reports; Table 5) or with total SC
length. Then why are there differences in the rates of between average SC length and average RN frequencyfor each bivalent (r 2 � 0.96 for each species excludingcrossing over between eukaryotic species? First, species
with larger numbers of chromosomes will have more the three shortest SCs from mouse; Sherman and Stack1995; Pigozzi 2001; Froenicke et al. 2002; this study).crossing over than species with lower numbers of chro-
mosomes due to the obligate crossover between each ho- The rarity of SCs without RNs in maize and tomato(Sherman and Stack 1995) and the rarity of pachy-mologous pair (e.g., chicken, Table 5). Second, the num-
ber of chromosome arms is also positively correlated tene bivalents without Mlh1 foci in mice and chicken(Pigozzi 2001; Froenicke et al. 2002) illustrate the tightwith crossover frequency with an average of one cross-
over per arm for mammals (Pardo-Manuel de Villena control of crossing over that ensures each bivalent (butnot necessarily each arm) has at least one crossoverand Sapienza 2001). Tomato and maize fit this general
trend as well (Sherman and Stack 1995; this work). while at the same time apportioning the probability ofadditional crossovers according to SC length. Thus, thereHowever, both tomato and maize have (short) chromo-
some arms that average less than one RN as well as appear to be at least two levels of control for crossoverfrequency, one at the level of the cell and another at the(long) arms that average more than one RN (Figure 5;
Sherman and Stack 1995). Third, species with excep- level of individual bivalents and bivalent arms.

861RN Crossover Maps in Maize
The distribution and frequency of crossing over along are protected from recombination, possibly includingthe genes that differentiate maize from teosinte (Gali-maize SCs: Generally, all 10 maize SCs show similar
patterns of RN distribution (Figure 6). The distal por- nat 1988; Doebley 1994).RNs in maize can occur at the very ends of SC armstions of the arms invariably have the highest average
concentration of RNs, while the frequency of RNs trails (Figures 6 and 7), in contrast to tomato in which noRNs (n � 9058 observations) were at the ends of SCsoff proximally toward the kinetochore, where RNs are
absent. This RN pattern is expected from reports of a (Sherman and Stack 1995). Inhibition of crossing overat the ends of tomato chromosomes is probably relatedhigh distal concentration of chiasmata in maize (Figure
4; Rhoades 1950, 1955). This RN pattern also is similar to the presence of prominent dark-staining telomereswith associated repeated DNA sequences that may haveto high levels of distal crossing over that have been
reported for two other grass species, wheat (Gill et al. some properties of heterochromatin (Sherman and Stack1995; Zhong et al. 1998). In maize, telomere structures1993, 1996a,b) and barley (Kunzel et al. 2000). In addi-
tion to the general concentration of RNs distally in are not obvious, suggesting that maize telomeres aresmall and do not interfere with nearby crossing over.maize, there are distinct peaks of RNs involving one or
a few adjacent 0.2-�m SC segments. Distinct chromo- The effect of knobs and NORs on crossing over:Heterochromatic knobs are a characteristic feature ofsomal regions of higher recombinational activity have
been reported also for barley (Kunzel et al. 2000) and maize pachytene chromosomes with the exact numberand placement of knobs varying between different lineswheat (Gill et al. 1996a). These “hot” regions for cross-
ing over at the chromosomal level (Froenicke et al. (McClintock et al. 1981). Knobs are composed of largetandem arrays of 180- and 350-bp repeats (Peacock et2002) may correspond to hotspots of recombination at
the DNA level, such as the well-known hotspots at a1 al. 1981; Ananiev et al. 1998; Chen et al. 2000). Becauseknobs are heterochromatic, they usually are consideredand bz1 loci that occur in distal regions of maize chromo-
somes 3 and 9, respectively (Brown and Sundaresan to be recombinationally inert, although variation in thesizes of knobs within populations could be explained1997; Fu et al. 2001, 2002; Yao et al. 2002). However, such
peaks (as well as valleys) in the histograms also may by unequal crossing over within the knobs (Buckler etal. 1999). While we were unable to observe knobs duebe caused (or exacerbated) by compiling data on the
location of RNs from many different SCs onto an “aver- to dispersion of chromatin in SC spreads, we estimatedthe position of homozygous knobs on KYS maize SCsage” SC or by sampling errors. The smoothing lines
reduce such variation and show the general trends of using data from Dawe et al. (1992) and Chen et al.(2000). We found that the amount of crossing over atcrossing over along the SCs. Determining whether the
individual peaks/valleys are artifactual or represent defi- the location of knobs was either about the same as theaverage for the SC as a whole (interstitial knobs 5L, 6L,nite positions of elevated or reduced recombination
frequency will require additional study. One method to 7L) or higher than the average (distal knobs 1S and 9S;Figure 6). The knobs on 1S, 9S, and 6L are compara-address this question will be to use fluorescence in situ
hybridization to determine the precise locations of tively small, so they might not be expected to have mucheffect on RN frequency. However, the knobs on 5L andmapped loci that are known to be hot or cold spots for
crossing over (Harper and Cande 2000; Sadder et al. 7L are large, and yet they still have appreciable numbersof RNs. This result indicates that knobs have little or2000; Sadder and Weber 2002).
Aside from the immediate vicinity of the kinetochore, no effect on reducing the amount of crossing over attheir locations on SCs. However, since knobs are hetero-no large segment on any of the maize SCs is completely
free of RNs, but there are segments proximal to kineto- chromatic, the structural relationship of knobs to SCmay differ from the structural relationship of euchroma-chores on every SC in which there are only a few RNs
(Figures 6 and 7). A low level of recombination in and tin to SC. The generally accepted model for SC structurehas loops of DNA (chromatin) extending from eachnear centromeres also has been detected by molecular
mapping in Arabidopsis (Copenhaver et al. 1998) and lateral element that may include a cohesin core (Zick-ler and Kleckner 1999; van Heemst and Heytingin the Festuca/Lolium bivalent (King et al. 2002b). A
reduced level of crossing over proximally is probably 2000; Pelttarri et al. 2001; Stack and Anderson 2001;Eijpe 2002). We suggest that the DNA in knobs is inrelated to the centromere effect (Resnick 1987) and
to the presence of pericentric heterochromatin in the the form of one to a few long loops of condensed chro-matin that are anchored to a short region of the lateralarms of all maize SCs (Carlson 1988; Jewell and Islam-
Faridi 1994). Pericentric heterochromatin in maize elements (Figure 8). Knobs, and heterochromatin ingeneral, may have only a few anchoring sequences indoes not stain by C-banding, so it may be a “lower grade”
of heterochromatin that permits more crossing over comparison to euchromatic regions. This model agreeswith the explanation offered by Stack (1984) for thenearer the centromere rather than the dense blocks of
pericentric heterochromatin in tomato (Sherman and observed underrepresentation of heterochromatin inthe length of pachytene chromosomes. In addition, it isStack 1995). Even so, the pericentric regions of maize
chromosomes are potential sites for blocks of genes that supported by the demonstration that chromatin loops are

862 L. K. Anderson et al.
RNs per meiosis for a complete set of KYS maize SCs(Table 2) is equivalent to a total map length of 1025cM. How do the lengths of the RN maps compare withthe classical gene maps and the molecular linkage mapsfor maize? From Table 2, it is apparent that the geneticand the molecular linkage maps are both roughly twiceas long as the RN map. However, when pairwise compar-isons are made between map lengths of individual chro-mosomes (linkage groups) using different maps, allmaps are significantly correlated (P � 0.01). The pre-Figure 8.—An SC with euchromatic chromatin loops and
a homozygous heterochromatic knob. Numerous (shaded) dictive value of the correlation is best for the RN maploops of euchromatin extend from the cohesin/lateral ele- compared to the molecular map (r 2 � 76%), with lowerment core from regularly spaced attachment sites. The loops
values for the RN map and the gene map (r 2 � 63%)are shown doubled to represent the two sister chromatids, butand the gene and molecular maps (r 2 � 59%). Thesesister loops may actually extend in opposite directions (Stackcorrelations are in the same order but better than theand Anderson 2001). In contrast, knob heterochromatin may
consist of only a few (solid) loops and their attachment sites. same correlations reported for tomato (r 2 � 69, 45, andSince crossing over occurs within the context of the SC, the 21%, respectively; Sherman and Stack 1995). Thus, dif-reduced association of the knob chromatin with the SC would
ferences in crossover frequency between the maps forgreatly decrease, but not eliminate, the amount of crossingmaize seem to apply to all 10 bivalents more or lessover that could occur within the knob itself. However, as shownequally.here, RNs that appear to be within the region of the knob
could actually be mediating crossovers between euchromatic The shorter length of the RN map compared to theloops. This would explain why RN frequencies at heterochro- linkage maps could be explained if some RNs are lostmatic knobs appear to be about average (or above) for the
(perhaps due to the spreading technique or to RN turn-SC region where the knobs occur.over), and, indeed, a small number of maize SCs arewithout RNs (Table 3). However, this is an unlikelyexplanation for three reasons:longer in pericentric heterochromatin than in distal eu-
chromatin along tomato SCs (Peterson et al. 1996).1. The number of univalent pairs from diakinesis chro-Since crossing over in plants and animals occurs in the
mosome squashes matches the number of maize SCscontext of the SC, minimal association of knob chroma-without RNs (� 0.1%), so this level of failure to crosstin with the SC could sharply reduce crossing over withinover appears to be a normal feature of crossing overhomozygous knobs. This model would explain why ho-in maize whether measured at pachytene or diakine-mozygous knobs neither alter the local rate of recombi-sis (Table 3).nation nor add significantly to the length of pachytene
2. The difference in size between RN maps and linkagechromosomes (Rhoades 1955; McClintock et al. 1981;maps requires that about half the RNs would haveStack 1984; Jones and de Azkue 1993).to be lost so that each SC would average two RNsThe frequency of RNs in the NOR region in the short(as actually observed) instead of the “real” four RNsarm of chromosome 6 is slightly lower than that for thepredicted from linkage maps. If RNs were lost atSC as a whole (1.6 RNs vs. 2.2 RNs per 0.2-�m segment;random and each RN had a 50% chance of beingFigure 6). Crossing over within the NOR also has beenlost, then one would expect �6% (� 1/24) of thedetected in the Festuca/Lolium bivalent although at aSCs to have no RNs. This is 60 times more SCs withreduced level compared to other parts of the chromo-no RNs than were actually observed.some (King et al. 2002b). Considering that NORs are
3. Finally, the RN map is slightly larger than the chiasmamade up of tens to thousands of tandem repeats (Heslop-map (Table 3), so if we are losing half the RNs, weHarrison 2000), NOR DNA may have few anchor se-must likewise be counting less than half the chias-quences for SCs and a relation to SC similar to thatmata, which again seems unlikely.proposed for knobs and heterochromatin in general.
As a result, crossing over within the NOR itself would So which of the maps most accurately describes thebe lower while having little effect on the rate of recombi- amount of crossing over in maize? We argue that thenation in nearby regions. RN map is the most accurate (at least for male KYS) for
RN maps compared to linkage maps: Two linked genes several reasons:that recombine 1% of the time during a single meiosis
1. The close agreement between numbers of RNs andare separated by 1 map unit (centimorgan), and 50 mapchiasmata is independent support for the accuracyunits correspond to the map distance between two lociof the RN map (Table 3).in which there is an average of one crossover event per
2. The RN map was prepared using a single inbred line,meiosis. Since each RN corresponds to a crossover event,whereas linkage maps were prepared using a varietyan SC segment that averages one RN per meiosis would
also be 50 map units long. Thus, the average of 20.5 of lines or hybrids.

863RN Crossover Maps in Maize
Beadle, G. W., 1933 Further studies of asynaptic maize. Cytologia3. The RN map is based only on male meiosis, whereas4: 269–287.
linkage maps utilize the products of both male and Beavis, W. D., and D. Grant, 1991 A linkage map based on informa-tion from four F2 populations of maize (Zea mays L.). Theor.female meioses that may differ in rate and distribu-Appl. Genet. 82: 636–644.tions of crossing over (Rhoades 1941, 1978; Carl-
Bennett, M. D., A. V. Cox and I. J. Leitch, 2000 Angiosperm DNAson 1988). C-values database. http://www.rbgkew.org.uk/cval/database1.
html.4. The conditions under which the work was performedBojko, M., 1985 Human meiosis. IX. Crossing over and chiasmafavors the consistency of the RN map because the
formation in oocytes. Carlsberg Res. Commun. 50: 43–72.RN map was produced from plants grown under the Brown, J., and V. Sundaresan, 1997 A recombination hot spot in
the maize A1 intragenic region. Theor. Appl. Genet. 81: 185–188.same conditions by the same people using the sameBuckler, E. S. I., T. L. Phelps-Durr, C. S. K. Buckler, R. K. Dawe,instruments and techniques.
J. F. Doebley et al., 1999 Meiotic drive of chromosomal knobs5. Several factors have been identified that could lead reshaped the maize genome. Genetics 153: 415–426.
Carlson, W. R., 1988 The cytogenetics of corn, pp. 259–331 in Cornto inflated linkage map values (Lincoln and Landerand Corn Improvement, edited by G. F. Sprague and J. W. Dudley.1992; King et al. 2002a; Knox and Ellis 2002).Crop Science Society, Madison, WI.
6. Since crossing over takes place in the context of Carpenter, A. T. C., 1975 Electron microscopy of meiosis in Drosoph-ila melanogaster females: II. The recombination nodule—A re-pachytene chromosomes, it is noteworthy that RNcombination-associated structure at pachytene? Proc. Natl. Acad.map lengths are better correlated with individual SC Sci. USA 72: 3186–3189.
lengths than with either genetic or molecular linkage Carpenter, A. T. C., 1979 Synaptonemal complex and recombina-tion nodules in wild-type Drosophila melanogaster females. Geneticsmaps. The lower correlations with the linkage maps92: 511–541.may reflect uneven coverage of markers among the Chen, C. C., C. M. Chen, F. C. Hsu, C. J. Wang, J. T. Yang et al.,
chromosomes. 2000 The pachytene chromosomes of maize as revealed by fluo-rescence in situ hybridization with repetitive DNA sequences.Theor. Appl. Genet. 101: 30–36.Uses of RN maps: RN maps show the physical distribu-
Cleveland, W. S., 1979 Robust locally weighted regression andtion of crossing over along each bivalent. Such mapssmoothing scatterplots. J. Am. Stat. Assoc. 74: 829–836.
can be used in a variety of ways. For example, they can Comings, D. E., 1972 The structure and function of chromatin, pp.237–431 in Advances in Human Genetics, edited by H. Harris andbe used to compare gene evolution in regions of theK. Hirschhorn. Plenum Press, New York.chromosome with high and low RN frequency (Stephan
Copenhaver, G. P., W. E. Browne and D. Preuss, 1998 Assayingand Langley 1998; Tenaillon et al. 2002), to examine genome-wide recombination and centromere functions with Ara-
bidopsis tetrads. Proc. Natl. Acad. Sci. USA 95: 247–252.interference (Sherman and Stack 1995; Anderson etDarlington, C. D., 1934 The origin and behaviour of chiasmata.al. 1999; Froenicke et al. 2002; our unpublished re- VII. Zea mays. Z. indkt. Abstamm.-Vererb. Lehre 67: 96–114.
sults), and to aid in integrating linkage maps with chro- Davis, G. L., M. D. McMullen, C. Baysdorfer, T. Musket, D. Grantet al., 1999 A maize map standard with sequenced core markers,mosome structure (Peterson et al. 1999; Froenicke etgrass genome reference points and 932 expressed sequenceal. 2002; our unpublished results). tagged sites (ESTs) in a 1736-locus map. Genetics 152: 1137–1172.
Dawe, R. K., D. A. Agard, J. W. Sedat and W. Z. Cande, 1992 Pachy-We thank Ben Burr and Ed Coe for providing KYS seeds. This worktene DAPI map. Maize Newsl. 66: 42.was supported by a grant from the National Science Foundation (NSF;
Dawe, R. K., J. W. Sedat, D. A. Agard and W. Z. Cande, 1994 MeioticMCB-9728673). K.D.H., A.L., and B.B. were supported by grants fromchromosome pairing in maize is associated with a novel chromatin
the NSF for Research Experience for Undergraduates. organization. Cell 76: 901–912.de la Torre, J., C. Lopez-Fernandez, R. Nichols and J. Gosalvez,
1986 Heterochromatin readjusting chiasma distribution in twospecies of the genus Arcyptera: the effect among individuals andpopulations. Heredity 56: 177–184.LITERATURE CITED
Dempsey, E., 1994 Traditional analysis of maize pachytene chromo-Ananiev, E. V., R. L. Phillips and H. W. Rines, 1998 A knob- somes, pp. 432–441 in The Maize Handbook, edited by M. Freeling
associated tandem repeat in maize capable of forming fold-back and V. Walbot. Springer-Verlag, New York.DNA segments: Are chromosome knobs megatransposons? Proc. Doebley, J., 1994 Genetics and the morphological evolution ofNatl. Acad. Sci. USA 95: 10785–10790. maize, pp. 66–77 in The Maize Handbook, edited by M. Freeling
Anderson, L. K., and S. M. Stack, 2002 Meiotic recombination in and V. Walbot. Springer-Verlag, New York.plants. Curr. Genomics 3: 507–525. Doyle, G. G., 1994 Inversions and list of inversions available, pp.
Anderson, L. K., S. M. Stack, M. H. Fox and C. Zhang, 1985 The 346–349 in The Maize Handbook, edited by M. Freeling and V.relationship between genome size and synaptonemal complex Walbot. Springer-Verlag, New York.length in higher plants. Exp. Cell Res. 156: 367–378. Eijpe, M., 2002 Homologous recombination, sister chromatid cohe-
Anderson, L. K., A. Reeves, L. M. Webb and T. Ashley, 1999 Distri- sion, and chromosome condensation in mammalian meiosis.bution of crossing over on mouse synaptonemal complexes using Ph.D. Thesis, Wageningen Universiteit, Wageningen, The Neth-immunofluorescent localization of MLH1 protein. Genetics 151: erlands.1569–1579. Fatmi, A., C. G. Poneleit and T. W. Pfeiffer, 1993 Variability in
Ayonoadu, U., and H. Rees, 1968 The influence of B-chromosomes recombination frequencies in the Iowa stiff stalk synthetic (Zeaon chiasma frequencies in black Mexican sweet corn. Genetica mays L.). Theor. Appl. Genet. 86: 859–866.39: 75–81. Freeling, M., and V. Walbot (Editors), 1994 The Maize Handbook.
Baker, S. M., A. W. Plug, T. A. Prolla, C. E. Bronner, A. C. Harris Springer-Verlag, New York.et al., 1996 Involvement of mouse Mlh1 in DNA mismatch repair Froenicke, L., L. K. Anderson, J. Weinberg and T. Ashley, 2002and meiotic crossing over. Nat. Genet. 13: 336–342. Male mouse recombination maps for each autosome identified
Bass, H. W., O. Riera-Lizarazu, E. V. Ananiev, S. J. Bordoli, H. W. by chromosome painting. Am. J. Hum. Genet. 71: 1353–1368.Rines et al., 2000 Evidence for the coincident initiation of ho- Fu, H., W. Park, X. Yan, Z. Zheng, B. Shen et al., 2001 The highlymolog pairing and synapsis during the telomere-clustering (bou- recombinogenic bz locus lies in an unusually gene-rich region of
the maize genome. Proc. Natl. Acad. Sci. USA 98: 8903–8908.quet) stage of meiotic prophase. J. Cell Sci. 113: 1033–1042.

864 L. K. Anderson et al.
Fu, H., Z. Zheng and H. K. Dooner, 2002 Recombination rates Maguire, M. P., 1978 A possible role for the synaptonemal complexin chiasma maintenance. Exp. Cell Res. 112: 297–308.between adjacent genic and retrotransposon regions in maize
vary by 2 orders of magnitude. Proc. Natl. Acad. Sci. USA 99: Marcon, E., and P. B. Moens, 2003 Mlh1p and Mlh3p localize toprecociously induced chiasmata of okadaic acid treated mouse1082–1087.
Galinat, W. C., 1988 The origin of corn, pp. 1–31 in Corn and Corn spermatocytes. Genetics (in press).Mather, K., 1937 The determination of position in crossing-over. II.Improvement, edited by G. F. Sprague and J. W. Dudley. Crop
Science Society, Madison, WI. The chromosome length-chiasma frequency relation. Cytologia 1:514–526.Gill, K. S., B. S. Gill and T. R. Endo, 1993 A chromosome region-
specific mapping strategy reveals gene-rich telomeric ends in Mather, K., 1939 Crossing over and heterochromatin in the Xchromosome of Drosophila melanogaster. Genetics 24: 413–435.wheat. Chromosoma 102: 374–381.
Gill, K. S., B. S. Gill, T. R. Endo and T. Taylor, 1996a Identifica- McClintock, B., 1929 Chromosome morphology in Zea mays. Sci-ence 69: 629.tion and high-density mapping of gene-rich regions in chromo-
some group 1 of wheat. Genetics 144: 1883–1891. McClintock, B., 1931 Cytological observations of deficiencies in-volving known genes, translocations, and inversions in Zea mays.Gill, K. S., B. S. Gill, T. R. Endo and E. V. Boyko, 1996b Identifica-
tion and high-density mapping of gene-rich regions in chromo- Res. Bull. Mo. Agric. Exp. Sta. 163: 1–30.McClintock, B., 1933 The association of non-homologous parts ofsome group 5 of wheat. Genetics 143: 1001–1012.
Gillies, C. B., 1973 Ultrastructural analysis of maize pachytene chromosomes in mid-prophase of meiosis in Zea mays. Z. Zell-forsch. Mikrosk. Anat. 19: 191–237.karyotypes by three dimensional reconstruction of the synaptone-
mal complexes. Chromosoma 43: 145–176. McClintock, B., 1934 The relation of a particular chromosomalelement to the development of the nucleoli in Zea mays. Z. Zell-Gillies, C. B., 1981 Electron microscopy of spread maize pachytene
synaptonemal complexes. Chromosoma 83: 575–591. forsch. Mikrosk. Anat. 21: 294–328.McClintock, B., T. A. Kato and A. Blumenschein, 1981 Chromo-Gregory, T. R., 2001 Animal genome size database (http://www.
genomesize.com). some Constitution of Races of Maize. Colegio de Postgraduados, Chap-ingo, Mexico.Hall, K. J., J. S. Parker, T. H. N. Ellis, L. Turner, M. R. Knox et al.,
1997 The relationship between genetic and cytogenetic maps of Moens, P. B., N. K. Kolas, M. Tarsounas, E. Marcon, P. E. Cohenet al., 2002 The time course and chromosomal localization ofpea. II. Physical maps of linkage mapping populations. Genome
40: 755–769. recombination-related proteins at meiosis in the mouse are com-patible with models that can resolve the early DNA-DNA interac-Harper, L. C., and W. Z. Cande, 2000 Mapping a new frontier:
development of integrated cytogenetic maps in plants. Funct. tions without reciprocal recombination. J. Cell Sci. 115: 1611–1622.Integr. Genomics 1: 89–98.
Heslop-Harrison, J. S., 2000 Comparative genome organization in Moran, E. S., S. J. Armstrong, J. L. Santos, F. C. H. Franklin andG. H. Jones, 2001 Chiasma formation in Arabidopsis thalianaplants: from sequence and markers to chromatin and chromo-
somes. Plant Cell 12: 617–635. accession Wassileskija and in two meiotic mutants. ChromosomeRes. 9: 121–128.Hunter, N., and R. H. Borts, 1997 Mlh1 is unique among mismatch
repair proteins in its ability to promote crossing-over during meio- Moses, M. J., G. H. Slatton, T. M. Gambling and C. F. Starmer,1977 Synaptonemal complex karyotyping in spermatocytes ofsis. Genes Dev. 11: 1573–1582.
Jewell, D. C., and N. Islam-Faridi, 1994 A technique for somatic the Chinese hamster (Cricetulus griseus). Chromosoma 60: 345–375.chromosome preparation and C-banding of maize, pp. 484–493
in The Maize Handbook, edited by M. Freeling and V. Walbot. Muehlbauer, G. J., O. Riera-Lizarazu, R. G. Kynast, D. Martin,R. L. Phillips et al., 2000 A maize chromosome 3 addition lineSpringer-Verlag, New York.
Jones, G. H., 1987 Chiasmata, pp. 213–244 in Meiosis, edited by P. B. of oat exhibits expression of the maize homeobox gene liguleless3and alteration of cell fates. Genome 43: 1055–1064.Moens. Academic Press, New York.
Jones, G. H., and D. De Azkue, 1993 Synaptonemal complex karyo- Muller, H. J., 1916 The mechanism of crossing-over. Am. Nat. 50:193–221.typing: an appraisal based on a study of Crepis capillaris. Chromo-
some Res. 1: 197–203. Nilsson, N.-O., T. Sall and B. O. Bengtsson, 1993 Chiasma andrecombination data in plants: Are they compatible? TrendsKarp, A., and R. N. Jones, 1982 Cytogenetics of Lolium perenne. Part
1: Chiasma frequency variation in inbred lines. Theor. Appl. Genet. 9: 344–348.Pagliarini, M. S., J. B. M. Filho and M. L. R. De Aguiar-Perecin,Genet. 62: 177–183.
King, J., I. P. Roberts, M. J. Kearsey, H. M. Thomas, R. N. Jones 1986 Correlation between chiasma frequency and combiningability in inbred lines of maize, pp. 183–188 in Anais XV Congressoet al., 2002a A demonstration of a 1:1 correspondence between
chiasma frequency and recombination using a Lolium perenne/ Nacional De Milho E Sorgo. Departamento de Difusao de Tecno-logia, Brasilia, Brazil.Festuca pratensis substitution. Genetics 161: 307–314.
King, J., I. P. Armstead, I. S. Donnison, H. M. Thomas, R. N. Jones Paques, F., and J. E. Haber, 1999 Multiple pathways of recombina-tion induced by double-strand breaks in Saccharomyces cerevisiae.et al., 2002b Physical and genetic mapping in the grasses Lolium
perenne and Festuca pratensis. Genetics 161: 315–324. Microbiol. Mol. Biol. Rev. 63: 349–404.Pardo-Manuel De Villena, F., and C. Sapienza, 2001 Recombina-Knox, M. R., and T. H. N. Ellis, 2002 Excess heterozygosity contrib-
utes to genetic map expansion in pea recombinant inbred popula- tion is proportional to the number of chromosome arms in mam-mals. Mamm. Genome 12: 318–322.tions. Genetics 162: 861–873.
Koehler, K. E., J. P. Cherry, A. Lynn, P. A. Hunt and T. Hassold, Peacock, W. J., E. S. Dennis, M. M. Rhoades and A. J. Pryor, 1981Highly repeated DNA sequences limited to knob heterochroma-2002 Genetic control of mammalian meiotic recombination. I.
Variation in exchange frequencies among males from inbred tin in maize. Proc. Natl. Acad. Sci. USA 78: 4490–4494.Pelttari, J., M.-R. Hoja, L. Yuan, J.-G. Liu, E. Brundell et al.,mouse strains. Genetics 162: 297–306.
Kunzel, G., L. Korzun and A. Meister, 2000 Cytologically inte- 2001 A meiotic chromosomal core consisting of cohesin com-plex proteins recruits DNA recombination proteins and promotesgrated physical restriction fragment length polymorphism maps
of the barley genome based on translocation breakpoints. Genet- synapsis in the absence of an axial element in mammalian meioticcells. Mol. Cell. Biol. 21: 5667–5677.ics 154: 397–412.
Laurie, D. A., and G. H. Jones, 1981 Inter-individual variation in Peterson, D. G., S. M. Stack, J. L. Healy, B. S. Donohoe andL. K. Anderson, 1994 The relationship between synaptonemalchiasma frequency and chiasma distribution in Chorthippus
brunneus. Heredity 47: 409–416. complex length and genome size in four vertebrate classes (Os-teicthyes, Reptilia, Aves, Mammalia). Chromosome Res. 2: 153–Lincoln, S. E., and E. S. Lander, 1992 Systematic detection of
errors in genetic linkage data. Genomics 14: 604–610. 162.Peterson, D. G., H. J. Price, J. S. Johnston and S. M. Stack, 1996Longley, A. E., 1939 Knob positions on corn chromosomes. J. Agric.
Res. 59: 475–490. DNA content of heterochromatin and euchromatin in tomato(Lycopersicon esculentum) pachytene chromosomes. Genome 39:Lynn, A., K. E. Koehler, L. Judis, E. R. Chan, J. P. Cherry, et al.,
2002 Covariation of synaptonemal complex length and mam- 77–82.Peterson, D. G., N. Lapitan and S. M. Stack, 1999 Localization ofmalian meiotic exchange rates. Science 206: 2222–2225.

865RN Crossover Maps in Maize
single- and low-copy sequences on tomato synaptonemal complex Stack, S. M., and L. K. Anderson, 2001 A model for chromosomespreads using fluorescence in situ hybridization (FISH). Genetics structure during the mitotic and meiotic cell cycles. Chromosome152: 427–439. Res. 9: 175–198.
Pigozzi, M. I., 2001 Distribution of MLH1 foci on the synaptonemal Stack, S. M., and L. K. Anderson, 2002 Crossing over as assessedcomplexes of chicken oocytes. Cytogenet. Cell Genet. 95: 129– by late recombination nodules is related to the pattern of synapsis133. and distribution of early recombination nodules in maize. Chro-
Rahn, M. I., and A. J. Solari, 1986 Recombination nodules in oo- mosome Res. 10: 329–345.cytes of the chicken, Gallus domesticus. Cytogenet. Cell Genet. 43: Stack, S. M., L. K. Anderson and J. D. Sherman, 1989 Chiasmata187–193. and recombination nodules in Lilium longiflorum. Genome 32:
Reeves, A., 2001 Micromeasure: a new computer program for the 486–498.collection and analysis of cytogenetic data. Genome 44: 439–443. Stephan, W., and C. H. Langley, 1998 DNA polymorphism in Ly-
Resnick, M. A., 1987 Investigating the genetic control of biochemi- copersicon and crossing-over per physical length. Genetics 150:cal events in meiotic recombination, pp. 157–210 in Meiosis, ed- 1585–1593.ited by P. B. Moens. Academic Press, San Diego. Stevenson, M., S. J. Armstrong, B. V. Ford-Lloyd and G. H. Jones,
Rhoades, M. M., and B. McClintock, 1935 The cytogenetics of 1998 Comparative analysis of crossover exchanges and chias-maize. Bot. Rev. 1: 292–325. mata in Allium cepa � fistulosum after genomic in situ hybridiza-
Rhoades, M. M., 1941 Different rates of crossing over in male and tion. Chromosome Res. 6: 567–574.female gametes of maize. J. Am. Soc. Agron. 33: 603–615. Sybenga, J., 1996 Recombination and chiasmata: few but intriguing
Rhoades, M. M., 1950 Meiosis in maize. J. Hered. 41: 58–67. discrepancies. Genome 39: 473–484.Rhoades, M. M., 1955 The cytogenetics of maize, pp. 123–219 in Tamarin, R. H., 2002 Principles of Genetics, Ed. 7. McGraw-Hill,
Corn and Corn Improvement, edited by G. F. Sprague. Academic Boston.Press, New York. Tease, C., G. M. Hartshorne and M. A. Hulten, 2002 Patterns of
Rhoades, M. M., 1978 Genetic effects of heterochromatin in maize, meiotic recombination in human fetal oocytes. Am. J. Hum.pp. 641–671 in Maize Breeding and Genetics, edited by D. B. Wal- Genet. 70: 1469–1479.den. John Wiley & Sons, New York. Tenaillon, M. I., M. C. Sawkins, L. K. Anderson, S. M. Stack, J.Rhoades, M. M., 1984 The early years of maize genetics. Annu. Rev.Doebley et al., 2002 Patterns of diversity and recombinationGenet. 18: 1–29.along chromosome 1 of maize (Zea mays sp. mays L.). GeneticsSadder, M. T., and G. Weber, 2002 Comparison between genetic162: 1401–1413.and physical maps in Zea mays L. of molecular markers linked to
Thuriaux, P., 1977 Is recombination confined to structural genesresistance against Diatraea spp. Theor. Appl. Genet. 104: 908–915.on the eukaryotic genome? Nature 268: 460–462.Sadder, M. T., N. Ponelies, U. Born and G. Weber, 2000 Physical
Timmermans, M. C. P., O. P. Das, J. M. Bradeen and J. Messing,localization of single-copy sequences on pachytene chromosomes1997 Region-specific cis- and trans-acting factors contribute toin maize (Zea mays L.) by chromosome in situ suppression hybrid-genetic variability in meiotic recombination in maize. Geneticsization. Genome 43: 1081–1083.146: 1101–1113.Sharopova, N., M. D. Mcmullen, L. Schultz, S. Schroeder, H.
Van Heemst, D., and C. Heyting, 2000 Sister chromatid cohesionSanchez-Villeda et al., 2002 Development and mapping ofand recombination in meiosis. Chromosoma 109: 10–26.SSR markers for maize. Plant Mol. Biol. 48: 463–481.
Von Wettstein, D., S. W. Rasmussen and P. B. Holm, 1984 TheSherman, J. D., and S. M. Stack, 1992 Two-dimensional spreads ofsynaptonemal complex in genetic segregation. Annu. Rev. Genet.synaptonemal complexes from solanaceous plants. V. Tomato18: 331–413.(Lycopersicon esculentum) karyotype and idiogram. Genome 35:
Wallace, B. M., and M. A. Hulten, 1985 Meiotic chromosome354–359.pairing in the normal human female. Ann. Hum. Genet. 49:Sherman, J. D., and S. M. Stack, 1995 Two-dimensional spreads215–226.of synaptonemal complexes from solanaceous plants. VI. High-
Williams, C. G., M. M. Goodman and C. W. Stuber, 1995 Compara-resolution recombination nodule map for tomato (Lycopersicontive recombination distances among Zea mays L. inbreds, wideesculentum). Genetics 141: 683–708.crosses and interspecific hybrids. Genetics 141: 1573–1581.Sherman, J. D., L. A. Herickhoff and S. M. Stack, 1992 Silver
Yao, H., Q. Zhou, J. Li, H. Smith, M. Yandeau et al., 2002 Molecularstaining two types of meiotic nodules. Genome 35: 907–915.Singer, A., H. Perlman, Y. Yan, C. Walker, G. Corley-Smith et al., characterization of meiotic recombination across the 140-kb
2002 Sex-specific recombination rates in zebrafish (Danio rerio). multigenic a1-sh2 interval of maize. Proc. Natl. Acad. Sci. USAGenetics 160: 649–657. 99: 6157–6162.
Southern, D. I., 1967 Chiasma distribution in Truxaline grasshop- Zhong, X.-B., P. F. Fransz, J. Wennekes-Van Eden, M. S. Ramanna,pers. Chromosoma 22: 164–191. A. Van Kammen et al., 1998 FISH studies reveal the molecular
Speed, R. M., and A. C. Chandley, 1988 Synaptonemal complex and chromosomal organization of individual telomere domainsspreading in human foetal oocytes, pp. 313–321 in Kew Chromo- in tomato. Plant J. 13: 507–517.some Conference, Vol. III, edited by P. E. Brandham. Her Majesty’s Zickler, D., and N. Kleckner, 1999 Meiotic chromosomes: integrat-Stationery Office, London. ing structure and function. Annu. Rev. Genet. 33: 603–754.
Stack, S. M., 1984 Heterochromatin, the synaptonemal complex,and crossing over. J. Cell Sci. 71: 159–176. Communicating editor: R. S. Hawley


