Embed Size (px)
Citation preview
This article appeared in a journal published by Elsevier. The attachedcopy is furnished to the author for internal non-commercial researchand education use, including for instruction at the authors institution
and sharing with colleagues.
Other uses, including reproduction and distribution, or selling orlicensing copies, or posting to personal, institutional or third party
websites are prohibited.
In most cases authors are permitted to post their version of thearticle (e.g. in Word or Tex form) to their personal website orinstitutional repository. Authors requiring further information
regarding Elsevier’s archiving and manuscript policies areencouraged to visit:
http://www.elsevier.com/authorsrights
Author's personal copy
High vulnerability of ecosystem function and services to diversity lossin Caribbean coral reefs
Fiorenza Micheli a,⇑, Peter J. Mumby b, Daniel R. Brumbaugh c,d, Kenny Broad e, Craig P. Dahlgren f,Alastair R. Harborne b, Katherine E. Holmes c,g, Carrie V. Kappel h, Steven Y. Litvin a, James N. Sanchirico i
a Hopkins Marine Station, Stanford University, 120 Oceanview Blvd., Pacific Grove, CA 93950, USAb Marine Spatial Ecology Lab, School of Biological Sciences, University of Queensland, St. Lucia Brisbane, Queensland 4072, Australiac Center for Biodiversity and Conservation, American Museum of Natural History, Central Park West at 79th Street, New York, NY 10024, USAd Institute of Marine Science, Center for Ocean Health, University of California, Santa Cruz, 100 Shaffer Road, Santa Cruz, CA 95060, USAe Rosenstiel School of Marine & Atmospheric Science, Division of Marine Affairs & Policy, 1365 Memorial Drive, Ungar Building, Room 230-H, Coral Gables, FL 33146, USAf Perry Institute for Marine Science, 100 N. US Highway 1, Suite 202, Jupiter, FL 33477, USAg Global Conservation Program, Wildlife Conservation Society, 2300 Southern Blvd, Bronx, NY 10460, USAh National Center for Ecological Analysis and Synthesis, University of California Santa Barbara, 735 State Street, Suite 300, Santa Barbara, CA 93101, USAi Department of Environmental Science and Policy, University of California, Davis, Wickson Hall, 1 Shields Ave., Davis, CA 95616, USA
a r t i c l e i n f o
Article history:Received 17 May 2013Received in revised form 12 December 2013Accepted 19 December 2013
Keywords:BiodiversityCoral reefEcosystem functioningEcosystem servicesFunctional diversityFunctional redundancyMarine reserve
a b s t r a c t
Determining how ecosystem function and services are related to diversity is necessary for predicting theconsequences of diversity loss and for setting goals and priorities for marine conservation. The conse-quences of biodiversity loss for ecosystem functions and services depend on the level of functional redun-dancy – the number of species with similar ecological functional traits. Using field data on fishassemblages from 199 coral reef and lagoon sites from six islands, and on local fisheries from four islandsin The Bahamas, we examined levels of functional diversity and redundancy within these assemblagesand determined how fish biomass and local fisheries catches vary with local diversity. A majority of func-tional groups contain few species, suggesting that these assemblages have limited functional redundancy.Most also include species targeted by local fisheries, thus fishing has the potential to broadly impact foodwebs. Comparisons between a large marine reserve and fished reefs confirm that fishing significantlyreduces functional redundancy and removes whole functional groups. Positive exponential relationshipsof fish biomass and fisheries catches with species and functional diversity highlight that even smalldeclines in biodiversity may result in large reductions in secondary production and seafood provision.Taken together, these results indicate that Caribbean fish assemblages have low functional redundancyand high vulnerability of ecosystem functions and services to diversity loss, and that protection ofmulti-species assemblages is needed to maintain functions and services.
� 2014 Elsevier Ltd. All rights reserved.
1. Introduction
The impacts of human activities on marine biodiversity arenearly ubiquitous (Halpern et al., 2008) – causing declines in eco-system functions, such as productivity and resilience, and the lossof key services (Millennium Ecosystem Assessment, 2005; Wormet al., 2006). However, the generality of a relationship between
diversity, functions, and services is still debated (Hooper et al.,2005; Stachowicz et al., 2007; Reich et al., 2012). In particular,the extent of diversity loss that can occur before functions and ser-vices are lost (e.g., Loreau et al., 2001; Micheli and Halpern, 2005;Danovaro et al., 2008) is unknown for most marine ecosystems.Determining how ecosystem function and services are related todiversity is necessary for predicting the consequences of diversityloss and for setting goals and priorities for marine conservation.
Functional redundancy within a community (defined as thenumber of taxonomically distinct species that exhibit similar eco-logical functions; Walker, 1992; Naeem, 1998) mediates the conse-quences of diversity loss because the loss of one species, and of itsfunctional role, may be compensated by the persistence of otherspecies with similar functional roles. Thus, a first step for linking
http://dx.doi.org/10.1016/j.biocon.2013.12.0290006-3207/� 2014 Elsevier Ltd. All rights reserved.
⇑ Corresponding author. Tel.: +1 831 655 6250; fax: +1 831 375 0793.E-mail addresses: [email protected] (F. Micheli), [email protected]
(P.J. Mumby), [email protected] (D.R. Brumbaugh), [email protected](K. Broad), [email protected] (C.P. Dahlgren), [email protected](A.R. Harborne), [email protected] (K.E. Holmes), [email protected](C.V. Kappel), [email protected] (S.Y. Litvin), [email protected] (J.N.Sanchirico).
Biological Conservation 171 (2014) 186–194
Contents lists available at ScienceDirect
Biological Conservation
journal homepage: www.elsevier .com/locate /b iocon
Author's personal copy
diversity and function is to examine the relationship betweenmeasures of diversity, such as species diversity, functional diver-sity and redundancy, and measures of ecosystem function andservices.
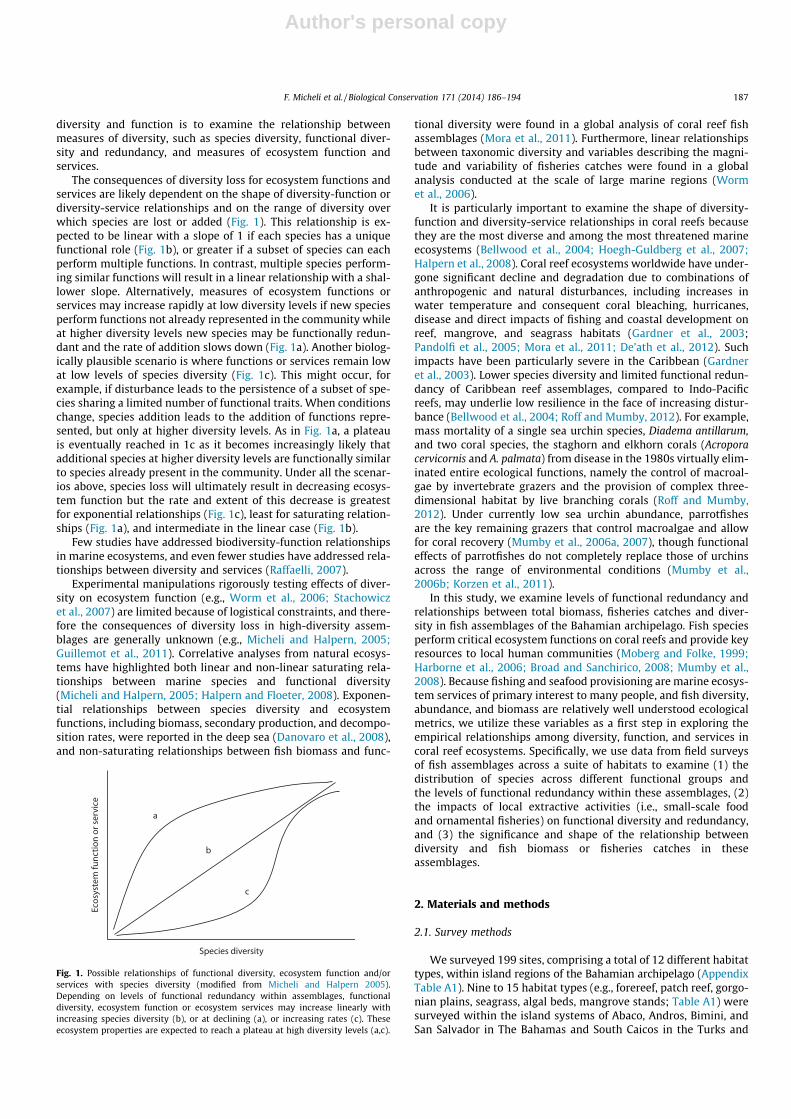
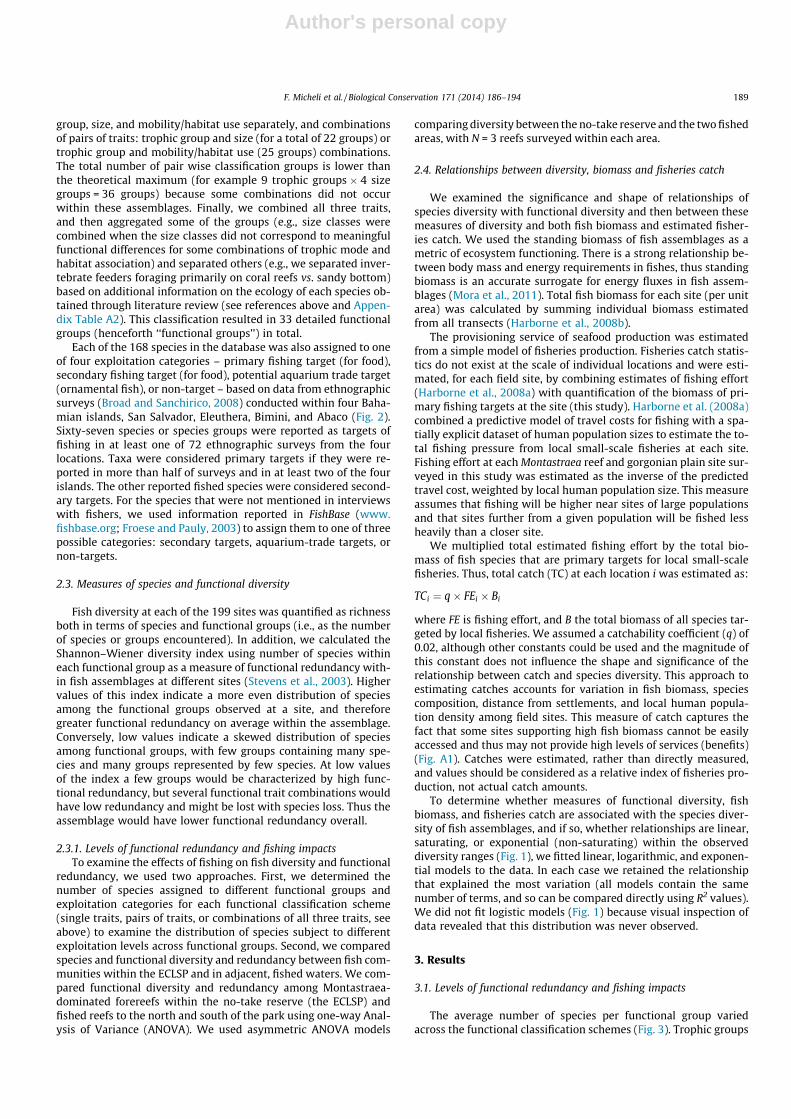
The consequences of diversity loss for ecosystem functions andservices are likely dependent on the shape of diversity-function ordiversity-service relationships and on the range of diversity overwhich species are lost or added (Fig. 1). This relationship is ex-pected to be linear with a slope of 1 if each species has a uniquefunctional role (Fig. 1b), or greater if a subset of species can eachperform multiple functions. In contrast, multiple species perform-ing similar functions will result in a linear relationship with a shal-lower slope. Alternatively, measures of ecosystem functions orservices may increase rapidly at low diversity levels if new speciesperform functions not already represented in the community whileat higher diversity levels new species may be functionally redun-dant and the rate of addition slows down (Fig. 1a). Another biolog-ically plausible scenario is where functions or services remain lowat low levels of species diversity (Fig. 1c). This might occur, forexample, if disturbance leads to the persistence of a subset of spe-cies sharing a limited number of functional traits. When conditionschange, species addition leads to the addition of functions repre-sented, but only at higher diversity levels. As in Fig. 1a, a plateauis eventually reached in 1c as it becomes increasingly likely thatadditional species at higher diversity levels are functionally similarto species already present in the community. Under all the scenar-ios above, species loss will ultimately result in decreasing ecosys-tem function but the rate and extent of this decrease is greatestfor exponential relationships (Fig. 1c), least for saturating relation-ships (Fig. 1a), and intermediate in the linear case (Fig. 1b).
Few studies have addressed biodiversity-function relationshipsin marine ecosystems, and even fewer studies have addressed rela-tionships between diversity and services (Raffaelli, 2007).
Experimental manipulations rigorously testing effects of diver-sity on ecosystem function (e.g., Worm et al., 2006; Stachowiczet al., 2007) are limited because of logistical constraints, and there-fore the consequences of diversity loss in high-diversity assem-blages are generally unknown (e.g., Micheli and Halpern, 2005;Guillemot et al., 2011). Correlative analyses from natural ecosys-tems have highlighted both linear and non-linear saturating rela-tionships between marine species and functional diversity(Micheli and Halpern, 2005; Halpern and Floeter, 2008). Exponen-tial relationships between species diversity and ecosystemfunctions, including biomass, secondary production, and decompo-sition rates, were reported in the deep sea (Danovaro et al., 2008),and non-saturating relationships between fish biomass and func-
tional diversity were found in a global analysis of coral reef fishassemblages (Mora et al., 2011). Furthermore, linear relationshipsbetween taxonomic diversity and variables describing the magni-tude and variability of fisheries catches were found in a globalanalysis conducted at the scale of large marine regions (Wormet al., 2006).
It is particularly important to examine the shape of diversity-function and diversity-service relationships in coral reefs becausethey are the most diverse and among the most threatened marineecosystems (Bellwood et al., 2004; Hoegh-Guldberg et al., 2007;Halpern et al., 2008). Coral reef ecosystems worldwide have under-gone significant decline and degradation due to combinations ofanthropogenic and natural disturbances, including increases inwater temperature and consequent coral bleaching, hurricanes,disease and direct impacts of fishing and coastal development onreef, mangrove, and seagrass habitats (Gardner et al., 2003;Pandolfi et al., 2005; Mora et al., 2011; De’ath et al., 2012). Suchimpacts have been particularly severe in the Caribbean (Gardneret al., 2003). Lower species diversity and limited functional redun-dancy of Caribbean reef assemblages, compared to Indo-Pacificreefs, may underlie low resilience in the face of increasing distur-bance (Bellwood et al., 2004; Roff and Mumby, 2012). For example,mass mortality of a single sea urchin species, Diadema antillarum,and two coral species, the staghorn and elkhorn corals (Acroporacervicornis and A. palmata) from disease in the 1980s virtually elim-inated entire ecological functions, namely the control of macroal-gae by invertebrate grazers and the provision of complex three-dimensional habitat by live branching corals (Roff and Mumby,2012). Under currently low sea urchin abundance, parrotfishesare the key remaining grazers that control macroalgae and allowfor coral recovery (Mumby et al., 2006a, 2007), though functionaleffects of parrotfishes do not completely replace those of urchinsacross the range of environmental conditions (Mumby et al.,2006b; Korzen et al., 2011).
In this study, we examine levels of functional redundancy andrelationships between total biomass, fisheries catches and diver-sity in fish assemblages of the Bahamian archipelago. Fish speciesperform critical ecosystem functions on coral reefs and provide keyresources to local human communities (Moberg and Folke, 1999;Harborne et al., 2006; Broad and Sanchirico, 2008; Mumby et al.,2008). Because fishing and seafood provisioning are marine ecosys-tem services of primary interest to many people, and fish diversity,abundance, and biomass are relatively well understood ecologicalmetrics, we utilize these variables as a first step in exploring theempirical relationships among diversity, function, and services incoral reef ecosystems. Specifically, we use data from field surveysof fish assemblages across a suite of habitats to examine (1) thedistribution of species across different functional groups andthe levels of functional redundancy within these assemblages, (2)the impacts of local extractive activities (i.e., small-scale foodand ornamental fisheries) on functional diversity and redundancy,and (3) the significance and shape of the relationship betweendiversity and fish biomass or fisheries catches in theseassemblages.
2. Materials and methods
2.1. Survey methods
We surveyed 199 sites, comprising a total of 12 different habitattypes, within island regions of the Bahamian archipelago (AppendixTable A1). Nine to 15 habitat types (e.g., forereef, patch reef, gorgo-nian plains, seagrass, algal beds, mangrove stands; Table A1) weresurveyed within the island systems of Abaco, Andros, Bimini, andSan Salvador in The Bahamas and South Caicos in the Turks and
Fig. 1. Possible relationships of functional diversity, ecosystem function and/orservices with species diversity (modified from Micheli and Halpern 2005).Depending on levels of functional redundancy within assemblages, functionaldiversity, ecosystem function or ecosystem services may increase linearly withincreasing species diversity (b), or at declining (a), or increasing rates (c). Theseecosystem properties are expected to reach a plateau at high diversity levels (a,c).
F. Micheli et al. / Biological Conservation 171 (2014) 186–194 187
Author's personal copy
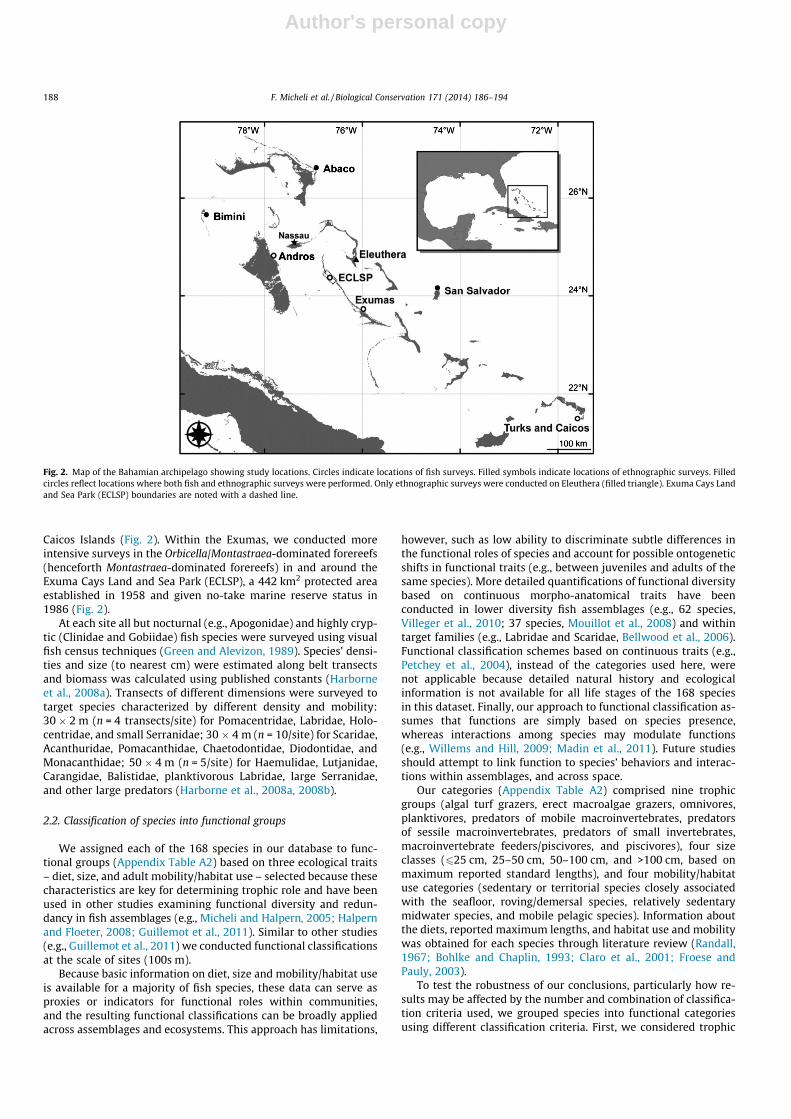
Caicos Islands (Fig. 2). Within the Exumas, we conducted moreintensive surveys in the Orbicella/Montastraea-dominated forereefs(henceforth Montastraea-dominated forereefs) in and around theExuma Cays Land and Sea Park (ECLSP), a 442 km2 protected areaestablished in 1958 and given no-take marine reserve status in1986 (Fig. 2).
At each site all but nocturnal (e.g., Apogonidae) and highly cryp-tic (Clinidae and Gobiidae) fish species were surveyed using visualfish census techniques (Green and Alevizon, 1989). Species’ densi-ties and size (to nearest cm) were estimated along belt transectsand biomass was calculated using published constants (Harborneet al., 2008a). Transects of different dimensions were surveyed totarget species characterized by different density and mobility:30 � 2 m (n = 4 transects/site) for Pomacentridae, Labridae, Holo-centridae, and small Serranidae; 30 � 4 m (n = 10/site) for Scaridae,Acanthuridae, Pomacanthidae, Chaetodontidae, Diodontidae, andMonacanthidae; 50 � 4 m (n = 5/site) for Haemulidae, Lutjanidae,Carangidae, Balistidae, planktivorous Labridae, large Serranidae,and other large predators (Harborne et al., 2008a, 2008b).
2.2. Classification of species into functional groups
We assigned each of the 168 species in our database to func-tional groups (Appendix Table A2) based on three ecological traits– diet, size, and adult mobility/habitat use – selected because thesecharacteristics are key for determining trophic role and have beenused in other studies examining functional diversity and redun-dancy in fish assemblages (e.g., Micheli and Halpern, 2005; Halpernand Floeter, 2008; Guillemot et al., 2011). Similar to other studies(e.g., Guillemot et al., 2011) we conducted functional classificationsat the scale of sites (100s m).
Because basic information on diet, size and mobility/habitat useis available for a majority of fish species, these data can serve asproxies or indicators for functional roles within communities,and the resulting functional classifications can be broadly appliedacross assemblages and ecosystems. This approach has limitations,
however, such as low ability to discriminate subtle differences inthe functional roles of species and account for possible ontogeneticshifts in functional traits (e.g., between juveniles and adults of thesame species). More detailed quantifications of functional diversitybased on continuous morpho-anatomical traits have beenconducted in lower diversity fish assemblages (e.g., 62 species,Villeger et al., 2010; 37 species, Mouillot et al., 2008) and withintarget families (e.g., Labridae and Scaridae, Bellwood et al., 2006).Functional classification schemes based on continuous traits (e.g.,Petchey et al., 2004), instead of the categories used here, werenot applicable because detailed natural history and ecologicalinformation is not available for all life stages of the 168 speciesin this dataset. Finally, our approach to functional classification as-sumes that functions are simply based on species presence,whereas interactions among species may modulate functions(e.g., Willems and Hill, 2009; Madin et al., 2011). Future studiesshould attempt to link function to species’ behaviors and interac-tions within assemblages, and across space.
Our categories (Appendix Table A2) comprised nine trophicgroups (algal turf grazers, erect macroalgae grazers, omnivores,planktivores, predators of mobile macroinvertebrates, predatorsof sessile macroinvertebrates, predators of small invertebrates,macroinvertebrate feeders/piscivores, and piscivores), four sizeclasses (625 cm, 25–50 cm, 50–100 cm, and >100 cm, based onmaximum reported standard lengths), and four mobility/habitatuse categories (sedentary or territorial species closely associatedwith the seafloor, roving/demersal species, relatively sedentarymidwater species, and mobile pelagic species). Information aboutthe diets, reported maximum lengths, and habitat use and mobilitywas obtained for each species through literature review (Randall,1967; Bohlke and Chaplin, 1993; Claro et al., 2001; Froese andPauly, 2003).
To test the robustness of our conclusions, particularly how re-sults may be affected by the number and combination of classifica-tion criteria used, we grouped species into functional categoriesusing different classification criteria. First, we considered trophic
Fig. 2. Map of the Bahamian archipelago showing study locations. Circles indicate locations of fish surveys. Filled symbols indicate locations of ethnographic surveys. Filledcircles reflect locations where both fish and ethnographic surveys were performed. Only ethnographic surveys were conducted on Eleuthera (filled triangle). Exuma Cays Landand Sea Park (ECLSP) boundaries are noted with a dashed line.
188 F. Micheli et al. / Biological Conservation 171 (2014) 186–194
Author's personal copy
group, size, and mobility/habitat use separately, and combinationsof pairs of traits: trophic group and size (for a total of 22 groups) ortrophic group and mobility/habitat use (25 groups) combinations.The total number of pair wise classification groups is lower thanthe theoretical maximum (for example 9 trophic groups � 4 sizegroups = 36 groups) because some combinations did not occurwithin these assemblages. Finally, we combined all three traits,and then aggregated some of the groups (e.g., size classes werecombined when the size classes did not correspond to meaningfulfunctional differences for some combinations of trophic mode andhabitat association) and separated others (e.g., we separated inver-tebrate feeders foraging primarily on coral reefs vs. sandy bottom)based on additional information on the ecology of each species ob-tained through literature review (see references above and Appen-dix Table A2). This classification resulted in 33 detailed functionalgroups (henceforth ‘‘functional groups’’) in total.
Each of the 168 species in the database was also assigned to oneof four exploitation categories – primary fishing target (for food),secondary fishing target (for food), potential aquarium trade target(ornamental fish), or non-target – based on data from ethnographicsurveys (Broad and Sanchirico, 2008) conducted within four Baha-mian islands, San Salvador, Eleuthera, Bimini, and Abaco (Fig. 2).Sixty-seven species or species groups were reported as targets offishing in at least one of 72 ethnographic surveys from the fourlocations. Taxa were considered primary targets if they were re-ported in more than half of surveys and in at least two of the fourislands. The other reported fished species were considered second-ary targets. For the species that were not mentioned in interviewswith fishers, we used information reported in FishBase (www.fishbase.org; Froese and Pauly, 2003) to assign them to one of threepossible categories: secondary targets, aquarium-trade targets, ornon-targets.
2.3. Measures of species and functional diversity
Fish diversity at each of the 199 sites was quantified as richnessboth in terms of species and functional groups (i.e., as the numberof species or groups encountered). In addition, we calculated theShannon–Wiener diversity index using number of species withineach functional group as a measure of functional redundancy with-in fish assemblages at different sites (Stevens et al., 2003). Highervalues of this index indicate a more even distribution of speciesamong the functional groups observed at a site, and thereforegreater functional redundancy on average within the assemblage.Conversely, low values indicate a skewed distribution of speciesamong functional groups, with few groups containing many spe-cies and many groups represented by few species. At low valuesof the index a few groups would be characterized by high func-tional redundancy, but several functional trait combinations wouldhave low redundancy and might be lost with species loss. Thus theassemblage would have lower functional redundancy overall.
2.3.1. Levels of functional redundancy and fishing impactsTo examine the effects of fishing on fish diversity and functional
redundancy, we used two approaches. First, we determined thenumber of species assigned to different functional groups andexploitation categories for each functional classification scheme(single traits, pairs of traits, or combinations of all three traits, seeabove) to examine the distribution of species subject to differentexploitation levels across functional groups. Second, we comparedspecies and functional diversity and redundancy between fish com-munities within the ECLSP and in adjacent, fished waters. We com-pared functional diversity and redundancy among Montastraea-dominated forereefs within the no-take reserve (the ECLSP) andfished reefs to the north and south of the park using one-way Anal-ysis of Variance (ANOVA). We used asymmetric ANOVA models
comparing diversity between the no-take reserve and the two fishedareas, with N = 3 reefs surveyed within each area.
2.4. Relationships between diversity, biomass and fisheries catch
We examined the significance and shape of relationships ofspecies diversity with functional diversity and then between thesemeasures of diversity and both fish biomass and estimated fisher-ies catch. We used the standing biomass of fish assemblages as ametric of ecosystem functioning. There is a strong relationship be-tween body mass and energy requirements in fishes, thus standingbiomass is an accurate surrogate for energy fluxes in fish assem-blages (Mora et al., 2011). Total fish biomass for each site (per unitarea) was calculated by summing individual biomass estimatedfrom all transects (Harborne et al., 2008b).
The provisioning service of seafood production was estimatedfrom a simple model of fisheries production. Fisheries catch statis-tics do not exist at the scale of individual locations and were esti-mated, for each field site, by combining estimates of fishing effort(Harborne et al., 2008a) with quantification of the biomass of pri-mary fishing targets at the site (this study). Harborne et al. (2008a)combined a predictive model of travel costs for fishing with a spa-tially explicit dataset of human population sizes to estimate the to-tal fishing pressure from local small-scale fisheries at each site.Fishing effort at each Montastraea reef and gorgonian plain site sur-veyed in this study was estimated as the inverse of the predictedtravel cost, weighted by local human population size. This measureassumes that fishing will be higher near sites of large populationsand that sites further from a given population will be fished lessheavily than a closer site.
We multiplied total estimated fishing effort by the total bio-mass of fish species that are primary targets for local small-scalefisheries. Thus, total catch (TC) at each location i was estimated as:
TCi ¼ q� FEi � Bi
where FE is fishing effort, and B the total biomass of all species tar-geted by local fisheries. We assumed a catchability coefficient (q) of0.02, although other constants could be used and the magnitude ofthis constant does not influence the shape and significance of therelationship between catch and species diversity. This approach toestimating catches accounts for variation in fish biomass, speciescomposition, distance from settlements, and local human popula-tion density among field sites. This measure of catch captures thefact that some sites supporting high fish biomass cannot be easilyaccessed and thus may not provide high levels of services (benefits)(Fig. A1). Catches were estimated, rather than directly measured,and values should be considered as a relative index of fisheries pro-duction, not actual catch amounts.
To determine whether measures of functional diversity, fishbiomass, and fisheries catch are associated with the species diver-sity of fish assemblages, and if so, whether relationships are linear,saturating, or exponential (non-saturating) within the observeddiversity ranges (Fig. 1), we fitted linear, logarithmic, and exponen-tial models to the data. In each case we retained the relationshipthat explained the most variation (all models contain the samenumber of terms, and so can be compared directly using R2 values).We did not fit logistic models (Fig. 1) because visual inspection ofdata revealed that this distribution was never observed.
3. Results
3.1. Levels of functional redundancy and fishing impacts
The average number of species per functional group variedacross the functional classification schemes (Fig. 3). Trophic groups
F. Micheli et al. / Biological Conservation 171 (2014) 186–194 189
Author's personal copy
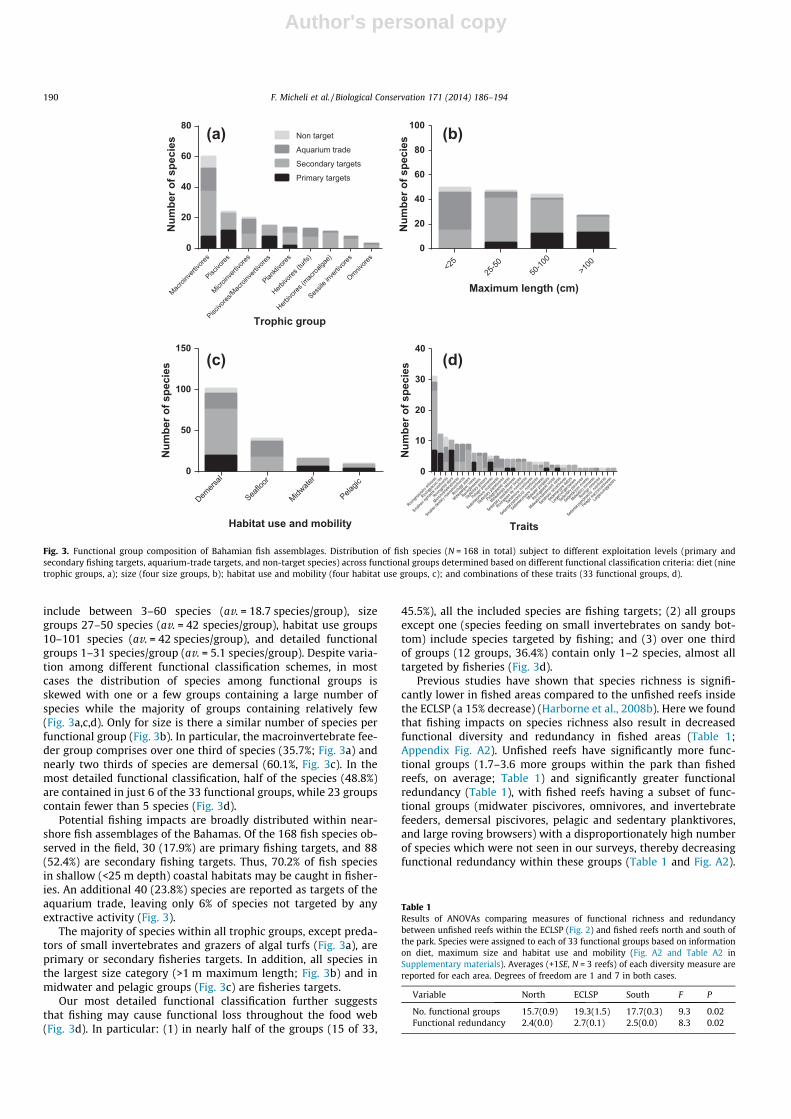
include between 3–60 species (av. = 18.7 species/group), sizegroups 27–50 species (av. = 42 species/group), habitat use groups10–101 species (av. = 42 species/group), and detailed functionalgroups 1–31 species/group (av. = 5.1 species/group). Despite varia-tion among different functional classification schemes, in mostcases the distribution of species among functional groups isskewed with one or a few groups containing a large number ofspecies while the majority of groups containing relatively few(Fig. 3a,c,d). Only for size is there a similar number of species perfunctional group (Fig. 3b). In particular, the macroinvertebrate fee-der group comprises over one third of species (35.7%; Fig. 3a) andnearly two thirds of species are demersal (60.1%, Fig. 3c). In themost detailed functional classification, half of the species (48.8%)are contained in just 6 of the 33 functional groups, while 23 groupscontain fewer than 5 species (Fig. 3d).
Potential fishing impacts are broadly distributed within near-shore fish assemblages of the Bahamas. Of the 168 fish species ob-served in the field, 30 (17.9%) are primary fishing targets, and 88(52.4%) are secondary fishing targets. Thus, 70.2% of fish speciesin shallow (<25 m depth) coastal habitats may be caught in fisher-ies. An additional 40 (23.8%) species are reported as targets of theaquarium trade, leaving only 6% of species not targeted by anyextractive activity (Fig. 3).
The majority of species within all trophic groups, except preda-tors of small invertebrates and grazers of algal turfs (Fig. 3a), areprimary or secondary fisheries targets. In addition, all species inthe largest size category (>1 m maximum length; Fig. 3b) and inmidwater and pelagic groups (Fig. 3c) are fisheries targets.
Our most detailed functional classification further suggeststhat fishing may cause functional loss throughout the food web(Fig. 3d). In particular: (1) in nearly half of the groups (15 of 33,
45.5%), all the included species are fishing targets; (2) all groupsexcept one (species feeding on small invertebrates on sandy bot-tom) include species targeted by fishing; and (3) over one thirdof groups (12 groups, 36.4%) contain only 1–2 species, almost alltargeted by fisheries (Fig. 3d).
Previous studies have shown that species richness is signifi-cantly lower in fished areas compared to the unfished reefs insidethe ECLSP (a 15% decrease) (Harborne et al., 2008b). Here we foundthat fishing impacts on species richness also result in decreasedfunctional diversity and redundancy in fished areas (Table 1;Appendix Fig. A2). Unfished reefs have significantly more func-tional groups (1.7–3.6 more groups within the park than fishedreefs, on average; Table 1) and significantly greater functionalredundancy (Table 1), with fished reefs having a subset of func-tional groups (midwater piscivores, omnivores, and invertebratefeeders, demersal piscivores, pelagic and sedentary planktivores,and large roving browsers) with a disproportionately high numberof species which were not seen in our surveys, thereby decreasingfunctional redundancy within these groups (Table 1 and Fig. A2).
25-50
Trophic group
Num
ber o
f spe
cies
Macroi
nvert
ivores
Piscivo
res
Microin
vertiv
ores
Piscivo
res/M
acroi
nvert
ivores
Plankti
vores
Herbivo
res(tu
rfs)
Herbivo
res(m
acroa
lgae)
Sessile
invert
ivores
Omnivore
s0
20
40
60
80
Primary targets
Secondary targets
Aquarium trade
Non target
Maximum length (cm)
Num
ber o
f spe
cies
<25
>100
0
20
40
60
80
100
Habitat use and mobility
Num
ber o
f spe
cies
Demers
al
Seaflo
or
Midwate
r
Pelagic
0
50
100
150
Traits
Num
ber o
f spe
cies
0
10
20
30
40
(a)
(d)
(b)
(c)
50-10
0
Fig. 3. Functional group composition of Bahamian fish assemblages. Distribution of fish species (N = 168 in total) subject to different exploitation levels (primary andsecondary fishing targets, aquarium-trade targets, and non-target species) across functional groups determined based on different functional classification criteria: diet (ninetrophic groups, a); size (four size groups, b); habitat use and mobility (four habitat use groups, c); and combinations of these traits (33 functional groups, d).
Table 1Results of ANOVAs comparing measures of functional richness and redundancybetween unfished reefs within the ECLSP (Fig. 2) and fished reefs north and south ofthe park. Species were assigned to each of 33 functional groups based on informationon diet, maximum size and habitat use and mobility (Fig. A2 and Table A2 inSupplementary materials). Averages (+1SE, N = 3 reefs) of each diversity measure arereported for each area. Degrees of freedom are 1 and 7 in both cases.
Variable North ECLSP South F P
No. functional groups 15.7(0.9) 19.3(1.5) 17.7(0.3) 9.3 0.02Functional redundancy 2.4(0.0) 2.7(0.1) 2.5(0.0) 8.3 0.02
190 F. Micheli et al. / Biological Conservation 171 (2014) 186–194
Author's personal copy
Lower numbers of piscivorous and planktivorous species were seenin fished compared to protected reefs, particularly demersal andmidwater piscivores and pelagic and sedentary planktivores(Fig. A2). Moreover, some key functional groups, such as the largeroving browsers of turf and macroalgae (i.e., the largest parrotfishspecies, Scarus coeruleus and S. guacamaia), were seen inside the re-serve but not at the adjacent fished sites north and south of theECLSP (Fig. A2).
3.2. Relationships between diversity, biomass and fisheriesproductivity
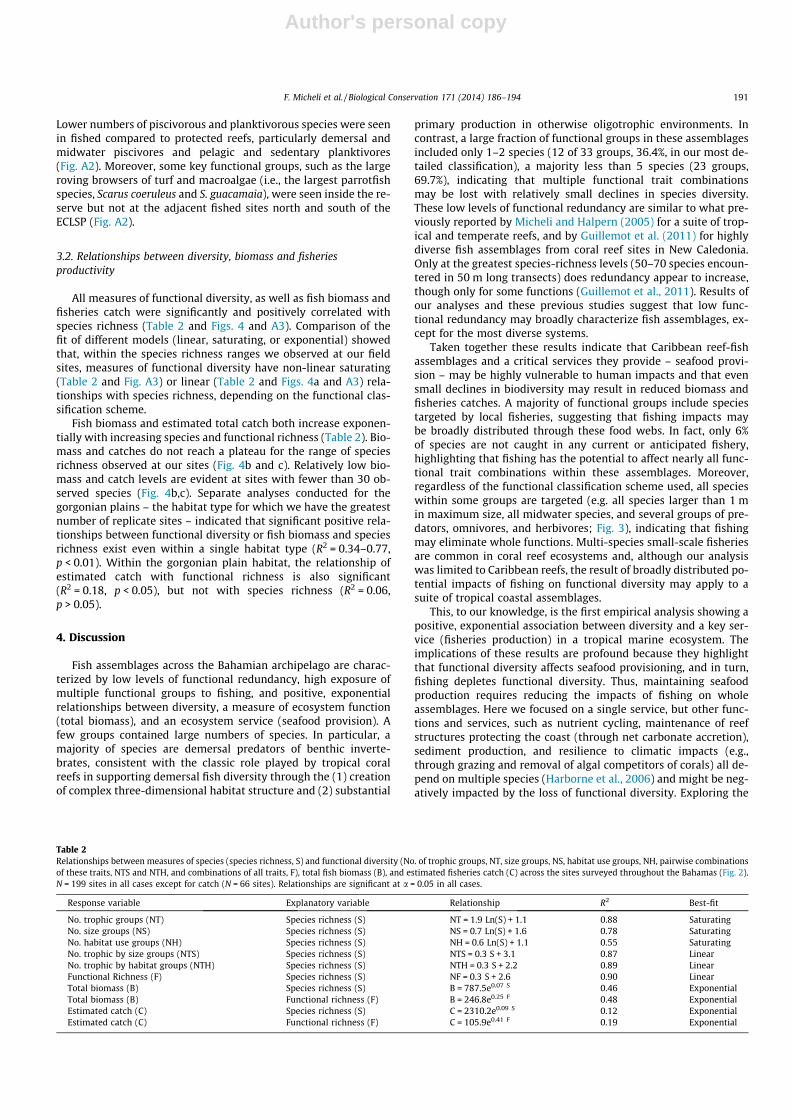
All measures of functional diversity, as well as fish biomass andfisheries catch were significantly and positively correlated withspecies richness (Table 2 and Figs. 4 and A3). Comparison of thefit of different models (linear, saturating, or exponential) showedthat, within the species richness ranges we observed at our fieldsites, measures of functional diversity have non-linear saturating(Table 2 and Fig. A3) or linear (Table 2 and Figs. 4a and A3) rela-tionships with species richness, depending on the functional clas-sification scheme.
Fish biomass and estimated total catch both increase exponen-tially with increasing species and functional richness (Table 2). Bio-mass and catches do not reach a plateau for the range of speciesrichness observed at our sites (Fig. 4b and c). Relatively low bio-mass and catch levels are evident at sites with fewer than 30 ob-served species (Fig. 4b,c). Separate analyses conducted for thegorgonian plains – the habitat type for which we have the greatestnumber of replicate sites – indicated that significant positive rela-tionships between functional diversity or fish biomass and speciesrichness exist even within a single habitat type (R2 = 0.34–0.77,p < 0.01). Within the gorgonian plain habitat, the relationship ofestimated catch with functional richness is also significant(R2 = 0.18, p < 0.05), but not with species richness (R2 = 0.06,p > 0.05).
4. Discussion
Fish assemblages across the Bahamian archipelago are charac-terized by low levels of functional redundancy, high exposure ofmultiple functional groups to fishing, and positive, exponentialrelationships between diversity, a measure of ecosystem function(total biomass), and an ecosystem service (seafood provision). Afew groups contained large numbers of species. In particular, amajority of species are demersal predators of benthic inverte-brates, consistent with the classic role played by tropical coralreefs in supporting demersal fish diversity through the (1) creationof complex three-dimensional habitat structure and (2) substantial
primary production in otherwise oligotrophic environments. Incontrast, a large fraction of functional groups in these assemblagesincluded only 1–2 species (12 of 33 groups, 36.4%, in our most de-tailed classification), a majority less than 5 species (23 groups,69.7%), indicating that multiple functional trait combinationsmay be lost with relatively small declines in species diversity.These low levels of functional redundancy are similar to what pre-viously reported by Micheli and Halpern (2005) for a suite of trop-ical and temperate reefs, and by Guillemot et al. (2011) for highlydiverse fish assemblages from coral reef sites in New Caledonia.Only at the greatest species-richness levels (50–70 species encoun-tered in 50 m long transects) does redundancy appear to increase,though only for some functions (Guillemot et al., 2011). Results ofour analyses and these previous studies suggest that low func-tional redundancy may broadly characterize fish assemblages, ex-cept for the most diverse systems.
Taken together these results indicate that Caribbean reef-fishassemblages and a critical services they provide – seafood provi-sion – may be highly vulnerable to human impacts and that evensmall declines in biodiversity may result in reduced biomass andfisheries catches. A majority of functional groups include speciestargeted by local fisheries, suggesting that fishing impacts maybe broadly distributed through these food webs. In fact, only 6%of species are not caught in any current or anticipated fishery,highlighting that fishing has the potential to affect nearly all func-tional trait combinations within these assemblages. Moreover,regardless of the functional classification scheme used, all specieswithin some groups are targeted (e.g. all species larger than 1 min maximum size, all midwater species, and several groups of pre-dators, omnivores, and herbivores; Fig. 3), indicating that fishingmay eliminate whole functions. Multi-species small-scale fisheriesare common in coral reef ecosystems and, although our analysiswas limited to Caribbean reefs, the result of broadly distributed po-tential impacts of fishing on functional diversity may apply to asuite of tropical coastal assemblages.
This, to our knowledge, is the first empirical analysis showing apositive, exponential association between diversity and a key ser-vice (fisheries production) in a tropical marine ecosystem. Theimplications of these results are profound because they highlightthat functional diversity affects seafood provisioning, and in turn,fishing depletes functional diversity. Thus, maintaining seafoodproduction requires reducing the impacts of fishing on wholeassemblages. Here we focused on a single service, but other func-tions and services, such as nutrient cycling, maintenance of reefstructures protecting the coast (through net carbonate accretion),sediment production, and resilience to climatic impacts (e.g.,through grazing and removal of algal competitors of corals) all de-pend on multiple species (Harborne et al., 2006) and might be neg-atively impacted by the loss of functional diversity. Exploring the
Table 2Relationships between measures of species (species richness, S) and functional diversity (No. of trophic groups, NT, size groups, NS, habitat use groups, NH, pairwise combinationsof these traits, NTS and NTH, and combinations of all traits, F), total fish biomass (B), and estimated fisheries catch (C) across the sites surveyed throughout the Bahamas (Fig. 2).N = 199 sites in all cases except for catch (N = 66 sites). Relationships are significant at a = 0.05 in all cases.
Response variable Explanatory variable Relationship R2 Best-fit
No. trophic groups (NT) Species richness (S) NT = 1.9 Ln(S) + 1.1 0.88 SaturatingNo. size groups (NS) Species richness (S) NS = 0.7 Ln(S) + 1.6 0.78 SaturatingNo. habitat use groups (NH) Species richness (S) NH = 0.6 Ln(S) + 1.1 0.55 SaturatingNo. trophic by size groups (NTS) Species richness (S) NTS = 0.3 S + 3.1 0.87 LinearNo. trophic by habitat groups (NTH) Species richness (S) NTH = 0.3 S + 2.2 0.89 LinearFunctional Richness (F) Species richness (S) NF = 0.3 S + 2.6 0.90 LinearTotal biomass (B) Species richness (S) B = 787.5e0.07 S 0.46 ExponentialTotal biomass (B) Functional richness (F) B = 246.8e0.25 F 0.48 ExponentialEstimated catch (C) Species richness (S) C = 2310.2e0.09 S 0.12 ExponentialEstimated catch (C) Functional richness (F) C = 105.9e0.41 F 0.19 Exponential
F. Micheli et al. / Biological Conservation 171 (2014) 186–194 191
Author's personal copy
relationships among diversity, functions, and services in coral reefstherefore remains an important priority.
Previous studies in this and other systems have shown that fish-ing reduces species diversity (Worm et al., 2006; Harborne et al.,2008b; Lester et al., 2009). Our comparison between reefs pro-tected within a large no-take marine reserve and adjacent fishedreefs shows that fishing also significantly reduces functional diver-sity and redundancy, including the removal of entire functionalgroups. Fishing depletes species below detectable levels dispropor-tionately more often within a subset of functional groups (mid-water piscivores, omnivores, and invertebrate feeders, demersal
piscivores, pelagic and sedentary planktivores, and large rovingbrowsers), thereby decreasing functional redundancy within thesegroups. Thus, fishing preferentially decreases predator and plankti-vore diversity, and may remove whole functional groups such aslarge roving browsers of macroalgae. The effects of such removalshave been shown to be ecologically important for a subset of func-tional groups (predators, Stallings, 2008; herbivores, Mumby et al.,2007; corallivores, Bellwood et al., 2003) and ecological processes(algal grazing, bioerosion, and coral recruitment; referencesabove). In particular, the effects of grazing have been studiedextensively in coral reefs (Mumby et al., 2006, 2007; Burkepileand Hay, 2008; Korzen et al., 2011). However, a more comprehen-sive understanding of the ecological roles played by species withinmultiple functional groups is needed in order to make predictionsabout how their decline may affect dynamics of coral reef ecosys-tems. In particular, the lower piscivore diversity we documented infished reefs may have important consequences for these assem-blages through the removal of predator control of populationsand communities (Mumby et al., 2006a). In addition, planktivoresplay an important ecological role by trophically linking coral reefand open-water communities (Hobson, 1991), and decline in theirdiversity may affect this function.
Unsurprisingly, the level of functional redundancy and theresulting shape of the relationship between species and functionaldiversity depend on the classification scheme used (Micheli andHalpern, 2005; Halpern and Floeter, 2008). However, high levelsof functional redundancy within groups and saturating relation-ships were found only when species were assigned to the broadest(single) categories, such as trophic groups or habitat use categories.In contrast, empirical evidence shows high variation in effects with-in trophic guilds (e.g., Burkepile and Hay, 2008). Here we find thatadding even just one trait to further subdivide these broad catego-ries always results in linear relationships between species and func-tional diversity without saturation, even at the highest levels ofspecies richness in our system. Although it is reasonable to expectthat an asymptote would eventually be reached, a plateau wasnever reached within our observed diversity range. This result indi-cates that species additions result in the addition of new functionalroles throughout the species diversity gradient in our study region,supporting the conclusion of low functional redundancy in theseand other marine assemblages (e.g., Micheli and Halpern, 2005).
Total biomass and fisheries catches are exponentially related tomeasures of diversity; we would therefore expect to observe thegreatest loss of function or service provision when species are lostfrom the most diverse systems. The positive exponential relation-ship of fish biomass and estimated fisheries catches with diversitysuggests that even small declines in biodiversity may result inlarge reductions in secondary production and seafood provisionin Caribbean fish assemblages. In general, small decreases in spe-cies diversity might lead to loss of ecosystem function and servicesin these and other highly diverse marine ecosystems.
The positive exponential relationship of biomass and catch withdiversity is likely partly related to the selective removal of large-bodied species by fisheries (Fig. 3b). Depletion of large consumersfrom human impact has been documented in coral reef systemsworldwide (Gell and Roberts 2003; Bellwood et al., 2004; Pandolfiet al., 2005; Stevenson et al., 2007) and would result in rapid loss ofbiomass due to the disproportionate contribution of large individ-uals to total biomass. However, our results suggest that rapid de-clines in biomass and catch may also occur in high diversitysystems under fishing pressure because multiple species are simul-taneously depleted throughout the food web (Fig. 3d). Thus, lowfunctional redundancy and widespread impacts of fishing acrossfunctional groups may be an important additional mechanismunderlying rapid loss of function and services in high diversity cor-al reef ecosystems.
0 20 40 60 0
5
10
15
20
25
0 20 40 60 0
20000
40000
60000
80000
100000
0 20 40 60 0
200000
400000
600000
800000
1000000
Species Richness
(a)
(b)
(c)
Func
tiona
l Ric
hnes
s To
tal B
iom
ass
(g 2
00m
-2)
Cat
ch (g
)
Fig. 4. Relationships of functional richness (a), total fish biomass (b), and estimatedfisheries catch (c) with species richness. Functional richness was based oncombination of three traits: diet, maximum body size, and habitat use and mobility(33 groups in total). N = 199 sites in all cases except for catch estimates (N = 66sites). Best-fitting relationships are linear for functional richness (a), and exponen-tial for fish biomass (b) and estimated catch (c) (Table 2).
192 F. Micheli et al. / Biological Conservation 171 (2014) 186–194
Author's personal copy
Overall, these results indicate that conserving and re-buildingspecies and functional diversity and functional redundancy isimportant for maintaining the functions and services provided bycoral reef seascapes in the Bahamas and other regions. This studyprovides additional evidence that marine reserves are an effectivemeans of achieving multi-species protection and restoring function(Gell and Roberts, 2003; Micheli et al., 2004; Russ et al., 2004;Lester et al., 2009). In particular, protection in the ECLSP hasresulted in greater abundances of large parrotfishes, with corre-sponding increased grazing rates, reduced macroalgal cover, andincreased coral recovery (Mumby and Harborne, 2010), increasedspecies richness (Harborne et al., 2008b), and increased functionaldiversity and redundancy (this study). These results demonstratethat implementation of management approaches such as marineprotected areas that simultaneously target multiple species andfunctional groups, and the inclusion of ecosystem-level indicators,such as diversity measures, as performance metrics for fisheriesmanagement (Sainsbury and Sumaila, 2003; Link, 2005) are partic-ularly important in coral reef ecosystems.
Experimental manipulations are unfeasible when dealing withlarge spatial scales (across seascapes) and hundreds of species,but the descriptive and comparative analytic approach used hereinalso has limitations. First, correlations between measures of func-tions or services and diversity do not imply causal relationshipsbut instead could be due to other processes simultaneously influ-encing these variables. Second, we did not measure ecosystemfunction and services directly, but instead used proxies (i.e., totalfish biomass and estimated fisheries catch). Additional future workdirectly quantifying ecosystem function and services will be criti-cal for understanding the role of diversity in maintaining the suiteof ecosystem functions and services provided by coral reefs andother marine ecosystems (e.g. Moberg and Folke, 1999; Harborneet al., 2006; 2008a; McClanahan, 2007; McClanahan et al., 2008).
5. Conclusions
Our analyses provide evidence of limited functional redundancyand a positive exponential relationship between diversity andmeasures of ecosystem function and services of fish assemblagesacross Caribbean coral reef seascapes. These results contribute tothe ongoing debate on the relationship between diversity andfunction in marine ecosystems (Cardinale et al., 2006; Wormet al., 2006; Danovaro et al., 2008; Mora et al., 2011; Reich et al.,2012). These findings highlight the high vulnerability of diversity,function, and ecosystem services to human impacts, and the needto conserve whole species assemblages, in addition to focal taxa ofknown ecological and economic importance, through ecosystem-based management approaches.
Acknowledgements
This work was supported by grants from the National ScienceFoundation’s Biocomplexity in the Environment Program (OCE-0119976); the National Oceanic and Atmospheric Administration’sNational Undersea Research Program, administered by the Carib-bean Marine Research Center (CMRC-03-NRDH-01-04A, underawards NA06RU0228 and NA16RU1496); and the U.S. Environ-mental Protection Agency (R832223).
Appendix A. Supplementary material
Supplementary data associated with this article can be found, inthe online version, at http://dx.doi.org/10.1016/j.biocon.2013.12.029.
References
Bellwood, D.R., Hoey, A., Choat, J.H., 2003. Limited functional redundancy in highdiversity systems: resilience and ecosystem function on coral reefs. Ecol. Lett. 6,281–285.
Bellwood, D.R., Hughes, T.P., Folke, C., Nystrom, M., 2004. Confronting the coral reefcrisis. Nature 429, 827–833.
Bellwood, D.R., Wainwright, P.C., Fulton, C.J., Hoey, A.S., 2006. Functional versatilitysupports coral reef biodiversity. Proc. Roy. Soc. B 273, 101–107.
Bohlke, J.E., Chaplin, C.C.G., 1993. Fishes of the Bahamas and Adjacent TropicalWaters. University of Texas Press, Austin.
Broad, K., Sanchirico, J.N., 2008. Local perspectives on marine reserve creation in theBahamas. Ocean Coast. Manag. 51, 763–771.
Burkepile, D.E., Hay, M.E., 2008. Herbivore species richness and feedingcomplementarity affect community structure and function on a coral reef.Proc. Natl. Acad. Sci. USA 105, 16201–16206.
Cardinale, B.J., Srivastava, D.S., Duffy, J.E., Wright, J.P., Downing, A.L., Sankaran, M.,et al., 2006. Effects of biodiversity on the functioning of trophic groups andecosystems. Nature 443, 989–992.
Claro, R.K., Lyndeman, C., Parenti, L.R., 2001. Ecology of Marine Fishes of Cuba.Smithsonian Institution Press, Washington, DC, London.
Danovaro, R., Gambi, C., dell’Anno, A., Corinaldesi, C., Fraschetti, S., Vanreusel, A.,2008. Exponential decline of deep-sea ecosystem functioning linked to benthicbiodiversity loss. Curr. Biol. 18, 1–8.
De’ath, G., Fabricius, K.E., Sweatman, H., Puotinen, M., 2012. The 27-year decline ofcoral cover on the Great Barrier Reef and its causes. In: Proceedings of theNational Academy of Science USA, October 1, 2012, published online beforeprint. DOI: http://dx.doi.org/10.1073/pnas.1208909109.
Froese, R., Pauly, D., 2003. FishBase. <http://www.fishbase.org> (Last accessed22.11.11).
Gardner, T.A., Cote’, I.M., Gill, J.A., Grant, A., Watkinson, A.R., 2003. Long-term regionwide declines in Caribbean corals. Science 301, 958–960.
Gell, F.R., Roberts, C.M., 2003. The Fishery Effects of Marine Reserves and FisheryClosures. WWF-US, Washington, DC.
Green, L.E., Alevizon, W.S., 1989. Comparative accuracies of visual assessmentmethods for coral reef fishes. Bull. Mar. Sci. 44, 899–912.
Guillemot, N., Kulbicki, M., Chabanet, P., Vigliola, L., 2011. Functional redundancypatterns reveal non-random assembly rules in a species-rich marineassemblage. PLoS ONE 6 (10), e26735. http://dx.doi.org/10.1371/journal.pone.0026735.
Halpern, B.S., Floeter, S.R., 2008. Functional diversity responses to changing speciesrichness in reef fish communities. Mar. Ecol. Prog. Ser. 364, 147–156.
Halpern, B.S., Waldbridge, S., Selkoe, K.A., Kappel, C.V., Micheli, F., D’Agrosa, C., et al.,2008. A global map of human impact on marine ecosystems. Science 319, 948–952.
Harborne, A.R., Mumby, P.J., Micheli, F., Perry, C.T., Dahlgren, C.P., Holmes, K.E., et al.,2006. The functional value of Caribbean reef habitats to ecosystem processes.Adv. Mar. Biol. 50, 57–189.
Harborne, A.R., Mumby, P.J., Kappel, C.V., Dahlgren, C.P., Micheli, F., Holmes, K.E.,et al., 2008a. Tropical coastal habitats as surrogates of fish communitystructure, grazing, and fisheries value. Ecol. Appl. 18, 1689–1701.
Harborne, A.R., Mumby, P.J., Kappel, C.V., Dahlgren, C.P., Micheli, F., Holmes, K.E.,et al., 2008b. Reserve effects and natural variation in coral reef communities. J.Appl. Ecol. 45, 1010–1018.
Hobson, E.S., 1991. Trophic relationships of fishes specialized to feed onzooplankters above coral reefs. In: Sale, P.F. (Ed.), The Ecology of Fishes onCoral Reefs. Academic Press Limited, London, pp. 69–95.
Hoegh-Guldberg, O., Mumby, P.J., Hooten, A.J., Steneck, R.S., Greenfield, P., Gomez,E., et al., 2007. Coral reefs under rapid climate change and ocean acidification.Science 318, 1737–1742.
Hooper, D.U., Chapin, F.S., Ewel, J.J., Hector, A., Inchausti, P., Lavorel, S., et al., 2005.Effects of biodiversity on ecosystem functioning: a consensus of currentknowledge. Ecol. Monogr. 75, 3–35.
Korzen, L., Israel, A., Abelson, A., 2011. Grazing effects of fish versus sea urchins onturf algae and coral recruits: possible implications for coral reef resilience andrestoration. J. Mar. Biol. 2011, 960207. http://dx.doi.org/10.1155/2011/960207.
Lester, S.E., Halpern, B.S., Grorud-Covert, K., Lubchenco, J., Ruttenberg, B.I., Gaines,S.D., et al., 2009. Biological effects within no-take marine reserves: a globalsynthesis. Mar. Ecol. Prog. Ser. 384, 33–46.
Link, J.S., 2005. Translating ecosystem indicators into decision criteria. ICES J. Mar.Sci. 62, 569–576.
Loreau, M., Naeem, S., Inchausti, P., Bengtsson, J., Grime, J.P., Hector, A., et al., 2001.Biodiversity and ecosystem functioning: current knowledge and futurechallenges. Science 294, 804–808.
Madin, E.M.P., Madin, J.S., Booth, D.J., 2011. Landscape of fear visible from space. Sci.Reports 1, 14. http://dx.doi.org/10.1038/srep00014.
McClanahan, T.R., 2007. Achieving sustainability in East African coral reefs. J. Mar.Sci. Environ. C5, 1–4.
McClanahan, T.R., Hicks, C.C., Darling, E.S., 2008. Malthusian overfishing and effortsto overcome it on Kenyan coral reefs. Ecol. Appl. 18, 1516–1529.
Micheli, F., Halpern, B.S., Botsford, L.W., Warner, R.R., 2004. Trajectories andcorrelates of community change in no-take marine reserves. Ecol. Appl. 14,1709–1723.
Micheli, F., Halpern, B.S., 2005. Low functional redundancy in coastal marineassemblages. Ecol. Lett. 8, 391–400.
F. Micheli et al. / Biological Conservation 171 (2014) 186–194 193
Author's personal copy
Millennium Ecosystem Assessment, 2005. Ecosystems and Human Well-being:Current State and Trends. Island Press, Washington, DC.
Moberg, F., Folke, C., 1999. Ecological goods and services of coral reef ecosystems.Ecol. Econ. 29, 215–233.
Mora, C., Aburto-Oropeza, O., Ayala Bocos, A., Ayotte, P.M., Banks, S., Bauman, A.G.,et al., 2011. Global human footprint on the linkage between biodiversity andecosystem functioning in reef fishes. PLoS Biol. 9 (4), e1000606. http://dx.doi.org/10.1371/journal.pbio.1000606.
Mouillot, D., Culioli, J.M., Pelletier, D., Tomasini, J.A., 2008. Do we protect biologicaloriginality in protected areas? a new index and an application to the BonifacioStrait Natural Reserve. Biol. Conserv. 141, 1569–1580.
Mumby, P.J., Dahlgren, C.P., Harborne, A.R., Kappel, C.V., Micheli, F., Brumbaugh,D.R., et al., 2006a. Fishing, trophic cascades, and the process of grazing on coralreefs. Science 311, 98–101.
Mumby, P.J., Hedley, J.D., Zychaluk, K., Harborne, A.R., Blackwell, P.G., 2006b.Revisiting the catastrophic die-off of the urchin Diadema antillarum onCaribbean coral reefs: fresh insights on resilience from a simulation model.Ecol. Model. 196 (1–2), 131–148.
Mumby, P.J., Harborne, A.R., Williams, J., Kappel, C.V., Brumbaugh, D.R., Micheli, F.,et al., 2007. Trophic cascade facilitates coral recruitment in a marine reserve.Proc. Natl. Acad. Sci. USA 104, 8362–8367.
Mumby, P.J., Broad, K., Brumbaugh, D.R., Dahlgren, C.P., Harborne, A.R., Hastings, A.,et al., 2008. Coral reef habitats as surrogates of species, ecological functions, andecosystem services. Conserv. Biol. 22, 941–951.
Mumby, P.J., Harborne, A.R., 2010. Marine reserves enhance the recovery of coralson Caribbean reefs. PLoS ONE 5 (1), e8657. http://dx.doi.org/10.1371/journal.pone.0008657.
Naeem, S., 1998. Species redundancy and ecosystem reliability. Conserv. Biol. 12,39–45.
Pandolfi, J.M., Jackson, J.B.C., Baron, N., Bradbury, R.H., Guzmán, H.M., Hughes, T.P.,et al., 2005. Are US coral reefs on the slippery slope to slime? Science 307,1725–1726.
Petchey, O.L., Hector, A., Gaston, K.J., 2004. How do different measures of functionaldiversity perform? Ecology 85, 847–857.
Raffaelli, D., 2007. Food webs, body size and the curse of the Latin binomial. In:Rooney, N., McCann, K.S., Noakes, D.L.G. (Eds.), From Energetics to Ecosystems:
The Dynamics and Structure of Ecological Systems. Springer, Dordrecht, pp. 53–64.
Randall, J.E., 1967. Food habits of reef fishes of the West Indies, in: Studies inTropical Oceanography No. 5. University of Miami Institute of Marine Science,Miami Beach, pp. 665–847.
Reich, P.B., Tilman, D., Isbell, F., Mueller, K., Hobbie, S.E., Flynn, D.F.B., Eisenhauer, N.,2012. Impacts of biodiversity loss escalate through time as redundancy fades.Science 336, 589–592.
Roff, G., Mumby, P.J., 2012. Global disparity in the resilience of coral reefs. TrendsEcol. Evol. 27, 404–413.
Russ, G.R., Alcala, A.C., Maypa, A.P., Calumpong, H.P., White, A.T., 2004. Marinereserve benefits local fisheries. Ecol. Appl. 14, 597–606.
Sainsbury, K., Sumaila, U.R., 2003. Incorporating ecosystem objectives intomanagement of sustainable marine fisheries, including ‘best practice’reference points and use of marine protected areas. In: Sinclair, M.,Valdimarson, G. (Eds.), Responsible Fisheries in the Marine Ecosystem. CABInternational, UK, pp. 343–361.
Stachowicz, J.J., Bruno, J.F., Duffy, J.E., 2007. Understanding the effects of marinebiodiversity on communities and ecosystems. Annu. Rev. Ecol. Syst. 38, 739–766.
Stallings, C.D., 2008. Indirect effects of an exploited predator on recruitment ofcoral-reef fishes. Ecology 89, 2090–2095.
Stevens, R.D., Cox, S.B., Strauss, R.E., Willing, M.R., 2003. Patterns of functionaldiversity across an extensive environmental gradient: vertebrate consumers,hidden treatments and latitudinal trends. Ecol. Lett. 6, 1099–1108.
Stevenson, C., Katz, L.S., Micheli, F., Block, B., Heiman, K.W., Perle, C., et al., 2007.High apex predator biomass on remote Pacific islands. Coral Reefs 26, 47–51.
Villeger, S., Ramos Miranda, J., Flores Hernandez, D., Mouillot, D., 2010. Contrastingchanges in taxonomic vs. functional diversity of tropical fish communities afterhabitat degradation. Ecol. Appl. 20, 1512–1522.
Walker, B., 1992. Biological diversity and ecological redundancy. Conserv. Biol. 6,18–23.
Willems, E.P., Hill, R.A., 2009. Predator-specific landscapes of fear and resourcedistribution: effects on spatial range use. Ecology 90, 546–555.
Worm, B., Barbier, E.B., Beaumont, N., Duffy, J.E., Folke, C., Halpern, B.S., et al., 2006.Impacts of biodiversity loss on ocean ecosystem services. Science 314, 787–790.
194 F. Micheli et al. / Biological Conservation 171 (2014) 186–194


