Embed Size (px)
Citation preview
L Trophic Interactions in Caribbean Coral Reefs
Silvia Opitz s /
INTERNATIONAL CENTER FOR LIVING AQUATIC RESOURCES MANAGEMENT
Trophic Interactions in Caribbean Coral Reefs APR 14 19B7
Published by the International Center for Living Aquatic Resources Management, MCPO Box 2631, 0718 Makati City, Philippines.
Printed in Manila, Philippines
Opitz, S. 1996. Trophic interactions in Caribbean coral reefs. I LARM Tech. Rep. 43, 341 p. $
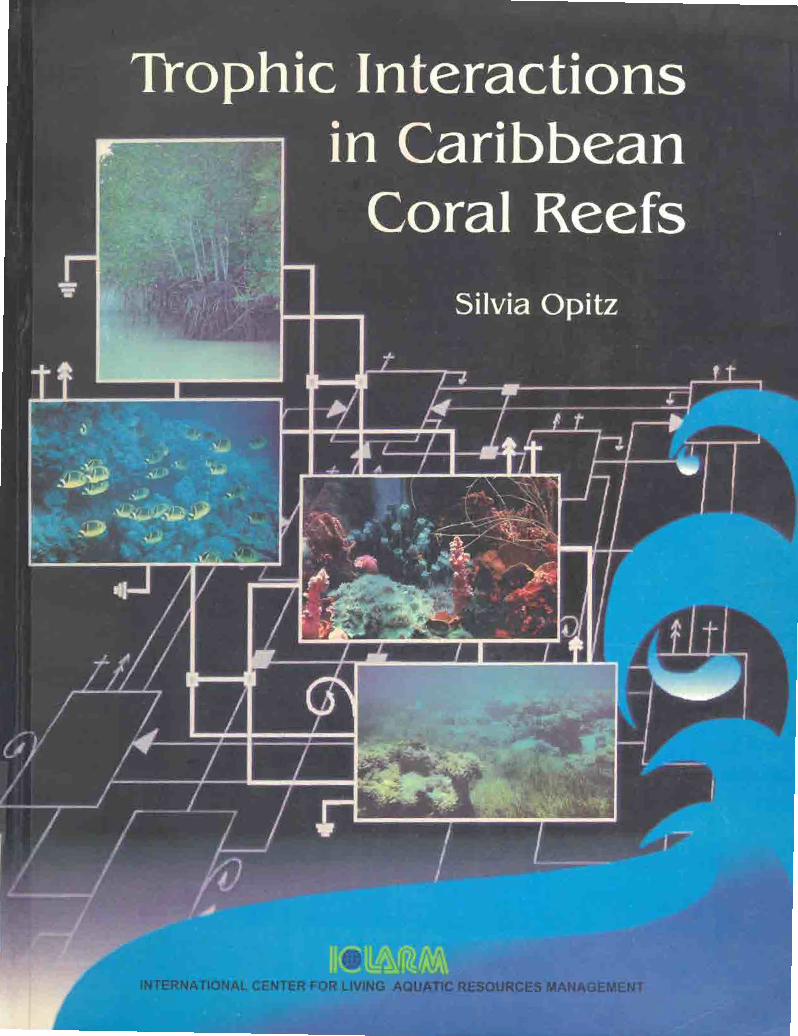
Cover: Design emphasizes the systematic properties of coral reefs (central insert), inhabited by a variety of fishes (insert, left below), and often connected to other equally productive and equally threatened ecosystems, mangroves (insert, upper left) and seagrasses (insert, lower right). The wave at the lower right side symbolizes how the Sea interconnects these elements, also connected in the models (background diagram).
Copyediting by: Marie Sol M. Sadorra Proofreading by: Marie Sol M. Sadorra, Cecille Legazpi, Francisco Torres, Jr.
and Jessica A. Moya Layout by: Ariel C. Aquisap, Albert B. Contemprate and Ovidio F. Espiritu, Jr. Cover concept by: Silvia Opitz Cover design by: Alan Siegfried Esquillon Illustrations by: Albert B. Contemprate and Ovidio F. Espiritu, Jr.
ISSN 011 5-5547 ISBN 971 -8709-60-6
ICLARM Contribution No. 1085
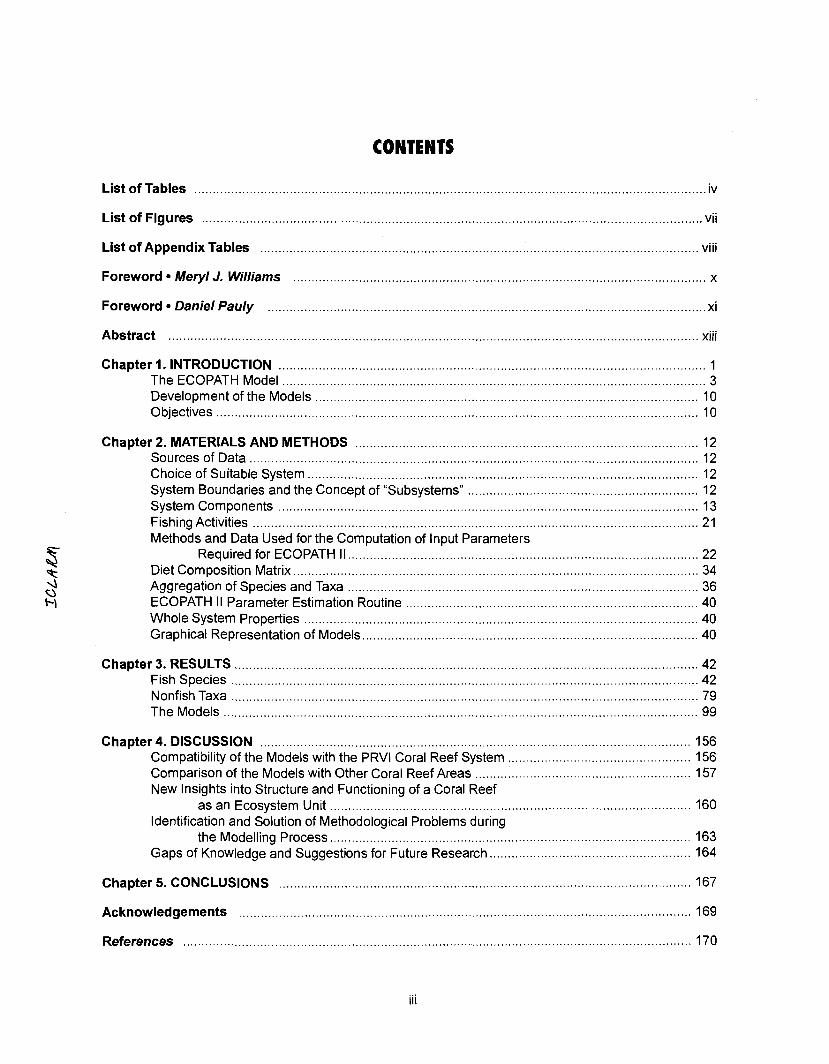
CONTENTS
List of Tables ............................................................................................................................................ iv
List of Figures ......................................................................................................................................... vii
... List of Appendix Tables ........................................................................................................................ VIII
. . Foreword Meryl J . W~llrams ................................................................................................................. x
Foreword Daniel Pauly ........................................................................................................................ xi
... Abstract ............................................................................................................................................... XIII
Chapter 1 . INTRODUCTION ..................................................................................................................... 1 The ECOPATH Model ................................................................................................................ 3 Development of the Models ...................................................................................................... 10 Objectives .................................................................................................................................. 10
Chapter 2 . MATERIALS AND METHODS ............................................................................................. 12 Sources of Data ........................................................................................................................... 12 Choice of Suitable System ........................................................................................................... 12 System Boundaries and the Concept of "Subsystems" ............................................................... 12 System Components ................................................................................................................... 13 Fishing Activities ................................................................................................................... 21 Methods and Data Used for the Computation of Input Parameters
Required for ECOPATH 11 ................................................................................................ 22 . . Diet Compos~t~on Matrix ............................................................................................................... 34 Aggregation of Species and Taxa .......................................................................................... 36 ECOPATH II Parameter Estimation Routine ................................................................................ 40 Whole System Properties ............................................................................................................ 40 Graphical Representation of Models ............................................................................................ 40
Chapter 3 . RESULTS ........................................................................................................................... 42 Fish Species ................................................................................................................................ 42
............................................................................................................................ Nonfish Taxa 79 The Models .................................................................................................................................. 99
.................................................................................................................... Chapter 4 . DISCUSSION 156 Compatibility of the Models with the PRVl Coral Reef System ................................................. 156 Comparison of the Models with Other Coral Reef Areas ...................................................... 157 New Insights into Structure and Functioning of a Coral Reef
................................................................................................ as an Ecosystem Unit 160 Identification and Solution of Methodological Problems during
the Modelling Process ................................................................................................... 163 Gaps of Knowledge and Suggestions for Future Research ....................................................... 164
Chapter 5 . CONCLUSIONS ................................................................................................................. 167
Acknowledgements ............................................................................................................................ 169
........................................................................................................................................... References 170
iii
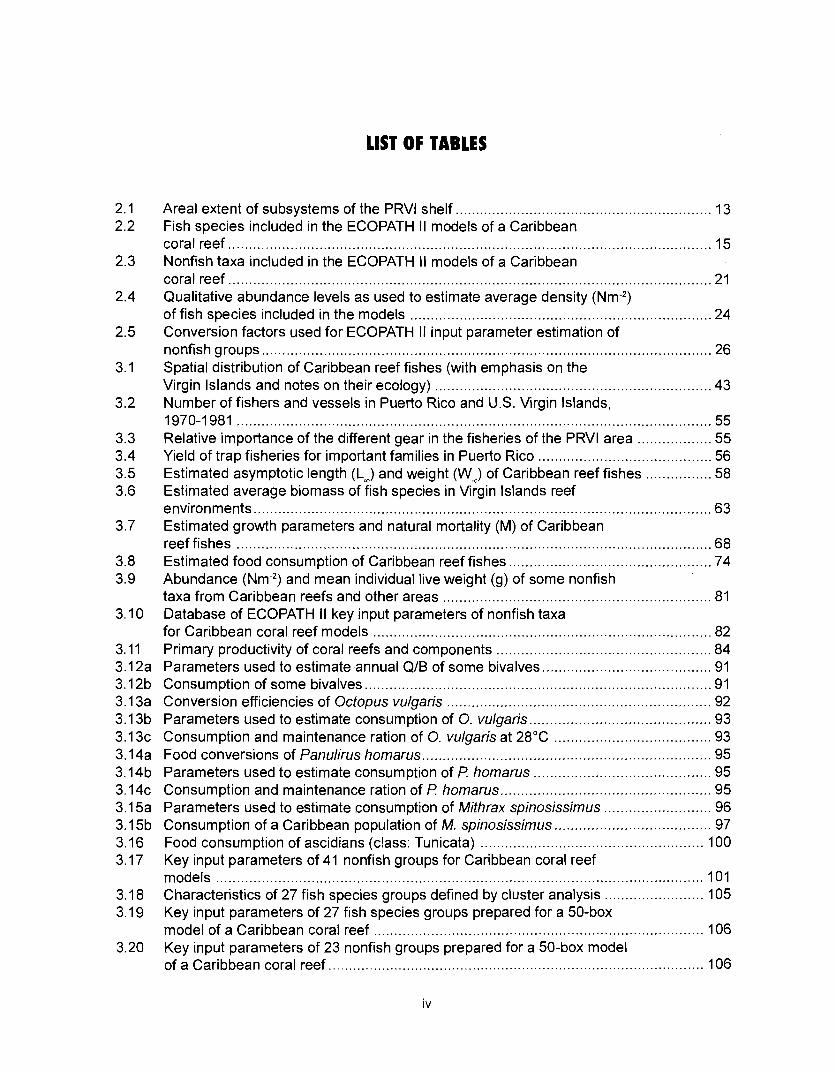
LIST OF TABLES
Areal extent of subsystems of the PRVl shelf .............................................................. 13 Fish species included in the ECOPATH II models of a Caribbean coral reef ..................................................................................................................... 15 Nonfish taxa included in the ECOPATH II models of a Caribbean coral reef ..................................................................................................................... 21 Qualitative abundance levels as used to estimate average density (Nm-2) of fish species included in the models ......................................................................... 24 Conversion factors used for ECOPATH II input parameter estimation of nonfish groups ............................................................................................................. 26 Spatial distribution of Caribbean reef fishes (with emphasis on the Virgin Islands and notes on their ecology) ................................................................... 43 Number of fishers and vessels in Puerto Rico and U.S. Virgin Islands, 1970-1 981 ................................................................................................................... 55 Relative importance of the different gear in the fisheries of the PRVl area .................. 55 Yield of trap fisheries for important families in Puerto Rico .......................................... 56 Estimated asymptotic length (L, ) and weight (Wm) of Caribbean reef fishes ................ 58 Estimated average biomass of fish species in Virgin Islands reef environments ............................................................................................................... 63 Estimated growth parameters and natural mortality (M) of Caribbean reef fishes ................................................................................................................... 68 Estimated food consumption of Caribbean reef fishes ................................................. 74 Abundance (Nm-2) and mean individual live weight (g) of some nonfish taxa from Caribbean reefs and other areas ................................................................. 81 Database of ECOPATH II key input parameters of nonfish taxa for Caribbean coral reef models .................................................................................. 82 Primary productivity of coral reefs and components .................................................... 84 Parameters used to estimate annual Q/B of some bivalves ......................................... 91 Consumption of some bivalves .................................................................................... 91 Conversion efficiencies of Octopus vulgaris .............................................................. 92 Parameters used to estimate consumption of 0 . vulgaris ............................................ 93 Consumption and maintenance ration of 0 . vulgaris at 28°C ...................................... 93 Food conversions of Panulirus homarus ...................................................................... 95 Parameters used to estimate consumption of P homarus ........................................... 95 Consumption and maintenance ration of P homarus ................................................... 95 Parameters used to estimate consumption of Mithrax spinosissimus .......................... 96 Consumption of a Caribbean population of M . spinosissimus ...................................... 97
...................................................... Food consumption of ascidians (class: Tunicata) 100 Key input parameters of 41 nonfish groups for Caribbean coral reef
...................................................................................................................... models 101 Characteristics of 27 fish species groups defined by cluster analysis ........................ 105 Key input parameters of 27 fish species groups prepared for a 50-box model of a Caribbean coral reef ................................................................................ 106 Key input parameters of 23 nonfish groups prepared for a 50-box model
........................................................................................... of a Caribbean coral reef 106
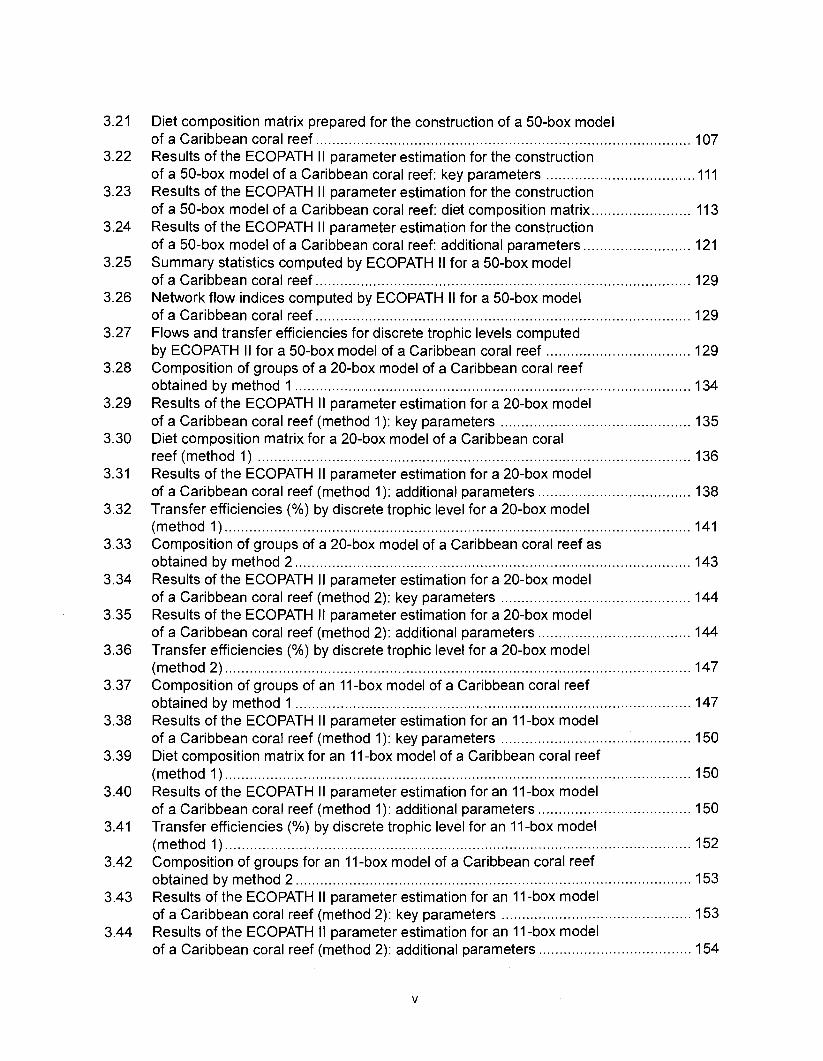
Diet composition matrix prepared for the construction of a 50-box model of a Caribbean coral reef ........................................................................................... 107 Results of the ECOPATH II parameter estimation for the construction of a 50-box model of a Caribbean coral reef: key parameters .................................... 111 Results of the ECOPATH II parameter estimation for the construction of a 50-box model of a Caribbean coral reef: diet composition matrix ........................ 113 Results of the ECOPATH II parameter estimation for the construction of a 50-box model of a Caribbean coral reef: additional parameters .......................... 121 Summary statistics computed by ECOPATH II for a 50-box model of a Caribbean coral reef ........................................................................................... 129 Network flow indices computed by ECOPATH I1 for a 50-box model of a Caribbean coral reef ........................................................................................... 129 Flows and transfer efficiencies for discrete trophic levels computed by ECOPATH II for a 50-box model of a Caribbean coral reef ................................... 129 Composition of groups of a 20-box model of a Caribbean coral reef obtained by method 1 ................................................................................................ 134 Results of the ECOPATH II parameter estimation for a 20-box model of a Caribbean coral reef (method 1): key parameters ........................................ 135 Diet composition matrix for a 20-box model of a Caribbean coral reef (method 1) ......................................................................................................... 136 Results of the ECOPATH II parameter estimation for a 20-box model of a Caribbean coral reef (method 1): additional parameters ..................................... 138 Transfer efficiencies (%) by discrete trophic level for a 20-box model (method 1) ................................................................................................................. 141 Composition of groups of a 20-box model of a Caribbean coral reef as obtained by method 2 ................................................................................................ 143 Results of the ECOPATH II parameter estimation for a 20-box model of a Caribbean coral reef (method 2): key parameters ........................................... 144 Results of the ECOPATH I1 parameter estimation for a 20-box model of a Caribbean coral reef (method 2): additional parameters ..................................... 144 Transfer efficiencies (%) by discrete trophic level for a 20-box model (method 2) ................................................................................................................. 147 Composition of groups of an I l -box model of a Caribbean coral reef obtained by method 1 ............................................................................................... 147 Results of the ECOPATH II parameter estimation for an I I -box model of a Caribbean coral reef (method 1): key parameters .............................................. 150 Diet composition matrix for an I I -box model of a Caribbean coral reef (method 1) ................................................................................................................. 150 Results of the ECOPATH II parameter estimation for an I I -box model
..................................... of a Caribbean coral reef (method 1): additional parameters 150 Transfer efficiencies (%) by discrete trophic level for an I I -box model
................................................................................................................. (method 1) 152 Composition of groups for an I l-box model of a Caribbean coral reef obtained by method 2 ................................................................................................ 153 Results of the ECOPATH II parameter estimation for an I I -box model
.............................................. of a Caribbean coral reef (method 2): key parameters 153 Results of the ECOPATH I1 parameter estimation for an I l -box model of a Caribbean coral reef (method 2): additional parameters ..................................... 154
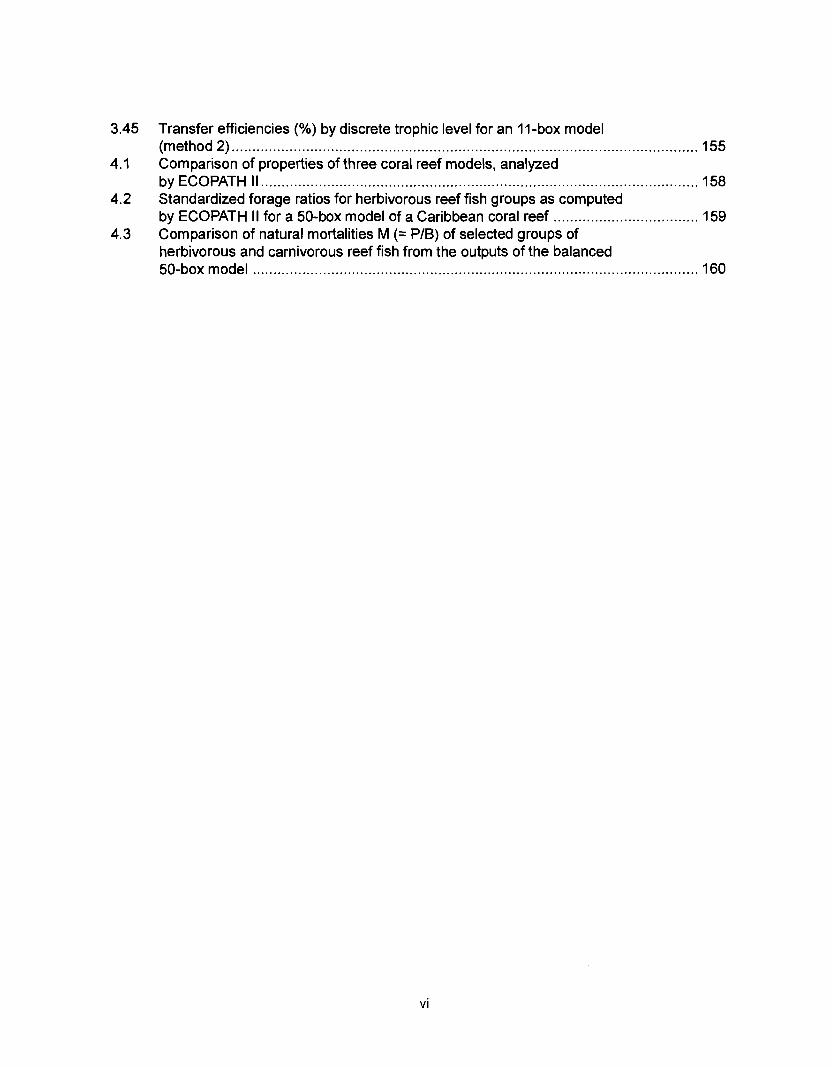
3.45 Transfer efficiencies (%) by discrete trophic level for an 11-box model ................................................................................................................. (method 2) 155
4.1 Comparison of properties of three coral reef models. analyzed by ECOPATH II .......................................................................................................... 158
4.2 Standardized forage ratios for herbivorous reef fish groups as computed by ECOPATH II for a 50-box model of a Caribbean coral reef ................................... 159
4.3 Comparison of natural mortalities M (= PIB) of selected groups of herbivorous and carnivorous reef fish from the outputs of the balanced
............................................................................................................ 50-box model 160
Flow chart showing development and construction of five steady-state models of a Caribbean coral reef ................................................................................. 11 Diagram of conceptual subsystems included in the models ......................................... 13 Schematic representation of method to estimate the aspect ratio of the caudal fin of fish. given height and surface area .......................................................... 33 Results of the factor analysis; relation between asymptotic weight (factor 1) and aspect ratio (factor 2) ........................................................................................... 37 Graphical representation of the results of the cluster analysis showing the reduction from 243 to 1 fish species group .......................................................... 102 Graphical representation of the 50-box model of a Caribbean coral reef ................... 128 Mixed trophic impacts of a 50-box model of a Caribbean coral reef .......................... 130 Graphical representation of the results of the ECOPATH II aggregation routine showing the stepwise reduction of the number of boxes from 50 to 1 for models of a Caribbean coral reef ..................................................... 132 Graphical representation of a 20-box model as obtained by method 1 ...................... 140 Mixed trophic impacts of a 20-box model (method 1) ................................................ 142 Graphical representation of a 20-box model as obtained by method 2 ...................... 145 Mixed trophic impacts of a 20-box model (method 2) ................................................ 148 Graphical representation of an I I -box model as obtained by method 1 ..................... 151 Mixed trophic impacts of an 11-box model (method 1) ............................................... 152
..................... Graphical representation of an 11-box model as obtained by method 2 154 Mixed trophic impacts of an I I -box model (method 2) ............................................... 155 Leslie plots for reef eels and bluehead wrasses from an isolated Bahamian reef patch. with estimates of unexploited population size .......................................... 157
Length-weight data of Caribbean reef fishes after Beebe ................................................................................................... and Tee-Van (1 928) 189
Length-weight data of Caribbean reef fishes after Randall .................................................................................................... (1 962, 1967, 1968) 192
Length-weight data of Caribbean reef fishes after Smith ........................................................................................................ and Tyler (1 972) 197
Length-weight data of fishes from the southeastern Atlantic coast of Brazil after Figuereido and Menezes (1977) .......................................................... 200 Length-weight data of Caribbean reef fishes after FA0 species identification sheets (Fischer 1978) ....................................................................... 202 Length-weight data of Caribbean reef fishes after Munro (1983) ............................... 206 Density (ind.m-3) and crop (gm-3) of fishes of a coral reef in the US Virgin Islands after Smith and Tyler (1972) .......................................................... 208 Aspect ratio (A) of Caribbean reef fishes based on drawings
................................................ in Fischer (1 978) and photographs in Randall (1 968) 21 0 Food consumption of Caribbean reef fishes (without accounting
............................................................................................................. for omnivory) 21 5 Benthic primary producers in fish stomachs of West lndian reef fishes
........................................................................................... (based on Randall 1967) 21 6 Invertebrates in stomachs of West lndian reef fishes (based on Randall 1967) ........................................................................................... 21 9 Composition of "zooplankton" in the diet composition matrix of a Caribbean coral reef (US Virgin Islands, based on Randall 1967) ...................... 228 Taxa and species included in the diet composition matrix of the ECOPATH I1 models of a Caribbean coral reef .......................................................... 229 The complete diet composition matrix for the construction of steady-state models of a Caribbean coral reef area, including
......................................................................... 41 nonfish taxa and 208 fish species 233 Summary of publications used for the construction of the diet composition matrix of nonfish taxa ............................................................................ 307 Characteristics of 27 fish species groups (extended version) .................................... 309 Food intake and electivity indices for a 50-box model of a Caribbean
................................................................................................................... coral reef 314 Food intake and electivity indices for a 20-box model of a Caribbean
................................................................................................. coral reef (method 1) 326 Food intake and electivity indices for a 20-box model of a Caribbean
................................................................................................. coral reef (method 2) 330 Food intake and electivity indices for an 11-box model of a Caribbean
................................................................................................. coral reef (method 1) 334 Food intake and electivity indices for an 11-box model of a Caribbean
................................................................................................. coral reef (method 2) 336 Summary statistics for a 20-box model of a Caribbean coral reef
................................................................................................................. (method 1) 338 Network flow indices for a 20-box model of a Caribbean coral reef
................................................................................................................. (method 1) 338
8.9.3 Flows and transfer efficiencies for discrete trophic levels of a 20-box model (method 1) ................................................................................... 338
8.9.4 Summary statistics for a 20-box model of a Caribbean coral reef (method 2) ................................................................................................................. 339
8.9.5 Network flow indices for a 20-box model of a Caribbean coral reef (method 2) ................................................................................................................. 339
8.9.6 Flows and transfer efficiencies for discrete trophic levels of a 20-box model (method 2) ...................................................................................................... 339
8.9.7 Summary statistics for an 11-box model of a Caribbean coral reef (method 1) ................................................................................................................. 339
8.9.8 Network flow indices for an 11-box model of a Caribbean coral reef (method 1) ................................................................................................................. 340
8.9.9 Flows and transfer efficiencies for discrete trophic levels of an 11-box model (method 1) ...................................................................................................... 340
8.9.10 Summary statistics for an I I -box model of a Caribbean coral reef (method 2) ................................................................................................................. 340
8.9.11 Network flow indices for an 11-box model of a Caribbean coral reef (method 2) ................................................................................................................. 340
8.9.12 Flows and transfer efficiencies for discrete trophic levels of an I I -box model (method 2) .................................................................................. 341
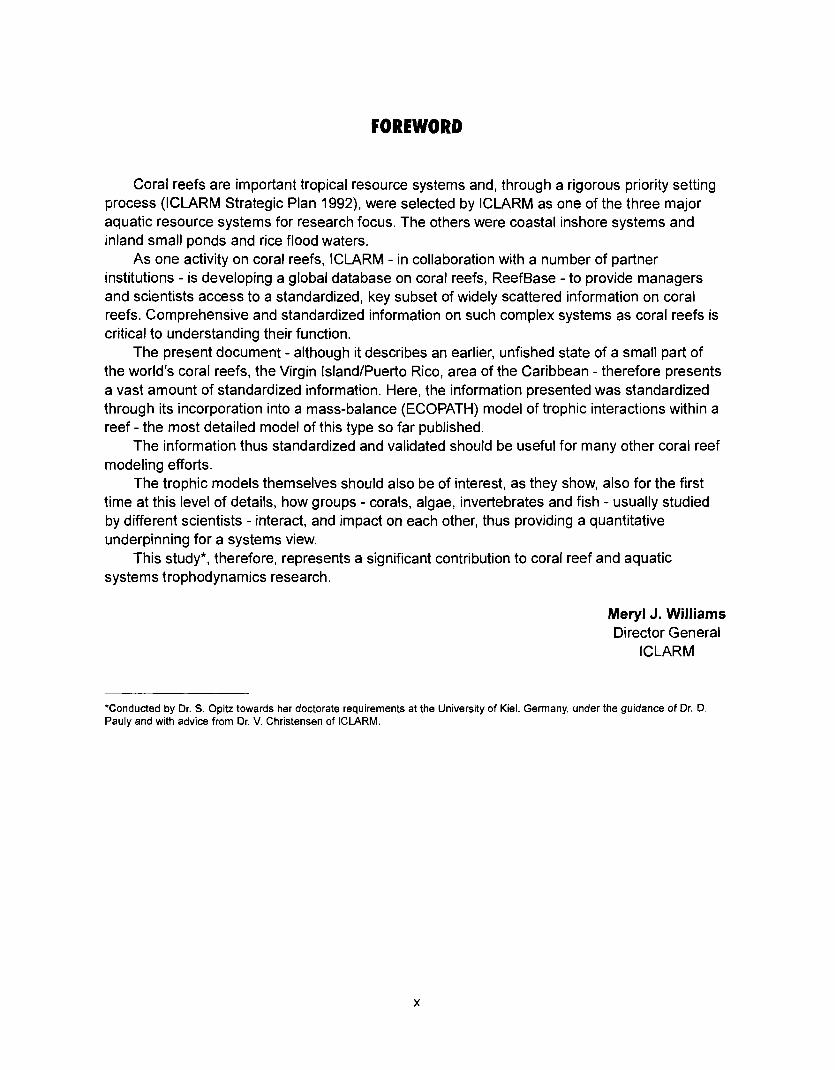
Coral reefs are important tropical resource systems and, through a rigorous priority setting process (ICLARM Strategic Plan 1992), were selected by ICLARM as one of the three major aquatic resource systems for research focus. The others were coastal inshore systems and inland small ponds and rice flood waters.
As one activity on coral reefs, ICLARM - in collaboration with a number of partner institutions - is developing a global database on coral reefs, ReefBase - to provide managers and scientists access to a standardized, key subset of widely scattered information on coral reefs. Comprehensive and standardized information on such complex systems as coral reefs is critical to understanding their function.
The present document - although it describes an earlier, unfished state of a small part of the world's coral reefs, the Virgin IslandIPuerto Rico, area of the Caribbean - therefore presents a vast amount of standardized information. Here, the information presented was standardized through its incorporation into a mass-balance (ECOPATH) model of trophic interactions within a reef - the most detailed model of this type so far published.
The information thus standardized and validated should be useful for many other coral reef modeling efforts.
The trophic models themselves should also be of interest, as they show, also for the first time at this level of details, how groups - corals, algae, invertebrates and fish - usually studied by different scientists - interact, and impact on each other, thus providing a quantitative underpinning for a systems view.
This study*, therefore, represents a significant contribution to coral reef and aquatic systems trophodynamics research.
Meryl J. Williams Director General
ICLARM
*Conducted by Dr. S. Opitz towards her doctorate requirements at the University of Kiel, Germany, under the guidance of Dr. D. Pauly and with advice from Dr. V. Christensen of ICLARM.
The work before you is the most detailed account ever published of the energy fluxes within a coral reef ecosystem - and I am well aware that this is a strong claim to make in view of the enormous research effort which has been devoted to coral reefs to date, and of the enormous literature which presents the results of this effort.
Upon perusing that literature, however, it quickly becomes clear that only a small fraction deals with the energetics of more than two species at a time: the bulk of published coral reef studies deals with the dynamics or trophic biology of either one species, or the interactions between two species.
Studies referring to ensembles of coral reef species obviously do exist as well but they tend to concentrate on the definition, identity and maintenance of the "communities" formed by coral reef species, with little attention devoted to their energetics: few coral reef researchers followed the path opened by the pioneering study of the metabolism of Eniwetak lagoon, published in 1955 by the Odum brothers.
One reason for this may be the lack of a straightforward tool for integrating scattered knowledge on the interactive elements of coral reef ecosystems: simulation modeling, e.g., as brilliantly applied by T.R. McClanahan to coral reef systems, requires formal skills possessed by only few biologists potentially interested in using a formal modeling framework.
This situation changed in the mid-1 980s, when J.J. Polovina and coworkers developed the ECOPATH approach and software, and applied this to the description of a coral reef system in the Northern Hawaiian Island, the French Frigate Shoals. This approach, fully described in the present work, does not need restating here. Suffice to say that, while based on a simple "Master Equation" with parameters that are relatively easy to estimate, it allows incorporation, into a formal framework, of the immense amount of single-species data, and on data on species interactions alluded to above.
The creators of this approach - J. Polovina and colleagues for the initial version, V. Christensen and this author for its vastly expanded successor ECOPATH II - earlier attributed the versatility of the ECOPATH approach to the "steady-state1' or "equilibrium" assumption that seemed to underlie its Master Equation.
However, this assumption is not necessary for the ECOPATH approach to work. Rather, what is needed is mass-balance, i.e., one must not only be able to account for all flows of biomass among the different elements of an ecosystem, during the period being modeled (usually one year), but one should also account for any difference in biomass that may occur between the beginning and the end of that period.
Equilibrium or steady-state implies. that this difference should be zero - a problem when the system being modeled is known to display interannual changes of biomass. However, recent changes incorporated on the Windows version of ECOPATH (ECOPATH 3.0) not only allow considering between-year changes of biomass (through a term for "biomass accumulated", added to the Master Equation), but also explicitly consider seasonal changes of all biomass and fluxes during an annual production cycle.
These features, along with the explicit consideration of uncertainty on the input values (accommodated through a Monte-Carlo simulation, whose output can be interpreted in a Bayesian context), have given the ECOPATH approach dynamic features that were lacking when Dr. Opitz began the work which led to this document.
The fact that Dr. Opitz could assemble as many biomass and rate estimates as she did, and then establish mass-balance in her models -without recourse to the routines recently developed to assist users of the ECOPATH software - speaks for the depth of understanding she achieved of the energetics of Caribbean coral reef systems, and of the biology of their components.
Indeed, I assume that many future models of coral reef systems -whether constructed using the ECOPATH approach or not -will rely on the biomass and rate estimates obtained by Dr. Opitz, and validated by their "fit" to her model.
I conclude, thus, by congratulating Dr. Opitz for a work destined to be found, much thumbed, on the desk of every would-be modeler of coral reef ecosystems.
Daniel Pauly Principal Science Adviser
ICLARM ManilaNancouver
Five thermodynamically balanced models of the trophic interactions and organic matter transfer between compartments of a Caribbean coral reef system are presented. Inputs to the models were obtained from published data and from parameter estimates based on multivariate statistics. The models were analyzed using the ECOPATH II program (Version 1 .O) of Daniel Pauly, Villy Christensen and coworkers at the International Center for Living Aquatic Resources Management (ICLARM) (in Manila, Philippines) which combines elements of network flow analysis with the steady-state approach of Jeffrey Polovina's original ECOPATH. A single model with 50 boxes, 2 models with 20 boxes and 2 with 11 boxes were constructed, based on two different methods of aggregation. Their features were compared.
These balanced models indicate that coral reef systems are in a "steady-state" or "flow- through equilibrium", when the appropriate spatial and temporal scale is selected. This implies that investigations on reef community structure which relied on a small spatial scale, and which suggest a high degree of stochastic variability may not address issues related to the stability of structures at larger scales.
The models' outputs indicate the existence of short cycles, effectively recycling organic matter within the reef system, with the larger part of net primary production being recycled directly to the detrital pool. Thus, transfer efficiencies between trophic levels are generally low.
Selected outputs of the models were compared with features of the original coral reef system, i.e., unfished segments of the Puerto Rico - Virgin Islands (PRVI) coral reef area and were found to be compatible.
Summary statistics of the models were compared with those of two other coral reefs also modelled using ECOPATH II. The models presented here refer to a large system in terms of biomass and throughput, compared to French Frigate Shoals, Hawaii, and to Bolinao, Philippines. These statistics indicate an intermediate stage of system maturity when compared to the other two systems. Features of the modelled system (degree of piscivory, avoidance, by piscivorous fish, of larger herbivorous reef fish as prey, sediment production by parrotfish) were compared with those of other coral reef systems and were found to be compatible.
A potential fisheries yield of 4 gm-2year1 for unfished segments of the PRVl reef area was estimated from the models' outputs. Present overexploitation of lobsters and conchs in the PRVl area may in part be explained by the strong predation pressure already exerted on these resources in the unexploited system as indicated by the high ecotrophic efficiencies of crustaceans and gastropods.
Possible solutions could be developed or suggested for several methodological problems identified during the modelling process. Also, worthwhile areas of future theoretical and field research were identified:
1. A large number of fish species can effectively be reduced to fewer groups by cluster analysis. Appropriate aggregation parameters are those referring to energetic requirements of a species such as size, activity level and type of food.
2. The impact of predator abundance on predation pressure may be accounted for by introdtrcing a weighting factor, which should be the product of density, mean weight and relative food requirements of a predator.
xiii
3. Density estimates from visual censuses, especially for migrating species, such as apex predators, should be divided by the time an individual fish was actually seen during the census. This would lead to more realistic values of "effective" biomass, i.e., a biomass which is related to the carrying capacity of the reef system for this species.
4. Density estimates for small and/or cryptic reef species should be obtained from repeated rotenone or similar samplings.
5. Density estimates for small schooling pelagics are urgently needed and may be obtained by hydroacoustic methods.
6. For the construction of nonfish groups one should, as was done for fishes, start from the species level and define appropriate energetic aggregation criteria by objective selection of ecological variables.
7. For future models, it will be a worthwhile theoretical task to identify objective criteria for the determination of spatial and temporal scales of the system which is to be modelled, to define appropriate system boundaries.
8. More information on diet, food consumption requirements, abundances and growth performance should be obtained for nonfish taxa in the PRVl reef area. This could strongly improve the reliability of the models' output.
9. Information on length-weight data and growth parameters for fish species without interest for fisheries (e.g., very small ones) are needed as well as catch data on a species level or for ecological guilds, i.e., on a generic or family level, for the PRVl reef area.
xiv
All kinds of superlatives have been used to describe the ecosystem "coral reef", the most famous being "the oasis in the desert", which is related to the high production rates often measured for components of the coral reef community compared to rates measured in the nutrient-poor water masses surrounding coral reefs (Polovina 1984b).
There is general agreement that coral reefs are characterized by three main features: (1) high species diversity; (2) pronounced complexity of relationships within the system community; and (3) high rates of production in usually nutrient- and plankton-poor oceanic waters (see Lewis 1981).
It is hypothesized here that coral reefs can survive under such unfavorable conditions mainly because these three features are interconnected, resulting in an effective recycling and conservation of organic matter within the system. This hypothesis is based on small-scale observations such as the symbiosis between the coral polyps and their symbionts, the "zooxanthellae". Whether this hypothesis applies to an entire coral reef ecosystem unit is, to date, not known. There is further disagreement on the question whether coral reefs may be considered to be in a steady-state, i.e., whether import plus consumption are balanced by production plus respiration for the entire system.
The main objective of this report was to test whether it is possible to construct a thermodynamically balanced model of a Caribbean coral reef system, the assumption being that if such model could be constructed, this would indicate that the coral reef system in question can indeed be considered as being in some form of steady state.
A Caribbean coral reef area was selected as study site for a modelling effort because I became enthralled by these beautiful ecosystems since I have "dived" Caribbean coral reefs in 198311 984. Another reason was that several Caribbean reef areas have been studied in such detail that enough input data appeared to exist for the creation of a model representative of the larger Caribbean area. My choice of a model of a Caribbean coral reef as a research topic was also influenced by the consideration that tools for proper management of coral reef systems, especially of fisheries resources, are urgently needed.
The whole system approach seems very promising, since it will provide information for conservationists with a holistic claim as well as for fisheries managers concerned with fisheries yields from a small number of target species. Several of these commercially interesting species are already heavily exploited and some show declines in catchleffort although they are reported to be only lightly exploited. Munro (1 984), in an unpublished report to the Caribbean Fisheries Management Council (CFMC) "on assessment of the fisheries of Puerto Rico and the U.S. Virgin Islands", attempted to find out why "the reported landings for the Virgin Islands only amount to 5%-13% of the 'norm' (for other Caribbean reef areas) of 5 tonnes km-2". He concluded that "either the landings are greatly underestimated or the fisheries are rather lightly exploited or both". In contrast to this statement, fisheries statistics in CFMC (1984, 1985) showed a decline in landings for target fish species in the Puerto Rico - Virgin Islands (PRVI)
area, and contributions in Mahon (1987) reported on the overexploitation of target invertebrates (conchs, lobsters) along with an increasing fishing effort for the same area.
The lack of appropriate data for proper stock assessment is emphasized regularly throughout the relevant literature (see e.g., Munro 1984; Mahon 1987; PDT 1990). Many unpublished reports of investigations and surveys lead a poor life in shelves or drawers; the more lucky ones are distributed through the person-to-person method. Thus, there is a need to pool, check and quantify data scattered over a wide range of formal and informal documentation. The construction of a model is an excellent reason for such compilatory work. By logical combination of the elements of a system, one may obtain new insights in its functioning as a whole and in that of its elements as well.
Holistic steady-state models, in contrast to simulation models, can be parameterized with relatively small expenditure in input data while they may, at the same time, correctly describe properties of the system being modelled (Silvert 1981). In spite of their "simplicity", these models may reflect relevant structures of the system and contribute to its understanding; simultaneously, they may indicate gaps of knowledge and thus identify areas of future practical research. According to Silvert (1 981), the "complexity of a model is not in itself a criterion of its quality. The degree of complexity is determined chiefly by its function and the observations it is supposed to describe, not by the internal structure of the system" that is being modelled.
Leontief (1951) developed economic input-output analysis aiming to quantify the amount of raw materials and industrial services required to produce a quantity of consumer goods. Augustinovics (1 970) later worked out an inverse analysis where the fate of system inputs is traced to their destination through the economic flow diagram. Hannon (1 973) and Finn (1 976) were the first to apply these techniques to biological systems.
Network analysis today provides tools for unifying the concepts of food chains, food webs, species richness, diversity, etc., by depicting ecosystems as number of compartments, interconnected by flows of energy or matter from one compartment to another. Wulff et al. (1989) believed that "network flow analysis contains a lot of information about the dynamic structure of a whole system and how it functions1'.
Network analysis today includes analysis of cycles, through-flows, storages and information theory. Finn (1976) developed an index showing the proportion of the flow in a system that is recycled, relative to total flow. The magnitude of this "cycling index" depends to some extent on the substance used as currency (biomass, carbon, nitrogen, phosphorus, etc.). Ulanowicz (1 980, 1986), one of the leading scientists of Working Group 59/73 of the Scientific Committee on Oceanographic Research devoted to "Mathematical Models in Biological Oceanography", (Platt et al. 1981), introduced three indices describing the state of an ecosystem: (1) Total System Throughput, the sum of all flows occurring within a system; (2) Ascendency, a measure of the mutual information content within the system; and which concerns the size of the system as well as diversity of flows; and (3) Development Capacity, a measure of the potential for growth of a system towards maturity.
In network analysis, comparison of two different elements (e.g., species) within a system may be established by defining their relative position in the food web as one plus the weighted mean trophic level of their preys. Conversely, the division of any kind of diet into compartments allows the construction of pyramids (see Lindeman 1942) representing flows and transfer efficiencies between trophic levels. This technique allows intercomparison of ecosystems or comparison of different states of a single system based on the analysis of the food web linking its components.
1 .I . The ECOPATH Model
The modelling approach used here was developed by J. J. Polovina (1 984a, l984b, l984c, 1985, 1986) and Polovina and Ow (1 983), named "ECOPATH", was originally designed to estimate standing stock and production budget of an entire coral reef ecosystem, the "French Frigate Shoals", in the Northwestern Hawaiian Islands.
ECOPATH II is derived from the original ECOPATH software. It was considerably enhanced and modified by combining the steady-state approach of the original ECOPATH with techniques derived from network analysis and information theory. ECOPATH II was designed as a tool to produce straightforward equilibrium box models for any kind of aquatic system. The development and updating of ECOPATH I1 are part of a project funded by the Danish International Development Agency (DANIDA) on "Global Comparisons of Aquatic Ecosystems", executed by Drs. Villy Christensen and Daniel Pauly at the lnternational Center for Living Aquatic Resources Management (ICLARM). Aquatic scientists, spread all around the world, are contributing to this project by applying ECOPATH II to "their" ecosystems. The present report is based on a thesis written as part of this project; therein, ECOPATH II was used to generate five quantitative steady-state models of the trophic interactions in a Caribbean coral reef.
In the following, a short comparative description is given of the theoretical background of inputs required and outputs provided by Polovina and Ow's original ECOPATH and by the ECOPATH I1 software of Pauly, Christensen and coworkers (Christensen and Pauly 1990a, 1990b; Pauly et al. 1993a). Analyses of models included here were executed with version 1.0 of ECOPATH 11. Since version 2.0 of ECOPATH II is distributed together with a comprehensive user's manual (Christensen and Pauly 1991), 1 advise the reader to consult this manual for additional information on differences between versions 1.0 and 2.0 (see also Christensen and Pauly 1992b for version 2.1 and Christensen and Pauly 1995 and 1996 for ECOPATH 3.0).
1.1. I. Comparative Description of ECOPATH I and ECOPATH I1
1.1 -1.1. POLOVINA'S ORIGINAL ECOPATH
Theoretical Background
The basic assumption of the original version of the ECOPATH model (termed here ECOPATH I) is that the ecosystem which will be modelled must be under equilibrium conditions, i.e., in a "steady-state". Polovina (1984b) stated that "equilibrium conditions exist when the mean annual biomass for each species (group) does not change from year to year. This assumption results in a system of biomass budget equations which, for each species (group), can be expressed as:
Production of biomass for species (i) - all predation on species (i) - nonpredatory biomass mortality for species (i) = 0 for all (i) ... 1.1)
The ECOPATH model expresses each term in the budget equation as a linear function of the unknown mean annual biomasses (Blls), so the resulting biomass budget equations become a system of simultaneous equations linear in the Blls." This system of equations can be
expressed in matrix form as AB = 0, where A is an n x n matrix of coefficients, and B is an n- dimensional vector.
Outputs
Outputs of ECOPATH I are: estimates of mean annual biomass, mean annual consumption and mean annual production of each species (group). Additionally, an estimate of necessary net primary production to support the system is computed which may be compared with "external" estimates to validate the model.
The inputs required by ECOPATH I (and ECOPATH II) are few compared to, e.g., simulation models. In the following, the inputs necessary to solve the system of biomass budget equations via the ECOPATH I computer program are briefly introduced.
Species Groups
Subsequent to identifying the various components of the ecosystem under study, these may be regrouped into species groups. ECOPATH I allows a maximum input of 20 species (groups). A species group is an aggregation of species with a common physical habitat, similar diet and similar life history characteristics (Polovina 198413).
Biomass
ECOPATH I is a "top-down model", i.e., the biomasses of the subordinated species (groups) are determined by the biomass (and food consumption) of the apex predator (group). When there is no fishery catch, a biomass estimate for at least one top predator (group) must be provided to produce a unique and nontrivial set of Bi's (i.e., B, > 0) which solves the system of equations. In an ecosystem where there is fishing mortality, the fish catches may be entered instead of an estimate of a species' (group's) biomass to insure a nontrivial solution.
Production/Biomass Ratio (P/B)
Polovina (1 98413, 1985) defined production (P) over one year for a cohort of animals as:
and mean annual biomass (B) for the cohort as:
where N, is the number of animals and W, the mean individual weight at time t.
Allen (1971) showed that, under equilibrium conditions, for a number of growth and mortality functions, including negative exponential mortality and "von Bertalanffy" growth, the ratio of annual production to mean biomass for a cohort of fish is equal to the annual instantaneous total mortality (Z). When mortality is expressed by a negative exponential function, total species group production (P) is equal to the sum of the production (PI) of n cohorts (or species) i with annual instantaneous total mortality (ZI).
In an ecosystem under equilibrium (i.e., under steady state) and where (when) there is very little or no fishing mortality, the PIB ratio of fishes and invertebrates is thus equal to their instantaneous rate of naturalLmortality (M) (Christensen and Pauly 1991).
Predation Mortality
Predation mortality is the fraction of the biomass of a species group which is consumed by its predator in a given ecosystem. Polovina's ECOPATH model computes this mortality in the same fashion as the PROBUB model by Laevastu and Larkins (1 981). Here, two types of information are needed:
Diet Composition Matrix
A diet composition matrix DCij must be specified, where an entry DC, from this matrix refers to the proportion of prey j in the diet of predator (or consumer) i. The primary source of this information is the analysis of consumers' stomach contents. Composition of stomach contents may be expressed in percent of total volume, weight or energy contents. Macdonald and Green (1983) showed that the estimation of diet composition is largely unaffected by the units used (volume, weight or energy); on the other hand, "numbers of items" or "occurrence" produce misleading diet compositions, due to the large difference in energy contents between small and large prey items (Pauly 1985, 1986).
Food Required
The second type of information needed to ascertain predation mortality is the food requirements of the predator. Food required (R) by a species (group) (i) is expressed as:
where Bi is the mean annual species (group) biomass, Pi is the annual production of species (group) i, and ai and bi are parameters to be estimated from energetics studies. The component biBi is the food required to maintain the biomass Biand the component aiPi is the food required to support the biomass production Pi (Laevastu and Larkins 1981).
In the original ECOPATH model, the production of species (group) i is Pi = CiBi, so the food required for species (group) Bi is
Thus, the amount of species (group) j consumed by predator species (group) i is given as:
RiDCi, = (bi + a,Ci)BiDCi, . . .I .6)
Predation mortality consumes generally between 75% and 90% of the populations' production (Ricker 1969; Polovina 1984a, 1984b); a change in predation mortality has little influence on the biomasses of species groups calculated by ECOPATH I, as was shown by Polovina (1 984c) by simple sensitivity analysis on the input parameters.
Nonpredation Mortality
All mortality attributable to causes other than predation, such as fishing, spawning and disease, is considered "nonpredation mortality".
Habitat Area
For each species (group) included in ECOPATH I, an estimate of the area of distribution for which the other input values are valid was required. This was not included in ECOPATH II as biomass and flows are easy to adjust to any standard area, without using a special software or routine.
Summary of inputs required for the original version of ECOPATH:
1. number and names of species (groups) considered in the model; 2. at least one biomass estimate of one of the apex predators or its annual fisheries catch; 3. annual fisheries catch (including discard) for all exploited species (groups), or
nonpredation mortality (diBi) when there is no fishing; 4. PIB ratio (usually Mi or Zi) for each species (group); 5. food required to support biomass production (aiPi) of each species (group); 6. food required to maintain the biomass (biBi) of each species (group); 7. diet composition DCij of each species (group); and 8. habitat area of each species (group).
1.1.1.2. ECOPATH II
Theoretical Background
ECOPATH II shares with ECOPATH I its "basic equationv (1 .I). This routine balances an equilibrium model using the mass-balance equation:
Consumption + Import = Production + Respiration
where "production" is the sum of "export + mortality due to predation + flow to detritus". Both versions of ECOPATH (I and II) are structured around the feature that, in a balanced system, the consumption of a predator (group) generates the predation mortality of its prey (groupls).
New Features and Outputs
DEFINITIONS AND PARAMETER ESTIMATION ROUTINE. In ECOPATH II, the set of simultaneous linear equations, representing an ecosystem, is solved using the "generalized inverse method1' (Mackay 1981); this has the advantage that a generalized inverse can be found even if the set of equations is overdetermined (more equations than unknowns) or underdetermined (less equations than unknowns). By linking the species groups into a combined system, the basic routines of ECOPATH I and II allow the estimation of one missing parameter (= unknown) of each species (group). In ECOPATH I, only biomass could be the unknowns, whereas other parameters may be unknown in ECOPATH II (see Christensen and Pauly 1992a, 199213 and further below).
For all consumers of the system, a request was incorporated into ECOPATH II for the percentages of ingestion that are lost due to egestion (feces) and to excretion (urine); values of 15% and 5%, respectively, are provided as defaults, based on Winberg (1 956). The entries (or defaults) are subsequently used for the computation of net conversion efficiencies (production1 [ingestion - egestion]) and of flows to the "detritus box". Detritus is derived from nonpredatory "leaks" of organic substance from any trophic level, mainly egestion, excretion and nonpredatory mortality.
ECOPATH II was provided with checks for "i's" that do not balance, i.e., for which production is larger or equal to the amount of food consumed. Gross efficiency (GE = production1consumption) should be < 0.5 for all species (groups). Ecotrophic efficiency (EE), the part of production consumed by predators, was, throughout, a required input in ECOPATH I. It is now either an input or output of ECOPATH II and is used to ascertain that the amount consumed by predators does not surpass production of a species (group). In a balanced system, EE must be 5 1 .O.
ECOPATH II calculates fractional trophic levels as suggested by Odum and Heald (1975). A routine assigns a trophic level (TL) of 1 to primary producers and detritus and a TL of I + (the weighted average of the prey's TL) to consumers.
The concept of "omnivory index" was included into ECOPATH II in 1987 (see Pauly et al. 1993a). It is calculated as the variance of the trophic levels of a consumer's prey groups. When the output value is zero, the consumers in question feed on a single discrete trophic level.
Ivlev's electivity index El (Ivlev 1961) is computed by ECOPATH II for each species (group), based on biomasses, not numbers. El is scaled so that El = -1 corresponds to total avoidance, El = 0 to nonselective feeding, and El = 1 to exclusive feeding. Since this index is not independent of prey density a further index, the "standardized forage ratio" of Chesson (1 983) was incorporated into ECOPATH II. This is independent of prey availability and initially ranged between 0 and 1, with SI = 0 representing avoidance and S,= 1 exclusive feeding. In ECOPATH II, this index has been reexpressed such that it can now range between -1 and 1, and thus allows direct comparison with Ivlev's index of electivity.
NETWORK FLOW INDICES. A routine for calculating "ascendency" was included in ECOPATH II based on Ulanowicz (1986) as modified by Ulanowicz and Norden (1990). "Ascendency" is a measure of the "average mutual information in a system1'. It is scaled by system throughput (sum of all flows) and expressed in flowbits (e.g., bit * gm-2.year1 WW). In addition to ascendency and related statistics (overhead, capacity, etc.), holistic properties of ecosystems that can be computed using ECOPATH II are total system throughput and Finn's cycling index
(Finn 1976). The theory leading to these system properties can be found in Ulanowicz (1986) and is further discussed in Christensen and Pauly (1991).
FLOWS AND TRANSFER EFFICIENCIES. Based on Lindeman (1 942), Christensen and Pauly (1 WOb) provided ECOPATH II with routines to calculate discrete trophic levels and, since an ecosystem is treated as a thermodynamical unit, to calculate flows and transfer efficiencies between trophic levels. The combination of throughput and transfer efficiency of each trophic level allows the construction of solid "trophic pyramids" (see Christensen and Pauly 1992b) representing an entire system; these pyramids can be used for intercomparison of ecosystems.
MIXED TROPHIC IMPACTS. This routine allows the computation of direct and indirect impacts which a change in biomass of a predator group will have on other groups in the system, assuming that the diet matrix remains unchanged. This routine, based on Hannon (1973) and Hannon and Joiris (1 989), may thus be viewed as a tool for sensitivity analysis.
AGGREGATION OF BOXES. The ascendency and related features of an ecosystem are affected by the number of groups by which the system is represented. An aggregation routine was included into ECOPATH I I which allows for reduction of the initial number of boxes to any desired number. This routine identifies, under the constraint of no change in throughput, the pair of "boxes" which, when pooled, least reduce the ascendency of the ecosystem. As shown in Christensen and Pauly (1992b), "pairing" of boxes generally involves groups with low throughputs (at least initially) and having similar trophic levels.
Inputs Required by ECOPATH I1
PRIMARY PRODUCTION (PP). Net primary production (NPP, in the currency of the model, here in gm-2.year1 WW) is not an input for ECOPATH I. However, this is a required input for ECOPATH II, in order to "(1) encourage users to obtain independent, i.e., "external" estimates of a parameter which closely correlates with a number of important characteristics of a system; (2) to allow for validation of internally generated NPP, which should be smaller than or equal to the "external" input value and more importantly; (3) to allow for the difference between observed (= external) and computed (= internal) NPP to be added to the detritus box and thus quantify a linkage important in virtually all ecosystems (i.e., the transfer of uningested, dead phytoplankton and algal biomass to the detrital pool, from where it becomes available to a variety of consumers and/or for burial or export" [Pauly et al. 1993al).
DETRITUS BIOMASS (D). Detritus biomass is not a required input in ECOPATH I, but is needed by ECOPATH II for various computations when detritivores are included in a system, e.g., to compute the "electivity" of detritivores for detritus.
BIOMASS AND/OR ECOTROPHIC EFFICIENCY. Ecotrophic efficiency (EE) is an input of ECOPATH I expressing the fraction of total production consumed by predators (alpI). In ECOPATH II, ecotrophic efficiency must be either entered (when biomass is unknown) or is estimated by the program (when biomass is known and was entered). In ECOPATH II, the fraction 1-EE of production is directed toward the detritus box, from which it may be exported out of the system.
EXPORT AND/OR FISHERIES CATCH (C). Export from a species (group) consists of catches and emigration or transport out of the system. Fisheries catch (andlor the quantity killed by fishing and discarded) is required for all exploited species. This input is needed for both versions of ECOPATH in a system of which some elements are exploited.
P R ~ D U C T I ~ N ~ B I ~ M A ~ ~ RATIO (PIB). The PIB ratio is an input parameter required for ECOPATH I as well as ECOPATH II. As stated above, under certain conditions, the PIB ratio of a population can be set equal to instantaneous total mortality Z (or natural mortality M for an unfished stock). The PIB ratio of primary producers can be estimated either by direct methods (oxygen production, C,,, etc.) or if those data are not available, by indirect methods, e.g., empirical equations (Lafontaine and Peters 1986; Pauly et al. 1993a). Mann (1 982) provides PIB estimates for various benthic algae and seagrasses.
FOOD CONSUMPTION PER UNIT BIOMASS (QIB). The relative food consumption of a species (group) other than primary producers is required as input parameter by both versions of ECOPATH. Pauly et al. (1993a) defined QIB as the number of times a population consumes its own weight per year. In ECOPATH I, this input corresponds to the "food required (FR)". Pauly (1 986) used the symbols "Q/Bn for cases when FR refers "to age-structured populations, i.e., when one must consider the fact that there are, in a natural, steady-state population of fish more young than old fish, and that the former eat (per unit weight) more than the latter" (Pauly et al. 1993a). Methods to calculate QIB of an age-structured population are described in the "Materials and methods" section.
DIET COMPOSITION. The diet composition (DC) is also an input required by both versions of ECOPATH. Only species (groups) occurring within the system may be part of the dieta and, at least in ECOPATH II, some species (groups) should feed on detritus, as also happens in reality.
UNASSIMILATED FOOD. Egestion and excretion refer to parts of ingestion that are not assimilated. The respective fractions can be entered as an optional input if known for a species (group). Default values of 15% and 5%, respectively, are provided by the program based on Winberg (1 956).
Summary o f Inputs Required for ECOPATH 11:
one independent estimate of net primary production (NPP); one independent estimate of detritus biomass (D); number of species (groups) considered in the model; biomass (B,) for each species group or ecotrophic efficiency (EE) when biomass is un- known; export (usually fisheries catch, including discard) for all exploited species [groups]); PIB ratio (usually MI or ZI) for each species (group); food consumption per unit biomass (QIB) for each species (group); diet composition DCij of each species (group); and optional inputs: egestion and excretion (defaults 15% and 5%); the defaults were accepted here throughout.
"In recent version of ECOPATH, consumers may also feed on "imports," i.e., items not included in the system.
1.2. Development of the Models
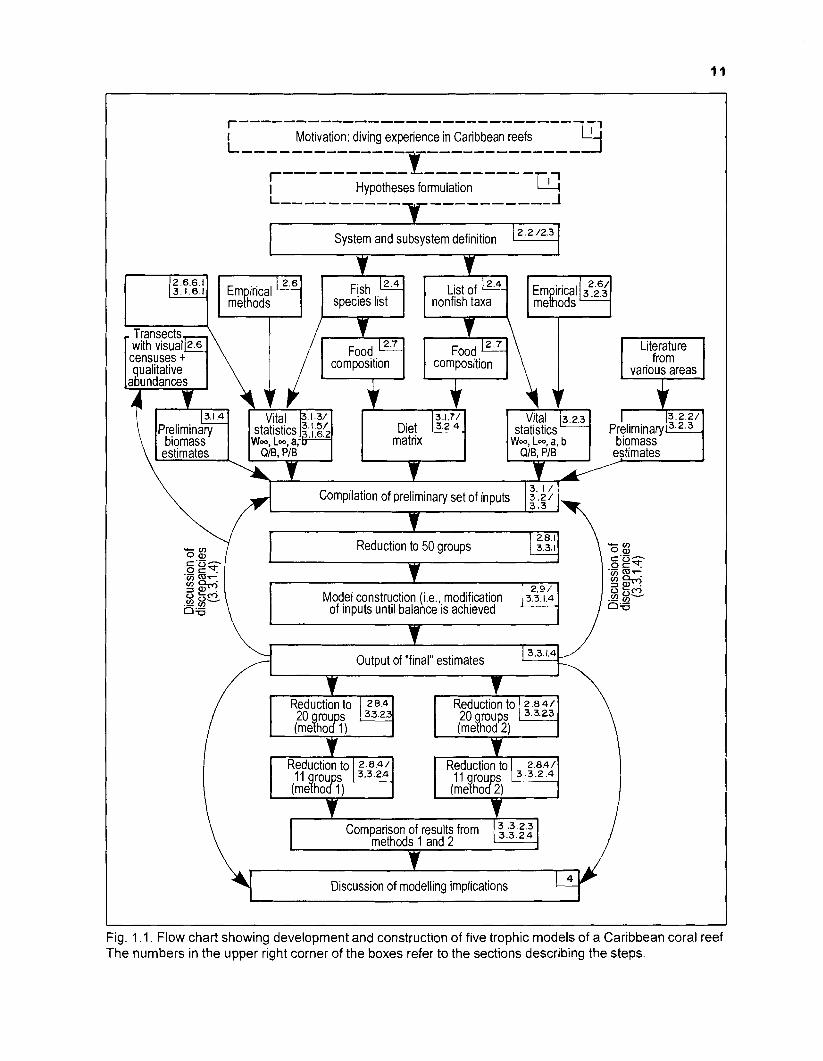
Fig. 1.1 shows a flow chart of the logical development and construction of the five models of a Caribbean coral reef that are presented here.
Starting from the motivation for such a modelling effort, the first step was to formulate an objective, the second to define the size and boundaries of the system which was to be modelled. The next step was the collection and definition of the elements represented in the system. Empirical methods were used to obtain values for the key input parameters of ECOPATH II. The literature was systematically searched for data useful for the composition of a diet matrix, for the estimation of preliminary biomass values and for the computation of vital statistics by empirical methods. After a preliminary set of inputs was prepared, the elements of the system were reduced to 50 species (groups) or "boxes", using a clustering technique.
The reduced set of inputs was entered into ECOPATH II and subsequently modified until the 50-box model was balanced. The final outputs were compared with the initial inputs and discrepancies discussed.
The balanced 50-box model was then reduced to 20-box and I I -box models by two different methods of aggregation. The resulting 20- and 11-box models from both methods were compared. Based on the outputs from all models, the implications of the modelling were discussed.
The number(s) of the section(s), in which the above steps are described, is (are) given in the upper right corner of the boxes in Fig. 1.1.
1.3. Objectives
Summarizing, the main objectives of this report are: 1. to test whether it is possible to construct quantitative steady-state models of the trophic
interactions in a Caribbean coral reef; 2. to assess the reliability of such models by comparison of outputs with independent
quantitative information on the dynamics of Caribbean and other coral reefs; 3. to possibly identify, describe and quantify presently unknown properties (qualitative and
quantitative) of coral reef ecosystems, relevant to their functioning and exploitation by fishing;
4. to identify methodological problems associated with the modelling process and propose solutions to these, e.g., on how to handle the high species diversity on coral reefs, based on various ataxonomical approaches, or on how to deal with migrating species that only spend a fraction of their time on the reef; and
5. to reveal information gaps where additional theoretical and field research is needed.
Reduction to 50 groups
C
I
Fig. 1 .I. Flow chart showing development and construction of five trophic models of a Caribbean coral reef. The numbers in the upper right corner of the boxes refer to the sections describing the steps.
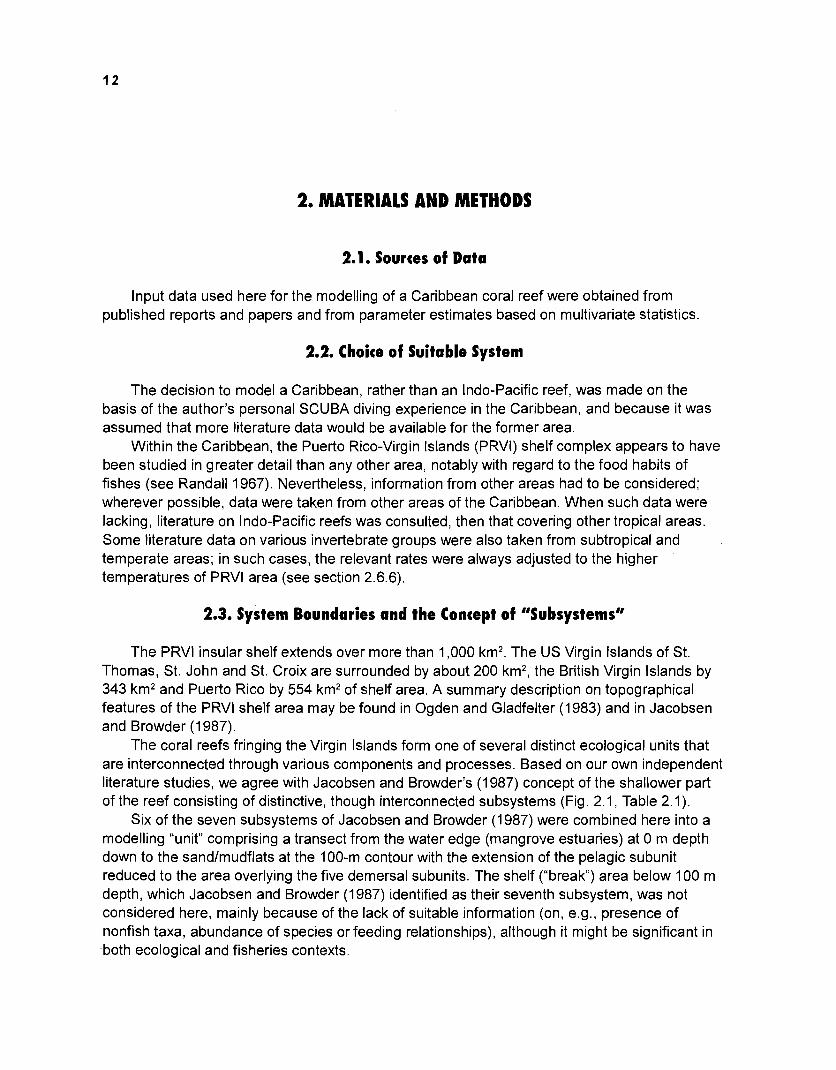
2.1. Sources of Data
Input data used here for the modelling of a Caribbean coral reef were obtained from published reports and papers and from parameter estimates based on multivariate statistics.
2.2. Choice of Suitable System
The decision to model a Caribbean, rather than an Indo-Pacific reef, was made on the basis of the author's personal SCUBA diving experience in the Caribbean, and because it was assumed that more literature data would be available for the former area.
Within the Caribbean, the Puerto Rico-Virgin lslands (PRVI) shelf complex appears to have been studied in greater detail than any other area, notably with regard to the food habits of fishes (see Randall 1967). Nevertheless, information from other areas had to be considered; wherever possible, data were taken from other areas of the Caribbean. When such data were lacking, literature on Indo-Pacific reefs was consulted, then that covering other tropical areas. Some literature data on various invertebrate groups were also taken from subtropical and temperate areas; in such cases, the relevant rates were always adjusted to the higher temperatures of PRVl area (see section 2.6.6).
2.3. System Boundaries and the Concept of "Subsystems"
The PRVl insular shelf extends over more than 1,000 km2. The US Virgin lslands of St. Thomas, St. John and St. Croix are surrounded by about 200 km2, the British Virgin Islands by 343 km2 and Puerto Rico by 554 km2 of shelf area. A summary description on topographical features of the PRVl shelf area may be found in Ogden and Gladfelter (1983) and in Jacobsen and Browder (1 987).
The coral reefs fringing the Virgin lslands form one of several distinct ecological units that are interconnected through various components and processes. Based on our own independent literature studies, we agree with Jacobsen and Browder's (1 987) concept of the shallower part of the reef consisting of distinctive, though interconnected subsystems (Fig. 2.1, Table 2.1).
Six of the seven subsystems of Jacobsen and Browder (1987) were combined here into a modelling "unit" comprising a transect from the water edge (mangrove estuaries) at 0 m depth down to the sandlmudflats at the 100-m contour with the extension of the pelagic subunit reduced to the area overlying the five demersal subunits. The shelf ("break) area below 100 m depth, which Jacobsen and Browder (1987) identified as their seventh subsystem, was not considered here, mainly because of the lack of suitable information (on, e.g., presence of nonfish taxa, abundance of species or feeding relationships), although it might be significant in both ecological and fisheries contexts.
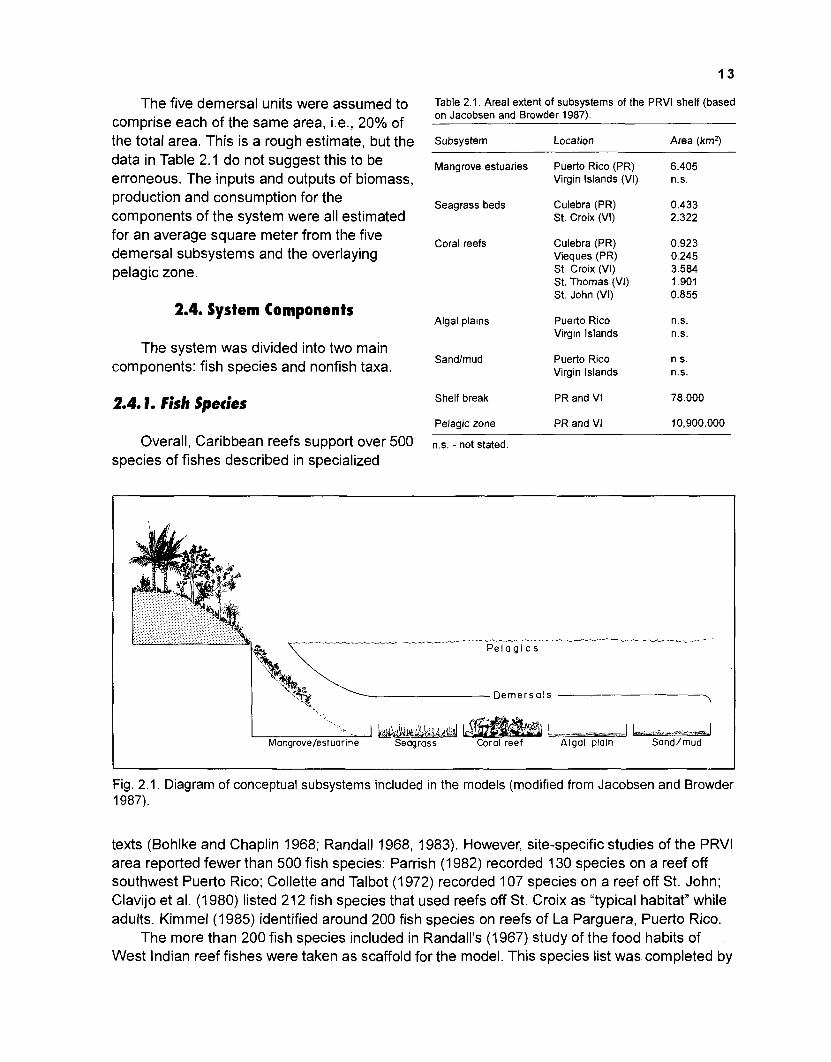
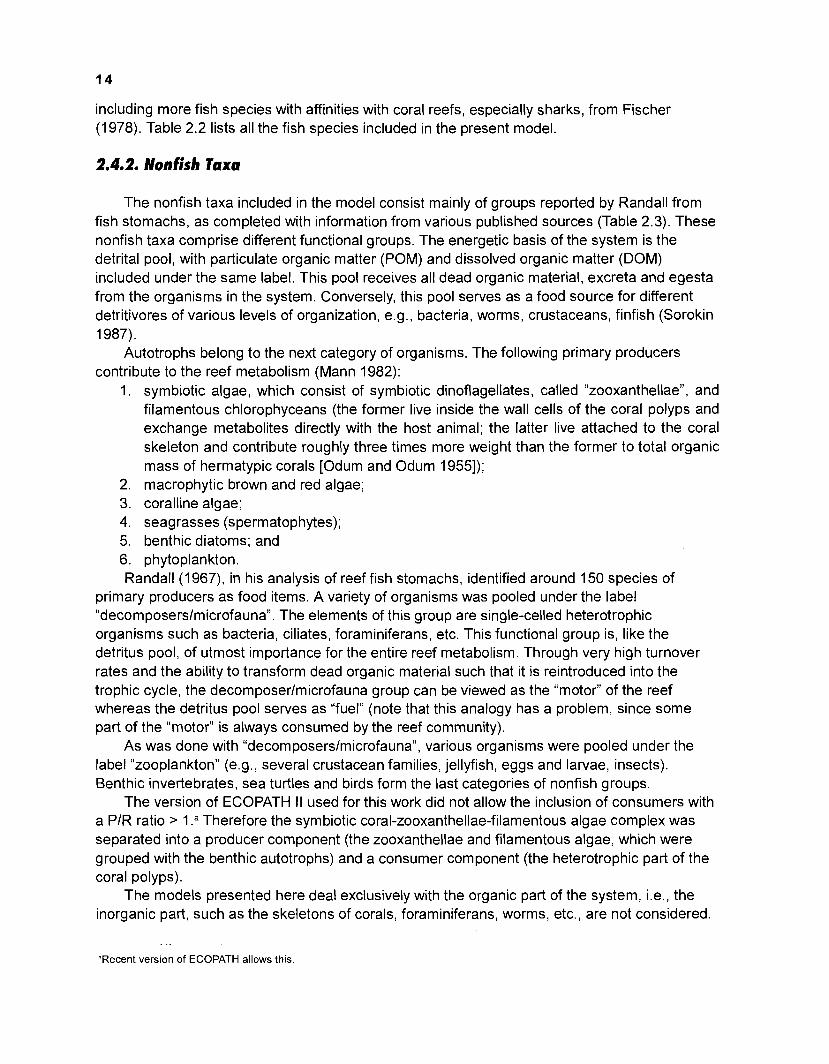
The five demersal units were assumed to comprise each of the same area, i.e., 20% of the total area. This is a rough estimate, but the data in Table 2.1 do not suggest this to be erroneous. The inputs and outputs of biomass, production and consumption for the components of the system were all estimated for an average square meter from the five demersal subsystems and the overlaying pelagic zone.
2.4. System Components
The system was divided into two main components: fish species and nonfish taxa.
2.4.1. Fish Species
Overall, Caribbean reefs support over 500 species of fishes described in specialized
Table 2.1. Areal extent of subsystems of the PRVl shelf (based on Jacobsen and Browder 1987).
Subsystem Location Area (km2)
Mangrove estuaries Puerto Rico (PR) Virgin Islands (VI)
Seagrass beds Culebra (PR) St. Croix (VI)
Coral reefs Culebra (PR) Vieques (PR) St. Croix (VI) St. Thomas (VI) St. John (VI)
Algal plains Puerto Rico Virgin Islands
Sandlmud Puerto Rico Virgin Islands
Shelf break PR and VI
Pelagic zone PR and VI
n.s. - not stated
L ----- J L >-,", -"--.-d ~angrove/estuarini Seqrass Coral reef Algal plain Sand/mud
Fig. 2.1. Diagram of conceptual subsystems included in the models (modified from Jacobsen and Browder 1987).
texts (Bohlke and Chaplin 1968; Randall 1968, 1983). However, site-specific studies of the PRVl area reported fewer than 500 fish species: Parrish (1982) recorded 130 species on a reef off southwest Puerto Rico; Colette and Talbot (1972) recorded 107 species on a reef off St. John; Clavijo et al. (1980) listed 21 2 fish species that used reefs off St. Croix as "typical habitat1' while adults. Kimmel (1985) identified around 200 fish species on reefs of La Parguera, Puerto Rico.
The more than 200 fish species included in Randall's (1 967) study of the food habits of West Indian reef fishes were taken as scaffold for the model. This species list was completed by
including more fish species with affinities with coral reefs, especially sharks, from Fischer (1978). Table 2.2 lists all the fish species included in the present model.
The nonfish taxa included in the model consist mainly of groups reported by Randall from fish stomachs, as completed with information from various published sources (Table 2.3). These nonfish taxa comprise different functional groups. The energetic basis of the system is the detrital pool, with particulate organic matter (POM) and dissolved organic matter (DOM) included under the same label. This pool receives all dead organic material, excreta and egesta from the organisms in the system. Conversely, this pool serves as a food source for different detritivores of various levels of organization, e.g., bacteria, worms, crustaceans, finfish (Sorokin 1987).
Autotrophs belong to the next category of organisms. The following primary producers contribute to the reef metabolism (Mann 1982):
symbiotic algae, which consist of symbiotic dinoflagellates, called "zooxanthellae", and filamentous chlorophyceans (the former live inside the wall cells of the coral polyps and exchange metabolites directly with the host animal; the latter live attached to the coral skeleton and contribute roughly three times more weight than the former to total organic mass of hermatypic corals [Odum and Odum 19551); macrophytic brown and red algae; coralline algae; seagrasses (spermatophytes); benthic diatoms; and phytoplankton.
Randall (1 967), in his analysis of reef fish stomachs, identified around 150 species of primary producers as food items. A variety of organisms was pooled under the label "decomposers1microfauna". The elements of this group are single-celled heterotrophic organisms such as bacteria, ciliates, foraminiferans, etc. This functional group is, like the detritus pool, of utmost importance for the entire reef metabolism. Through very high turnover rates and the ability to transform dead organic material such that it is reintroduced into the trophic cycle, the decomposer/microfauna group can be viewed as the "motor" of the reef whereas the detritus pool serves as "fuel" (note that this analogy has a problem, since some part of the "motor" is always consumed by the reef community).
As was done with "decomposerslmicrofauna", various organisms were pooled under the label "zooplankton" (e.g., several crustacean families, jellyfish, eggs and larvae, insects). Benthic invertebrates, sea turtles and birds form the last categories of nonfish groups.
The version of ECOPATH II used for this work did not allow the inclusion of consumers with a PIR ratio > 1 ." Therefore the symbiotic coral-zooxanthellae-filamentous algae complex was separated into a producer component (the zooxanthellae and filamentous algae, which were grouped with the benthic autotrophs) and a consumer component (the heterotrophic part of the coral polyps).
The models presented here deal exclusively with the organic part of the system, i.e., the inorganic part, such as the skeletons of corals, foraminiferans, worms, etc., are not considered.
"Recent version of ECOPATH allows this.
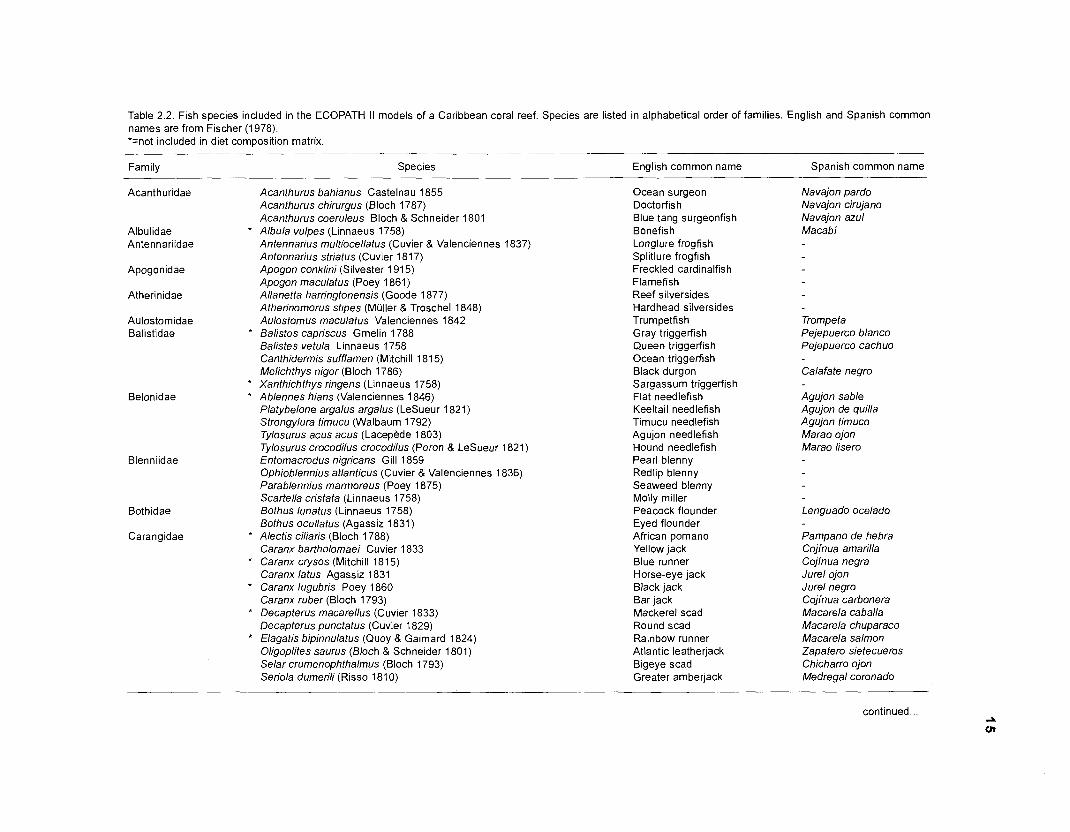
Table 2.2. Fish species included in the ECOPATH II models of a Caribbean coral reef. Species are listed in alphabetical order of families. English and Spanish common names are from Fischer (1 978). *=not included in diet composition matrix.
Family Species English common name Spanish common name
Albulidae Antennariidae
Apogonidae
Atherinidae
Aulostomidae Balistidae
Belonidae
Blenniidae
Bothidae
Carangidae
Acanthurus bahianus Castelnau 1855 Acanthurus chirurgus (Bloch 1787) Acanthurus coeruleus Bloch & Schneider 1801
* Albula vulpes (Linnaeus 1758) Antennarius multiocellatus (Cuvier & Valenciennes 1837) Antennarius striatus (Cuvier 181 7) Apogon conklini (Silvester 191 5) Apogon maculatus (Poey 1861) Allanetta harringtonensis (Goode 1877) Atherinomorus stipes (Miiller & Troschel 1848) Aulostomus maculatus Valenciennes 1842
* Balistes capriscus Gmelin I788 Balistes vetula Linnaeus 1758 Canthidermis sufflamen (Mitchill 181 5) Melichthys niger (Bloch 1786)
* Xanthichthys ringens (Linnaeus 1758) * Ablennes hians (Valenciennes 1846)
Platybelone argalus argalus (LeSueur 1821) Strongylura timucu (Walbaum 1792) Tylosurus acus acus (Lacepede 1803) Tylosurus crocodilus crocodilus (Peron & LeSueur 1821) Entomacrodus nigricans Gill 1859 Ophioblennius atlanticus (Cuvier & Valenciennes 1836) Parablennius marmoreus (Poey 1875) Scartella cristata (Linnaeus 1758) Bothus lunatus (Linnaeus 1758) Bothus ocellatus (Agassiz 1831)
* Alectis ciliaris (Bloch 1788) Caranx bartholomaei Cuvier 1833
* Caranx crysos (Mitchill 181 5) Caranx latus Agassiz 1831
* Caranx lugubris Poey I860 Caranx ruber (Bloch 1793)
* Decapterus macarellus (Cuvier 1833) Decapterus punctatus (Cuvier 1829)
* Elagatis bipinnulatus (Quoy & Gaimard 1824) Oligoplites saurus (Bloch & Schneider 1801) Selar crumenophthalmus (Bloch 1793) Seriola dumerili (Risso 1 81 0)
Ocean surgeon Doctorfish Blue tang surgeonfish Bonefish Longlure frogfish Splitlure frogfish Freckled cardinalfish Flamefish Reef silversides Hardhead silversides Trumpetfish Gray triggerfish Queen triggerfish Ocean triggerfish Black durgon Sargassum triggerfish Flat needlefish Keeltail needlefish Timucu needlefish Agujon needlefish Hound needlefish Pearl blenny Redlip blenny Seaweed blenny Molly miller Peacock flounder Eyed flounder African pomano Yellow jack Blue runner Horse-eye jack Black jack Bar jack Mackerel scad Round scad Rainbow runner Atlantic leatherjack Bigeye scad Greater amberjack
Navajon pardo Navajon cirujano Navajon azul Macabi
Trompe ta Pejepuerco blanco Pejepuerco cachuo
Calafate negro
Agujon sable Agujon de quilla Agujon timuco Marao ojon Marao lisero
Lenguado ocelado
Pampano de hebra Cojinua amarilla Cojinua negra Jurel ojon Jurel negro Cojinua carbonera Macarela caballa Macarela chuparaco Macarela salmon Zapatero sietecueros Chicharro ojon Medregal coronado
continued
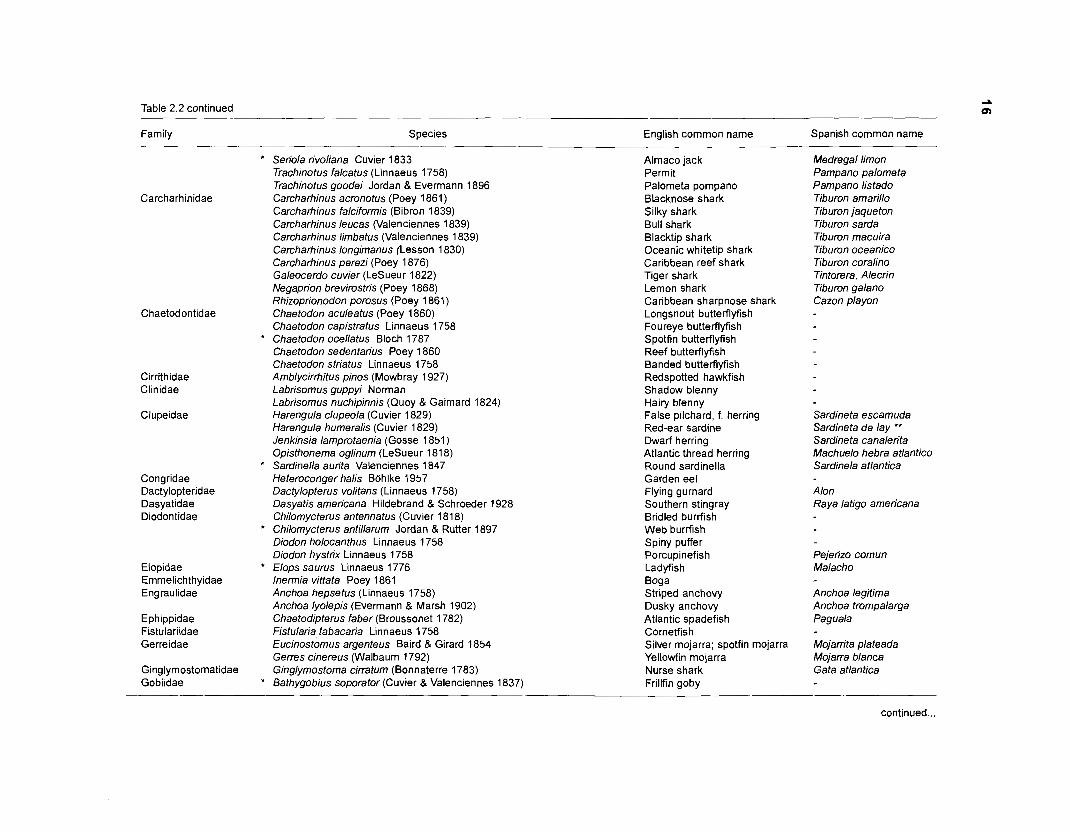
Table 2.2 continued
Familp Species English common name Spanish common name
Carcharhinidae
Chaetodontidae
Cirrithidae Clinidae
Clupeidae
Congridae Dactylopteridae Dasyatidae Diodontidae
Elopidae Emmelichthyidae Engraulidae
Ephippidae Fistulariidae Gerreidae
Ginglymostomatidae Gobiidae
* Seriola rivoliana Cuvier 1833 Trachinotus falcatus (Linnaeus 1758) Trachinotus goodei Jordan & Evermann 1896 Carcharhinus acronotus (Poey 1861) Carcharhinus falciformis (Bi bron 1 839) Carcharhinus leucas (Valenciennes 1839) Carcharhinus limbatus (Valenciennes 1839) Carcharhinus longimanus (Lesson 1830) Carcharhinus perezi (Poey 1876) Galeocerdo cuvier (LeSueur 1822) Negaprion brevirostris (Poey 1 868) Rhizoprionodon porosus (Poey 1 861 ) Chaetodon aculeatus (Poey 1860) Chaetodon capistratus Linnaeus 1758
* Chaetodon ocellatus Bloch 1787 Chaetodon sedentarius Poey 1860 Chaetodon striatus Linnaeus 1758 Amblycirrhitus pinos (Mowbray 1927) Labrisomus guppyi Norman Labrisomus nuchipinnis (Quoy & Gaimard 1824) Harengula clupeola (Cuvier 1 829) Harengula humeralis (Cuvier 1829) Jenkinsia lamprotaenia (Gosse 1851) Opisthonema oglinum (LeSueur 181 8)
* Sardinella aurita Valenciennes 1847 Heteroconger halis Bohlke 1957 Dactylopterus volitans (Linnaeus 1758) Dasyatis americana Hildebrand & Schroeder 1928 Chilomycterus antennatus (Cuvier 181 8)
* Chilomycterus antillarum Jordan & Rutter 1897 Diodon holocanthus Linnaeus 1758 Diodon hystrix Linnaeus 1758
* Elops saurus Linnaeus 1776 lnermia vittata Poey 1861 Anchoa hepsetus (Linnaeus 1758) Anchoa lyolepis (Evermann & Marsh 1902) Chaetodipterus faber (Broussonet 1782) Fistularia tabacaria Linnaeus 1758 Eucinostomus argenteus Baird & Girard 1854 Gerres cinereus (Walbaum 1792) Ginglymostoma cirratum (Bonnaterre 1783)
* Bathygobius soporator (Cuvier & Valenciennes 1837)
Almaco jack Permit Palometa pompano Blacknose shark Silky shark Bull shark Blacktip shark Oceanic whitetip shark Caribbean reef shark Tiger shark Lemon shark Caribbean sharpnose shark Longsnout butterflyfish Foureye butterflyfish Spotfin butterflyfish Reef butterflyfish Banded butterflyfish Redspotted hawkfish Shadow blenny Hairy blenny False pilchard, f. herring Red-ear sardine Dwarf herring Atlantic thread herring Round sardinella Garden eel Flying gurnard Southern stingray Bridled burrfish Web burrfish Spiny puffer Porcupinefish Ladyfish Boga Striped anchovy Dusky anchovy Atlantic spadefish Cornetfish Silver mojarra; spotfin mojarra Yellowfin rnojarra Nurse shark Frillfin goby
- -
Medregal limon Pampano palometa Pampano listado Tiburon amarillo Tiburon jaqueton Tiburon sarda Tiburon macuira Tiburon oceanic0 Tiburon coralino Tintorera, Alecrin Tiburon galano Cazon playon
Sardineta escamuda Sardineta de lay ** Sardineta canalerita Machuelo hebra atlantico Sardinela atlantica
Alon Raya latigo americana
Pejerizo comun Malacho
Anchoa legitima Anchoa trompalarga Paguala
Mojarrita plateada Mojarra blanca Gata atlantica
continued ...
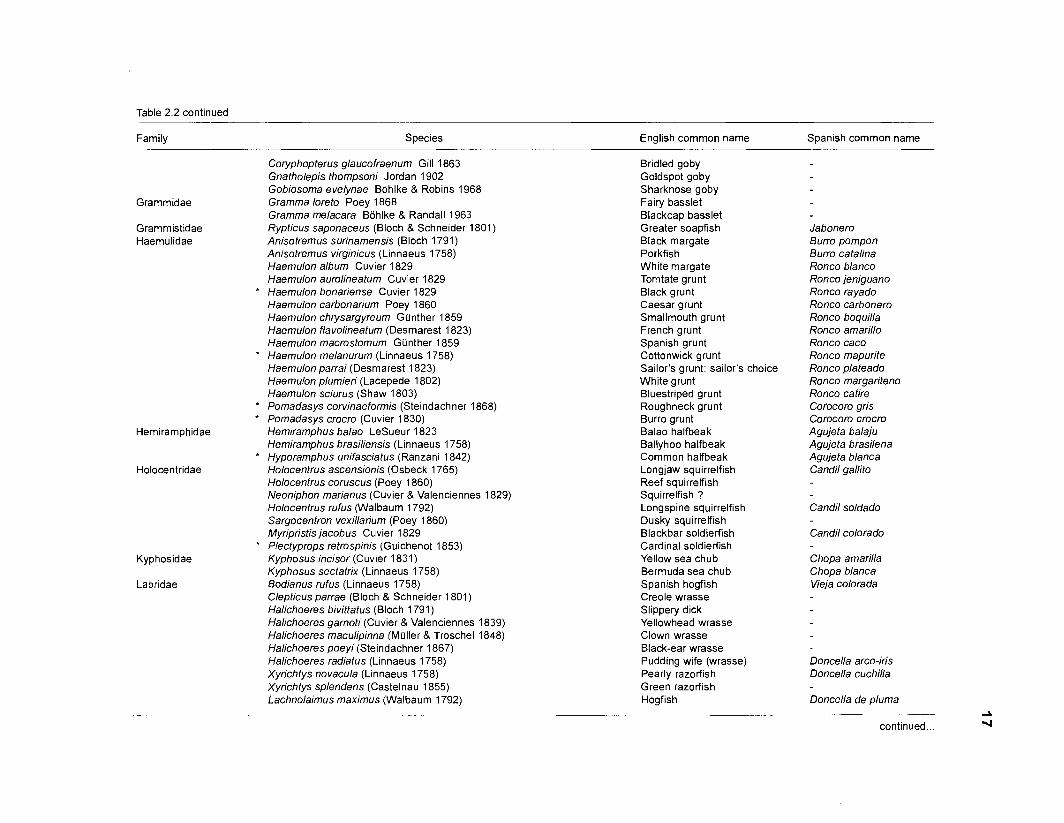
Table 2.2 continued
Family Species
- -
English common name Spanish common name
Grammidae
Grammistidae Haemulidae
Hemiramphidae
Holocentridae
Kyphosidae
Labridae
Coryphopterus glaucofraenum Gill 1863 Gnatholeois thomosoni Jordan 1 902 ~ o b i o s o h a evelinae BCjhlke & Robins 1968 Gramma loreto Poey 1868 Gramma melacara Bohlke & Randall 1963 Rypticus saponaceus (Bloch & Schneider 1801) Anisotremus surinamensis (Bloch 1791 ) Anisotremus virginicus (Linnaeus 1758) Haemulon album Cuvier 1829 Haemulon aurolineatum Cuvier 1829 Haemulon bonariense Cuvier 1829 Haemulon carbonarium Poey 1860 Haemulon chrysargyreum Gunther 1859 Haemulon flavolineatum (Desmarest 1823) Haemulon macrostomum Gunther 1859 Haemulon melanurum (Linnaeus 1758) Haemulon parrai (Desmarest 1823) Haemulon plumieri (Lacepede 1802) Haemulon sciurus (Shaw 1803) Pomadasys corvinaeformis (Steindachner 1868) Pomadasys crocro (Cuvier 1830) Hemiramphus balao LeSueur 1823 Hemiramohus brasiliensis (Linnaeus 1758) ~ ~ ~ o r a m b h u s unifasciatus'(~anzani 1842) Holocentrus ascensionis (Osbeck 1765) Holocentrus coruscus ( p i e y 1860) '
Neoniphon marianus (Cuvier & Valenciennes 1829) Holocentrus rufus (Walbaum 1792) Sargocentron vexillarium (Poey 1860) Myripristis jacobus Cuvier 1829 Plectyprops retrospinis (Guichenot 1853) Kyphosus incisor (Cuvier 1831 ) Kyphosus sectatrix (Linnaeus 1758) Bodianus rufus (Linnaeus 1758) Clepticus parrae (Bloch & Schneider 1801) Halichoeres bivittatus (Bloch 1791) Halichoeres garnoti (&vier & ~alemiennes 1839) Halichoeres maculi~inna (Muller & Troschel 1848) Halichoeres poeyi i~teindachner 1867) Halichoeres radiatus (Linnaeus 1758) Xyrichtys novacula (~innaeus 1758) ' Xyrichtys splendens (Castelnau 1 855) Lachnolaimus maximus (Walbaum 1792)
Bridled goby Goldspot goby Sharknose goby Fairy basslet Blackcap basslet Greater soapfish Black margate Porkfish White margate Tomtate grunt Black grunt Caesar grunt Smallmouth grunt French grunt Spanish grunt Cottonwick grunt Sailor's grunt: sailor's choice White grunt Bluestriped grunt Roughneck grunt Burro grunt Balao halfbeak Ballyhoo halfbeak Common halfbeak Longjaw squirrelfish Reef squirrelfish Squirrelfish ? Longspine squirrelfish Dusky squirrelfish Blackbar soldierfish Cardinal soldierfish Yellow sea chub Bermuda sea chub Spanish hogfish Creole wrasse Slippery dick Yellowhead wrasse Clown wrasse Black-ear wrasse Pudding wife (wrasse) Pearly razorfish Green razorfish Hogfish
Jabonero Burro pompon Burro catalina Ronco blanco Ronco jeniguano Ronco rayado Ronco carbonero Ronco boquilla Ronco amarillo Ronco caco Ronco mapurite Ronco plateado Ronco margariteno Ronco catire Corocoro gris Corocoro crocro Agujeta balaju Agujeta brasilena Agujeta blanca Candil gallito
Candil soldado
Candil colorado
Chopa amarilla Chopa blanca Vieja colorada
Doncella arco-iris Doncella cuchilla
Doncella de pluma
continued..
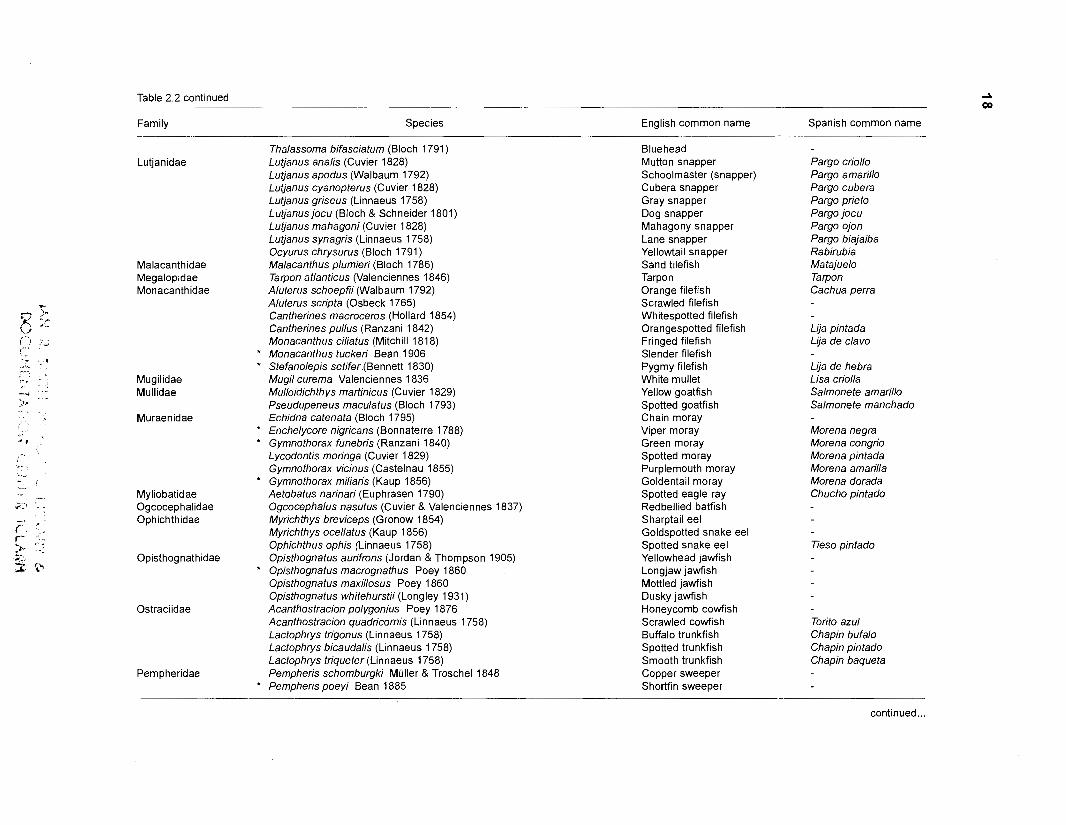
Table 2.2 continued
Family Species English common name Spanish common name
Lutjanidae
Malacanthidae Megalopidae Monacanthidae
Mugilidae Mullidae
Muraenidae
Myliobatidae Ogcocephalidae Ophichthidae
Opisthognathidae
Ostraciidae
Pempheridae
Thalassoma bifasciatum (Bloch 1791 ) Lutjanus analis (Cuvier 1828) Lutjanus apodus (Walbaum 1792) Lutjanus cyanopterus (Cuvier 1828) Lutjanus griseus (Linnaeus 1758) Lutjanus jocu (Bloch & Schneider 1801) Lutjanus mahagoni (Cuvier 1828) Lutjanus synagris (Linnaeus 1758) Ocyurus chrysurus (Bloch 1791) Malacanthus plumieri (Bloch 1786) Tarpon atlanticus (Valenciennes 1846) Aluterus schoepfii (Walbaum 1792) Aluterus scripta (Osbeck 1765) Cantherines macroceros (Hollard 1854) Cantherines pullus (Ranzani 1842) Monacanthus ciliatus (Mitchill 1 81 8)
* Monacanthus tucker; Bean 1906 * Stefanolepis setifer.(Bennett 1830)
Mugil curema Valenciennes 1836 Mulloidichthys martinicus (Cuvier 1829) Pseudupeneus maculatus (Bloch 1793) Echidna catenata (Bloch 1795)
* Enchelycore nigricans (Bonnaterre 1788) * Gymnothorax funebris (Ranzani 1840)
Lycodontis moringa (Cuvier 1829) Gymnothorax vicinus (Castelnau 1855)
* Gymnothorax miliaris (Kaup 1856) Aetobatus narinari (Euphrasen 1790) Ogcocephalus nasutus (Cuvier & Valenciennes 1837) Myrichthys breviceps (Gronow 1854) Myrichthys ocellatus (Kaup 1856) Ophichthus ophis (Linnaeus 1758) Opisthognatus aurifrons (Jordan & Thompson 1905)
* Opisthognatus macrognathus Poey 1860 Opisthognatus maxillosus Poey 1860 Opisthognatus whitehurstii (Longley 1931 ) Acanthostracion polygonius Poey 1876 Acanthostracion quadricornis (Linnaeus 1758) Lactophrys trigonus (Linnaeus 1758) Lactophrys bicaudalis (Lin naeus 1 758) Lactophrys triqueter (Linnaeus 1758) Pempheris schomburgki Mijller & Troschel 1848
* Pempheris poeyi Bean 1885
Bluehead Mutton snapper Schoolmaster (snapper) Cubera snapper Gray snapper Dog snapper Mahagonysnapper Lanesnapper Yellowtail snapper Sand tilefish Tarpon Orange filefish Scrawled filefish Whitespotted fiiefish Orangespotted filefish Fringed filefish Slender filefish Pygmy filefish White mullet Yellow goatfish Spotted goatfish Chain moray Viper moray Green moray Spotted moray Purplemouth moray Goldentail moray Spotted eagle ray Redbellied batfish Sharptail eel Goldspotted snake eel Spotted snake eel Yellowhead jawfish Longjaw jawfish Mottled jawfish Dusky jawfish Honeycomb cowfish Scrawled cowfish Buffalo trunkfish Spotted trunkfish Smooth trunkfish Copper sweeper Shortfin sweeper
Pargo criollo Pargo amarillo Pargo cubera Pargo prieto Pargo jocu Pargo ojon Pargo biajaiba Rabirubia Matajuelo Tarpon Cachua perra
Lija pintada Lija de clavo
Lija de hebra Lisa criolla Salmonete amarillo Salmonete manchado
Morena negra Morena congrio Morena pintada Morena amarilla Morena dorada Chucho pintado
Tieso pintado
Torito azul Chapin bufalo Chapin pintado Chapin baqueta
continued ...
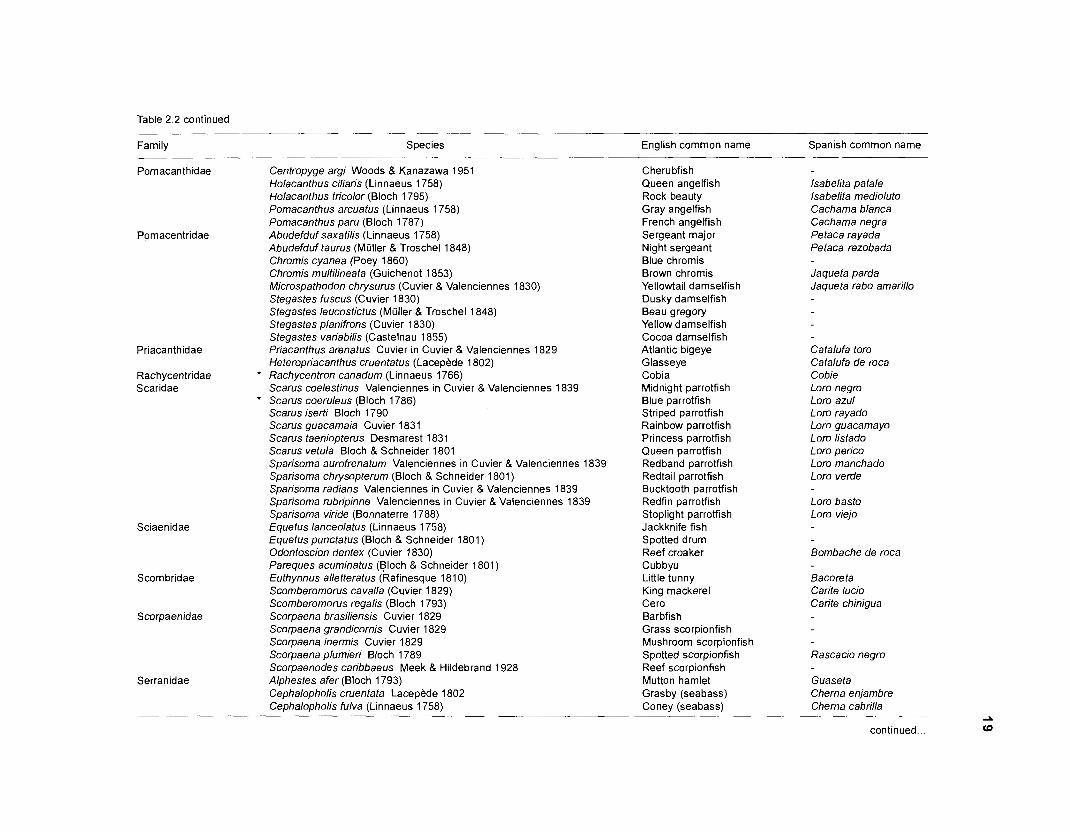
Table 2.2 continued
Family Species English common name Spanish common name
Pomacentridae
Priacanthidae
Rachycentridae Scaridae
-- -
Pomacanthidae Centropyge argi Woods & Kanazawa 1951 Holacanthus ciliaris (Linnaeus 1758) Holacanthus tricolor (Bloch 1795) Pomacanthus arcuatus (Linnaeus 1758) Pornacanthus paru (Bloch 1787) Abudefduf saxatilis (Linnaeus 1758) Abudefduf taurus (Muller & Troschel 1848) Chrornis cyanea (Poey 1860) Chromis rnultilineata (Guichenot 1853) Microspathodon chrysurus (Cuvier & Valenciennes 1830) Stegastes fuscus (Cuvier 1830) Stegastes leucostictus (Muller & Troschel 1848) Stegastes planifrons (Cuvier 1830) Stegastes variabilis (Castelnau 1855) Priacanthus arenatus Cuvier in Cuvier & Valenciennes 1829 Heteropriacanthus cruentatus (Lacepede 1802)
* Rachycentron canadum (Linnaeus 1766) Scarus coelestinus Valenciennes in Cuvier & Valenciennes 1839
* Scarus coeruleus (Bloch 1786) Scarus iseft; Bloch 1790 Scarus guacamaia Cuvier 1831 Scarus taeniopterus Desmarest 1831 Scarus vetula Bloch & Schneider 1801 Sparisoma aurofrenaturn Valenciennes in Cuvier & Valenciennes 1839 Sparisorna chrysopterum (Bloch & Schneider 1801)
Sciaenidae
Scombridae
Scorpaenidae
Sparisoma radians Valenciennes in Cuvier & Valenciennes 1839 S~arisorna rubri~inne Valenciennes in Cuvier & Valenciennes 1839 ~ ~ a r i s o m a viridk (Bonnaterre 1788) Equetus lanceolatus (Linnaeus 1758) Equetus punctatus (Bloch & Schneider 1801) Odontoscion dentex (Cuvier 1830) Pareques acurninatus (Bloch & Schneider 1801) Euthynnus alletteratus (Rafinesque 181 0) Scornberornorus cavalla (Cuvier 1829) Scornberornorus regalis (Bloch 1793) Scorpaena brasiliensis Cuvier 1829 Scorpaena grandicornis Cuvier 1829 Scorpaena inermis Cuvier 1829 Scorpaena plumieri Bloch 1789 Scorpaenodes caribbaeus Meek & Hildebrand 1928
Serranidae Alphestes afer (Bloch 1793) Cephalopholis cruentata Lacepede 1802 Cephalopholis fulva (Linnaeus 1758)
Cherubfish Queen angelfish Rock beauty Gray angelfish French angelfish Sergeant major Night sergeant Blue chromis Brown chromis Yellowtail damselfish Dusky damselfish Beau gregory Yellow damselfish Cocoa damselfish Atlantic bigeye Glasseye Cobia Midnight parrotfish Blue parrotfish Striped parrotfish Rainbow parrotfish Princess parrotfish Queen parrotfish Redband parrotfish Redtail parrotfish Bucktooth parrotfish Redfin parrotfish Stoplight parrotfish Jackknife fish Spotted drum Reef croaker Cubbyu Little tunny King mackerel Cero Barbfish Grass scorpionfish Mushroom scorpionfish Spotted scorpionfish Reef scorpionfish Mutton hamlet Grasby (seabass) Coney (seabass)
lsabelita patale lsabelita medioluto Cacharna blanca Cacharna negra Petaca rayada Petaca rezobada
Jaqueta parda Jaqueta rabo arnarillo
Catalufa tor0 Catalufa de roca Cobie Loro negro Loro azul Loro rayado Loro guacamayo Loro listado Loro perico Loro manchado Loro verde
Loro basto Loro viejo
Bombache de roca
Bacoreta Carite lucio Carite chinigua
Rascacio negro
Guaseta Cherna enjarnbre Cherna cabrilla
continued ...
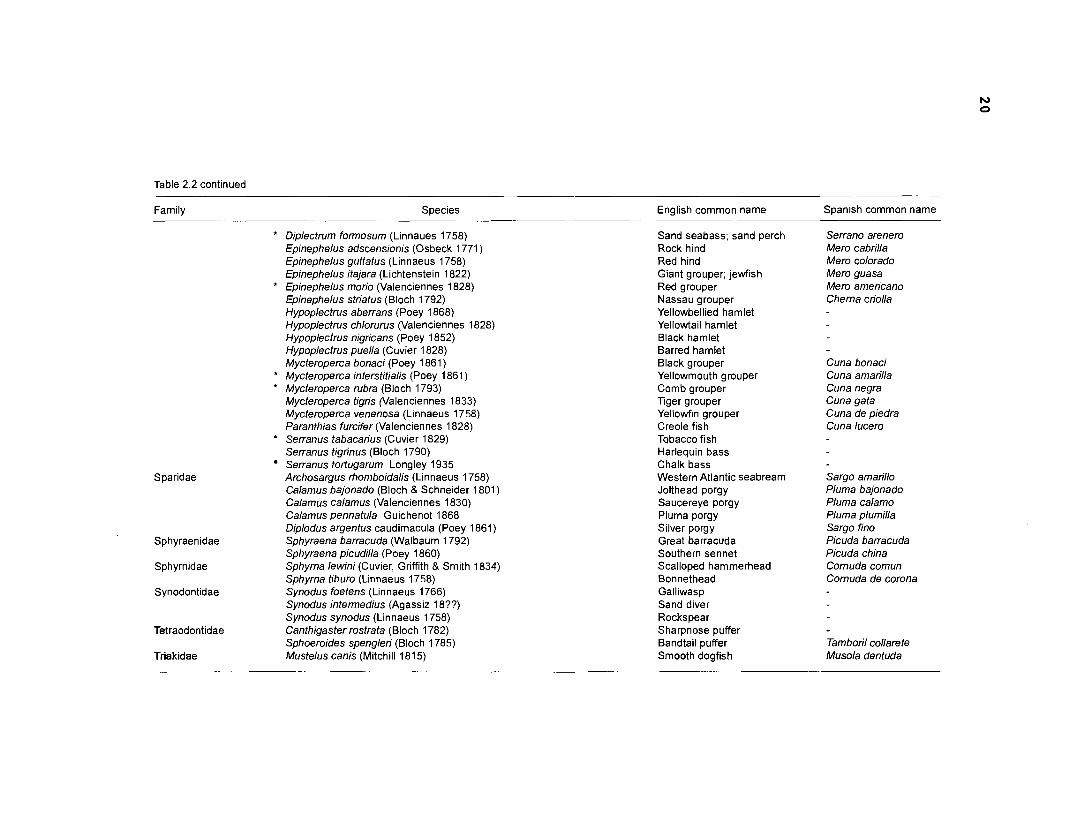
Table 2.2 continued
Family Species English common name Spanish common name
* Diplectrum formosum (Linnaues 1758) Epinephelus adscensionis (Osbeck 1771 ) Epinephelus guttatus (Linnaeus 1758) Epinephelus itajara (Lichtenstein 1822)
* Epinephelus morio (Valenciennes 1828) Epinephelus striatus (Bloch 1792) Hypoplectrus aberrans (Poey 1868) Hypoplectrus chlorurus (Valenciennes 1828) Hypoplectrus nigricans (Poey 1852) Hypoplectrus puella (Cuvier 1828) Mycteroperca bonaci (Poey 1861)
* Mycteroperca interstitialis (Poey 1861 ) * Mycteroperca rubra (Bloch 1793)
Mycteroperca tigris (Valenciennes 1833) Mycteroperca venenosa (Linnaeus 1758) Paranthias furcifer (Valenciennes 1828)
* Serranus tabacarius (Cuvier 1829) Serranus tigrinus (Bloch 1790) Serranus tortugarum Longley 1935 Archosargus rhomboidalis (Linnaeus 1758) Calamus bajonado (Bloch & Schneider 1801) Calamus calamus (Valenciennes 1830) Calamus pennatula Guichenot 1868 Diplodus argentus caudimacula (Poey 1861)
Sphyraenidae Sphyraena barracuda (Walbaum 1792) Sphyraena picudilla (Poey 1860)
Sphyrnidae Sphyrna lewini (Cuvier, Gr~ffith & Smith 1834) Sphyrna tiburo (Linnaeus 1758)
Synodontidae Synodus foetens (Linnaeus 1766) Synodus intermedius (Agassiz 18??) Synodus synodus (Linnaeus 1758)
Tetraodontidae Canthigaster rostrata (Bloch 1782) Sphoeroides spengleri (Bloch 1 785)
Triakidae Mustelus canis (Mitchill 1 81 5)
Sparidae
Sand seabass; sand perch Rock hind Red hind Giant grouper; jewfish Red grouper Nassau grouper Yellowbellied hamlet Yellowtail hamlet Black hamlet Barred hamlet Black grouper Yellowmouth grouper Comb grouper Tiger grouper YellowFin grouper Creole fish Tobacco fish Harlequin bass Chalk bass Western Atlantic seabream Jolthead porgy Saucereye porgy Pluma porgy Silver porgy Great barracuda Southern sennet Scalloped hammerhead Bonnethead Galliwasp Sand diver Rockspear Sharpnose puffer Bandtail puffer Smooth dogfish
Serrano arenero Mero cabrilla Mero colorado Mero guasa Mero americano Cherna criolla
Cuna bonaci Cuna amarilla Cuna negra Cuna gata Cuna de piedra Cuna lucero
Sargo amarillo Pluma bajonado Pluma calamo Pluma plumilla Sargo fino Picuda barracuda Picuda china Cornuda comun Cornuda de corona
Tamboril collarete Musola dentuda
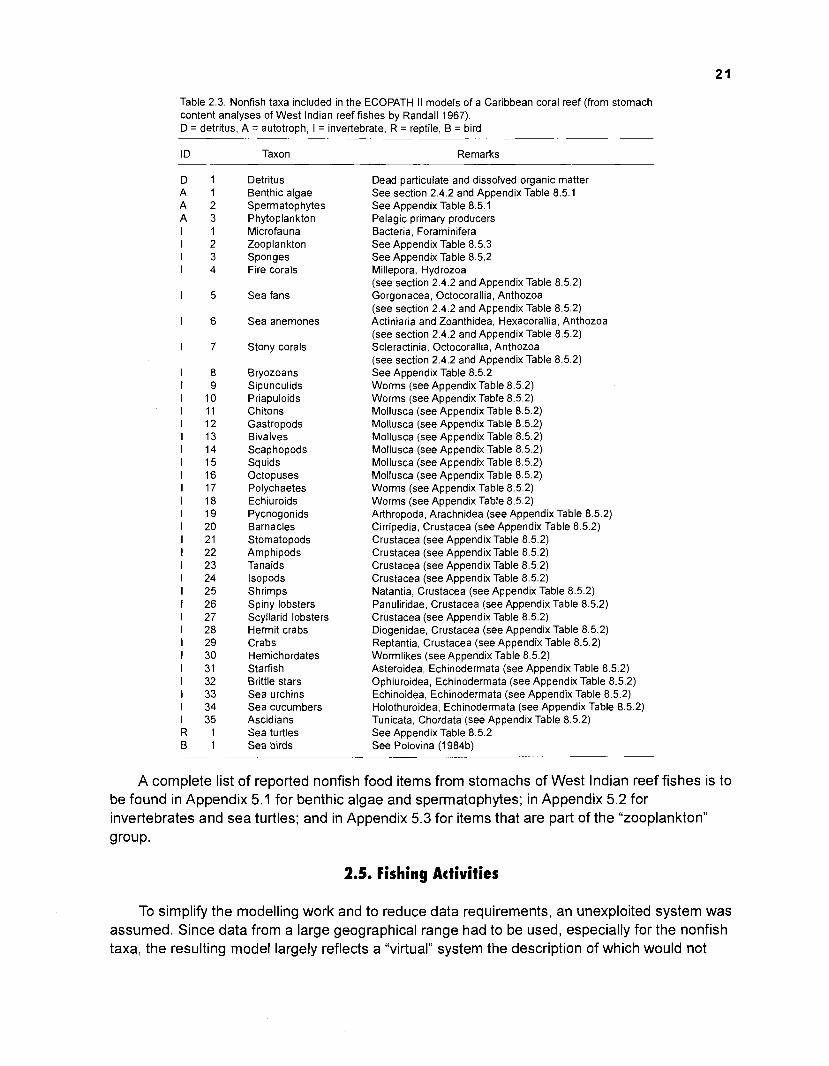
Table 2.3. Nonfish taxa included in the ECOPATH II models of a Caribbean coral reef (from stomach content analyses of West Indian reef fishes by Randall 1967). D = detritus, A = autotroph, I = invertebrate, R = reptile, B = bird
Taxon Remarks
Detritus Benthic algae Spermatophytes Phytoplankton Microfauna Zooplankton Sponges Fire corals
Sea fans
Sea anemones
Stony corals
Bryozoans Sipunculids Priapuloids Chitons Gastropods Bivalves Scaphopods Squids Octopuses Polychaetes Echiuroids Pycnogonids Barnacles Stomatopods Amphipods Tanaids lsopods Shrimps Spiny lobsters Scyllarid lobsters Hermit crabs Crabs Hemichordates Starfish Brittle stars Sea urchins Sea cucumbers Ascidians Sea turtles Sea birds
Dead particulate and dissolved organic matter See section 2.4.2 and Appendix Table 8.5.1 See Appendix Table 8.5.1 Pelagic primary producers Bacteria, Foraminifera See Appendix Table 8.5.3 See Appendix Table 8.5.2 Millepora, Hydrozoa (see section 2.4.2 and Appendix Table 8.5.2) Gorgonacea, Octocorallia, Anthozoa (see section 2.4.2 and Appendix Table 8.5.2) Actiniaria and Zoanthidea, Hexacorallia, Anthozoa (see section 2.4.2 and Appendix Table 8.5.2) Scleractinia, Octocorallia, Anthozoa (see section 2.4.2 and Appendix Table 8.5.2) See Appendix Table 8.5.2 Worms (see Appendix Table 8.5.2) Worms (see Appendix Table 8.5.2) Mollusca (see Appendix Table 8.5.2) Mollusca (see Appendix Table 8.5.2) Mollusca (see Appendix Table 8.5.2) Mollusca (see Appendix Table 8.5.2) Mollusca (see Appendix Table 8.5.2) Mollusca (see Appendix Table 8.5.2) Worms (see Appendix Table 8.5.2) Worms (see Appendix Table 8.5.2) Arthropoda, Arachnidea (see Appendix Table 8.5.2) Cirripedia, Crustacea (see Appendix Table 8.5.2) Crustacea (see Appendix Table 8.5.2) Crustacea (see Appendix Table 8.5.2) Crustacea (see Appendix Table 8.5.2) Crustacea (see Appendix Table 8.5.2) Natantia, Crustacea (see Appendix Table 8.5.2) Panuliridae, Crustacea (see Appendix Table 8.5.2) Crustacea (see Appendix Table 8.5.2) Diogenidae, Crustacea (see Appendix Table 8.5.2) Reptantia, Crustacea (see Appendix Table 8.5.2) Wormlikes (see Appendix Table 8.5.2) Asteroidea, Echinodermata (see Appendix Table 8.5.2) Ophiuroidea, Echinodermata (see Appendix Table 8.5.2) Echinoidea, Echinodermata (see Appendix Table 8.5.2) Holothuroidea, Echinodermata (see Appendix Table 8.5.2) Tunicata, Chordata (see Appendix Table 8.5.2) See Appendix Table 8.5.2 See Polovina (1984b)
A complete list of reported nonfish food items from stomachs of West Indian reef fishes is to be found in Appendix 5.1 for benthic algae and spermatophytes; in Appendix 5.2 for invertebrates and sea turtles; and in Appendix 5.3 for items that are part of the "zooplankton" group.
2.5. Fishing Activities
To simplify the modelling work and to reduce data requirements, an unexploited system was assumed. Since data from a large geographical range had to be used, especially for the nonfish taxa, the resulting model largely reflects a "virtual1' system the description of which would not
necessarily be improved by inclusion of fisheries catch data from a specific area. Moreover, even if this had have been attempted, it would have been extremely difficult to obtain catch data for individual species - except for certain commercial species of the Serranidae and Lutjanidae families.
The ecosystem described here can thus be seen as representing unfished areas of the PRVl shelf and may therefore be directly compared with the unexploited French Frigate Shoals reef ecosystem described by Polovina (1 984a, b,c, 1985, 1986) and Polovina and Ow (1 983).
2.6. Methods and Data Used for the Computation of Input Parameters Required for ECOPATH II
2.6.1. Growth Parameter Estimation
For the computation of several input parameters of ECOPATH II (e.g., QIB, M), growth parameters had to be estimated for most of the fish and invertebrates included in the model. Growth of fish was generally assumed to follow the von Bertalanffy growth function (VBGF) expressed for growth in length as:
where L, is the length at age t, Lm the asymptotic length, K is the growth coefficient (year1) and to the theoretical "age1' at length zero (Pauly 1984). Growth in weight is defined as:
where W, is the weight at age t, Wm the asymptotic weight and b is the exponent of a length- weight relationship of the form:
When only one pair of L, W value was available, the value of b was set equal to 3, and the relationship was used to estimate the multiplicative factor required in equation 2.3.
2.6.1 .l. ASYMPTOTIC SIZES
For the majority of fish species considered in the model, size-at-age or length-frequency data were not available from which Lr or W_ could be estimated. Therefore, asymptotic sizes were estimated from the reported maximum sizes (Lmax or Wmax) using the relationships (Pauly 1984):
2.6.1.2. GROWTH COEFFICIENT K
Estimates of the growth coefficient K of the VBGF were obtained directly from published sources or via the equation
for length and
for weight. The required estimates of $' and $ were generally obtained from the means of several values of
$' = log,,K + 210g,~L~, and ... 2.9)
where K, Lm and Wm are growth parameter estimates for various populations of the same species (Pauly 1979a; Pauly and Munro 1984; Pauly 1985). This approach which, strictly speaking, should be used only within species was used here between species (generally of the same genus) when these were similar in shape and habits.
2.6.1.3. ESTIMATION OF to
For all cases considered here, rough estimates of to were obtained via an empirical model by Pauly (1979a) of the form:
with L= as the asymptotic length in cm (total length) and K the growth coefficient of the species considered, expressed in year1. This parameter has little influence on the estimation of Q/B (see Pauly 1986), the only use for which it was required here.
2.6.2. Habitat and Abundanres
2.6.2.1. FISH SPECIES
Ecological information on feeding areas, shelter, time of activity, schooling behavior, etc., as well as information on abundance of Caribbean reef fishes were assembled from various
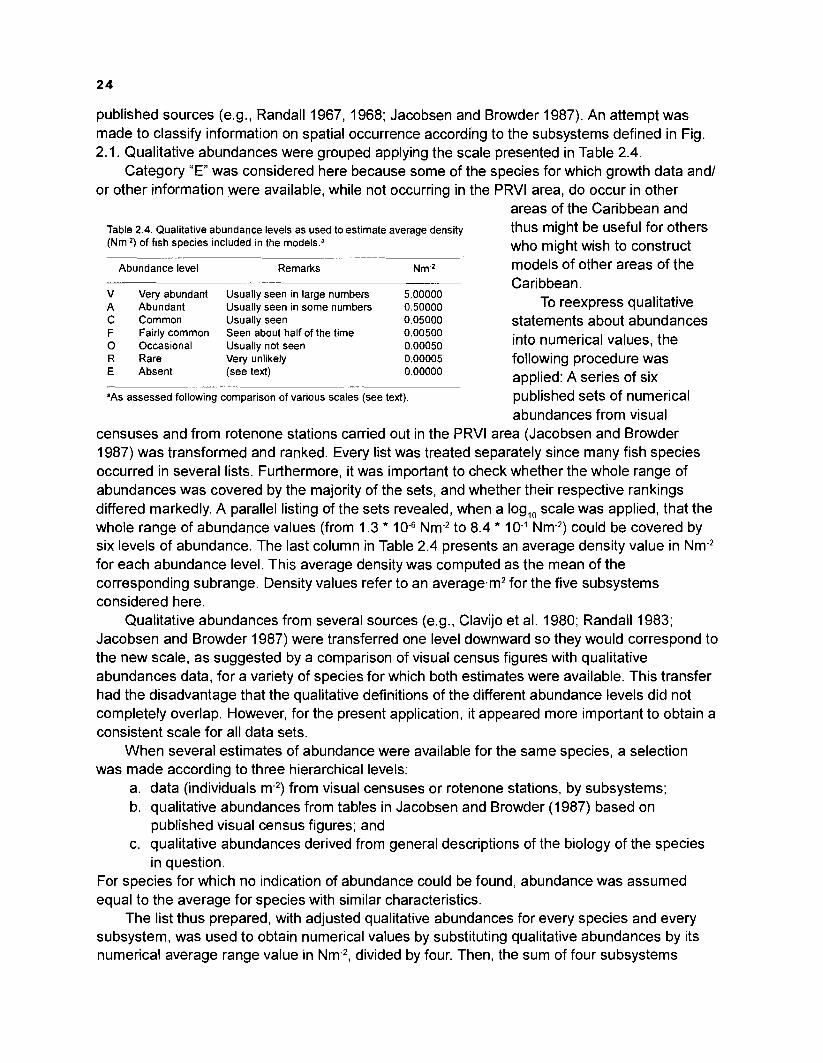
published sources (e.g., Randall 1967, 1968; Jacobsen and Browder 1987). An attempt was made to classify information on spatial occurrence according to the subsystems defined in Fig. 2.1. Qualitative abundances were grouped applying the scale presented in Table 2.4.
Category "En was considered here because some of the species for which growth data and/ or other information were available, while not occurring in the PRVl area, do occur in other
areas of the Caribbean and Table 2.4. Qualitative abundance levels as used to estimate average density thus might be useful for others (Nm-2) of fish species included in the model^.^ who might wish to construct
Abundance level Remarks Nm2 models of other areas of the Caribbean.
V Very abundant Usually seen in large numbers 5.00000 A Abundant Usually seen in some numbers 0.50000 To reexpress qualitative c Common Usually seen 0.050oo statements about abundances F Fairly common Seen about half of the time 0 Occasional Usually not seen R Rare Very uhkely E Absent (see text)
into numerical values, the o.oooo5 following procedure was o.ooooo applied: A series of six
=AS assessed following comparison of various scales (see text). published sets of numerical abundances from visual
censuses and from rotenone stations carried out in the PRVl area (Jacobsen and Browder 1987) was transformed and ranked. Every list was treated separately since many fish species occurred in several lists. Furthermore, it was important to check whether the whole range of abundances was covered by the majority of the sets, and whether their respective rankings differed markedly. A parallel listing of the sets revealed, when a log,, scale was applied, that the whole range of abundance values (from 1.3 * Nm-2 to 8.4 * 10-I Nm-2) could be covered by - six levels of abundance. The last column in Table 2.4 presents an average density value in Nm-2 for each abundance level. This average density was computed as the mean of the corresponding subrange. Density values refer to an average.m2 for the five subsystems considered here.
Qualitative abundances from several sources (e.g., Clavijo et al. 1980; Randall 1983; Jacobsen and Browder 1987) were transferred one level downward so they would correspond to the new scale, as suggested by a comparison of visual census figures with qualitative abundances data, for a variety of species for which both estimates were available. This transfer had the disadvantage that the qualitative definitions of the different abundance levels did not completely overlap. However, for the present application, it appeared more important to obtain a consistent scale for all data sets.
When several estimates of abundance were available for the same species, a selection was made according to three hierarchical levels:
a. data (individuals m-2) from visual censuses or rotenone stations, by subsystems; b. qualitative abundances from tables in Jacobsen and Browder (1987) based on
published visual census figures; and c. qualitative abundances derived from general descriptions of the biology of the species
in question. For species for which no indication of abundance could be found, abundance was assumed equal to the average for species with similar characteristics.
The list thus prepared, with adjusted qualitative abundances for every species and every subsystem, was used to obtain numerical values by substituting qualitative abundances by its numerical average range value in Nm-2, divided by four. Then, the sum of four subsystems
(seagrass beds and algal mats were combined here in one subsystem) was computed by simple addition of estimates for a species across subsystems.
2.6.2.2. NONFISH TAXA
For nonfish taxa, even rough qualitative estimates of abundance are scarce to nonexistent in coral reef systems. Although some investigations have been carried out in the PRVl reef area, they concentrated mostly on commercially exploited species, especially conchs and lobster. The limited information on abundance of nonfish taxa that were identified in the course of this work may be found in Table 3.9 in the "Results" section.
2.6.3. Biomass
2.6.3.1 . FISH SPECIES
The biomass in g per m2wet weight (gm-2WW) of each fish species was calculated by multiplying the average numerical abundance obtained as described above with the mean individual weight of the corresponding species. Mean individual weight (Wmean) was obtained through
with Wm being asymptotic weight in gWW and assuming that the mean weight corresponds roughly to 30% of maximum weight, itself about 86% of the asymptotic weight (see equation 2.6). Note that this definition of W,,,, implies that the bulk of the biomass is comprised by late juveniles and young adults.
2.6.3.2. NONFISH TAXA
Many of the biomass values for nonfish taxa were indicated in the corresponding references in units other than wet (=live) weight. A summary of the conversion factors used for the computation of biomass and PIB values for nonfish taxa is given in Table 2.5.
2.6.3.3. DETRITUS BIOMASS
The following empirical equation was derived by Pauly et al. (1993a, Appendix IV) to obtain rough estimates of detritus biomass (D, gCm-2) as a function of primary production (PP, gCm-2 year1) and euphotic depth (E, in m):
Fifty-two percent of the variation (R = 0.718) in the data set was explained by equation (2.12), so the fit is not tight. However, the biomass of detritus (as opposed to the flows in and out of this box) is not an important parameter and hence the low precision of estimates for (2.13) may be /
acceptable here.
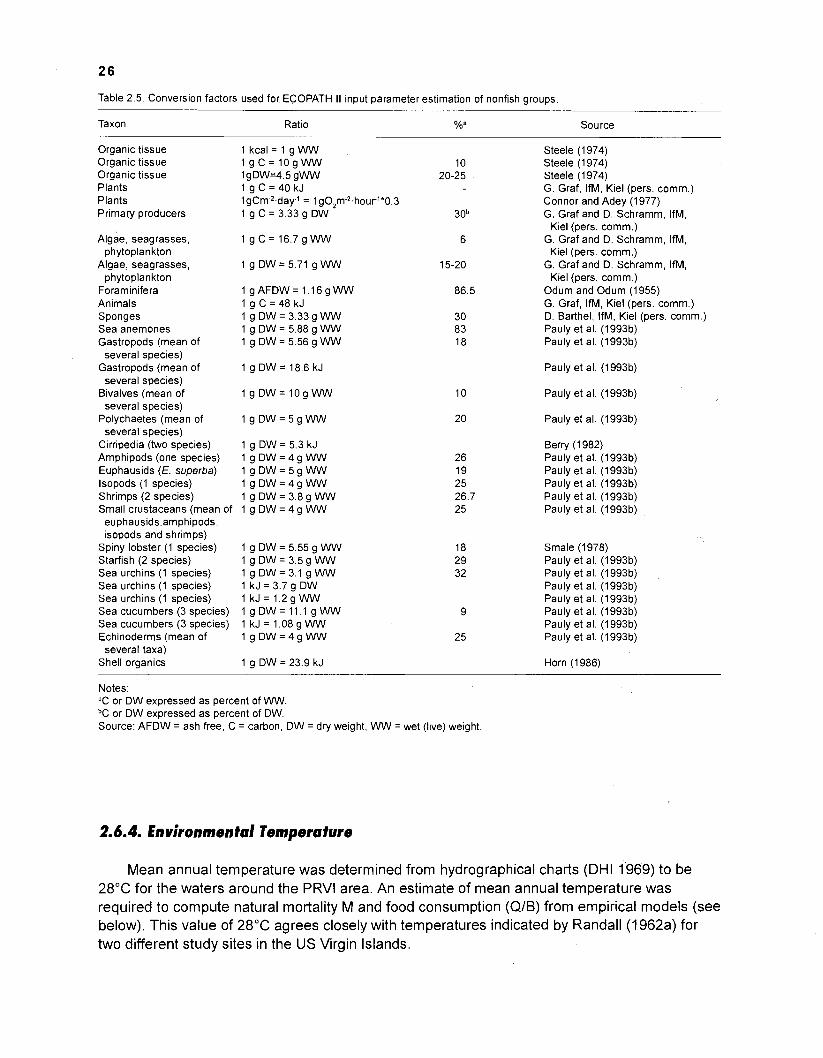
Table 2.5. Conversion factors used for ECOPATH II input parameter estimation of nonfish groups. -
Taxon Ratio %a Source
Organic tissue Organic tissue Organic tissue Plants Plants Primary producers
1 kcal = I g WW l g C = l O g W W lgDW=4.5 gWW 1 g C = 4 0 k J IgCm-2.day-f = Ig0,m-2~hourf*0.3 1 g C = 3.33 g DW
Algae, seagrasses, phytoplankton
Algae, seagrasses, phytoplankton
Foraminifera Animals Sponges Sea anemones Gastropods (mean of
several species) Gastropods (mean of
several species) Bivalves (mean of
several species) Polychaetes (mean of
several species) Cirripedia (two species) Amphipods (one species) Euphausids (E. superba) lsopods (1 species) Shrimps (2 species) . . . Small crustaceans (mean of
euphausids,amphipods, isopods and shrimps)
Spiny lobster (1 species) Starfish (2 species) Sea urchins (1 species) Sea urchins (1 species) Sea urchins (1 species) Sea cucumbers (3 species) Sea cucumbers (3 species) Echinoderms (mean of
several taxa) Shell organics
Steele (1 974) Steele (1 974) Steele (1 974) G. Graf, IfM, Kiel (pers. comm.) Connor and Adey (1 977) G. Graf and D. Schramm, IfM,
Kiel (pers. comm.) G. Graf and D. Schramm, IfM,
Kiel (pers. comm.) G. Graf and D. Schramm, IfM,
Kiel (pers. comm.) Odum and Odum (1955) G. Graf, IfM, Kiel (pers. comm.) D. Barthel, IfM, Kiel (pers. comm.) Pauly et al. (1993b) Pauly et al. (1993b)
Pauly et al. (1993b)
Pauly et al. (1 993b)
Pauly et al. (1993b)
Berry (1 982) Pauly et al. (1993b) Pauly et al. (1993b) Pauly et al. (1993b) Pauly et al. (1993b) Pauly et al. (1993b)
Smale (1 978) Pauly et al (199313) Pauly et al (199313) Pauly et al (1993b) Pauly et al (1993b) Pauly et al (1993b) Pauly et al (1993b) Pauly et al (1993b)
Horn (1 986)
Notes: "C or DW expressed as percent of WW. bC or DW expressed as percent of DW. Source: AFDW = ash free, C = carbon, DW = dry weight, WW = wet (live) weight
2.6.4. Environmental Temperature
Mean annual temperature was determined from hydrographical charts (DHI 1969) to be 28°C for the waters around the PRVl area. An estimate of mean annual temperature was required to compute natural mortality M and food consumption (QIB) from empirical models (see below). This value of 28°C agrees closely with temperatures indicated by Randall (1 962a) for two different study sites in the US Virgin Islands.
2.6.5. Production/Biomass Ratio
Under certain conditions mentioned above, the P/B ratio is equal to total mortality Z or natural mortality M (in case of no fishing) of a population of fish or invertebrates. Given the assumption of zero fishing mortality made here, the literature was searched for published values of M (or of Z in unexploited systems).
When natural mortality (or Z) was indicated as a percentage, or as percentage survival, the estimate was transformed into an exponential rate based on:
where Nt is the number of fish in a given cohort at time t and No is the initial number of fish. In cases where no values of M for fishes or invertebrates with high metabolic rate could be
found, this parameter was estimated by means of an empirical model derived by Pauly (1980), of the form
and
where Lm and Wm refer to asymptotic length in cm and asymptotic weight in g, respectively, K refers to year1 and T is the mean annual temperature in "C of the water in which the stock in question lives (i.e., 28"C, see above). Estimates of natural mortality M for clupeoid species obtained via equation (2.15) or (2.16) were corrected with M * 0.6 as suggested by Pauly (1980). In the case of the low-metabolism echinoderms (sea urchins, holothuroids), M was assumed to be lower than implied by equation (2.15) or (2.16), i.e., about equal to K (as was demonstrated to be appropriate for tropical sea urchins by Longhurst and Pauly 1987).
2.6.6. Food Consumption per Unit Biomass (Q/BI
One of the key input parameters in ECOPATH I as well as in ECOPATH II is the food consumption of a species (group). Polovina (1984a,b) called this input the "food required" (FR). Pauly (1986), instead, used the expression "food consumption per unit biomass" (QIB) and defined it as the number of times an age-structured population of fish consumes its own weight per year. In the forthcoming, QIB shall be used sensu Pauly.
Published data on food consumption of tropical reef fishes and invertebrates are scarce. Thus, Polovina (1984a,b,c), in the absence of appropriate data, used estimates of consumption by Pacific salmon for the reef fishes in the ECOPATH modelling of French Frigate Shoals, Northern Hawaiian Islands Furthermore, all reef invertebrates, except squids, lobsters and crabs, were lumped together as "heterotrophic benthos" with one common estimate of QIB. Menzel (1958,1960) was one of the firsts to carry out food conversion experiments on coral reef fishes using two species from Bermuda, the herbivorous Holacanthus bermudensis (Pomacanthidae) and the carnivorous Epinephelus guttatus (Serranidae) for his experiments.
To date a series of methods exists for estimating the quantity of food eaten by a fish population during a certain period of time (e.g., Bajkov 1935; Beverton and Holt 1957; Ursin 1967; Elliot and Persson 1978; Jobling 1981 ; Daan 1973, 1983; Andersen 1982; Armstrong et al. 1983; Durbin et al. 1983; Rice et al. 1983; Stewart et al. 1983; Majkowski and Hearns 1984; and Pennington 1984). Most of the available methods are based on combining stomach contents data obtained from the field with experimental results. These parameters then allow for the determination of transition rates for stomach contents. Such investigations require a great number of stomachs because of the generally high variabilities of stomach contents in natural fish populations. This requirement is generally difficult to meet with regard to coral reef fishes which abundances are often rather low. In addition to this, reefs are unsuited for trawl fishing for obvious reasons and, instead, fishes on reefs and in adjacent areas are caught by a wide variety of gears from traps to hook and lines. Therefore, catches and hence stomach contents are usually not representative. Fishes, when trap-caught, may consume prey usually unavailable to them. Also the mean weight of the food in the stomach of fishes caught with hook and lines, tends to be underestimated because generally "hungry" fish are caught.
Another approach to estimate the food consumption is by executing laboratory or pond feeding experiments. According to Mann (1 978), extrapolations of food consumption estimates from laboratory experiments to natural conditions can be divided into direct and indirect methods. The direct methods attempt to simulate natural conditions in the laboratory by imitating environmental variables such as temperature, salinity, food type, availability of food, water movements, die1 cycles, etc., as well as the growth rates of fish occurring in the field. Because of practical difficulties in meeting all of these requirements, indirect methods have evolved. Indirect estimates usually use nitrogen and/or energy budgets as a basis for the prediction of food requirements of fish under a range of conditions (Ivlev 1939, 1961 ; Winberg 1956; Gerking 1962). Although more assumptions than in the direct method are involved, the indirect approach leaves more space for the incorporation of the effects of environmental variables. A detailed discussion of the subject can be found in Mann (1 978).
2.6.6.1 . THE FOOD CONSUMPTION MODEL
As a contribution to the indirect approach, an analytical method for the estimation of Q/B has been developed by Pauly (1986) which may be applied in cases where stomach analyses from field samples cannot be carried out. The method links up estimates of gross food conversion efficiency, obtained from laboratory experiments, with field data on growth. Thus, it aims to make the best use of available data from laboratory or pond experiments without the need for extensive field sampling of stomachs. By combining experimental and field data, this model reduces the effects of two sources of bias from experimental data on food conversion: (1) experimental fish are most often given a higher ration than is available to them in nature (Windell 1978); and (2) captive fish are usually stressed and therefore have lower conversion efficiencies than in nature (Pauly 1986).
Pauly's model assumes that the population under consideration is in a steady state and that the fish (or invertebrate) grows according to the von Bertalanffy theory of growth (von Bertalanffy 1934, 1938, 1951 ; Pauly 1984). Note that these assumptions are also inherent to the reef ecosystem model developed here.
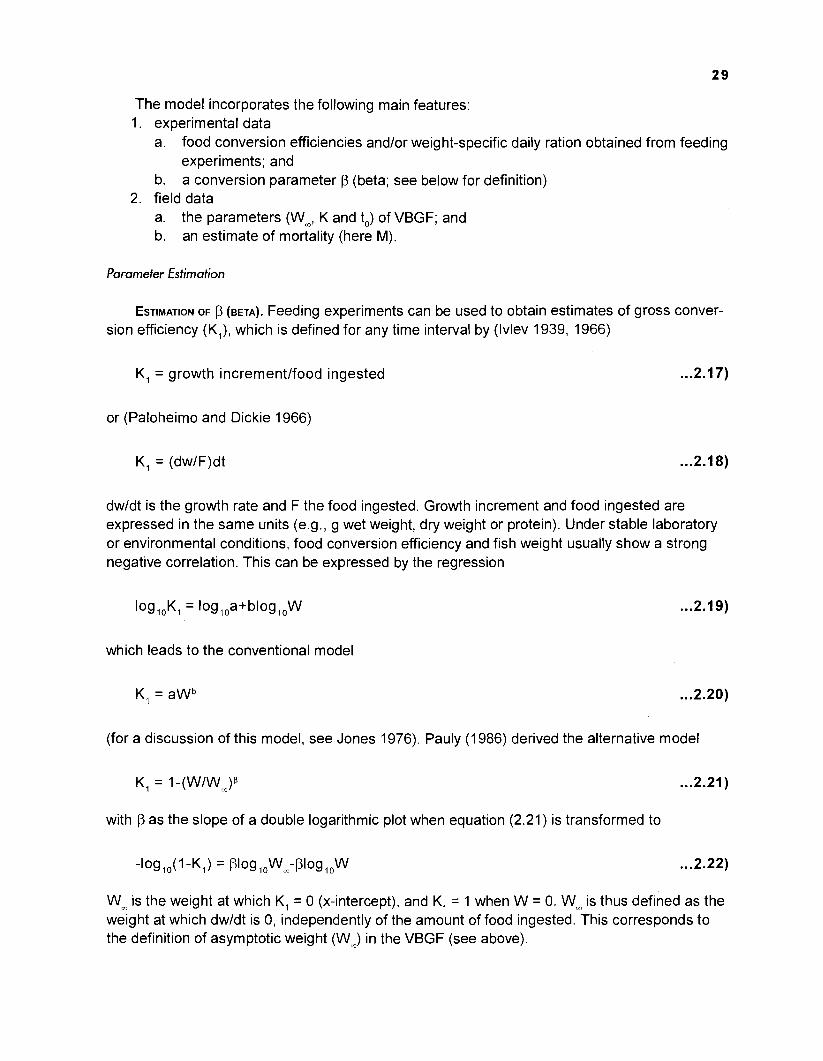
The model incorporates the following main features: 1. experimental data
a. food conversion efficiencies and/or weight-specific daily ration obtained from feeding experiments; and
b. a conversion parameter p (beta; see below for definition) 2. field data
a. the parameters (W,, K and to) of VBGF; and b. an estimate of mortality (here M).
Parameter Estimation
ESTIMATION OF (BETA). Feeding experiments can be used to obtain estimates of gross conver- sion efficiency (K,), which is defined for any time interval by (Ivlev 1939, 1966)
K, = growth incrementlfood ingested
or (Paloheimo and Dickie 1966)
dwldt is the growth rate and F the food ingested. Growth increment and food ingested are expressed in the same units (e.g., g wet weight, dry weight or protein). Under stable laboratory or environmental conditions, food conversion efficiency and fish weight usually show a strong negative correlation. This can be expressed by the regression
which leads to the conventional model
(for a discussion of this model, see Jones 1976). Pauly (1 986) derived the alternative model
with p as the slope of a double logarithmic plot when equation (2.21) is transformed to
Wm is the weight at which K, = 0 (x-intercept), and K, = 1 when W = 0. Wm is thus defined as the weight at which dwldt is 0, independently of the amount of food ingested. This corresponds to the definition of asymptotic weight (W,) in the VBGF (see above).
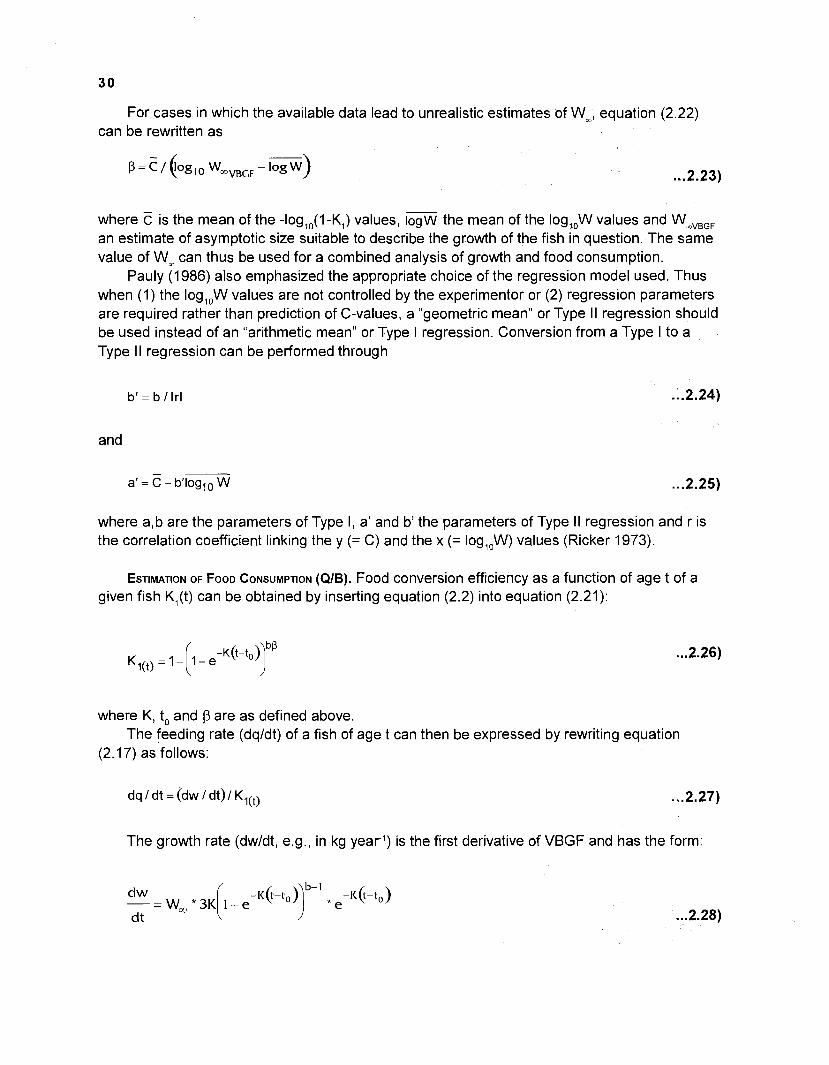
For cases in which the available data lead to unrealistic estimates of Wm, equation (2.22) can be rewritten as
where C is the mean of the - l~g,~( l -K,) values, logW the mean of the log,,W values and WmVBGF an estimate of asymptotic size suitable to describe the growth of the fish in question. The same value of Wm can thus be used for a combined analysis of growth and food consumption.
Pauly (1986) also emphasized the appropriate choice of the regression model used. Thus when (1) the log,,W values are not controlled by the experimentor or (2) regression parameters are required rather than prediction of C-values, a "geometric mean" or Type II regression should be used instead of an "arithmetic mean" or Type I regression. Conversion from a Type I to a Type II regression can be performed through
and
where a,b are the parameters of Type I, a' and b' the parameters of Type II regression and r is the correlation coefficient linking the y (= C) and the x (= log,,W) values (Ricker 1973).
ESTIMATION OF FOOD CONSUMPTION (QIB). Food conversion efficiency as a function of age t of a given fish K,(t) can be obtained by inserting equation (2.2) into equation (2.21):
where K, to and p are as defined above. The feeding rate (dqldt) of a fish of age t can then be expressed by rewriting equation
(2.17) as follows:
The growth rate (dwldt, e.g., in kg year1) is the first derivative of VBGF and has the form:
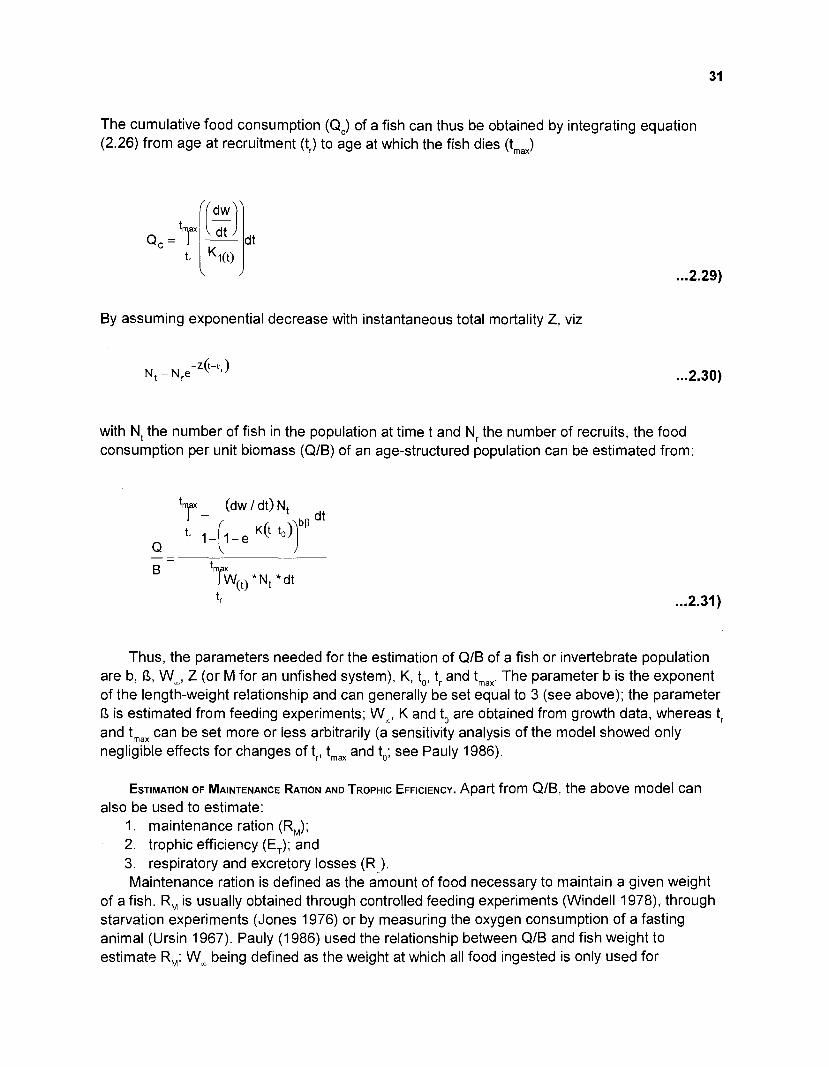
The cumulative food consumption (Q,) of a fish can thus be obtained by integrating equation (2.26) from age at recruitment (t,) to age at which the fish dies (tmax)
By assuming exponential decrease with instantaneous total mortality 2, viz
with N, the number of fish in the population at time t and Nr the number of recruits, the food consumption per unit biomass (QIB) of an age-structured population can be estimated from:
(dw 1 dt) Nt
Q -- -
Thus, the parameters needed for the estimation of QIB of a fish or invertebrate population are b, 8, Wm, Z (or M for an unfished system), K, to, tr and tmax The parameter b is the exponent of the length-weight relationship and can generally be set equal to 3 (see above); the parameter I3 is estimated from feeding experiments; Wm, K and to are obtained from growth data, whereas tr and tmax can be set more or less arbitrarily (a sensitivity analysis of the model showed only negligible effects for changes of tr, tmax and to; see Pauly 1986).
ESTIMATION OF MAINTENANCE RATION AND TROPHIC EFFICIENCY. Apart from QIB, the above model can also be used to estimate:
1. maintenance ration (R,); 2. trophic efficiency (E,); and 3. respiratory and excretory losses (R,). Maintenance ration is defined as the amount of food necessary to maintain a given weight
of a fish. R, is usually obtained through controlled feeding experiments (Windell 1978), through starvation experiments (Jones 1976) or by measuring the oxygen consumption of a fasting animal (Ursin 1967). Pauly (1 986) used the relationship between QIB and fish weight to estimate R,: Wc being defined as the weight at which all food ingested is only used for
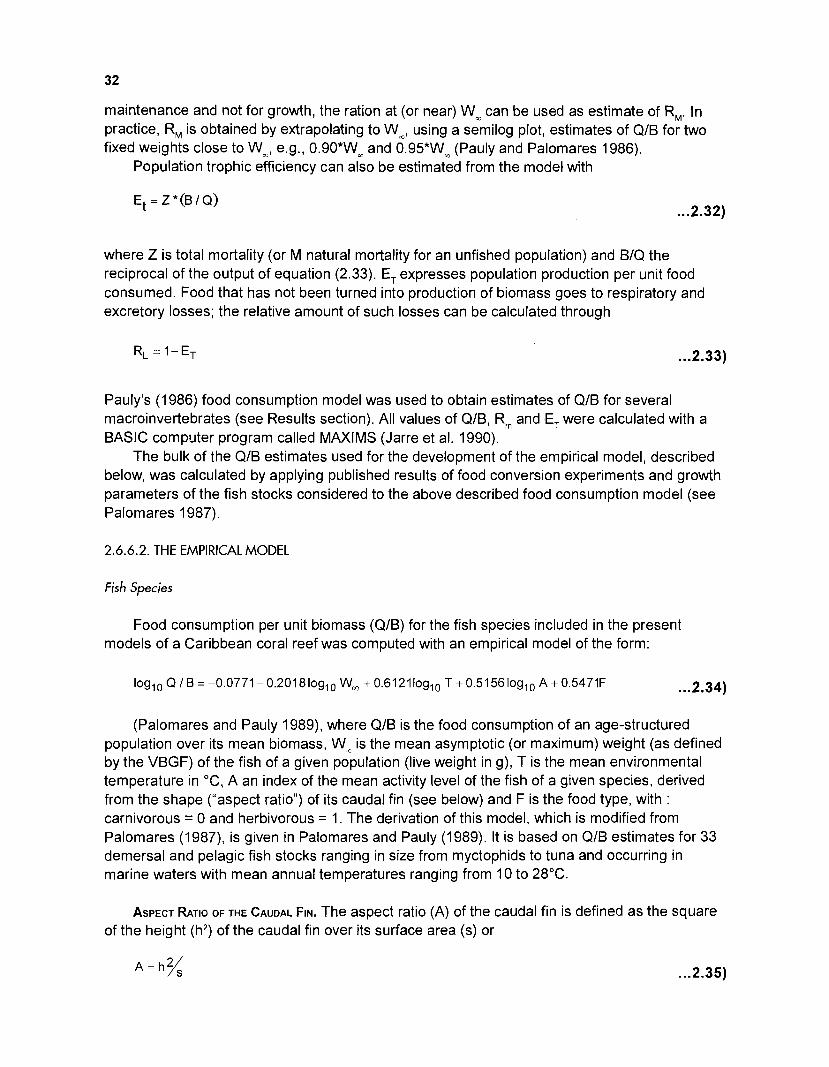
maintenance and not for growth, the ration at (or near) Wm can be used as estimate of R,. In practice, R, is obtained by extrapolating to Wm, using a semilog plot, estimates of QIB for two fixed weights close to Wm, e.g., 0.90XWm and 0.95*Wm (Pauly and Palomares 1986).
Population trophic efficiency can also be estimated from the model with
where Z is total mortality (or M natural mortality for an unfished population) and BIQ the reciprocal of the output of equation (2.33). E, expresses population production per unit food consumed. Food that has not been turned into production of biomass goes to respiratory and excretory losses; the relative amount of such losses can be calculated through
Pauly's (1 986) food consumption model was used to obtain estimates of QIB for several macroinvertebrates (see Results section). All values of QIB, Rm and E, were calculated with a BASIC computer program called MAXIMS (Jarre et al. 1990).
The bulk of the QIB estimates used for the development of the empirical model, described below, was calculated by applying published results of food conversion experiments and growth parameters of the fish stocks considered to the above described food consumption model (see Palomares 1987).
2.6.6.2. THE EMPIRICAL MODEL
Fish Species
Food consumption per unit biomass (QIB) for the fish species included in the present models of a Caribbean coral reef was computed with an empirical model of the form:
(Palomares and Pauly 1989), where QIB is the food consumption of an age-structured population over its mean biomass, Wm is the mean asymptotic (or maximum) weight (as defined by the VBGF) of the fish of a given population (live weight in g), T is the mean environmental temperature in "C, A an index of the mean activity level of the fish of a given species, derived from the shape ("aspect ratio") of its caudal fin (see below) and F is the food type, with : carnivorous = 0 and herbivorous = 1. The derivation of this model, which is modified from Palomares (1987), is given in Palomares and Pauly (1989). It is based on QIB estimates for 33 demersal and pelagic fish stocks ranging in size from myctophids to tuna and occurring in marine waters with mean annual temperatures ranging from 10 to 28°C.
ASPECT RATIO OF THE CAUDAL FIN. The aspect ratio (A) of the caudal fin is defined as the square of the height (h2) of the caudal fin over its surface area (s) or
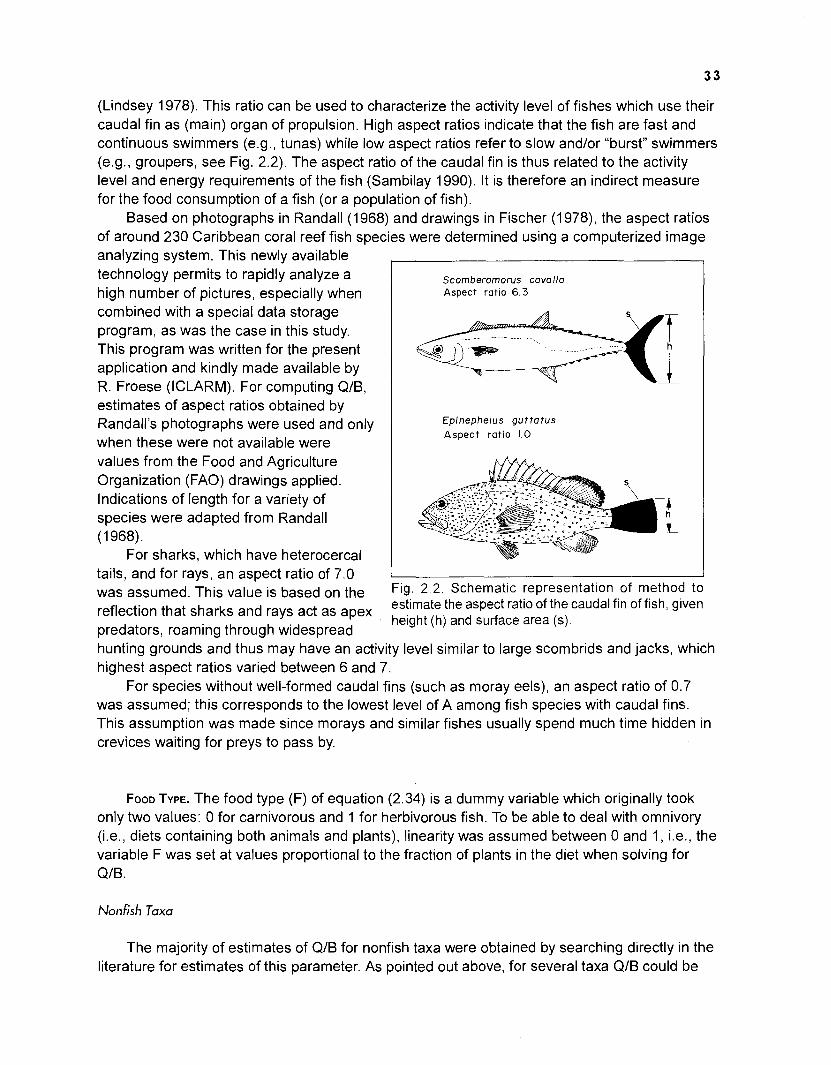
3 3
(Lindsey 1978). This ratio can be used to characterize the activity level of fishes which use their caudal fin as (main) organ of propulsion. High aspect ratios indicate that the fish are fast and continuous swimmers (e.g., tunas) while low aspect ratios refer to slow andlor "burst" swimmers (e.g., groupers, see Fig. 2.2). The aspect ratio of the caudal fin is thus related to the activity level and energy requirements of the fish (Sambilay 1990). It is therefore an indirect measure for the food consumption of a fish (or a population of fish).
Based on photographs in Randall (1968) and drawings in Fischer (1978), the aspect ratios of around 230 Caribbean coral reef fish species were determined using a computerized image analyzing system. This newly available
I
technology permits to rapidly analyze a high number of pictures, especially when combined with a special data storage program, as was the case in this study. This program was written for the present application and kindly made available by R. Froese (ICLARM). For computing QIB, estimates of aspect ratios obtained by Randall's photographs were used and only when these were not available were values from the Food and Agriculture Organization (FAO) drawings applied. Indications of length for a variety of species were adapted from Randall (1 968).
For sharks, which have heterocercal
Scornberornorus cavaila Aspect ratio 6.3
Epinephelus gut ta tus Aspect ratio 1.0
tails, and for rays, an aspect ratio of 7.0 1 was assumed, hi^ value is based on the Fig. 2.2. Schematic representation of method to
reflection that sharks and rays act as apex estimate the aspect ratio of the caudal fin of fish, given height (h) and surface area (s).
predators, roaming through widespread hunting grounds and thus may have an activity level similar to large scombrids and jacks, which highest aspect ratios varied between 6 and 7.
For species without well-formed caudal fins (such as moray eels), an aspect ratio of 0.7 was assumed; this corresponds to the lowest level of A among fish species with caudal fins. This assumption was made since morays and similar fishes usually spend much time hidden in crevices waiting for preys to pass by.
FOOD TYPE. The food type (F) of equation (2.34) is a dummy variable which originally took only two values: 0 for carnivorous and 1 for herbivorous fish. To be able to deal with omnivory (i.e., diets containing both animals and plants), linearity was assumed between 0 and 1, i.e., the variable F was set at values proportional to the fraction of plants in the diet when solving for QIB.
Nonfish Taxa
The majority of estimates of QIB for nonfish taxa were obtained by searching directly in the literature for estimates of this parameter. As pointed out above, for several taxa QIB could be
estimated through the food consumption model (Pauly 1986), i.e., via P as obtained from published estimates on food conversion or daily ration and from growth parameters.
I also attempted to estimate QIB from data on energy metabolism, i.e., from oxygen consumption estimates. This approach yielded, for reasons not explored here, excessively high consumption estimates and was therefore abandoned.
Consumption values from the literature were adjusted to a mean annual temperature of 28"C, prevailing in the Caribbean waters around the Virgin Islands, through a reexpression of the slope associated with temperature in equation (2.34), i.e.,
V is the factor for temperature adjustment, T the temperature at PRVl (i.e., 28°C) and T' the original habitat or experimental temperature.
2.7. Diet Composition Matrix
It was known from a previous application of ECOPATH II to the Peruvian upwelling system (Jarre et al. 1991), that changes in the diet composition had a strong impact on model structure. Therefore, the diet matrix of the present modelling work was elaborated as carefully as possible for the species groups involved.
2.7. I. Fish Speties
The data for the diet composition matrix DC,, were obtained primarily from a study carried out in St. John, US Virgin Islands, by Randall (1967).
The results of Randall's stomach contents analyses were given in percent of volume of the different major groups of food organisms. This is roughly equivalent to relative weight and thus, approximates the relative amounts of energy extracted by consumers from various system components (MacDonald and Green 1983).
The taxonomic level of the organisms identified by Randall (1967) from fish stomachs varied from species to families and higher categories, with most of the invertebrates grouped under the higher categories. Fishes, on the other hand, were identified mostly to generic or specific level without indication of percentage volume of the single genus or species. For the construction of the DC matrix, the percentages of "fish" were divided into equal parts between all the genera and species listed as prey for the respective fish species. When fish were identified only to family or generic level, the respective percent of volume was distributed evenly over all species of the family or the genus represented in the matrix. Only 18 fish species appeared as prey but not as predators. Their share was distributed evenly over all the species of the same family or genus considered in the matrix. Species of families that were not represented in the matrix were considered as "unidentified" fish (FO). The FO in the matrix contains also all cases where the share of fish in a diet was not identified to a lower taxonomic category.
Unidentified stomach contents were assigned to the identified parts according to the relative-abundance of the latter. Eggs and larvae were assigned as "zooplankton", together with
a variety of other organisms (see Appendix 8.5.3). In Randall's study, "algae and organic detritus1' were listed as a combined item in many cases. Their relative contribution was divided into two equal parts. The symbiotic coral-algae complex was separated into a producer and a consumer component; when a fish species' diet included the item "corals", the corresponding percentage was divided into two shares with 60% of it for plant tissue (benthic algae) and 40% for animal tissue (corals).
Only five species of sharks, four of the family Carcharhinidae and one of the family Ginglymostomatidae were included in Randall's study. These five species were represented only by few individuals, many of which had (nearly) empty stomachs. The same was true for stomach analyses of the two species of rays included in the model. Diet for cartilaginous species was generally stated as "fish", preliminarily included into the food matrix under the label FO. Randall's list of shark species was completed by including more sharks with affinities to coral reefs of the PRVl area, based on accounts in Fischer (1978). From qualitative descriptions of the diet composition given therein, quantitative shares were estimated for each food item according to the already existing DC matrix. The item "fish" or "small fish" was most difficult to translate into quantitative information. It was assumed that, when part of the diet was stated to be "fish", every fish species in the system had the same probability of being a victim of a shark's appetite. So the generalization "feeds on fishes" was translated by distributing 100% (minus the part of the diet represented by invertebrates) into equal percentages over all fish species in the DC matrix. Excluded were (1) species larger than the one under consideration and (2) reef fish species with Wm < 100 g. The latter restriction was adopted based on the notion that a large animal, such as a tiger shark, weighing about half a ton, would generally not manage to extract gobies, blennies, damselfishes, etc., of 10-20 g from between the coral heads and other crevices. When the diet, or part of it, was stated to be "pelagic fish", this was divided into the pelagic species in the DC matrix. When a shark fed on "small pelagic fish" the same procedure was applied, but excluding the scombrids and large jacks from the list of possible candidates. When the food or part of it consisted of "small fish", the diet was distributed evenly over all species with Wm < 1,000 g. The weight limits are arbitrary. Such arbitrary limits were necessary, however, since a rigorous definition of what a "small fish" is does not exist.
The relative contribution of fish versus nonfish taxa is also arbitrary. The only restriction was the statement "feeds mainly on...". In such cases, the diet part referred to was considered to represent from 60% to 80% of the total diet.
To establish a diet matrix for the nonfish taxa, the food items of fish stomachs analyzed by Randall (1967) were listed under their corresponding taxon together with the number of fish species for which an item was stated as part of the diet (see Appendix Tables 8.5.1 and 8.5.2). Based on this listing, a search of the Aquatic Sciences and Fisheries Abstracts (ASFA) database was carried out and ca. 300 publications were selected. Since quantitative information on diet composition of coral reef invertebrates is still scarce (see also Lewis 1981), the quantitative diet composition of each taxon was estimated in many cases from qualitative or rough quantitative information and/or was transferred from ecosystems other than coral reefs.
For the construction of the DC matrix, all percentages of volume were reexpressed as fraction of one.
2.8. Aggregation of Species and Taxa
2.8.1. First Reduction
ECOPATH 11, as presently implemented, allows a maximum input of 50 species groups. This restriction made it necessary to reduce the initial number of fish species (over 200) and 41 nonfish taxa into 50 species groups. The procedures used for this reduction are described below.
2.8.1 .l. FISH SPECIES
A set of ecologically meaningful criteria was needed by which the fish species could be aggregated into species groups, using cluster analysis. Since I was concerned with a model of energy flow, variables which relate to flows between elements of the system had to be identified. These variables must necessarily relate to the factors which determine the food consumption of a species. Referring to the section on "Food consumption (QIB)", these variables are: ( I ) size, (2) activity level and (3) type of food. These variables were parametrized as in equation (2.34)) using: (1) size = asymptotic weight Wm in g; (2) activity level = aspect ratio A; and (3) type of food = degree of herbivory, in %. These three were treated as being of equal importance. Prior to the aggregation of fish species into species groups by cluster analysis, two of the three variables were transformed such that they evenly covered a range of values.
Asymptotic weights (originally in g wet weight) were reexpressed in logarithmic form and thus reduced to values between 0 and 6. Food type was divided by 10 and thus ranged then from 0 to 10. A value of 0 corresponded now to 100% carnivory and a value of 10-1 00% herbivory. Aspect ratio was not transformed since this evenly covered values between 0.7 and 7.0.
To determine whether the three variables were correlated, a factor analysis was carried out. According to Backhaus et al. (1 986), prior to the execution of a cluster analysis on a given set of elements and variables, it is advisable to carry out a factor analysis to detect dependent variables and exclude them from the aggregation process. The factor analysis showed that the variables were largely independent, except for a negligible correlation between aspect ratio and size (Fig. 2.3).
Cluster analysis was performed, using the prepared matrix of 243 fish species and 3 variables. "Quadratic Euclidean distance (QED)" was selected as index of dissimilarity. By relying on the square of the distance between the variables of two elements, this index emphasizes large distances.
Three hierarchical agglomerative cluster-algorithms were applied to the matrix of input data: (1) "average linkage", (2) "centroid1' and (3) "ward". All three are conservative algorithms (they have no contracting or dilating effect on the grouping process) and may be used with measures of dissimilarity (e.g., QED). "Average linkage" and "ward" are monotonous algorithms where the measure of dissimilarity (QED) increases monotonously with decreasing number of clusters. "Ward" has the exclusive feature of forming groups of similar sizes, i.e., groups with a similar number of elements. By comparison of the results (clusters) obtained by the three algorithms, "average linkage" was finally selected to be most appropriate. The species groups aggregated by this algorithm represented best the conditions in the reef, even with reference to the habitat of certain species groups (see below).
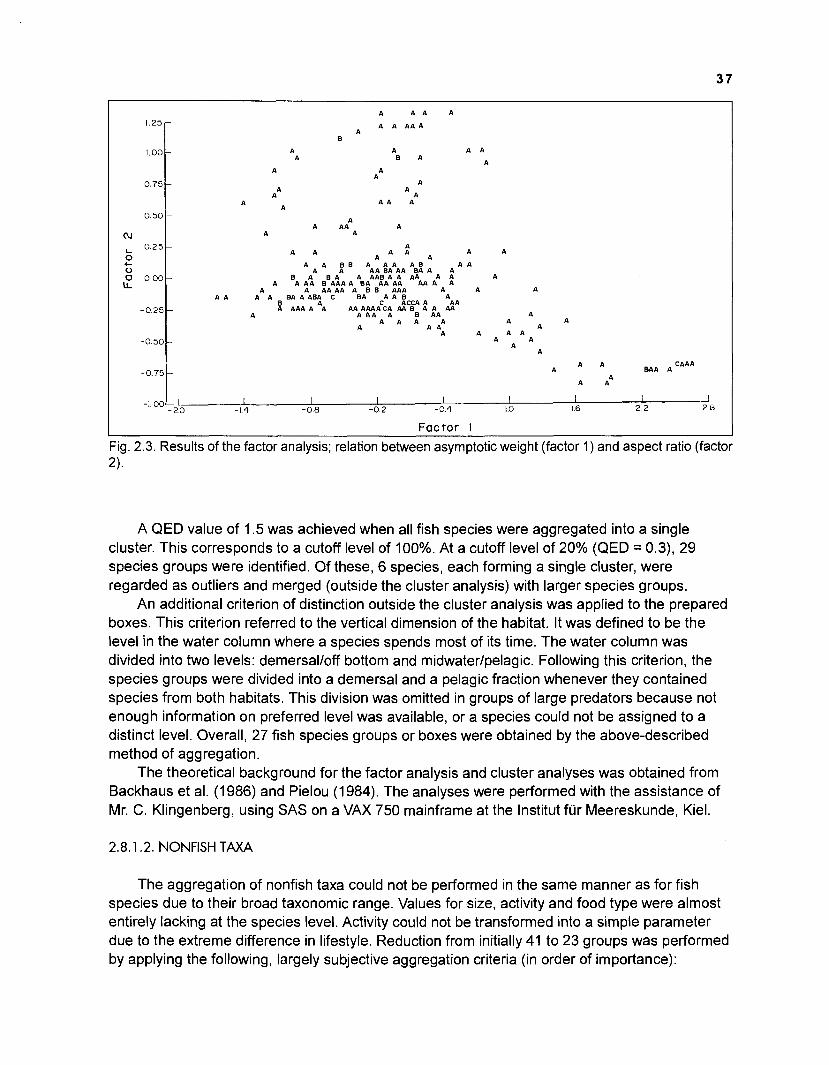
A A A A A
8
A A
A A B A A
B A B A A A A B AAn
A AA AA BA A ABA C
AAA A A
BAA A CAAA
- 1 00 h l I I I I I I I I - 2 0 -1.4 -0.8 -0.2 -0.4 1.0 1.6 2.2 2 8
Factor I
Fig. 2.3. Results of the factor analysis; relation between asymptotic weight (factor 1) and aspect ratio (factor 2).
A QED value of 1.5 was achieved when all fish species were aggregated into a single cluster. This corresponds to a cutoff level of 100%. At a cutoff level of 20% (QED = 0.3), 29 species groups were identified. Of these, 6 species, each forming a single cluster, were regarded as outliers and merged (outside the cluster analysis) with larger species groups.
An additional criterion of distinction outside the cluster analysis was applied to the prepared boxes. This criterion referred to the vertical dimension of the habitat. It was defined to be the level in the water column where a species spends most of its time. The water column was divided into two levels: demersalloff bottom and midwaterlpelagic. Following this criterion, the species groups were divided into a demersal and a pelagic fraction whenever they contained species from both habitats. This division was omitted in groups of large predators because not enough information on preferred level was available, or a species could not be assigned to a distinct level. Overall, 27 fish species groups or boxes were obtained by the above-described method of aggregation.
The theoretical background for the factor analysis and cluster analyses was obtained from Backhaus et al. (1 986) and Pielou (1 984). The analyses were performed with the assistance of Mr. C. Klingenberg, using SAS on a VAX 750 mainframe at the lnstitut fijr Meereskunde, Kiel.
2.8.1.2. NONFISH TAXA
The aggregation of nonfish taxa could not be performed in the same manner as for fish species due to their broad taxonomic range. Values for size, activity and food type were almost entirely lacking at the species level. Activity could not be transformed into a simple parameter due to the extreme difference in lifestyle. Reduction from initially 41 to 23 groups was performed by applying the following, largely subjective aggregation criteria (in order of importance):
1. Availability of estimates of PIB and QIB: Estimates of these two input parameters were only available for 24 of the 41 taxa. Fortunately, most of the taxa for which estimates could be obtained were definitely of great importance to reef metabolism.
2. Size: Rough indications of size for the majority of taxa were obtained from Barnes' (1 963) Invertebrate Zoology. For some, size indications were encountered while compiling estimates of PIB and QIB of nonfish taxa. Size was roughly scaled into four groups: small, medium, large, very large. It was assumed that, for taxa with a wide spectrum of sizes (e.g., polychaetes, gastropods), the average size contributed the bulk of biomass to the respective box.
3. Similarity of diet composition: Diet composition was reduced to six compartments: detritus, benthic producers/symbiotic algae, phytoplankton, microfauna, zooplankton, macroinvertebrateslfish.
4. Similarity of lifestyle: Sessile, semisessile, burrowing in bottom or calcareous skeletons, free living, filtering, grazing, scavenging, predatory were the categories considered.
5. Taxonomic closeness: This feature was used in cases (e.g., coralslsea anemones) where the preceding criteria were not applicable or did not allow a decision because, e.g., the lifestyles were too different, as in the case of sessile or slow-moving organisms which had no adequate group to be pooled with in terms of sizes or diet compositions.
2.8.2. Weighting Within Species Groups
To obtain a reasonable distribution of food percentages within the species groups, these had to be weighted by considering throughput of every species belonging to the respective group. A weighting factor (WF) was computed for every species through
where Wmean is as defined for equation (2.12) above, AB is the abundance of a species in Nm-2 and QIB the annual food consumption per unit biomass.
2.8.3. Combining Species Groups
Single fish species and nonfish taxa were combined into the respective groups according to the results of the aggregation procedure.
2.8.3.1. P/B RATIO AND FOOD CONSUMPTION (Q/B)
A group estimate of PIB ratio and QIB was obtained from the median of the respective parameter for each group of estimates for single species or taxon.
2.8.3.2. DIET COMPOSITION MATRIX
For the condensation of the DC matrix, groups had to be combined vertically (columns) and horizontally (rows). All columns and rows belonging to one group were summed up. Thus, each row in the reduced DC matrix represented a predator group and each column a prey group. To bring the sum of a row back to unity (all values had formerly been multiplied by the
corresponding weighting factor, see above), each value in a row was divided by the sum of the row:
where dij is the weighted jth value of species group i, k is the number of columns and d,' the resulting part of 1.0 in column j of group i. This procedure was carried out for each species group and each level of aggregation.
2.8.4. Second Reduction of Species Groups
The initial 50-box model was still rather difficult to handle and visualize. For this reason, and also to find out whether information on the energy flow is lost when the system is further aggregated, the number of boxes was further reduced. Models with an equal number of boxes generated by two different methods of reduction were also compared.
2.8.4.1. METHOD 1 : CLUSTER ANALYSIS + INTUITION
Fish Groups
The fish groups were further reduced by increasing the average distance (expressed by the dissimilarity index QED) between clusters. Two additional cutoff levels of 40% and 50% were selected. After separating the "pelagic-midwater" from the "demersal-off bottom" species, two sets with nine, respectively, four fish species groups were obtained. Combining groups was achieved by computing a mean (weighted by biomass) for the three key input parameters. The DC values were computed as weighted means (by throughput = biomass * consumption) from the groups of which they consisted.
Nonfish Groups
The nonfish groups were again difficult to reduce, especially because no standardized criterion could be identified for lumping nonfish groups with each other and with fish groups, a necessary procedure when reducing the boxes of the system ( ~ 2 0 ) . Based on diet composition, size and lifestyle, boxes were combined intuitively with each other as well as with fish groups. Results of this "intuitive guesswork" (Ulanowicz 1986) were contrasted with those of the objective aggregation routine included in ECOPATH II, described in the Introduction and summarized in Section 2.8.4.2. The resulting total number of boxes including all fish species and nonfish taxa was 20 and 11, respectively.
2.8.4.2. METHOD 2: ECOPATH II AGGREGATION ROUTINE
As described in the Introduction, the ECOPATH II program (Pauly and Christensen 1993) includes an aggregation routine, based on Ulanowicz (1986), which allows the stepwise reduction of the number of boxes in a model from a highest possible number of 50 to any small
number (after the initial system is balanced). Boxes are linked pairwise such that ascendency (a measure of the information content of a system, see Introduction) is reduced as little as possible. With this aggregation routine, the boxes of the present coral reef system were reduced pairwise until the 50 initial boxes of the system were reduced to 10. The intermediate models with the box numbers corresponding to those obtained by method 1 were used to compare models resulting from both methods.
2.9. ECOPATH II Parameter Estimation Routine
The databases for the 50-, 20- and 11-box models obtained by method 1 were fed into the ECOPATH I1 program, and the ecotrophic efficiency (EE) for each box was computed. Then, the original input values of the 50-box model were gradually modified, until all components (boxes) showed an E E 4 . Starting from the balanced 50-box model, the ECOPATH I1 aggregation routine (method 2) was then used to compute the parameter values for each aggregation step (this involved automatical transformation of the diet matrix) such that every new model resulting from a further reduction of boxes was again balanced.
Besides estimation of EE, ECOPATH I1 was used to compute the estimates for each box of the parameters of the "master equation" (see Introduction). With the estimates for food intake, predation mortality (= production (P) * EE), flow to detritus and assimilation (A) (all in gm-2.year1), an energy balance for every box could be calculated. Furthermore, ECOPATH II calculated trophic level, omnivory index, gross efficiency, net efficiency, RIA ratio and PIR ratio for each box of the system. Based on the diet composition matrix, ECOPATH I1 computed, finally, for each predator, the food intake in gm-2.year1, Ivlev's electivity index and the standardized forage ratio of each prey group (see Introduction).
2.1 0. Whole System Properties
In the Introduction, the various features of ECOPATH I1 were presented. Besides the ability to produce a balanced system, the program offers several routines for the computation of various whole system properties useful for comparing different ecosystems or models of the same ecosystem.
These summary statistics are: sum of all production, sum of all imports, sum of all respiratory flows, sum of flows into detritus, total system throughput, throughput cycled, Finn's cycling index and net primary production necessary to support the system.
The "network flow indices" routine enabled the computation of ascendency, overhead and capacity for distinctive sources (inputs, internal and dissipations) of the system. The same routine computed flows and transfer efficiencies within the system subsequent to dividing it into discrete trophic levels. Finally, the routine called "mixed trophic impacts" allowed the computation of a predator - prey matrix in which the impact of an increase in biomass for a predator group is shown for all prey groups.
2.1 1. Graphid Representation of Models
The graphical representation of the box models followed suggestions made on this topic by Jarre et al. (1 989) and Pauly and Christensen (1 993). Thus, the surface area of each box was drawn so as to be proportional to the logarithm of the biomass in that box. Also, care was taken

to arrange the boxes along the ordinate (trophic level) such that they did not overlap and enough space was left to draw the arrows representing the flows. Furthermore, the boxes were arranged along the abscissa so as to minimize crossovers of arrows. Whenever possible, flows were combined to reduce the number of arrows between boxes. About 80-90% of flows into a box from the components of the system were included into the graphical representations of the models, the rest was omitted for clarity. The complete sets of flows for each box are shown in Appendix 8.8.
3. RESULTS
3.1. Fish Species
3.1. 1 Ecology
The available information on the spatial distribution of coral reef fish species in the Puerto Rico - Virgin Islands (PRVI) area are summarized, by subsystem, in Table 3.1. While the majority of species live within the coral reef, a number of others use the reef only as shelter and forage in the adjacent areas, such as the seagrass beds and the algal flats. These species contribute to reef metabolism mainly by means of their excreted and egested matters (feces). Several species use mangrove areas and estuaries as nursery for their offspring. These few examples show that in terms of energy flow, the subsystems cannot really be separated from each other (see also Ogden and Gladfelter 1983).
The resident coral reef fishes and the regular visitors to reefs show a very high species diversity, whereas the pelagic or oceanic fishes that are only indirectly related to reef metabolism (through their foraging activity or release of excreta) contribute relatively few species.
However, Table 3.1 is only a first attempt to group into compartments what is, in reality, a gradient with smooth transitions.
3.1.2. Fisheries and Management
The fisheries in the PRVI reef area consist mainly of small-scale, commercial fishing, and the rest of recreational fishing (and perhaps some subsistence fishing). The Caribbean Fisheries Management Council (CFMC 1985) estimates that 22% of total landings originate from the recreational sector in the US Virgin Islands. In the shallow-water reef fisheries, it is estimated that recreational landings contribute 13% of total landings. The overwhelming part of domestic requirements of fish products in the PRVI area (Puerto Rico, 85%; US Virgin Islands, over 60%) is covered by imports. Table 3.2 gives the number of fishers and vessels comprising the commercial fisheries in the PRVI area.
Fish traps are by far the most important fishing gear in terms of units as well as yield in the PRVI area. The second most important gear is the handline. Table 3.3 gives the relative importance of the different gear in the fisheries of Puerto Rico and the US Virgin Islands. A local annual fisheries production of around 3,000 t for Puerto Rico and 1,700 t for the US Virgin Islands is indicated (Table 3.3).
The CFMC reports the following 10 species as important in PRVI: Nassau grouper (Epinephelus striatus), red hind (E. guttatus), coney (Cephalopholis fulva), lane snapper (Lutjanus synagris), mutton snapper (L. analis), yellowtail snapper (Ocyurus chrysurus), white grunt (Haemulon plumier/), queen triggerfish (Balistes vetula), spotted goatfish (Pseudupeneus
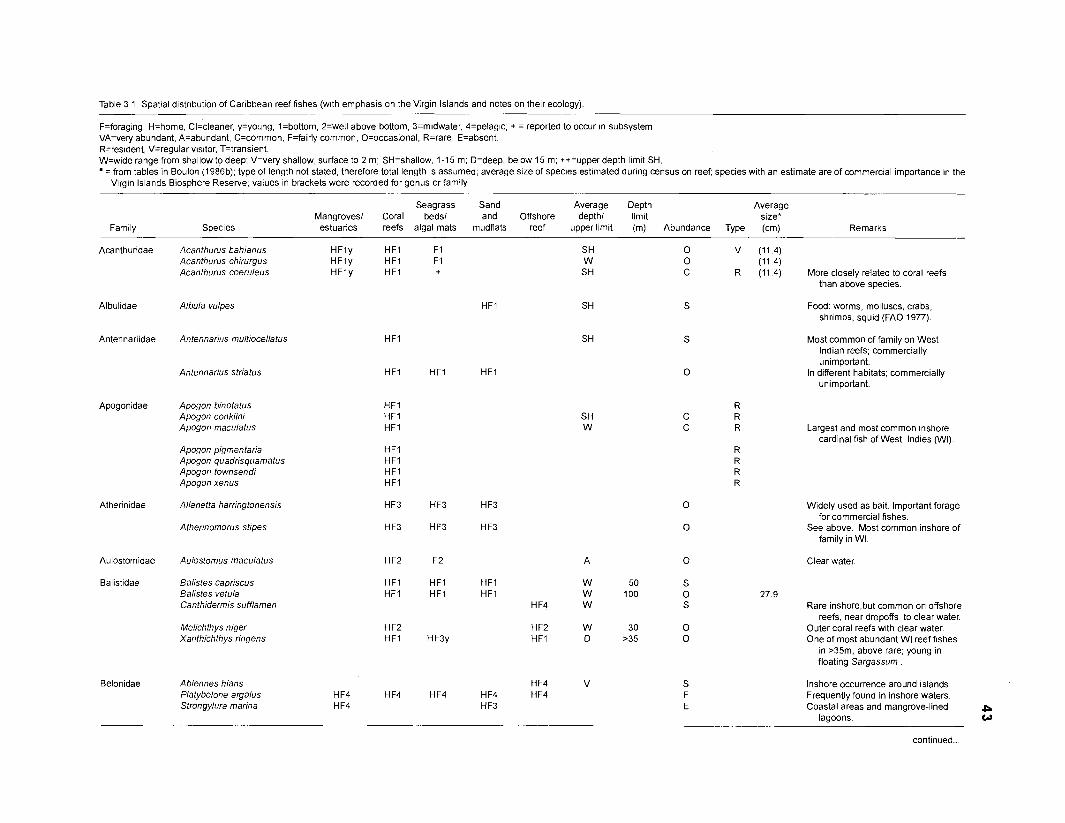
Table 3.1. Spatial distr~bution of Caribbean reef fishes (with emphasis on the Virgin Islands and notes on the~r ecology).
F=foraging, H=home, CI=cleaner, y=young, I=bottom, 2=well above bottom. 3=midwater, 4=pelag1c; + = reported to occur in subsystem. VA=very abundant, A=abundant, C=common, F=fairly common, O=occasional, R=rare, E=absent Rzresident, V=regular visitor. T=transient. W=wide range from shallow to deep; V=very shallow, surface to 2 m; SH=shallow, 1-15 m; D=deep, below 15 m; ++=upper depth lim~t SH.
= from tables in Boulon (1986b); type of length not stated, therefore total length is assumed; average size of species estimated during census on reef; species with an estimate are of commercial importance in the Virgin Islands Biosphere Reserve; values in brackets were recorded for genus or family.
Seagrass Sand Average Depth Average Mangroves1 Coral beds1 and Offshore depth1 limit size* estuaries reefs algal mats mudflats reef upper limit (m) Abundance Type (cm) Remarks Family Species
Acanthurus bahianus Acanthurus chirurgus Acanthurus coeruleus
HF ly HFI F1 HF ly HFI F1 HF1y HFI +
0 V (11.4) 0 (11 4) C R (11 4) More closely related to coral reefs
than above species.
Acanthuridae
Food: worms, molluscs, crabs, shrimps, squid (FA0 1977).
Albulidae
Antennariidae
Albula vuloes
Most common of family on West Indian reefs; commercially unimportant.
In different habitats; commercially unimportant.
Antennarius multiocellatus
Antennarius striatus
Apogonidae Apogon binotatus Apogon conklini Apogon rnaculatus Largest and most common inshore
cardinal fish of West lndies (WI). Apogon pigmentaria Apogon quadrisquamatus Apogon townsendi Apogon xenus
Widely used as bait. Important forage for commercial fishes.
See above. Most common inshore of family in WI.
Atherinidae Allanetta harringtonensis
Atherinornorus s t i ~ e s
Clear water. Aulostomidae
Balistidae
Aulostornus rnaculatus
Balistes capriscus Balistes vetula Canthidermis sufflarnen
HFI HFI HFI W 50 HFI HFI HFI W 100
HF4 W 27.9
Rare inshore,but common on offshore reefs, near dropoffs to clear water.
Outer coral reefs with clear water. One of most abundant WI reef fishes
in >35m, above rare; young in floating Sargassum .
Melichthys nlger Xanthichthys ringens
HF2 HF2 W 30 HFI HF3y HFI D >35
Inshore occurrence around islands. Frequently found in inshore waters. Coastal areas and mangrove-lined P
laqoons. 0
Belonidae Ablennes hians Platybelone argalus Strongylura marina
continued ...
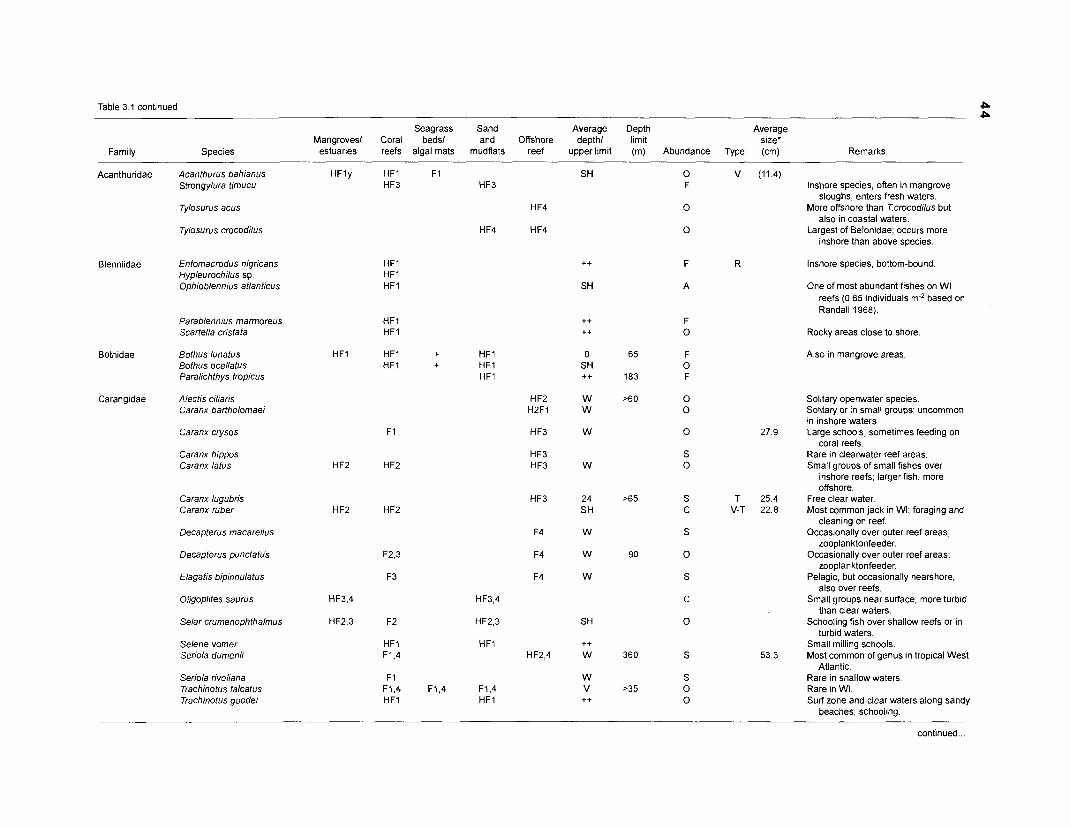
Table 3.1 continued P P
Seagrass Sand Average Depth Average Mangroves1 Coral beds1 and Offshore depth1 limit size*
Family Species estuaries reefs algal mats mudflats reef upper limit (m) Abundance Type (cm) Remarks
Acanthuridae Acanthurus bahianus Strongylura timucu
HFly HFI F1 HF3 HF3
V (11.4) lnshore species, often in mangrove
sloughs, enters fresh waters. More offshore than Tcrocodilus but
also in coastal waters. Largest of Belonidae; occurs more
inshore than above species.
Tylosurus acus
Tylosurus crocodilus
Blenniidae Entomacrodus nigricans Hypleurochilus sp. Ophioblennius atlanticus
R lnshore species, bottom-bound.
One of most abundant fishes on WI reefs (0.65 individuals m-2 based on Randall 1968).
Parablennius marmoreus Scartella cristata Rocky areas close to shore
Bothidae Bothus lunatus Bothus ocellatus Paralichthys tropicus
Also in mangrove areas.
Carangidae Alectis ciliaris Caranx bartholomaei
Solitary openwater species. Solitary or in small groups; uncommon in inshore waters.
27.9 Large schools; sometimes feeding on coral reefs.
Rare in clearwater reef areas. Small groups of small fishes over
inshore reefs; larger fish, more offshore.
T 25.4 Free clear water. V-T 22.8 Most common jack in WI; foraging and
cleaning on reef. Occasionally over outer reef areas;
zooplanktonfeeder. Occasionally over outer reef areas;
zooplanktonfeeder. Pelagic, but occasionally nearshore.
also over reefs. Small groups near surface; more turbid
than clear waters. Schooling fish over shallow reefs or in
turbid waters. Small milling schools.
53.3 Most common of genus in tropical West Atlantic.
Rare in shallow waters. Rare in WI. Surf zone and clear waters along sandy
beaches; schooling.
Caranx crysos
Caranx hippos Caranx latus
Caranx lugubris Caranx ruber
Decapterus macarellus
Decapterus punctatus
Elagatis bipinnulatus
Ohgoplites saurus
Selar crumenophthalmus
Selene vomer Seriola dumerili
Seriola rivoliana Trachinotus falcatus Trachinotus goodei
continued ...
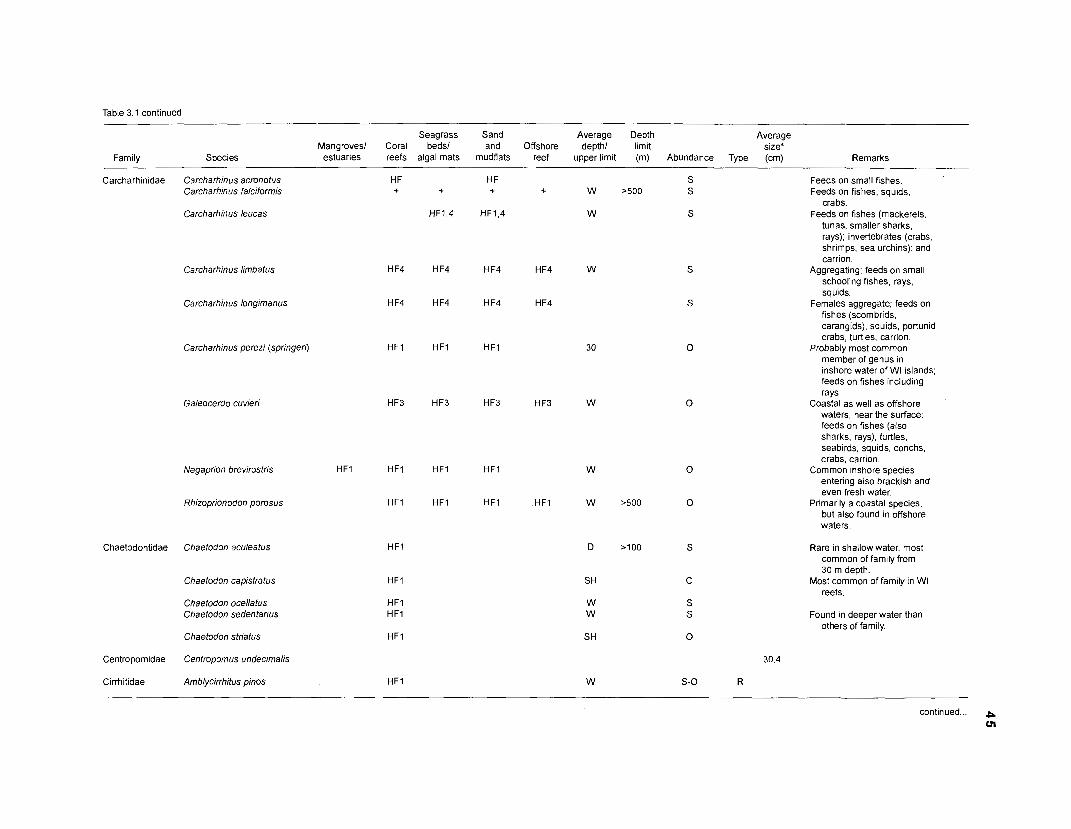
Table 3.1 continued
Family Species
Seagrass Sand Average Depth Average Mangroves1 Coral beds1 and Offshore depth1 limit size* estuaries reefs algal mats mudflats reef upper limit (m) Abundance Type (cm) Remarks
Feeds on small fishes. Feeds on fishes, squids,
crabs. Feeds on fishes (mackerels,
tunas, smaller sharks, rays); invertebrates (crabs, shrimps, sea urchins); and carrion.
Aggregating; feeds on small schooling fishes, rays. squids.
Females aggregate; feeds on fishes (scombrids, carangids), squids, portunid crabs, turtles, carrion.
Probably most common member of genus in inshore water of WI islands; feeds on fishes including rays.
Coastal as well as offshore waters, near the surface; feeds on fishes (also sharks, rays), turtles, seabirds, squids, conchs, crabs, carrion.
Common inshore species entering also brackish and even fresh water.
Primarily a coastal species, but also found in offshore waters.
Carcharhinidae Carcharhinus acronotus Carcharhinus falciformis
Carcharhhus Ieucas
Carcharhinus limbatus
Carcharhinus longimanus
Carcharhinus perezi (springer,)
Galeocerdo cuvieri
Negaprion brevirostris
Rhizoprionodon porosus HFI HFI
Rare in shallow water, most common of family from 30 m depth.
Most common of family in WI reefs.
Chaetodontidae Chaetodon aculeatus
Chaetodon capistratus HFI
Chaetodon ocellatus Chaetodon sedentarius Found in deeper water than
others of family. Chaetodon striatus
Centropomidae Centropomus undecimalis
Cirrhitidae Amblycirrhitus pinos
continued ... p ul
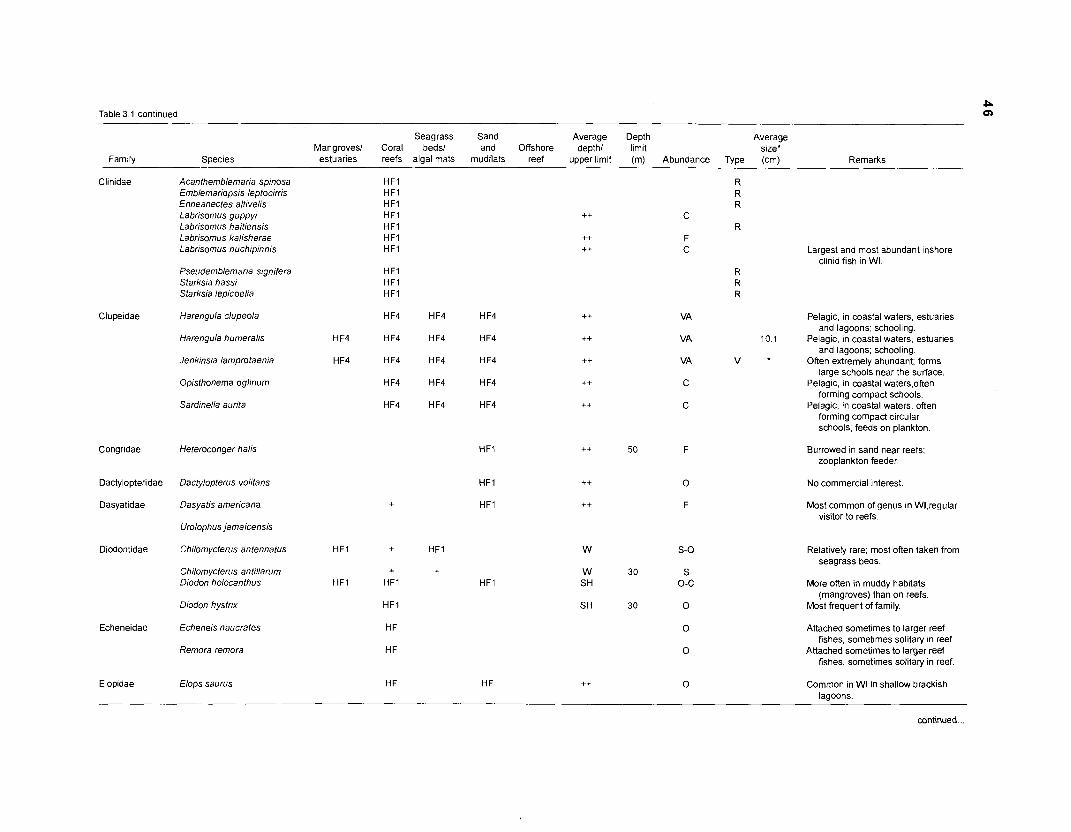
Table 3.1 continued
Seagrass Sand Average Depth Average Mangroves1 Coral beds/ and Offshore depth1 limit size*
Family Species estuaries reefs algal mats mudflats reef upper lim~t (m) Abundance Type (cm) Remarks
Clinidae Acanthemblemaria spinosa Emblemariopsis leptocirris Enneanectes altivelis Labrisomus guppy; Labrisomus haitiensis Labrisomus kalisherae Labrisomus nuchipinnis
HFI HFI HFI HFI HFI HFI HFI
HFI HFI HFI
HF4
HF4 H F4
H F4 H F4
HF4
HF4
Largest and most abundant inshore clinid fish in WI.
Pseudemblemaria signifera Starksia bassi Starksia lepicoelia
Clupeidae Harengula clupeola Pelagic, in coastal waters, estuaries and lagoons; schooling.
10.1 Pelagic. in coastal waters. estuaries and lagoons; schooling.
V * Often extremely abundant; forms large schools near the surface.
Pelagic, in coastal waterqoflen forming compact schools.
Pelagic, in coastal waters, often forming compact circular schools; feeds on plankton.
Harengula humeralis
Jenkinsia lamprotaenia
Opisthonema oglinum
Sardinella aurita
Heteroconger halis Burrowed in sand near reefs; zooplankton feeder.
Dactylopteridae
Dasyatidae
Dactylopterus volitans
Dasyatis americana
Urolophus jamaicensis
Chilomycterus antennatus
Chilomycterus antillarum Diodon holocanthus
Diodon hystrix
Echeneis naucrates
Remora remora
HFI
HFI
No commercial interest
Most common of genus in Wl,regular visitor to reefs.
Diodontidae HFI Relatively rare; most often taken from seagrass beds.
More often in muddy habitats (mangroves) than on reefs
Most frequent of family.
Echeneidae
Elopidae
Attached sometimes to larger reef fishes, sometimes solitary in reef.
Attached sometimes to larger reef fishes, sometimes solitary in reef.
Elops saurus Common in WI in shallow brackish lagoons.
continued.. .
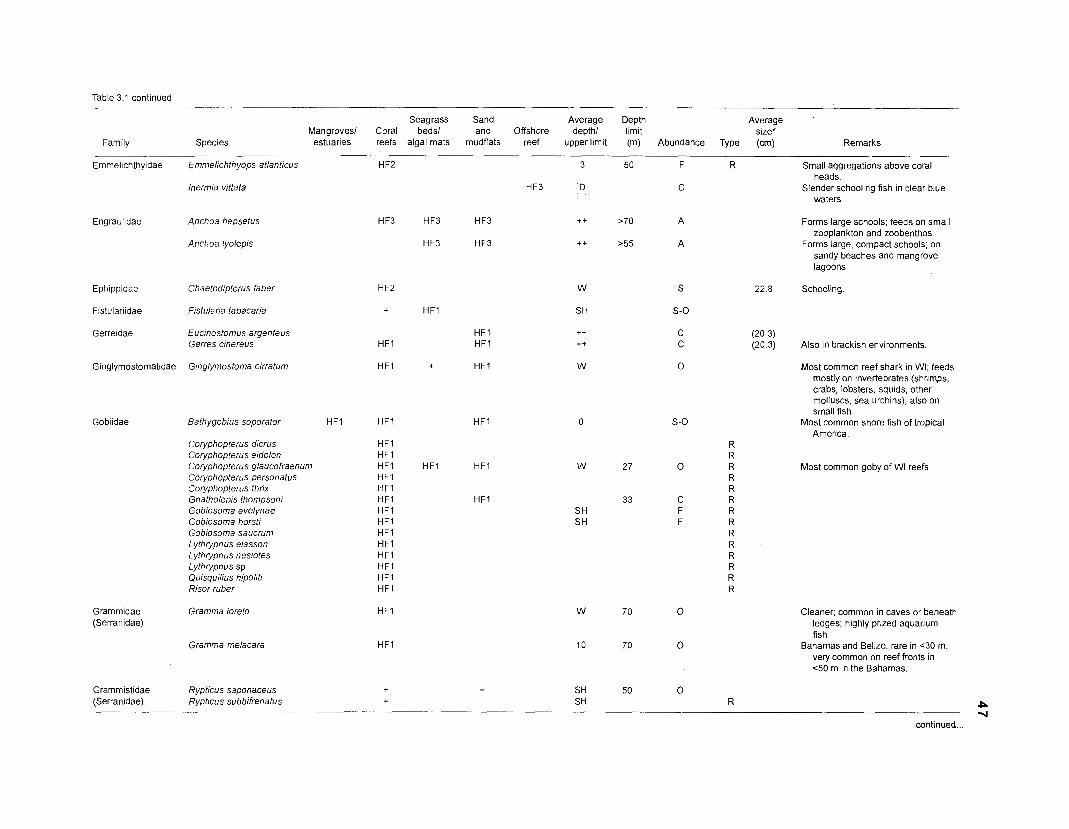
Table 3 1 cont~nued
Seagrass Sand Average Depth Average Mangroves1 Coral beds1 and Offshore depth/ limit size*
Family Species estuaries reefs algal mats mudflats reef upper limit (m) Abundance Type (cm) Remarks
Emmel~chthyops atlanticus
lnermia vittata
Small aggregations above coral heads.
Slender schooling fish in clear blue waters.
Anchoa hepsetus
Anchoa lyoleprs
Forms large schools, feeds on small zooplankton and zoobenthos
Forms large, compact schools, on sandy beaches and mangrove lagoons
Chaetodipterus faber 22.8 Schooling
Fistularia tabacaria
Euonostomus argenteus Gerres clnereus
(20 3) (20.3) Also in brackish environments.
Ginglymostoma cirratum Most common reef shark in WI; feeds mostly on invertebrates (shrimps, crabs, lobsters, squids, other molluscs, sea urchins); also on small Ash.
Most common shore fish of tropical America.
Bathygobius soporator HFI HFI HF1
Coryphopterus dicrus Coryphopterus eldolon Coryphopterus glaucofraenum Coryphopterus personatus Coiyphopterus thrix Gnatholepis thompsonl Gobiosoma evelynae Goblosoma horsti Gobiosoma saucrum Lythrypnus elasson Lythrypnus neslotes Lythrypnus sp. Quisquil~us hipoliti Risor ruber
Most common goby of WI reefs.
Grammidae (Serranldae)
Gramma loreto Cleaner; common in caves or beneath ledges; highly prized aquarium fish.
Bahamas and Belize, rare in <30 m, very common on reef fronts in 4 0 m in the Bahamas.
Gramma melacara
Grammistidae (Serranidae)
Rypticus saponaceus Rypticus subbifrenatus
continued..
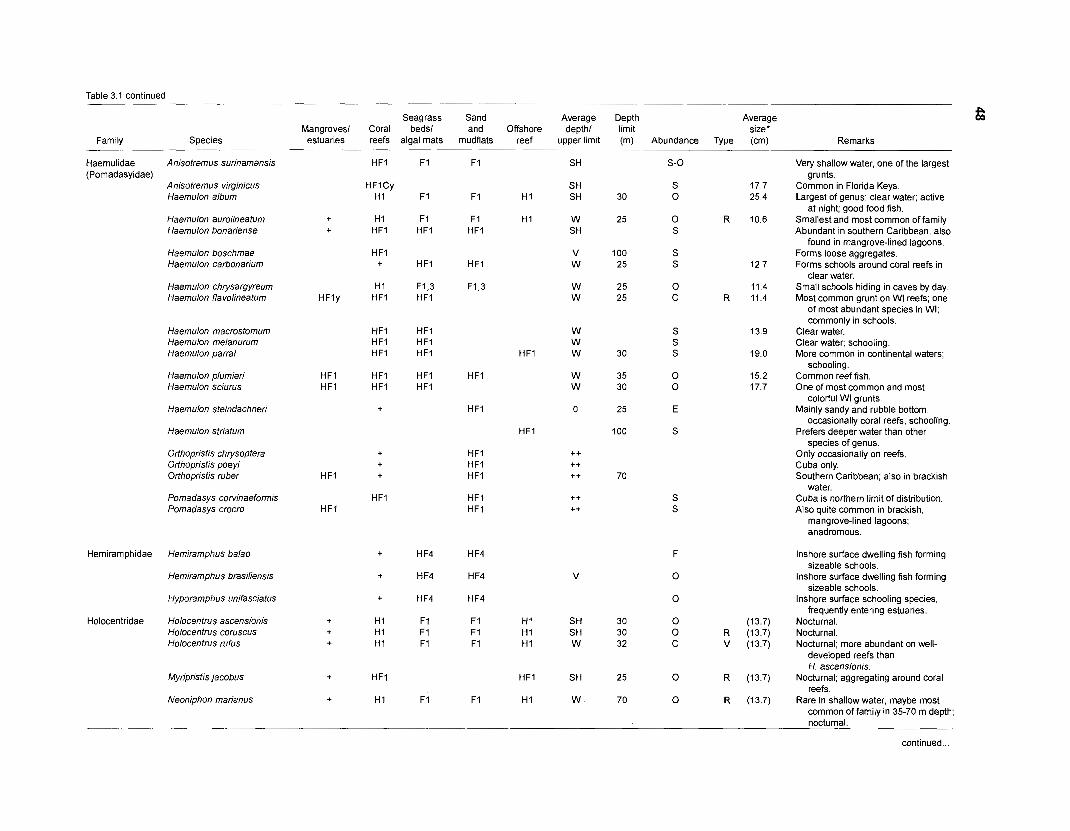
Table 3.1 continued
Seagrass Sand Average Depth Average Mangroves1 Coral beds1 and Offshore depth/ limit size*
Family Species estuaries reefs algal mats mudflats reef upper lim~t (m) Abundance Type (cm) Remarks
Haemulidae (Pomadasyidae)
Anisotremus surinamensis HFI
HFlCy H 1
+ H 1 + HFI
HFI +
H 1 HFly HFI
F 1
F 1
F1 HFI
HFI
F1,3 HFI
HFI HFI HFI
HFI HFI
Very shallow water, one of the largest grunts.
Common in Florida Keys. Largest of genus; clear water; active
at night; good food fish. Smallest and most common of family. Abundant in southern Caribbean, also
found in mangrove-lined lagoons. Forms loose aggregates. Forms schools around coral reefs in
clear water. Small schools hiding in caves by day. Most common grunt on WI reefs; one
of most abundant species in WI; commonly in schools.
Clear water. Clear water; schooling. More common in continental waters;
schooling. Common reef fish. One of most common and most
colorful WI grunts. Mainly sandy and rubble bottom,
occasionally coral reefs; schooling. Prefers deeper water than other
species of genus. Only occasionally on reefs. Cuba only. Southern Caribbean; also in brackish
water. Cuba is northern limit of distribution. Also quite common in brackish,
mangrove-lined lagoons; anadromous.
Anisotremus virginicus Haemulon album
Haemubn aurolineatum Haemulon bonariense
Haemulon boschmae Haemulon carbonarium
Haemulon chrysargyreum Haemulon flavolineatum
Haemulon macrostomum Haemulon melanurum Haemulon parrai
Haemulon plumier; Haemulon sciurus
Haemulon steindachneri
Haemulon striatum
Orthopristis chrysoptera Orthopristis poeyi Orthopristis ruber
Pomadasys corvinaeformis Pomadasys crocro
lnshore surface dwelling fish forming sizeable schools.
lnshore surface dwelling fish forming sizeable schools.
lnshore surface schooling species, frequently entering estuaries.
Nocturnal. Nocturnal. Nocturnal; more abundant on well-
developed reefs than H. ascensionis.
Nocturnal; aggregating around coral reefs.
Rare in shallow water, maybe most common of family in 35-70 m depth; nocturnal.
Hemiramphidae
Holocentridae
Hemiramphus balao
Hemiramphus brasiliensis
Hyporamphus unifasciatus
Holocentrus ascensionis Holocentrus coruscus Holocentrus rufus
Myripristis jacobus
Neoniphon marianus
continued
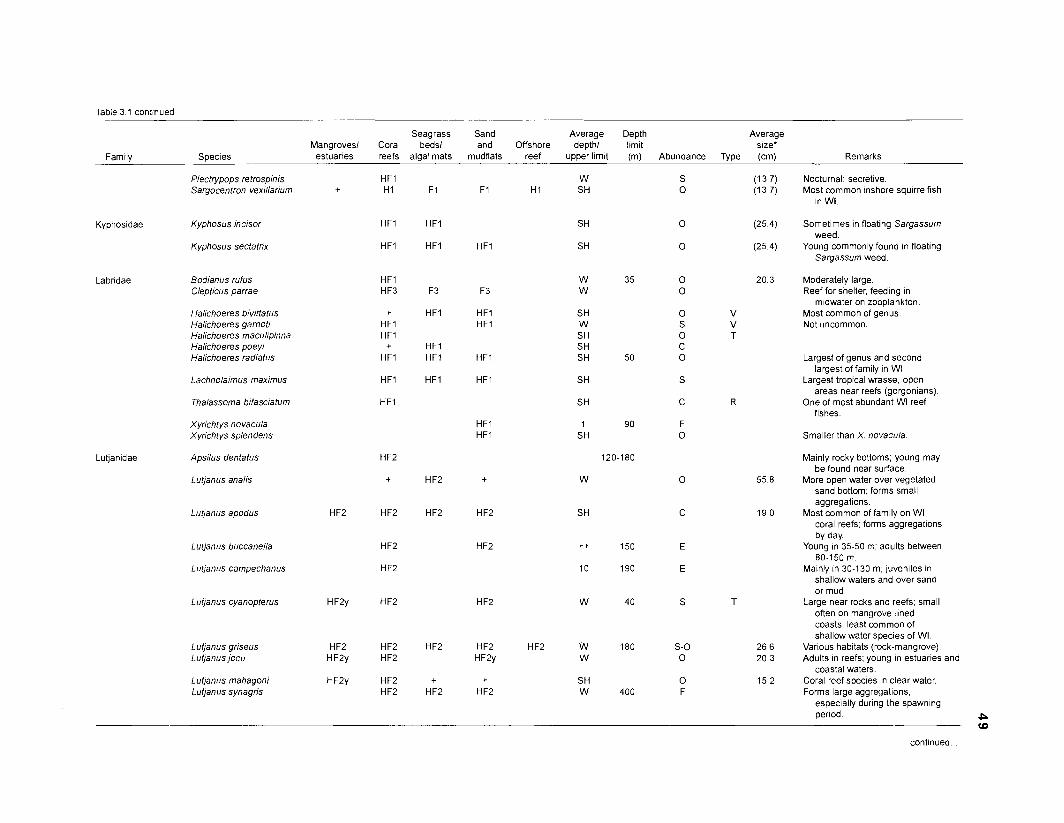
Table 3.1 cont~nued
Seagrass Sand Mangroves1 Coral beds1 and
Fam~lv Species estuaries reefs algal mats mudflats -
Kyphosidae
Lutjanidae
Plectrypops retrospinis Sargocentron vexillarium
Kyphosus incisor
Kyphosus sectatrix
Bodianus rufus Clepticus parrae
Halichoeres bivittatus Halichoeres garnoti Halichoeres maculipinna Halichoeres poey! Halichoeres radiatus
Lachnolaimus maximus
Thalassoma bifasciatum
Xyrichtys novacula Xyrkhtys splendens
Apsilus dentatus
Lutjanus analis
Lutjanus apodus
Lutjanus buccanella
Lutjanus campechanus
Lutjanus cyanopterus
Lutjanus griseus Lutjanus jocu
Lutjanus mahagoni Lutjanus synagris
F1
HFI
HFI
F3
HFI
HFI HFI
HFl
HF2
H F2
H F2
+ HF2
--- ~
Average Depth Offshore depth1 limit
reef upper limit (m)
W H1 SH
Abundance
S 0
0
0
0 0
0 S 0 C 0
S
C
F 0
0
C
E
E
S
S-0 0
0 F
Average size' (cm)
(13.7) (1 3.7)
(25.4)
(25.4)
20.3
55.8
19.0
26.6 20 3
15.2
Remarks
Nocturnal; secretive. Most common inshore squirrelfish
in WI.
Sornet~mes in floating Sargassum weed.
Young commonly found in floating Sargassum weed.
Moderately large. Reef for shelter, feeding in
m~dwater on zooplankton. Most common of genus. Not uncommon.
Largest of genus and second largest of family in WI.
Largest tropical wrasse, open areas near reefs (gorgonians)
One of most abundant WI reef fishes.
Smaller than X. novacula
Mainly rocky bottoms; young may be found near surface.
More open water over vegetated sand bottom; forms small aggregations.
Most common of fam~ly on WI coral reefs; forms aggregations by day.
Young in 35-50 m; adults between 80-150 m.
Mainly in 30-130 m, juveniles In shallow waters and over sand or mud.
Large near rocks and reefs; small often on mangrove-lined coasts, least common of shallow water species of WI.
Various habitats (rock-mangrove). Adults In reefs; young In estuaries and
coastal waters. Coral reef species in clear water. Forms large aggregat~ons,
especially during the spawnlng period. P

Table 3.1 continued Ul 0
Seagrass Sand Average Depth Average Mangroves1 Coral beds1 and Offshore depth1 lim~t size*
Family Species estuaries reefs algal mats mudflats reef upper hm~t (m) Abundance Type (cm) Remarks
Lufianus vivanus HF2 >ZOO S Very common between 90 and 140 m, near shelf edge; not a real reef specles.
17.7 One of the most common and active shallow-water reef fishes of the Caribbean.
V-T
v
v
R v
Ocyurus chtysurus
Malacanthidae Malacanthus plurnieri Sand and rubble near reefs; only shallow-water species of family in West Atlant~c.
Megalopidae Tarpon atlanticus
Monacanthidae Aluterus rnonoceros Aluterus schoepfii Aluterus scripta Cantherines rnacrocerus Cantherines pullus Monacanthus ciliatus Monacanthus tucker; Stephanolepis setifer
Most common filef~sh in WI Fish of vegetated areas. Smallest of WI f~lefishes
Mugilidae 25.4 Typical in murky waters (estuaries, mangroves, lagoons) but also in clear waters close to the surface.
Mugil curerna
Mulhdae
Muraenidae
Mulloidichthys rnartinicus Pseudupeneus rnaculatus
HFly HFly
16.5 Solitary or in small groups. 13.7 Solitary, young in seagrass beds.
Enchelycore nigricans Echidna catenata
Mainly in very shallow water. Very shallow water beneath rocks;
feeds mainly on crabs. Also in mangroves. Secretive. Secretive. Most common moray in shallow water
in WI.
Gyrnnothorax funebris Gymnothorax vicinus Gyrnnothorax rniliaris Lycodontis rnoringa
HFI HFI HFI HFI HFI
HFI
Myliobatidae Aetobatus narinari Coastal surface waters; visitor to reefs; solitary or large schools; feeds on bivalves (cockles, oysters), sna~ls, shrimps, worms, cephalopods, small fish.
Ogcocephalidae Ogcocephalus nasutus
Ophichthidae Myrichthys breviceps
Occasionally on reefs
May be observed in reefs; burrowing in mud or sand.
continued
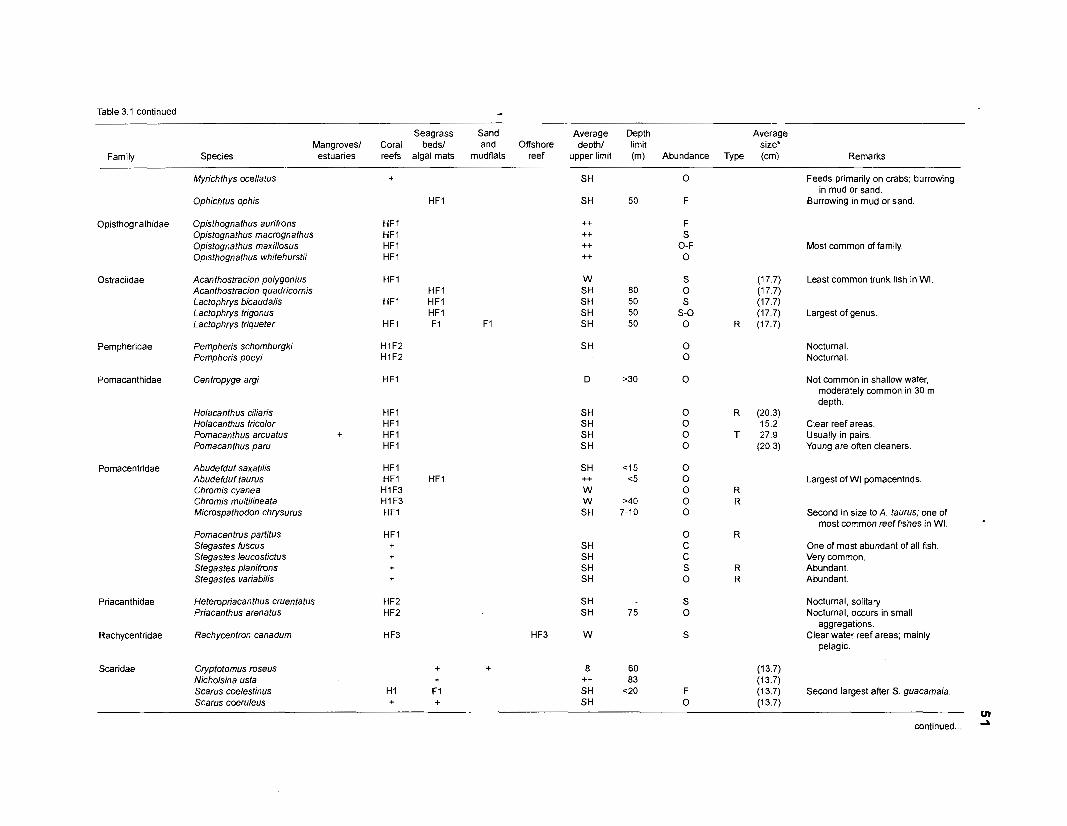
Table 3.1 continued A
Seagrass Sand Average Depth Average Mangroves1 Coral beds1 and Offshore depth1 limit size*
Family Species estuaries reefs algal mats mudflats reef upper limit (m) Abundance Type (cm) Remarks
Myrichthys ocellatus Feeds primarily on crabs; burrowing in mud or sand.
Burrowing in mud or sand. Ophichtus ophis
Opisthognathidae Opisthognathus aurifrons Opistognathus macrognathus Opistognathus maxillosus Opisthognathus whitehurstii
Most common of family.
Ostraciidae Least common trunk fish in WI. Acanthostracion polygonius Acanthostracion quadricornis Lactophrys bicaudalis Lactophrys trigonus Lactophrys triqueter
Largest of genus.
Pempheridae Pempheris schomburgk~ Pempheris poeyi
Nocturnal. Nocturnal.
Pomacanthidae Centropyge argi Not common in shallow water, moderately common in 30 m depth.
Holacanthus ciliaris Holacanthus tricolor Pomacanthus arcuatus Pornacanthus paru
HF1 HFI
+ HFI HF1
Clear reef areas. Usually in palrs. Young are often cleaners
Pomacentridae Abudefduf saxatilis Abudefduf taurus Chromis cyanea Chromis multilineata Microspathodon chrysurus
HFI HFI HFI H I F3 HI F3 HFI
Largest of WI pomacentrids. R R
Second in size to A. taurus; one of most common reef fishes in WI.
R One of most abundant of all fish. Very common.
R Abundant. R Abundant.
Pomacentrus partitus Stegastes fuscus Stegastes leucostictus Stegastes planifrons Stegastes variabilis
Priacanthidae Heteropriacanthus cruentatus Priacanthus arenatus
Nocturnal, solitary. Nocturnal, occurs in small
aggregations. Clear water reef areas; mainly
pelagic. Rachycentridae Rachycentron canadum
Scaridae Cryptotornus roseus Nicholsina usta Scarus coelestinus Scarus coeruleus
F (1 3.7) Second largest after S. guacamaia. 0 (1 3.7)
cn continued ... a
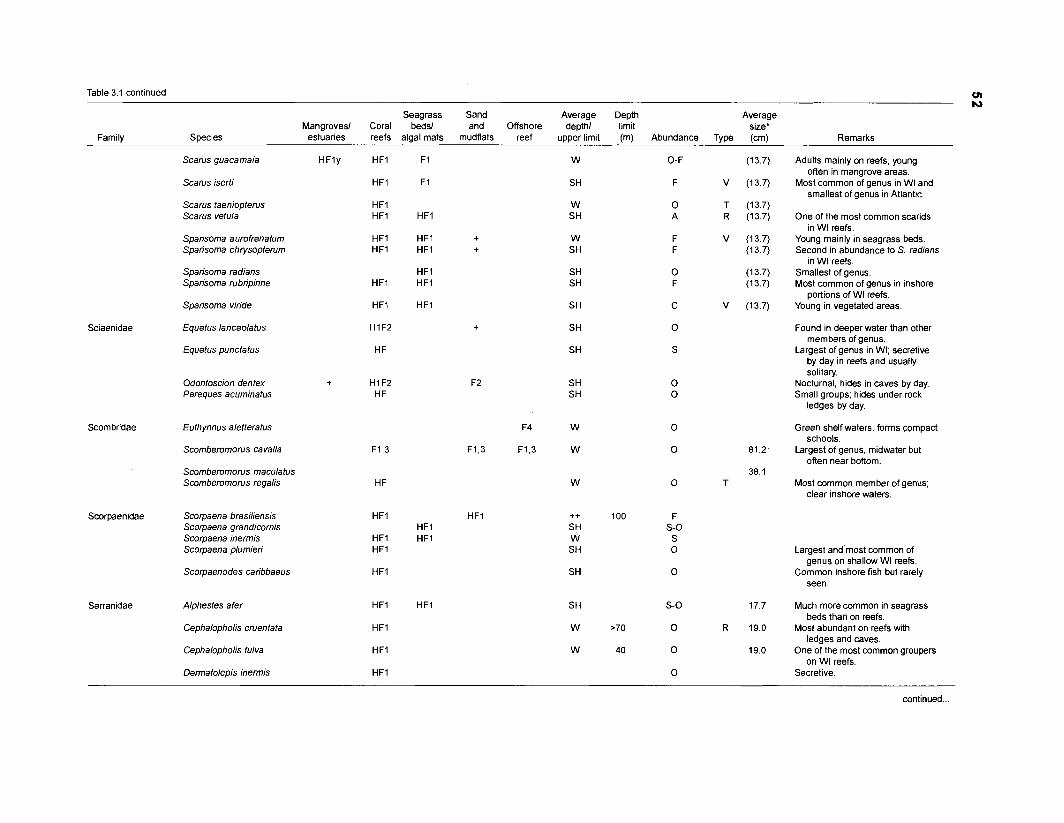
Table 3.1 continued fn h)
Seagrass Sand Average Depth Average Mangroves1 Coral beds1 and Offshore depth1 limit size*
Family Specles estuaries reefs algal mats mudflats reef upper limit (m) Abundance Type (un) Remarks
Sciaenidae
Scombridae
Scorpaenidae
Serranidae
Scarus guacamaia HFly
Scarus taeniopteros Scarus vetula
Sparisoma aurofrenatum Sparisoma chrysopterum
Sparisoma radians Sparisoma rubripinne
Sparisoma viride
Equetus lanceolatus
Equetus punctatus
Odontoscion dentex Pareques acuminatus
Euthynnus aletferatus
Scomberomorus cavalla
Scomberomorus maculatus Scomberomorus regalis
Scorpaena brasiliensis Scorpaena grandicornis Scorpaena inermis Scorpaena plumieri
Scorpaenodes caribbaeus
Alphestes afer
Cephalopholis cruentata
Cephalopholis fulva
Dermatolepis inermis
HFI
HFI
HFI HFI
HFI HFI
HFI
HFI
H1F2
HF
H I F2 H F
F1,3
HF
HFI
HFI HFI
HFI
HFI
HFI
HFI
HFI
HFI
HFI + HFI +
HFI HFI
HFI
HFI HFI HFI
Adults mainly on reefs, young oflen in mangrove areas.
Most common of genus in WI and smallest of genus in Atlantic.
One of the most common scarids in WI reefs.
Young mainly in seagrass beds. Second in abundance to S. radians
in WI reefs. Smallest of genus. Most common of genus in inshore
portions of WI reefs. Young in vegetated areas.
Found in deeper water than other members of genus.
Largest of genus in WI; secretive by day in reefs and usually solitaly.
Nocturnal, hides in caves by day. Small groups; hides under rock
ledges by day.
Green shelf waters, forms compact schools.
Largest of genus, midwater but oflen near bottom.
Most common member of genus; clear inshore waters.
Largest and most common of genus on shallow WI reefs.
Common inshore fish but rarely seen.
Much more common in seagrass beds than on reefs.
Most abundant on reefs with ledges and caves.
One of the most common groupers on WI reefs.
Secretive.
continued.
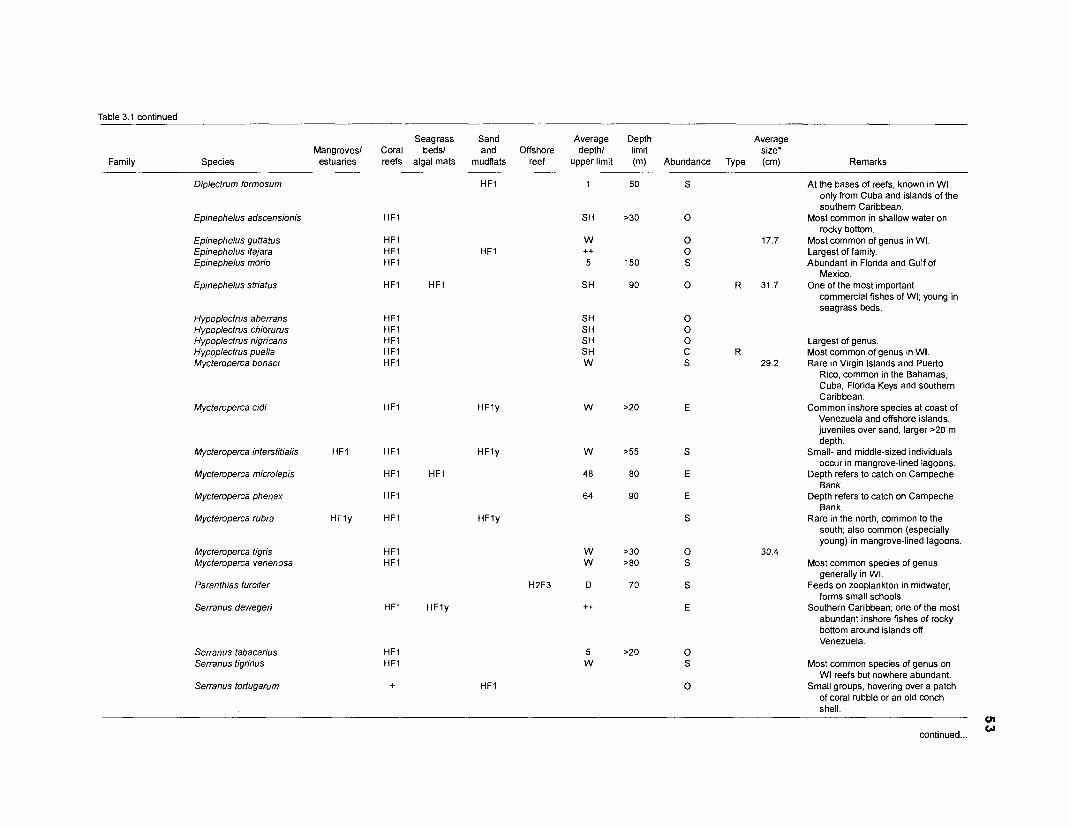
Table 3.1 continued
Seagrass Sand Average Depth Average Mangroves1 Coral beds1 and Offshore depth1 limit size*
Family Species estuaries reefs algal mats mudflats reef upper limit (m) Abundance Type (cm) Remarks -
Diplectrum formosum HFI At the bases of reefs, known in WI only from Cuba and islands of the southern Caribbean.
Most common in shallow water on rocky bottom.
Most common of genus in WI. Largest of family. Abundant in Florida and Gulf of
Mexico. One of the most important
commercial fishes of WI; young in seagrass beds.
Epinephelus adscensionis
Epinephelus guttatus Epinephelus itajara Epinephelus morio
Epinephelus striatus
Hypoplectrus aberrans Hypoplectrus chlorurus Hypoplectrus nigricans Hypoplectrus puella Mycteroperca bonaci
Largest of genus. Most common of genus in WI. Rare in Virgin Islands and Puerto
Rico, common in the Bahamas, Cuba, Florida Keys and southern Caribbean.
Common inshore species at coast of Venezuela and offshore islands, juveniles over sand, larger >20 m depth.
Small- and middle-sized individuals occur in mangrove-lined lagoons.
Depth refers to catch on Campeche Bank.
Depth refers to catch on Campeche Bank.
Rare in the north, common to the south; also common (especially young) in mangrove-lined lagoons
HFly
HFly
Mycteroperca cidi
Mycteroperca interstitialis
Mycteroperca microlep~s
Mycteroperca phenax
Mycteroperca rubra
HFI HFI
HFI
HFI
HFly HFI HFly
Mycteroperca tigris Mycteroperca venenosa
Paranthias furcifer
Serranus dewegeri
HFI HF1 Most common species of genus
generally in WI. Feeds on zooplankton in midwater,
forms small schools. Southern Caribbean; one of the most
abundant inshore fishes of rocky bottom around islands off Venezuela.
HFly
Serranus tabacarius Serranus tigrinus Most common species of genus on
WI reefs but nowhere abundant. Small groups, hovering over a patch
of coral rubble or an old conch shell.
Serranus tortugarum
cn continued ...
0
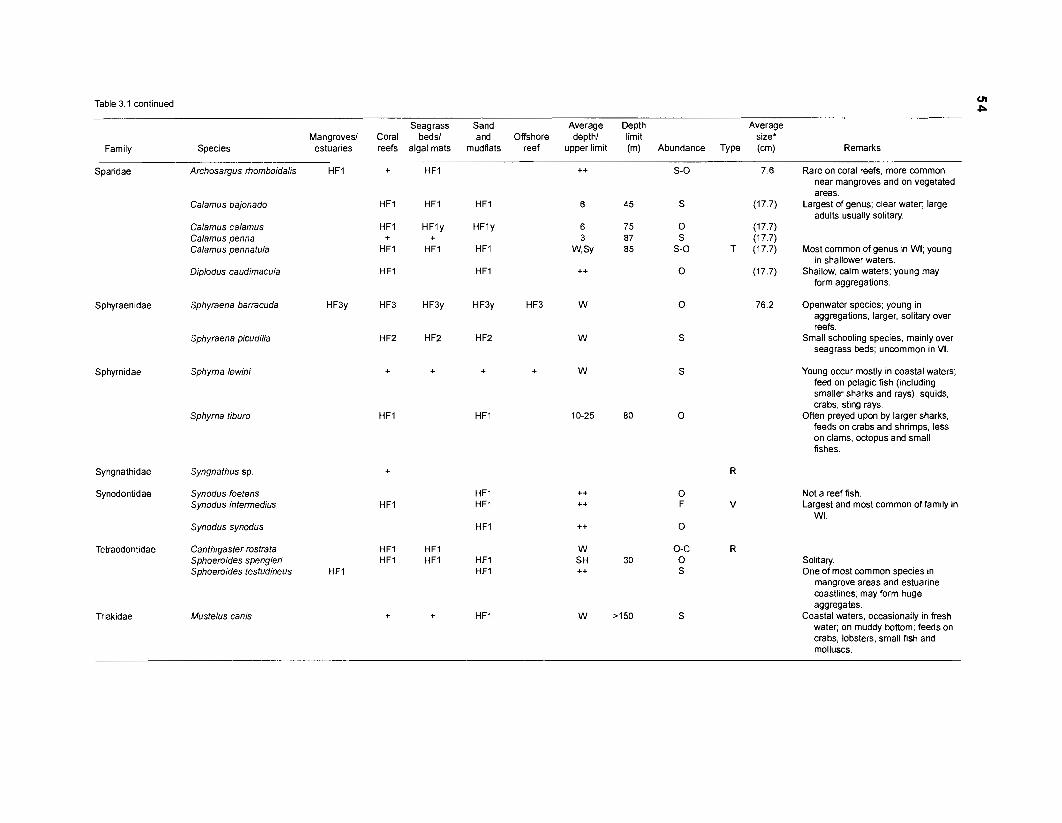
Table 3.1 continued
Seagrass Sand Average Depth Average Mangroves1 Coral beds1 and Offshore depth1 limit size*
estuaries reefs algal mats mudflats reef upper limit (m) Abundance Type (cm) Remarks Family Species
Sparidae Archosargus rhomboidalis HFI
HFI
HFly +
HFI
HF3y
HF2
+
7.6 Rare on coral reefs; more common near mangroves and on vegetated areas.
(17.7) Largest of genus; clear water; large adults usually solitary.
(17.7) (17.7)
T (17.7) Most common of genus in WI; young in shallower waters.
(17.7) Shallow, calm waters; young may form aggregations.
Calamus bajonado
Calamus calamus Calamus penna Calamus pennatula
Diplodus caudimacula
HFI
HFly
HFI
HFI
HF3y
HF2
+
HFI
Sphyraenidae Sphyraena barracuda 76.2 Openwater species; young in aggregations, larger, solitary over reefs.
Small schooling species, mainly over seagrass beds; uncommon in VI.
Sphyraena picudilla
Sphyrnidae Sphyrna lewini Young occur mostly in coastal waters; feed on pelagic fish (including smaller sharks and rays), squids, crabs, sting rays.
Often preyed upon by larger sharks; feeds on crabs and shrimps, less on clams, octopus and small fishes.
Sphyrna tiburo
Syngnathidae Syngnathus sp. +
Synodontidae Synodus foetens Synodus intermedius
Not a reef fish. Largest and most common of family in
WI. Synodus synodus HFI
Tetraodontidae Canthigaster rostrata HFI HFI Sphoeroides spengleri HFI HFI HFI Sphoeroides testudineus HFI HFI
Solitary. One of most common species in
mangrove areas and estuarine coastlines; may form huge aggregates.
Coastal waters, occasionally in fresh water; on muddy bottom; feeds on crabs, lobsters, small fish and molluscs.
Triakidae Mustelus canis
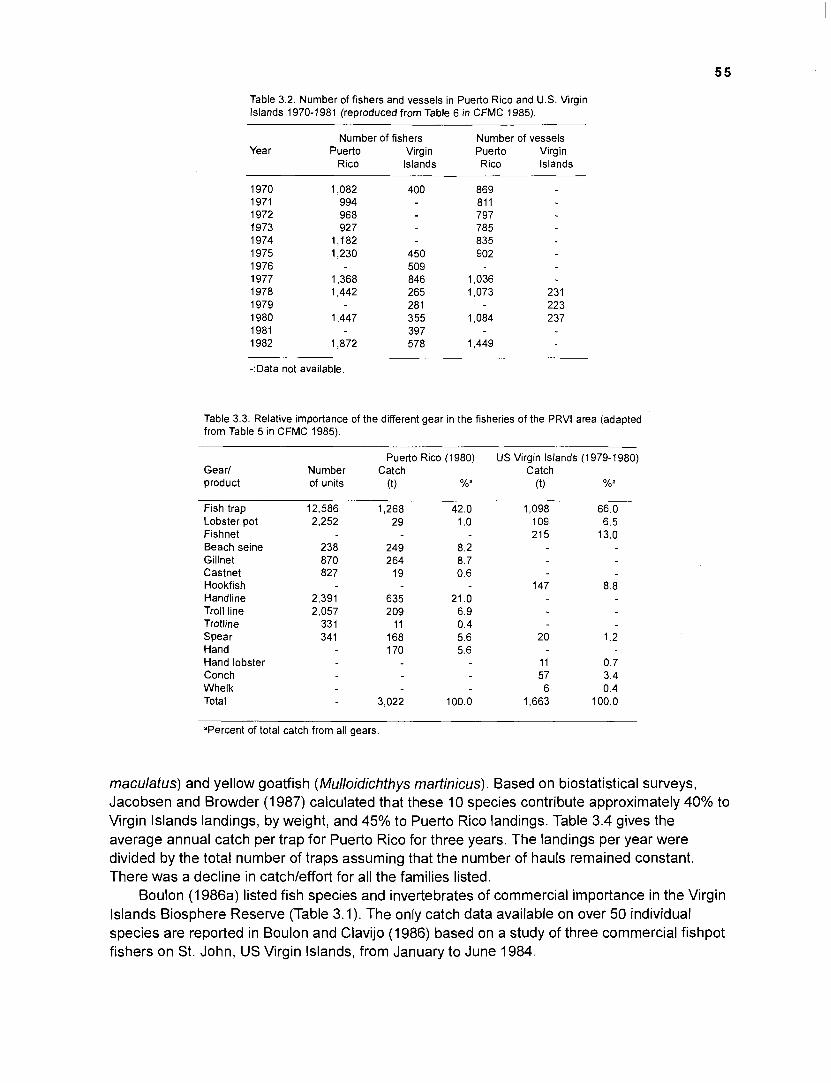
Table 3.2. Number of fishers and vessels in Puerto Rico and U.S. Virgin lslands l97O-l98l (reproduced from Table 6 in CFMC 1985).
Number of fishers Number of vessels Year Puerto Virgin Puerto Virgin
Rico Islands Rico Islands
-:Data not available
Table 3.3. Relative importance of the different gear in the fisheries of the PRVl area (adapted from Table 5 in CFMC 1985).
Puerto Rico (1980) US Virgin lslands (1979-1980) Gear/ Number Catch Catch product of units (t) %" (t) %a
Fish trap 12,586 1,268 42.0 Lobster pot 2,252 29 1 .O Fishnet Beach seine 238 249 8.2 Gillnet 870 264 8.7 Castnet 827 19 0.6 Hookfish Handline 2,391 635 21 .O Troll line 2,057 209 6.9 Trotline 33 1 11 0.4 Spear 34 1 168 5.6 Hand 170 5.6 Hand lobster Conch Whelk Total 3,022 100.0
"Percent of total catch from all gears
maculatus) and yellow goatfish (Mulloidichthys martinicus). Based on biostatistical surveys, Jacobsen and Browder (1 987) calculated that these 10 species contribute approximately 40% to Virgin lslands landings, by weight, and 45% to Puerto Rico landings. Table 3.4 gives the average annual catch per trap for Puerto Rico for three years. The landings per year were divided by the total number of traps assuming that the number of hauls remained constant. There was a decline in catchleffort for all the families listed.
Boulon (1 986a) listed fish species and invertebrates of commercial importance in the Virgin lslands Biosphere Reserve (Table 3.1). The only catch data available on over 50 individual species are reported in Boulon and Clavijo (1 986) based on a study of three commercial fishpot fishers on St. John, US Virgin Islands, from January to June 1984.
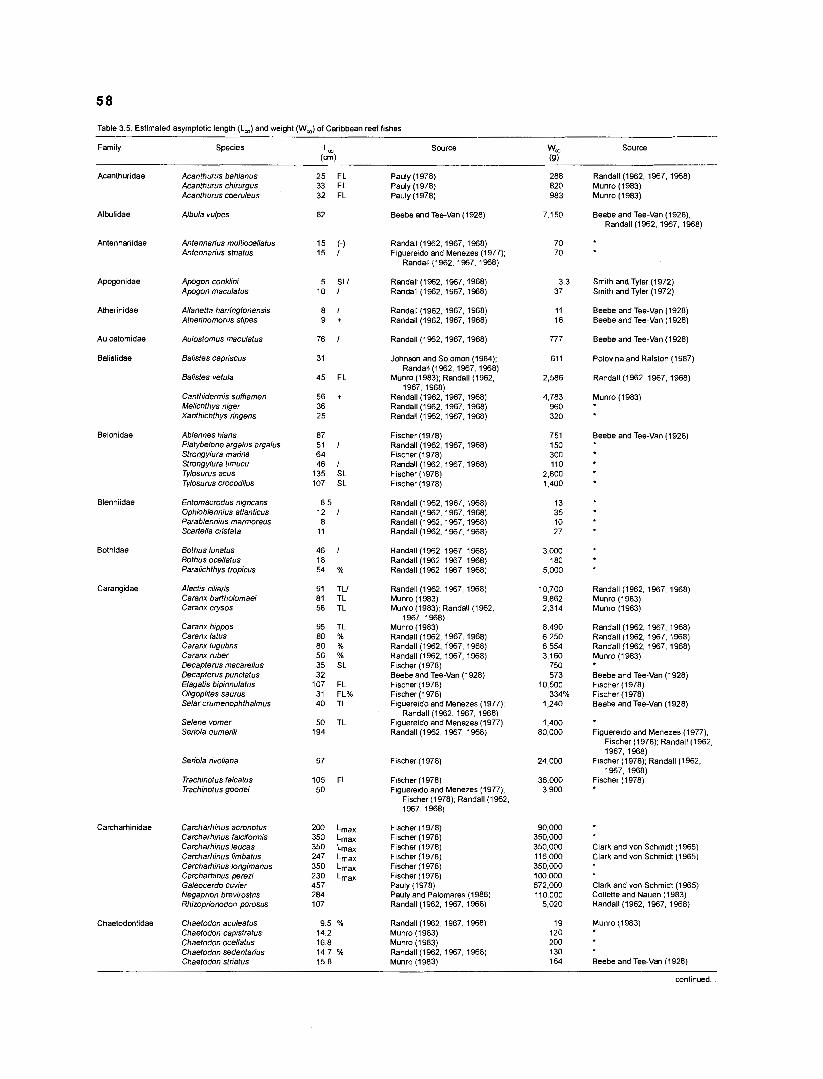
Family Species
Table 3.5. Estimated asymptotic length (Lm) and weight (W,) of Caribbean reef fishes.
-
Acanthuridae Acanthurus bahianus Acanthurus chirurgus Acanthurus coeruleus
Albulidae
Antennariidae
Apogonidae
Atherinidae
Aulostomidae
Balistidae
Belonidae
Blenniidae
Bothidae
Carangidae
Carcharhinidae
Chaetodontidae
Albula vulpes
Antennarios multiocellatus Antennarius striatus
Apogon conklini Apogon maculatus
Allanetta harringtonensis Atherinomorus stipes
Aulostomus maculatus
Balistes capriscus
Balistes vetula
Canthidermis sufflamen Melichthys niger Xanthichthys ringens
Ablennes hlans Platybelone argalus argalus Strongylura marina Strongylura bmucu Tylosurus acus Tylosurus crocodilus
Entomacrodus nigricans Ophioblennius atlanticus Parablennius marmoreus Scarfella cristata
Bothus lunatus Bothus ocellatus Paralichthys tropicus
Alectis ciliaris Caranx barfholomaei Caranx crysos
Caranx hippos Caranx latus Caranx lugubris Caranx ruber Decapterus macarellus Decapterus punctatus Elagatis bipinnulatus Ol~goplites saurus Selar crumenophthalmus
Selene vomer Seriola dumerili
Seriola rivoliana
Trachinotus falcatus Trachinotus goodei
Carcharhinus acronotus Carcharhlnus falciformis Carcharhinus leucas Carcharhinus limbatus Carcharhinus longimanus Carcharhinus perezi Galeocerdo cuvier Negapnon brevirostris Rhizoprionodon porosus
Chaetodon aculeatus Chaetodon capistratus Chaetodon ocellatus Chaetodon sedentanus Chaetodon striatus
Source wm Source
25 FL 33 FL 32 FL
82
15 (-) 15 1
5 SLI 10 1
8 1 9 +
76 1
31
45 FL
56 + 36 25
87 51 1 64 46 1
135 SL 107 SL
8 5 12 1 8
11
46 1 18 54 %
91 TLI 81 TL 58 TL
95 TL 80 % 80 % 56 % 35 SL 32
107 FL 31 FL% 40 TL
50 TL 194
97
105 FL 50
200 Lmax 350 Lmax 350 Lmax 247 Lmax 350 Lmax 230 Lmax 457 284 lo7
9 5 % 14.2 16.8 147 % 15.8
Pauly (1978) Pauly (1978) Pauly (1978)
Beebe and Tee-Van (1928)
Randall (1962, 1967, 1968) Flguereido and Menezes (1977);
Randall (1 962, 1967. 1968)
Randall (1962, 1967, 1968) Randall (1962. 1967, 1968)
Randall (1962, 1967, 1968) Randall (1962. 1967, 1968)
Randall (1962, 1967. 1968)
Johnson and Solomon (1984), Randall (1962, 1967, 1968)
Munro (1983); Randall (1962, 1967, 1968)
Randall (1962. 1967, 1968) Randall (1962 1967.19681 Randall (1962; 1967: 1968)
Flscher (1978) Randall (1962, 1967, 1968) Fischer (1978) Randall (1962. 1967, 1968) Fischer (1 978) Flscher (1978)
Randall (1962, 1967, 1968) Randall (1962, 1967, 1968) Randall (1 962, 1967, 1968) Randall (1 962, 1967, 1968)
Randall (1962, 1967, 1968) Randall (1962, 1967, 1968) Randall (1962, 1967, 1968)
Randall (1962, 1967. 1968) Munro (1 983) Munro (1983); Randall (1962.
1967, 1968) Munro (1983) Randall (1962, 1967, 1968) Randall (1962,1967, 1968) Randall (1 962, 1967, 1968) Flscher (1978) Beebe and Tee-Van (1 928) Fischer (1978) Fischer (1 978) Figuere~do and Menezes (1 977).
Randall (1962. 1967, 1968) Figuereido and Menezes (1977) Randall (1962, 1967, 1968)
Fischer (1 978)
Flscher (1978) Flguereido and Menezes (1977);
Flscher (1978); Randall (1962. 1967, 1968)
Fischer (1 978) Flscher (1978) Fischer (1978) F~scher (1 978) Fischer (1 978) Fischer (1 978) Pauly (1978) Pauly and Palomares (1986) Randall (1962, 1967. 1968)
Randall (1962, 1967, 1968) Munro (1 983) Munro (1 983) Randall (1962, 1967. 1968) Munro (1983)
Randall (1962, 1967, 1968) Munro (1 983) Munro (1 983)
Beebe and Tee-Van (1928), Randall (1962, 1967. 1968)
Smith and Tyler (1972) Smith and Tyler (1972)
Beebe and Tee-Van (1928) Beebe and Tee-Van (1928)
Beebe and Tee-Van (1 928)
Polovina and Ralston (1 987)
Randall (1962, 1967. 1968)
Munro (1983)
Beebe and Tee-Van (1928)
Randall (1 962, 1967, 1968) Munro (1 983) Munro (1 983)
Randall (1962, 1967, 1968) Randall (1962,1967.1968) Randall (1962, 1967, 1968) Munro (1 983)
Beebe and Tee-Van (1 928) Fischer (1978) Flscher (1978) Beebe and Tee-Van (1928)
Figuereido and Menezes (1977). Fischer (1978); Randall (1962, 1967, 1968)
Flscher (1978); Randall (1962, 1967, 1968)
Fischer (1 978)
Clark and von Schmldt (1965) Clark and von Schmidt (1965)
Clark and von Schmidt (1965) Collette and Nauen (1983) Randall (1962, 1967, 1968)
Munro (1983)
Beebe and Tee-Van (1928)
continued.
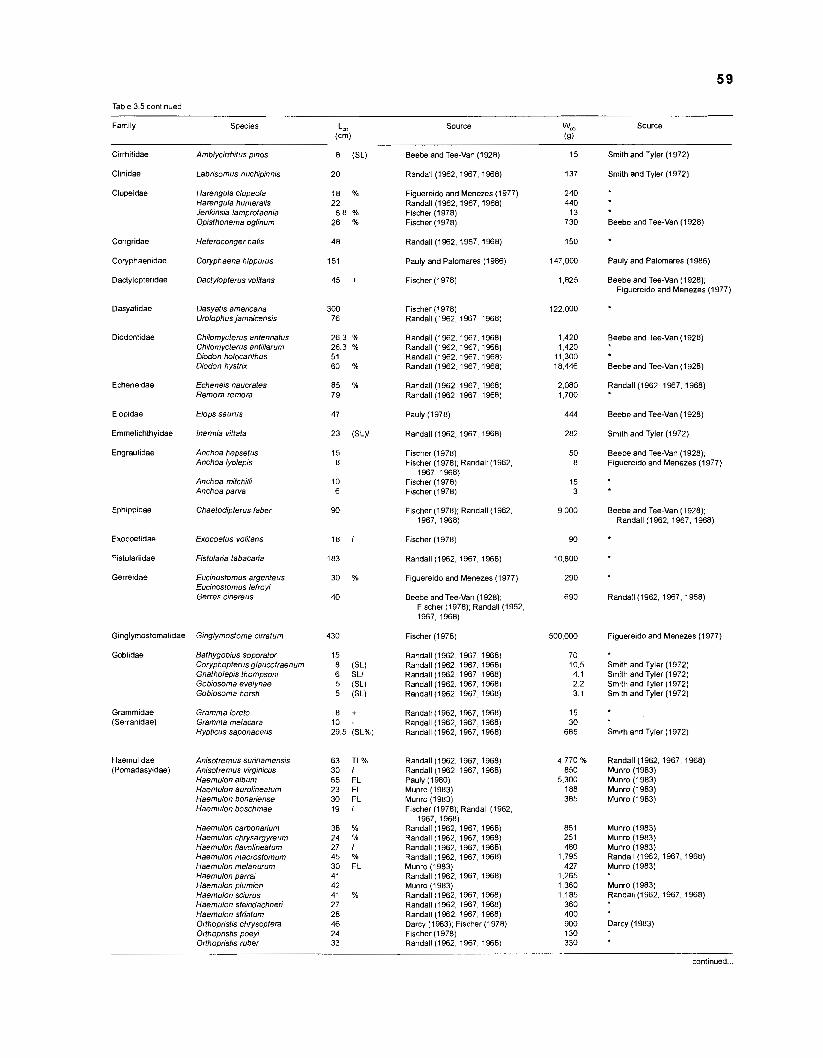
Table 3.5 continued
Source wm Source (9)
Clrrhitidae
Clinidae
Clupeidae
Congridae
Coryphaenidae
Dactylopteridae
Dasyatidae
Diodontidae
Echeneidae
Elopidae
Emmelichthyidae
Engraulidae
Ephippidae
Exocoetidae
Fistularildae
Gerreidae
Ginglyrnostomatidae
Gobiidae
Grarnrnldae (Serranidae)
Haemulldae (Pomadasyidae)
Amblycirrhitus pinos
Labnsomus nuchiplnnls
Harengula clupeola Harengula humeralis Jenkinsia lamprofaenia Op~sfhonema oglinum
Heteroconger halis
Coryphaena hippurus
Dactylopterus volitans
Dasyafrs americana Urolophus jamaicens~s
Chilomycterus antennafus Chilomycterus antiNarum Diodon holocanthus Diodon hystnx
Echeneis naucrates Remora remora
Elops saurus
lnermia viffata
Anchoa hepsetus Anchoa lyolepis
Anchoa mitchilli Anchoa parva
Chaetodipterus faber
Exocoetus volifans
F~stularia tabacana
Eucinostomus argenteus Eucinostomus lefroyi Gerres cinereus
Ginglymosfoma cirratum
Bathygobrus soporator Coryphopterus glaucofraenum Gnatholepis thornpsonr Gobiosoma evelynae Gobiosoma horsti
Gramma lorefo Gramma melacara Ryptrcus saponaceus
An~sotremus sunnamensrs Anisotremus virgrnrcus Haemulon album Haemulon aurolineatum Haemulon bonarrense Haemulon boschmae
Haernulon carbonarrum Haemulon chrysargyreum Haernulon flavolrneatum Haemulon macrostomum Haemulon melanurum Haemulon parrai Haernulon plumierr Haemulon scrurus Haemulon ste~ndachner~ Haemulon striatum Olfhopristis chrysoptera Orthopnstis poeyr Olfhopristis ruber
8 (SL)
20
18 % 22 6 8 %
26 %
48
151
45 +
300 76
26.3 % 26.3 % 51 60 %
85 % 79
47
23 (SL)/
15 8
10 6
90
18 1
I83
30 %
40
430
15 8 (SL) 6 SLI 5 (SL) 5 (SL)
8 + 10 - 29 5 (SL%)
63 TL% 30 I 65 FL 23 FL 30 FL 19 1
38 % 24 % 27 I 45 % 30 FL 41 42 41 % 27 28 46 24 33
Beebe and Tee-Van (1928)
Randall (1 962, 1967, 1968)
Figuereido and Menezes (1977) Randall (1962. 1967, 1968) Fischer (1978) Fischer (1978)
Randall (1962, 1967, 1968)
Pauly and Palomares (1986)
F~scher (1978) Randall (1962, 1967, 1968)
Randall (1962, 1967, 1968) Randall (1962, 1967, 1968) Randall (1962, 1967. 1968) Randall (1962, 1967, 1968)
Pauly (1 978)
Randall (1962. 1967, 1968)
Fischer (1978) Fischer (1978); Randall (1962.
1967, 1968) Fischer (1 978) Fischer (1 978)
Flscher (1978), Randall (1962, 1967, 1968)
Fischer (1978)
Randall (1962, 1967, 1968)
Flguereido and Menezes (1977)
Beebe and Tee-Van (1928), Flscher (1978), Randall (1962, 1967, 1968)
Fischer (1978)
Randall (1962, 1967, 1968) Randall (1962, 1967. 1968) Randall (1962. 1967. 1968) Randall (1962, 1967, 1968) Randall (1962. 1967, 1968)
Randall (1962. 1967, 1968) Randall (1962, 1967, 1968) Randall (1962, 1967, 1968)
Randall (1962, 1967. 1968) Randall (1962, 1967. 1968) Pauly (1980) Munro (1983) Munro (1983) Flscher (1978); Randall (1962.
1967, 1968) Randall (1962, 1967, 1968) Randall (1962 1967 1968) Randall i1962: 1967: 1968) Randall (1 962, 1967, 1968) Munro (1 983) Randall (1962. 1967. 1968) Munro (1983) Randall (1962. 1967. 1968) Randall (1962.1967.1968) Randall (1962, 1967,1968) Darcy (1983), Fischer (1978) Flscher (1978) Randall (1962, 1967, 1968)
Smith and Tyler (1972)
Smith and Tyler (1972)
Beebe and Tee-Van (1 928)
Pauly and Palomares (1986)
Beebe and Tee-Van (1928); Figuereido and Menezes (1977)
Beebe and Tee-Van (1928)
Beebe and Tee-Van (1 928)
Randall (1962, 1967, 1968)
Beebe and Tee-Van (1928)
Smith and Tyler (1972)
Beebe and Tee-Van (1928); Figuereido and Menezes (1977)
Beebe and Tee-Van (1 928); Randall (1962, 1967, 1968)
Randall (1962, 1967, 1968)
Figuereido and Menezes (1977)
Smith and Tyler (1972) Smith and Tyler (1972) Smlth and Tyler (1972) Srnlth and Tyler (1972)
Sm~th and Tyler (1972)
Randall (1962, 1967, 1968) Munro (1983) Munro (1983) Munro (1 983) Munro (1 983)
Munro (1983) Munro (1983) Munro (1983) Randall (1962, 1967, 1968) Munro (1983)
Munro (1983) Randall (1962, 1967, 1968)
Darcy (1983)
continued ...
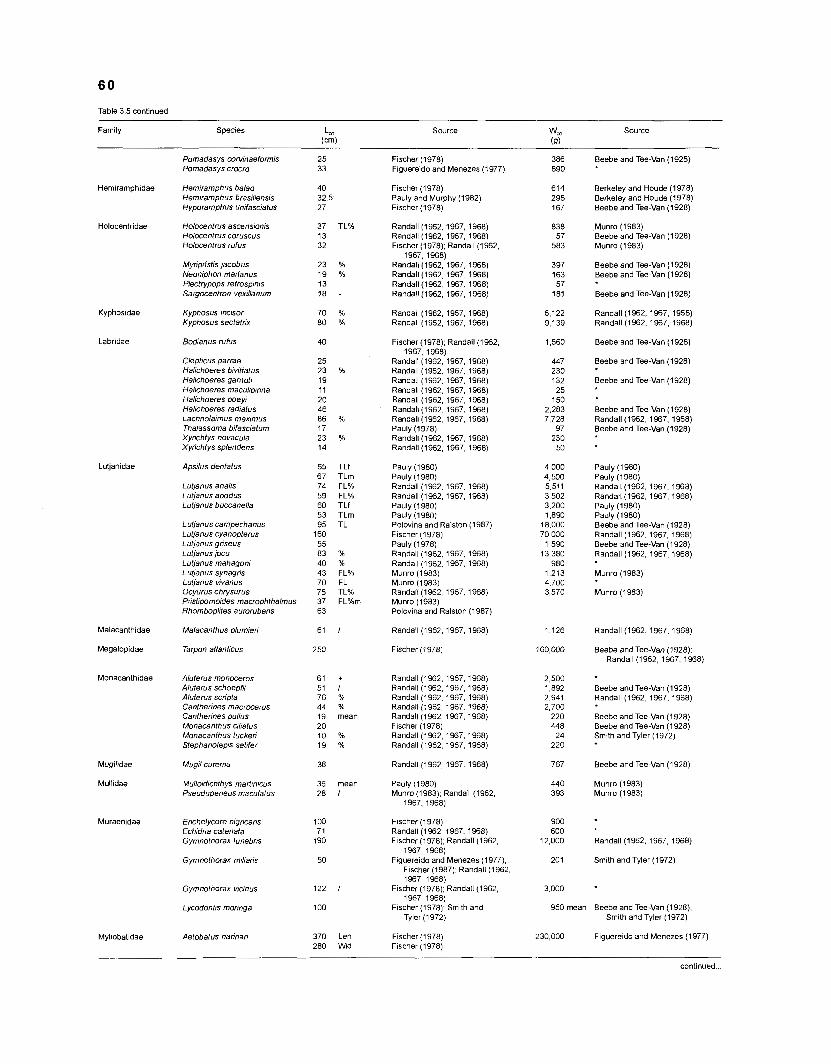
Table 3.5 continued
Family Species k c (cm)
Source
Hemiramphidae
Holocentridae
Kyphosldae
Labridae
Lutjanidae
Malacanthidae
Megalopldae
Monacanthidae
Mugilidae
Mullldae
Muraen~dae
Myllobatidae
Pomadasys corvinaeformis Pomadasys crocro
Hemiramphus balao Hemiramphus brasiliensrs Hyporamphus unifasciafus
Holocentrus ascensionrs Holocentrus coruscus Holocentrus rufus
Myripristis jacobus Neoniphon marianus Plectrypops refrospinis Sargocentron vex~llariom
Kyphosus incisor Kyphosus sectatnx
Bodianus rufus
Clepbcus parrae Halichoeres bivrttafus Halichoeres garnob Halrchoeres maculipinna Halichoeres poeyr Halichoeres radratus Lachnolaimus maxrmus Thalassoma bifascratum Xyrichtys novacula Xyrichtys splendens
Apsilus dentatus
Lutjanus analis Lufjanus apodus Lutjanus buccanella
Lutjanus campeehanus Lutjanus cyanopterus Lutjanus grrseus Lutjanus jocu Lubanus mahagonr Luoanus synagris Lutjanus vwanus Ocyurus chrysurus Pnstipomordes macrophthalmus Rhomboplifes aurorubens
Malacanthus plumieri
Tarpon atlanticus
Aluterus monoceros Aluterus schoepfi Aluterus scripta Cantherhes macrocerus Cantherines pullus Monacanthus cfliatus Monacanthus tuckeri Stephanoleprs setifer
Mugil curema
Yullodchthys marfinicus Pseudupeneus maculatus
Enchelycore nigricans Echidna catenata Gymnothorax funebrrs
Gymnothorax rnrlfaris
Gymnothorax vicrnus
Lycodontis morrnga
Aetobatus narinari
25 33
40 32.5 27
37 TL% 13 32
23 % 19 % 13 18 -
70 % 80 %
40
25 23 % 19 11 20 46 86 % 17 23 % 14
65 TLf 67 TLm 74 FL% 59 FL% 60 TLf 53 TLm 95 TL
160 55 83 % 40 % 43 FL% 70 FL 75 TL% 37 FL%rn 63
61 1
250
61 + 51 I 76 % 44 % 19 mean 20 10 % 19 %
38
35 mean 28 1
100 71
190
50
122 1
100
370 Len 280 Wid
Fischer (1978) Figuereido and Menezes (1977)
Fischer (1 978) Pauly and Murphy (1982) Fischer (1978)
Randall (1962. 1967, 1968) Randall (1962, 1967, 1968) Fischer (1978); Randall (1962.
1967, 1968) Randan (1962, 1967,1968) Randall (1962, 1967, 1968) Randall (1962, 1967. 1968) Randall (1962, 1967, 1968)
Ranaal (1962 1967 1968) Ranaal (1962 1967 1968)
Flscher (1978); Randall (1962, 1967: 1968)
Randall (1962, 1967, 1968) Randall 11962. 1967. 19681 Randall i1962: 1967: 1968) Randall (1962, 1967, 1968) Randall (1 962, 1967, 1968) Randall (1962, 1967, 1968) Randall (1962, 1967, 1968) Pauly (1978) Randa l(1962 1967 1968) Randa l(1962 1967 1968)
Pauly (1 980) Pauly (1 980) Randall (1962, 1967, 1968) Randall (1962, 1967, 1968) Pauly (1980) Pauly (1980) Polovina and Ralston (1987) F~scher (1978) Pauly (1978) Randall (1962, 1967, 1968) Randall (1962, 1967, 1968) Munro (1983) Munro (1983) Randall (1962, 1967. 1968) Munro (I 983) Polovlna and Ralston (1987)
Randall (1962, 1967, 1968)
Randall (1962. 1967, 1968) Ranoa ,1962 1967 1968) Ranoa 1562 1967 19681 Randall i196z: 1967,1968) Randall (1962, 1967. 1968) F~scher (1978) Randall (1962, 1967, 1968) Randall (1962, 1967, 1968)
Randall (1 962, 1967, 1968)
Pauly (1980) Munro (1983); Randall (1962.
1967. 1968)
F~scher (1 978) Randall (1962, 1967. 1968) F~scher (1978), Randall (1962,
1967, 1968) Figuereido and Menezes (1 977);
Flscher (1987); Randall (1962, 1967, 1968)
F~scher (1978); Randall (1962, 1967, 1968)
Fischer (1978); Smith and Tyler (1972)
Fischer (1978) F~scher (1 978)
Beebe and Tee-Van (1928)
Berkeley and Houde (1978) Berkeley and Houde (1 978) Beebe and Tee-Van (1928)
Munro (1 983) Beebe and Tee-Van (1928) Munro (1983)
Beebe and Tee-Van (1928) Beebe and Tee-Van (1928)
Beebe and Tee-Van (1928)
Randall (1962, 1967, 1968) Randall (1962, 1967, 1968)
Beebe and Tee-Van (1928)
Beebe and Tee-Van (1928)
Beebe and Tee-Van (1928)
Beebe and Tee-Van (1928) Randan (1962.1967, 1968) Beebe and Tee-Van (1928)
Pauly (1980) Pauly (1980) Randall (1962. 1967, 1968) Randall (1962, 1967. 1968) Pauly (1980) Pauly (1980) Beebe and Tee-Van (1928) Randall (1962, 1967, 1968) Beebe and Tee-Van (1928) Randall (1 962, 1967, 1968)
Munro (1983)
Munro (1983)
Randall (1962, 1967, 1968)
Beebe and Tee-Van (1 928); Randall (1982,1967, 1968)
Beebe and Tee-Van (1928) Randall (1962, 1967,1968)
Beebe and Tee-Van (1 928) Beebe and Tee-Van (1928) Smith and Tyler (1972)
Beebe and Tee-Van (1 928)
Munro (1983) Munro (1983)
Randall (1962, 1967, 1968)
Smith and Tyler (1 972)
950 mean Beebe and Tee-Van (1928); Smith and Tyler (1972)
230,000 F~guereido and Menezes (1977)
continued ...
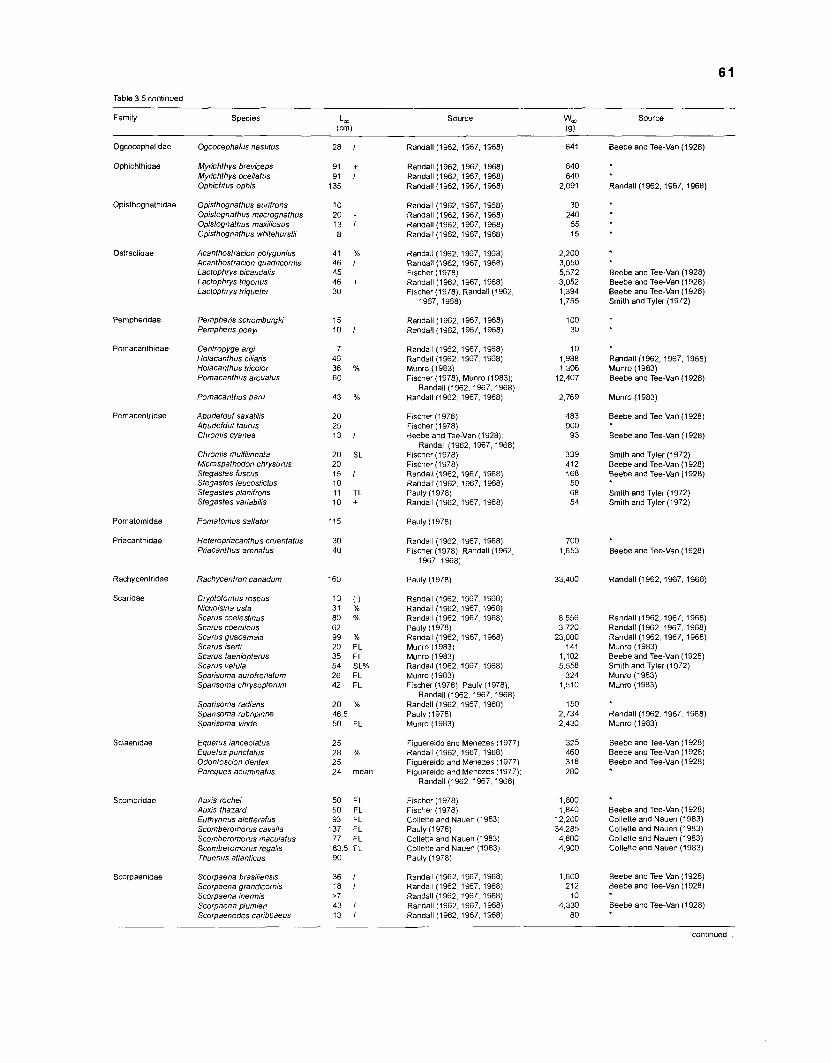
6 1
Table 3.5 continued
Family Species Source Wm Source (9)
Ogcocephalidae
Ophlchthidae
Ogcocephalus nasufus
Myrichthys breviceps Myrichthys ocellatus Ophichtus ophis
Opisthognathidae
Ostraciidae
Pernpheridae
Pornacanthidae
Pomacentridae
Pornatomidae
Priacanthidae
Rachycentridae
Scaridae
Sciaenidae
Scorpaenidae
Opisthognathus aurifrons Opistognathus macrognathus Opistognathus rnaxillosus Opisthognathus whitehurstii
Acanthostracion polygonius Acanthostracion quadncornrs Lacfophrys brcaudahs Lactophrys trrgonus Lacfophrys triquefer
Pernpheris schornburgkr Pernpheris poeyi
Centropyge argi Holacanthus ciliaris Holacanfhus tricolor Pornacanthus arcuafus
Pornacanthus paru
Abudefduf saxat;lis Abudefduf taurus Chrornis cyanea
Chromrs rnultilrneata Mrcrospathodon chrysurus Stegastes fuscus Stegasfes leucostictus Stegastes planifrons Stegastes variabrlis
Pornatomus saltator
Heteropriacanthus cruentatus Priacanthus arenafus
Rachycentron canadurn
Cryptotornus roseus Nicholsina usta Scarus coelesbnus Scarus coeruleus Scarus guacarnara Scarus [serf, Scarus taeniopterus Scarus vetula Sparisorna aurofrenafum Sparisorna chrysopterurn
Spansorna radians Sparisorna rubr;pinne Sparisorna vrrrde
Equetus lanceolatus Equetus punctatus Odontoscion dentex Pareques acurninatus
Auxrs rocher Aux~s !hazard Euthynnus aletteratus Scomberornorus cavalla Scomberornorus maculatus Scomberomorus regalis Thunnus atlantrcus
Scorpaena brasrhensis Scorpaena grandrcornis Scorpaena inerrnis Scorpaena plurnieri Scorpaenodes carrbbaeus
28 1
91 + 91 1
135
10 - 20 - 13 1 8
41 % 46 1 45 46 + 30
15 10 1
7 46 36 % 60
43 %
20 25 13 I
20 SL 20 15 1 10 11 TL 10 +
115
30 40
160
13 0 31 % 80 % 62 99 % 20 FL 35 FL 54 SL% 26 FL 42 FL
20 % 46 5 50 FL
25 28 % 25 24 mean
50 FL 50 FL 93 FL
137 FL 77 FL 835 FL 90
36 I 18 1 >7 43 I 13 I
Randall (1962, 1967, 1968)
Randall (1962, 1967, 1968) Randall (1 962, 1967, 1968) Randall (1962, 1967, 1968)
Randall (1962, 1967, 1968) Randall (1 962, 1967, 1968) Randall (1962, 1967, 1968) Randan (1962, 1967, 1968)
Randall (1962, 1967, 1968) Randall (1962, 1967, 1968) Fischer (1978) Randall (1962, 1967, 1968) Fischer (1978); Randall (1962,
1967, 1968)
Randall (1 962,1967,1968) Randall (1962, 1967, 1968)
Randall (1962, 1967, 1968) Randall (1962, 1967, 1968) Munro (1 983) Flscher (1978); Munro (1983);
Randall (1962. 1967, 1968) Randall (1962. 1967, 1968)
Fischer (1978) Flscher (1978) Beebe and Tee-Van (1928);
Randall (1 962, 1967,1968) Fischer (1978) Flscher (1 978) Randall (1962,1967,1968) Randall (1962, 1967, 1968) Pauly (1978) Randall (1962, 1967. 1968)
Pauly (1978)
Randall (1962. 1967. 1968) Flscher (1978). Randall (1962,
1967, 1968)
Pauly (1978)
Randall (1962, 1967, 1968) Randall (1962, 1967, 1968) Randall (1962, 1967, 1968) Pauly (1978) Randall (1962, 1967, 1968) Munro (1 983) Munro (1983) Randall (1962, 1967. 1968) Munro (1983) F~scher (1978). Pauly (1978),
Randall (1962. 1967, 1968) Randall (1962, 1967, 1968) Pauly (1978) Munro (1983)
Flguereido and Menezes (1977) Randall (1962. 1967, 1968) Flguereldo and Menezes (1977) Flguereldo and Menezes (1977),
Randall (1962, 1967, 1968)
Flscher ( I 978) F~scher (1978) Collette and Nauen (1983) Pauly (1978) Collette and Nauen (1983) Collette and Nauen (1983) Pauly (1978)
Randall (1962. 1967, 1968) Randall (1962, 1967, 1968) Randall (1962, 1967, 1968) Randall (1962, 1967, 1968) Randall (1962, 1967, 1968)
Beebe and Tee-Van (1 928)
Randall (1962, 1967, 1968)
Beebe and Tee-Van (1928) Beebe and Tee-Van (1928) Beebe and Tee-Van (1 928) Smith and Tyler (1972)
Randall (1962, 1967, 1968) Munro (1983) Beebe and Tee-Van (1928)
Munro (1983)
Beebe and Tee-Van (1928)
Beebe and Tee-Van (1 928)
Smlth and Tyler (1972) Beebe and Tee-Van (1928) Beebe and Tee-Van (1928)
Srn tn and Tyler (1972) Sm lh ana Tyler (1972)
Beebe and Tee-Van (1 928)
Randall (1962, 1967, 1968)
Randall (1962. 1967, 1968) Randall (1962,1967, 1968) Randall (1962, 1967, 1968) Munro (1983) Beebe and Tee-Van (1928) Smith and Tyler (1972) Munro (1 983) Munro (1983)
Randall (1962,1967, 1968) Munro (1 983)
Beebe and Tee-Van (1928) Beebe and Tee-Van (1928) Beebe and Tee-Van (1 928)
Beebe and Tee-Van (1928) Collette and Nauen (1983) Collette and Nauen (1983) Collette and Nauen (1983) Collette and Nauen (1983)
Beebe and Tee-Van (1928) Beebe and Tee-Van (1928)
Beebe and Tee-Van (1928)
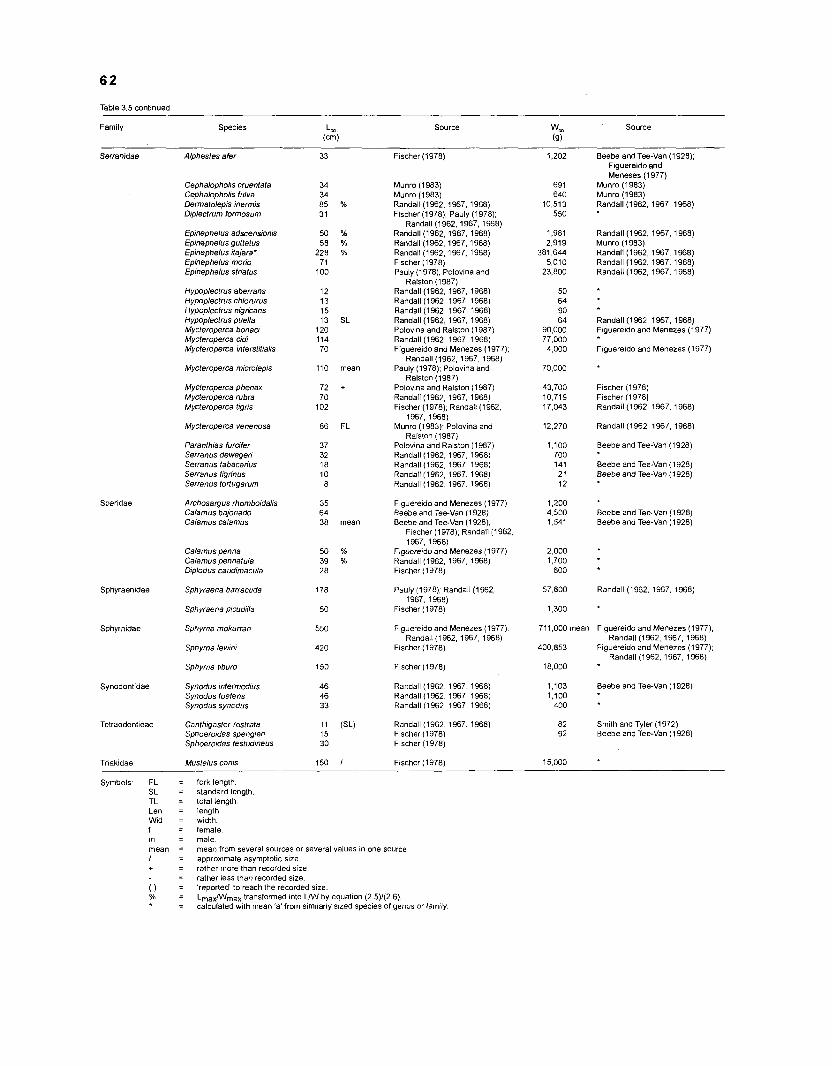
Table 3.5 continued
Family Species Source '"40 Source (9)
Serranidae Alphestes afer
Cephalopholis cruentata Cephalopholis fulva Derrnatolepis inerrnis Diplectrurn forrnosurn
Epmephelus adscensionis Epinephelus gutfatus Epinephelus rtajara' Epinephelus rnorio Epinephelus striatus
Hypoplectrus aberrans Hypoplectrus chlorurus Hypoplectrus nigricans Hypoplectrus puella Mycteroperca bonaci Mycteroperca cidi Mycteroperca interstitialis
Mycteroperca microleprs
Mycteroperca phenax Mycteroperca rubra Mycteroperca tigrrs
Mycteroperca venenosa
Sphyraenldae
Sphyrnidae
Paranthras furcifer Serranus dewegeri Serranus tabacarios Serranus tigrinus Serranus tortugarum
Archosargus rhomboidabs Calamus bajonado Cabrnus calamus
Calamus penna Calamus pennatula Drplodus caudimacula
Sphyraena barracuda
Sphyraena picudilla
Sphyrna mokarran
Sphyrna lewrnr
Sphyrna f~buro
Synodontidae Synodus intermedrus Synodus foefens Synodus synodus
Tetraodontldae Canthrgaster rosfrata Sphoeroides spenglen Sphoerordes testudrneus
Triakidae Mustelus canis
33
34 34 85 % 31
50 % 58 %
228 % 71
100
12 13 15 13 SL
120 114 70
110 mean
72 + 70
102
86 FL
37 32 18 10 8
35 64 38 mean
50 % 39 % 28
I78
50
550
420
150
46 46 33
11 (SL) 15 30
150 1
Fischer (1978)
Munro (1983) Munro (1983) Randall (1962, 1967, 1968) Flscher (1978); Pauly (1978);
Randan (1962,1967,1968) Randall (1 962, 1967, 1968) Randall (1962, 1967. 1968) Randall (1962, 1967, 1968) Fischer ( I 978) Pauly (1978). Polovina and
Ralston (1987) Randall (1962, 1967, 1968) Randall (1962, 1967, 1968) Randall (1 962, 1967,1968) Randan (1962,1967,1968) Polovlna and Ralston (1987) Randall (1962. 1967, 1968) Figuereldo and Menezes (1 977);
Randan (1962,1967. 1968) Pauly (1978); Polovina and
Ralston (1987) Polovina and Ralston (1987) Randall (1962, 1967, 1968) Fischer (1978); Randall (1962,
1967, 1968) Munro (1983): Polovina and
Rals!on (1987) Polovina and Ralston (1987) Randan (1962, 1967,1968) Randall (1962, 1967, 1968) Randall (1962, 1967, 1968) Randall (1962. 1967. 1968)
Flguereido and Menezes (1977) Beebe and Tee-Van (1928) Beebe and Tee-Van (1 928),
F~scher (1978), Randall (1962, 1967, 1968)
Flguereido and Menezes (1 977) Randall (1962, 1967, 1968) Flscher (1978)
Pauly (1978), Randall (1962, 1967, 1968)
Flscher (1978)
Flguereldo and Menezes (1977), Randan (1962, 1967, 1968)
Fischer (1 978)
Randall (1962. 1967. 1968) Randall ,1962 1967 1968, Ranoa 1962 1967 1968,
Randall (1962. 1967. 1968) F~scher (1978) Flscher (1978)
Symbols: FL = SL = TL = Len = Wid = f = m = mean = 1 = + =
0 = % = * =
fork length. standard length. total length. length width. female male mean from several sources or several values in one source approxlmate asymptotic slze. rather more than recorded size rather less than recorded size. 'reported' to reach the recorded size. LmaxNVma, transformed into LNV by equatlon (2 5)1(2 6). calculated with mean 'a' from similarly %zed species of genus or famrly
Beebe and Tee-Van (1928); Flguereido and Meneses (1977)
Munro (1983) Munro (1983) Randall (1962. 1967, 1968)
Randall (1962, 1967, 1968) Munro (1 983) Randall (1 962, 1967. 1968) Randall (1962,1967,1968) Randall (1962, 1967, 1968)
Randall (1962, 1967. 1968) Figuereido and Menezes (1977)
Figuereido and Menezes (1977)
Fischer (1 978) Flscher (1 978) Randall (1962, 1967. 1968)
Randall (1962, 1967, 1968)
Beebe and Tee-Van (1928)
Beebe and Tee-Van (1928) Beebe and Tee-Van (1928)
Beebe and Tee-Van (1 928) Beebe and Tee-Van (1928)
Randall (1 962, 1967. 1968)
711,000 mean F~guereldo and Menezes (1977), Randall (1962, 1967, 1968)
400.853 Figuereido and Menezes (1977); Randall (1962. 1967, 1968)
18,000
1 , I 03 Beebe and Tee-Van (1 928) 1.100
400
82 Smith and Tyler (1972) 92 Beebe and Tee-Van (1928)
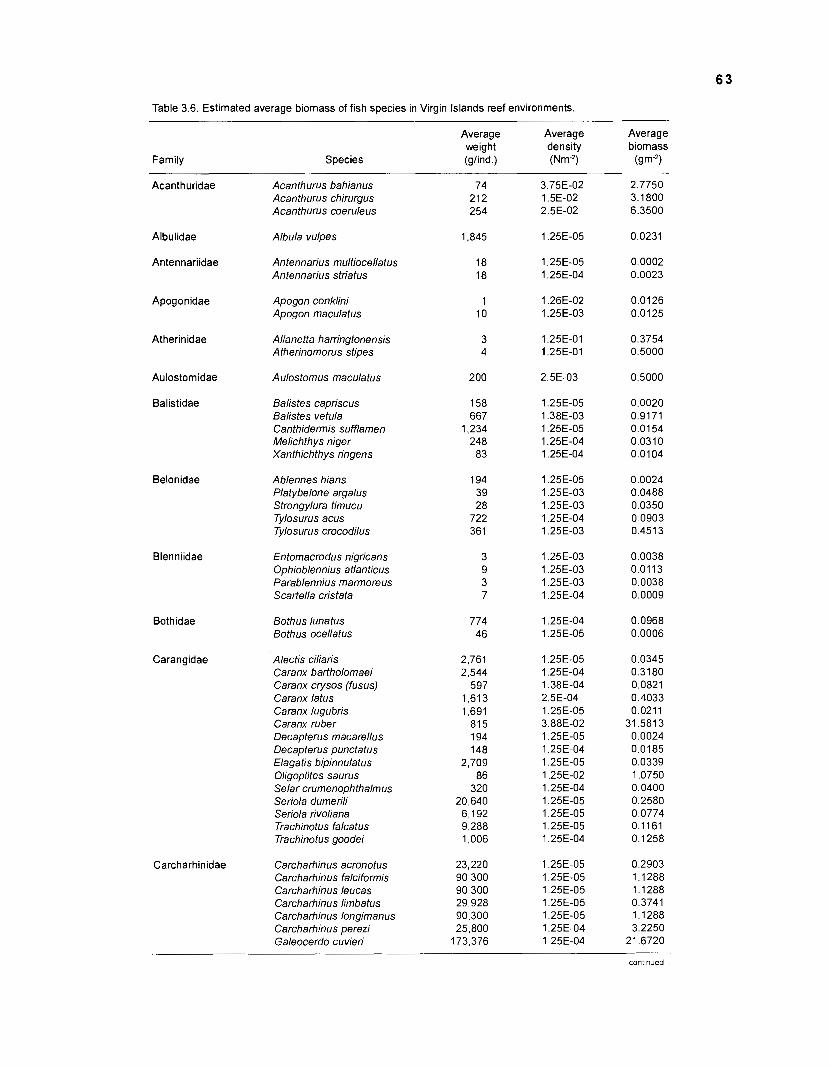
Table 3.6. Estimated average biomass of fish species in Virgin Islands reef environments.
Family Species
Acanthuridae
Albulidae
Antennariidae
Apogonidae
Atherinidae
Aulostomidae
Balistidae
Belonidae
Blenniidae
Bothidae
Carangidae
Carcharhinidae
Acanthurus bahianus Acanthurus chirurgus Acanthurus coeruleus
Albula vulpes
Antennarius multiocellatus Antennarius striatus
Apogon conklini Apogon rnaculatus
Allanetta harringtonensis Atherinornorus stipes
Aulostornus maculatus
Balistes capriscus Balistes vetula Canthiderrnis sufflarnen Melichthys niger Xanthichthys ringens
Ablennes hians Platybelone argalus Strongylura timucu Tylosurus acus Tylosurus crocodilus
Entornacrodus nigricans Ophioblennius atlanticus Parablennius mamoreus Scartella cristata
Bothus lunatus Bothus ocellatus
Alectis ciliaris Caranx bartholomaei Caranx crysos (fusus) Caranx latus Caranx lugubris Caranx ruber Decapterus macarellus Decapterus punctatus Elagatis bipinnulatus Oligoplites saurus Selar crurnenophthalmus Seriola dumerili Seriola rivoliana Trachinotus falcatus Trachinotus goodei
Carcharhinus acronotus Carcharhinus falciforrnis Carcharhinus leucas Carcharhinus lirnbatus Carcharhinus longirnanus Carcharhinus perezi Galeocerdo cuvieri
Average weight (glind.)
Average Average density biomass (Nm") (9m")
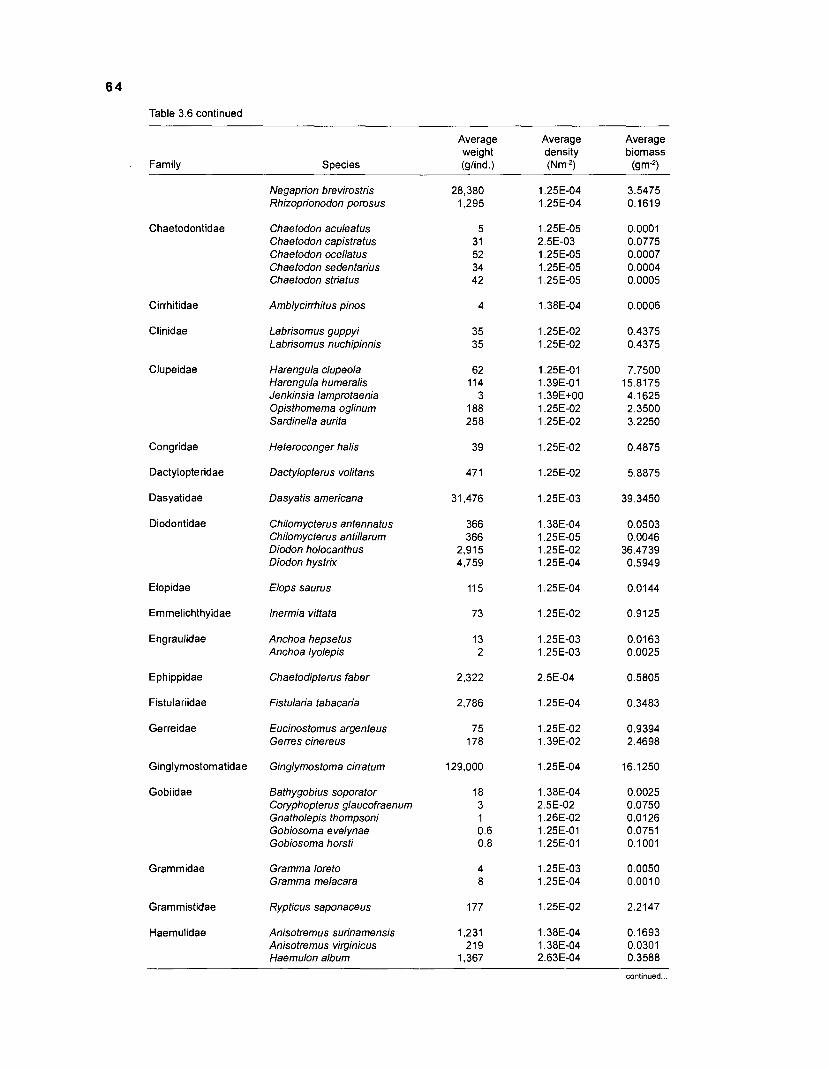
Table 3.6 continued
Family Species
Average Average Average weight density biomass (glind.) (NmS) (gm")
Chaetodontidae
Cirrhitidae
Clinidae
Clupeidae
Congridae
Dactylopteridae
Dasyatidae
Diodontidae
Elopidae
Emmelichthyidae
Engraulidae
Ephippidae
Fistulariidae
Gerreidae
Ginglymostomatidae
Gobiidae
Grammidae
Grammistidae
Haemulidae
Negaprion brevirostris Rhizoprionodon porosus
Chaetodon aculeatus Chaetodon capistratus Chaetodon ocellatus Chaetodon sedentarius Chaetodon striatus
Amblycirrhitus pinos
Labrisomus guppy; Labrisomus nuchipinnis
Harengula clupeola Harengula humeralis Jenkinsia lamprotaenia Opisthomema oglinum Sardinella aurita
Heteroconger halis
Dactylopterus volitans
Dasyatis americana
Chilomycterus antennatus Chilomycterus antillarum Diodon holocanthus Diodon hystrix
Elops saurus
lnermia vittata
Anchoa hepsetus Anchoa lyolepis
Chaetodipterus faber
Fistularia tabacaria
Eucinostomus argenteus Gerres cinereus
Ginglymostoma cirratum
Bathygobius soporator Coryphopterus glaucofraenum Gnatholepis thompsoni Gobiosoma evelynae Gobiosoma horsti
Gramma loreto Gramma melacara
Rypticus saponaceus
Anisotremus surinamensis Anisotremus virginicus Haemulon album
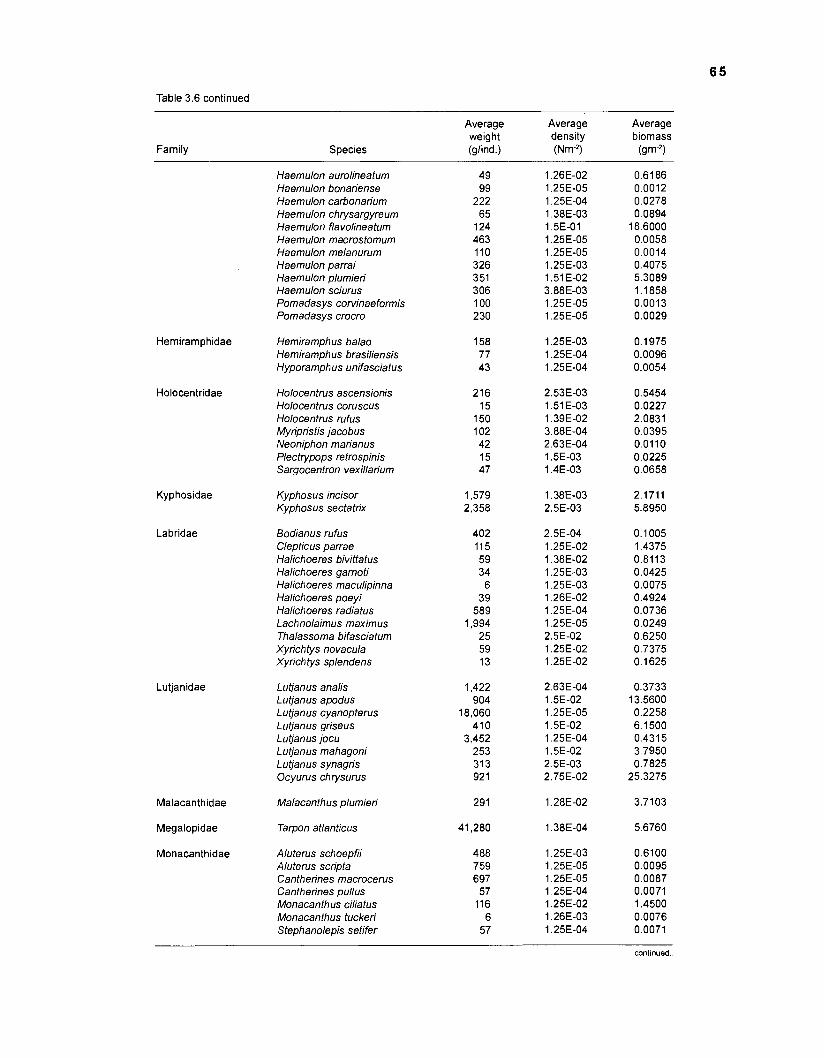
Table 3.6 continued
Average weight (glind.)
Average density (NmS)
1.26E-02 1.25E-05 1.25E-04 1.38E-03 1.5E-01 1.25E-05 1.25E-05 1.25E-03 1.51 E-02 3.88E-03 1.25E-05 1.25E-05
Average biomass
(gm-?
0.6186 0.0012 0.0278 0.0894
18.6000 0.0058 0.0014 0.4075 5.3089 1.1858 0.001 3 0.0029
Family Species
Haemulon aurolineatum Haemulon bonariense Haemulon carbonarium Haemulon chrysargyreum Haemulon flavolineatum Haemulon macrostomum Haemulon melanurum Haemulon parrai Haemulon plumieri Haemulon sciurus Pomadasys corvinaeformis Pomadasys crocro
Hemiramphidae
Holocentridae
Hemiramphus balao Hemiramphus brasiliensis Hyporamphus unifasciatus
Holocentrus ascensionis Holocentrus coruscus Holocentrus rufus Myripristis jacobus Neoniphon marianus Plectrypops retrospinis Sargocentron vexillarium
Kyphosidae
Labridae
Kyphosus incisor Kyphosus sectatrix
Bodianus rufus Clepticus parrae Halichoeres bivittatus Halichoeres garnoti Halichoeres maculipinna Halichoeres poeyi Halichoeres radiatus Lachnolaimus maximus Thalassoma bifasciatum Xyrichtys novacula Xyrichtys splendens
Lutjanidae Lutjanus analis Lutjanus apodus Lutjanus cyanopterus Lutjanus griseus Lutjanus jocu Lutjanus mahagoni Lutjanus synagris Ocyurus chrysurus
Malacanthidae
Megalopidae
Monacanthidae
Malacanthus plumieri
Tarpon atlanticus
Aluterus schoepfii Aluterus scripta Cantherines macrocerus Cantherines pullus Monacanthus ciliatus Monacanthus tucker; Stephanolepis setifer
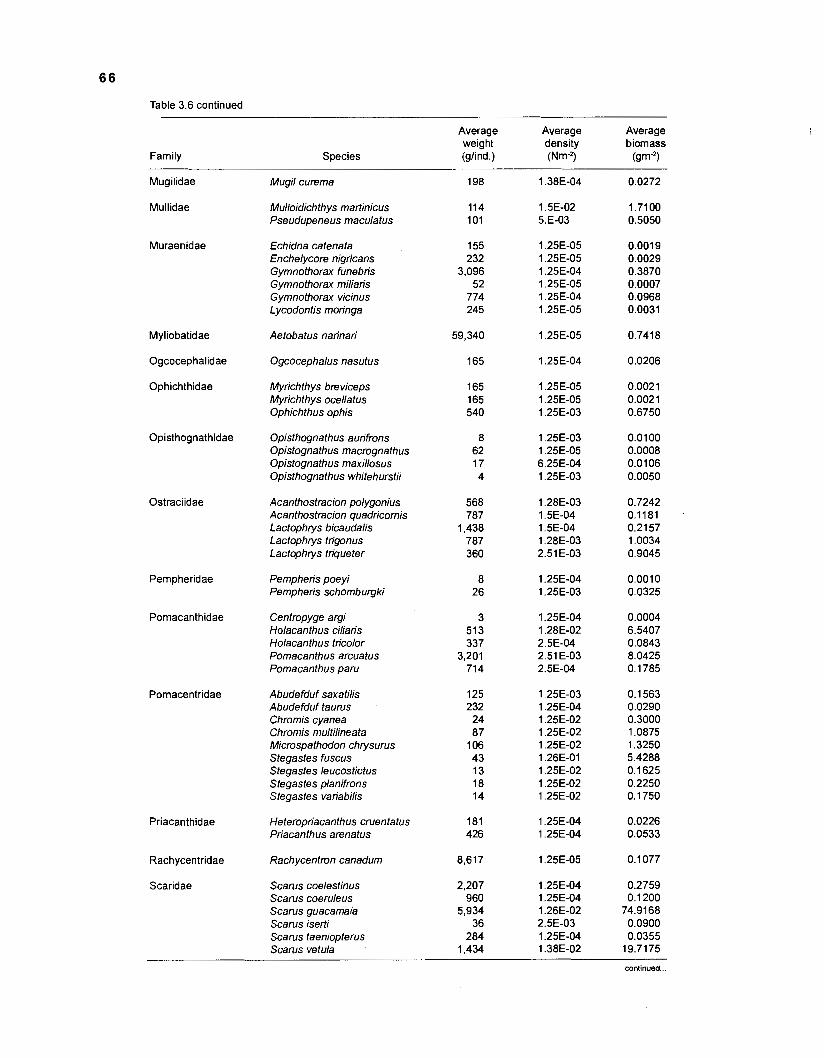
Table 3.6 continued
Family Species
Average Average Average weight density biomass (glind.) (Nm-2) ( V " )
Mugilidae
Mullidae
Muraenidae
Myliobatidae
Ogcocephalidae
Ophichthidae
Opisthognathidae
Ostraciidae
Pempheridae
Pomacanthidae
Pomacentridae
Priacanthidae
Rachycentridae
Scaridae
Mugil curema
Mulloidichthys martinicus Pseudupeneus maculatus
Echidna catenata Enchelycore nigricans Gymnothorax funebris Gymnothorax miliaris Gymnothorax vicinus Lycodontis moringa
Aetobatus narinari
Ogcocephalus nasutus
Myrichthys breviceps Myrichthys ocellatus Ophichthus ophis
Opisthognathus aurifrons Opistognathus macrognatbus Opistognathus maxillosus Opisthognathus whitehurstii
Acanthostracion polygonius Acanthostracion quadricornis Lactophrys bicaudalis Lactophrys trigonus Lactophrys triqueter
Pempheris poeyi Pempheris schomburgki
Centropyge argi Holacanthus ciliaris Holacanthus tricolor Pomacanthus arcuatus Pomacanthus paru
Abudefduf saxatilis Abudefduf taurus Chromis cyanea Chromis multilineata Microspathodon chrysurus Stegastes fuscus Stegastes leucostictus Stegastes planifrons Stegastes variabilis
Heteropriacanthus cruentatus Priacanthus arenatus
Rachycentron canadum
Scarus coelestinus Scarus coeruleus Scarus guacamaia Scarus iserti Scarus taeniopterus Scarus vetula
continued ...
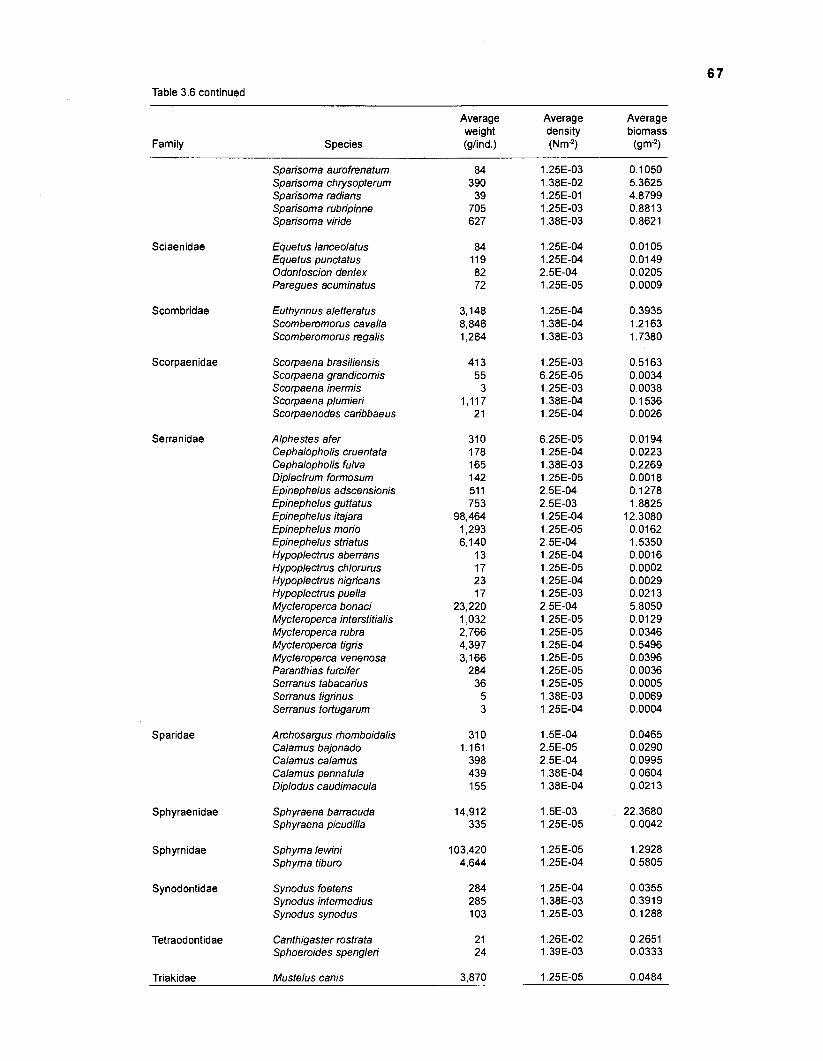
Table 3.6 continued
Family Species
Average Average Average weight density biomass (glind.) (Nn2) (gm")
Sciaenidae
Scombridae
Scorpaenidae
Serranidae
Sparidae
Sphyraenidae
Sphyrnidae
Synodontidae
Tetraodontidae
Sparisoma aurofrenatum Sparisoma chrysopterum Sparisoma radians Sparisoma rubripinne Sparisoma viride
Equetus lanceolatus Equetus punctatus Odontoscion dentex Paregues acuminatus
Euthynnus aletteratus Scomberomorus cavalla Scomberomorus regalis
Scorpaena brasiliensis Scorpaena grandicornis Scorpaena inermis Scorpaena plumieri Scorpaenodes caribbaeus
Alphestes afer Cephalopholis cruentata Cephalopholis fulva Diplectrum formosum Epinephelus adscensionis Epinephelus guttatus Epinephelus itajara Epinephelus mono Epinephelus striatus Hypoplectrus aberrans Hypoplectrus chlorurus Hypoplectrus nigricans Hypoplectrus puella Mycteroperca bonaci Mycteroperca interstitialis Mycteroperca rubra Mycteroperca tigris Mycteroperca venenosa Paranthias furcifer Serranus tabacarius Serranus tigrinus Serranus tortugarum
Archosargus rhomboidalis Calamus bajonado Calamus calamus Calamus pennatula Diplodus caudimacula
Sphyraena barracuda Sphyraena picudilla
Sphyrna lewini Sphyrna tiburo
Synodus foetens Synodus intermedius Synodus synodus
Canthigaster rostrata Sphoeroides spenglen
Triakidae Mustelus canis 3,870
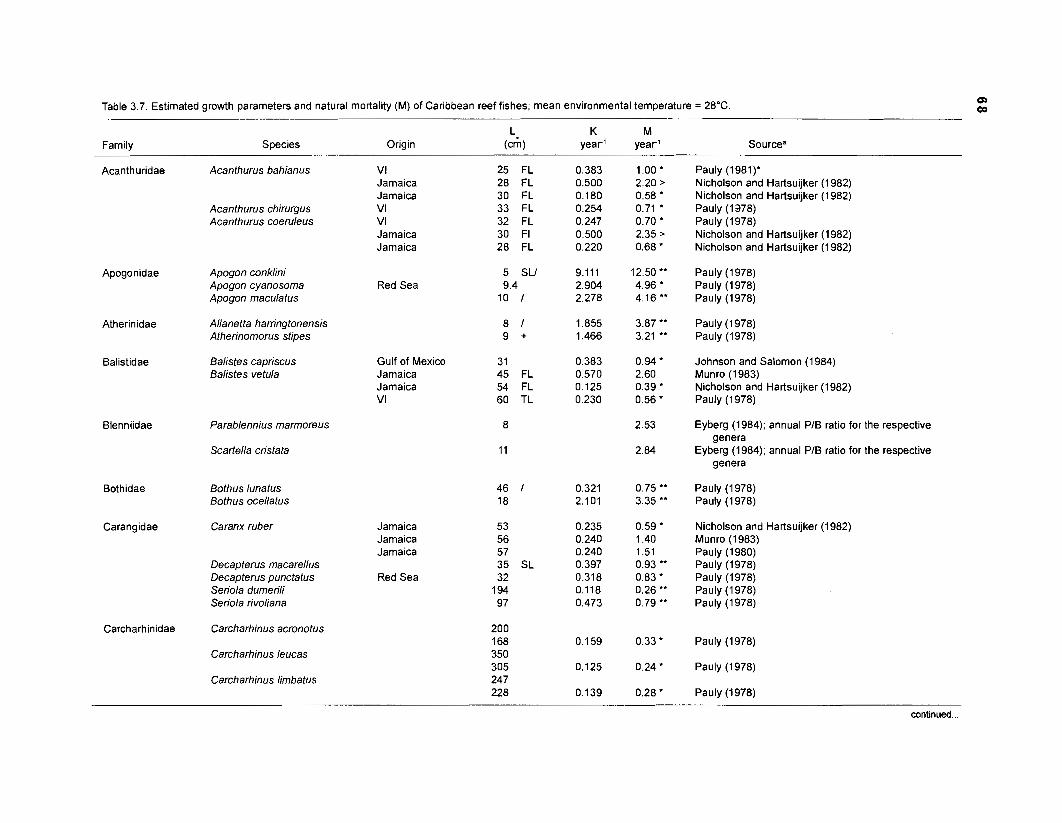
Table 3.7. Estimated growth parameters and natural mortality (M) of Caribbean reef fishes; mean environmental temperature = 28°C.
Family Species Origin
Acanthuridae Acanthurus bahianus
Acanthurus chirurgus Acanthurus coeruleus
Apogonidae
Atherinidae
Balistidae
Blenniidae
Bothidae
Carangidae
Carcharhinidae
Apogon conklini Apogon cyanosoma Apogon maculatus
Allanetta harringtonensis A therinomorus stipes
Balistes capriscus Balistes vetula
Parablennius marmoreus
Scartella cristata
Bothus lunatus Bothus ocellatus
Caranx ruber
Decapterus macarellus Decapterus punctatus Seriola dumerili Seriola rivoliana
Carcharhinus acronotus
Carcharhinus leucas
Carcharhinus limbatus
VI Jamaica Jamaica VI VI Jamaica Jamaica
Red Sea
Gulf of Mexico Jamaica Jamaica VI
Jamaica Jamaica Jamaica
Red Sea
Pauly (1 981 )* Nicholson and Hartsuijker (1 982) Nicholson and Hartsuijker (1 982) Pauly (1 378) Pauly (1 978) Nicholson and Hartsuijker (1982) Nicholson and Hartsuijker (1982)
Pauly (1 978) Pauly (1 978) Pauly (1978)
Pauly (1 978) Pauly (1 978)
Johnson and Salomon (1 984) Munro (1983) Nicholson and Hartsuijker (1982) Pauly (1 978)
Eyberg (1984); annual PIB ratio for the respective genera
Eyberg (1984); annual PIB ratio for the respective genera
Pauly (1 978) Pauly (1 978)
Nicholson and Hartsuijker (1982) Munro (1983) Pauly (1980) Pauly (1978) Pauly (1978) Pauly (1 978) Pauly (1 978)
Pauly (1978)
Pauly (1 978)
Pauly (1978)
continued
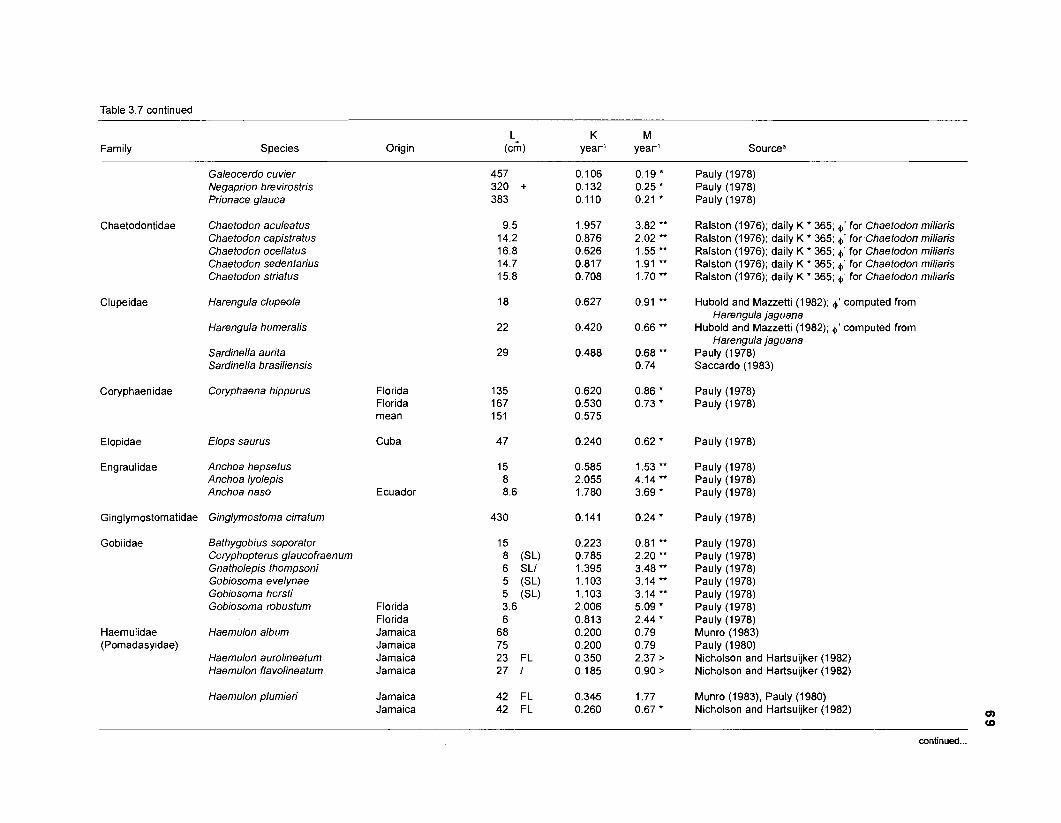
Table 3.7 continued
Family Species
Galeocerdo cuvier Negaprion brevirostris Prionace glauca
Origin
Pauly (1978) Pauly (1 978) Pauly (1978)
Chaetodontidae Chaetodon aculeatus Chaetodon capistratus Chaetodon ocellatus Chaetodon sedentarius Chaetodon striatus
Ralston (1976); daily K * 365; 4' for Chaetodon miliaris Ralston (1 976); daily K * 365; 4' for Chaetodon miliaris Ralston (1976); daily K * 365; 4' fpr Chaetodon miliaris Ralston (1976); daily K * 365; 4' for Chaetodon miliaris Ralston (1 976); daily K * 365; 4' for Chaetodon miliaris
Clupeidae Harengula clupeola Hubold and Mazzetti (1 982); 4' computed from Harengula jaguana
Hubold and Mazzetti (1982); 4' computed from Harengula jaguana
Pauly (1 978) Saccardo (I 983)
Harengula humeralis
Sardinella aurita Sardinella brasiliensis
Coryphaenidae Coryphaena hippurus Florida Florida mean
Pauly (1 978) Pauly (1978)
Elopidae Elops saurus Cuba Pauly (1 978)
Engraulidae Anchoa hepsetus Anchoa lyolepis Anchoa naso
Pauly (1 978) Pauly (1978) Pauly (1 978) Ecuador
Ginglymostomatidae Ginglymostoma cirratum Pauly (1 978)
Gobiidae Bathygobius soporator Coryphopterus glaucofraenum Gnatholepis thompsoni Gobiosoma evelynae Gobiosoma horsti Gobiosoma robusturn
Pauly (1 978) Pauly (1 978) Pauly (1 978) Pauly (1 978) Pauly (1 978) Pauly (1 978) Pauly (1 978) Munro (1983) Pauly (1 980) Nicholson and Hartsuijker (1982) Nicholson and Hartsuijker (1982)
Florida Florida Jamaica Jamaica Jamaica Jamaica
Haemulidae Haemulon album (Pomadasyidae)
Haemulon aurolineatum Haemulon flavolineatum
Haemulon plumier; Jamaica Jamaica
Munro (1983), Pauly (1980) Nicholson and Hartsuijker (1982)
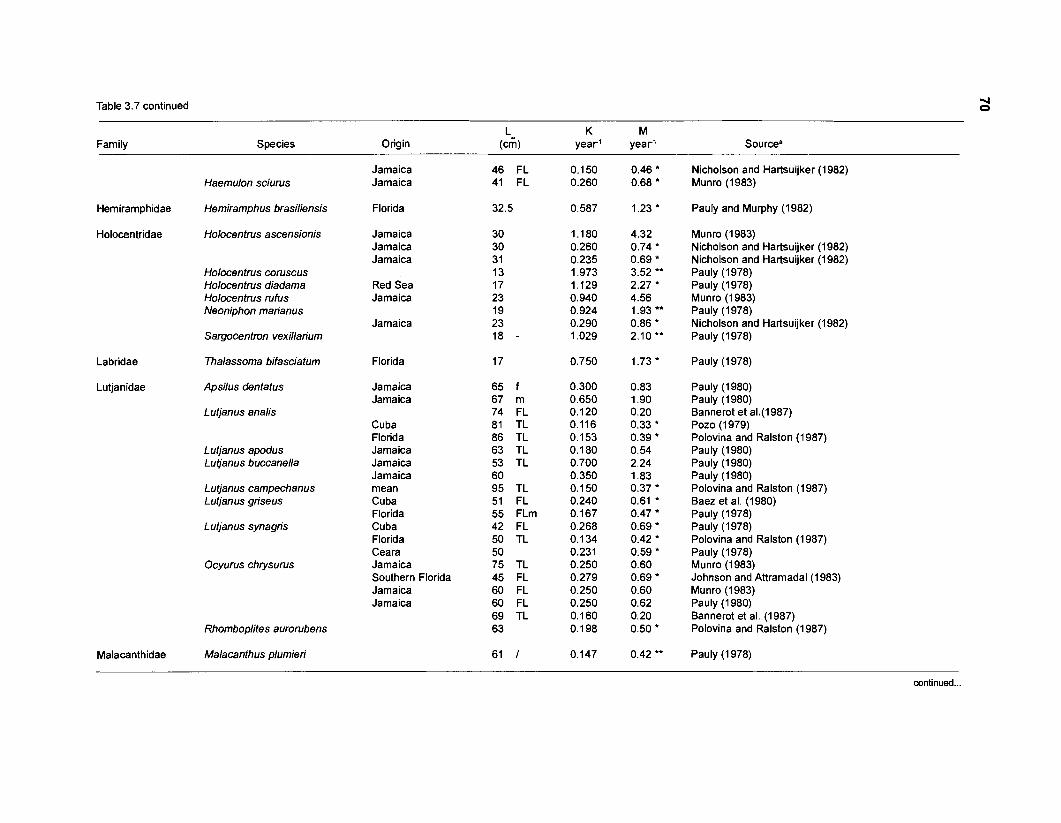
Table 3.7 continued
Family Species Origin
Jamaica Jamaica
Nicholson and Hartsuijker (1982) Munro (1983) Haemulon sciurus
Hemiramphidae Hemiramphus brasiliensis
Holocentridae Holocentrus ascensionis
Florida Pauly and Murphy (1982)
Jamaica Jamaica Jamaica
Munro (1983) Nicholson and Hartsuijker (1982) Nicholson and Hartsuijker (1982) Pauly (1978) Pauly (1978) Munro (1 983) Pauly (1 978) Nicholson and Hartsuijker (1982) Pauly (1 978)
Holocentrus coruscus Holocentrus diadama Holocentrus rufus Neoniphon marianus
Red Sea Jamaica
Jamaica Sargocentron vexillarium
Thalassoma bifasciatum Florida Pauly (1 978) Labridae
Lutjanidae Apsilus dentatus Jamaica Jamaica
65 f 67 m 74 FL 81 TL 86 TL 63 TL 53 TL 60 95 TL 51 FL 55 FLm 42 FL 50 TL 50 75 TL 45 FL 60 FL 60 FL 69 TL 63
Pauly (1 980) Pauly (1 980) Bannerot et aL(1987) Pozo (1 979) Polovina and Ralston (1987) Pauly (1 980) Pauly (1 980) Pauly (1 980) Polovina and Ralston (1987) Baez et al. (1980) Pauly (1 978) Pauly (1 978) Polovina and Ralston (1987) Pauly (1 978) Munro (1983) Johnson and Attramadal(1983) Munro (1983) Pauly (1 980) Bannerot et al. (1987) Polovina and Ralston (1987)
Lutjanus analis Cuba Florida Jamaica Jamaica Jamaica mean Cuba Florida Cuba Florida Ceara Jamaica Southern Florida Jamaica Jamaica
Lutjanus apodus Lutjanus buccanella
Lutjanus campechanus Lutjanus griseus
Lutjanus synagris
Ocyurus chrysurus
Rhomboplites aurorubens
Malacanthidae Malacanthus plumieri Pauly (1 978)
continued..
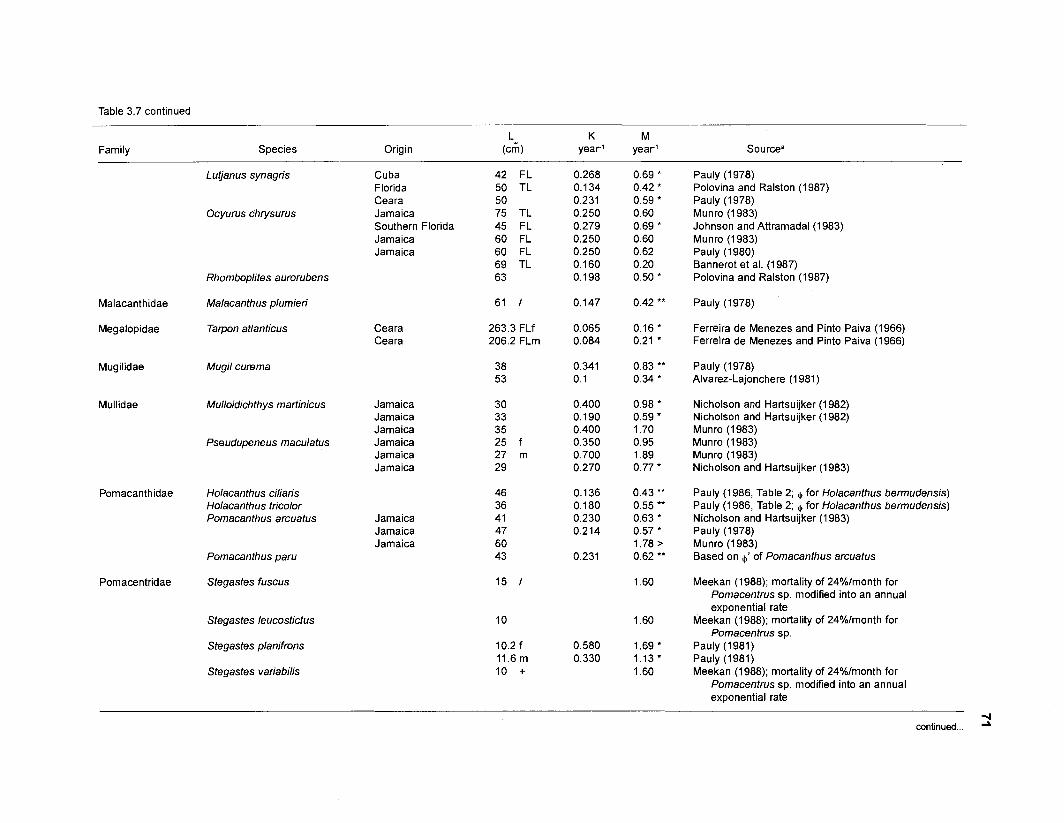
Table 3.7 continued
Family Species L, K M
Origin (cm) year1 year1
Malacanthidae
Megalopidae
Mugilidae
Mullidae
Pomacanthidae
Pomacentridae
Lutjanus synagris
Ocyurus chrysurus
Rhomboplites aurorubens
Malacanthus plumieri
Tarpon atlanticus
Mugil curema
Mulloidichthys martinicus
Pseudupeneus maculatus
Holacanthus ciliaris Holacanthus tricolor Pomacanthus arcuatus
Pomacanthus paru
Stegastes fuscus
Stegastes leucostictus
Stegastes planifrons
Stegastes variabilis
Cuba Florida Ceara Jamaica Southern Florida Jamaica Jamaica
Ceara Ceara
Jamaica Jamaica Jamaica Jamaica Jamaica Jamaica
Jamaica Jamaica Jamaica
42 FL 50 TL 50 75 TL 45 FL 60 FL 60 FL 69 TL 63
61 1
263.3 FLf 206.2 FLm
38 53
30 33 35 25 f 27 m 29
46 36 41 47 60 43
15 1
10
10.2 f 11.6 m 10 +
Pauly (1 978) Polovina and Ralston (1 987) Pauly (1 978) Munro (1983) Johnson and Attramadal(1983) Munro (1 983) Pauly (1980) Bannerot et al. (1987) Polovina and Ralston (1987)
Pauly (1978)
Ferreira de Menezes and Pinto Paiva (1 966) Ferreira de Menezes and Pinto Paiva (1 966)
Pauly (1978) Alvarez-Lajonchere (1 981 )
Nicholson and Hartsuijker (1982) Nicholson and Hartsuijker (1982) Munro (1 983) Munro (1 983) Munro (1 983) Nicholson and Hartsuijker (1983)
Pauly (1 986, Table 2; + for Holacanthus bemudensis) Pauly (1 986, Table 2; + for Holacanthus bemudensis) Nicholson and Hartsuijker (1 983) Pauly (1 978) Munro (1 983) Based on +' of Pomacanthus arcuatus
Meekan (1988); mortality of 24%lmonth for Pomacentrus sp. modified into an annual exponential rate
Meekan (1 988); mortality of 24%lmonth for Pomacentrus sp.
Pauly (1 981) Pauly (1 981) Meekan (1988); mortality of 24%lmonth for
Pomacentrus sp. modified into an annual exponential rate
continued ... 2
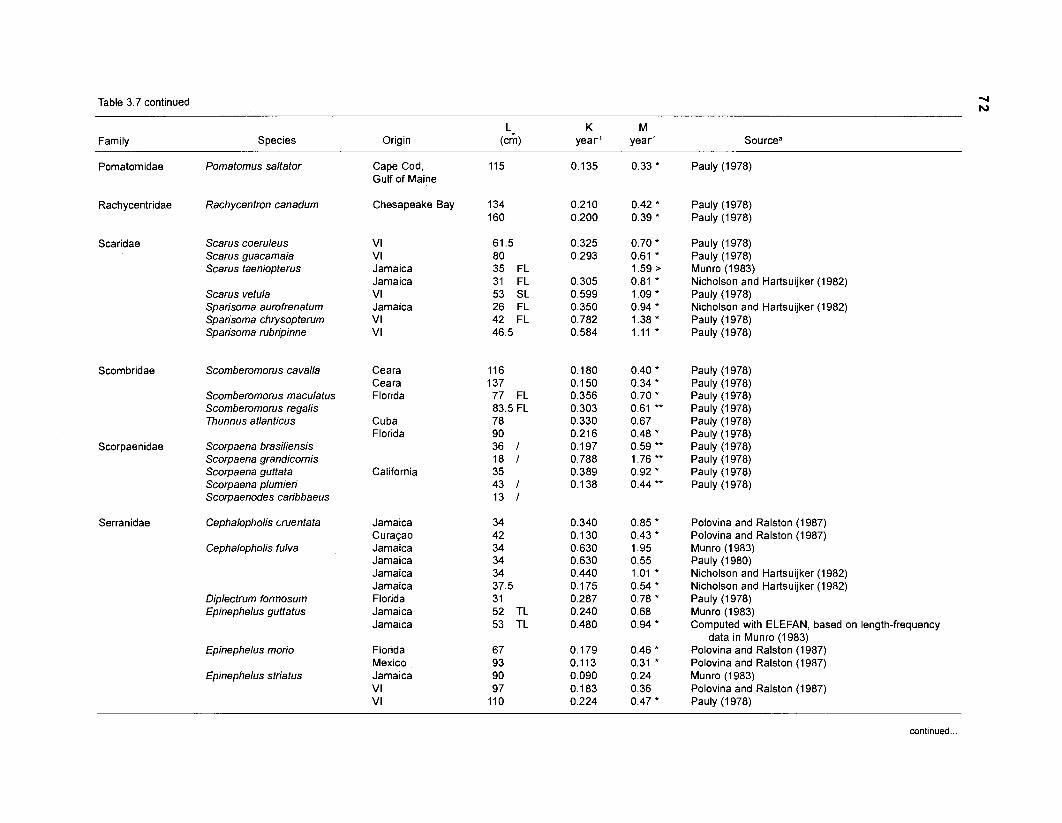
Table 3.7 continued -I h)
L, K M Family Species Origin (cm) year1 year1 Sourcea
Pomatomidae Pomatomus saltator Cape Cod, 115 Gulf of Maine
Rachycentridae Rachycentron canadum Chesapeake Bay 134 I60
Scaridae Scarus coeruleus VI Scarus guacamaia VI Scarus taeniopterus Jamaica
Jamaica Scarus vetula VI Sparisoma aurofrenatum Jamaica Sparisoma chrysopterum VI Sparisoma rubripinne VI
Scombridae
Scorpaenidae
Serranidae
Scomberomorus cavalla
Scomberomorus maculatus Scomberomorus regalis Thunnus atlanticus
Scorpaena brasiliensis Scorpaena grandicornis Scorpaena guttata Scorpaena plumieri Scorpaenodes caribbaeus
Ceara 116 Ceara 137 Florida 77 FL
83.5 FL Cuba 78 Florida 90
36 1 18 1
California 35 43 1 13 1
Cephalopholis cruentata Jamaica Cura~ao
Cephalopholis fulva Jamaica Jamaica Jamaica Jamaica
Diplectrum forrnosum Florida Epinephelus guttatus Jamaica
Jamaica
Epinephelus morio Florida 67 Mexico 93
Epinephelus striatus Jamaica 90 VI 97 VI 110
Pauly (1978)
Pauly (1978) Pauly (1978)
Pauly (1 978) Pauly (1 978) Munro (1983) Nicholson and Hartsuijker (1982) Pauly (1978) Nicholson and Hartsuijker (1982) Pauly (1978) Pauly (1978)
Pauly (1 978) Pauly (1 978) Pauly (1 978) Pauly (1 978) Pauly (1 978) Pauly (1 978) Pauly (1 978) Pauly (1 978) Pauly (1 978) Pauly (1 978)
Polovina and Ralston (1 987) Polovina and Ralston (1 987) Munro (1 983) Pauly (1 980) Nicholson and Hartsuijker (1982) Nicholson and Hartsuijker (1982) Pauly (1 978) Munro (1983) Computed with ELEFAN, based on length-frequency
data in Munro (1983) Polovina and Ralston (1987) Polovina and Ralston (1987) Munro (1 983) Polovina and Ralston (1987) Pauly (1 978)
continued ...
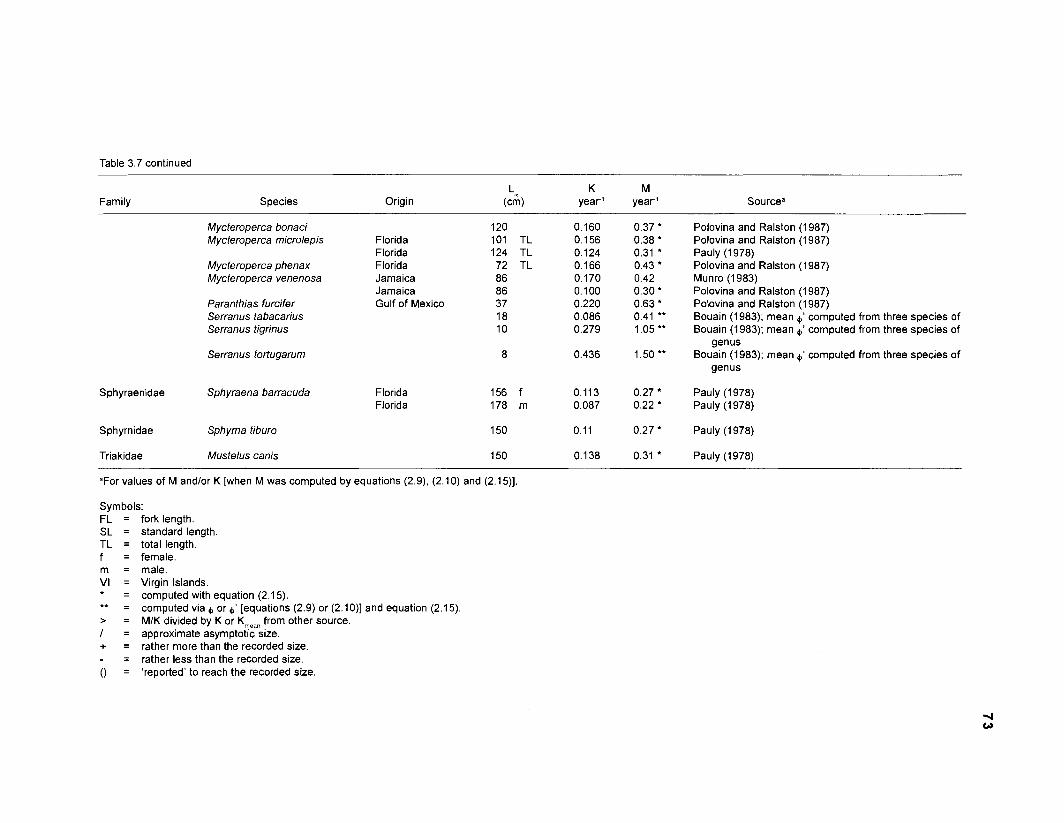
Table 3.7 continued
Family Species Origin
Mycteroperca bonaci Mycteroperca microlepis
Mycteroperca phenax Mycteroperca venenosa
Paranthias furcifer Serranus tabacarius Serranus tigrinus
Serranus tortugarum
Sphyraenidae Sphyraena barracuda
Sphyrnidae Sphyrna tiburo
Triakidae Mustelus canis
Florida Florida Florida Jamaica Jamaica Gulf of Mexico
Florida Florida
Polovina and Ralston (1 987) Polovina and Ralston (1987) Pauly (1 978) Polovina and Ralston (1987) Munro (1983) Polovina and Ralston (1 987) Polovina and Ralston (1 987) Bouain (1 983); mean 6' computed from three species of Bouain (1 983); mean 6' computed from three species of
genus Bouain (1983); mean 6' computed from three species of
genus
Pauly (1 978) Pauly (1 978)
Pauly (1 978)
Pauly (1 978)
"For values of M andlor K [when M was computed by equations (2.9), (2.10) and (2.15)].
Symbols: FL = fork length. SL = standard length. TL = total length. f = female. m = male. VI = Virgin Islands. * = computed with equation (2.15). ** = computed via 6 or 6' [equations (2.9) or (2.10)] and equation (2.15). > = MIK divided by K or Kmean from other source. I = approximate asymptotic size. + = rather more than the recorded size. - = rather less than the recorded size. () = 'reported' to reach the recorded size.
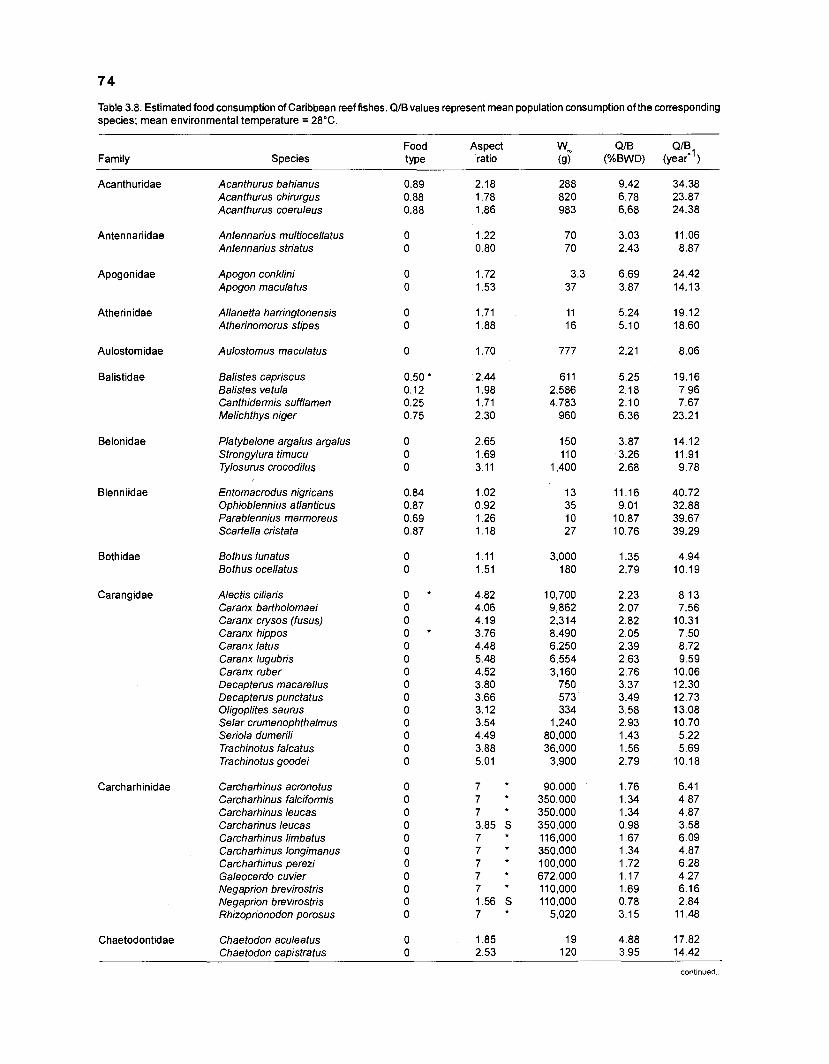
Table 3.8. Estimated food consumption of Caribbean reef fishes. Q/B values represent mean population consumption of the corresponding species; mean environmental temperature = 28°C.
Family Species Food Aspect wm QIB QIBl type ratio (g) (%BWD) (year- )
Acanthuridae
Antennariidae
Apogonidae
Atherinidae
Aulostomidae
Balistidae
Belonidae
Blenniidae
Bothidae
Carangidae
Carcharhinidae
Chaetodontidae
Acanthurus bahianus Acanthurus chirurgus Acanthurus coeruleus
Antennarius multiocellatus Antennarius striatus
Apogon conklini Apogon maculatus
Allanetta hamngtonensis Atherinomorus stipes
Aulostomus maculatus
Balistes capriscus Balistes vetula Canthidermis sufflamen Melichthys niger
Platybelone argalus argalus Strongylura timucu Tylosurus crocodilus
Entomacrodus nigricans Ophioblennius atlanticus Parablennius marmoreus Scartella cristata
Bothus lunatus Bothus ocellatus
Alectis ciliaris Caranx bartholomaei Caranx crysos (fusus) Caranx hippos Caranx latus Caranx lugubris Caranx ruber Decapterus macarellus Decapterus punctatus Oligoplites saurus Selar crumenophthalmus Seriola dumerili Trachinotus falcatus Trachinotus goodei
Carcharhinus acronotus Carcharhinus falciformis Carcharhinus leucas Carcharinus leucas Carcharhinus limbatus Carcharhinus longimanus Carcharhinus perezi Galeocerdo cuvier Negaprion brevirostris Negaprion brevirostris Rhizoprionodon porosus
Chaetodon aculeatus Chaetodon capistratus
continued ...
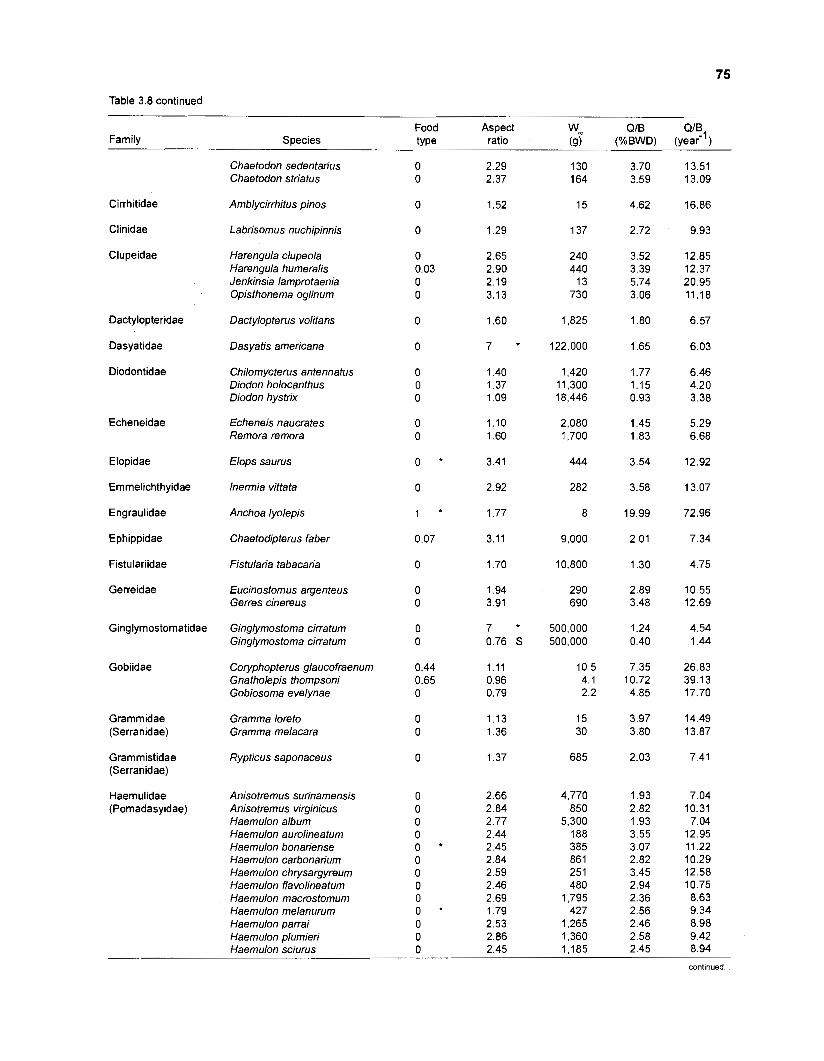
75
Table 3.8 continued
Food Aspect wm QIB Family Species type ratio (9) W W D )
Cirrhitidae
Clinidae
Clupeidae
Dactylopteridae
Dasyatidae
Diodontidae
Echeneidae
Elopidae
Emmelichthyidae
Engraulidae
Ephippidae
Fistulariidae
Gerreidae
Ginglymostomatidae
Gobiidae
Grammidae (Serranidae)
Grammistidae (Serranidae)
Haemulidae (Pomadasyidae)
Chaetodon sedentarius Chaetodon striatus
Amblycirrhitus pinos
Labrisomus nuchipinnis
Harengula clupeola Harengula humeralis Jenkinsia larnprotaenia Opisthonema oglinum
Dactylopterus volitans
Dasyatis americana
Chilornycterus antennatus Diodon holocanthus Diodon hystrix
Echeneis naucrates Remora remora
Elops saurus
lnemia vittata
Anchoa lyolepis
Chaetodipterus faber
Fistularia tabacaria
Eucinostomus argenteus Gerres cinereus
Ginglymostorna cirratum Ginglymostorna cirratum
Coryphopterus glaucofraenum Gnatholepis thompsoni Gobiosoma evelynae
Gramrna loreto Gramrna rnelacara
Rypticus saponaceus
Anisotrernus surinamensis Anisotremus virginicus Haemulon album Haemulon aurolineatum Haernulon bonariense Haemulon carbonarium Haernulon chrysargyreum Haernulon flavolineatum Haemulon rnacrostomum Haemulon melanurum Haemulon parrai Haemulon plumieri Haemulon sciurus
continued
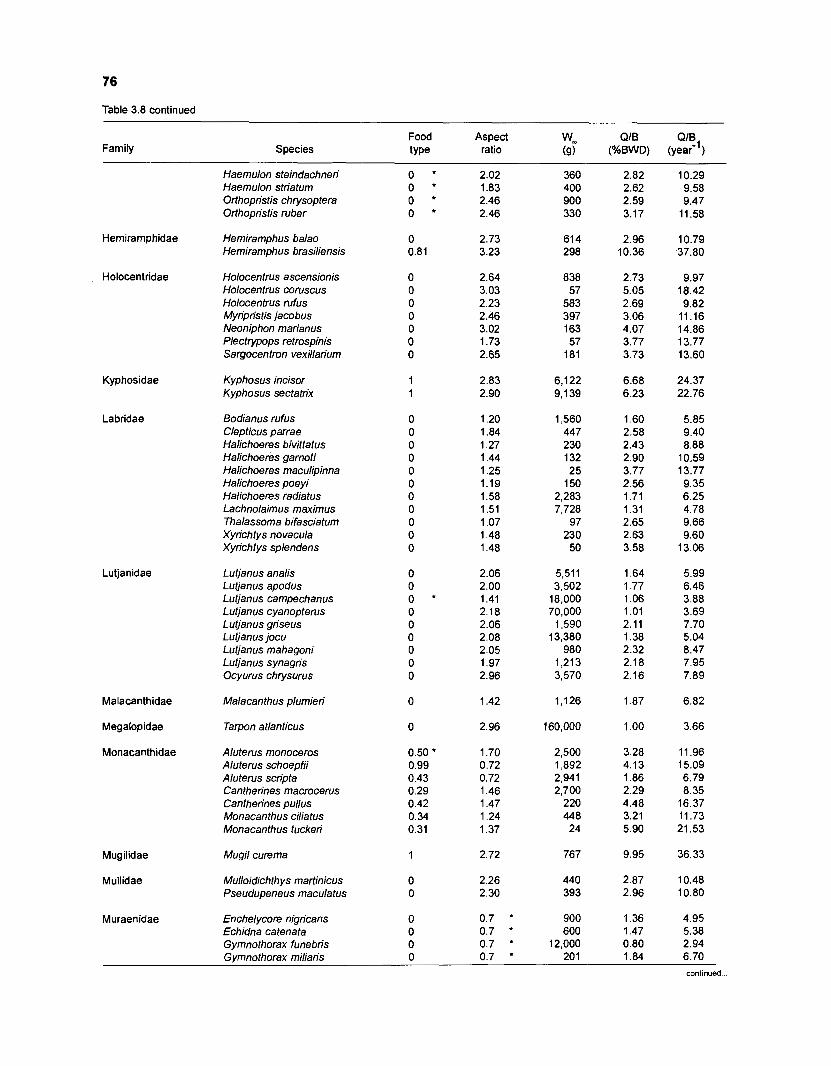
Table 3.8 continued
Food Aspect "'L QIB QIBl Family Species type ratio (g) (%BWD) (year- )
Hemiramphidae
Holocentridae
Kyphosidae
Labridae
Lutjanidae
Malacanthidae
Megalopidae
Monacanthidae
Mugilidae
Mullidae
Muraenidae
Haemulon steindachneri Haemulon striatum Orthopristis chrysoptera Orthopristis ruber
Hemiramphus balao Hemiramphus brasiliensis
Holocentrus ascensionis Holocentrus coruscus Holocentrus rufus Myripristis jacobus Neoniphon marianus Plectrypops retrospinis Sargocentron vexillarium
Kyphosus incisor Kyphosus sectatrix
Bodianus rufus Clepticus parrae Halichoeres bivittatus Halichoeres garnoti Halichoeres maculipinna Halichoeres poeyi Halichoeres radiatus Lachnolaimus maximus Thalassoma bifasciatum Xyrichtys novacula Xyrichtys splendens
Lutjanus analis Lutjanus apodus Lutjanus carnpechanus Lutjanus cyanopterus Lutjanusgriseus Lutjanus jocu Lutjanus rnahagoni Lutjanus synagris Ocyurus chrysurus
Malacanthus plumieri
Tarpon atlanticus
Aluterus monoceros Aluterus schoepfii Aluterus scripta Cantherines macrocerus Cantherines pullus Monacanthus ciliatus Monacanthus tucken'
Mugil curema
Mulloidichthys martinicus Pseudupeneus maculatus
Enchelycore nigricans Echidna catenata Gymnothorax funebris ~~mnothorax miliaris
continued ...
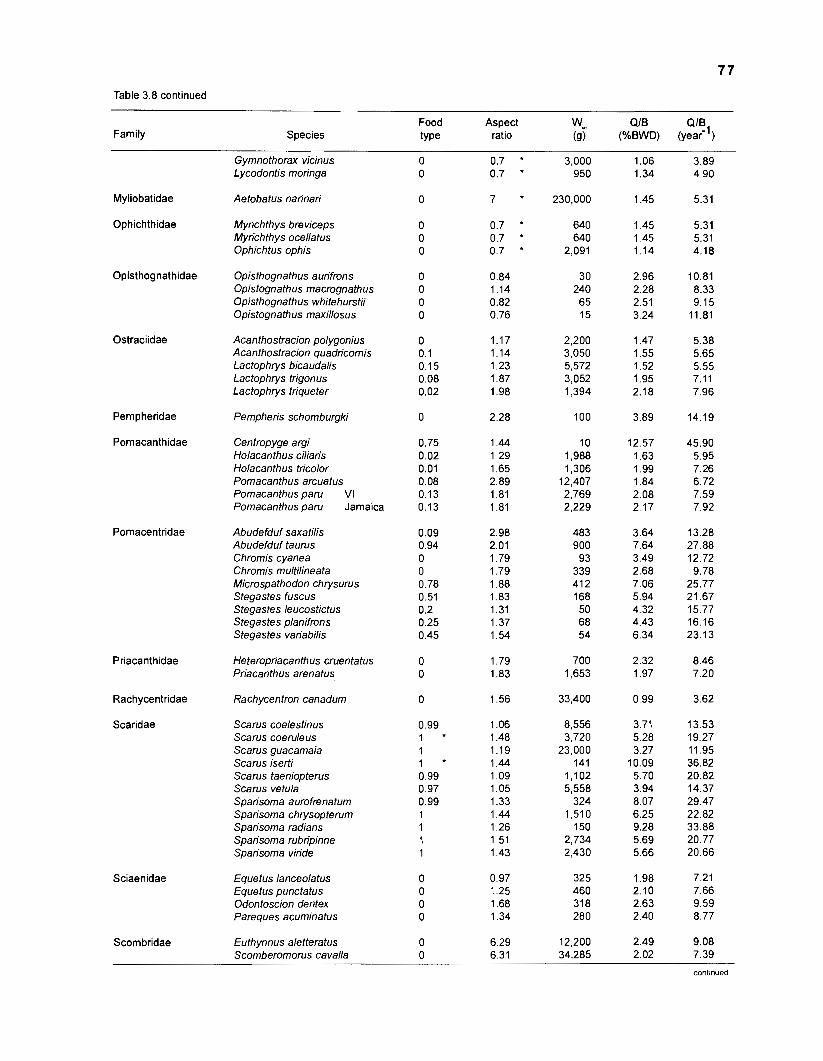
Table 3.8 continued
Food Aspect wm QIB QIBl Family Species type ratio (9) (%BWD) (year- )
Priacanthidae
Rachycentridae
Scaridae
Sciaenidae
Ostraciidae
Pornacentridae
Gymnothorax vicinus Lycodontis moringa
Myliobatidae Aetobatus narinari
Ophichthidae Myrichthys breviceps Myrichthys ocellatus Ophichtus ophis
Opisthognathidae Opisthognathus aurifrons Opistognathus macrognathus Opisthognathus whitehurstii Opistognathus maxillosus
Acanthostracion polygonius Acanthostracion quadricornis Lactophrys bicaudalis Lactophrys trigonus Lactophrys triqueter
Pernpheridae Pempheris schomburgki
Pomacanthidae Centropyge argi Holacanthus ciliaris Holacanthus tricolor Pomacanthus arcuatus Pomacanthus paru VI Pomacanthus paru Jamaica
Abudefduf saxatilis Abudefduf taurus Chromis cyanea Chromis multilineata Microspathodon chrysurus Stegastes fuscus Stegastes leucostictus Stegastes planifrons Stegastes variabilis
Heteropriacanthus cruentatus Priacanthus arenatus
Rachycentron canadum
Scarus coelestinus Scarus coeruleus Scarus guacamaia Scarus iserti Scarus taeniopterus Scarus vetula Sparisoma aurofrenatum Sparisoma chrysopterum Sparisoma radians Sparisoma rubripinne Sparisoma viride
Equetus lanceolatus Equetus punctatus Odontoscion dentex Pareques acuminatus
Scornbridae Euthynnus aletteratus Scomberomorus cavalla
continued ..
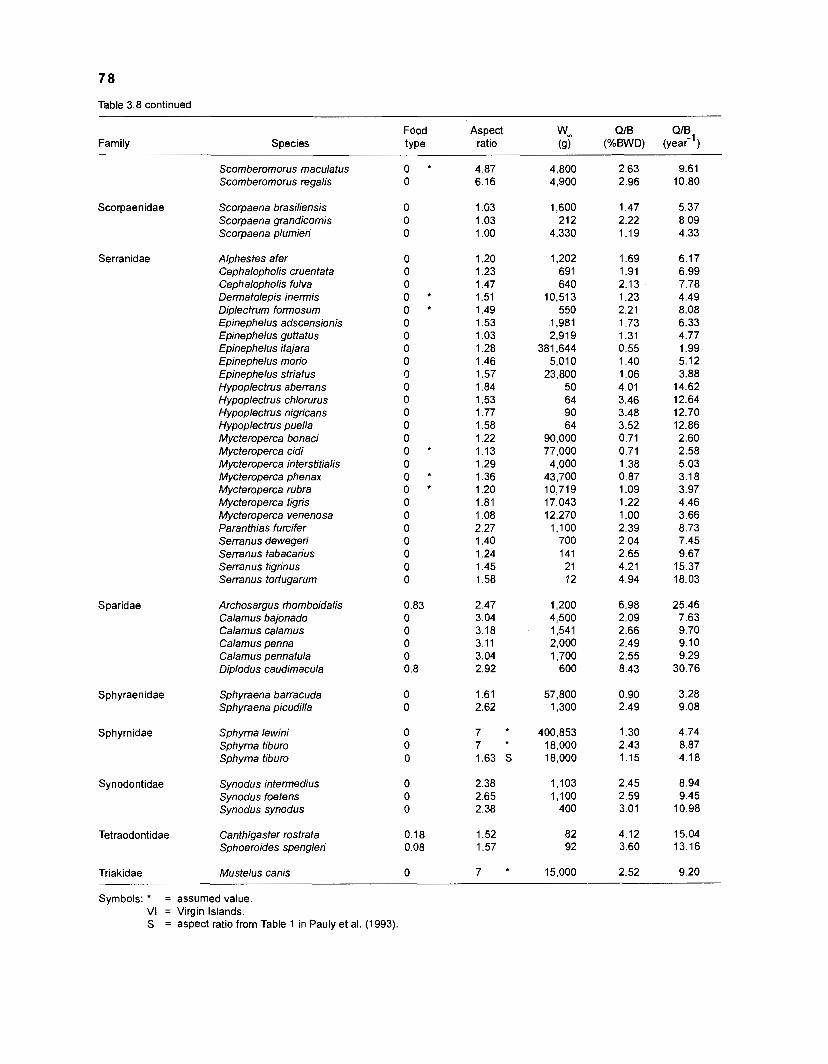
Table 3.8 continued
Family Species Food Aspect wm QIB QIBl type ratio (g) (%BWD) (year- )
Scorpaenidae
Serranidae
Scomberomorus maculatus Scomberomorus regalis
Scorpaena brasiliensis Scorpaena grandicornis Scorpaena plumieri
Alphestes afer Cephalopholis cruentata Cephalopholis fulva Dermatolepis inermis Diplectrum formosum Epinephelus adscensionis Epinephelus guttatus Epinephelus itajara Epinephelus morio Epinephelus striatus Hypoplectrus aberrans Hypoplectrus chlorurus Hypoplectrus nigricans Hypoplectrus puella Mycteroperca bonaci Mycteroperca cidi Mycteroperca interstitialis Mycteroperca phenax Mycteroperca rubra Mycteroperca tigris Mycteroperca venenosa Paranthias furcifer Serranus dewegeri Serranus tabacarius Serranus tigrinus Serranus tortugarum
Sparidae Archosargus rhomboidalis Calamus bajonado Calamus calamus Calamus penna Calamus pennatula Diplodus caudimacula
Sphyraenidae Sphyraena barracuda Sphyraena picudilla
Sphyrnidae Sphyrna lewini Sphyrna tiburo Sphyrna tiburo
Synodontidae Synodus intermedius Synodus foetens Synodussynodus
Tetraodontidae Canthigaster rostrata Sphoeroides spengleri
Triakidae Mustelus canis
Symbols: * = assumed value. VI = Virgin Islands. S = aspect ratio from Table 1 in Pauly et al. (1993).
3.2. Nonfish Taxa
3.2.1. Ecology, Fisheries and Management
Although I assumed a coral reef ecosystem without fishing activities, which was realistic when Randall investigated food habits of West Indian reef fishes in 1967, some information on fisheries and management were included here to give an idea of later developments.
Boulon (1986b) gave a short description of spatial occurrence of the three commercially most important invertebrates in the Virgin Islands Biosphere Reserve:
Adults of Strombus gigas, the queen conch, are found from grass and mud-bottom mangrove embayments out to deep (10 m+) algal plains. They are most often found in beds of seagrass (Thalassia testudinum, Syringodium filiforme, or a mixture of both), but are also found on sand flats. Juvenile conch are generally found in shallower water and in areas of less dense seagrass. Young conch may be restricted in their movements in thick beds of seagrass.
Cittarium pica, the West Indian topshell, is primarily found in rocky, coastal habitats, from slightly above the water level to several feet below. They appear to prefer coasts that are subject to at least some wave action. The smaller individuals tend to be found higher up in the habitat range of this species with larger, mature individuals being found in deeper (1-2 m) subtidal bedrock or upper fore-reef zones.
Panulirus argus, the spiny lobster, appears to be most abundant near reef-grassflat boundaries. Juveniles were found in mangroves and Thalassia habitats. In the reef habitat, lobsters are primarily found in dense grass beds (?) where they spend the daylight hours. At night, they forage for food either on the reef or on adjacent algal plains.
Mahon (1987) gave a summary on ecology, fisheries and management of "shared fishery resources of the Lesser Antilles region". The only invertebrates discussed therein are queen conch and spiny lobster; the former is stated to be "the second most valuable resource in the Caribbean as a whole", while "conch stocks throughout the Caribbean region are considered to be fully or overexploited".
In Puerto Rico, all conch production is consumed locally. The west coast dominates the fisheries with landings averaging 68.2 t during the early and mid-1 970s, and increasing to 189 t in 1982. Price per pound rose from US$0.5 in 1975 to USW.37 in 1984, with a total worth for the latter year of $628,350, thus, making conch one of the country's most commercially important species."
Inshore populations were noticeably reduced by the mid-1970s, when fishing pressure on deepwater areas increased. In the population off La Parguera, Puerto Rico, fishing mortality is estimated to be 68% (F = 0.4 year1). The conch fishery is classified as "overfished".
A directed, commercial conch fishery exists on St. Croix, US Virgin Islands. St. Thomas and St. John are less fished because conch occur deeper and farther from shore. In 1982,9.7 conch.ha-I and 1.58 * l o 6 individuals were estimated for St. ThomasISt. John, and 7.6 conch.ha-
and 0.26 * l o 6 individuals for St. Croix. Primary fishing grounds for conch in the US Virgin Islands are the west and northwest coasts of St. Croix and the south shelf on St. Thomas. The conch resources in the US Virgin Islands are classified as "overfished".
"All monetary figures are in US$, unless otherwise stated.
Queen conch are harvested primarily by free and scuba diving. The regulations that have been enacted or proposed to reduce fishing pressure include: a minimum size limit on shell length (e.g., 18 cm), shell diameter, lip thickness or meat weight (e.g., 225 g market weight), seasonal closures, total closures, prohibitions on the use of scuba and on export.
In Puerto Rico, total spiny lobster landings decreased from 133.58 t in 1983 to 11 2.62 t in 1985, and the market value decreased from $1.04 * to $0.92 * I 0-'j. For 1985-1 986, approximately 20% of lobsters sampled were less than 76 mm carapace length (CL) as compared to 16% for 1984-1985. Regulations include a minimum CL of 89 mm; no capture of berried females; prohibition on the use of spears, hooks and drugs, poisons or explosives; and the use of degradable panels on lobster traps.
In the US Virgin Islands, estimated domestic landings were 22.7 t in 1975; this rose to 74 t in 1979, but the 1982 estimate was 45.4 t. Only 50% of lobster catches are assumed to be reported, which hinders reliable determination of stock size. Depletion of spiny lobster stocks is indicated by declining average size and the necessity for fishers to travel longer distances to the fishing grounds. Regulations are the same as for Puerto Rico.
Indications on the commercial importance of other nonfish taxa, such as shrimps and turtles, were not found. lndications on their ecology, however, were found in general zoology textbooks and in the references assembled for construction of their diet composition matrix (see below).
3.2.2. Abundance and Mean Individual Weight
While assembling the ECOPATH II input parameters for nonfish taxa, a number of estimates of abundance and weight per individual could be identified (Table 3.9).
3.2.3. Biomass, P/B Ratio and Food Consumption
Table 3.10 shows the complete database of the three ECOPATH II key input parameters for the 41 nonfish taxa originating from stomach contents records of West Indian reef fishes (Randall 1967). Following is a brief description on the origin of every range or single value, in form of 135 numbered statement^":^
1. To assess total system net primary productivity (NPP), a selection of published values of coral reef gross and net PP was compiled from various sources (Table 3.11). Emphasis was put on information from the Caribbean Sea. Available values for distinct parts of the community were related to their corresponding subsystem(s) (mangrove, seagrass bed, sand flat, coral reef, algal plain). A mean NPP (in gCm-2year1) was computed for every subsystem and from these again a mean total system NPP of ca. 1,200 gCm-2year1 (= 20,000 gm-2year1WW, conversion: carbon = 6% of WW) was obtained. Compared to overall NPP for coral reefs worldwide (e.g., in Lewis 1981 and Hatcher 1990, see Table PP), the value obtained by the above-described procedure for a Virgin Islands reef system seemed high. This value, however, was strongly influenced by the high NPP estimates reported for parts of the algal community by Connor and Adey (1977) for the Virgin Islands. The uncertainty of the estimate of total system NPP is critical since this value is a direct measure of the carrying capacity of the system. The reliability of this parameter has a strong impact on the degree of similarity in terms of size (biomass) between the real system and the model.
bThe number corresponding to each statement may also be found in Table 3.10.
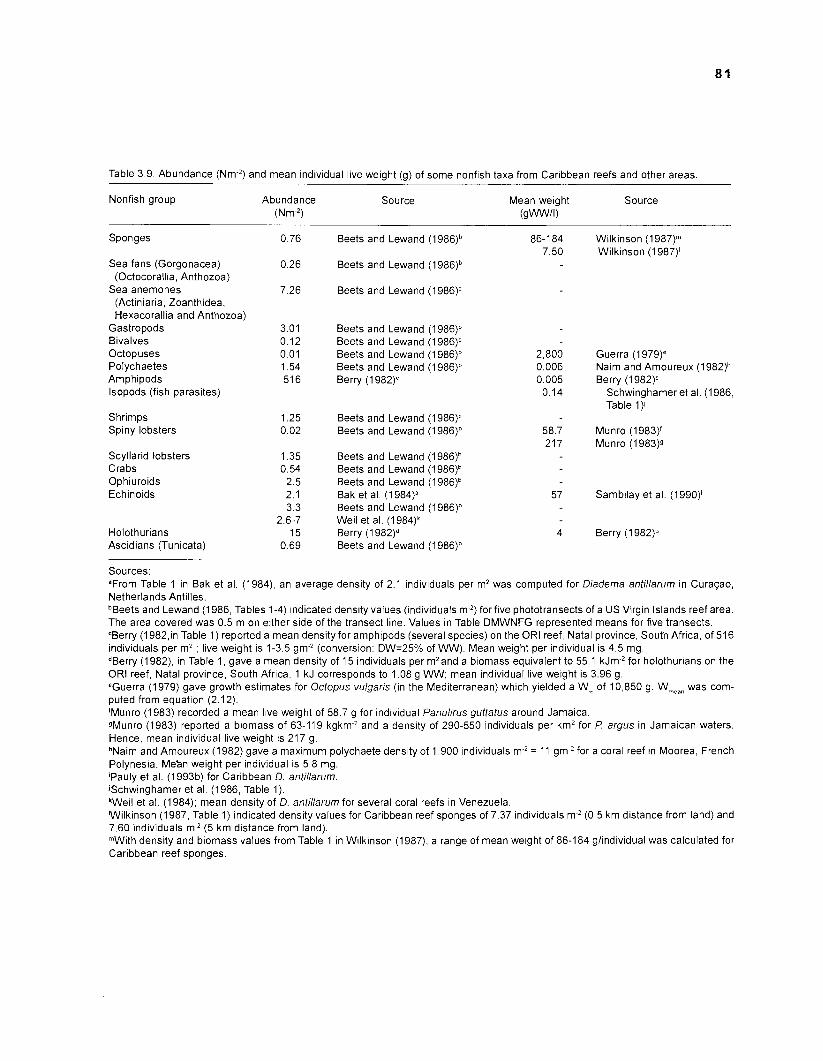
Table 3.9. Abundance (Nm-Z) and mean individual live weight (g) of some nonfish taxa from Caribbean reefs and other areas.
Nonfish group Abundance Source (Nm-2)
Mean weight Source ( g ~ / I )
Sponges
Sea fans (Gorgonacea) (Octocorallia, Anthozoa)
Sea anemones (Actiniaria, Zoanthidea, Hexacorallia and Anthozoa)
Gastropods Bivalves Octopuses Polychaetes Amphipods lsopods (fish parasites)
Shrimps Spiny lobsters
Scyllarid lobsters Crabs Ophiuroids Echinoids
Holothurians Ascidians (Tunicata)
Sources:
Beets and Lewand (1 986)b
Beets and Lewand (1986)b
Beets and Lewand (1986)b
Beets and Lewand (1986)b Beets and Lewand (1 986)b Beets and Lewand (1986)b Beets and Lewand (1 986)b Berry (1 982)"
Beets and Lewand (1986)b Beets and Lewand (1 986)b
Beets and Lewand (1986)b Beets and Lewand (1 986)b Beets and Lewand (1 986)b Bak et al. (1984)a Beets and Lewand (1 986)b Weil et al. (1984)k Berry (1 982)d Beets and Lewand (1 986)b
Wilkinson (1987)" Wilkinson (1 987)l
Guerra (1 979)" Naim and Amoureux ( I 982)h Berry (1 982)"
Schwinghamer et al. (1986, Table 1)'
Munro (1983)' Munro (1983)s
Sambilay et al. (1990)'
Berry (1 982)d
F r o m Table 1 in Bak et al. (1984), an average density of 2.1 individuals per mZ was computed for Diadema antillarum in Cura~ao, Netherlands Antilles. bBeets and Lewand (1986, Tables 1-4) mdicated density values (individuals m-2) for five phototransects of a US Virgin Islands reef area. The area covered was 0.5 m on either side of the transect line. Values in Table DMWNFG represented means for five transects. "Berry (1982,in Table 1) reported a mean density for amphipods (several species) on the OR1 reef, Natal province, South Africa, of 516 individuals per mZ ; live weight is 1-3.5 gm~2 (conversion: DW=25% of WW). Mean weight per individual is 4.5 mg. dBerry (1982), in Table 1, gave a mean density of 15 individuals per m2and a biomass equivalent to 55.1 kJm-2 for holothurians on the OR1 reef, Natal province, South Africa. 1 kJ corresponds to 1.08 g WW; mean individual live weight is 3.96 g. 'Guerra (1979) gave growth estimates for Octopus vulgaris (in the Mediterranean) which yielded a WI of 10,850 g. Wmean was com- puted from equation (2.12). 'Munro (1 983) recorded a mean h e weight of 58.7 g for individual Panulirus guttatus around Jamaica. gMunro (1983) reported a biomass of 63-119 kgkm2 and a density of 290-550 individuals per kmz for P argus in Jamaican waters. Hence, mean individual live weight is 217 g. hNaim and Amoureux (1982) gave a maximum polychaete density of 1,900 individuals m-2 = 11 gm~> for a coral reef in Moorea, French Polynesia. Me'an weight per individual is 5.8 mg. 'Pauly et al. (1993b) for Caribbean D. antillarum. ischwinghamer et al. (1986, Table 1). kWeil et al. (1 984); mean density of D. antillarum for several coral reefs in Venezuela. IWilkinson (1987, Table 1) indicated density values for Caribbean reef sponges of 7.37 individuals m-2 (0 5 km distance from land) and 7.60 individuals m-2 (5 km distance from land). "With density and biomass values from Table 1 in Wilkinson (1987), a range of mean weight of 86-184 glindividual was calculated for Caribbean reef sponges.
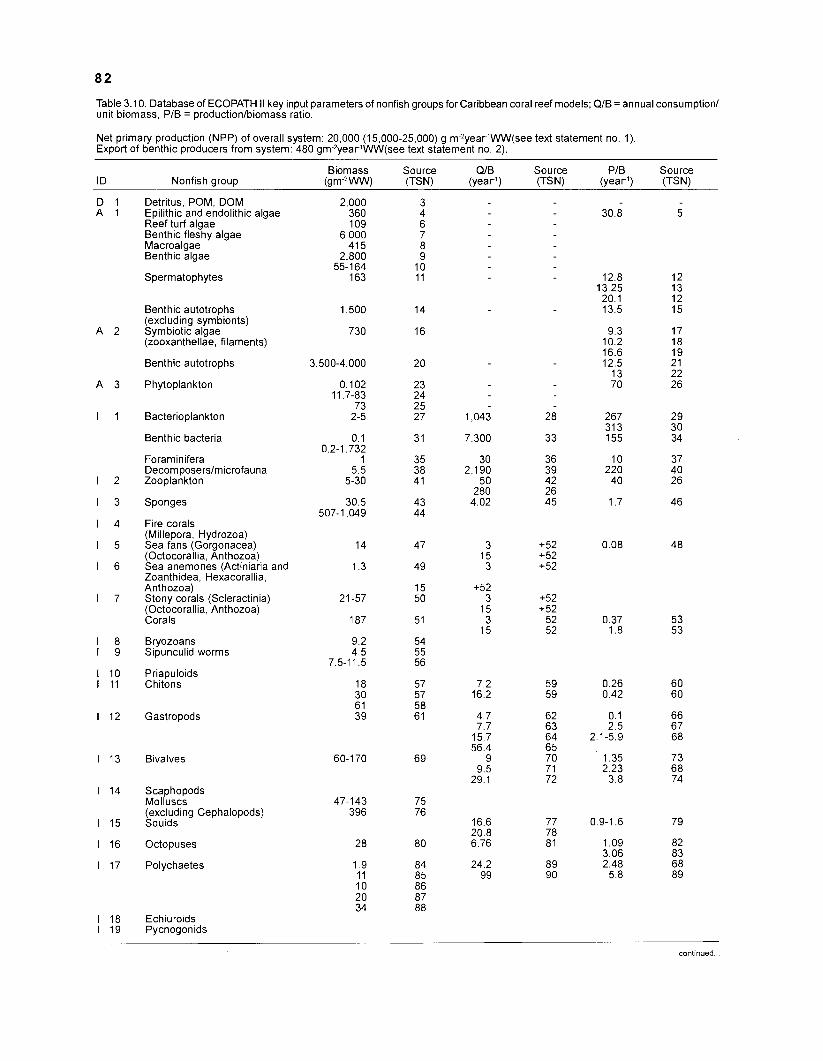
Table 3.1 0. Database of ECOPATH II key input parameters of nonfish groups for Caribbean coral reef models; QIB = annual consumption1 unit biomass, PIB = productionlbiomass ratio.
Net primary production (NPP) of overall system: 20,000 (15,000-25,000) g m-2year1WW(see text statement no. 1) Export of benthic producers from system: 480 gm-2year1WW(see text statement no. 2).
Biomass Source QIB Source PIB Source Nonfish group (gm-2WW) (TSN) (year1) (TSN) (year1) (TSN)
Detritus, POM, DOM Epilithic and endolithic algae Reef turf algae Benthic fleshy algae Macroalgae Benthic algae
Spermatophytes
Benthic autotrophs (excluding symbionts) Symbiotic algae (zooxanthellae, filaments)
Benthic autotrophs
Phytoplankton
Bacterioplankton
Benthic bacteria
Foraminifera Decomposerslmicrofauna Zooplankton
Sponges
Fire corals (Millepora, Hydrozoa) Sea fans (Gorgonacea) (Octocorallia, Anthozoa) Sea anemones (Actiniaria and Zoanthidea, Hexacorallia, Anthozoa) Stony corals (Scleractinia) (Octocorallia, Anthozoa) Corals
Bryozoans Sipunculid worms
Priapuloids Chitons
Gastropods
Bivalves
Scaphopods Molluscs (excluding Cephalopods) Squids
Octopuses
Polychaetes
Echiuroids Pycnogonids
continued
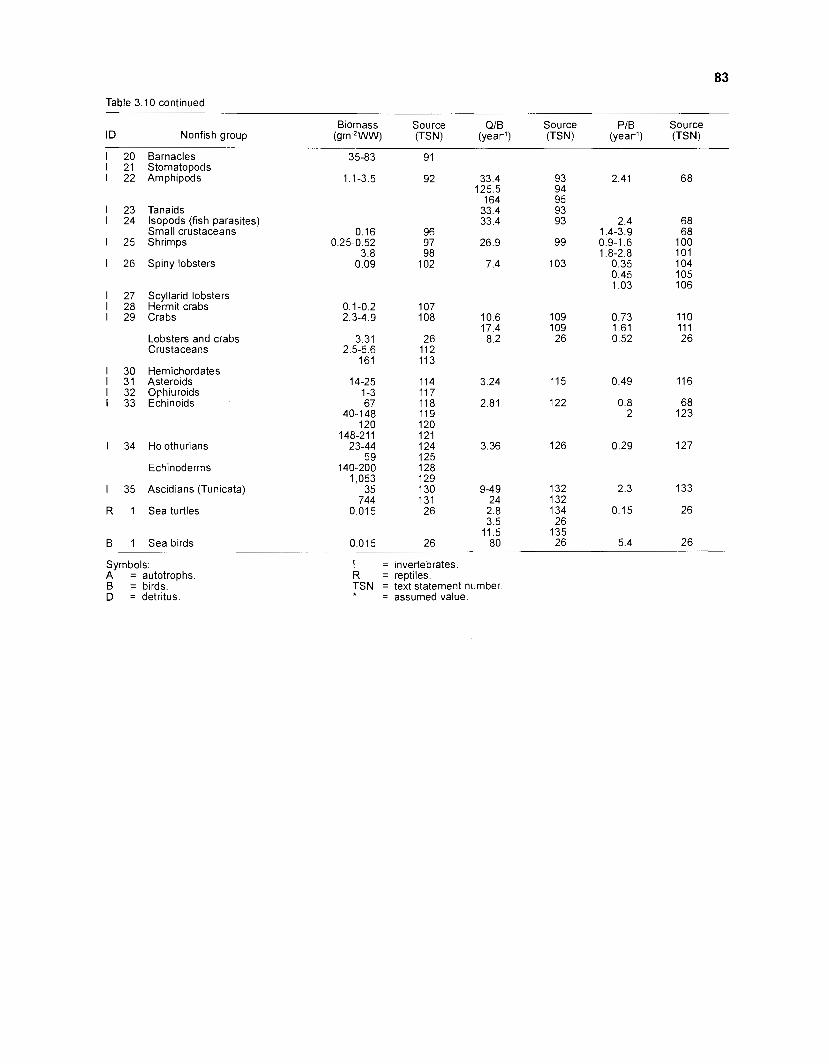
Table 3.10 continued
Biomass Source Q/B Source P/B Source ID Nonfish group (gm-Z'-"M4 (TSN) (year') (TSN) (year1) (TSN)
Barnacles Stomatopods Amphipods
Tanaids lsopods (fish parasites) Small crustaceans Shrimps
Spiny lobsters
Scyllarid lobsters Hermit crabs Crabs
Lobsters and crabs Crustaceans
Hemichordates Asteroids Ophiuroids Echinoids
Holothurians
Echinoderms
Ascidians (Tunicata)
Sea turtles
Sea b~rds
Symbols: A = autotrophs. B = birds. D = detritus.
I = invertebrates. R = reptiles. TSN = text statement number.
= assumed value.
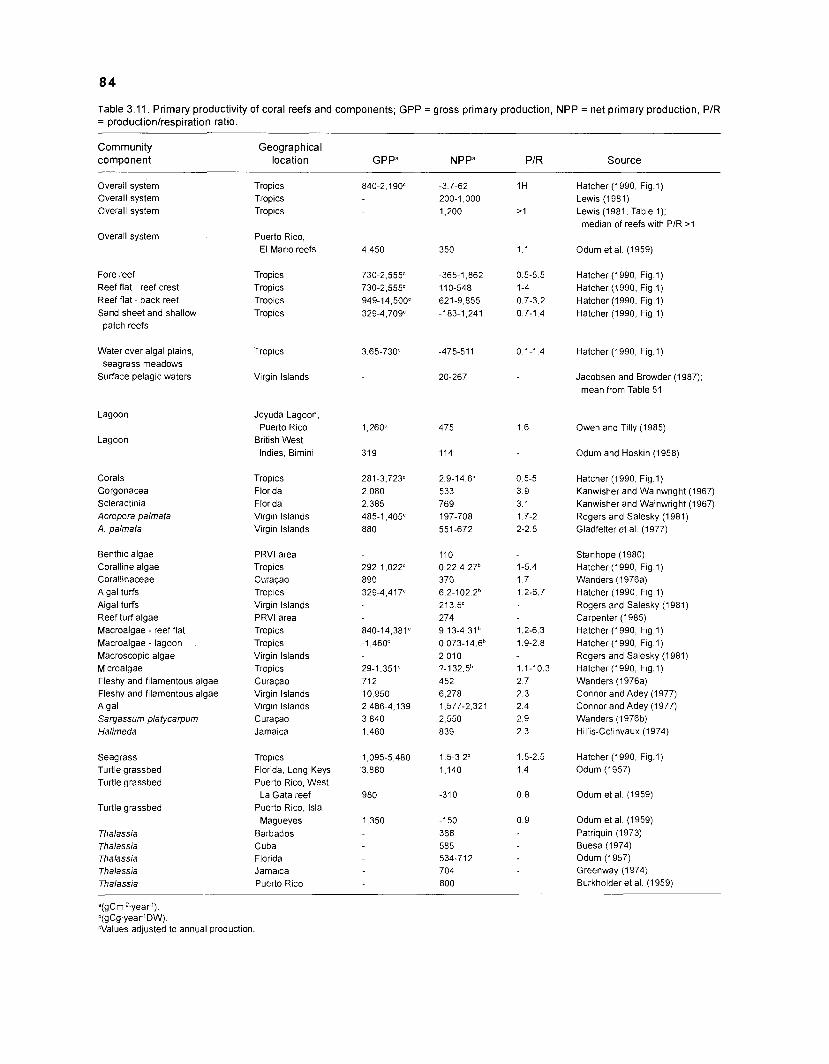
Table 3.11. Primary productivity of coral reefs and components; GPP = gross primary production, NPP = net primary production, P/R = productionlrespiration ratio.
Community component
Geographical location GPPa NPPa PIR Source
Overall system Overall system Overall system
Overall system
Fore reef Reef flat - reef crest Reef flat - back reef Sand sheet and shallow
patch reefs
Water over algal plains, seagrass meadows
Surface pelaglc waters
Lagoon
Lagoon
Corals Gorgonacea Scleractinia Acropora palmata A. palmata
Benthic algae Coralline algae Corallinaceae Algal turfs Algal turfs Reef turf algae Macroalgae - reef flat Macroalgae - lagoon Macroscopic algae Microalgae Fleshy and filamentous algae Fleshy and filamentous algae Algal Sargassum platycarpurn Halimeda
Seagrass Turtle grassbed Turtle grassbed
Turtle grassbed
Thalassia Thalassia Thalassia Thalassia Thalassia
Tropics Tropics Tro~ics
Puerto R~co, El Mario reefs
Tropics Tropics Tropics Tro~ics
Virgin lslands
Joyuda Lagoon, Puerto Rico
British West Indles, Bimini
Tropics Florida Florida Virgin lslands Virgin lslands
PRVI area Troplcs Cura~ao Tropics Vlrgm lslands PRVI area Tropics Tropics Virgln lslands Tropics Cura~ao Virgln lslands Vlrg~n lslands Cura~ao Jamaica
Tropics Florida, Long Keys Puerto Rico, West
La Gata reef Puerto Rlco, lsla
Magueyes Barbados Cuba Florida Jamaica Puerto Rico
Hatcher (1 990, Fig.1) Lewis (1981) Lewis (1981. Table 1); median of reefs with PIR > I
Odum et at. (1959)
Hatcher (1990, Fig.1) Hatcher (1990, Fig 1) Hatcher (1990. Fig 1) Hatcher (1990, Fig.1)
Hatcher (1990, Fig.1)
Jacobsen and Browder (1987); mean from Table 51
Owen and Tilly (1985)
Odum and Hoskin (1958)
Hatcher (1990, Fig.1) Kanwisher and Wainwright (1967) Kanwisher and Wainwright (1967) Rogers and Salesky (1981) Gladfelter et a1 (1977)
Stanhope (1 980) Hatcher (1990, F1g.1) Wanders (1976a) Hatcher (1990. F1g.1) Rogers and Salesky (1981) Carpenter (1985) Hatcher (1990, Fig.1) Hatcher (1990, Fig.1) Rogers and Salesky (1 981) Hatcher (1990, F1g.1) Wanders (1 976a) Connor and Adey (1977) Connor and Adey (1 977) Wanders ( I 976b) Hillis-Collnvaux (1 974)
Hatcher (1990, Fig.1) Odum (1957)
Odum et at. (1 959)
Odum et at. (1959) Patr~quin (1973) Buesa (1 974) Odum (1 957) Greenway (1974) Burkholder et at. (1959)
"gCm-2.year') b(gCg.yearlDW). Values adjusted to annual production
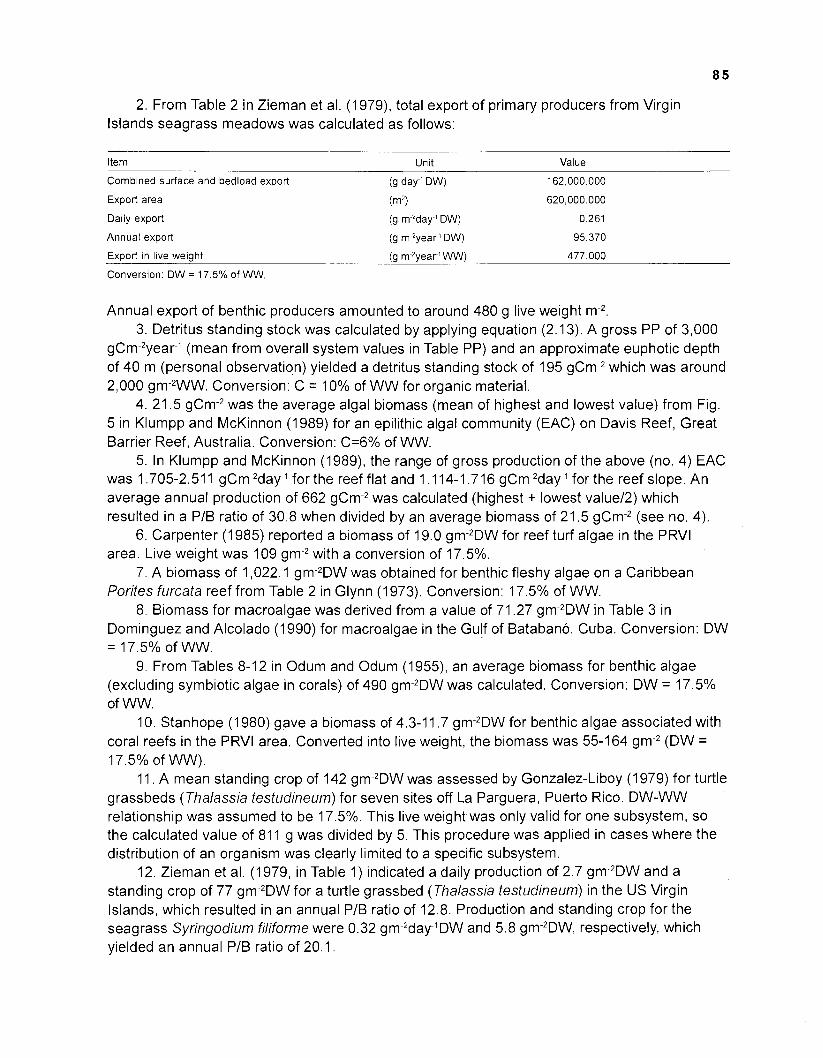
2. From Table 2 in Zieman et al. (1 979), total export of primary producers from Virgin Islands seagrass meadows was calculated as follows:
Item Unit Value
Combined surface and bedload export (g day-' DW) 162,000.000
Export area (m2) 620,000.000
Daily export (g m-Zday~l DW) 0.261
Annual export (g m~zyear' DW) 95.370
Export in live weight (g rrzyear1 WW) 477.000
Conversion: DW = 17.5% of WW.
Annual export of benthic producers amounted to around 480 g live weight m-2. 3. Detritus standing stock was calculated by applying equation (2.1 3). A gross PP of 3,000
gCm-2year1 (mean from overall system values in Table PP) and an approximate euphotic depth of 40 m (personal observatiqn) yielded a detritus standing stock of 195 gCm-2 which was around 2,000 gm-2WW. Conversion: C = 10% of W W for organic material.
4. 21.5 gCm-2 was the average algal biomass (mean of highest and lowest value) from Fig. 5 in Klumpp and McKinnon (1989) for an epilithic algal community (EAC) on Davis Reef, Great Barrier Reef, Australia. Conversion: C=6% of WW.
5. In Klumpp and McKinnon (1989), the range of gross production of the above (no. 4) EAC was 1.705-2.51 1 gCm-2day-' for the reef flat and 1.114-1.716 gCm-2day-1 for the reef slope. An average annual production of 662 gCm-2 was calculated (highest + lowest value12) which resulted in a PIB ratio of 30.8 when divided by an average biomass of 21.5 gCm-2 (see no. 4).
6. Carpenter (1 985) reported a biomass of 19.0 gm-2DW for reef turf algae in the PRVl area. Live weight was 109 gm-2 with a conversion of 17.5%.
7. A biomass of 1,022.1 gm-2DW was obtained for benthic fleshy algae on a Caribbean Porites furcata reef from Table 2 in Glynn (1 973). Conversion: 17.5% of WW.
8. Biomass for macroalgae was derived from a value of 71.27 gm-2DW in Table 3 in Dominguez and Alcolado (1 990) for macroalgae in the Gulf of Batabano, Cuba. Conversion: DW = 17.5% of WW.
9. From Tables 8-12 in Odum and Odum (1955), an average biomass for benthic algae (excluding symbiotic algae in corals) of 490 gm-2DW was calculated. Conversion: DW = 17.5% of WW.
10. Stanhope (1 980) gave a biomass of 4.3-1 1.7 gm-2DW for benthic algae associated with coral reefs in the PRVl area. Converted into live weight, the biomass was 55-164 gm-2 (DW = 17.5% of WW).
11. A mean standing crop of 142 gm-2DW was assessed by Gonzalez-Liboy (1 979) for turtle grassbeds (Thalassia testudineum) for seven sites off La Parguera, Puerto Rico. DW-WW relationship was assumed to be 17.5%. This live weight was only valid for one subsystem, so the calculated value of 811 g was divided by 5. This procedure was applied in cases where the distribution of an organism was clearly limited to a specific subsystem.
12. Zieman et al. (1979, in Table I ) indicated a daily production of 2.7 gm-2DW and a standing crop of 77 gm-2DW for a turtle grassbed (Thalassia testudineum) in the US Virgin Islands, which resulted in an annual PIB ratio of 12.8. Production and standing crop for the seagrass Syringodium filiforme were 0.32 gm-2day-1DW and 5.8 gm-2DW, respectively, which yielded an annual PIB ratio of 20.1.
13. A mean daily turnover (= PIB * 100) of 3.63% was assessed by Gonzalez-Liboy (1 979) for the above turtle grassbeds. Annual turnover (= PIB) was thus 13.25 (3.63 * 3.65).
14. A mean standing crop of 1,513 gm-2WW for benthic autotrophs, excluding symbiotic algae (zooxanthellae and filamentous algae), was estimated from biomass values of different components described in nos. 4, 6, 7, 8, 9, 10 and 11.
15. A weighted (by biomass) mean annual PIB ratio of 13.5 for benthic autotrophs was estimated from nos. 5, 12 and 13, and an assumed annual P/B ratio of 12.5 for benthic algae, benthic fleshy algae and macroalgae (see no. 21).
16. From Table 4 in Odum and Odum (1955), an average dry weight for symbiotic algae (zooxanthellae and filaments) of 0.063 g ~ m - ~ was obtained. Conversion DW-WW was 17.5%. Since the calculated live weight of 3,600 gm-* was only valid for the reef zone, and few or no corals grow in the other subsystems included in the model, the value was divided by 5. The resulting biomass of 720 S ~ - ~ W W was increased to 730 gm-2WW to account for zooxanthellae biomass in foraminiferans (see no. 35).
17. A PP for corals of 281-3,723 gCm-2year1 was read off Fig. 1 in Hatcher (1990). A mean production of 33,366 gm-2year1WW (conversion: C = 6% of WW) and a biomass of 3,600 gm- 2WW for symbionts resulted in an annual PIB of 9.3.
18. From Kanwisher and Wainwright (1967), an average gross primary productivity of 2,200 gCm-2year1 was obtained for Gorgonacea (sea fans) and Scleractinia (stony corals). Applying a conversion of C = 6% of WW and a symbiont biomass of 3,600 gm-2WW, the resulting PIB ratio was 10.2 year1.
19. Production of zooxanthellae was indicated with 10 kcalm-2day-1 in Fig. 2 in Sorokin (1 987) which is 3,650 gm-2year1WW. When zooxanthellae biomass is around 220 S ~ - ~ W W (Odum and Odum 1955, Table 4; conversion DW = 17.5% of WW), annual PIB is 16.6.
20. Odum and Odum (1955) estimated a mean standing stock of benthic producers of 703 S ~ - ~ D W with a low standard deviation, i.e., the biomass seemed to be evenly distributed over the reef regardless of species composition. A conversion of DW = 17.5% WW resulted in a live weight biomass of ca. 3,500-4,000 gm-2 for benthic autotrophs.
21. Odum and Odum (1955) indicated an annual ratio of 12.5 for gross PP to standing stock of benthic autotrophs for the Eniwetok atoll reef.
22. Weighted (by biomass) mean annual PIB ratio for benthic autotrophs and symbiotic algae was 13.0.
23. Chlorophyll-a concentrations per depth range of pelagic waters in Great Cruz Bay, St. John, Virgin Islands, were given in Table 52 in Jacobsen and Browder (1987). The median was 0.37 mgChl.-am-2. A conversion factor of Chl.-a to phytoplankton carbon of 6% was determined from Table 1 and Fig. 5 in Knoppers and Opitz (1984). Assuming a conversion of 6% for carbon: WW resulted in a biomass of 0.102 gm-2WW for phytoplankton.
24. Margalef (1 971) gave a phytoplankton biomass range of 0.7-5.0 g Cm-2 for the northeastern Caribbean. This, transformed into wet weight, yielded a range of 11.7-83 g (Carbon = 6% of WW).
25. Jones (1963) indicated a phytoplankton production of 307 gCm-2 year1 = 5,117 gm-2 yearlWW (conversion C = 6% of WW) for a Florida patch reef. Assuming a P/B ratio of 70 (Polovina 1984b) yielded a biomass of 73 gm-2WW.
26. All estimates with this source number in Table 3.10 were adopted from Polovina (1 984b).
27. Sorokin (1987) reported 0.2-0.5 gm-3 as range for bacterioplankton biomass. An assumed mean water depth of 10 m resulted in a value of 2-5 gm-2 bacterioplankton standing stock.
28. A daily consumption of 10 k c a h 2 was read off Fig. 2 in Sorokin (1987) for bacterioplankton. A conversion of 1 kcal = 1 g live weight and a biomass of 2-5 gm-2 yielded a daily consumption of 286% of body weight (% BWdayl) and an annual QIB of 1,043.
29. Lewis (1 981, Table 3b) presented values for production and biomass of bacteria in the water column above various coral reefs. From these values, a mean annual PIB ratio of 267 can be calculated.
30. Production of bacterioplankton was 3 kcalm-2day-1 in Fig. 2 in Sorokin (1987). Divided by a biomass of 3.5 gm-2, this resulted in an annual P/B ratio of 313 (1 kcal = 1 gWW).
31. Odum and Odum (1955) calculated a biomass of 0.1 gm-* for bacteria on reef substrates.
32. Sorokin (1987) gave a biomass range of 0.2-1.7 gm-2 for benthic bacteria as an average for coral reefs.
33. Sorokin (1987), in Fig. 2, gave a ration of 20 kcalm-2day-1 = 20 gm-2WW for demersal microflora on coral reefs. Based on an average biomass of 1 gm-2 (0.2-1.7 gm-2, no. 32), the annual consumption was 7,300 *BW.
34. From Table 3a in Lewis (1981), a mean annual PIB ratio of 155 was calculated for bacteria in coral sediments.
35. A value for organic tissue of foraminiferans was obtained as follows: a. 31.4 g was the mean foraminiferan biomass of a four-year sampling period in the Gulf of Batabano, Cuba (based on Table 4 in Gomez et al. 1980). b. Odum and Odum (1955, Table 12) reported an ash-free DW of 48 gm-2 for foraminifera and an AFDW:WW conversion of 86.5% for this component of the decomposers on the Eniwetok reef atoll, South Pacific. Thus foraminiferan wet weight was 55.5 gm-2. c. From Table 2 in Glynn (1973), a biomass of 135.6 gm-2DW was obtained for foraminiferans on a Caribbean P furcata reef. A conversion of 86.5% (Odum and Odum 1955) yielded a live weight of 157 gm-2. d. A mean foraminiferan biomass of 81 gm-2WW was computed from a, b and c. Odum and Odum (1 955) gave a loss on ignition for foraminiferans of 13.5% per individual. Organic tissue of foraminiferans is assumed to approximately represent the difference between dry weight and wet weight, so that the main component of dry biomass consists of the calcareous skeleton. Like coral polyps, foraminiferans, in Caribbean coral reefs, cover their metabolic requirements largely through the activity of symbiotic microalgae (zooxanthellae). These autotroph organisms are assumed to represent 80-90% of the organic tissue of foraminiferans (Prof. Rijttger, Department of Microbiology, University Kiel, pers. comm.). Hence, isolated organic tissue of foraminiferans was reduced to 1 gm-2WW.
36. Annual PIB ratio of foraminiferans (no. 37) is about ten times the PIB ratio of corals. Their functioning as an ecological unit resembles that of corals: both have a calcareous skeleton and symbiotic zooxanthellae which supply a considerable part of the ration - ca. 40% of photosynthesis C,, is transferred to the animal (Drits et al. 1987). Considering the much smaller size of foraminiferans and therefore a higher metabolism, I assumed their QIB to be at least ten times that of corals. Hence, annual consumption should not be < 30 *BW.
37. Hallock (1 981) reported carbonate turnover rates for foraminiferans of 11 -1 6 times per year for Palau, Western Caroline Islands and of 7-11 times for Hawaii due to slower growth rates and the absence of the family Calcarinidae. Species composition of Caribbean reef foraminiferans was not known; an average annual PIB ratio of 10 was assumed.
38. Sum of foraminifera (1 gm-2), benthic bacteria (0.9 gm-2) and bacterioplankton (3.5 gm-2) 39. Consumption, computed via the combined daily ration of 30 kcalm-2day1, for
bacterioplankton and demersal decomposers (Fig. 2 in Sorokin 1987) was 556% * 3.65 = 2,028* year2BW based on a wet biomass of 5.4 gm-2 and a conversion of 1 kcal = 1 gWW.
40. Mean weighted (by biomass) annual PIB ratio for microfauna (bacterioplankton, benthic microflora and foraminifera) was 220.
41. Sorokin (1987) reported a range of 0.5-3 gm-3 for zooplankton biomass on coral reefs; based on an assumed average water depth of 10 m, the biomass was thus 5-30 gm-2.
42. Sorokin (1987) in Fig. 2 gave a consumption of 2.5 kcah2day1 for reef zooplankton. For an average biomass of 18 gm-2, daily consumption was 13.9% BW and annual Q/B was 50.1.
43. Glynn (1973, in Table 2) reported a sponge biomass of 11.8 gm-2DW for a P furcafa reef in the Caribbean. A conversion of DW = 30% of WW yielded a wet biomass for sponges of 39.3 gm-2. A 22.5% wet mass was subtracted for inorganic skeletal material (D. Barthel, IfM, Kiel, pers. comm.). The organic weight was 30.5 gm-2.
44. Wilkinson (1 987, in Table I ) gave a biomass value of 1,353.8 gm-2WW (0.5 km distance from land) and 654.2 gm-2 (5 km distance from land) for sponge populations around St. Croix, US Virgin Islands. Subtracting 22.5% for inorganic skeletal material yielded a range of organic wet weight of 507-1,049 gm-2.
45. Wilkinson (1 987) reported a consumption of 0.084 gCm-2day-1 for a Great Barrier Reef sponge biomass of 98.3 gm-2WW = 76.2 gm-2 of organic wet weight. A conversion of carbon to live weight of 10% yielded a daily sponge consumption of 1 .I % BW. Thus, sponges consumed 4.02 times their body weight per year. This value might underestimate consumption of Caribbean sponge populations. Sponges in the Pacific show a much higher infestation with autotrophic symbionts (Cyanophyceae) than species in the tropical Atlantic; metabolites of these symbionts are consumed directly by the sponge host, as those of symbiotic zooxanthellae by the coral polyp (see Wilkinson 1987).
46. Weight-at-age data for the Caribbean sponge Pseudocerafina crassa were read off Fig. 1 in Wilkinson and Cheshire (1 988). The slope of a semilogarithmic plot from these data yielded an annual production rate of 2.97, indicating that an individual would treble its initial biomass in one year. When assuming a low natural mortality of 10% year1 and exponential growth, an annual PIB ratio of 1.7 can be obtained as a crude preliminary estimate.
47. A biomass value of 16.52 gm-2DW was adopted from Table 12 in Alcolado (1990) for calculating a gorgonian standing stock. Dry weight was converted to live weight (22.5%) and yielded 73.4 gm-2. From this value, 5% was subtracted for zooxanthellae biomass (see Table 4 in Odum and Odum 1955). The resulting animal biomass was divided by 5 to account for its occurrence in only one subsystem.
48. Yoshioka and Yoshioka (1 990) reported an average annual survival rate of 92% for gorgonians at La Parguera, Puerto Rico. From this value, an exponential rate of total mortality Z = M = 0.08 year1 can be computed. This corresponds to an estimate of PIB (see Allen 1971).
49. Glynn (1 973) in Table 2 gave a biomass of 1 .I gm-*DW for zoanthids on a Caribbean P furcafa reef. With a conversion of DW = 17% of WW, the live biomass was 6.5 gm-2. Divided by 5 to account for the subsystems' effect led to a live weight of sea anemones of 1.3 gm-2.
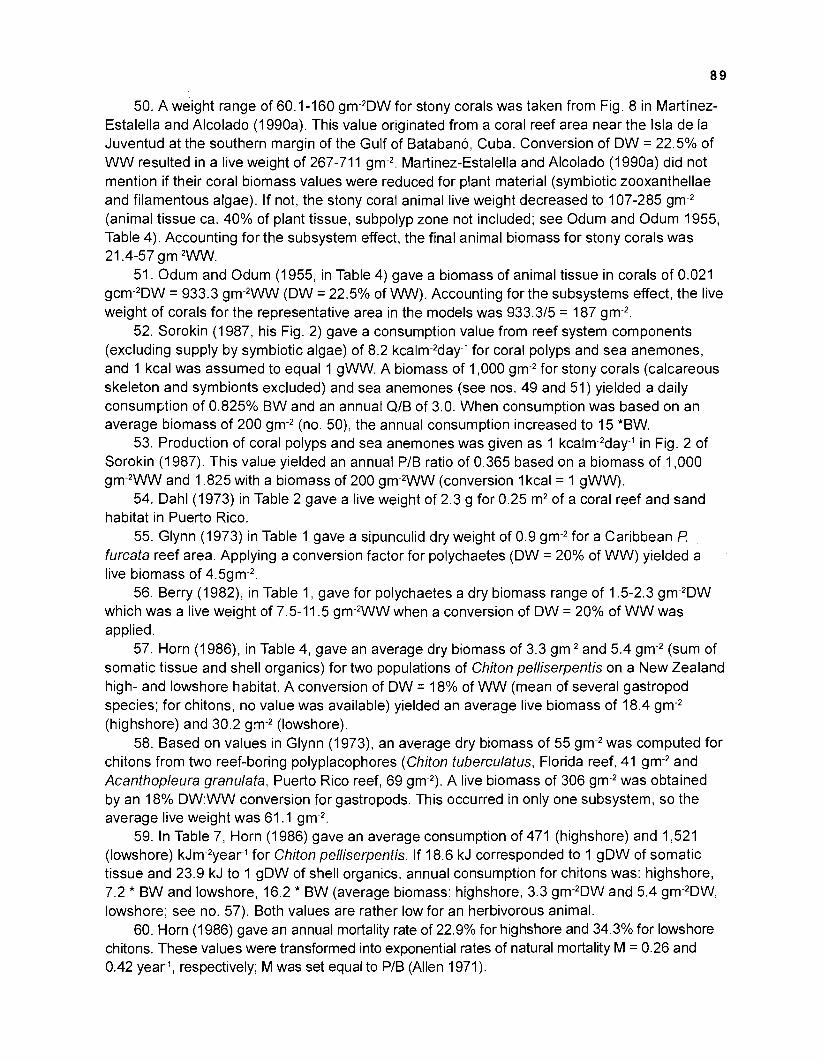
50. A weight range of 60.1-1 60 gm-2DW for stony corals was taken from Fig. 8 in Martinez- Estalella and Alcolado (1990a). This value originated from a coral reef area near the lsla de la Juventud at the southern margin of the Gulf of Batabano, Cuba. Conversion of DW = 22.5% of WW resulted in a live weight of 267-711 gm-2. Martinez-Estalella and Alcolado (1990a) did not mention if their coral biomass values were reduced for plant material (symbiotic zooxanthellae and filamentous algae). If not, the stony coral animal live weight decreased to 107-285 gm-2 (animal tissue ca. 40% of plant tissue, subpolyp zone not included; see Odum and Odum 1955, Table 4). Accounting for the subsystem effect, the final animal biomass for stony corals was 21.4-57 gm-2WW.
51. Odum and Odum (1955, in Table 4) gave a biomass of animal tissue in corals of 0.021 g ~ m - ~ D w = 933.3 gm-2WW (DW = 22.5% of WW). Accounting for the subsystems effect, the live weight of corals for the representative area in the models was 933.315 = 187 gm-2.
52. Sorokin (1987, his Fig. 2) gave a consumption value from reef system components (excluding supply by symbiotic algae) of 8.2 kcalm-2day-1 for coral polyps and sea anemones, and 1 kcal was assumed to equal 1 gWW. A biomass of 1,000 gm-2 for stony corals (calcareous skeleton and symbionts excluded) and sea anemones (see nos. 49 and 51) yielded a daily consumption of 0.825% BW and an annual QIB of 3.0. When consumption was based on an average biomass of 200 gm-2 (no. 50), the annual consumption mcreased to 15 *BW.
53. Production of coral polyps and sea anemones was given as 1 kcalm-2day-1 in Fig. 2 of Sorokin (1 987). This value yielded an annual PIB ratio of 0.365 based on a biomass of 1,000 gm-2WW and 1.825 with a biomass of 200 gm-2WW (conversion I kcal = 1 gWW).
54. Dahl (1973) in Table 2 gave a live weight of 2.3 g for 0.25 m2 of a coral reef and sand habitat in Puerto Rico.
55. Glynn (1973) in Table 1 gave a slpunculid dry weight of 0.9 gm-2 for a Caribbean /? furcata reef area. Applying a conversion factor for polychaetes (DW = 20% of WW) yielded a live biomass of 4.5gm-2.
56. Berry (1982), in Table I , gave for polychaetes a dry biomass range of 1.5-2.3 gm-2DW which was a live weight of 7.5-11.5 gm-2WW when a conversion of DW = 20% of WW was applied.
57. Horn (1 986), in Table 4, gave an average dry biomass of 3.3 gm-2 and 5.4 gm-2 (sum of somatic tissue and shell organics) for two populations of Chiton pelliserpentis on a New Zealand high- and lowshore habitat. A conversion of DW = 18% of WW (mean of several gastropod species; for chitons, no value was available) yielded an average live biomass of 18.4 gm-2 (highshore) and 30.2 grm2 (lowshore).
58. Based on values in Glynn (1973), an average dry biomass of 55 gm-2 was computed for chitons from two reef-boring polyplacophores (Chiton tuberculatus, Florida reef, 41 gm-2 and Acanthopleura granulata, Puerto Rico reef, 69 gm-*). A live biomass of 306 gm-2 was obtained by an 18% DW:WW conversion for gastropods. This occurred in only one subsystem, so the average live weight was 61 .I gm-2.
59. In Table 7, Horn (1 986) gave an average consumption of 471 (highshore) and 1,521 (lowshore) kJm-2year1 for Chiton pelliserpentis. If 18.6 kJ corresponded to 1 gDW of somatic tissue and 23.9 kJ to 1 gDW of shell organics, annual consumption for chitons was: highshore, 7.2 * BW and lowshore, 16.2 * BW (average biomass: highshore, 3.3 gm-2DW and 5.4 gm-2DW, lowshore; see no. 57). Both values are rather low for an herbivorous animal.
60. Horn (1986) gave an annual mortality rate of 22.9% for highshore and 34.3% for lowshore chitons. These values were transformed into exponential rates of natural mortality M = 0.26 and 0.42 year1, respectively; M was set equal to PIB (Allen 1971).
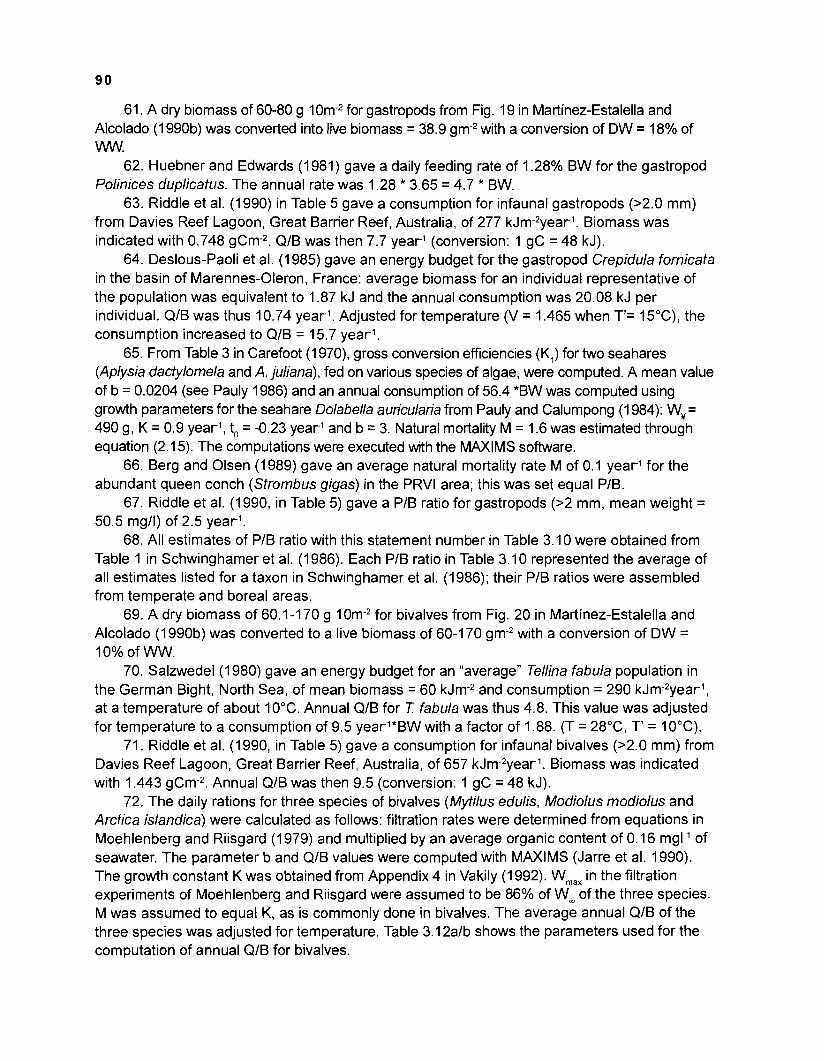
61. A dry biomass of 60-80 g for gastropods from Fig. 19 in Martinez-Estalella and Alcolado (1 990b) was converted into live biomass = 38.9 gm-2 with a conversion of DW = 18% of WW.
62. Huebner and Edwards (1981) gave a daily feeding rate of 1.28% BW for the gastropod Polinices duplicatus. The annual rate was 1.28 * 3.65 = 4.7 * BW.
63. Riddle et al. (1990) in Table 5 gave a consumption for infaunal gastropods (>2.0 mm) from Davies Reef Lagoon, Great Barrier Reef, Australia, of 277 kJm-2year1. Biomass was indicated with 0.748 gCm-2. QIB was then 7.7 year1 (conversion: 1 gC = 48 kJ).
64. Deslous-Paoli et al. (1 985) gave an energy budget for the gastropod Crepidula fornicata in the basin of Marennes-Oleron, France: average biomass for an individual representative of the population was equivalent to 1.87 kJ and the annual consumption was 20.08 kJ per individual. QIB was thus 10.74 year1. Adjusted for temperature (V = 1.465 when T'= 15"C), the consumption increased to QIB = 15.7 year1.
65. From Table 3 in Carefoot (1 970), gross conversion efficiencies (K,) for two seahares (Aplysia dactylomela and A. juliana), fed on various species of algae, were computed. A mean value of b = 0.0204 (see Pauly 1986) and an annual consumption of 56.4 *BW was computed using growth parameters for the seahare Dolabella auricularia from Pauly and Calumpong (1 984): W, = 490 g, K = 0.9 year1, to = -0.23 year1 and b = 3. Natural mortality M = I .6 was estimated through equation (2.15). The computations were executed with the MAXIMS software.
66. Berg and Olsen (1989) gave an average natural mortality rate M of 0.1 year1 for the abundant queen conch (Strombus gigas) in the PRVl area; this was set equal PIB.
67. Riddle et al. (1990, in Table 5) gave a PIB ratio for gastropods (>2 mm, mean weight = 50.5 mgll) of 2.5 year1.
68. All estimates of PIB ratio with this statement number in Table 3.10 were obtained from Table 1 in Schwinghamer et al. (1 986). Each PIB ratio in Table 3.10 represented the average of all estimates listed for a taxon in Schwinghamer et al. (1986); their PIB ratios were assembled from temperate and boreal areas.
69. A dry biomass of 60.1-1 70 g 1 for bivalves from Fig. 20 in Martinez-Estalella and Alcolado (1990b) was converted to a live biomass of 60-170 gm-2 with a conversion of DW = 10% of WW.
70. Salzwedel (1 980) gave an energy budget for an "average" Tellina fabula population in the German Bight, North Sea, of mean biomass = 60 kJm-2 and consumption = 290 kJm-2year1, at a temperature of about 10°C. Annual QIB for T. fabula was thus 4.8. This value was adjusted for temperature to a consumption of 9.5 yearl*BW with a factor of 1.88. (T = 28"C, T' = 10°C).
71. Riddle et al. (1990, in Table 5) gave a consumption for infaunal bivalves (>2.0 mm) from Davies Reef Lagoon, Great Barrier Reef, Australia, of 657 kJm-2year1. Biomass was indicated with 1.443 gCm-2. Annual QIB was then 9.5 (conversion: 1 gC = 48 kJ).
72. The daily rations for three species of bivalves (Mytilus edulis, Modiolus modiolus and Arctica islandica) were calculated as follows: filtration rates were determined from equations in Moehlenberg and Riisgard (1 979) and multiplied by an average organic content of 0.16 mgl-I of seawater. The parameter b and QIB values were computed with MAXIMS (Jarre et al. 1990). The growth constant K was obtained from Appendix 4 in Vakily (1992). Wmax in the filtration experiments of Moehlenberg and Riisgard were assumed to be 86% of Wm of the three species. M was assumed to equal K, as is commonly done in bivalves. The average annual QIB of the three species was adjusted for temperature. Table 3.1 2alb shows the parameters used for the computation of annual QIB for bivalves.
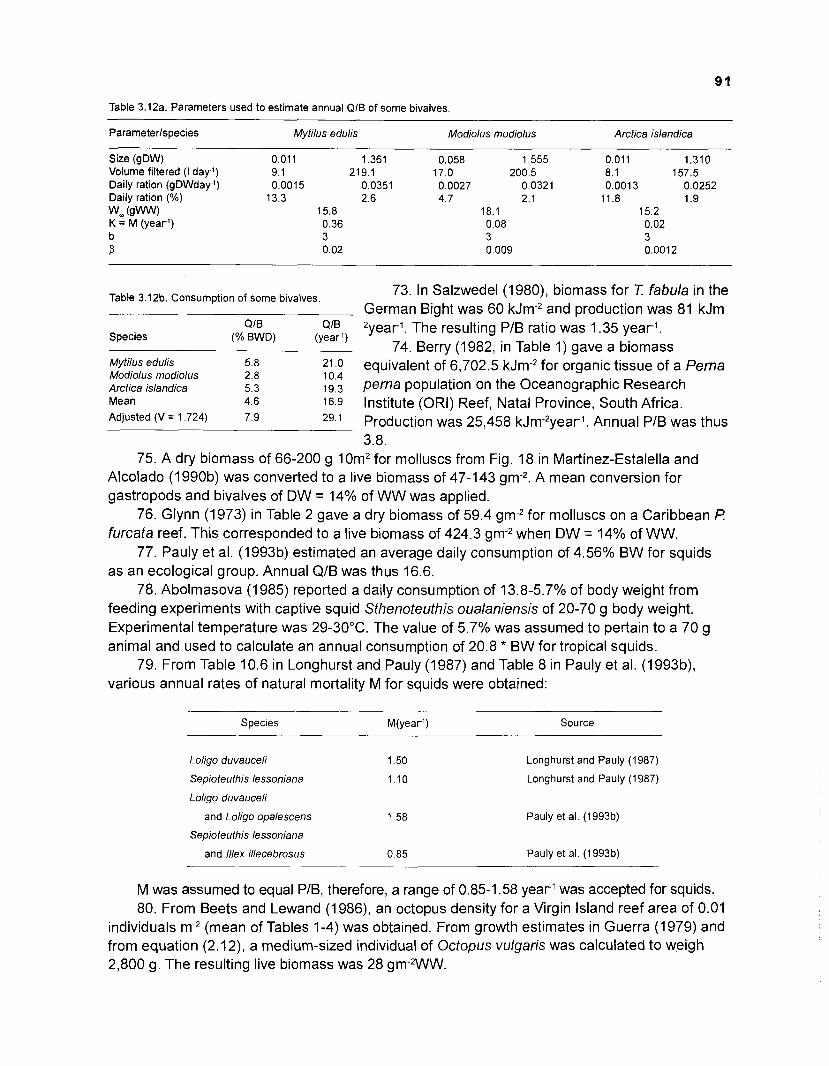
Table 3.12a. Parameters used to estimate annual QIB of some bivalves.
Mytilus edulis Modiolus modiolus
-
Arctics islandica
Size (gDW) Volume filtered (I day-I) Daily ration (gDWday-l) Daily ration (%) wm WW K = M (year1) b a
Table 3.12b. Consumption of some bivalves - -
QIB QIB Species (% BWD) (year1)
Mytilus edulis 5.8 21 .O Modiolus modiolus 2.8 10.4 Arctica islandica 5.3 19.3 Mean 4.6 16.9 Adjusted (V = 1.724) 7.9 29.1
73. In Salzwedel (1980), biomass for T. fabula in the German Bight was 60 kJm-2 and production was 81 kJm- 2year1. The resulting PIB ratio was 1.35 year1.
74. Berry (1982, in Table I ) gave a biomass equivalent of 6,702.5 kJm-2 for organic tissue of a Perna perna population on the Oceanographic Research Institute (ORI) Reef, Natal Province, South Africa. Production was 25,458 kJm-*year1. Annual PIB was thus 3.8.
75. A dry biomass of 66-200 g I Om2 for molluscs from Fig. 18 in Martinez-Estalella and Alcolado (1 990b) was converted to a live biomass of 47-143 gm-2. A mean conversion for gastropods and bivalves of DW = 14% of WW was applied.
76. Glynn (1973) in Table 2 gave a dry biomass of 59.4 gm-2 for molluscs on a Caribbean F? furcata reef. This corresponded to a live biomass of 424.3 gm-2 when DW = 14% of WW.
77. Pauly et al. (1993b) estimated an average daily consumption of 4.56% BW for squids as an ecological group. Annual QIB was thus 16.6.
78. Abolmasova (1 985) reported a daily consumption of 13.8-5.7% of body weight from feeding experiments with captive squid Sthenoteuthis oualaniensis of 20-70 g body weight. Experimental temperature was 29-30°C. The value of 5.7% was assumed to pertain to a 70 g animal and used to calculate an annual consumption of 20.8 * BW for tropical squids.
79. From Table 10.6 in Longhurst and Pauly (1987) and Table 8 in Pauly et al. (1993b), various annual rates of natural mortality M for squids were obtained:
Species M(yearl) Source
Loligo duvauceli 1.50 Longhurst and Pauly (1987)
Sepioteuthis lessoniana 1.10 Longhurst and Pauly (1987)
Loligo duvauceli
and Loligo opalescens 1.58 Pauly et al. (1993b)
Sepioteuthis lessoniana
and lllex illecebrosus 0.85 Pauly et al. (1993b)
M was assumed to equal PIB, therefore, a range of 0.85-1.58 year1 was accepted for squids. 80. From Beets and Lewand (1986), an octopus density for a Virgin Island reef area of 0.01
individuals m-2 (mean of Tables 1-4) was obtained. From growth estimates in Guerra (1979) and from equation (2.12), a medium-sized individual of Octopus vulgaris was calculated to weigh 2,800 g The resulting live biomass was 28 gm-2WW.
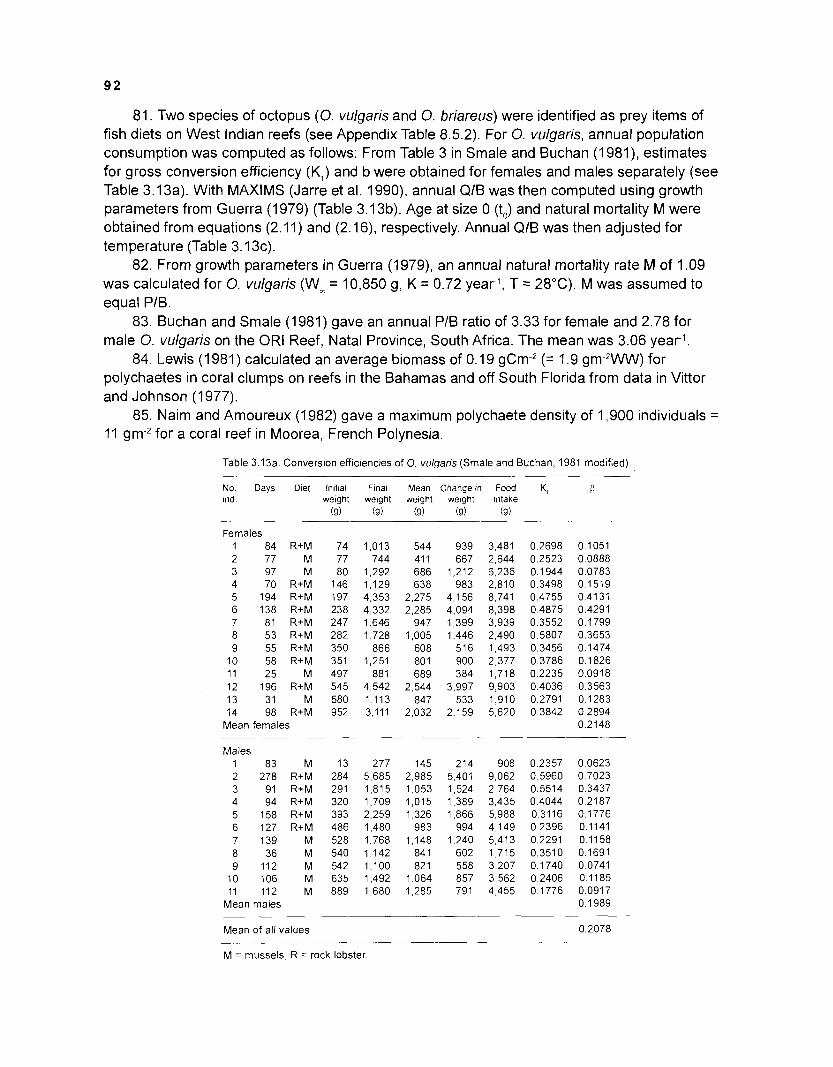
81. Two species of octopus (0. vulgaris and 0. briareus) were identified as prey items of fish diets on West Indian reefs (see Appendix Table 8.5.2). For 0. vulgaris, annual population consumption was computed as follows: From Table 3 in Smale and Buchan (1981), estimates for gross conversion efficiency (K,) and b were obtained for females and males separately (see Table 3.13a). With MAXIMS (Jarre et al. 1990), annual QIB was then computed using growth parameters from Guerra (1979) (Table 3.1 3b). Age at size 0 (to) and natural mortality M were obtained from equations (2.11) and (2.16), respectively. Annual QIB was then adjusted for temperature (Table 3.13~).
82. From growth parameters in Guerra (1979), an annual natural mortality rate M of 1.09 was calculated for 0. vulgaris (Wm = 10,850 g, K = 0.72 year1, T = 28°C). M was assumed to equal PIB.
83. Buchan and Smale (1981) gave an annual PIB ratio of 3.33 for female and 2.78 for male 0. vulgaris on the OR1 Reef, Natal Province, South Africa. The mean was 3.06 year1.
84. Lewis (1 981) calculated an average biomass of 0.19 gCm-2 (= I .9 gm-2WW) for polychaetes in coral clumps on reefs in the Bahamas and off South Florida from data in Vittor and Johnson (1977).
85. Naim and Amoureux (1982) gave a maximum polychaete density of 1,900 individuals = 11 gm-> for a coral reef in Moorea, French Polynesia.
Table 3.13a. Conversion efficiencies of 0. vulgaris (Smale and Buchan, 1981 modified).
No. Days Diet Initial Final Mean Change in Food K, P ind weight weight weight weight ~ntake
(9) (g) (g) (g) (9)
Females 1 84 R+M 2 77 M 3 97 M 4 70 R+M 5 194 R+M 6 138 R+M 7 81 R+M 8 53 R+M 9 55 R+M
10 58 R+M 11 25 M 12 196 R+M 13 31 M 14 98 R+M
Mean females
Males 1 2 3 4 5 6 7 8 9
10 11
Mean
83 278
9 1 94
I58 127 139 36
112 lo6 112
males
Mean of all values 0.2078 - -
M = mussels, R = rock lobster
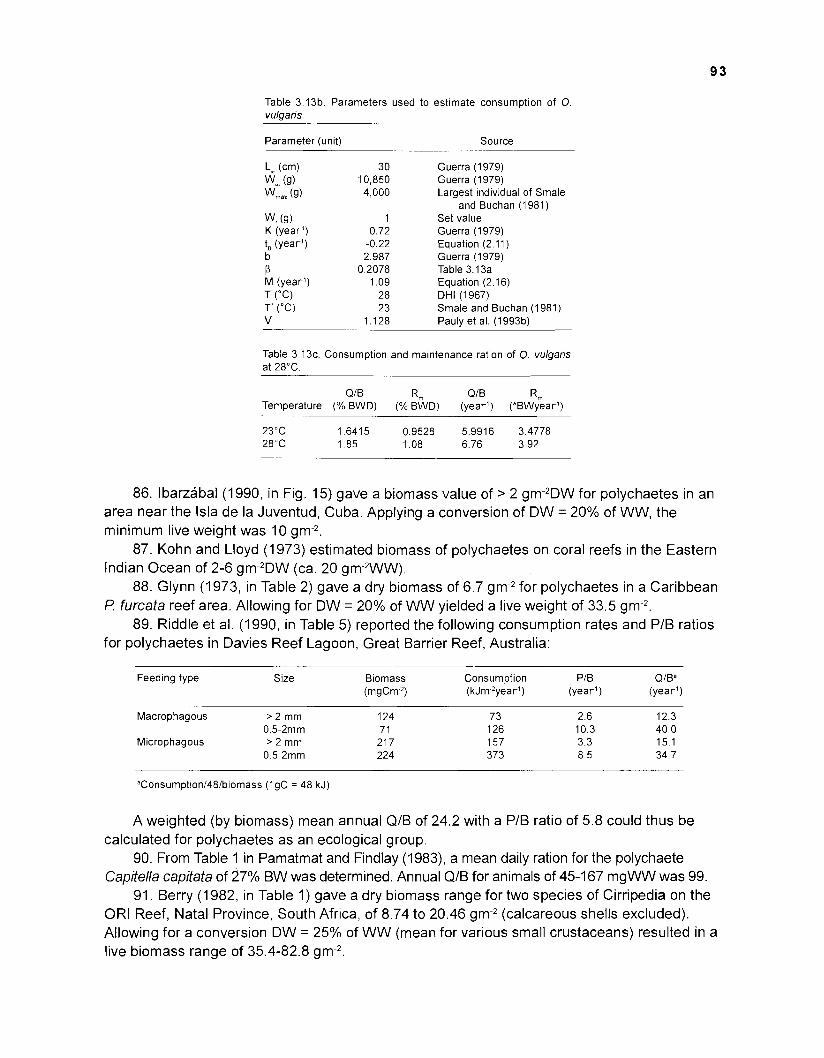
Table 3.13b. Parameters used to estimate consumption of 0. vuloaris.
Parameter (unit) Source
w, (s) K (year1) to (year') b P M (year1) T ("C) T' ("C) v
Guerra (1 979) Guerra (1 979) Largest individual of Srnale
and Buchan (1981) Set value Guerra (1 979) Equation (2.11) Guerra (1 979) Table 3.13a Equation (2.16) DHI (1967) Smale and Buchan (1981) Pauly et al. (199313)
Table 3 .13~ . Consumption and maintenance ration of 0. vulgaris at 28°C.
Q/B Rm QIB Rm
Temperature (% BWD) (% BWD) (yeari) (*BWyearl)
86. Ibarzabal (1 990, in Fig. 15) gave a biomass value of > 2 gm-2DW for polychaetes in an area near the lsla de la Juventud, Cuba. Applying a conversion of DW = 20% of WW, the minimum live weight was 10 gm-2.
87. Kohn and Lloyd (1973) estimated biomass of polychaetes on coral reefs in the Eastern Indian Ocean of 2-6 gm-2DW (ca. 20 gm-2WW).
88. Glynn (1 973, in Table 2) gave a dry biomass of 6.7 gm-2 for polychaetes in a Caribbean P furcafa reef area. Allowing for DW = 20% of WW yielded a live weight of 33.5 gm-2.
89. Riddle et al. (1990, in Table 5) reported the following consumption rates and PIB ratios for polychaetes in Davies Reef Lagoon, Great Barrier Reef, Australia:
Feeding type Size Biomass Consumption P/B Q/Ba (mgCrn~z) (kJrn->year1) (year1) (year')
Macrophagous > 2 m m 124 73 2.6 12.3 0.5-2mm 7 1 126 10.3 40.0
Microphagous > 2 rnrn 21 7 157 3.3 15.1 0.5-2mrn 224 373 8.5 34.7
aConsurnption148/biornass (IgC = 48 kJ).
A weighted (by biomass) mean annual QIB of 24.2 with a PIB ratio of 5.8 could thus be calculated for polychaetes as an ecological group.
90. From Table 1 in Pamatmat and Findlay (1983), a mean daily ration for the polychaete Capifella capitafa of 27% BW was determined. Annual QIB for animals of 45-167 mgWW was 99.
91. Berry (1 982, in Table 1) gave a dry biomass range for two species of Cirripedia on the OR1 Reef, Natal Province, South Africa, of 8.74 to 20.46 gm-2 (calcareous shells excluded). Allowing for a conversion DW = 25% of WW (mean for various small crustaceans) resulted in a live biomass range of 35.4-82.8 gm-2.
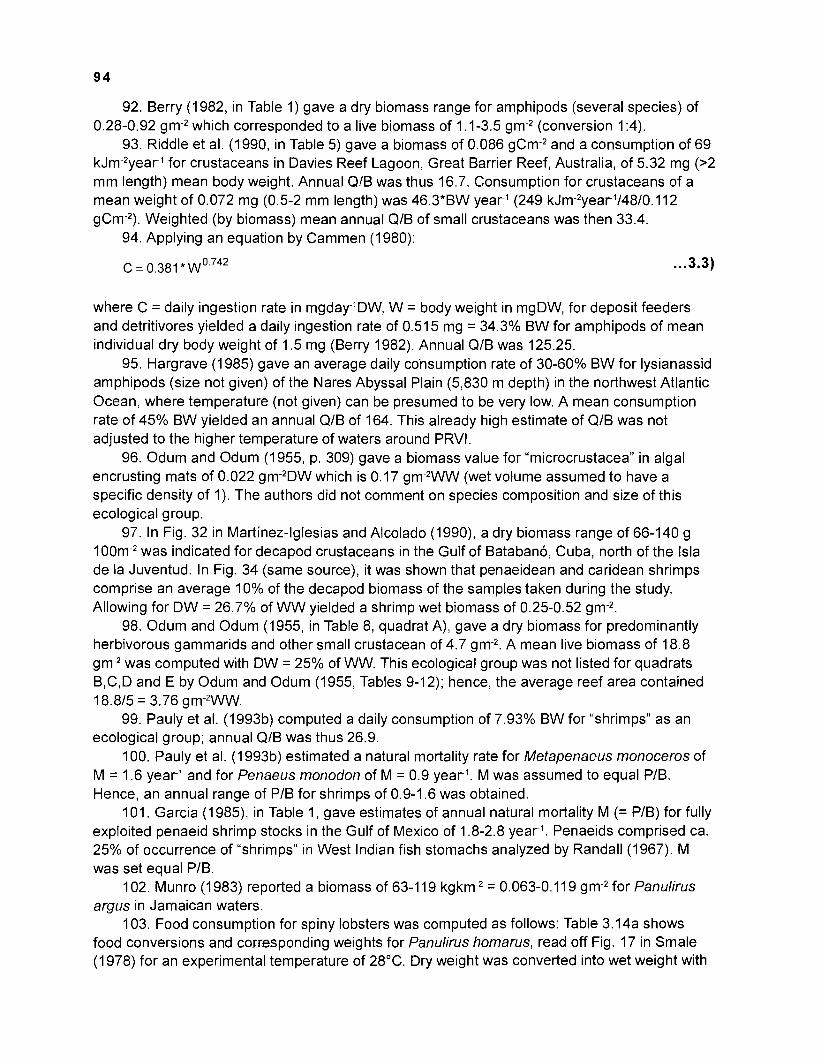
92. Berry (1 982, in Table 1) gave a dry biomass range for amphipods (several species) of 0.28-0.92 gm-2 which corresponded to a live biomass of 1 .I-3.5 gm-* (conversion 1 :4).
93. Riddle et al. (1 990, in Table 5) gave a biomass of 0.086 gCm-2 and a consumption of 69 kJm-2year1 for crustaceans in Davies Reef Lagoon, Great Barrier Reef, Australia, of 5.32 mg (>2 mm length) mean body weight. Annual QIB was thus 16.7. Consumption for crustaceans of a mean weight of 0.072 mg (0.5-2 mm length) was 46.3*BW year1 (249 kJm-2year114810. 11 2 gCm-2). Weighted (by biomass) mean annual Q/B of small crustaceans was then 33.4.
94. Applying an equation by Cammen (1980):
where C = daily ingestion rate in mgday-'DW, W = body weight in mgDW, for deposit feeders and detritivores yielded a daily ingestion rate of 0.51 5 mg = 34.3% BW for amphipods of mean individual dry body weight of 1.5 mg (Berry 1982). Annual QIB was 125.25.
95. Hargrave (1 985) gave an average daily co'nsumption rate of 30-60% BW for lysianassid amphipods (size not given) of the Nares Abyssal Plain (5,830 m depth) in the northwest Atlantic Ocean, where temperature (not given) can be presumed to be very low. A mean consumption rate of 45% BW yielded an annual QIB of 164. This already high estimate of Q/B was not adjusted to the higher temperature of waters around PRVI.
96. Odum and Odum (1 955, p. 309) gave a biomass value for "microcrustacea" in algal encrusting mats of 0.022 gm-2DW which is 0.17 gm-2WW (wet volume assumed to have a specific density of 1). The authors did not comment on species composition and size of this ecological group.
97. In Fig. 32 in Martinez-lglesias and Alcolado (1990), a dry biomass range of 66-140 g 1 00m-2 was indicated for decapod crustaceans in the Gulf of Batabano, Cuba, north of the lsla de la Juventud. In Fig. 34 (same source), it was shown that penaeidean and caridean shrimps comprise an average 10% of the decapod biomass of the samples taken during the study. Allowing for DW = 26.7% of WW yielded a shrimp wet biomass of 0.25-0.52 gm-2.
98. Odum and Odum (1955, in Table 8, quadrat A), gave a dry biomass for predominantly herbivorous gammarids and other small crustacean of 4.7 gm-2. A mean live biomass of 18.8 gm-2 was computed with DW = 25% of WW. This ecological group was not listed for quadrats B,C,D and E by Odum and Odum (1955, Tables 9-12); hence, the average reef area contained 18.815 = 3.76 gm-2WW.
99. Pauly et at. (1993b) computed a daily consumption of 7.93% BW for "shrimps" as an ecological group; annual Q/B was thus 26.9.
100. Pauly et al. (1993b) estimated a natural mortality rate for Metapenaeus monoceros of M = 1.6 year1 and for Penaeus monodon of M = 0.9 year1. M was assumed to equal P/B. Hence, an annual range of P/B for shrimps of 0.9-1.6 was obtained.
101. Garcia (1 985), in Table 1, gave estimates of annual natural mortality M (= PIB) for fully exploited penaeid shrimp stocks in the Gulf of Mexico of 1.8-2.8 year1. Penaeids comprised ca. 25% of occurrence of "shrimps" in West Indian fish stomachs analyzed by Randall (1967). M was set equal PIB.
102. Munro (1 983) reported a biomass of 63-1 19 kgkm-2 = 0.063-0.11 9 gm-2 for Panulirus argus in Jamaican waters.
103. Food consumption for spiny lobsters was computed as follows: Table 3.14a shows food conversions and corresponding weights for Panulirus homarus, read off Fig. 17 in Smale (1978) for an experimental temperature of 28°C. Dry weight was converted into wet weight with
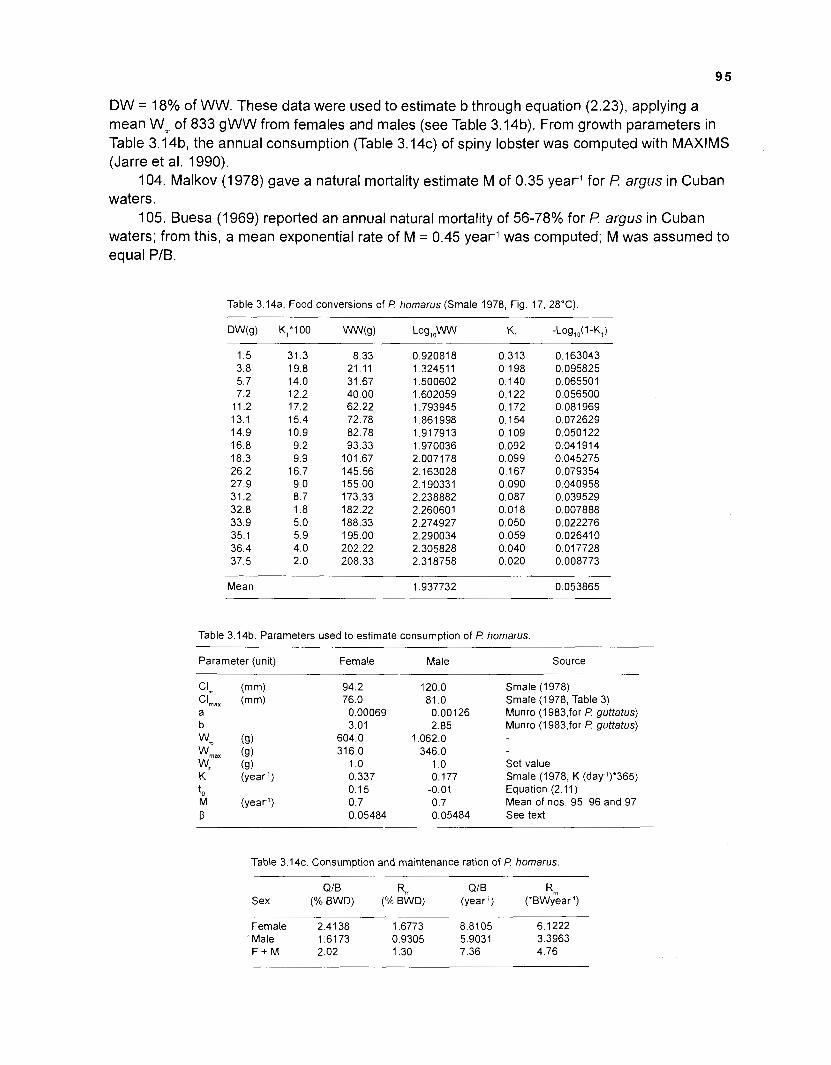
DW = 18% of WW. These data were used to estimate b through equation (2.23), applying a mean Wm of 833 gWW from females and males (see Table 3.14b). From growth parameters in Table 3.14b, the annual consumption (Table 3 .14~) of spiny lobster was computed with MAXIMS (Jarre et al. 1990).
104. Malkov (1978) gave a natural mortality estimate M of 0.35 year1 for P argus in Cuban waters.
105. Buesa (1969) reported an annual natural mortality of 56-78% for F! argus in Cuban waters; from this, a mean exponential rate of M = 0.45 year1 was computed; M was assumed to equal PIB.
Table 3.14a. Food conversions of P homarus (Smale 1978, Fig. 17, 28°C)
Mean 1.937732 0.053865
Table 3.14b. Parameters used to estimate consumption of P homarus.
Parameter (unit) Female Male Source
Smale (1 978) Smale (1978, Table 3) Munro (1 983,for P guttatus) Munro (1983,for P guttatus)
Set value Smale (1978, K (day-l)*365) Equation (2.11) Mean of nos. 95, 96 and 97 See text
Table 3 . 1 4 ~ . Consumption and maintenance ration of P homarus
Q/B Rm Q/B Rm Sex (% BWD) (% BWD) (year1) (*BWyearl)
Female 2 4138 1 6773 8 8105 6 1222 Male 16173 0 9305 5 9031 3 3963 F + M 2 02 1 30 7 36 4 76
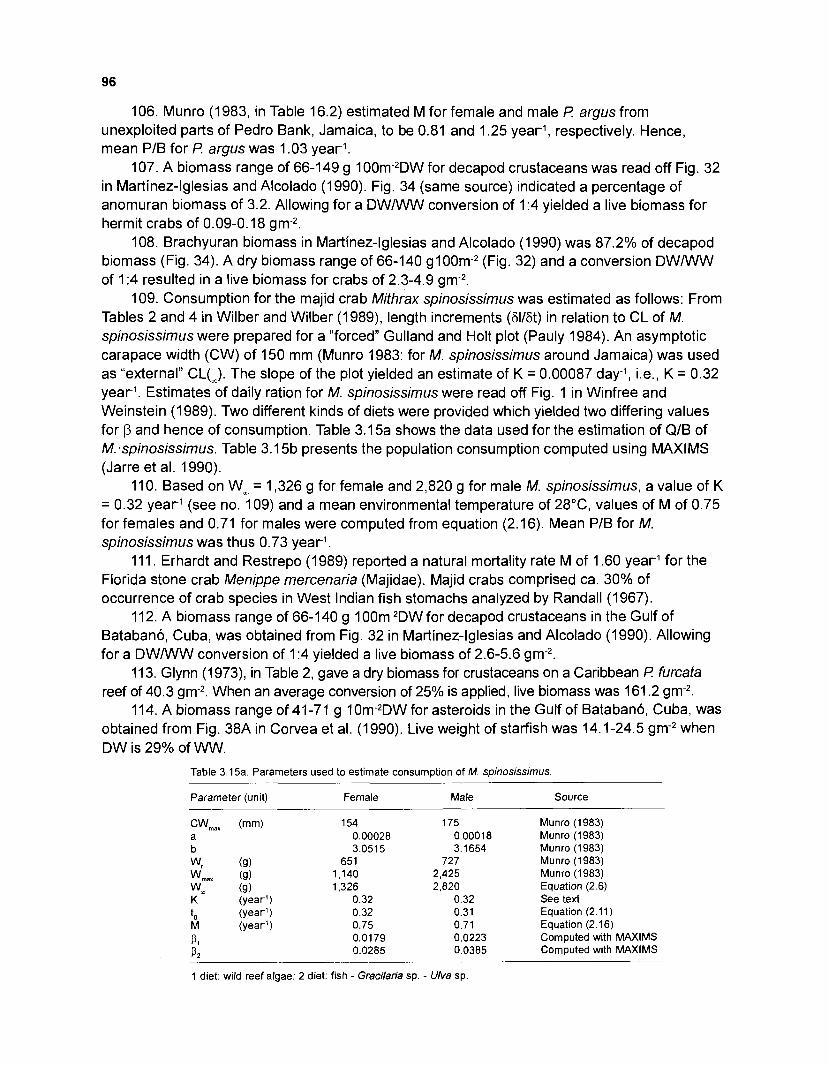
106. Munro (1 983, in Table 16.2) estimated M for female and male I? argus from unexploited parts of Pedro Bank, Jamaica, to be 0.81 and 1.25 year1, respectively. Hence, mean P/B for P argus was 1.03 year1.
107. A biomass range of 66-149 g 1 00m-2DW for decapod crustaceans was read off Fig. 32 in Martinez-lglesias and Alcolado (1990). Fig. 34 (same source) indicated a percentage of anomuran biomass of 3.2. Allowing for a DWNVW conversion of 1 :4 yielded a live biomass for hermit crabs of 0.09-0.18 gm-2.
108. Brachyuran biomass in Martinez-lglesias and Alcolado (1990) was 87.2% of decapod biomass (Fig. 34). A dry biomass range of 66-140 g100m-2 (Fig. 32) and a conversion D W N W of 1 :4 resulted in a live biomass for crabs of 2.3-4.9 gm-2.
109. Consumption for the majid crab Mithrax spinosissimus was estimated as follows: From Tables 2 and 4 in Wilber and Wilber (1989), length increments (6116t) in relation to CL of M. spinosissimus were prepared for a "forced" Gulland and Holt plot (Pauly 1984). An asymptotic carapace width (CW) of 150 mm (Munro 1983: for M. spinosissimus around Jamaica) was used as "external" CL(,). The slope of the plot yielded an estimate of K = 0.00087 day-l, i.e., K = 0.32 year1. Estimates of daily ration for M. spinosissimus were read off Fig. 1 in Winfree and Weinstein (1989). Two different kinds of diets were provided which yielded two differing values for p and hence of consumption. Table 3.1 5a shows the data used for the estimation of Q/B of M:spinosissimus. Table 3.15b presents the population consumption computed using MAXIMS (Jarre et al. 1990).
11 0. Based on Wm = 1,326 g for female and 2,820 g for male M. spinosissimus, a value of K = 0.32 year1 (see no. 109) and a mean environmental temperature of 28"C, values of M of 0.75 for females and 0.71 for males were computed from equation (2.16). Mean P/B for M. spinosissimus was thus 0.73 year1.
11 1. Erhardt and Restrepo (1 989) reported a natural mortality rate M of 1.60 year1 for the Florida stone crab Menippe mercenaria (Majidae). Majid crabs comprised ca. 30% of occurrence of crab species in West Indian fish stomachs analyzed by Randall (1967).
112. A biomass range of 66-140 g 1 00m-2DW for decapod crustaceans in the Gulf of Batabano, Cuba, was obtained from Fig. 32 in Martinez-lglesias and Alcolado (1990). Allowing for a DWNVW conversion of 1 :4 yielded a live biomass of 2.6-5.6 gm-2.
11 3. Glynn (1973), in Table 2, gave a dry biomass for crustaceans on a Caribbean f? furcata reef of 40.3 gm-2. When an average conversion of 25% is applied, live biomass was 161.2 gm-2.
114. A biomass range of 41-71 g 10m-2DW for asteroids in the Gulf of Batabano, Cuba, was obtained from Fig. 38A in Corvea et al. (1990). Live weight of starfish was 14.1-24.5 gm-2 when DW is 29% of WW.
Table 3.15a. Parameters used to estimate consumption of M. spinosissimus.
Parameter (unit) Female Male Source
Munro (1983) Munro (1 983) Munro (1 983) Munro (1983) Munro (1983) Equation (2.6) See text Equation (2.11) Equation (2.16) Computed with MAXIMS Computed with MAXIMS
1 diet: wild reef algae; 2 diet: fish - Gracilaria sp. - Ulva sp.
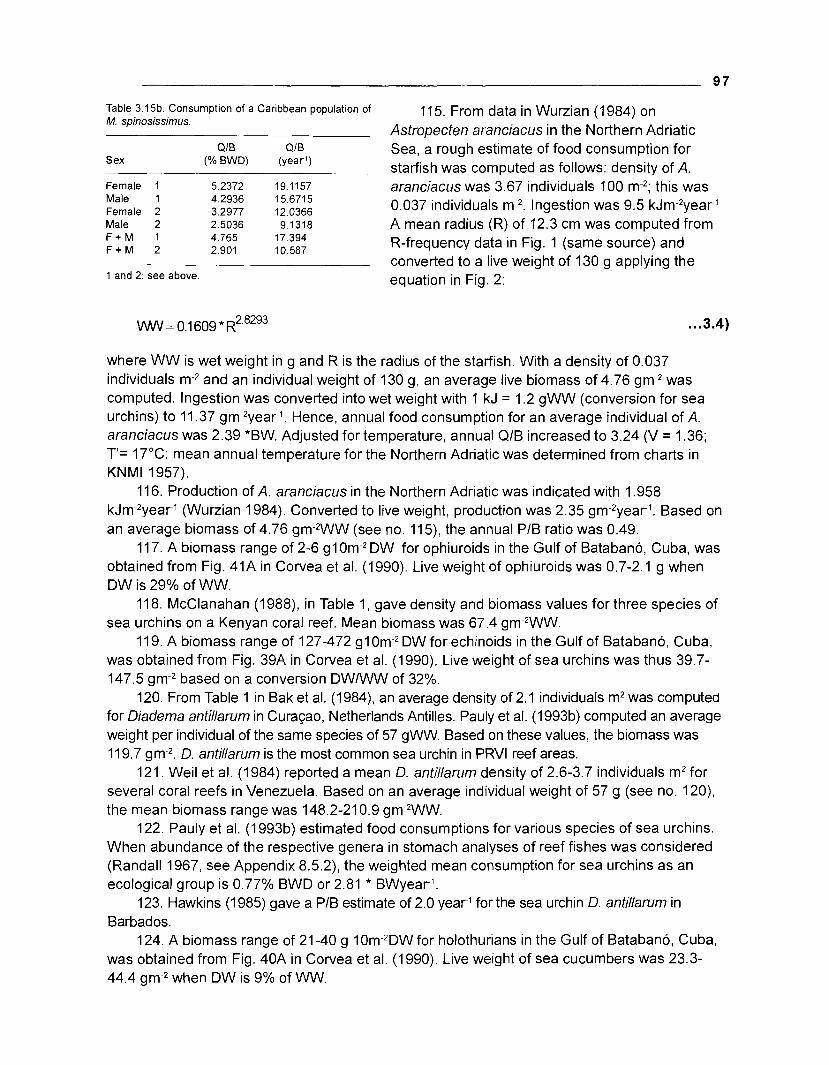
Table 3.15b. Consumption of a Caribbean population of M. spinosissimus.
I 1 5. From data in Wurzian (1 984) on Astropecten aranciacus in the Northern Adriatic
QIB QIB Sea, a rough estimate of food consumption for Sex (% BWD) (year1)
starfish was computed as follows: density of A. Female I 5.2372 19.1157 aranciacus was 3.67 individuals 100 m-*: this was Male 1 4.2936 15.6715 Female 2 3.2977 12.0366 Male 2 2.5036 9.1318
0.037 individuals m-2. Ingestion was 9.5 kJm-2year1 A mean radius (R) of 12.3 cm was computed from . ,
F + M 1 4.765 17.394 F + M 2 2.901 10.587
R-frequency data in Fig. 1 (same source) and converted to a live weight of 130 g applying the
1 and 2: see above. equation in Fig. 2:
where WW is wet weight in g and R is the radius of the starfish. With a density of 0.037 individuals m-* and an individual weight of 130 g, an average live biomass of 4.76 gm-2 was computed. Ingestion was converted into wet weight with 1 kJ = 1.2 gWW (conversion for sea urchins) to 11.37 gm-2yeari. Hence, annual food consumption for an average individual of A. aranciacus was 2.39 *BW. Adjusted for temperature, annual QIB increased to 3.24 (V = 1.36; T1= 17°C: mean annual temperature for the Northern Adriatic was determined from charts in KNMl 1957).
11 6. Production of A. aranciacus in the Northern Adriatic was indicated with 1.958 kJm-2year1 (Wurzian 1984). Converted to live weight, production was 2.35 gm-2year1. Based on an average biomass of 4.76 gm-2WW (see no. 115), the annual PI6 ratio was 0.49.
11 7. A biomass range of 2-6 g l Om-2 DW for ophiuroids in the Gulf of Batabano, Cuba, was obtained from Fig. 41A in Corvea et al. (1990). Live weight of ophiuroids was 0.7-2.1 g when DW is 29% of WW.
11 8. McClanahan (1988), in Table 1, gave density and biomass values for three species of sea urchins on a Kenyan coral reef. Mean biomass was 67.4 gm-2WW.
11 9. A biomass range of 127-472 g1 DW for echinoids in the Gulf of Batabano, Cuba, was obtained from Fig. 39A in Corvea et al. (1990). Live weight of sea urchins was thus 39.7- 147.5 gm-2 based on a conversion DWIWW of 32%.
120. From Table 1 in Bak et al. (1984), an average density of 2.1 individuals m2 was computed for Diadema antillarum in Cura~ao, Netherlands Antilles. Pauly et al. (1 993b) computed an average weight per individual of the same species of 57 gWW. Based on these values, the biomass was 11 9.7 gm-2. D. antillarum is the most common sea urchin in PRVl reef areas.
121. Weil et al. (1 984) reported a mean D. antillarum density of 2.6-3.7 individuals m2 for several coral reefs in Venezuela. Based on an average individual weight of 57 g (see no. 120), the mean biomass range was 148.2-21 0.9 gm-2WW.
122. Pauly et al. (1993b) estimated food consumptions for various species of sea urchins. When abundance of the respective genera in stomach analyses of reef fishes was considered (Randall 1967, see Appendix 8.5.2), the weighted mean consumption for sea urchins as an ecological group is 0.77% BWD or 2.81 * BWyearl.
123. Hawkins (1 985) gave a PIB estimate of 2.0 year1 for the sea urchin D. antillarum in Barbados.
124. A biomass range of 21-40 g 10m-*DW for holothurians in the Gulf of Batabano, Cuba, was obtained from Fig. 40A in Corvea et al. (1990). Live weight of sea cucumbers was 23.3- 44.4 gm-2 when DW is 9% of WW.
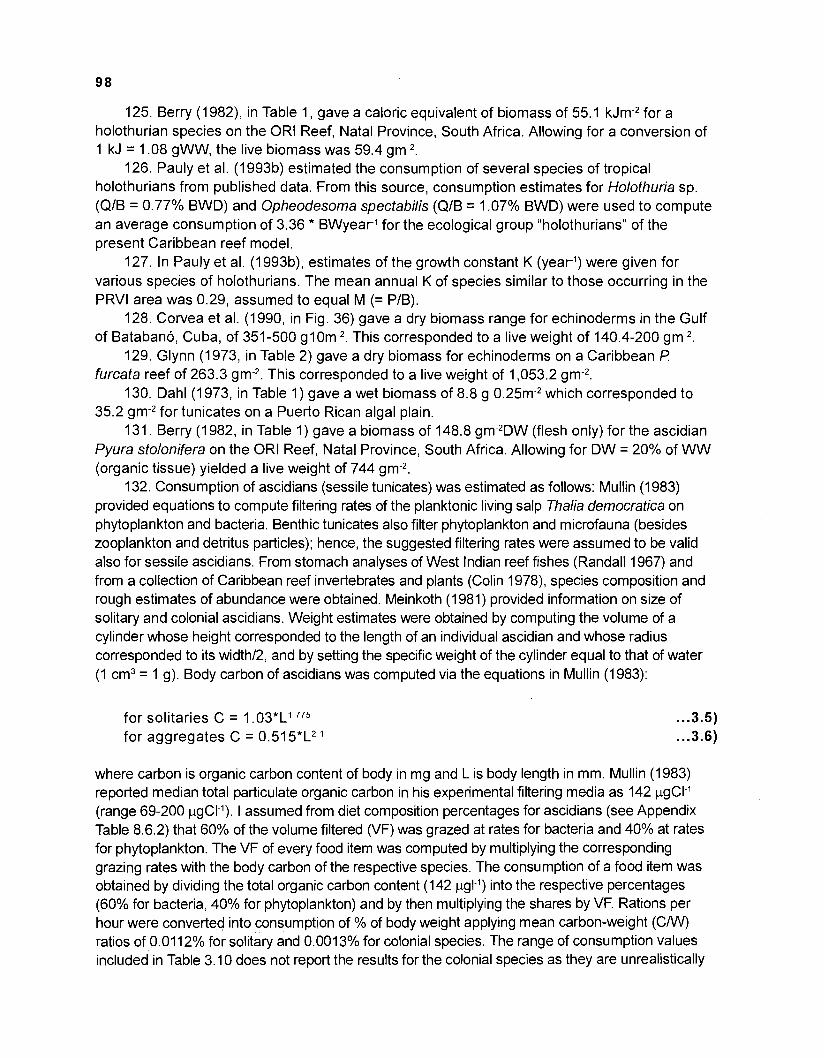
125. Berry (1 982), in Table I , gave a caloric equivalent of biomass of 55.1 kJm-2 for a holothurian species on the OR1 Reef, Natal Province, South Africa. Allowing for a conversion of 1 kJ = 1.08 gWW, the live biomass was 59.4 gm-2.
126. Pauly et al. (1993b) estimated the consumption of several species of tropical holothurians from published data. From this source, consumption estimates for Holothuria sp. (QIB = 0.77% BWD) and Opheodesoma spectabilis (QIB = 1.07% BWD) were used to compute an average consumption of 3.36 * BWyearl for the ecological group "holothurians" of the present Caribbean reef model.
127. In Pauly et al. (1993b), estimates of the growth constant K (year1) were given for various species of holothurians. The mean annual K of species similar to those occurring in the PRVl area was 0.29, assumed to equal M (= PIB).
128. Corvea et al. (1 990, in Fig. 36) gave a dry biomass range for echinoderms in the Gulf of Batabano, Cuba, of 351-500 g10m-2. This corresponded to a live weight of 140.4-200 gm-2.
129. Glynn (1973, in Table 2) gave a dry biomass for echinoderms on a Caribbean P furcata reef of 263.3 gm-2. This corresponded to a live weight of 1,053.2 gm-2.
130. Dahl (1973, in Table I ) gave a wet biomass of 8.8 g 0.25m-2 which corresponded to 35.2 gm-2 for tunicates on a Puerto Rican algal plain.
131. Berry (1982, in Table 1) gave a biomass of 148.8 gm-2DW (flesh only) for the ascidian Pyura stolonifera on the OR1 Reef, Natal Province, South Africa. Allowing for DW = 20% of WW (organic tissue) yielded a live weight of 744 gm-2.
132. Consumption of ascidians (sessile tunicates) was estimated as follows: Mullin (1 983) provided equations to compute filtering rates of the planktonic living salp Thalia democratica on phytoplankton and bacteria. Benthic tunicates also filter phytoplankton and microfauna (besides zooplankton and detritus particles); hence, the suggested filtering rates were assumed to be valid also for sessile ascidians. From stomach analyses of West Indian reef fishes (Randall 1967) and from a collection of Caribbean reef invertebrates and plants (Colin 1978), species composition and rough estimates of abundance were obtained. Meinkoth (1981) provided information on size of solitary and colonial ascidians. Weight estimates were obtained by computing the volume of a cylinder whose height corresponded to the length of an individual ascidian and whose radius corresponded to its widthl2, and by setting the specific weight of the cylinder equal to that of water (1 cm3 = 1 g). Body carbon of ascidians was computed via the equations in Mullin (1 983):
for solitaries C = 1 .03*L1 775
for aggregates C = 0.51 5*L2
where carbon is organic carbon content of body in mg and L is body length in mm. Mullin (1 983) reported median total particulate organic carbon in his experimental filtering media as 142 pgCI-I (range 69-200 pgCI-I). I assumed from diet composition percentages for ascidians (see Appendix Table 8.6.2) that 60% of the volume filtered (VF) was grazed at rates for bacteria and 40% at rates for phytoplankton. The VF of every food item was computed by multiplying the corresponding grazing rates with the body carbon of the respective species. The consumption of a food item was obtained by dividing the total organic carbon content (142 pgl-l) into the respective percentages (60% for bacteria, 40% for phytoplankton) and by then multiplying the shares by VF. Rations per hour were converted into consumption of % of body weight applying mean carbon-weight (CAN) ratios of 0.0112% for solitary and 0.0013% for colonial species. The range of consumption values included in Table 3.1 0 does not report the results for the colonial species as they are unrealistically
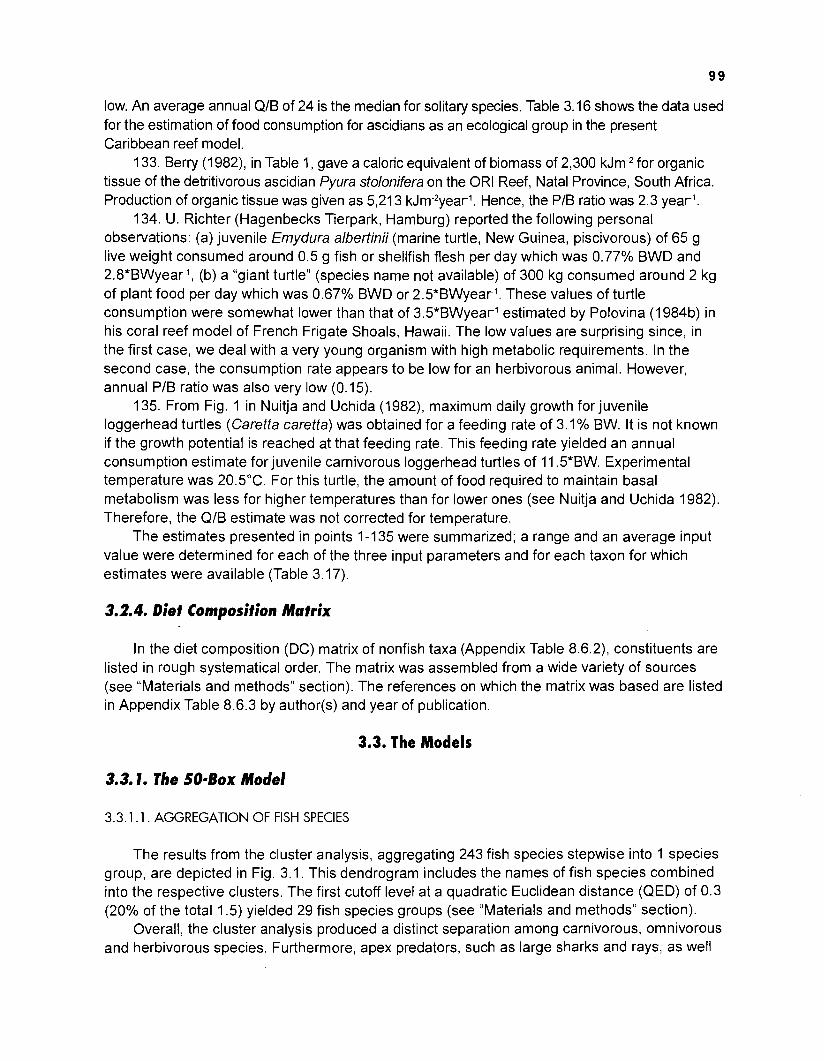
low. An average annual QIB of 24 is the median for solitary species. Table 3.16 shows the data used for the estimation of food consumption for ascidians as an ecological group in the present Caribbean reef model.
133. Berry (1 982), in Table I, gave a caloric equivalent of biomass of 2,300 kJm-* for organic tissue of the detritivorous ascidian Pyura stolonifera on the OR1 Reef, Natal Province, South Africa. Production of organic tissue was given as 5,213 kJm-2year1. Hence, the PIB ratio was 2.3 year1.
134. U. Richter (Hagenbecks Tierpark, Hamburg) reported the following personal observations: (a) juvenile Emydura albertinii (marine turtle, New Guinea, piscivorous) of 65 g live weight consumed around 0.5 g fish or shellfish flesh per day which was 0.77% BWD and 2.8*BWyear1, (b) a "giant turtle" (species name not available) of 300 kg consumed around 2 kg of plant food per day which was 0.67% BWD or 2.5*BWyear1. These values of turtle consumption were somewhat lower than that of 3.5*BWyear1 estimated by Polovina (1 984b) in his coral reef model of French Frigate Shoals, Hawaii. The low values are surprising since, in the first case, we deal with a very young organism with high metabolic requirements. In the second case, the consumption rate appears to be low for an herbivorous animal. However, annual PIB ratio was also very low (0.15).
135. From Fig. 1 in Nuitja and Uchida (1982), maximum daily growth for juvenile loggerhead turtles (Caretta caretta) was obtained for a feeding rate of 3.1 % BW. It is not known if the growth potential is reached at that feeding rate. This feeding rate yielded an annual consumption estimate for juvenile carnivorous loggerhead turtles of 11.5*BW. Experimental temperature was 20S°C. For this turtle, the amount of food required to maintain basal metabolism was less for higher temperatures than for lower ones (see Nuitja and Uchida 1982). Therefore, the QIB estimate was not corrected for temperature.
The estimates presented in points 1-1 35 were summarized; a range and an average input value were determined for each of the three input parameters and for each taxon for which estimates were available (Table 3.17).
3.2.4. Diet Composition Matrix
In the diet composition (DC) matrix of nonfish taxa (Appendix Table 8.6.2), constituents are listed in rough systematical order. The matrix was assembled from a wide variety of sources (see "Materials and methods" section). The references on which the matrix was based are listed in Appendix Table 8.6.3 by author(s) and year of publication.
3.3. The Models
3.3.1. The 50-Box Model
3.3.1 . 1 . AGGREGATION OF FISH SPECIES
The results from the cluster analysis, aggregating 243 fish species stepwise into 1 species group, are depicted in Fig. 3.1. This dendrogram includes the names of fish species combined into the respective clusters. The first cutoff level at a quadratic Euclidean distance (QED) of 0.3 (20% of the total 1.5) yielded 29 fish species groups (see "Materials and methods1' section).
Overall, the cluster analysis produced a distinct separation among carnivorous, omnivorous and herbivorous species. Furthermore, apex predators, such as large sharks and rays, as well
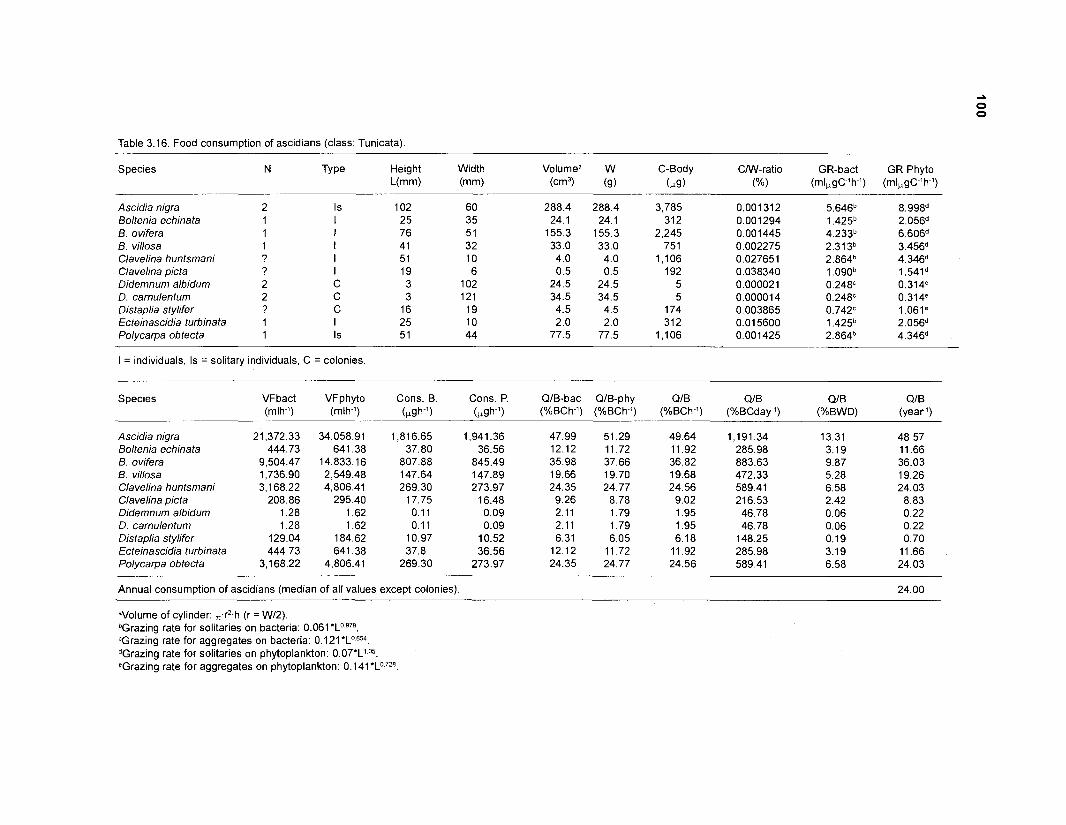
Table 3.16. Food consumption of ascidians (class: Tunicata)
Species N Type Height Width Volumea W C-Body CAN-ratio GR-bact GR Phyto L(mm) (mm) (cm3) (g) (pg) (%) (ml,gC-' h-l) (ml,gC-' h-l)
Ascidia nigra 2 IS Boltenia echinata 1 I B. ovifera 1 I B. villosa 1 I Clavelina huntsman; ? I Clavelina picta ? I Didernnurn albidum 2 C D. carnulenturn 2 C Distaplia stylifer ? C Ecteinascidia turbinata 1 I Polycarpa obtecta 1 Is
I = individuals, Is = solitary individuals, C = colonies.
Species VFbact VFphyto Cons. B. Cons. P. QIB-bac QIB-phy QIB QIB QIB QIB (mlh-') (mlh-l) (pgh ') (pgh-') (%BCh-') (%BCh-') (%BCh-') (%BCday-l) (%BWD) (year1)
Ascidia nigra 21,372.33 34,058.91 1,816.65 1,941.36 47.99 51.29 49.64 1,191.34 13.31 48.57 Boltenia echinata 444.73 641.38 37.80 36.56 12.12 11.72 11.92 285.98 3.19 11.66 B. ovifera 9,504.47 14,833.16 807.88 845.49 35.98 37.66 36.82 883.63 9.87 36.03 B. villosa 1,736.90 2,549.48 147.64 147.89 19.66 19.70 19.68 472.33 5.28 19.26 Clavelina huntsrnani 3,168.22 4,806.41 269.30 273.97 24.35 24.77 24.56 589.41 6.58 24.03 Clavelina picta 208.86 295.40 17.75 16.48 9.26 8.78 9.02 216.53 2.42 8.83 Didernnurn albidurn 1.28 1.62 0.11 0.09 2.11 1.79 1.95 46.78 0.06 0.22 D. carnulenturn 1.28 1.62 0.11 0.09 2.11 1.79 1.95 46.78 0.06 0.22 Distaplia stylifer 129.04 184.62 10.97 10.52 6.31 6.05 6.18 148.25 0.19 0.70 Ecteinascidia turbinata 444.73 641.38 37.8 36.56 12.12 11.72 11.92 285.98 3.19 11.66 Polycarpa obtecta 3,168.22 4,806.41 269.30 273.97 24.35 24.77 24.56 589.41 6.58 24.03
Annual consumption of ascidians (median of all values except colonies).
aVolume of cylinder: ,,rZ.h (r = Wl2). bGrazing rate for solitaries on bacteria: 0.061 "Grazing rate for aggregates on bacteria: 0 .121*L0~. dGrazing rate for solitaries on phytoplankton: 0.07*L1 05.
'Grazing rate for aggregates on phytoplankton: 0.141*L0728.
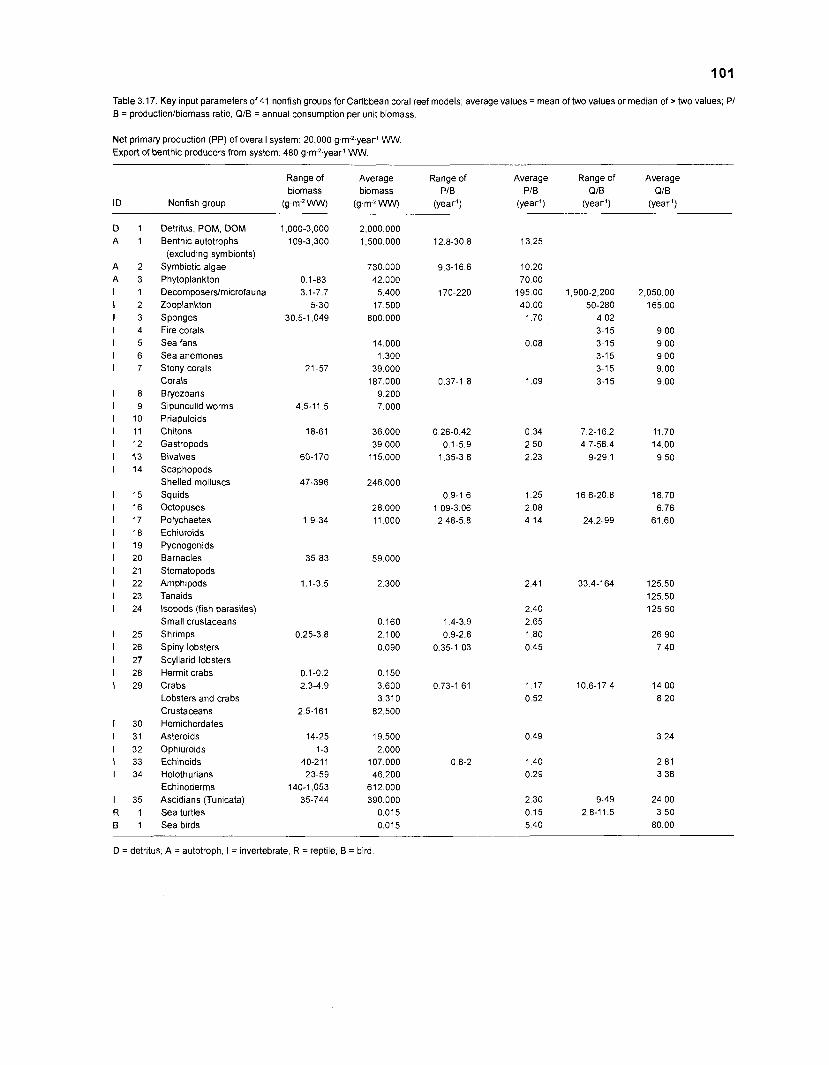
Table 3.17. Key input parameters of 41 nonfish groups for Caribbean coral reef models; average values = mean of two values or median of > two values; PI B = productionlbiomass ratio, QIB = annual consumption per unit biomass.
Net primary production (PP) of overall system: 20,000 gm2.year' WW. Export of benthic producers from system: 480 gm2.year' WW.
Range of Average Range of Average Range of Average biomass biomass P/B PIB QIB QIB
ID Nonfish group ( g m 2 w w ) (g.m-'ww) (year') (year') (year') (year')
Detritus, POM, DOM Benthic autotrophs
(excluding symbionts) Symbiotic algae Phytoplankton Decomposers/microfauna Zooplankton Sponges Fire corals Sea fans Sea anemones Stony corals Corals Bryozoans Sipunculid worms Priapuloids Chitons Gastropods Bivalves Scaphopods Shelled molluscs Squids Octopuses Polychaetes Echiuroids Pycnogonids Barnacles Stomatopods Amphipods Tanaids lsopods (fish parasites) Small crustaceans Shrimps Spiny lobsters Scyllarid lobsters Hermit crabs Crabs Lobsters and crabs Crustaceans Hemichordates Asteroids Ophiuro~ds Echinoids Holothurians Echinoderms Ascidians (Tunicata) Sea turtles Sea birds
D = detritus, A = autotroph, I = invertebrate, R = reptile, B = bird.
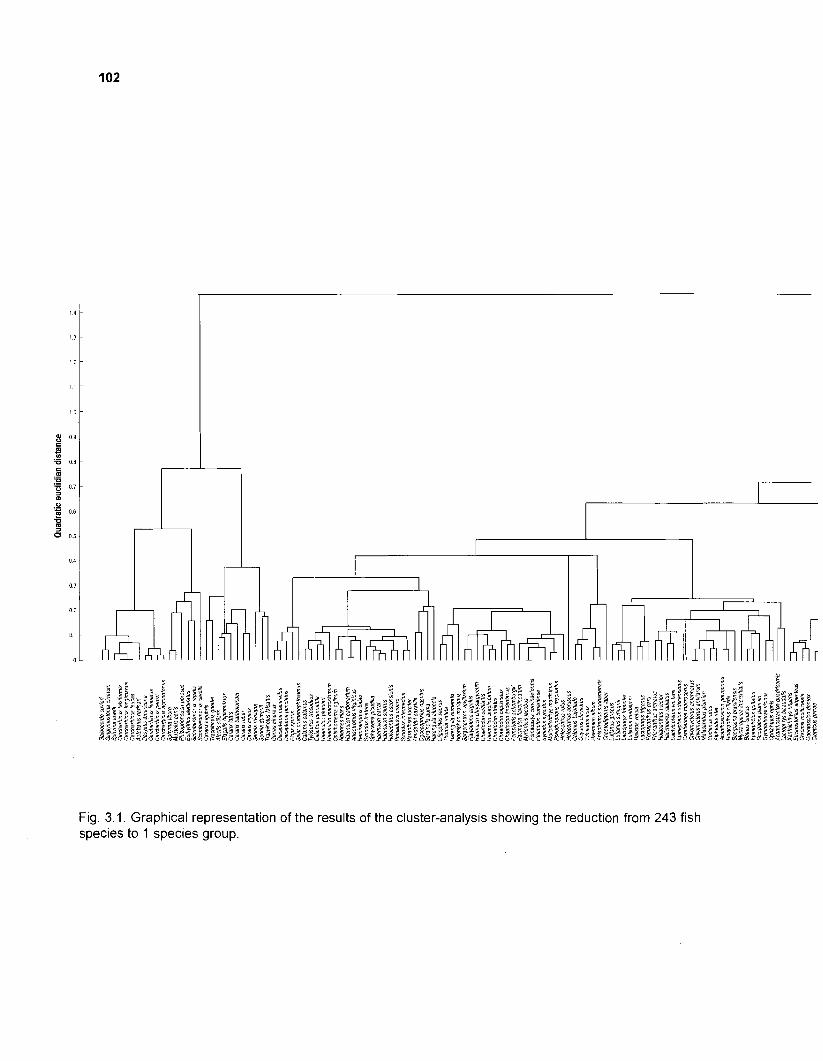
Fig. 3.1. Graphical representation of the results of the cluster-analysis showing the reduction from 243 fish species to 1 species group.
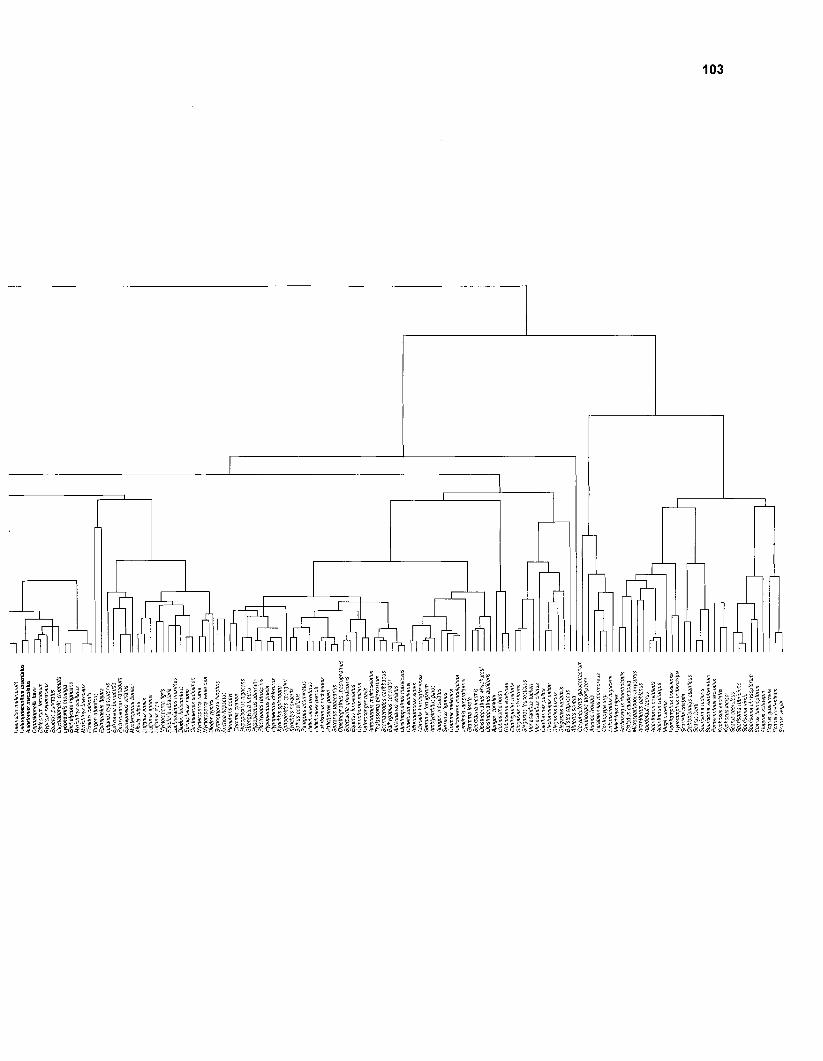
as scombrids and large jacks were jointly aggregated into clusters due to their high aspect ratio and high asymptotic weight. The vast majority of (predominantly) carnivorous reef species and small pelagics were clustered according to the resulting mixture of asymptotic weight and aspect ratio. These basic features of aggregation were observed as well by the results of the "centroid" agglomeration algorithm. The "centroid" algorithm produced more single species clusters than "average linkage", an undesirable feature for the present application. Besides, "average linkage" and "centroid" differed in several cases in the way they combined omnivorous species with carnivores or herbivores. Slight differences could also be observed for species with intermediate sizes and aspect ratios. Since the reef fish community can be viewed as an assemblage of species with smooth gradations in terms of size, activity and even DC than a set of separate compartments (see above), it is not surprising that species with intermediate parameter values were grouped differently by two different aggregation algorithms. What was surprising, rather, was that the results from both methods were largely compatible.
3.3.1.2. ASSEMBLAGE CHARACTERISTICS OF FISH SPECIES GROUPS
Table 3.18 presents the characteristics of 27 fish species groups which resulted from a further treatment of the 29 fish species groups from the cluster analysis. These 27 groups are part of the 50-box model, which was completed by adding 23 nonfish groups. An extended version of Table 3.18, where the species are only grouped but not condensed may be found in Appendix Table 8.7.1.
3.3.1.3. INPUT VALUES
Tables 3.1 9 and 3.20 present the estimates of the three key parameters: biomass, PIB ratio and QIB, which served as input values for the groups of the 50-box model. The model was balanced based on these inputs and the corresponding food matrix, presented in Table 3.21, with all ecotrophic efficiencies (EEs) < 1 and input NPP > output NPP.
3.3.1.4. MODIFICATION STRATEGY OF INPUT VALUES
The inputs were ranked intuitively according to the accuracy of the methods by which the respective inputs were obtained (see "Materials and methods"). The biomass values of fish and nonfish groups were considered to be the least accurate of all inputs. The PIB and QIB values of nonfish groups were considered to be less accurate than those of fish groups. The diet matrix of nonfish groups was considered less accurate than that of fish groups. Within the fish groups, the DCs of large, wide-ranging top predators, like sharks, scombrids and jacks, were considered less accurate than that of the other fish groups. The inputs were gradually modified following the above sequence of accuracy.
3.3.1.5. PARAMETER ESTIMATION
Output vahes
In Table 3.22, the changes of the three key input parameters necessary to balance the 50- box model are documented together with the resulting change in ecotrophic efficiency. Table 3.23 documents necessary changes within the diet composition matrix. Table 3.24 shows
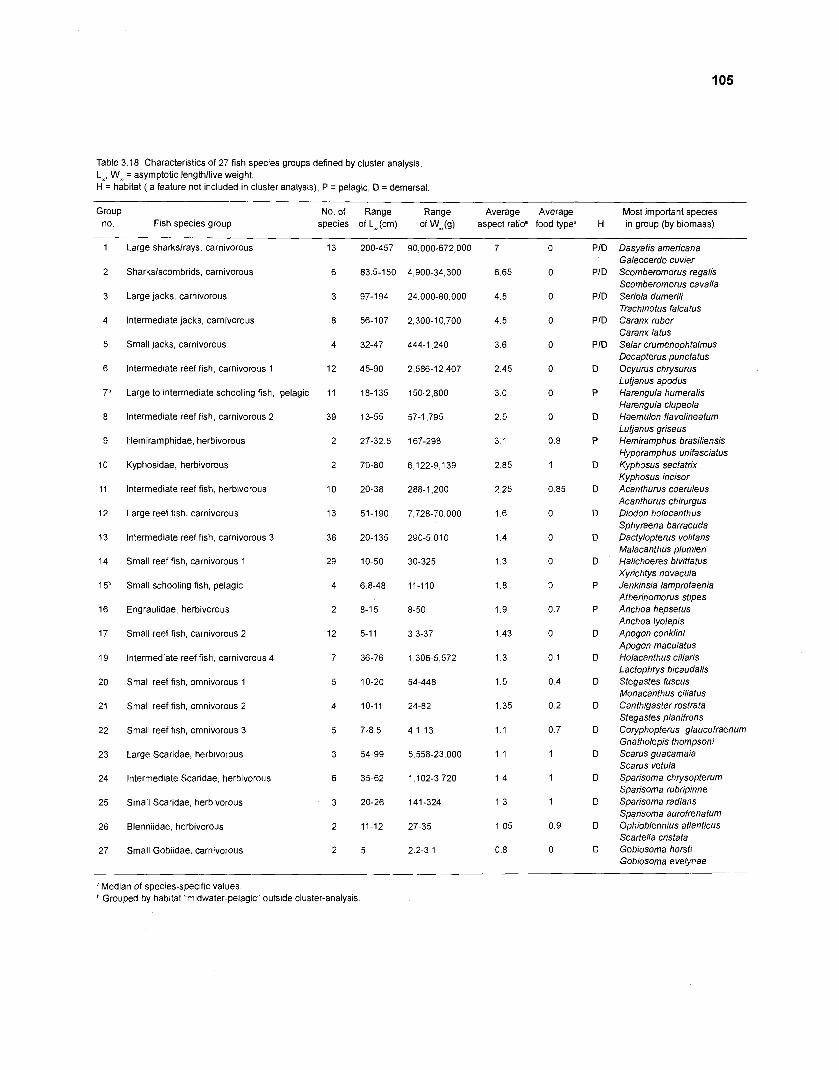
Table 3.18. Characteristics of 27 fish species groups defined by cluster analysis. L-, WI = asymptotic lengthllive weight. H = habitat ( a feature not included in cluster analysis), P = pelagic, D = demersal.
Group No. of Range Range Average Average Most important species no. Fish species group species of L- (cm) of W-(g) aspect ratioa food type" in group (by biomass)
Large sharkslrays, carnivorous
Sharkslscornbrids, carnivorous
Large jacks, carnivorous
lntermedlate jacks, carnivorous
Small jacks, carnivorous
Intermediate reef fish, carnivorous 1
Large to intermediate schooling fish, pelagic
lntermediate reef fish, carnivorous 2
Hemiramphidae, herbivorous
Kyphosidae, herbivorous
lntermediate reef fish, herbivorous
Large reef fish, carnivorous
lntermediate reef fish, carnivorous 3
Small reef fish, carnivorous 1
Small schooling frsh, pelagic
Engraulidae, herbivorous
Small reef fish, carnivorous 2
Intermediate reef fish, carnlvorous 4
Small reef fish, omnivorous 1
Small reef fish, omnivorous 2
Small reef fish, omnivorous 3
Large Scaridae, herbivorous
lntermedlate Scaridae, herbivorous
Small Scaridae, herbivorous
Blennildae, herbivorous
Small Gobiidae, carnivorous
PID
PID
PID
PID
PID
D
P
D
P
D
D
D
D
D
P
P
D
D
D
D
D
D
D
D
D
D
Dasyatis americana Galeocerdo cuvier Scomberomorus regalis Scomberomorus cavalla Seriola dumerili Trachinotus falcatus Caranx ruber Caranx latus Selar crumenophtalmus Decapterus punctatus Ocyurus chrysurus Lutjanusapodus Harengula humeralis Harengula clupeola Haemulon flavolineatum Lutjanus griseus Hemiramphus brasiliensis Hyporamphus unifasciatus Kyphosus sectatrix Kyphosus incisor Acanthurus coeruleus Acanthurus chirurgus Diodon holocanthus Sphyraena barracuda Dactylopterus volitans Malacanthus plumieri Halichoeres bivittatus Xyrichtys novacula Jenkinsia lamprotaenia Atherinomorus stipes Anchoa hepsetus Anchoa lyolepis Apogon conklini Apogon rnaculatus Holacanthus ciliaris Lactophrys bicaudalis Stegastes fuscus Monacanthus ciliatus Canthigaster rostrata Stegastes planifrons Coryphopterus glaucofraenum Gnatholepis thompsoni Scarus guacamaia Scarus vetula Sparisoma chrysopterum Sparisoma rubripinne Sparisoma radians Sparisoma aurofrenatum Ophioblennius atlanticus Scartella cristata Gobiosoma horsti Gobiosoma evelynae
"Median of species-specif~c values Grouped by habitat "m~dwater-pelagic" outside cluster-analysrs.
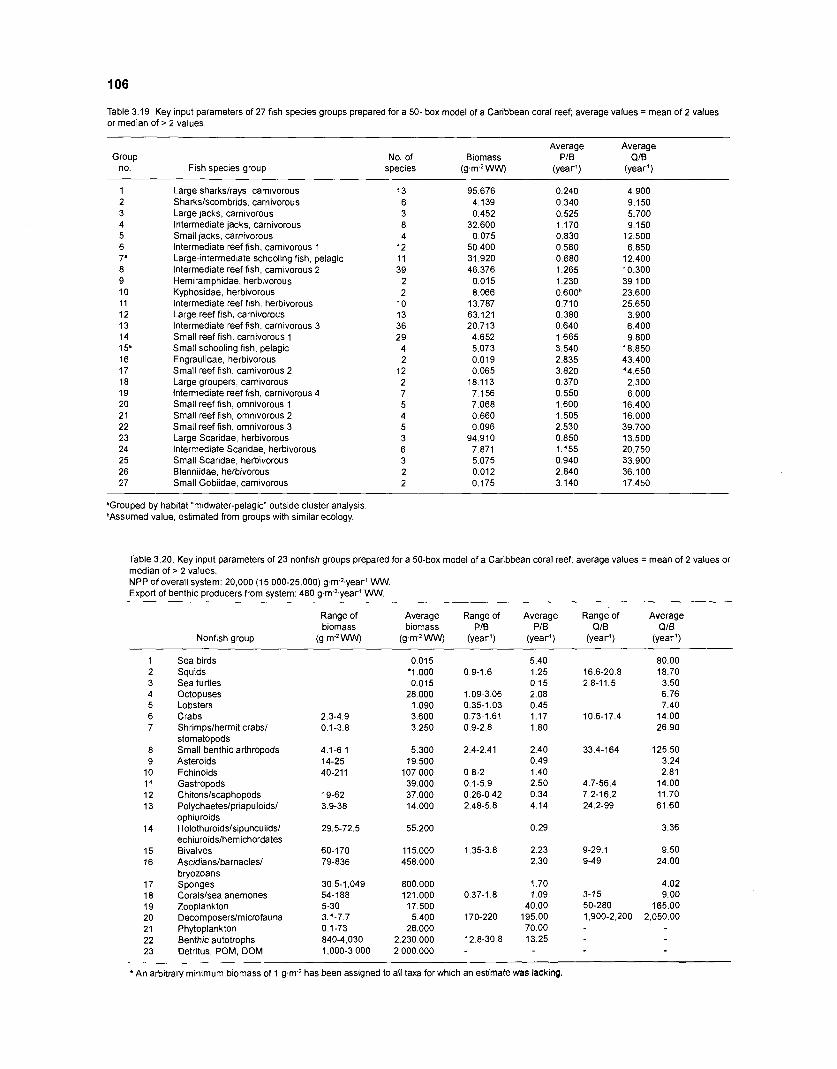
Table 3.19. Key input parameters of 27 fish species groups prepared for a 50- box model of a Caribbean coral reef; average values = mean of 2 values or median of > 2 values.
Group no. Fish species group
Average Average No. of Biomass PIB QIB
species ( g . d w w ) (year1) (year1)
Large sharkslrays, carnivorous Sharkslscombrids, carnivorous Large jacks, carnivorous lntermediate jacks, carnivorous Small jacks, carnivorous lnterrnediate reef fish, carnivorous 1 Large-intermediate schooling fish, pelagic lntermediate reef fish, carnivorous 2 Hemiramphidae, herbivorous Kyphosidae, herbivorous lnterrnediate reef fish, herbivorous Large reef fish, carnivorous Intermediate reef fish, carnivorous 3 Small reef fish, carnivorous 1 Small schooling fish, pelagic Engraulidae, herbivorous Small reef fish, carnivorous 2 Large groupers, carnivorous lntermediate reef fish, carnivorous 4 Small reef fish, omnivorous 1 Small reef fish, omnivorous 2 Small reef fish, omnivorous 3 Large Scaridae, herbivorous lntermediate Scaridae, herbivorous Small Scaridae, herbivorous Blenniidae, herbivorous Small Gobiidae, carnivorous
"Grouped by habitat "midwater-pelagic" outside cluster analysis. bAssumed value, estimated from groups with similar ecology.
Table 3.20. Key input parameters of 23 nonfish groups prepared for a 50-box model of a Caribbean coral reef; average values = mean of 2 values or median of > 2 values. NPP of overall system: 20,000 (1 5,000-25,000) gm2.year1 WW. Exoort of benthic oroducers from svstem: 480 a.m-2.vear' WW.
Range of Average Range of Average Range of Average biomass biomass PIB PIB QIB QIB
Nonfish group ( w " ww) ( g . m 2 w (year1) (year') (year1) (year1)
1 Sea birds 0.015 5.40 2 Squids * I ,000 0 9-1.6 1.25 3 Sea turtles 0.015 0.15 4 Octopuses 28.000 1.09-3.06 2.08 5 Lobsters 1.090 0.35-1.03 0.45 6 Crabs 2.3-4.9 3.600 0.73-1.61 1.17 7 Shrirnpslhermit crabs1 0.1-3.8 3.250 0.9-2.8 1.80
stomatopods 8 Small benthic arthropods 4.1-6.1 5.300 2.4-2.41 2.40 9 Asteroids 14-25 19.500 0.49
10 Echinoids 40-211 107.000 0.8-2 1.40 11 Gastropods 39.000 0.1-5.9 2.50 12 Chitonslscaphopods 19-62 37.000 0.26-0.42 0.34 13 Polychaeteslpriapuloidsl 3.9-38 14 000 2.48-5.8 4.14
ophiuroids 14 Holothuroidslsipunculidsl 29.5-72.5 55.200 0.29
echiuroidslhemichordates 15 Bivalves 60-170 115.000 1.35-3.8 2.23 16 Ascidianslbarnaclesl 79-836 458.000 2.30
bryozoans 17 Sponges 30.5-1,049 800.000 1.70 18 Coralslsea anemones 54-188 121.000 0.37-1.8 1 .09 19 Zooplankton 5-30 17.500 40.00 20 Decomposerslmicrofauna 3.1-7.7 5.400 170-220 195.00 21 Phytoplankton 0.1-73 26.000 70.00 22 Benthic autotrophs 840-4,030 2,230.000 12.8-30.8 13.25 23 Detritus, POM, DOM 1,000-3,000 2,000 000 -
* A n arbitrary minimum biomass of 1 g.m2 has been assigned to all taxa for which an estimate was lacking.
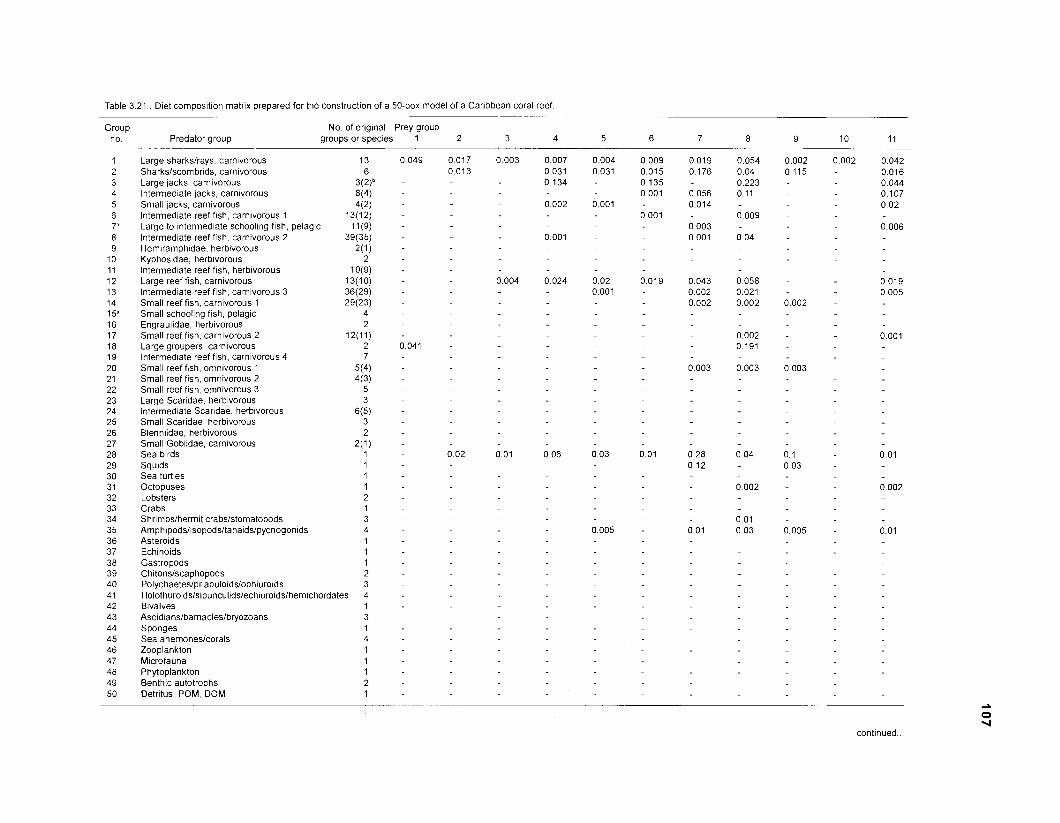
Table 3.21 D~et composition matrix prepared for the construction of a 50-box model of a Caribbean coral reef.
Group no Predator group
No. of oriainal Prev arouo
Large sharkslrays, carnivorous Sharkslscombrids, carnivorous Large jacks, carnivorous Intermedlate jacks, carnivorous Small jacks, carnivorous lntermedlate reef fish, carnivorous 1 Large to lntermedlate schoollng fish, pelagic Intermedlate reef fish, carnivorous 2 Hemiramphidae, herbivorous Kyphosidae, herblvorous lntermediate reef fish, herblvorous Large reef fish, carnlvorous Intermediate reef fish. carnlvorous 3 Small reef flsh, carnivorous 1 Small schoollng fish, pelagic Engraulidae, herbivorous Small reef fish, carnlvorous 2 Large groupers, carnivorous lntermediate reef fish, carnlvorous 4 Small reef flsh, omnivorous 1 Small reef f~sh, omnivorous 2 Small reef fish, omnivorous 3 Large Scarldae, herblvorous lntermediate Scaridae, herbivorous Small Scarldae, herbivorous Blenniidae, herbivorous Small Goblidae, carnivorous Sea birds Squids Sea turtles Octopuses Lobsters Crabs Shrimpslhermit crabslstomatopods Amphipodsl~sopodsltanaidslpycnogonids Asteroids Echinoids Gastropods Chitonslscaphopods Polvchaetesl~riaouloidslo~hiuroids
. - groups or specles 1
~olbthuroids~si~~nculidsl~chiuroidslhemichordates Bivalves Ascidianslbarnacleslbryozoans Sponges Sea anemoneslcorals Zooplankton Microfauna Phytoplankton Benthic autotrophs Detritus, POM, DOM
continued..
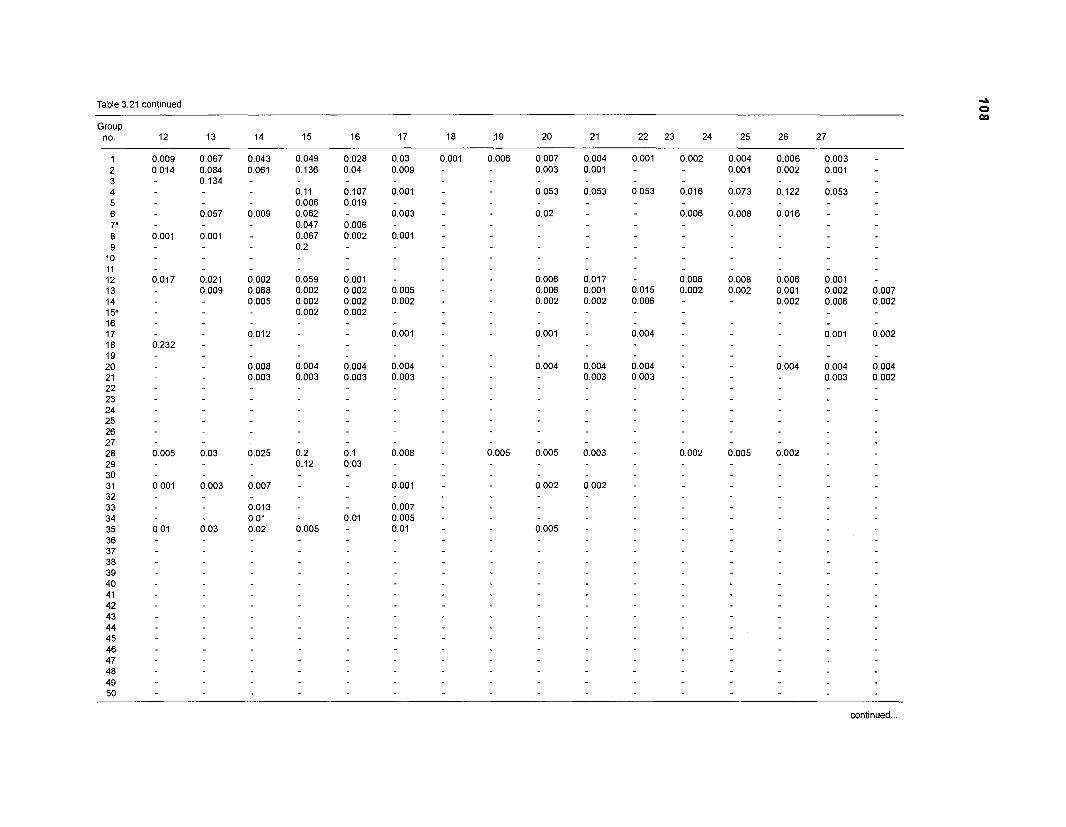
Table 3.21 continued
Group no 12 13 14 15 16 17 18 j9 20 21 22 23 24 25 26 27
continued
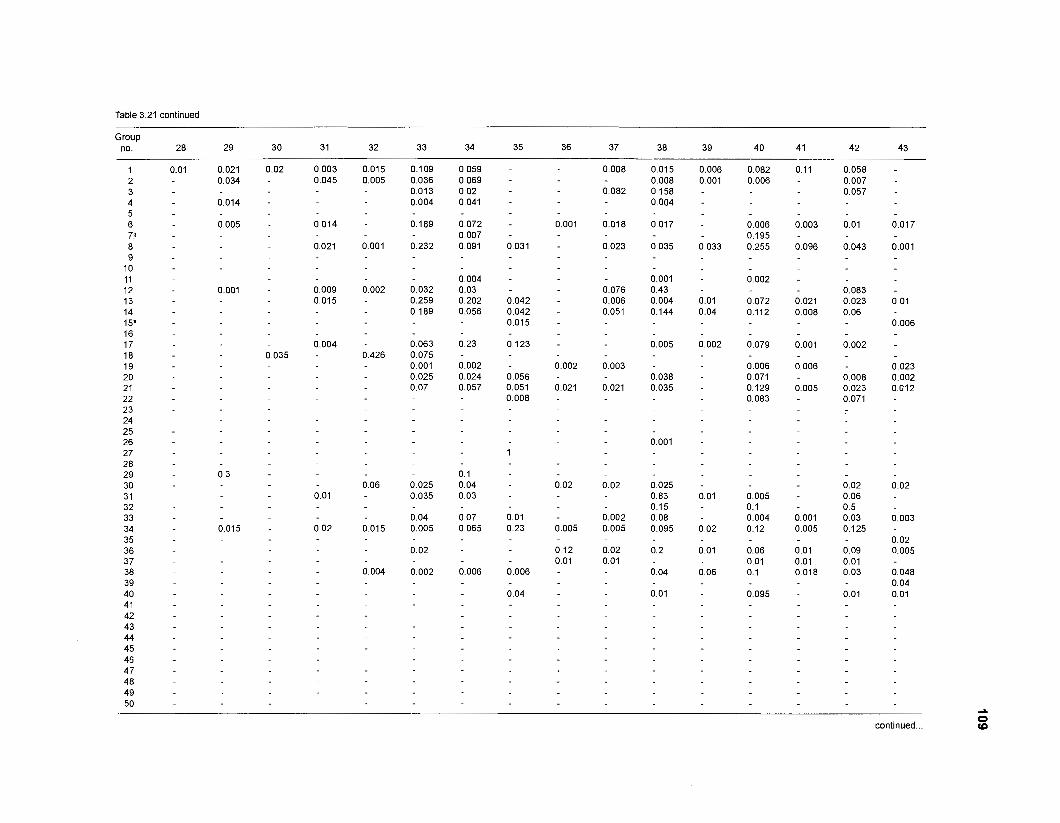
Table 3.21 continued
Group no. 28 29 30 31 32 33 34 35 36 37 38 39 40 41 42 43
continued ...
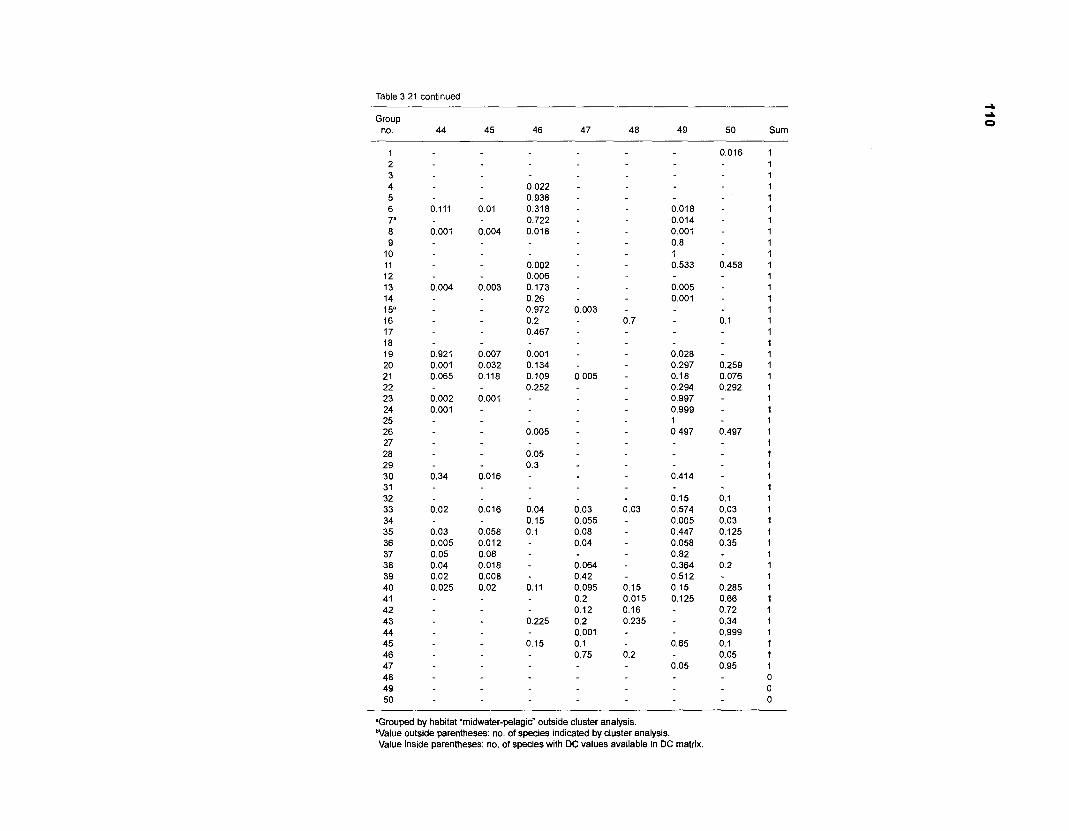
Table 3.21 continued
Group no. 44 45 46 47 48 49 50 Sum
- "Grouped by habitat "midwater-pelagic" outside cluster analysis. bValue outside parentheses: no. of species indicated by cluster analysis. Value inside parentheses: no. of species with DC values available in DC matrix.
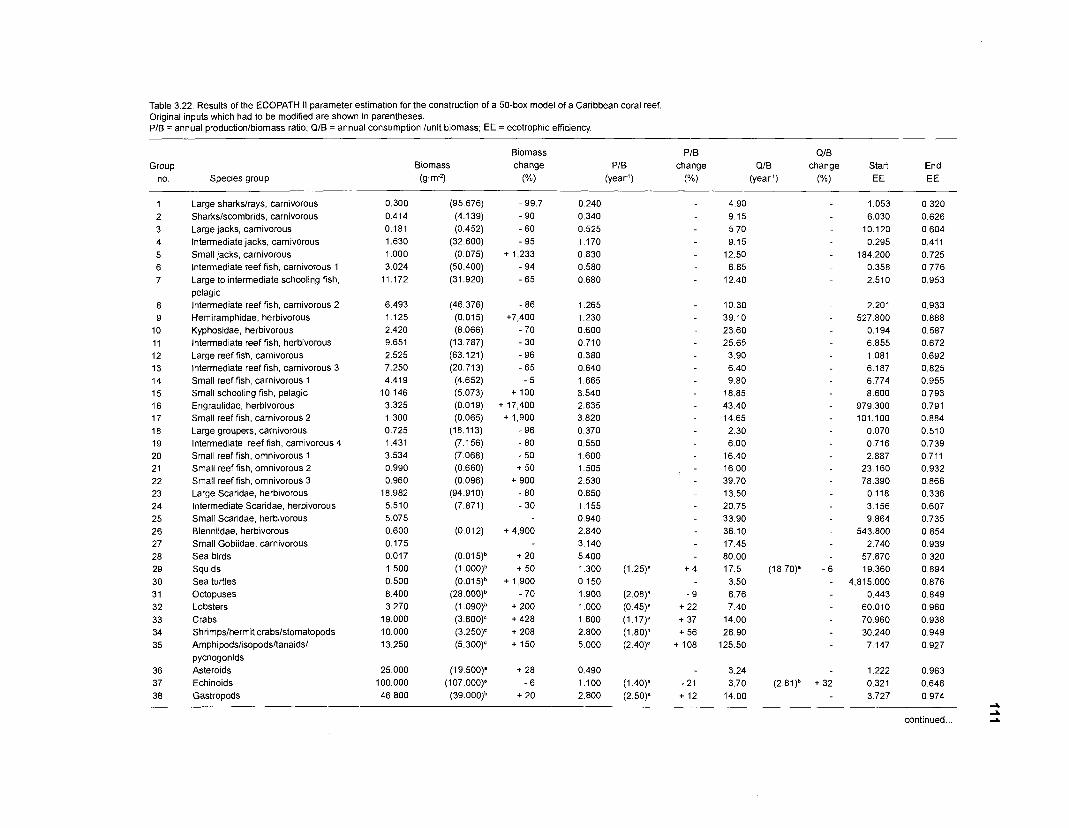
Table 3.22. Results of the ECOPATH I1 parameter estimation for the construction of a 50-box model of a Caribbean coral reef. Original inputs which had to be modified are shown in parentheses. PIB = annual production1biomass ratio; QIB = annual consumption lunit biomass; EE = ecotrophic efficiency.
Group no. Species group
Large sharkslrays, carnivorous Sharkslscombrids, carnivorous Large jacks, carnivorous lntermediate jacks, carnivorous Small jacks, carnivorous lntermediate reef fish, carnivorous 1 Large to intermediate schooling fish. pelagic lntermediate reef fish, carnivorous 2 Hemiramphidae, herbivorous Kyphosidae, herbivorous lntermediate reef fish, herbivorous Large reef fish, carnivorous lntermediate reef fish, carnivorous 3 Small reef fish, carnivorous 1 Small schooling fish, pelagic Engraulidae, herbivorous Small reef fish, carnivorous 2 Large groupers, carnivorous Intermediate reef fish, carnivorous 4 Small reef fish, omnivorous 1 Small reef fish, omnivorous 2 Small reef fish, omnivorous 3 Large Scaridae, herbivorous lntermediate Scaridae, herbivorous Small Scaridae, herbivorous Blenniidae, herbivorous Small Gobiidae, carnivorous Sea birds Squ~ds Sea turtles Octopuses Lobsters Crabs Shrimpsmermit crabslstomatopods Arnphipodslisopodsltanaidsl pycnogonids Asteroids Echinoids Gastropods
Biomass Biomass change
(g.m-2) ("4
PIB QIB PIB change QIB change Start
EE
1.053 6.030
10.120 0.295
184 200 0.358 2.510
2.201 527.800
0.194 6.855 1.081 6.187 6.774 8.600
979.300 101.100
0.070 0.716 2.887
23.160 78.390
0 118 3.156 9.864
543.800 2.740
57.870 19.360
4,815.000 0.443
60.010 70.960 30.240 7.147
1.222 0.321 3.727
End EE
0 320 0.626 0.604 0.411 0 725 0 776 0.953
0.933 0.888 0.587 0.672 0 692 0.825 0.955 0.793 0.791 0.884 0.510 0.739 0.711 0.932 0 866 0.336 0.607 0.735 0.854 0.939 0.320 0.894 0.876 0.849 0.960 0.938 0.949 0.927
0.963 0.648 0.974
- A
continued ... a
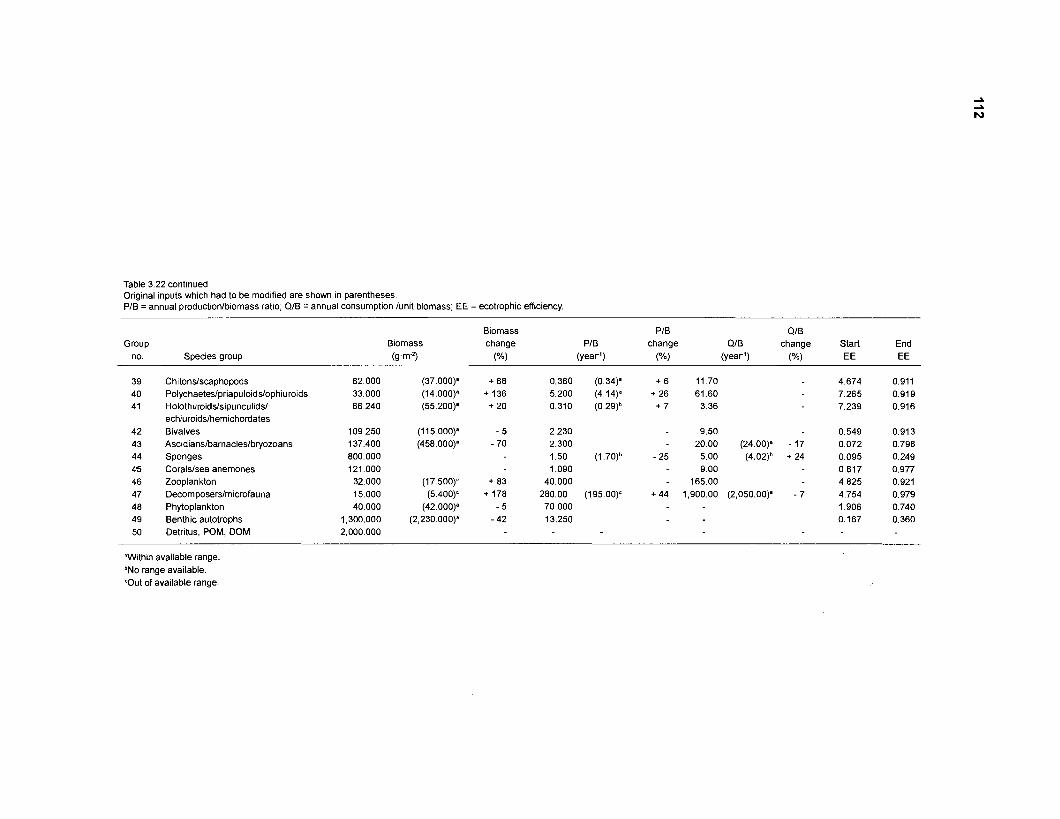
Table 3.22 continued Original inputs which had to be modified are shown in parentheses. PIB = annual productionlbiomass ratio; QIB = annual consumption lunit biomass; EE = ecotrophic efficiency.
Biomass PIB QIB Group Biomass change PIB change QIB change Start End
no. Species group ( w 2 ) ("4 (year') ("4 (year') ("4 EE EE
39 Chitonslscaphopods 62.000 (37.000)" + 68 0.360 (0.34)' + 6 11.70 4.674 0.911 40 Polychaeteslpriapuloids1ophiuroids 33.000 (14.000)" + 136 5.200 (4.14)" + 26 61.60 7.265 0.91 9 41 Holothuroidslsipunculidsl 66.240 (55.200)" + 20 0.310 (0.29)b + 7 3.36 7.239 0.916
echiuroidslhemichordates Bivalves Ascidianslbarnacleslbryozoans Sponges Coralslsea anemones Zooplankton Decomposerslmicrofauna Phytoplankton Benthic autotrophs Detritus. POM, DOM
"Within available range. bNo range available. "Out of available range.
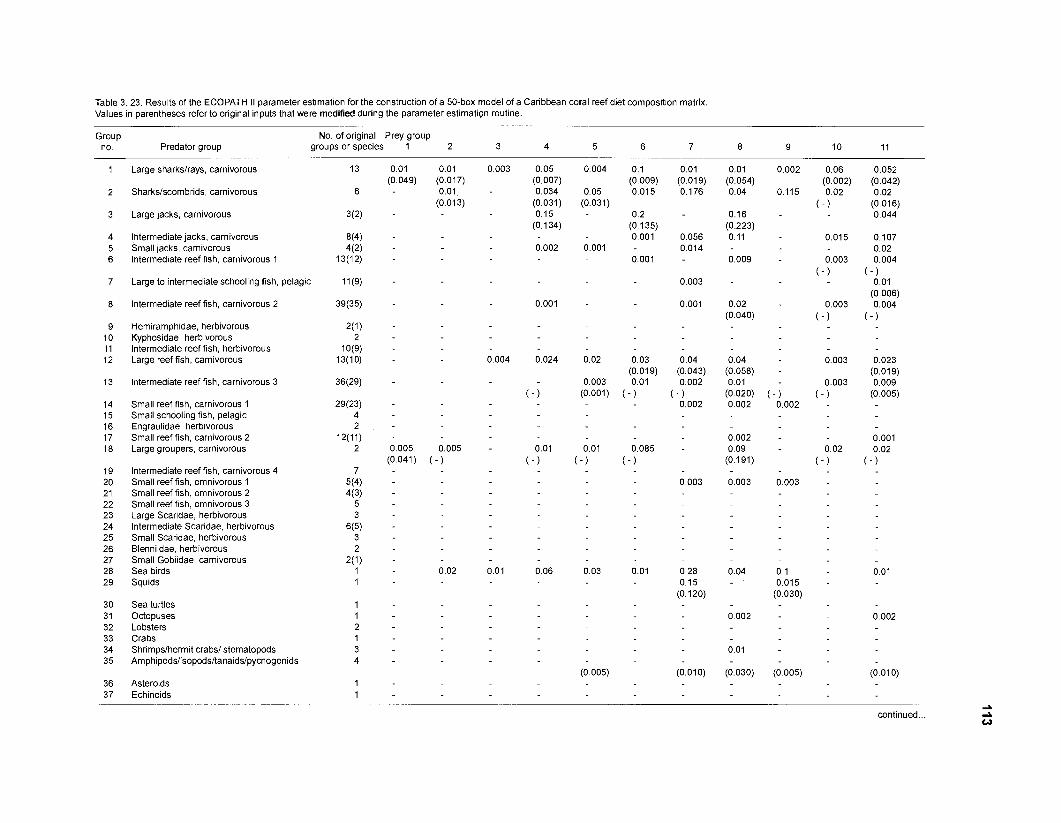
Table 3. 23. Results of the ECOPATH II parameter estimation for the construction of a 50-box model of a Caribbean coral reef diet compositron matrix. Values in parentheses refer to original inputs that were modified during the parameter estimatipn routine.
-
Group no. Predator group
No. of original Prey group groups or species 1 2 3
Large sharkslrays, carnivorous
Sharks/scombrids, carnivorous
Large jacks, carnivorous
lnterrnediate jacks, carnivorous Small jacks, carnivorous Intermediate reef f~sh. carnivorous 1
Large to intermediate schooling fish, pelagic
Intermediate reef fish, carnivorous 2
Hemiramphidae, herbivorous Kyphosidae, herbivorous lntermediate reef fish, herbivorous Large reef fish, carnivorous
lntermediate reef fish, carnlvorous 3
Small reef fish, carnivorous 1 Small schooling fish, pelagic Engraulidae, herbivorous Small reef fish, carnivorous 2 Large groupers, carnlvorous
Intermediate reef fish, carnivorous 4 Small reef fish, omnivorous 1 Small reef fish, omnivorous 2 Small reef fish, omnivorous 3 Large Scar~dae, herbivorous lnterrnediate Scaridae, herbivorous Small Scaridae, herbivorous Blenniidae, herbivorous Small Gobi~dae, carnivorous Sea birds Squids
Sea turtles Octopuses Lobsters Crabs Shrimpslhermit crabs1 stomatopods Amphipodslisopods/tanaidslpycnogonids
Asteroids Echinoids
continued ...
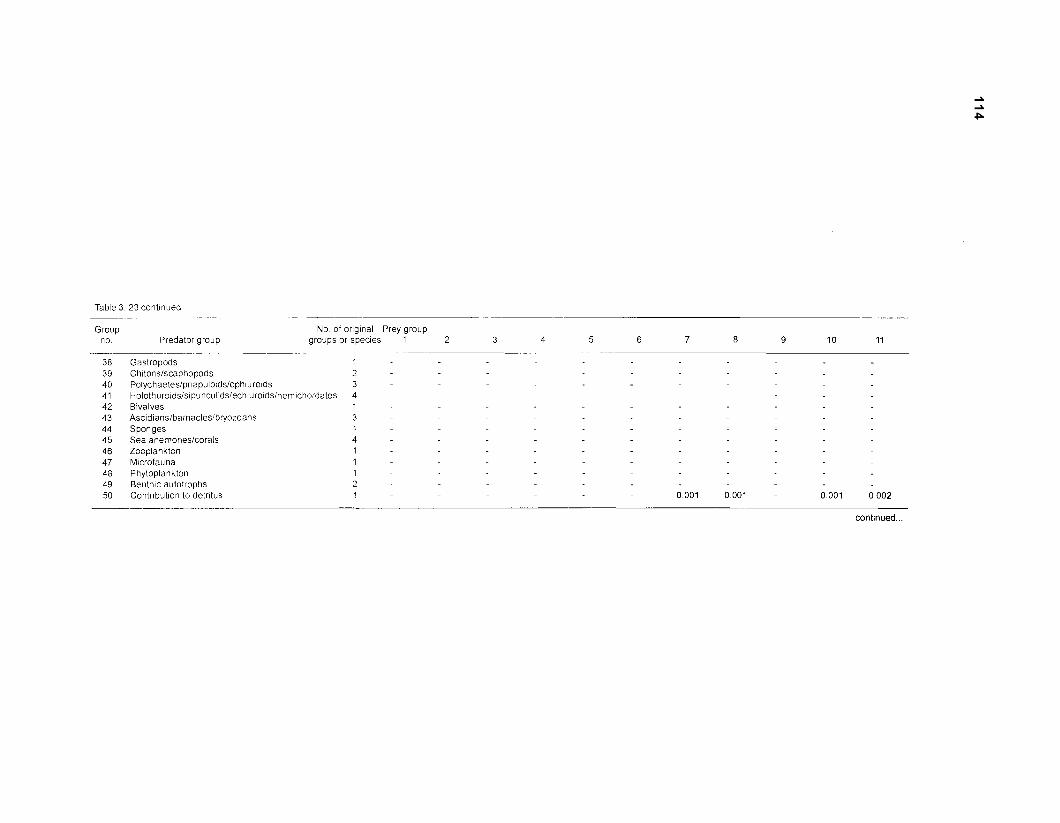
Table 3 23 cont~nued - .. - -- -- - --
Group no Predator group
No of or~glnal Prey group groups or specles 1 2 3 4 5 6 7 8 9 10 11
Gastropods Ch~tonslscaphopods Polychaeteslpr~apuloidsloph~uro~ds Holothuro~dsls~puncuI~dslech~uro~ds/hem~chordates Blvalves Asc~d~anslbarnacleslbryozoans Sponges Sea anemoneslcorals Zooplankton M~crofauna Phytoplankton Benth~c autotrophs Contr~but~on to detr~tus
continued
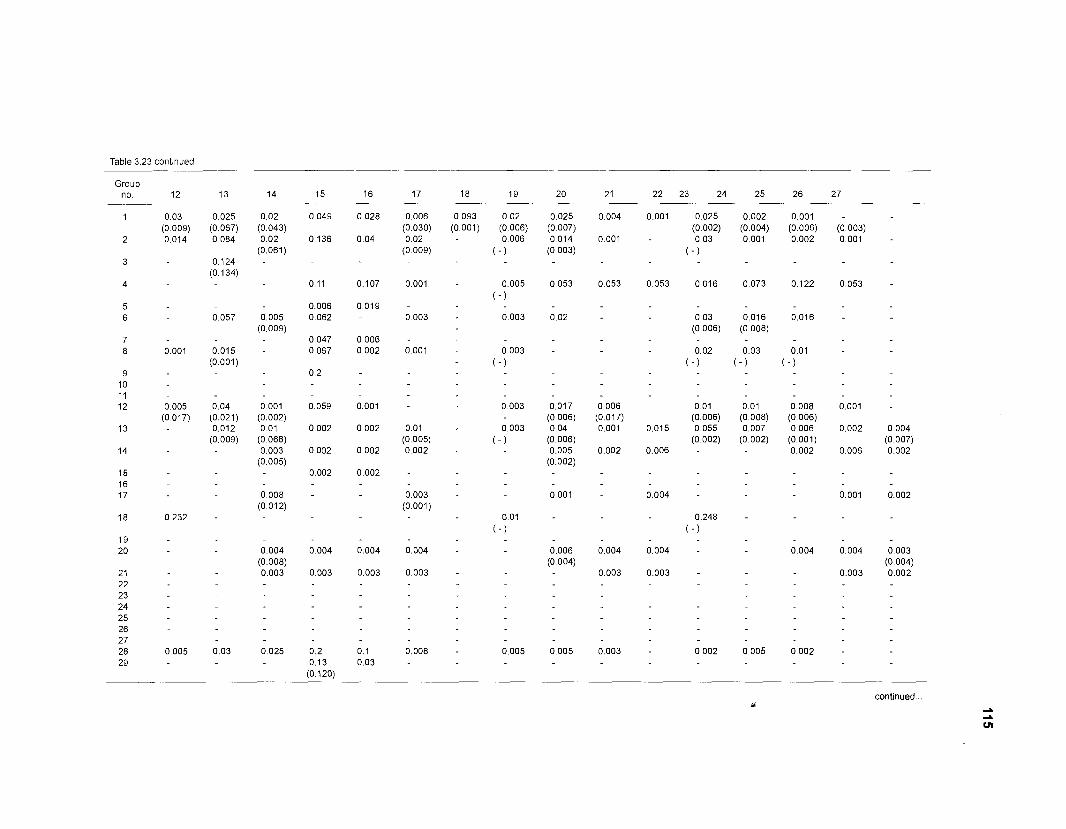
Table 3 23 continued
Group no 12
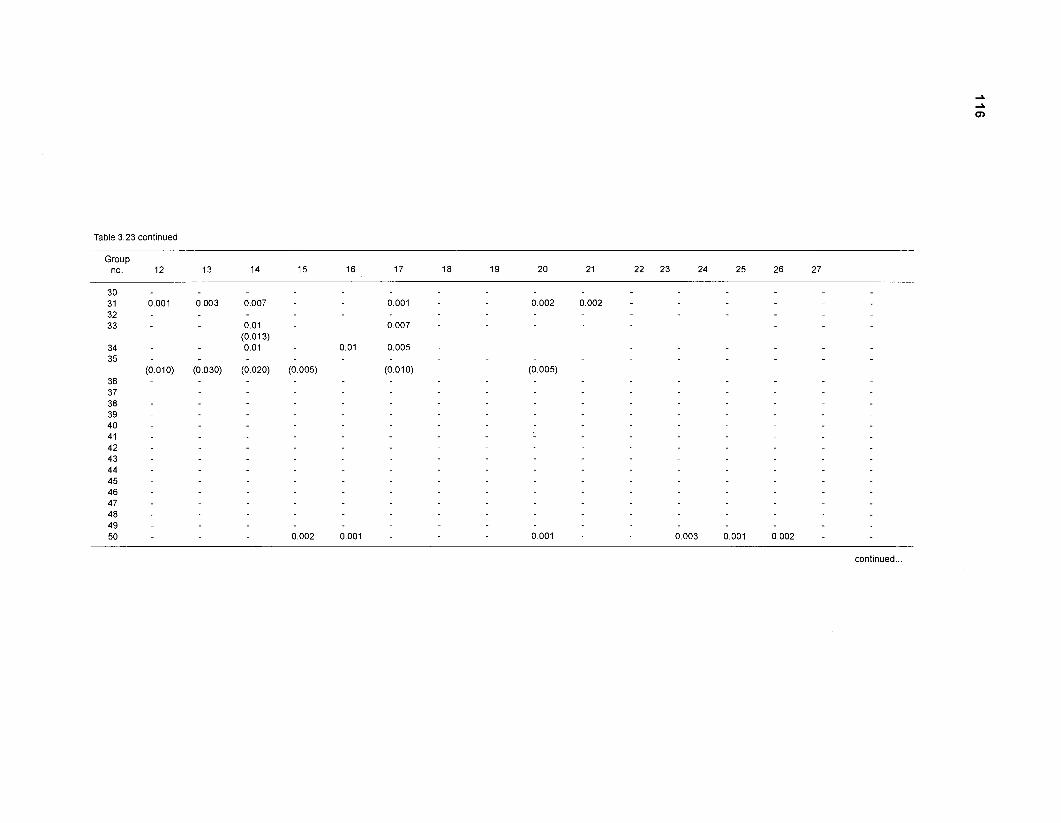
Table 3.23 continued
Group no. 12 13 14 15 16 17 18 19 20 21 22 23 24 25 26 27
continued.
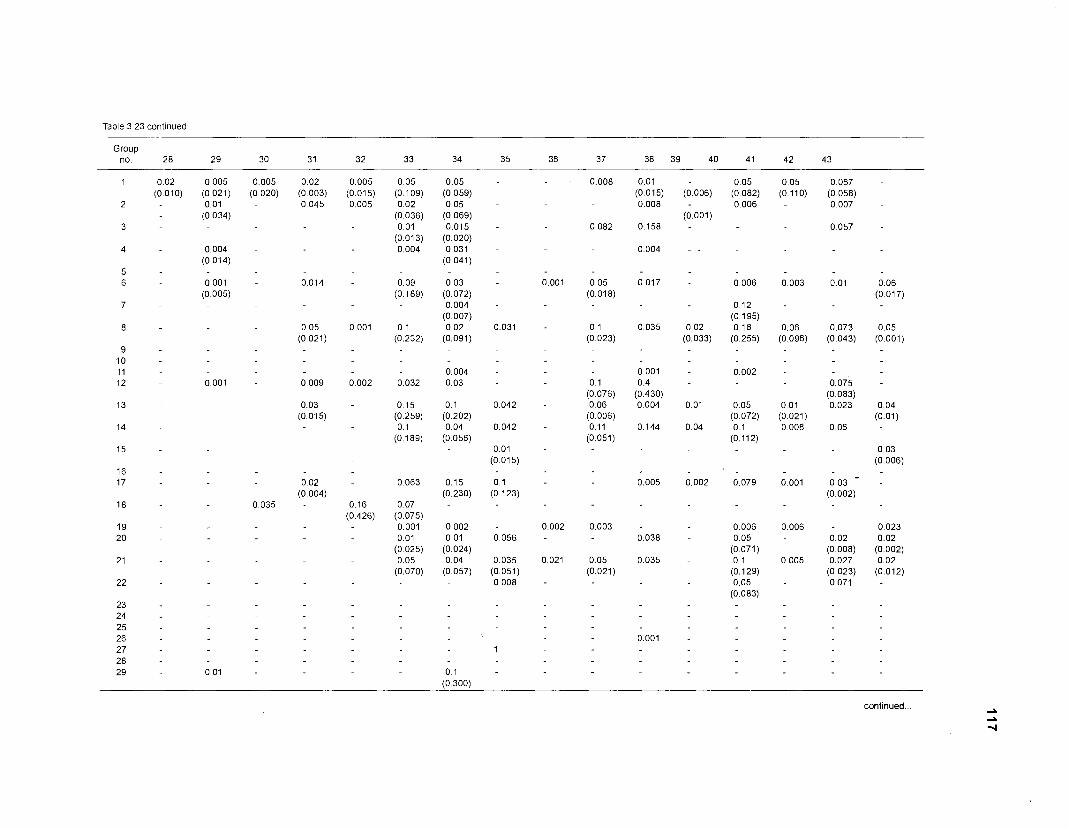
Table 3.23 continued
Group no. 28 29 30 31 32 33 34 35 36 37 38 39 40 41 42 43
continued
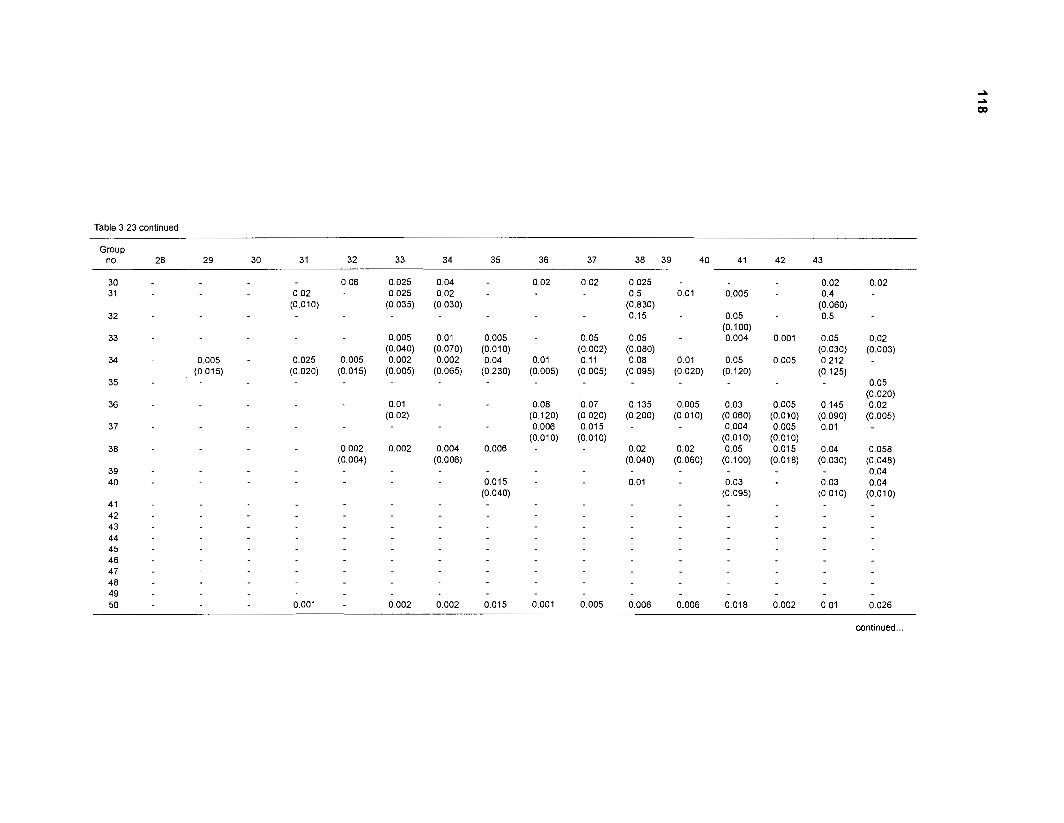
Table 3.23 cont~nued
Group no 28 29 30 31 32 33 34 35 36 37 38 39 40 41 42 43
continued
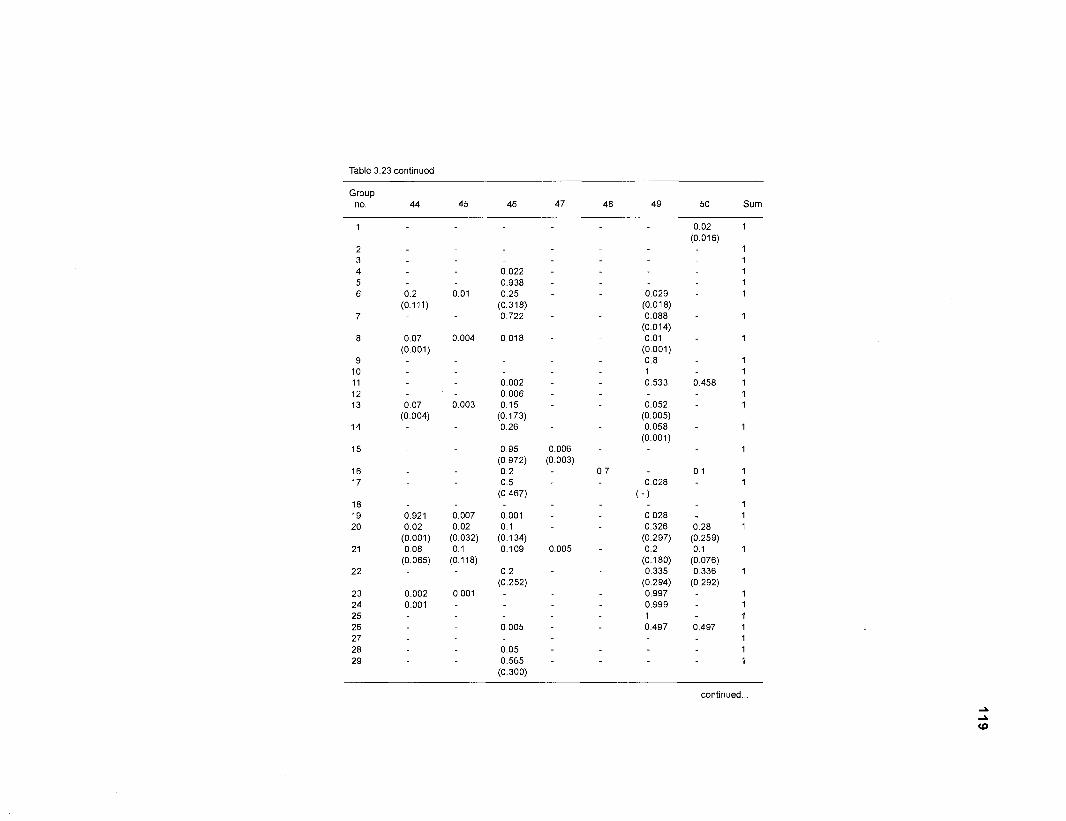
Table 3.23 continued
Group no. 44 45 46 47 48 49 50 Sum
continued
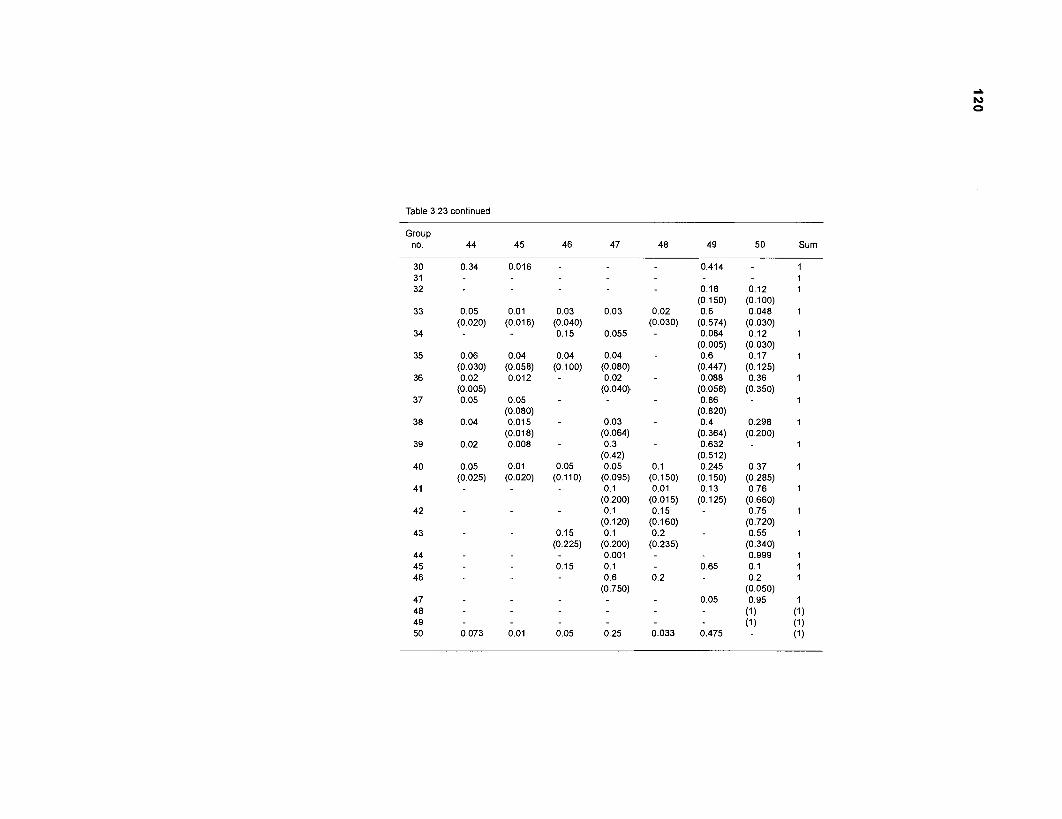
Table 3.23 continued
Group no. 44 45 46 47 48 49 50 Sum
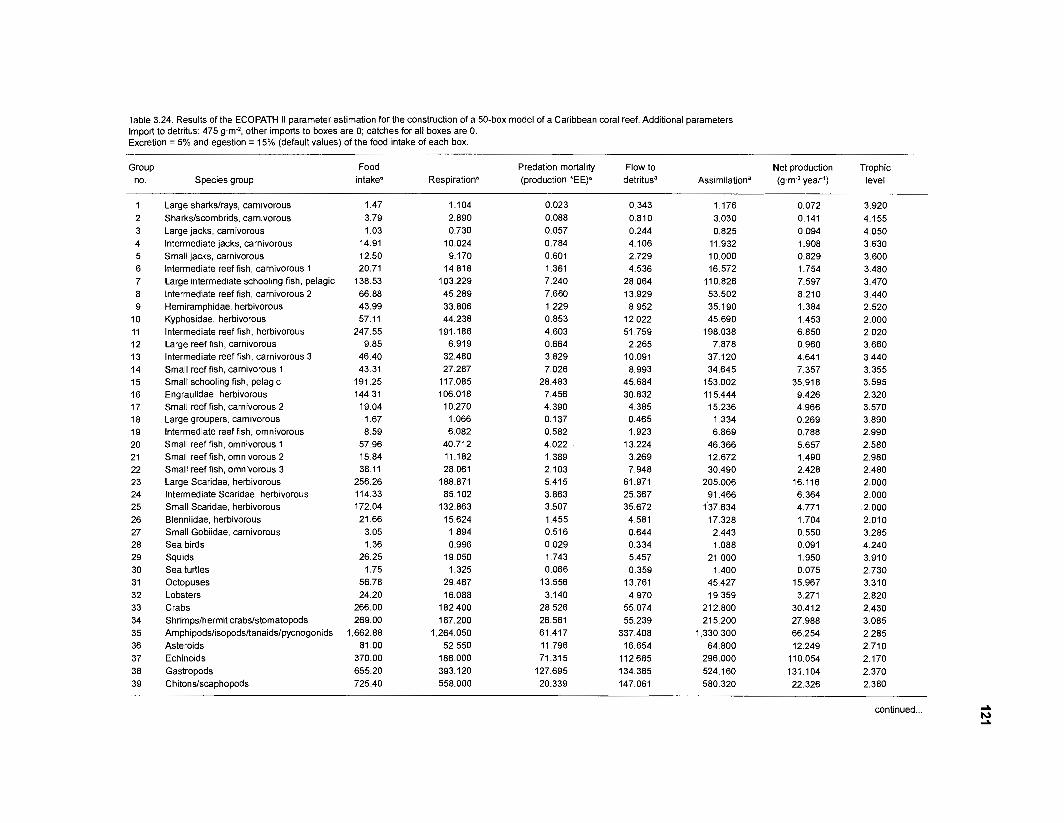
Table 3.24. Results of the ECOPATH II parameter estimation for the construction of a 50-box model of a Caribbean coral reef. Additional parameters. Import to detritus: 475 g m 2 , other imports to boxes are 0; catches for all boxes are 0. Excretion = 5% and egestion = 15% (default values) of the food intake of each box.
Group Species group
- no.
1 2 3 4 5 6 7 8 9
10 11 12 13 14 15 16 17 18 19 20 21 22 23 24 25 26 27 28 29 30 31 32 33 34 35 36 37 38 39
Food Predation mortality Flow to Net production Trophic intakea Respirationa (production 'EE)" detritusa Assimilationa (g.m2.year') level
Large sharkslrays, carnivorous Sharkslscombrids, carnivorous Large jacks, carnivorous lntermediate jacks, carnivorous Small jacks, carnivorous Intermediate reef fish, carnivorous 1 Large intermediate schooling fish, pelagic Intermediate reef fish, carnivorous 2 Hemiramphidae, herbivorous Kyphosidae, herbivorous lntermediate reef fish, herbivorous Large reef fish, carnivorous lntermediate reef fish, carnivorous 3 Small reef fish, carnivorous 1 Small schooling fish, pelag~c Engraulidae, herbivorous Small reef fish, carnivorous 2 Large groupers, carnivorous lntermediate reef f~sh, omnivorous Small reef fish, omnivorous 1 Small reef fish, omnivorous 2 Small reef fish, omnivorous 3 Large Scaridae, herbivorous lntermediate Scaridae, herbivorous Small Scaridae, herbivorous Blenniidae, herbivorous Small Gobiidae, carnivorous Sea birds Squids Sea turtles Octopuses Lobsters Crabs Shrimpslhermit crabslstomatopods Amphipodslisopodsltanaidslpycnogonids Asteroids Echinoids Gastropods Chitonslscaphopods
continued ...
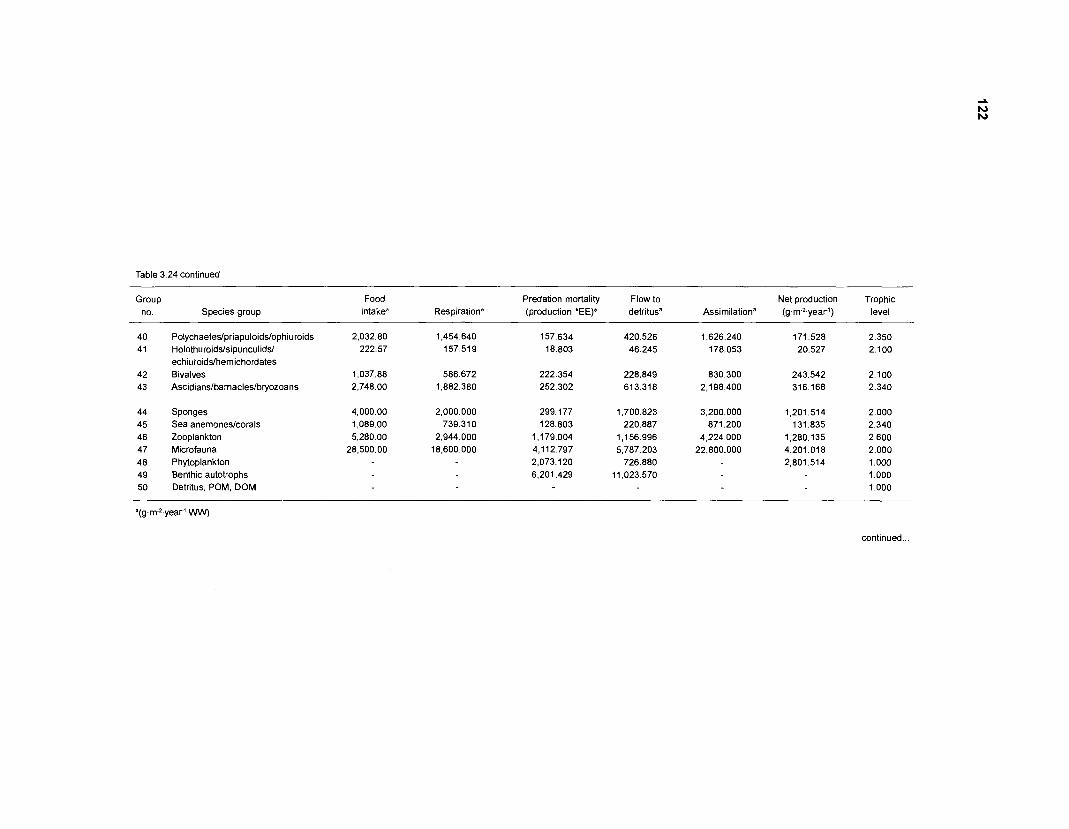
Table 3.24 continued
Group no. Species group
Food Predation mortality Flow to Net production Trophic intakea Respirationa (production *EE)a detritusa Assimilationa (gm2.year') level
Polychaeteslpriapuloidslophiuroids Holothuroidslsipunculidsl
Sponges Sea anernoneslcorals Zooplankton Microfauna Phytoplankton Benthic autotrophs Detritus, POM, DOM
'(gm2.year1 WW).
continued ...
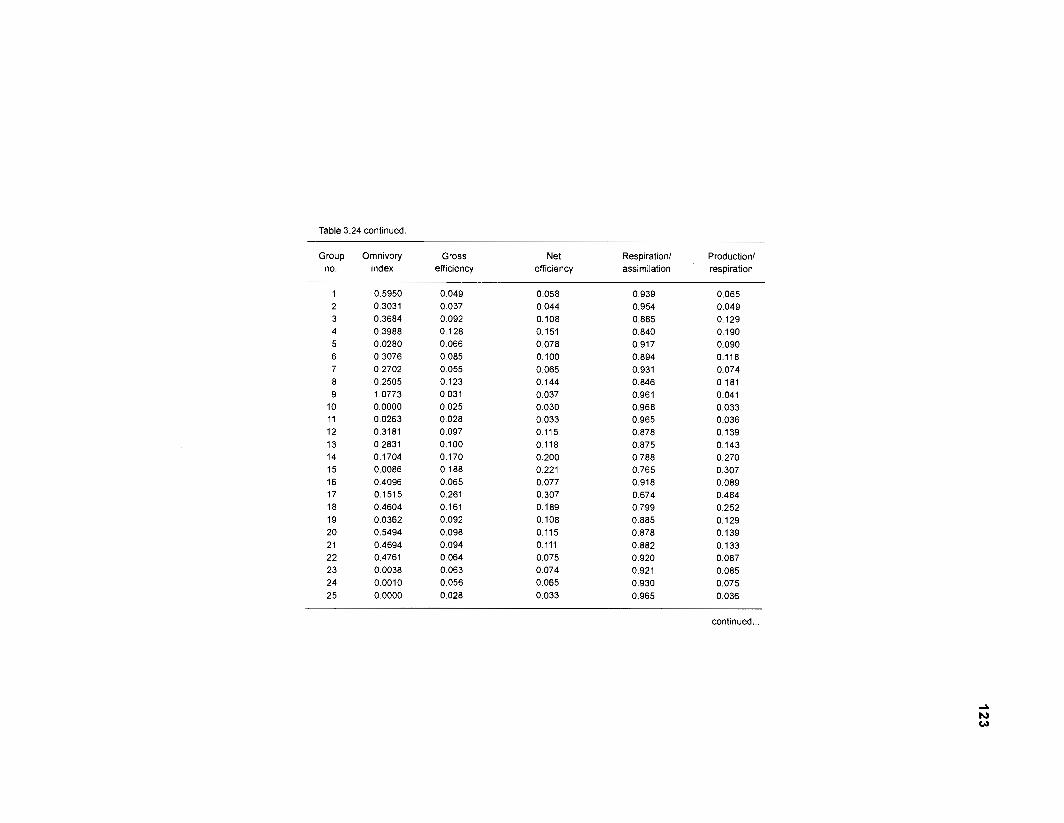
Table 3.24 continued.
Group Omnivory Gross Net Respiration1 Production1 no. index efficiency efficiency assimilation respiration
continued
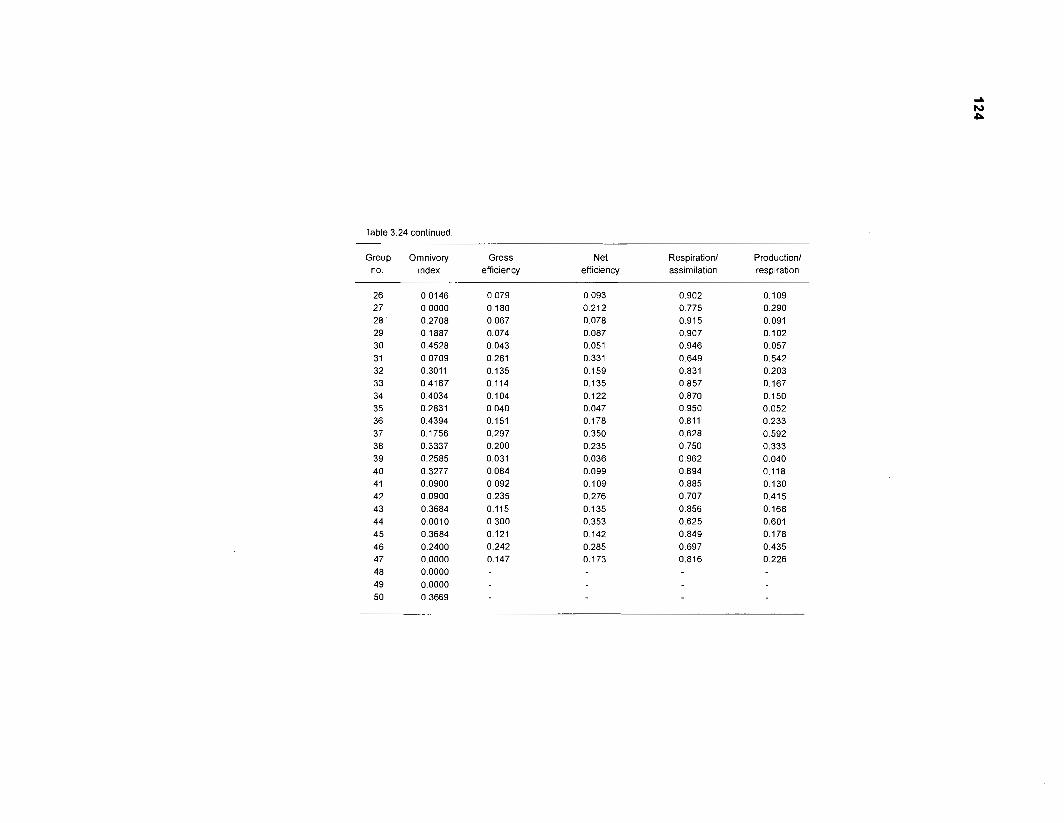
Table 3.24 continued
Group Omnivory Gross Net Respiration1 Production1 no. index efficiency efficiency assimilation respiration
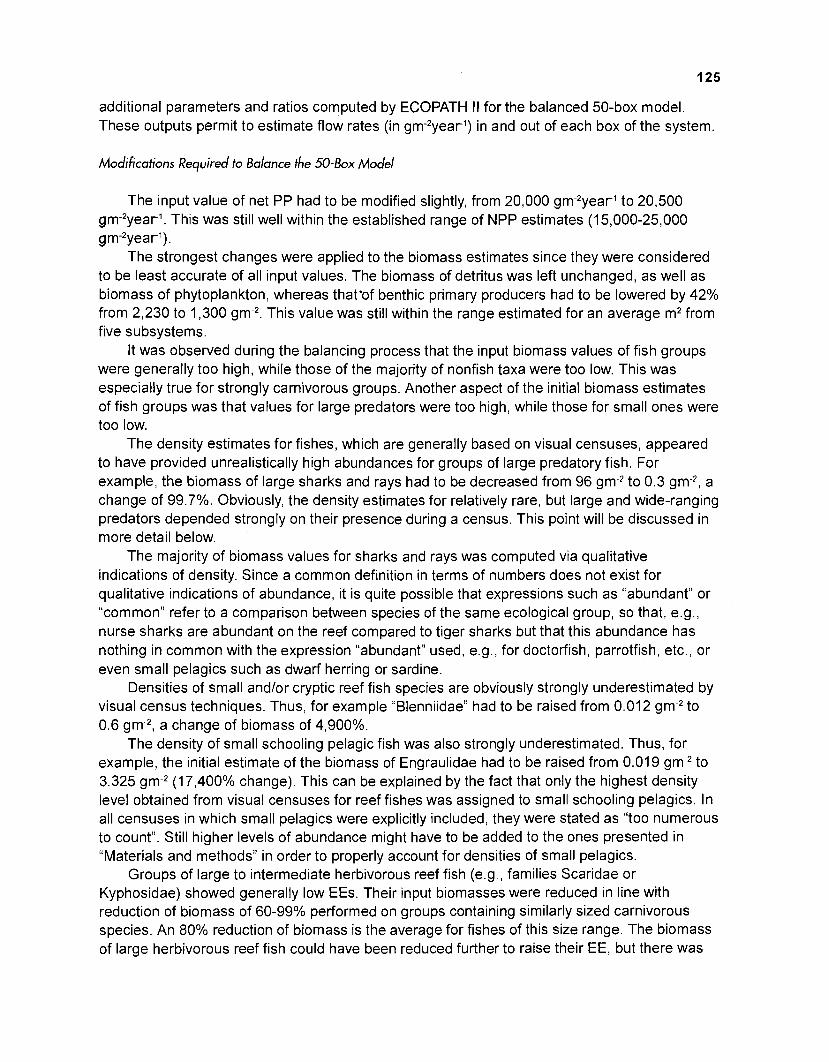
additional parameters and ratios computed by ECOPATH II for the balanced 50-box model. These outputs permit to estimate flow rates (in gm-2year1) in and out of each box of the system.
Modifications Required to BaIance the 50-Box Model
The input value of net PP had to be modified slightly, from 20,000 gm-2year1 to 20,500 gm-2year1. This was still well within the established range of NPP estimates (15,000-25,000 gm-2year1).
The strongest changes were applied to the biomass estimates since they were considered to be least accurate of all input values. The biomass of detritus was left unchanged, as well as biomass of phytoplankton, whereas that'of benthic primary producers had to be lowered by 42% from 2,230 to 1,300 gm-2. This value was still within the range estimated for an average m2 from five subsystems.
It was observed during the balancing process that the input biomass values of fish groups were generally too high, while those of the majority of nonfish taxa were too low. This was especially true for strongly carnivorous groups. Another aspect of the initial biomass estimates of fish groups was that values for large predators were too high, while those for small ones were too low.
The density estimates for fishes, which are generally based on visual censuses, appeared to have provided unrealistically high abundances for groups of large predatory fish. For example, the biomass of large sharks and rays had to be decreased from 96 gm-2 to 0.3 gm-2, a change of 99.7%. Obviously, the density estimates for relatively rare, but large and wide-ranging predators depended strongly on their presence during a census. This point will be discussed in more detail below.
The majority of biomass values for sharks and rays was computed via qualitative indications of density. Since a common definition in terms of numbers does not exist for qualitative indications of abundance, it is quite possible that expressions such as "abundant" or "common" refer to a comparison between species of the same ecological group, so that, e.g., nurse sharks are abundant on the reef compared to tiger sharks but that this abundance has nothing in common with the expression "abundant" used, e.g., for doctorfish, parrotfish, etc., or even small pelagics such as dwarf herring or sardine.
Densities of small andlor cryptic reef fish species are obviously strongly underestimated by visual census techniques. Thus, for example "Blenniidae" had to be raised from 0.012 gm-2 to 0.6 gm-2, a change of biomass of 4,900%.
The density of small schooling pelagic fish was also strongly underestimated. Thus, for example, the initial estimate of the biomass of Engraulidae had to be raised from 0.01 9 gm-2 to 3.325 gm-2 (17,400% change). This can be explained by the fact that only the highest density level obtained from visual censuses for reef fishes was assigned to small schooling pelagics. In all censuses in which small pelagics were explicitly included, they were stated as "too numerous to count". Still higher levels of abundance might have to be added to the ones presented in "Materials and methods" in order to properly account for densities of small pelagics.
Groups of large to intermediate herbivorous reef fish (e.g., families Scaridae or Kyphosidae) showed generally low EEs. Their input biomasses were reduced in line with reduction of biomass of 60-99% performed on groups containing similarly sized carnivorous species. An 80% reduction of biomass is the average for fishes of this size range. The biomass of large herbivorous reef fish could have been reduced further to raise their EE, but there was
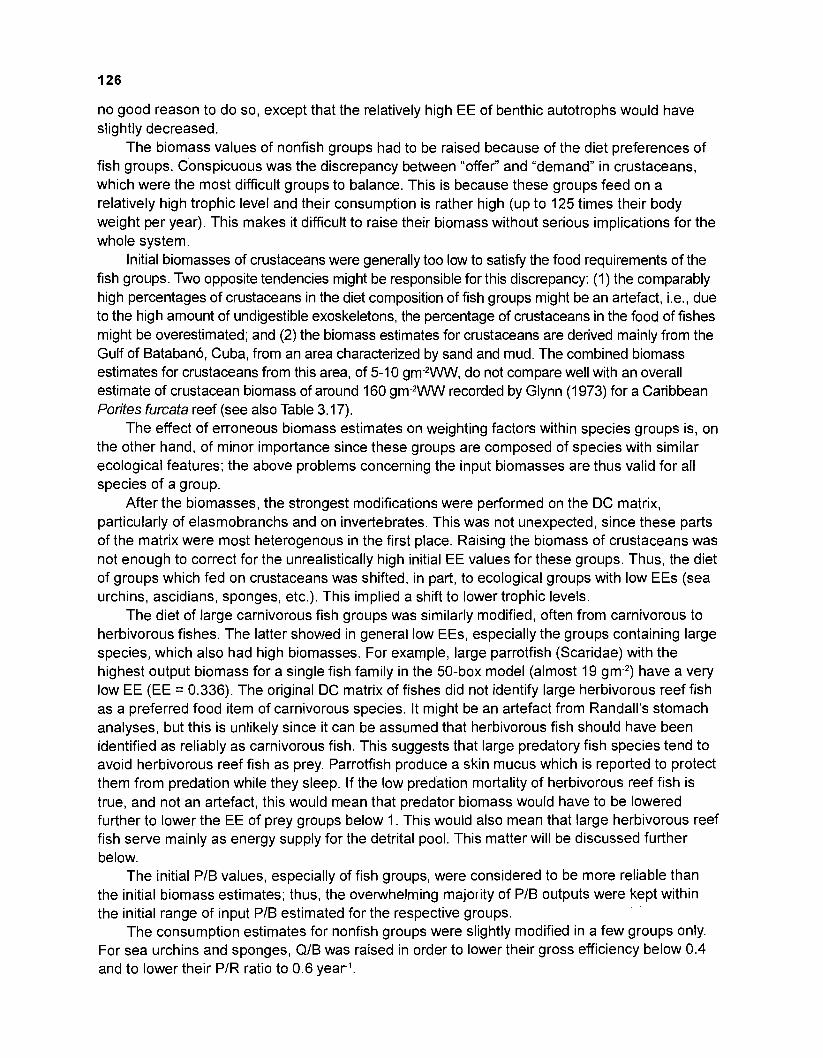
no good reason to do so, except that the relatively high EE of benthic autotrophs would have slightly decreased.
The biomass values of nonfish groups had to be raised because of the diet preferences of fish groups. Conspicuous was the discrepancy between "offer" and "demand" in crustaceans, which were the most difficult groups to balance. This is because these groups feed on a relatively high trophic level and their consumption is rather high (up to 125 times their body weight per year). This makes it difficult to raise their biomass without serious implications for the whole system.
Initial biomasses of crustaceans were generally too low to satisfy the food requirements of the fish groups. Two opposite tendencies might be responsible for this discrepancy: (1) the comparably high percentages of crustaceans in the diet composition of fish groups might be an artefact, i.e., due to the high amount of undigestible exoskeletons, the percentage of crustaceans in the food of fishes might be overestimated; and (2) the biomass estimates for crustaceans are derived mainly from the Gulf of Batabano, Cuba, from an area characterized by sand and mud. The combined biomass estimates for crustaceans from this area, of 5-1 0 gm-2WW, do not compare well with an overall estimate of crustacean biomass of around 160 gm-*WW recorded by Glynn (1 973) for a Caribbean Porites furcata reef (see also Table 3.17).
The effect of erroneous biomass estimates on weighting factors within species groups is, on the other hand, of minor importance since these groups are composed of species with similar ecological features; the above problems concerning the input biomasses are thus valid for all species of a group.
After the biomasses, the strongest modifications were performed on the DC matrix, particularly of elasmobranchs and on invertebrates. This was not unexpected, since these parts of the matrix were most heterogenous in the first place. Raising the biomass of crustaceans was not enough to correct for the unrealistically high initial EE values for these groups. Thus, the diet of groups which fed on crustaceans was shifted, in part, to ecological groups with low EEs (sea urchins, ascidians, sponges, etc.). This implied a shift to lower trophic levels.
The diet of large carnivorous fish groups was similarly modified, often from carnivorous to herbivorous fishes. The latter showed in general low EEs, especially the groups containing large species, which also had high biomasses. For example, large parrotfish (Scaridae) with the highest output biomass for a single fish family in the 50-box model (almost 19 gm-2) have a very low EE (EE = 0.336). The original DC matrix of fishes did not identify large herbivorous reef fish as a preferred food item of carnivorous species. It might be an artefact from Randall's stomach analyses, but this is unlikely since it can be assumed that herbivorous fish should have been identified as reliably as carnivorous fish. This suggests that large predatory fish species tend to avoid herbivorous reef fish as prey. Parrotfish produce a skin mucus which is reported to protect them from predation while they sleep. If the low predation mortality of herbivorous reef fish is true, and not an artefact, this would mean that predator biomass would have to be lowered further to lower the EE of prey groups below 1. This would also mean that large herbivorous reef fish serve mainly as energy supply for the detrital pool. This matter will be discussed further below.
The initial PIB values, especially of fish groups, were considered to be more reliable than the initial biomass estimates; thus, the overwhelming majority of PIB outputs were kept within the initial range of input PIB estimated for the respective groups.
The consumption estimates for nonfish groups were slightly modified in a few groups only. For sea urchins and sponges, QIB was raised in order to lower their gross efficiency below 0.4 and to lower their PIR ratio to 0.6 year1.
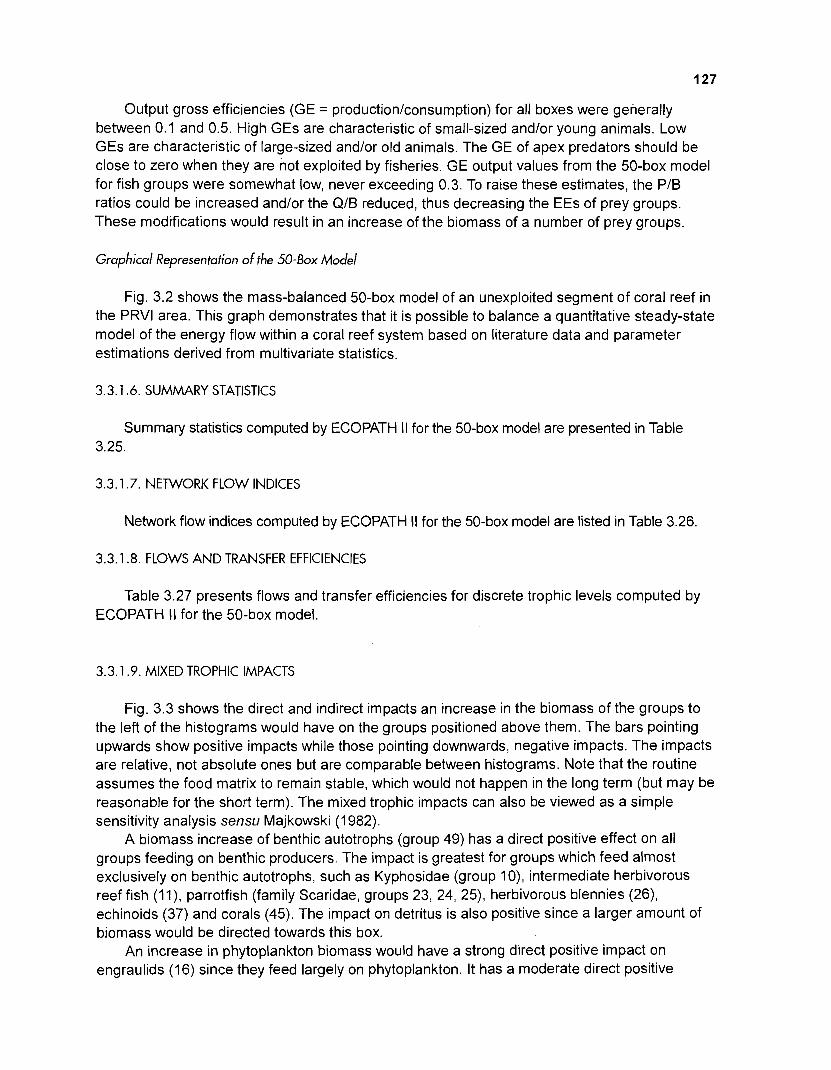
Output gross efficiencies (GE = production/consumption) for all boxes were generally between 0.1 and 0.5. High GEs are characteristic of small-sized and/or young animals. Low GEs are characteristic of large-sized and/or old animals. The GE of apex predators should be close to zero when they are not exploited by fisheries. GE output values from the 50-box model for fish groups were somewhat low, never exceeding 0.3. To raise these estimates, the PIB ratios could be increased and/or the Q/B reduced, thus decreasing the EEs of prey groups. These modifications would result in an increase of the biomass of a number of prey groups.
Graphical Representation of the 50-Box Model
Fig. 3.2 shows the mass-balanced 50-box model of an unexploited segment of coral reef in the PRVl area. This graph demonstrates that it is possible to balance a quantitative steady-state model of the energy flow within a coral reef system based on literature data and parameter estimations derived from multivariate statistics.
3.3.1.6. SUMMARY STATISTICS
Summary statistics computed by ECOPATH II for the 50-box model are presented in Table 3.25.
3.3.1.7. NETWORK FLOW INDICES
Network flow indices computed by ECOPATH II for the 50-box model are listed in Table 3.26.
3.3.1.8. FLOWS AND TRANSFER EFFICIENCIES
Table 3.27 presents flows and transfer efficiencies for discrete trophic levels computed by ECOPATH II for the 50-box model.
3.3.1.9. MIXED TROPHIC IMPACTS
Fig. 3.3 shows the direct and indirect impacts an increase in the biomass of the groups to the left of the histograms would have on the groups positioned above them. The bars pointing upwards show positive impacts while those pointing downwards, negative impacts. The impacts are relative, not absolute ones but are comparable between histograms. Note that the routine assumes the food matrix to remain stable, which would not happen in the long term (but may be reasonable for the short term). The mixed trophic impacts can also be viewed as a simple sensitivity analysis sensu Majkowski (1 982).
A biomass increase of benthic autotrophs (group 49) has a direct positive effect on all groups feeding on benthic producers. The impact is greatest for groups which feed almost exclusively on benthic autotrophs, such as Kyphosidae (group 1 O), intermediate herbivorous reef fish ( I I ) , parrotfish (family Scaridae, groups 23, 24, 25), herbivorous blennies (26), echinoids (37) and corals (45). The impact on detritus is also positive since a larger amount of biomass would be directed towards this box.
An increase in phytoplankton biomass would have a strong direct positive impact on engraulids (16) since they feed largely on phytoplankton. It has a moderate direct positive
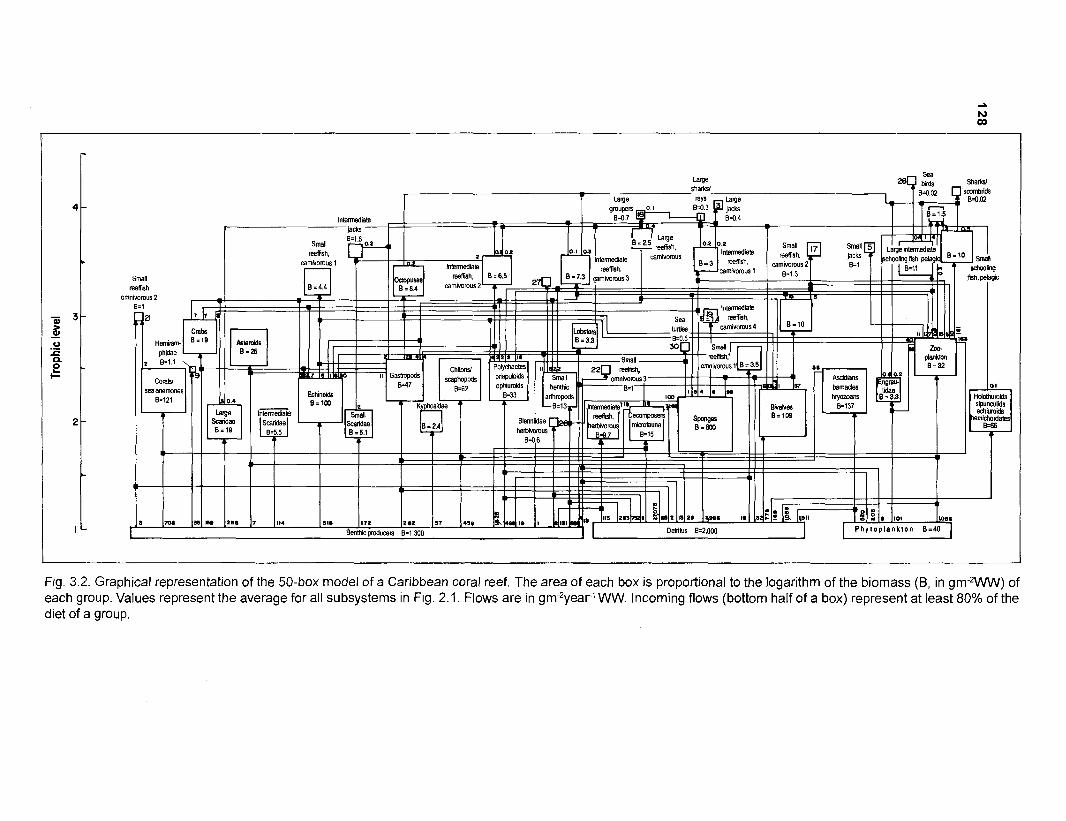
Small reefkh
Sea 2 8 0 hid. Sharks1
fish. pelagic
Fig. 3.2. Graphical representation of the 50-box model of a Caribbean coral reef. The area of each box is proportional to the logarithm of the biomass (B, in S ~ - ~ W W ) of each group. Values represent the average for all subsystems in Fig. 2.1. Flows are in gm-2year1 WW. Incoming flows (bottom half of a box) represent at least 80% of the diet of a group.
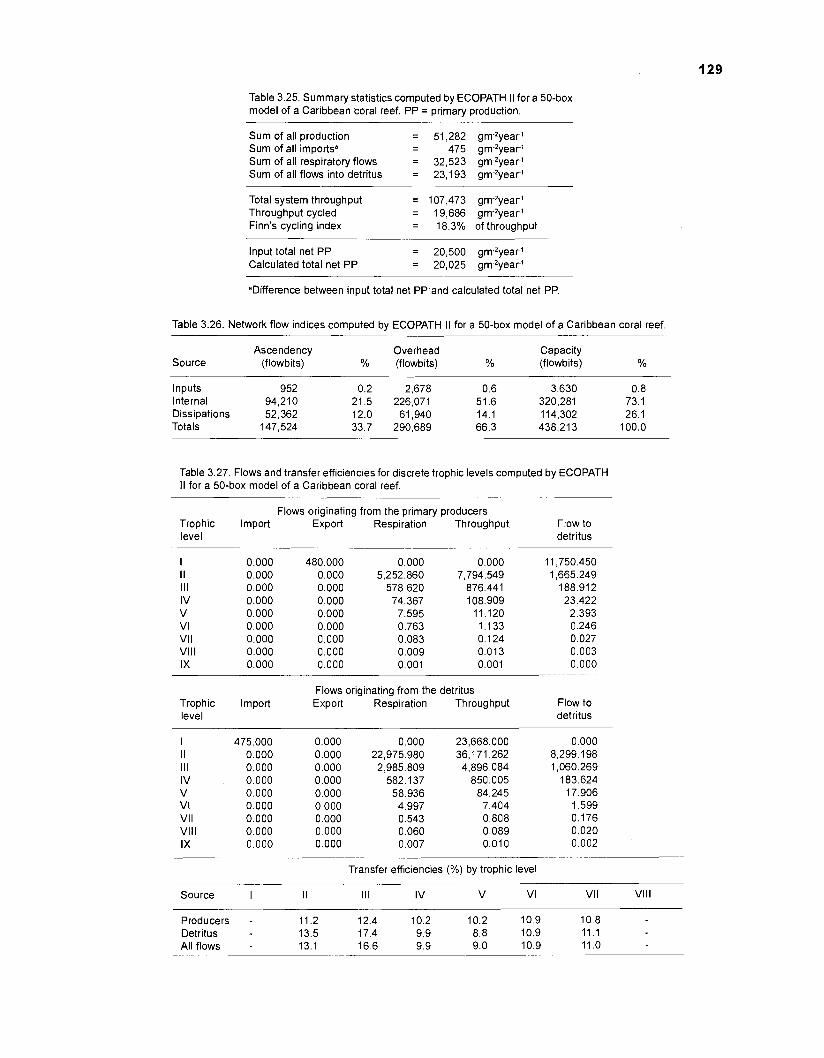
Table 3.25. Summary statistics computed by ECOPATH II for a 50-box model of a Caribbean coral reef. PP = primary production.
Sum of all production = 51,282 gm-zyearl Sum of all importsa = 475 gm-zyearl Sum of all respiratory flows = 32,523 gm2year1 Sum of all flows into detritus = 23,193 gm-2year1
Total system throughput = 107,473 gm-2yearl Throughput cycled = 19,686 gm-2year1 Finn's cycling index = 18.3% of throughput
Input total net PP = 20,500 gm-2year1 Calculated total net PP = 20,025 gm-2year1
"Difference between input total net PP and calculated total net PP.
Table 3.26. Network flow indices computed by ECOPATH II for a 50-box model of a Caribbean coral reef.
Ascendency Overhead Capacity Source (flowbits) % (flowbits) YO (flowbits) YO
Inputs 952 0.2 2,678 0.6 3,630 0.8 Internal 94,210 21.5 226,071 51.6 320,281 73.1 Dissipations 52,362 12.0 61,940 14.1 114,302 26.1 Totals 147,524 33.7 290,689 66.3 438,213 100.0
Table 3.27. Flows and transfer efficiencies for discrete trophic levels computed by ECOPATH II for a 50-box model of a Caribbean coral reef.
Flows originating from the primary producers Trophic Import Export Respiration Throughput Flow to level detritus
I II 111 IV v VI VI I Vlll IX
Trophic level
Import
I I I Ill IV v VI VI I Vlll IX
Flows originating from the detritus Export Respiration Throughput Flow to
detritus
0.000 8,299.1 98 1,060.269
183.624 17.906
1.599 0.176 0.020 0.002
Transfer efficiencies (%) by trophic level
Source I I I 111 IV V VI VI I Vlll
Producers - 11.2 12.4 10.2 10.2 10.9 10.8 Detritus - 13.5 17.4 9.9 8.8 10.9 11.1 All flows - 13.1 16.6 9.9 9.0 10.9 11.0
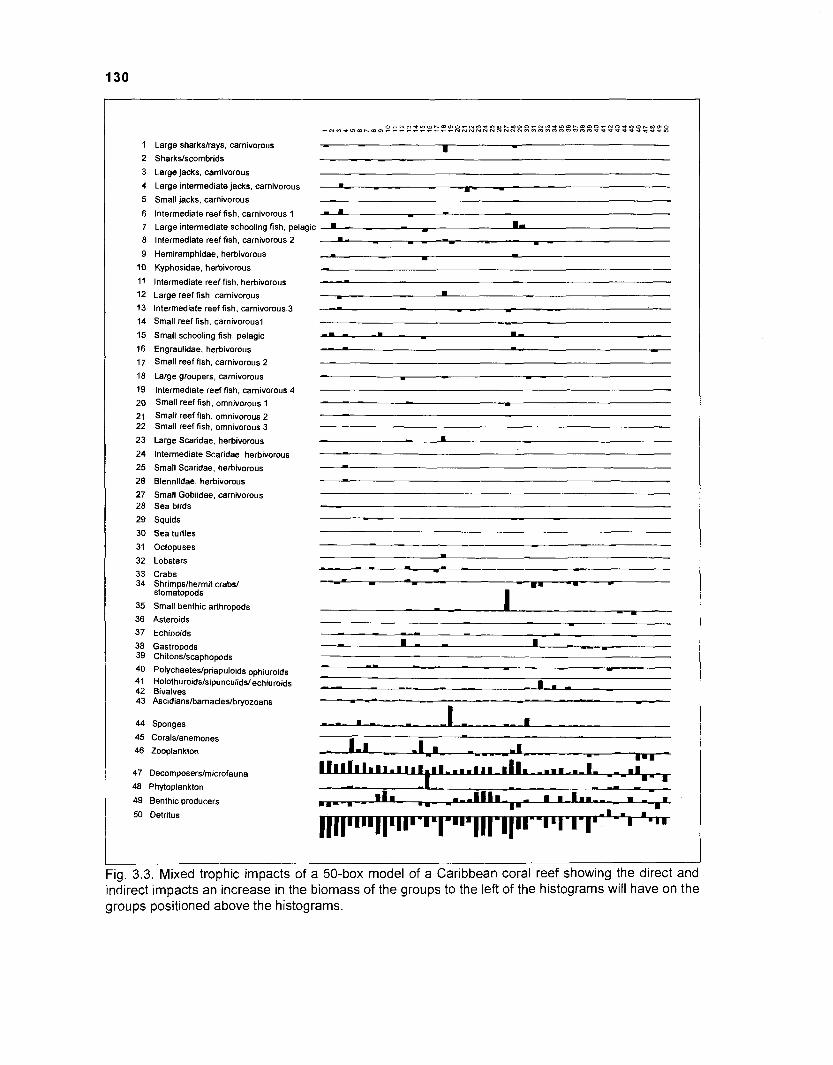
- , , , , , , , , ~ ~ Z Z Z 2 Z % X R R X W W C ; W I ~ 6 W ~ 5 ~ W % W % S & 2 ~ ~ % ~ % % ~ ~
1 Large sharkslrays, carnivorous I - 2 Sharkslscombrids
3 Large jacks, carnivorous
4 Large intermediate jacks, carnivorous I - -- 5 Small jacks, carnivorous - 6 lntermediate reef fish, carnivorous 1 - - 7 Large intermediate schooling fish, pelagic . I I- 8 lntermediate reef fish, carnivorous 2
9 Hemiramphidae, herbivorous
10 Kyphosidae, herbivorous
11 lntermediate reef fish, herbivorous
12 Large reef fish, carnivorous
13 lntermediate reef fish, carnivorous 3
14 Small reef fish, carnivorous1
15 Small schooling fish, pelagic
16 Engraulidae, herbivorous
17 Small reef fish, carnivorous 2
18 Large groupers, carnivorous
19 lntermediate reef fish, carnivorous 4
20 Small reef fish, omnivorous 1
21 Small reef fish, omnivorous 2 22 Small reef fish, omnivorous 3
23 Large Scaridae, herbivorous
24 Intermediate Scaridae, herbivorous
25 Small Scaridae, herbivorous
26 Blenniidae, herbivorous
27 Small Gobiidae, carnivorous 28 Sea birds
29 Squids
30 Sea turtles
31 Octopuses
32 Lobsters
33 Crabs 34 Shrimpslhermit crabs1
stomatopods
35 Small benthic arthropods
36 Asteroids
37 Echinoids
38 Gastrooods 39 Chitonslscaphopods
40 Polychaeteslpriapuloids ophiuroids 41 Holothuroidslsipunculidslechiuroids 42 Bivalves 43 Ascidianslbarnacleslbryozoans
44 Sponges
45 Coralslanemones
46 Zooplankton
47 Decomposerslmicrofauna
48 Phytoplankton
49 Benthic producers
50 Detritus
Fig. 3.3. Mixed trophic impacts of a 50-box model of a Caribbean coral reef showing the direct and indirect impacts an increase in the biomass of the groups to the left of the histograms will have on the groups positioned above the histograms.
impact on bivalves (42), ascidians, barnacles and bryozoans (43) and zooplankton (46) since these groups feed to some extent on phytoplankton. A slight indirect positive impact is observed for groups feeding on groups which feed on phytoplankton, such as sharks and scombrids, which feed on phytoplanktivorous engraulids.
An increase in biomass of decomposers/microfauna (group 47) has a large indirect positive impact on almost all other groups (recall the analogy with the system's motor), except for a small indirect negative impact on groups, which feed to a large extent on detritus. These groups may be regarded as competitors for the same food source since group 47 feeds almost exclusively on detritus. Therefore an increase of decomposers/microfauna biomass would have a direct negative impact on the detritus box.
Increasing the biomass of the apex predators (birds, sharks, scombrids, large jacks and groupers) would have a relatively small negative impact on their prey groups. This is due to the small biomass of these groups combined with moderate relative food requirements. An increase in the biomass of apex predators would have a slight direct positive effect on groups which themselves feed, albeit, to a small extent on these predators, such as the seabirds.
Overall, an increase in biomass of a given group has a direct negative impact on its prey groups and an indirect negative impact on groups competing for the same food source. Further, such increase has a direct positive impact on the predators of that group and an indirect positive impact on groups feeding, in turn, on those predators.
3.3.2. Comparison of Models Based on Two Methods of Aggregation
3.3.2.1. FURTHER AGGREGATION OF FISH GROUPS BY CLUSTER ANALYSIS
The results of the cluster analysis used to pass from 29 to 1 fish species group are depicted in Fig. 3.1.
The strong separation of herbivores and carnivores is maintained up to a cutoff level of 80% (QED 1.2). The strongest separation between large and fast-swimming apex predators and the vast majority of reef fish is maintained up to a cutoff level of 99.9% (QED 1.49). The reef fish fauna is thus characterized by three principal energetic groups: (1) the large and fast-swimming apex predators with a predominantly pelagic habitat and wide-ranging migrations (exceptions are not well identified due to set values used here for the aspect ratios of sharks and rays; some of them, especially rays and the nurse shark, probably belong to the large reef fishes); (2) the predominantly carnivorous; and (3) the predominantly herbivorous reef fishes. (The omnivores were pooled with either group depending on the percentage of plant or animal food in their diet).
3.3.2.2. AGGREGATION BY THE ECOPATH II AGGREGATION ROUTINE
Fig. 3.4 shows the results of the ECOPATH II aggregation routine which allowed a stepwise reduction of the number of boxes from 50 to 1. Species groups with a similar trophic level were aggregated first as in the case of the strictly herbivorous fish groups and the strictly carnivorous groups which belong largely to the apex predators; within each trophic set, groups with a low biomass were aggregated first in order to reduce ascendency as little as possible. It may also be observed from Fig. 3.4 that the aggregation routine tends to form two main trophic groups by combining groups with a similar trophic level: one carnivorous and one herbivorous. This tendency becomes more obvious when the number of boxes is further reduced. Due to their
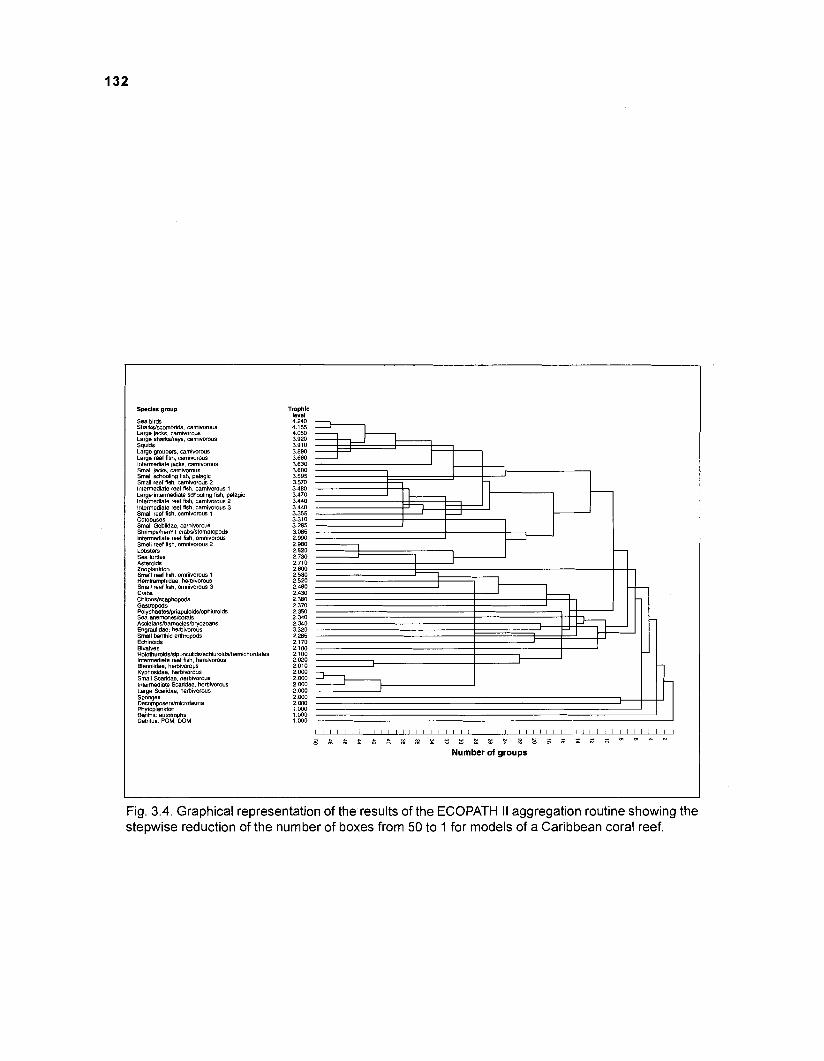
Sea blrds Sha&dscombrids, camlwrous Large jacks, carnivorous Large shaiWrays, camiwrous Ssuids Large grwpen camworms Large rest fisn cam vor0.r ntermed ate lacks camrvorws Sma face, camovoroJs Sma. K h m ng l sh pelag c Small reef fish carnworodS 2 Interneeate reef bsn cam voro~s 1 a rgs onlermedmle schm ng tlrh peaglc lnferneaale reef fish cam vorous 2 InlermedP1e reef fish, cam vOmbS 3 Sma reef lsh cam .oro.s 1
Lobsters Sea tunles Asteroids Zooplankton Small reef hsh, omnlvomus 1 HemlramDhldae hehiuorous Small red hhsh, omnivorous 3 Crabs ChitOnsAcaphOpOdS Gasvopodo Polychaetedpdapulo~ds/ophoroids Sea anemoneslmals I\Jcidians~bamacleSm'yOzoans Engraulidae, hehlwrous Small benthic admpods Echinoids Bivalves Holothuro~ddsipunculiddech~umiddhemich~ Intermediate reef fish, hehworous Blennadae, hehivomus Kyphosldae, helvorous Small Scaddae, herbivorous Intermediate Scandae, herbivorous Large Scaddae, hsrb~vorous Sponges Decomposerslm~crofauna Phytoplankton Bwmic autotrophs Detritus, POM, DOM
Fig. 3.4. Graphical representation of the results of the ECOPATH II aggregation routine showing the stepwise reduction of the number of boxes from 50 to 1 for models of a Caribbean coral reef.
high biomass and/or degree of detritivory, sponges and microfauna are kept as single groups until the system is reduced to 8 boxes.
Benthic producers and detritus are also kept separate until the system is reduced to a minimum number of boxes (5, 3 and 1). This dendrogram cannot be compared directly with the results of the cluster analysis, since the latter was applied exclusively to fish species. Nevertheless, it should be noticed that both figures show a separation into main trophic groups (recall the separation into herbivorous and carnivorous reef fish groups which was maintained up to a cutoff level of 80% in Fig. 3.1). The separation into large apex predators with a mainly pelagic habitat and reef fish with a demersal habitat was not repeated by the ECOPATH II aggregation routine.
3.3.2.3. THE 20-BOX MODELS
Method 1 : Cluster Analysis + Intuition
COMPOSITION OF GROUPS. Table 3.28 shows the composition of groups for the first of the two 20-box models. As pointed out in "Materials and methods", the group composition resulted from an aggregation of fish species by cluster analysis and "intuitive guesswork" for the nonfish groups based on the criteria relative to DC, body size and lifestyle.
In contrast to the 50-box model, some of the boxes of the 20-box model include both fish and nonfish groups: groups are now classified by a combination of diet, size and lifestyle, leaving apart the separation into fish and nonfish. This is a first step away from taxonomics, toward a purely energetic approach (within the fish community, steps in this direction were taken by combining species and groups with similar energy requirements, also irrespective of taxonomics).
PARAMETER ESTIMATION. The condensed input values for the key parameters and the inputs for the DC matrix may be found in Tables 3.29 and 3.30, respectively. Output values are the same as input values with one exception referring to box 8, small benthic carnivores. In the 50- box model, due to their low biomass (1.3 gm-*), the sea anemones were merged with the corals, even though they are fully heterotrophic (feeding mainly on zooplankton). Within the 20-box model, they were merged with small benthic carnivores. Their excessive predation mortality was shifted to benthic autotrophs; this was unproblematic since the predators of sea anemones include omnivorous and herbivorous groups. Therefore, the EE of benthic autotrophs (box 19) increased from 0.360 to 0.362, while the EE of "corals" decreased from 0.977 in the 50-box model to 0.71 3 in the 20-box model.
Table 3.31 presents additional parameters and ratios computed by ECOPATH II. These parameter estimates allow, as already mentioned for the 50-box model, computation of the energy balance, following the "master equation", of each box of the system.
Fig. 3.5 presents the 20-box model of an unexploited segment of the PRVl coral reefs system, aggregated following method 1 (see above).
SYSTEM PROPERTIES. System properties, such as summary statistics, network flow indices, flows and transfer efficiencies and mixed trophic impacts, were estimated by ECOPATH II for the 20-box model as obtained by method 1. The results showed only negligible differences in relation to the 50-box model. Summary statistics, network flow indices and flows for the 20-box model, obtained by method I , are listed in Appendix Tables 8.9.1 to 8.9.3. Table 3.32 presents the transfer efficiencies between discrete trophic levels.
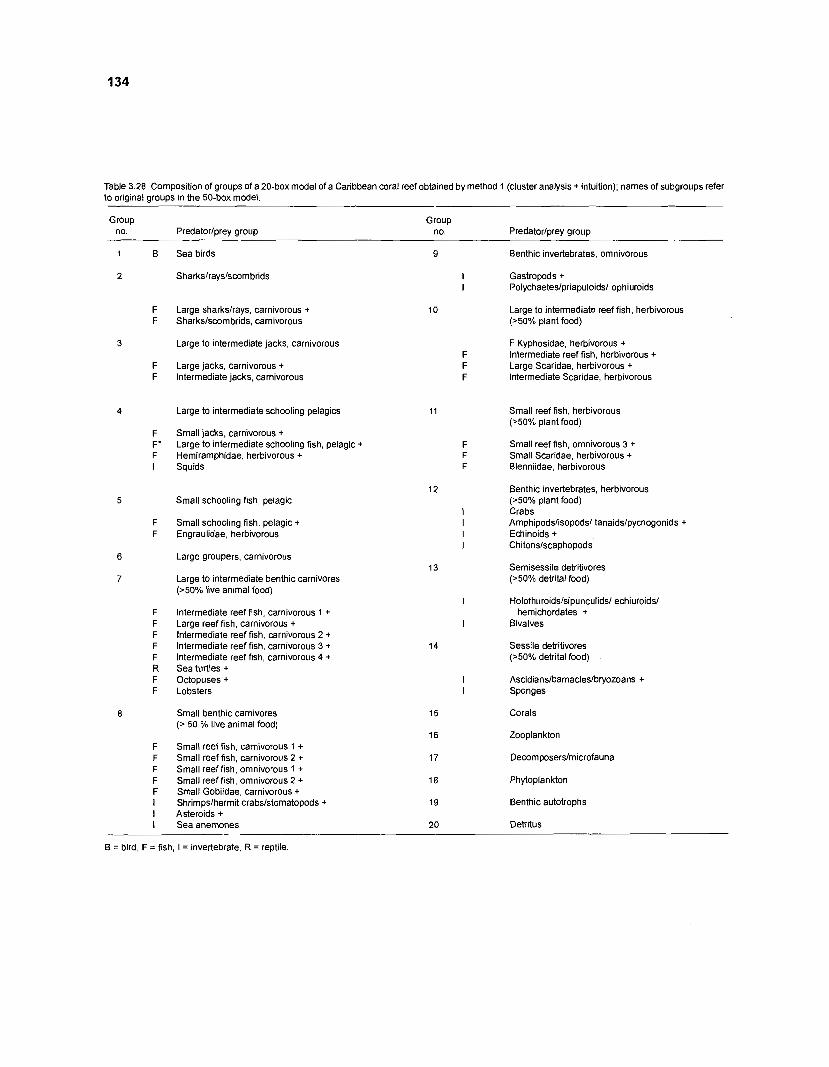
Table 3.28. Composition of groups of a 20-box model of a Caribbean coral reef obtained by method 1 (cluster analysis + intuition); names of subgroups refer to orioinal orouDs in the 50-box model.
Group Group no. Predatorlprey group no. Predatorlprey group
1 B Sea birds 9 Benthic invertebrates, omnivorous
2 Sharkslrayslscombrids I Gastropods +
I Polychaeteslpriapuloidsl ophiuroids
F Large sharkslrays, carnivorous + F Sharkslscombrids, carnivorous
Large to intermediate reef fish, herbivorous (>50% plant food)
Large to intermediate jacks, carnivorous F Kyphosidae, herbivorous + F Intermediate reef fish, herbivorous + F Large Scaridae, herbivorous + F Intermediate Scaridae, herbivorous
F Large jacks, carnivorous + F lntermediate jacks, carnivorous
Large to intermediate schooling pelagics Small reef fish, herbivorous ( ~ 5 0 % plant food)
F Small jacks, carnivorous + F* Large to intermediate schooling fish, pelagic + F Hemiramphidae, herbivorous + I Squids
F Small reef fish, omnivorous 3 +
F Small Scaridae, herbivorous + F Blenniidae, herbivorous
Benthic invertebrates, herbivorous (>50% plant food) Crabs Amphipodslisopodsl tanaidslpycnogonids + Echinoids + Chitonslscaphopods
Small schooling fish, pelagic
Small schooling fish, pelagic +
Engraulidae, herbivorous
Large groupers, carnivorous Semisessile detritivores (>50% detrital food) Large to intermediate benthic carnivores
( ~ 5 0 % live animal food) Holothuroidslsipunculidsl echiuroidsl
hemichordates + Bivalves
Intermediate reef fish, carnivorous 1 + Large reef fish, carnivorous + lntermediate reef fish, carnivorous 2 +
lntermediate reef fish, carnivorous 3 +
lntermediate reef fish, carnivorous 4 + Sea turtles + Octopuses + Lobsters
Sessile detritivores (>50% detrital food)
Ascidianslbarnacleslbryozoans +
Sponges
Small benthic carnivores 15 Corals (> 50 % live animal food)
16 Zooplankton Small reef fish, carnivorous 1 + Small reef fish, carnivorous 2 + 17 Decomposerslmicrofauna Small reef fish, omnivorous 1 + Small reef fish, omnivorous 2 + 18 Phytoplankton Small Gobiidae, carnivorous +
Shrimpslhermit crabslstomatopods + 19 Benthic autotrophs Asteroids + Sea anemones 20 Detritus
B = bird, F = fish, I = invertebrate, R = reptile
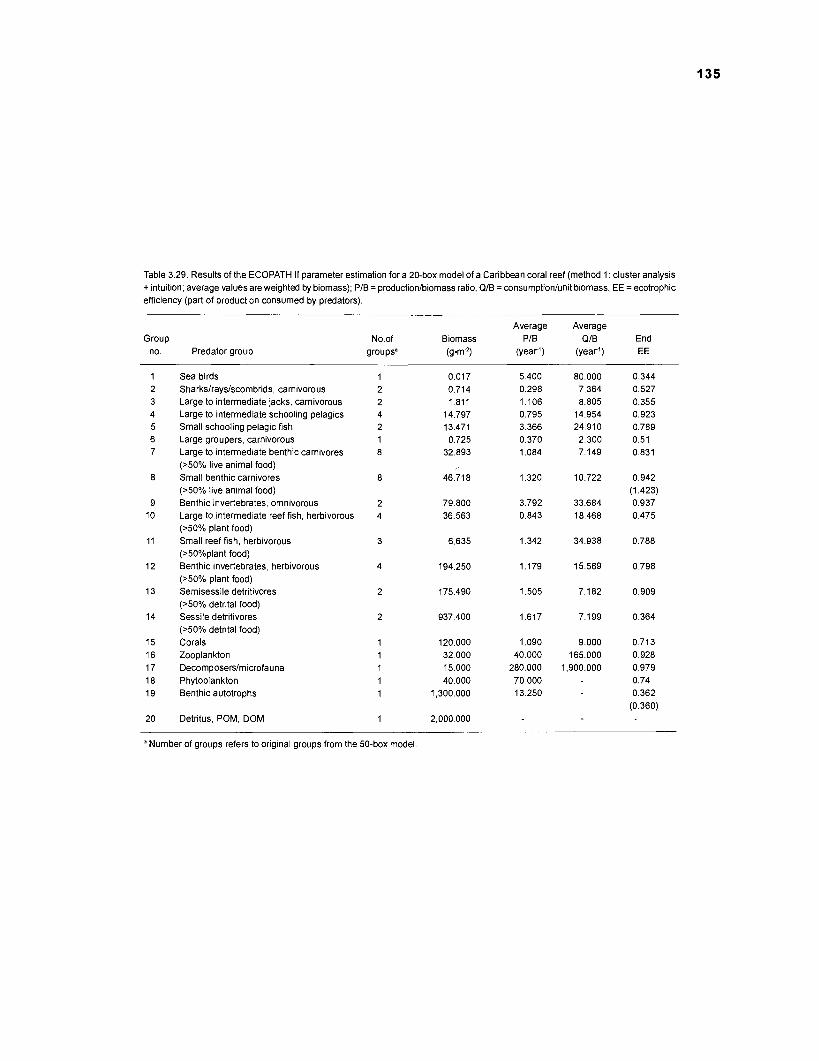
Table 3.29. Results of the ECOPATH II parameterestimation for a 20-box model of a Caribbean coral reef (method 1: cluster analysis + intuition; average values are weighted by biomass); PIB = productionlbiomass ratio, QIB = consumptionlunit biomass, EE = ecotrophic efficiency (part of production consumed by predators).
Average Average Group No.of Biomass PIB QIB End
Predator group groupsa (g .m-2) (year1) (year') EE
Sea birds Sharkslrayslscombrids, carnivorous Large to intermediate jacks, carnivorous Large to intermediate schooling pelagics Small schooling pelagic fish Large groupers, carnivorous Large to intermediate benthic carnivores (>50% live animal food) Small benthic carnivores (>50% live animal food) Benthic invertebrates, omnivorous Large to intermediate reef fish, herbivorous (>50% plant food) Small reef fish, herbivorous (>50%plant food) Benthic invertebrates, herbivorous (>50% plant food) Semisessile detritivores (>50% detrital food) Sessile detritivores (>50% detrital food) Corals Zooplankton Decomposerslmicrofauna Phytoplankton Benthic autotrophs
Detritus, POM, DOM
a Number of groups refers to original groups from the 50-box model
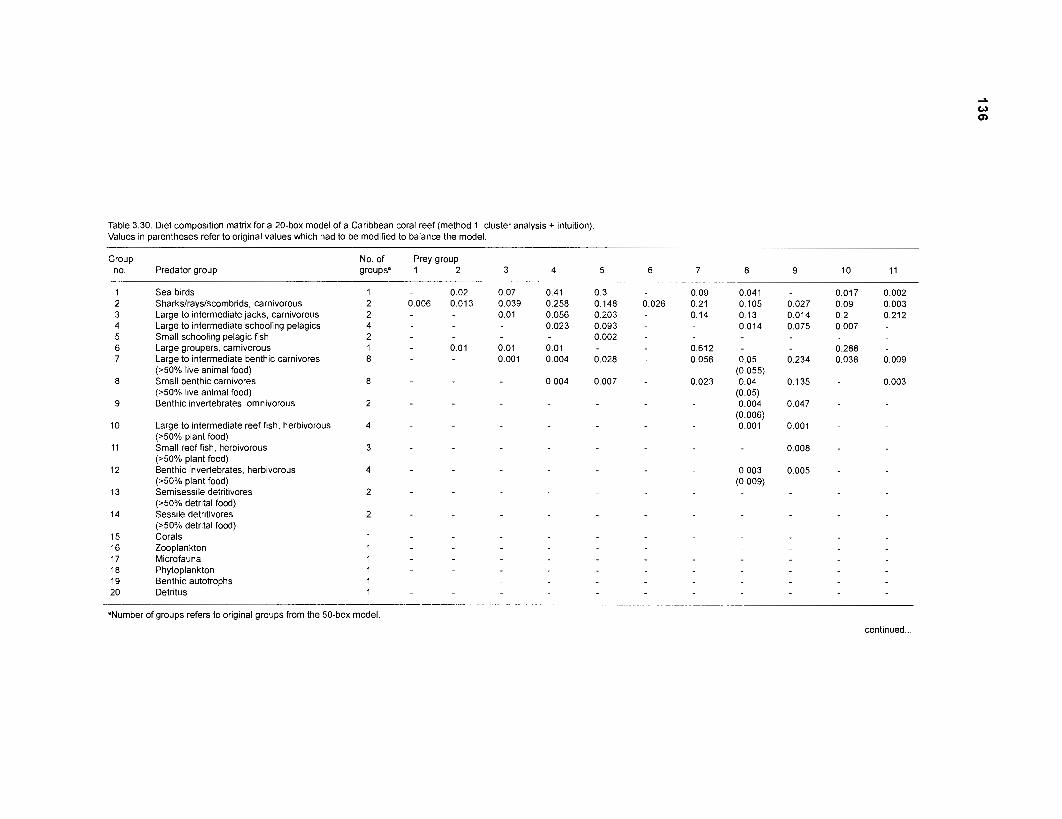
Table 3.30. D~et composition matrix for a 20-box model of a Caribbean coral reef (method 1: cluster analysis + intuition) Values in parentheses refer to origlnal values which had to be modified to balance the model.
Group no. Predator group
No. of Prey group groupsa 1 2 3 4
Sea birds Sharkslrayslscombrids, carnivorous Large to intermediate jacks, carnivorous Large to intermediate schooling pelagics Small schooling pelagic fish Large groupers, carnivorous Large to intermediate benthic carnivores ( ~ 5 0 % live animal food) Small benthic carnivores (>50% live animal food) Benthic Invertebrates, omnivorous
Large to mtermediate reef fish, herbivorous ( ~ 3 0 % plant food) Small reef fish, herbivoro~s (>50% plant food) Benthic invertebrates, herbworous (250% plant food) Semisessile detritivores ( ~ 5 0 % detrital food) Sessile detritivores (>50% detr~tal food) Corals Zooplankton Microfauna Phytoplankton Benthic autotrophs Detritus
"Number of groups refers to origlnal groups from the 50-box model
continued.
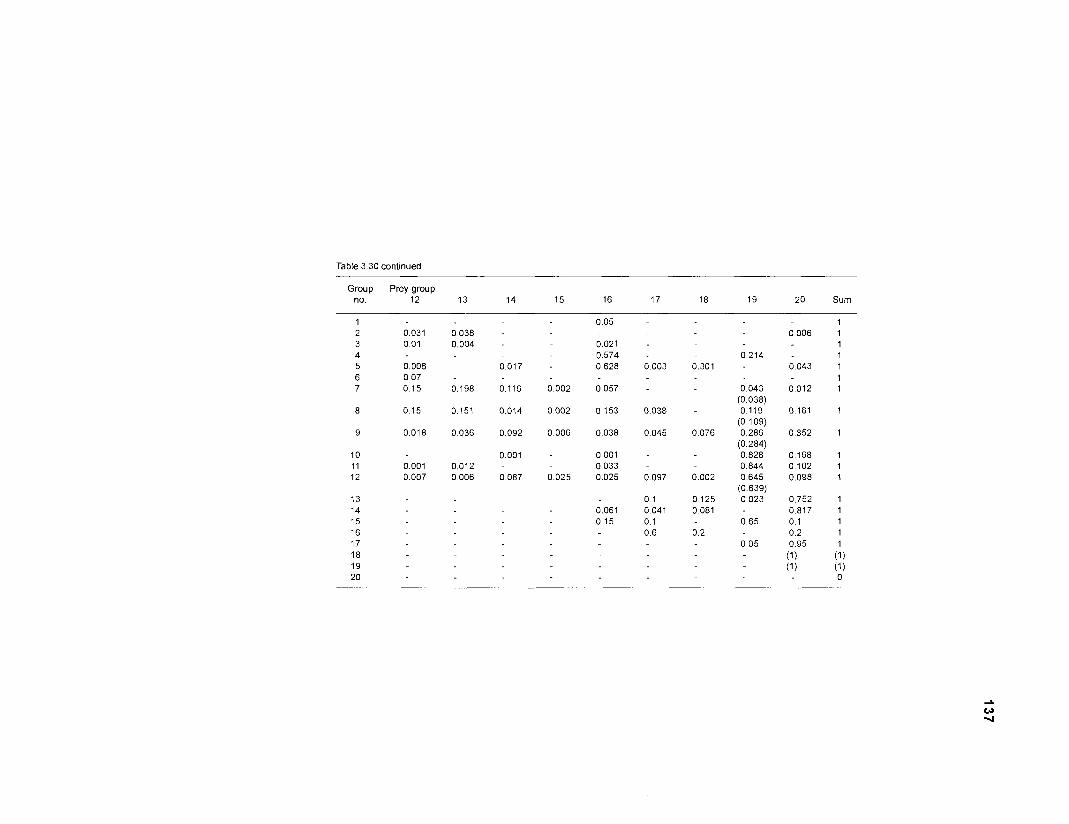
Table 3.30 continued
Group Prey group no. 12 20 Sum
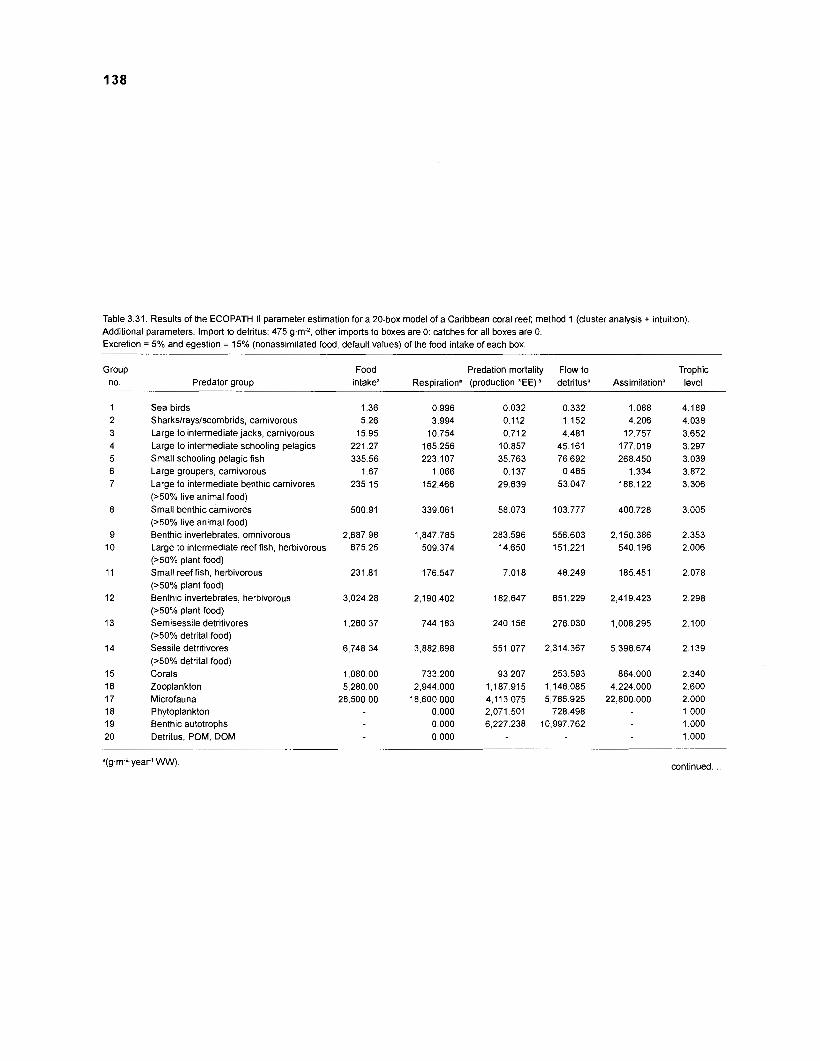
Table 3.31. Results of the ECOPATH II parameter estimation for a 20-box model of a Caribbean coral reef; method 1 (cluster analysis + intuition). Additional parameters. Import to detritus: 475 g-mZ, other imports to boxes are 0: catches for all boxes are 0. Excretion = 5% and egestion = 15% (nonassimilated food, default values) of the food intake of each box.
Group no. Predator group
Food intakea
Sea birds Sharkslrayslscombrids, carnivorous Large to intermediate jacks, carnivorous Large to intermediate schooling pelagics Small schooling pelagic fish Large groupers, carnivorous Large to intermediate benthic carnivores (>50% live animal food) Small benthic carnivores (>SO% live animal food) Benthic invertebrates, omnivorous Large to intermediate reef fish. herbivorous (>50% plant food) Small reef fish, herbivorous (>50% plant food) Benthic invertebrates, herbivorous (>50% plant food) Semisessile detritivores (>50% detrital food) Sessile detritivores (>50% detrital food) Corals Zooplankton Microfauna Phytoplankton Benthic autotrophs Detritus, POM, DOM
Predation mortality Flow to Trophic Respiration~production ^EE) V e t r i t u s a Assimilationa level
continued
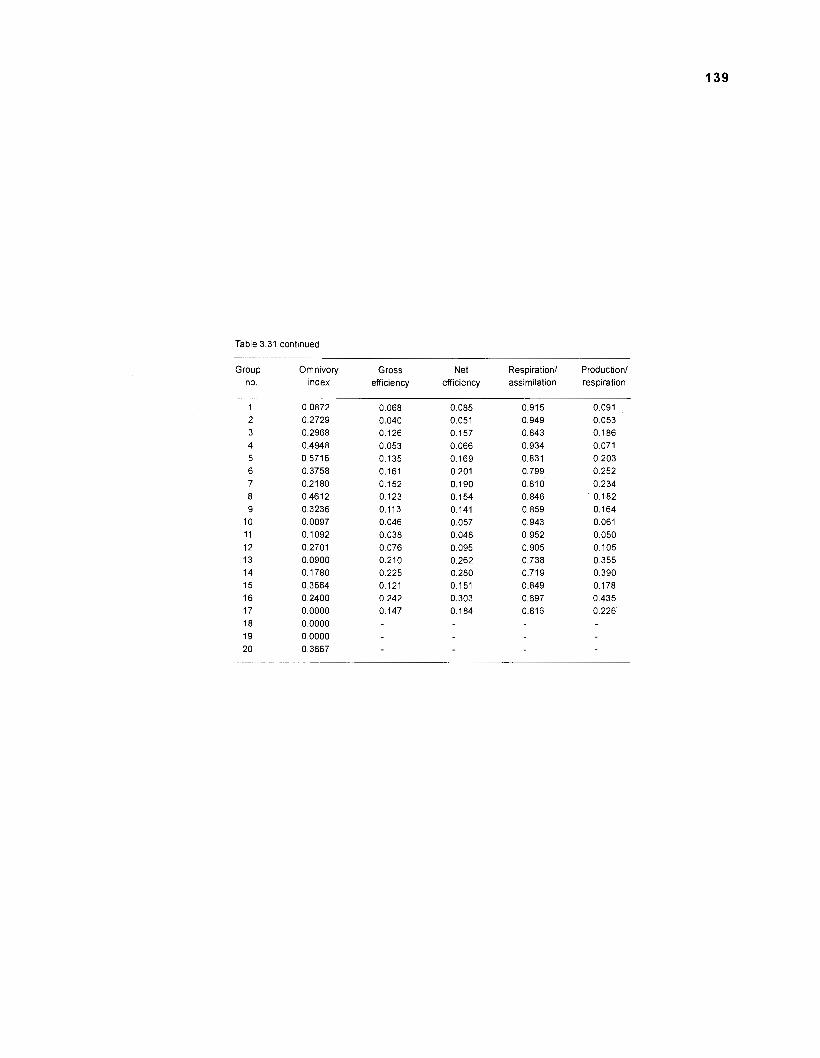
Table 3.31 continued
Group Omnivory Gross Net Respiration1 Production1 no. index efficiency efficiency assimilation respiration
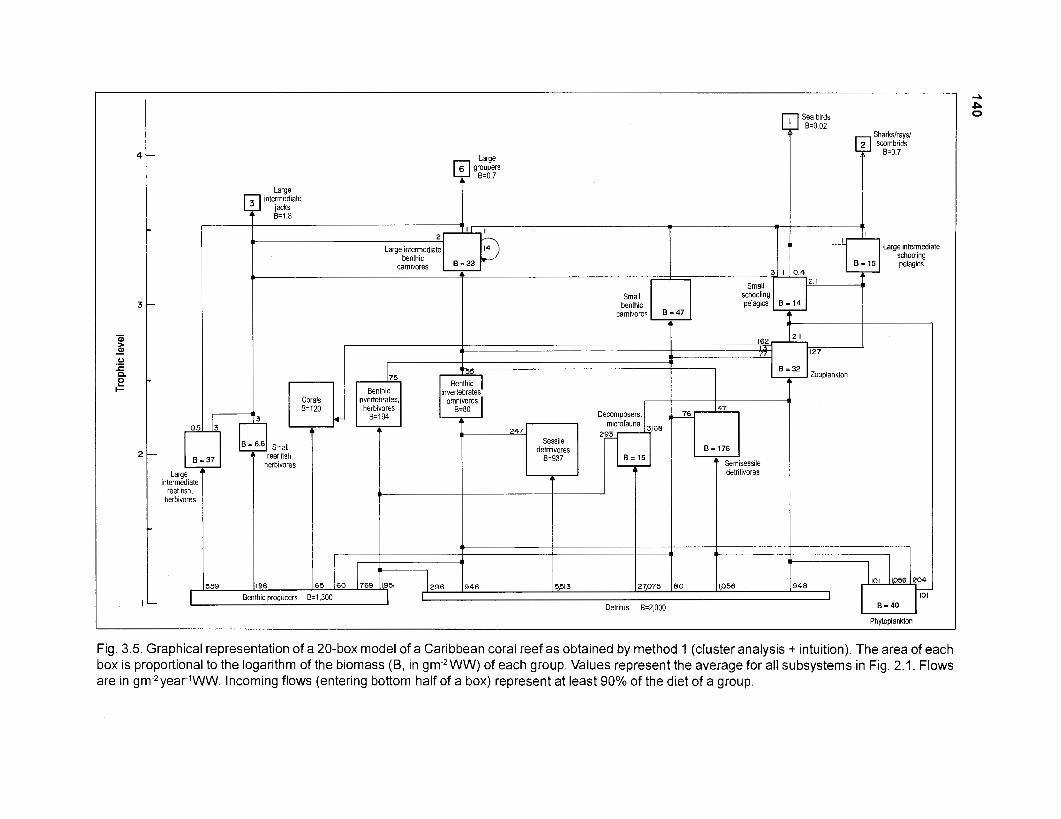
Large intermediate
Large
1 jacks
Large Intermediate benthic
carnivores ' 33 3
I I small I
mtermedlate reef fish,
herb~vores
Small benthic
t
Benthic invertebrates,
herbivores
Benthic ] invertebrates,
omnivores 0.80
1 detnt~vores Sessile I Decomposers,
Sea birds I 6.002
I
, Bi 1 Larg;;te;ediate schooling
Ir?
schooling 1 -1 pelagics 8 = 14
B=32 Zooplankton
I I
I 11
11
559 196 296 946 3513 27,075 80 1,056 948
Benthlc producers B=1,300 I 1 Detritus 8=2,000
Phvtoolankton
Fig. 3.5. Graphical representation of a 20-box model of a Caribbean coral reef as obtained by method 1 (cluster analysis + intuition). The area of each box is proportional to the logarithm of the biomass (B, in gm-2 WW) of each group. Values represent the average for all subsystems in Fig. 2.1. Flows are in gm-2year1WW. Incoming flows (entering bottom half of a box) represent at least 90% of the diet of a group.
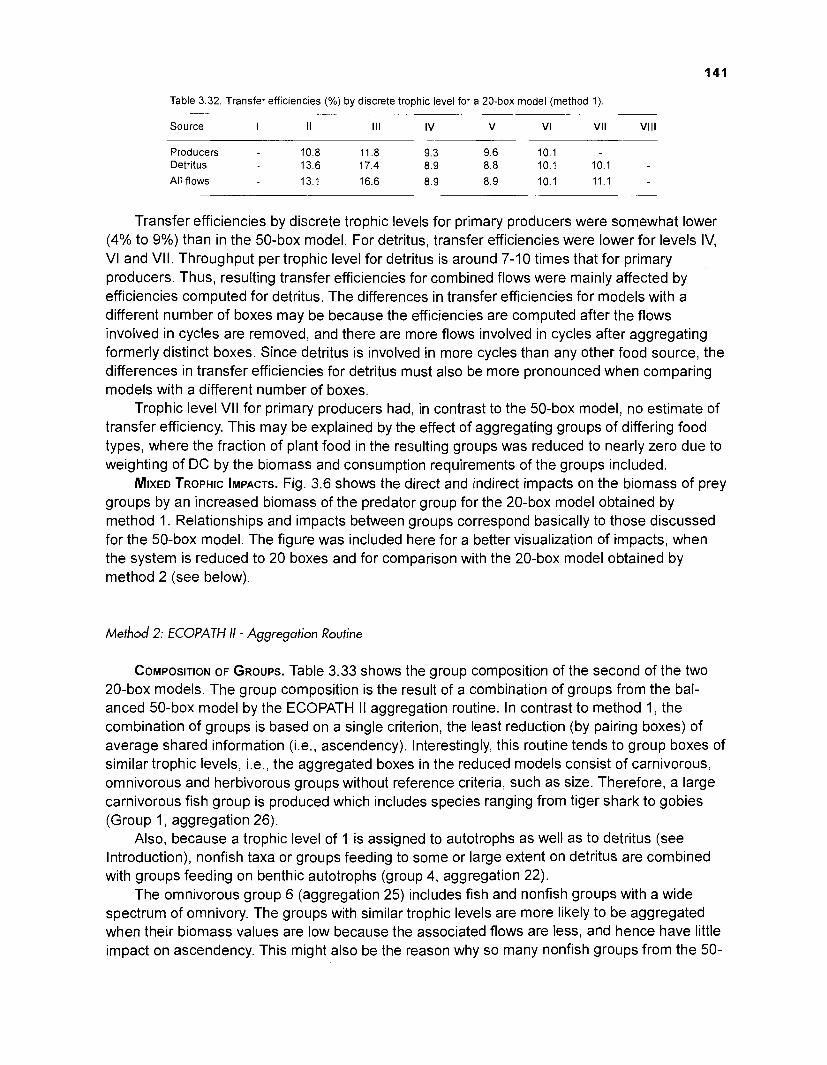
Table 3.32. Transfer efficiencies (%) by discrete trophic level for a 20-box model (method 1)
Source I II I l l IV V VI VI I Vlll
Producers 10.8 11.8 9.3 9.6 10.1 Detritus 13.6 17.4 8.9 8.8 10.1 10.1
All flows 13.1 16.6 8.9 8.9 10.1 11.1
Transfer efficiencies by discrete trophic levels for primary producers were somewhat lower (4% to 9%) than in the 50-box model. For detritus, transfer efficiencies were lower for levels IV, VI and VII. Throughput per trophic level for detritus is around 7-10 times that for primary producers. Thus, resulting transfer efficiencies for combined flows were mainly affected by efficiencies computed for detritus. The differences in transfer efficiencies for models with a different number of boxes may be because the efficiencies are computed after the flows involved in cycles are removed, and there are more flows involved in cycles after aggregating formerly distinct boxes. Since detritus is involved in more cycles than any other food source, the differences in transfer efficiencies for detritus must also be more pronounced when comparing models with a different number of boxes.
Trophic level VII for primary producers had, in contrast to the 50-box model, no estimate of transfer efficiency. This may be explained by the effect of aggregating groups of differing food types, where the fraction of plant food in the resulting groups was reduced to nearly zero due to weighting of DC by the biomass and consumption requirements of the groups included.
MIXED TROPHIC IMPACTS. Fig. 3.6 shows the direct and indirect impacts on the biomass of prey groups by an increased biomass of the predator group for the 20-box model obtained by method 1. Relationships and impacts between groups correspond basically to those discussed for the 50-box model. The figure was included here for a better visualization of impacts, when the system is reduced to 20 boxes and for comparison with the 20-box model obtained by method 2 (see below).
Method 2: ECOPATH 11 - Aggregation Routine
COMPOSITION OF GROUPS. Table 3.33 shows the group composition of the second of the two 20-box models. The group composition is the result of a combination of groups from the bal- anced 50-box model by the ECOPATH II aggregation routine. In contrast to method l , the combination of groups is based on a single criterion, the least reduction (by pairing boxes) of average shared information (i.e., ascendency). Interestingly, this routine tends to group boxes of similar trophic levels, i.e., the aggregated boxes in the reduced models consist of carnivorous, omnivorous and herbivorous groups without reference criteria, such as size. Therefore, a large carnivorous fish group is produced which includes species ranging from tiger shark to gobies (Group 1, aggregation 26).
Also, because a trophic level of 1 is assigned to autotrophs as well as to detritus (see Introduction), nonfish taxa or groups feeding to some or large extent on detritus are combined with groups feeding on benthic autotrophs (group 4, aggregation 22).
The omnivorous group 6 (aggregation 25) includes fish and nonfish groups with a wide spectrum of omnivory. The groups with similar trophic levels are more likely to be aggregated when their biomass values are low because the associated flows are less, and hence have little impact on ascendency. This might also be the reason why so many nonfish groups from the 50-
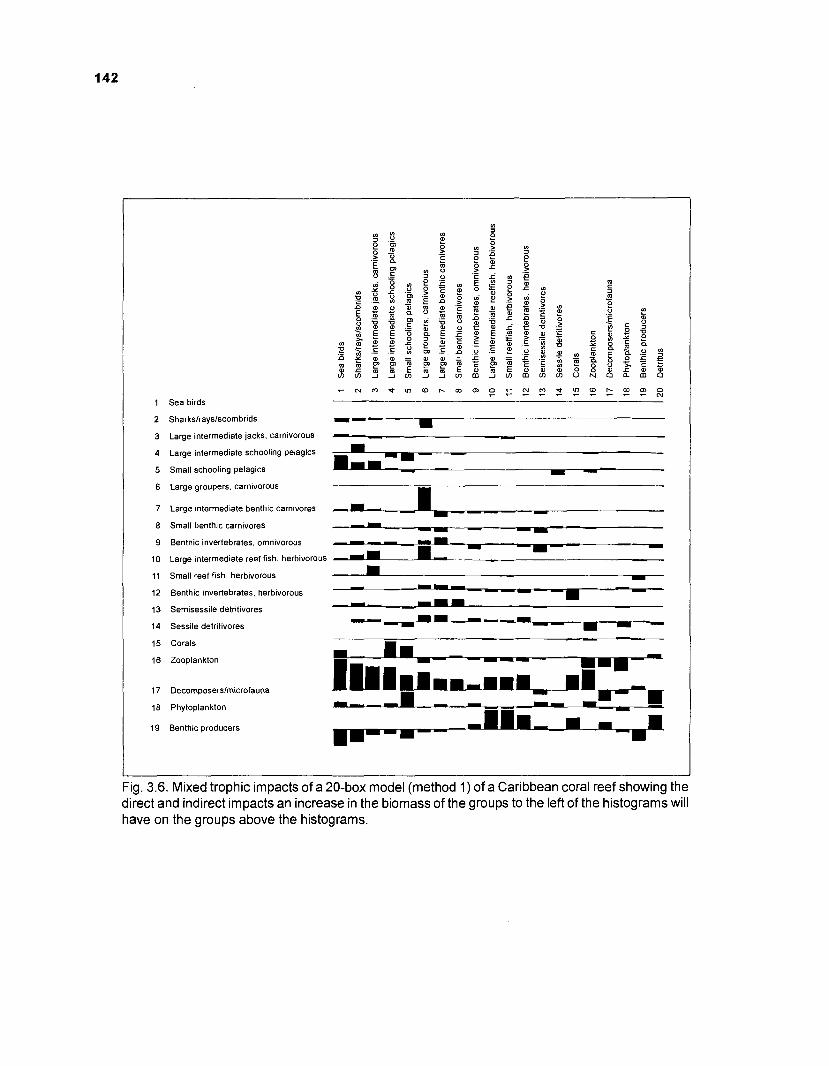
1 Sea birds
2 Sharkslrayslscombrids
3 Large intermediate jacks, carnivorous
4 Large intermediate schooling pelagics
5 Small schooling pelagics
6 Large groupers, carnivorous
7 Large intermediate benthlc carnivores
8 Small benthic carnivores
9 Benthic invertebrates, omnivorous
10 Large intermediate reef fish, herbivorous
11 Small reef fish, herbivorous I
11- 12 Benthic invertebrates, herbivorous - 13 Semisessile detritivores
14 Sessile detritivores I - 15 Corals
16 Zooplankton
17 Decomposerslmicrofauna
18 Phytoplankton
19 Benthic producers
Fig. 3.6. Mixed trophic impacts of a 20-box model (method 1) of a Caribbean coral reef showing the direct and indirect impacts an increase in the biomass of the groups to the left of the histograms will have on the groups above the histograms.
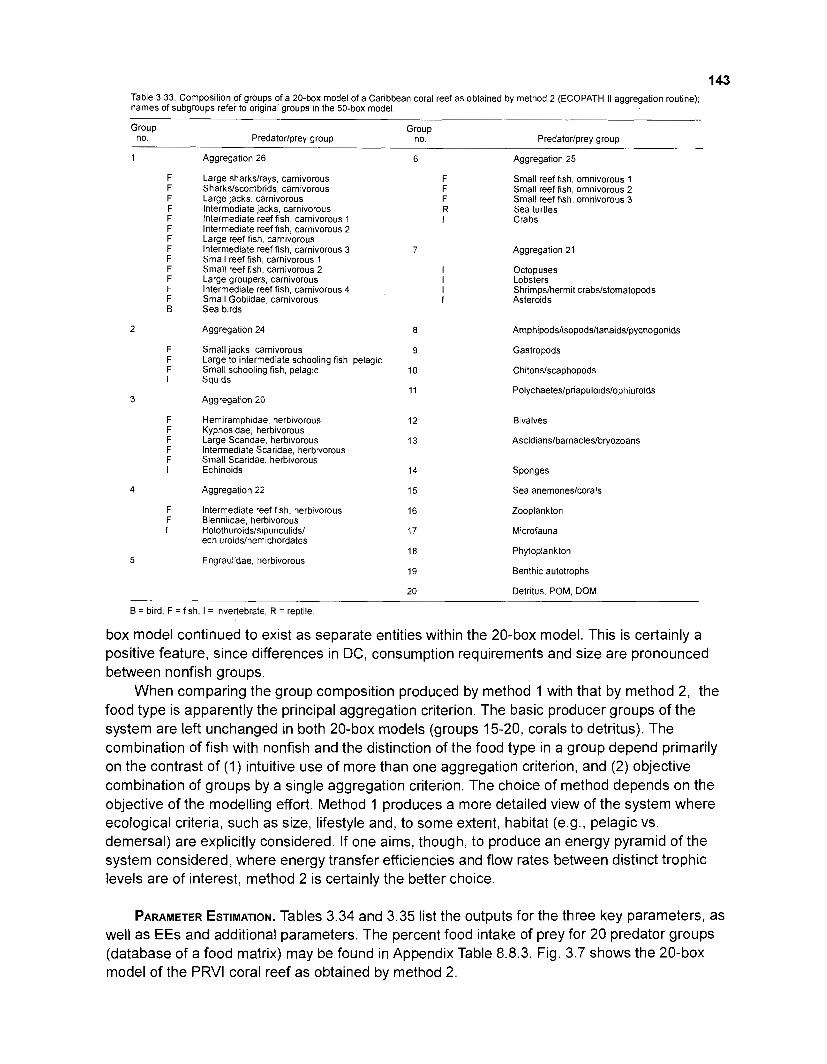
Table 3.33. Composition of groups of a 20-box model of a Caribbean coral reef as obtained by method 2 (ECOPATH II aggregation routine); names of subgroups refer to original groups in the 50-box model
Group no. Predatorlprey group
Group no. Predatorlprey group
Aggregation 26 Aggregation 25
Large sharkslrays, carnivorous Sharkslscombrids, carnivorous
Small reef fish, omnivorous 1 Small reef fish, omnivorous 2 Small reef fish, omnivorous 3 Sea turtles Crabs
Large jacks, carnivorous Intermediate jacks, carnivorous lntermediate reef fish, carnivorous 1 lntermediate reef fish, carnivorous 2 Large reef fish, carnivorous Intermediate reef fish, carnivorous 3 Small reef fish, carnivorous 1 Small reef fish, carnivorous 2 Large groupers, carnivorous lntermediate reef fish, carnivorous 4 Small Gobiidae, carnivorous Sea birds
Aggregation 21
Octopuses Lobsters Shrimpslhermit crabslstomatopods Asteroids
Aggregation 24 Amphipodslisopodsltanaidslpycnogonids
Small jacks, carnivorous Large to intermediate schooling fish, pelagic Small schooling fish, pelagic Squlds
Gastropods
Chitonslscaphopods
Aggregation 20
F Hemiramph~dae, herbivorous 12 F Kyphosidae, herbivorous F Large Scarldae, herbivorous 13 F Intermediate Scaridae, herbivorous F Small Scaridae, herbivorous I Echinoids 14
Bivalves
Ascidianslbarnacleslbryozoans
Sponges
4 Aggregation 22 15 Sea anemoneslcorals
F Intermediate reef fish, herbivorous F Blenniidae, herbivorous I Holothuroidslsipunculidsl
echiuroidslhemichordates
Zooplankton
Microfauna
Phytoplankton
Benthic autotrophs 5 Engraulidae, herbivorous
20 Detritus, POM, DOM
B = bird, F =Ash, I = invertebrate, R = reptile.
box model continued to exist as separate entities within the 20-box model. This is certainly a positive feature, since differences in DC, consumption requirements and size are pronounced between nonfish groups.
When comparing the group composition produced by method 1 with that by method 2, the food type is apparently the principal aggregation criterion. The basic producer groups of the system are left unchanged in both 20-box models (groups 15-20, corals to detritus). The combination of fish with nonfish and the distinction of the food type in a group depend primarily on the contrast of (1) intuitive use of more than one aggregation criterion, and (2) objective combination of groups by a single aggregation criterion. The choice of method depends on the objective of the modelling effort. Method 1 produces a more detailed view of the system where ecological criteria, such as size, lifestyle and, to some extent, habitat (e.g., pelagic vs. demersal) are explicitly considered. If one aims, though, to produce an energy pyramid of the system considered, where energy transfer efficiencies and flow rates between distinct trophic levels are of interest, method 2 is certainly the better choice.
PARAMETER ESTIMATION. Tables 3.34 and 3.35 list the outputs for the three key parameters, as well as EEs and additional parameters. The percent food intake of prey for 20 predator groups (database of a food matrix) may be found in Appendix Table 8.8.3. Fig. 3.7 shows the 20-box model of the PRVl coral reef as obtained by method 2.
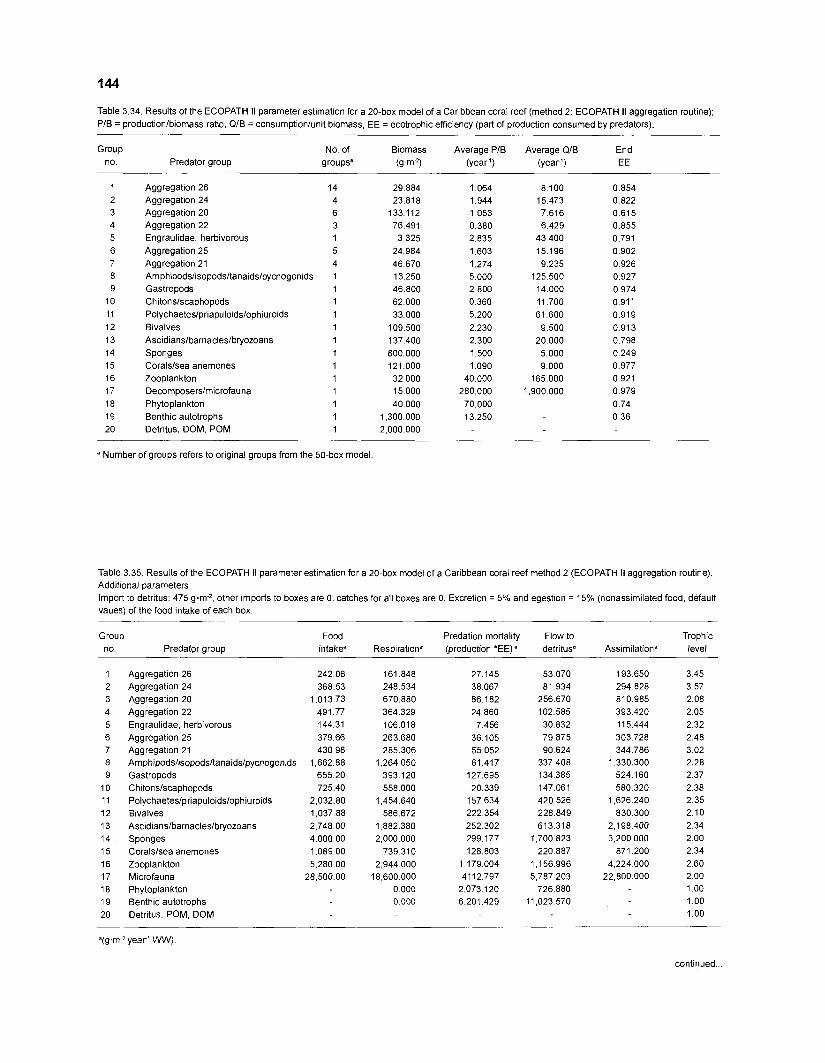
Table 3.34. Results of the ECOPATH II parameter estimation for a 20-box model of a Caribbean coral reef (method 2: ECOPATH II aggregation routine); PIB = productionlbiomass ratio, QIB = consumptionlunit biomass, EE = ecotrophic efficiency (part of production consumed by predators).
Group No. of Biomass Average PIB Average QIB End no. Predator group groupsa k W 2 ) (year') (year') EE
Aggregation 26 Aggregation 24 Aggregation 20 Aggregation 22 Engraulidae, herbivorous Aggregation 25 Aggregation 21 Amphipodslisopodsltanaidslpycnogonids Gastropods Chitonslscaphopods Polychaeteslpriapulo~dsloph~uroids Bivalves Ascidianslbarnacleslbryozoans Sponges Coralslsea anemones Zooplankton Decornposerslmicrofauna Phytoplankton Benthic autotrophs Detritus, DOM, POM
" Number of groups refers to original groups from the 50-box model
Table 3 35. Results of the ECOPATH II parameter estimation for a 20-box model of a Caribbean coral reef method 2 (ECOPATH II aggregation routine). Additional parameters Import to detritus: 475 g m 2 , other imports to boxes are 0. catches for all boxes are 0. Excretion = 5% and egestion = 15% (nonassimilated food, default vaues) of the food intake of each box
Grour, Food no. Predat~r group intakea
Aggregation 26 Aggregation 24 Aggregation 20 Aggregation 22 Engraulidae, herbivorous Aggregation 25 Aggregat~on 21 Amphipods/~sopods/tanaids/pycnogonids Gastropods Chitonslscaphopods Polychaeteslpriapuloidslophiuroids Bivalves Ascidianslbarnacleslbryozoans Sponges Coralslsea anemones Zooplankton Microfauna Phytoplankton Benthic autotrophs Detritus, POM. DOM
Predation mortality Flow to Trophic (production *EE)" detritusa Asslmrlationa level
3.45 3.57 2.08 2.05 2.32 2.48 3 02 2.28 2.37 2.38 2.35 2.10 2.34 2 00 2.34 2.60 2.00 1 .oo 1.00 1 00
continued ...
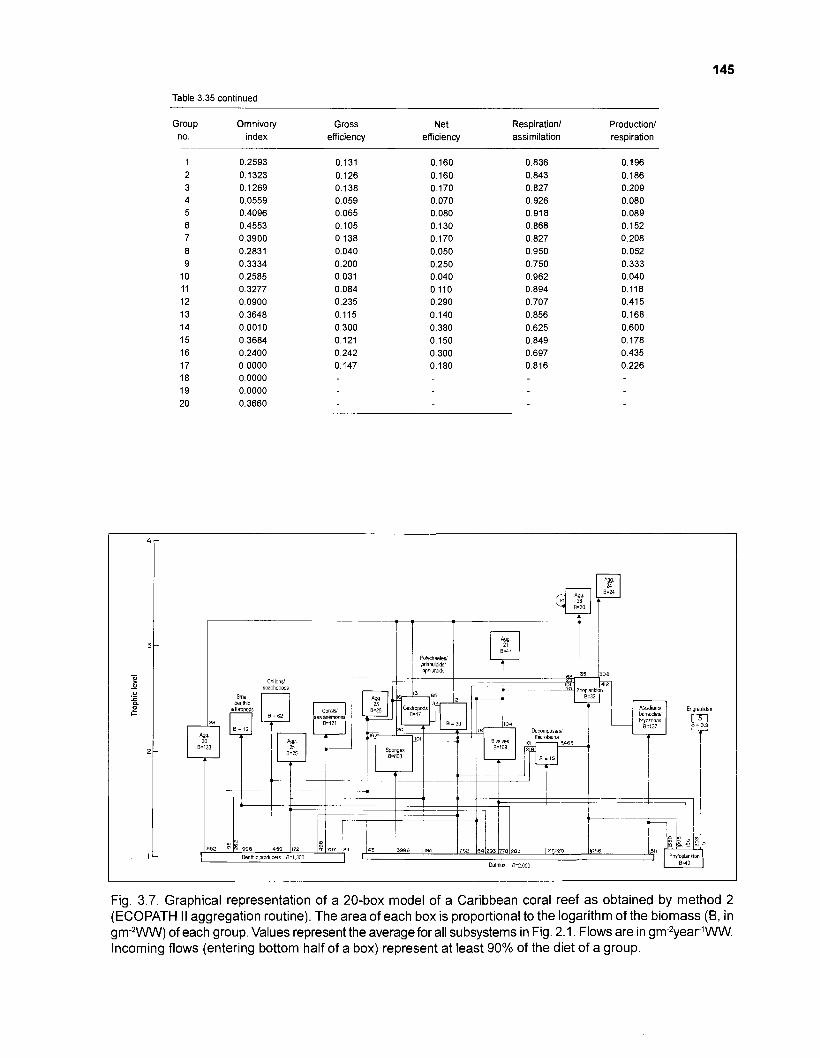
Table 3.35 continued
Group Omnivory Gross Net Respiration1 Production1 no. index efficiency efficiency assimilation respiration
sea anemones I
1-
Fig. 3.7. Graphical representation of a 20-box model of a Caribbean coral reef as obtained by method 2 (ECOPATH II aggregation routine). The area of each box is proportional to the logarithm of the biomass (B, in gm-2WW) of each group. Values represent the average for all subsystems in Fig. 2.1. Flows are in gm-2year1WW. Incoming flows (entering bottom half of a box) represent at least 90% of the diet of a group.
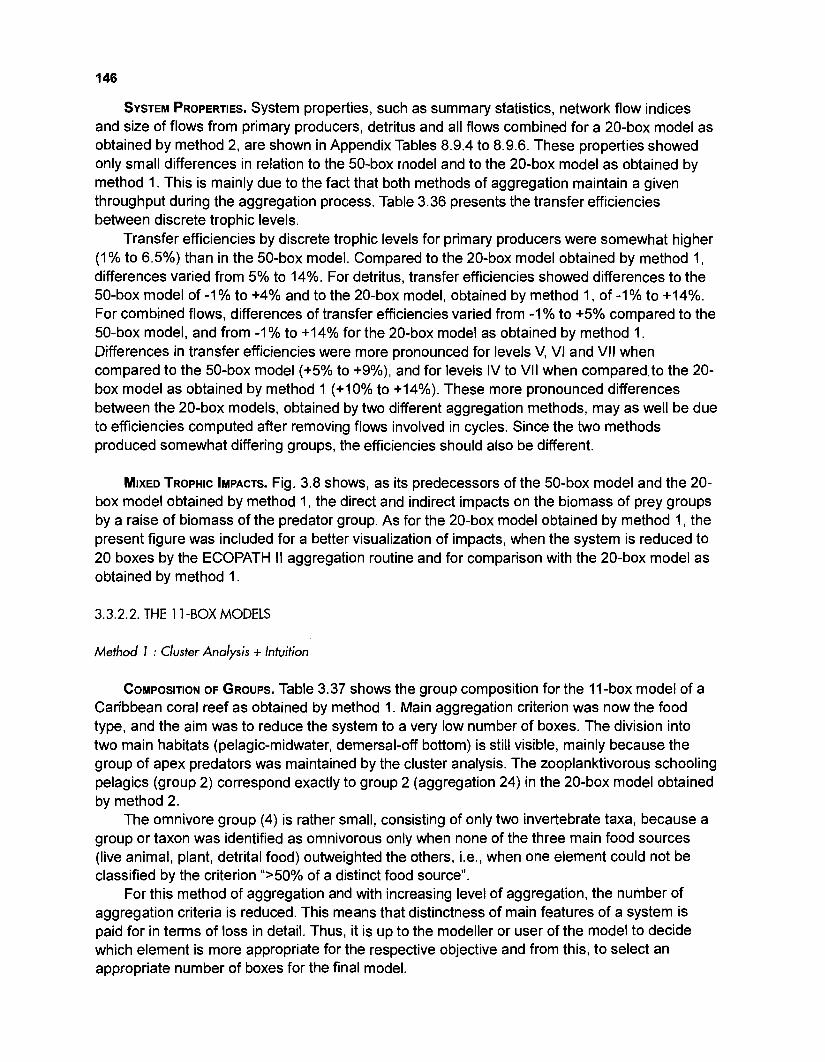
SYSTEM PROPERTIES. System properties, such as summary statistics, network flow indices and size of flows from primary producers, detritus and all flows combined for a 20-box model as obtained by method 2, are shown in Appendix Tables 8.9.4 to 8.9.6. These properties showed only small differences in relation to the 50-box model and to the 20-box model as obtained by method 1. This is mainly due to the fact that both methods of aggregation maintain a given throughput during the aggregation process. Table 3.36 presents the transfer efficiencies between discrete trophic levels.
Transfer efficiencies by discrete trophic levels for primary producers were somewhat higher (1% to 6.5%) than in the 50-box model. Compared to the 20-box model obtained by method 1, differences varied from 5% to 14%. For detritus, transfer efficiencies showed differences to the 50-box model of -1 % to +4% and to the 20-box model, obtained by method 1, of -1% to +14%. For combined flows, differences of transfer efficiencies varied from -1 % to +5% compared to the 50-box model, and from -1% to +14% for the 20-box model as obtained by method 1. Differences in transfer efficiencies were more pronounced for levels V, VI and VII when compared to the 50-box model (+5% to +9%), and for levels IV to VII when compared.to the 20- box model as obtained by method 1 (+lo% to +14%). These more pronounced differences between the 20-box models, obtained by two different aggregation methods, may as well be due to efficiencies computed after removing flows involved in cycles. Since the two methods produced somewhat differing groups, the efficiencies should also be different.
MIXED TROPHIC IMPACTS. Fig. 3.8 shows, as its predecessors of the 50-box model and the 20- box model obtained by method 1, the direct and indirect impacts on the biomass of prey groups by a raise of biomass of the predator group. As for the 20-box model obtained by method 1, the present figure was included for a better visualization of impacts, when the system is reduced to 20 boxes by the ECOPATH II aggregation routine and for comparison with the 20-box model as obtained by method 1.
3.3.2.2. THE 1 1 -BOX MODELS
Method 7 : Cluster Analysis + Intuition
COMPOSITION OF GROUPS. Table 3.37 shows the group composition for the 11-box model of a Caribbean coral reef as obtained by method 1. Main aggregation criterion was now the food type, and the aim was to reduce the system to a very low number of boxes. The division into two main habitats (pelagic-midwater, demersal-off bottom) is still visible, mainly because the group of apex predators was maintained by the cluster analysis. The zooplanktivorous schooling pelagics (group 2) correspond exactly to group 2 (aggregation 24) in the 20-box model obtained by method 2.
The omnivore group (4) is rather small, consisting of only two invertebrate taxa, because a group or taxon was identified as omnivorous only when none of the three main food sources (live animal, plant, detrital food) outweighted the others, i.e., when one element could not be classified by the criterion %0% of a distinct food source".
For this method of aggregation and with increasing level of aggregation, the number of aggregation criteria is reduced. This means that distinctness of main features of a system is paid for in terms of loss in detail. Thus, it is up to the modeller or user of the model to decide which element is more appropriate for the respective objective and from this, to select an appropriate number of boxes for the final model.
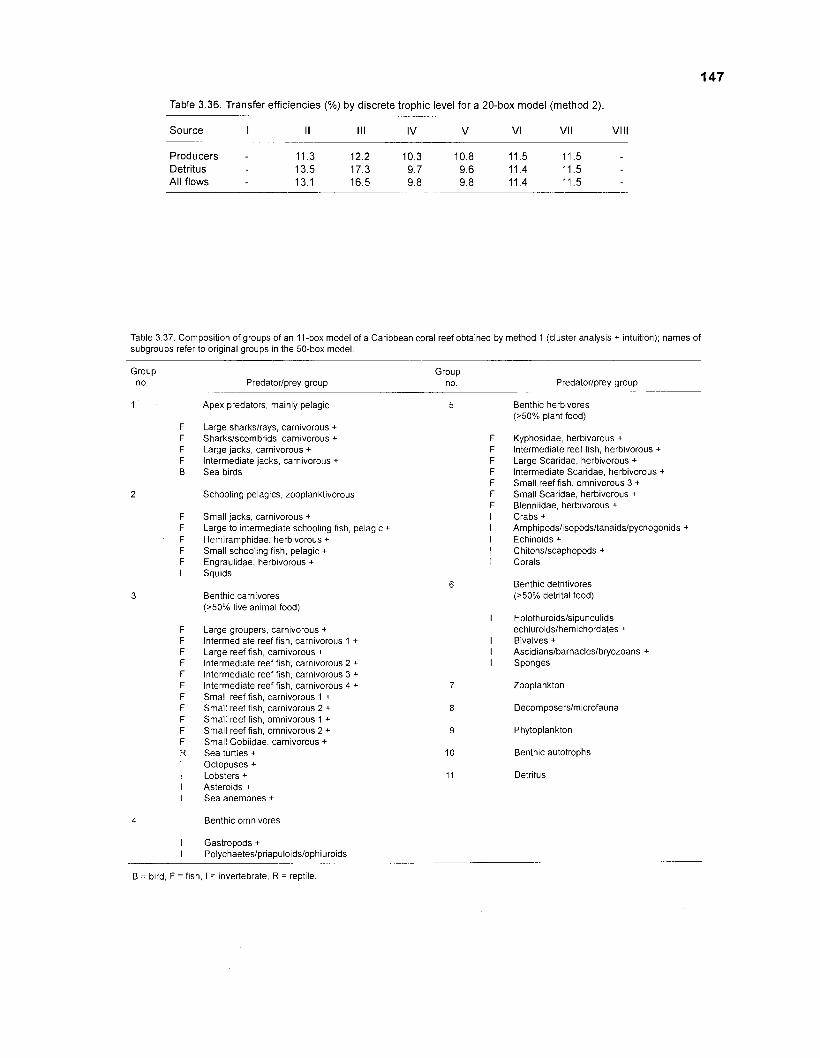
Table 3.36. Transfer efficiencies (%) by discrete trophic level for a 20-box model (method 2)
Source I II 1 1 1 IV V VI VI I Vlll - - -
Producers - 11.3 12.2 10.3 10.8 11.5 11.5 Detritus 13.5 17.3 9.7 9.6 11.4 11.5 All flows 13.1 16.5 9.8 9.8 11.4 11.5
Table 3.37. Composition of groups of an 11-box model of a Caribbean coral reef obtained by method 1 (cluster analysis + intuition); names of subgroups refer to original groups in the 50-box model.
Group no Predatorlprey group
Group no. Predatorlprey group
Apex predators, mainly pelagic
Large sharkslrays, carnivorous + Sharkslscombrids, carnivorous + Large jacks, carnivorous + Intermediate jacks, carnivorous + Sea birds
Schooling pelagics, zooplanktivorous
Small jacks, carnivorous + Large to intermediate schooling flsh, pelagic + Hemiramphidae, herbivorous + Small schooling fish, pelagic + Engraulidae, herbivorous + Squids
Benthic carnivores ( ~ 5 0 % live animal food)
Large groupers, carnivorous + lntermediate reef fish, carnivorous 1 + Large reef fish, carnivorous + lntermediate reef fish, carnivorous 2 + lntermediate reef fish, carnivorous 3 + lntermediate reef fish, carnivorous 4 + Small reef fish, carnivorous 1 + Small reef fish, carnivorous 2 + Small reef fish, omnivorous 1 + Small reef fish, omnivorous 2 + Small Gobiidae, carnivorous + Sea turtles + Octopuses + Lobsters + Asteroids + Sea anemones +
Benthic omnivores
Gastropods + Polvchaetesloria~uloidslo~hiuroids
Benthic herbivores (>50% plant food)
Kyphosidae, herbivorous + Intermediate reef fish, herbivorous + Large Scaridae, herbivorous + lntermediate Scaridae, herbivorous +
Small reef fish, omnivorous 3 +
Small Scaridae, herbivorous + Blenniidae, herbivorous + Crabs + Amphipodslisopods/tanaidslpycnogonids + Echinolds + Chitonslscaphopods + Corals
Benthic detritivores (>50% detrital food)
Holothuroidslsipunculids echiuroidslhemichordates + Bivalves + Asc~dians/barnacleslbryozoans + Sponges
Zooplankton
Phytoplankton
Benthic autotrophs
B = bird. F =fish, I = invertebrate, R = reptile
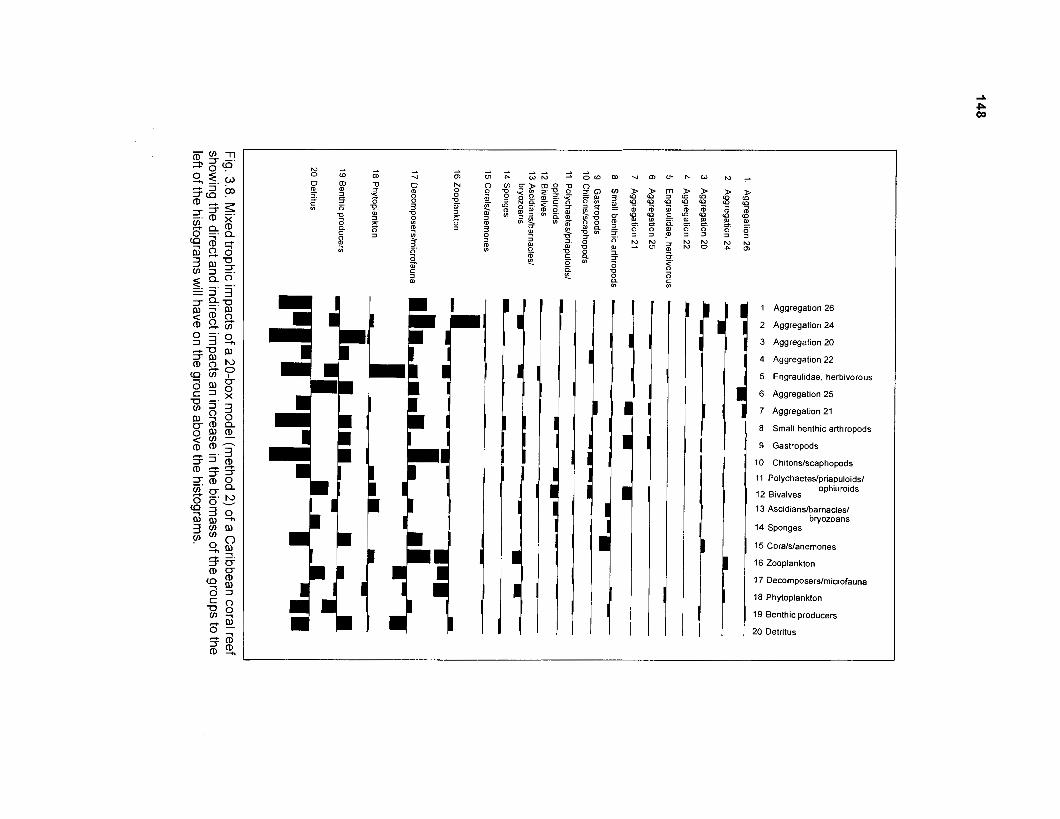
1 Aggregation 26
I 2 Aggregation 24
3 Aggregation 20
4 Aggregatlon 22
5 Engraulidae, herbivorous
6 Aggregation 25
I 7 Aggregatlon 21
8 Small benthic arthropods
9 Gastropods
10 Chitonslscaphopods
11 Polychaeteslpriapuloidsl
12 Bivalves ophiuroids
13 Ascidianslbarnaclesl bryozoans
14 Sponges
I 15 Coralslanemones
16 Zooplankton
17 Decomposerslmicrofauna
18 Phytoplankton
19 Benthic producers
20 Detritus
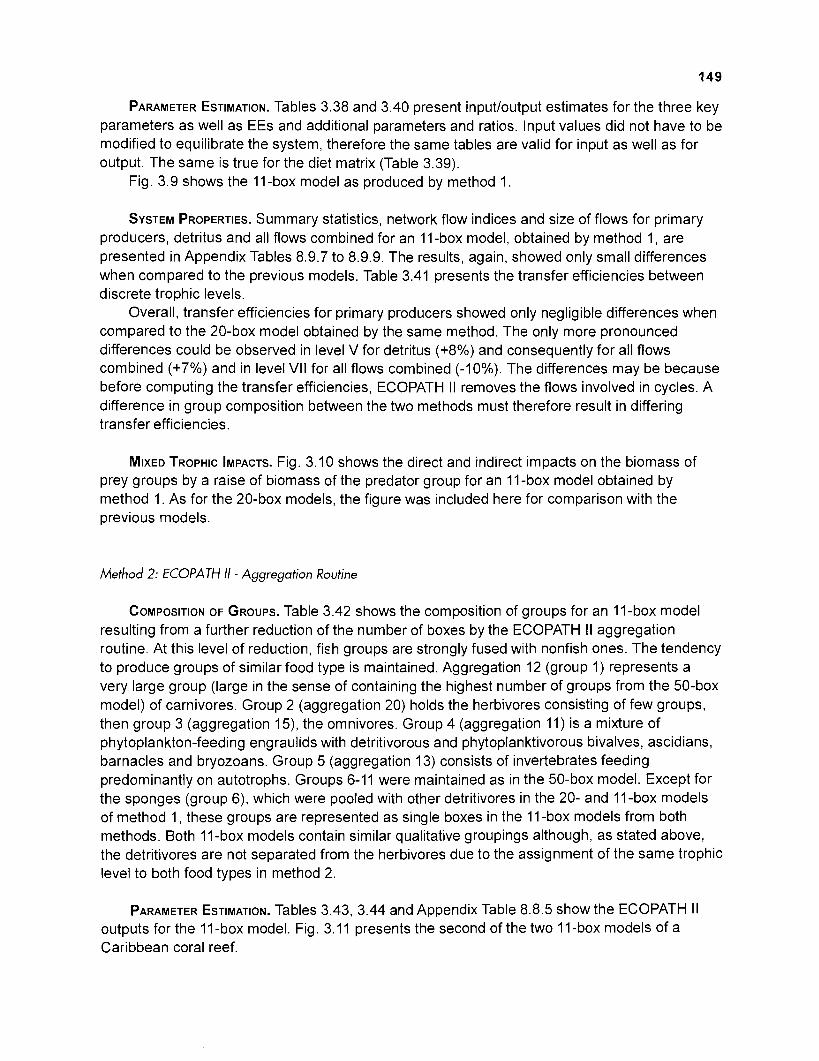
PARAMETER ESTIMATION. Tables 3.38 and 3.40 present inputloutput estimates for the three key parameters as well as EEs and additional parameters and ratios. Input values did not have to be modified to equilibrate the system, therefore the same tables are valid for input as well as for output. The same is true for the diet matrix (Table 3.39).
Fig. 3.9 shows the 11-box model as produced by method 1.
SYSTEM PROPERTIES. Summary statistics, network flow indices and size of flows for primary producers, detritus and all flows combined for an 11-box model, obtained by method 1, are presented in Appendix Tables 8.9.7 to 8.9.9. The results, again, showed only small differences when compared to the previous models. Table 3.41 presents the transfer efficiencies between discrete trophic levels.
Overall, transfer efficiencies for primary producers showed only negligible differences when compared to the 20-box model obtained by the same method. The only more pronounced differences could be observed in level V for detritus (+8%) and consequently for all flows combined (+7%) and in level VII for all flows combined (-10%). The differences may be because before computing the transfer efficiencies, ECOPATH II removes the flows involved in cycles. A difference in group composition between the two methods must therefore result in differing transfer efficiencies.
MIXED TROPHIC IMPACTS. Fig. 3.10 shows the direct and indirect impacts on the biomass of prey groups by a raise of biomass of the predator group for an I I -box model obtained by method 1. As for the 20-box models, the figure was included here for comparison with the previous models.
Method 2: ECOPATH 11 - Aggregation Routine
COMPOSITION OF GROUPS. Table 3.42 shows the composition of groups for an 11-box model resulting from a further reduction of the number of boxes by the ECOPATH II aggregation routine. At this level of reduction, fish groups are strongly fused with nonfish ones. The tendency to produce groups of similar food type is maintained. Aggregation 12 (group 1) represents a very large group (large in the sense of containing the highest number of groups from the 50-box model) of carnivores. Group 2 (aggregation 20) holds the herbivores consisting of few groups, then group 3 (aggregation 15), the omnivores. Group 4 (aggregation 11) is a mixture of phytoplankton-feeding engraulids with detritivorous and phytoplanktivorous bivalves, ascidians, barnacles and bryozoans. Group 5 (aggregation 13) consists of invertebrates feeding predominantly on autotrophs. Groups 6-11 were maintained as in the 50-box model. Except for the sponges (group 6), which were pooled with other detritivores in the 20- and 11-box models of method 1, these groups are represented as single boxes in the 11-box models from both methods. Both 11-box models contain similar qualitative groupings although, as stated above, the detritivores are not separated from the herbivores due to the assignment of the same trophic level to both food types in method 2.
PARAMETER ESTIMATION. Tables 3.43, 3.44 and Appendix Table 8.8.5 show the ECOPATH II outputs for the I I -box model. Fig. 3.11 presents the second of the two I I -box models of a Caribbean coral reef.
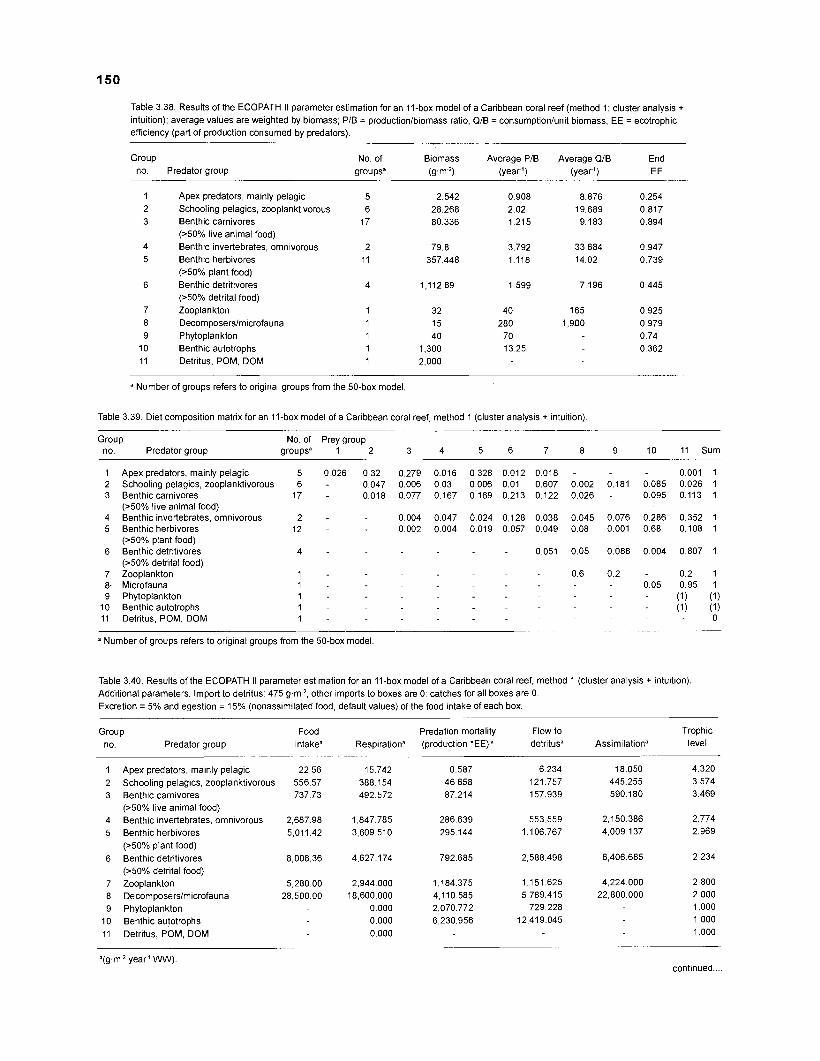
Table 3.38. Results of the ECOPATH II parameter estimation for an 11-box model of a Caribbean coral reef (method 1: cluster analysis + intuition); average values are weighted by biomass; PIB = productionlbiomass ratio, QIB = consumptionlunit biomass, EE = ecotrophic efficiency (part of production consumed by predators).
Group No of B~omass Average PIB Average QIB End no Predator group groupsa (g m 2, (year') (year') EE
Apex predators, mainly pelagic Schooling pelagics, zooplanktivorous Benthic carnivores (>50% live animal food) Benthic invertebrates, omnivorous Benthic herbivores (>50% plant food) Benthic detritivores (250% detrital food) Zooplankton Decomposerslmicrofauna Phytoplankton Benthic autotrophs Detritus, POM, DOM
a Number of groups refers to original groups from the 50-box model
Table 3.39. Diet composition matrix for an 11-box model of a Caribbean coral reef, method 1 (cluster analysis + intuition)
Group No of Prey group no. Predator group groups" 2 3 4 5 6 7 8 9 10 11 Sum
Apex predators, mainly pelagic Schooling pelagics, zooplanktivorous Benthic carnivores (>50% live animal food) Benthic invertebrates, omnivorous Benthic herbivores (>50% plant food) Benthic detritivores (>50% detrital food) Zooplankton Microfauna Phytoplankton Benthic autotrophs Detritus, POM, DOM
Additional parameters. Import to detritus: 475 g m Z , other imports to boxes are 0: catches for all boxes are 0 Excretion = 5% and egestion = 15% (nonassimilated food, default values) of the food intake of each box.
a Number of groups refers to original groups from the 50-box model.
Table 3.40. Results of the ECOPATH II parameter estimation for an 11-box model of a Caribbean coral reef, method 1 (cluster analysis + intuition).
-
-
Group no. Predator group
Food Predation mortality Flow to intake" Respiration"production 'EE) " detritus"
Apex predators, mainly pelagic Schooling pelagics, zooplanktivorous Benthic carnivores (>50% live animal food) Benthic invertebrates, omnivorous Benthic herbivores (>50% plant food) Benthic detritivores (>50% detrital food) Zooplankton Decomposerslmicrofauna Phytoplankton Benthic autotrophs Detritus, POM, DOM
Trophic Assimilationa level
"g.m 2.year1 WW) continued ....
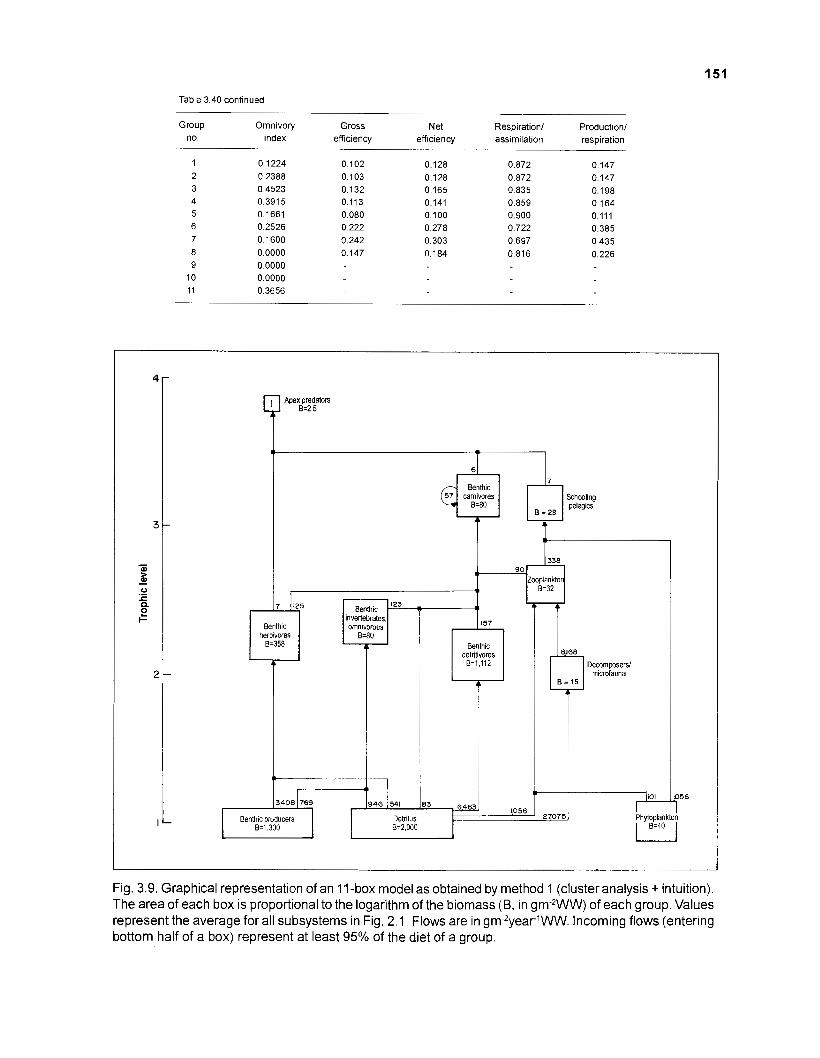
Table 3.40 continued - -
Group Omnivoly Gross Net Respiration1 Production1 no. index efficiency efficiency assimilation respiration
Schooling pelagics
invertebrates, Benthic omnivorous
herbivores 6.358 Benthic
detritivores B=1.112 n Decomposers1
rnicrofauna B = 1 5 C
I1
(1
3>408 769 946 541 83
Benth~c producers Detr~tus B=1.300 B=2,000
Fig. 3.9. Graphical representation of an I l-box model as obtained by method 1 (cluster analysis + intuition). The area of each box is proportional to the logarithm of the biomass (B, in S ~ - ~ W W ) of each group. Values represent the average for all subsystems in Fig. 2.1. Flows are in gm-2year1WW. Incoming flows (entering bottom half of a box) represent at least 95% of the diet of a group.
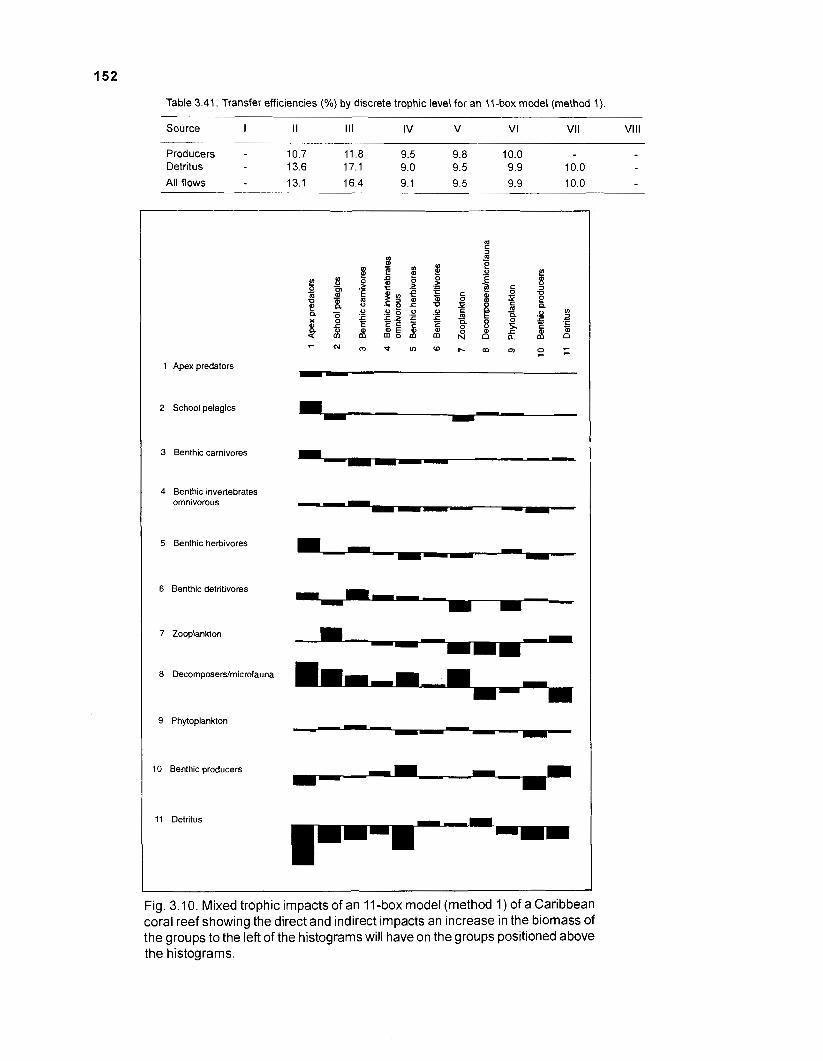
Table 3.41. Transfer efficiencies (%) by discrete trophic level for an 11-box model (method 1)
Source I II Ill IV V VI VII Vlll
Producers - 10.7 11.8 9.5 9.8 10.0 Detritus 13.6 17.1 9.0 9.5 9.9 10.0
All flows 13.1 16.4 9.1 9.5 9.9 10.0
1 Apex predators
2 School pelagics
3 Benthic carnivores
4 Benthic invertebrates omnivorous
5 Benthic herbivores
6 Benthic detritivores
7 Zooplankton
8 Decomposers/rnicrofauna
9 Phytoplankton
10 Benthic producers
11 Detritus
Fig. 3.10. Mixed trophic impacts of an 11-box model (method 1) of a Caribbean coral reef showing the direct and indirect impacts an increase in the biomass of the groups to the left of the histograms will have on the groups positioned above the histograms.
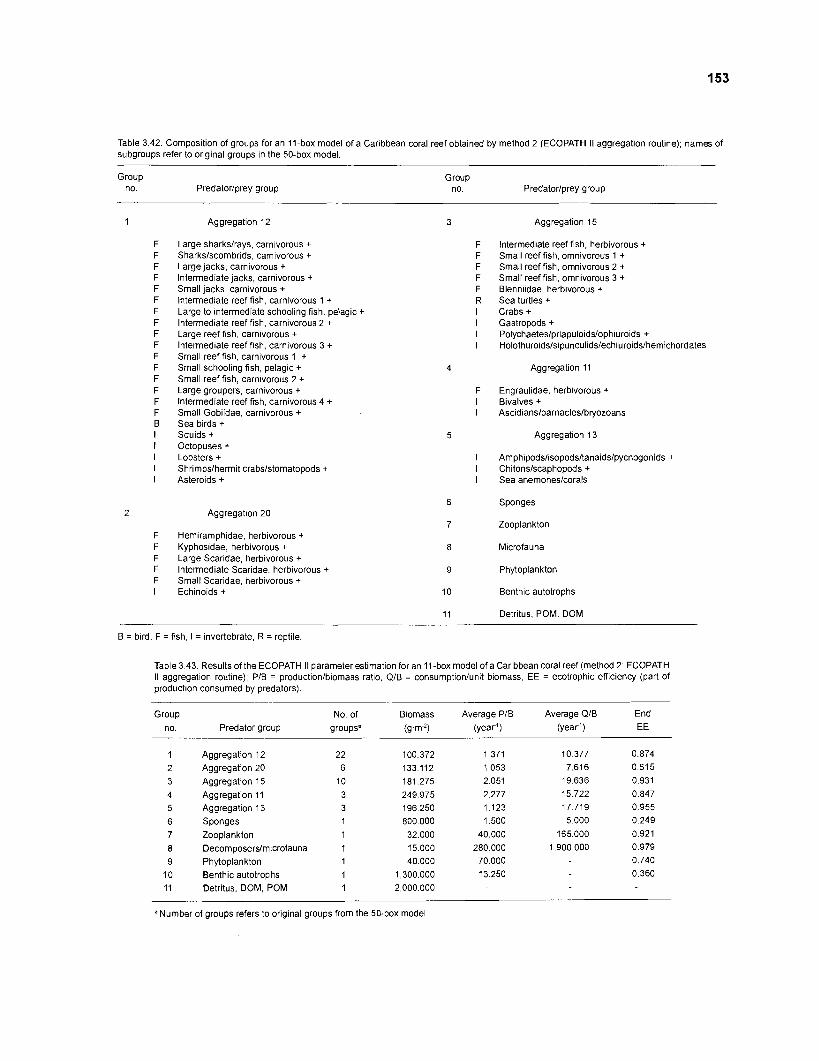
Table 3.42. Composition of groups for an 11-box model of a Caribbean coral reef obtained by method 2 (ECOPATH II aggregation routine); names of subgroups refer to original groups in the 50-box model.
Group Group no. Predatorlprey group no. Predatorlprey group
Aggregation 12 Aggregation 15
Large sharkslrays, carnlvorous + Sharkslscombrids, carnivorous + Large jacks, carnivorous + lntermediate jacks, carnivorous + Small jacks, carnivorous + lntermediate reef fish, carnivorous 1 + Large to intermediate schooling fish, pelagic + lnterrnediate reef fish, carnlvorous 2 + Large reef fish, carnivorous + lnterrnediate reef fish, carnivorous 3 + Small reef fish, carnlvorous 1 + Small schooling fish, pelagic + Small reef fish, carnivorous 2 + Large groupers, carnivorous + lnterrnediate reef fish, carnivorous 4 + Small Gobiidae, carnivorous + Sea birds + Squids + Octopuses + Lobsters + Shrimpslhermit crabs1stomatopods + Asteroids +
lntermediate reef fish, herbivorous + Small reef fish, omnivorous 1 + Small reef fish, omnivorous 2 + Small reef fish, omnivorous 3 + Blenniidae, herbivorous + Sea turtles + Crabs + Gastropods + Polychaeteslpriapuloidslophiuroids + Holothuro~dslsi~unculidslechiuroidslhemichordates
Aggregation 11
Engraulidae, herbivorous + Bivalves + Ascidianslbarnacleslbryozoans
Aggregation 13
Amphipodslisopodsltanaidslpycnogonids + Chitonslscaphopods + Sea anemoneslcorals
Sponges Aggregation 20
Zooplankton Hemiramphrdae, herbivorous + Kyphosidae, herbivorous + Large Scaridae, herbivorous + lntermediate Scaridae, herbivorous + Small Scaridae, herbivorous + Echinoids +
Microfauna
Phytoplankton
Benthic autotrophs
Detritus, POM, DOM
B = bird, F =fish, I = invertebrate, R = reptile.
Table 3.43. Results of the ECOPATH II parameter estimation for an 11-box model of a Caribbean coral reef (method 2: ECOPATH II aggregation routine); PIB = productionlbiomass ratio, QIB = consumpt~onlunit biomass, EE = ecotrophic efficiency (part of production consumed by predators).
Group No of Biomass Average PIB Average QIB End no. Predator group groupsa (W') (year') (year') EE
Aggregat~on 12 Aggregation 20 Aggregation 15 Aggregation 11 Aggregation 13 Sponges Zooplankton Decomposerslmicrofauna Phytoplankton Benthic autotrophs Detritus, DOM, POM
"umber of groups refers to original groups from the 50-box model
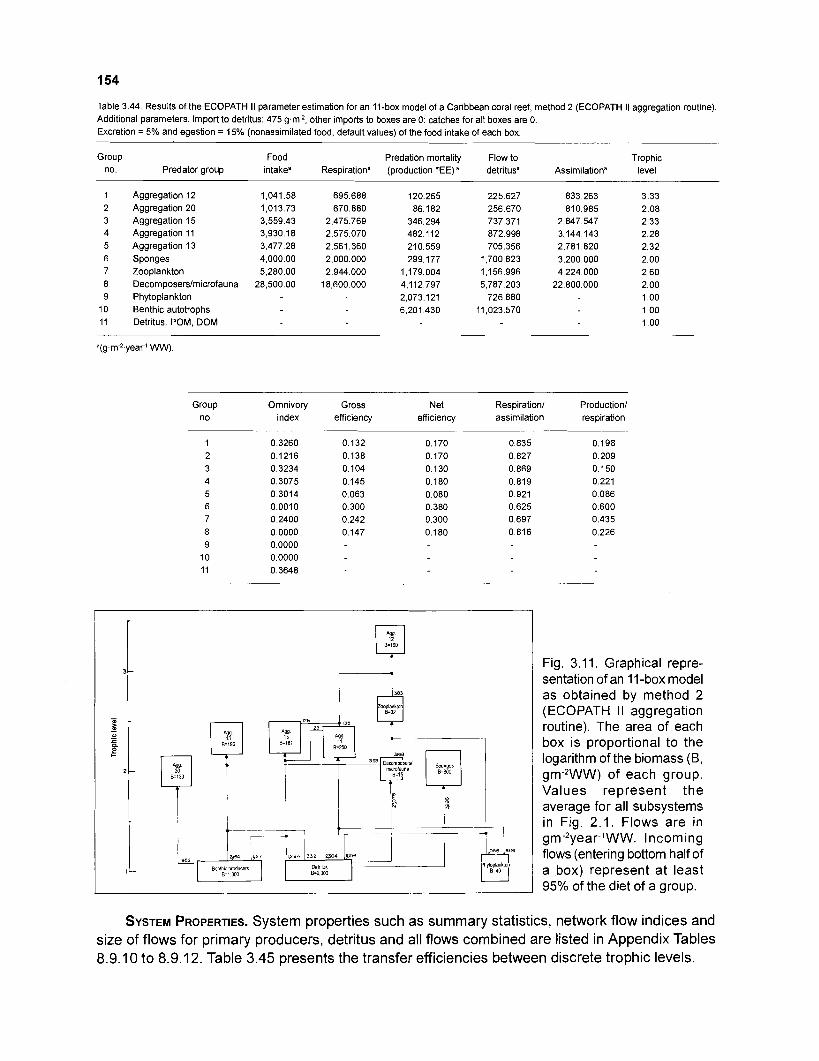
Table 3.44. Results of the ECOPATH II parameter estimation for an 11-box model of a Caribbean coral reef, method 2 (ECOPATH II aggregation routine). Additional parameters. Import to detritus: 475 g.m", other imports to boxes are 0: catches for all boxes are 0. Excretion = 5% and egestion = 15% (nonassimilated food, default values) of the food intake of each box.
Group Food Predation mortality Flow to Trophic no. Predator group intakea Respirationa (production *EE) a detritusa Assimilationa level
Aggregation 12 Aggregation 20 Aggregation 15 Aggregation 11 Aggregation 13 Sponges Zooplankton Decomposerslmicrofauna Phytoplankton Benthic autotrophs Detritus, POM, DOM
Group Omnivory Gross Net Respiration1 Production1 no. index efficiency efficiency assimilation respiration
Fig. 3.11. Graphical repre- sentation of an 11-box model as obtained by method 2 (ECOPATH II aggregation routine). The area of each box is proportional to the logarithm of the biomass (B, S ~ - ~ W W ) of each group. Values represent the average for all subsystems in Fig. 2.1. Flows are in gm-2year-1WW. Incoming flows (entering bottom half of a box) represent at least 95% of the diet of a group.
SYSTEM PROPERTIES. System properties such as summary statistics, network flow indices and size of flows for primary producers, detritus and all flows combined are listed in Appendix Tables 8.9.1 0 to 8.9.12. Table 3.45 presents the transfer efficiencies between discrete trophic levels.
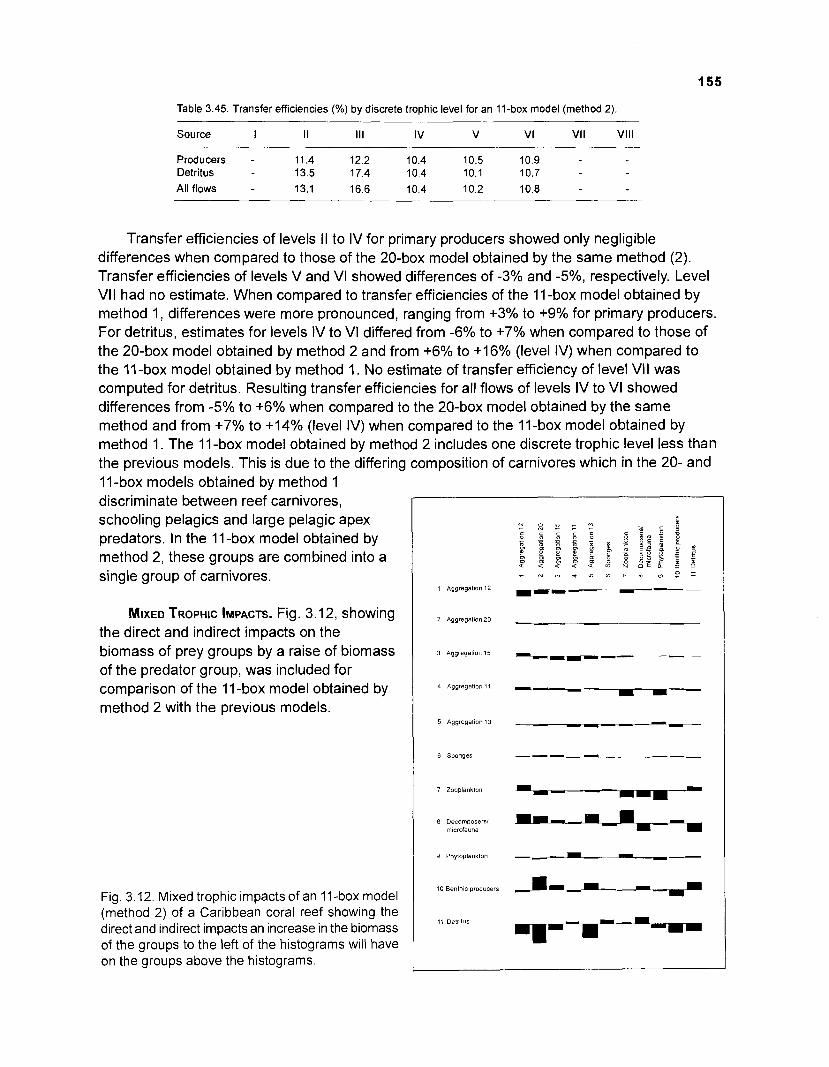
Table 3.45. Transfer efficiencies (%) by discrete trophic level for an 11-box model (method 2).
Source I Il 1 1 1 IV V VI VI I Vlll - -
Producers - 11.4 12.2 10.4 10.5 10.9 Detritus 13.5 17.4 10.4 10.1 10.7 All flows 13.1 16.6 10.4 10.2 10.8
Transfer efficiencies of levels II to IV for primary producers showed only negligible differences when compared to those of the 20-box model obtained by the same method (2). Transfer efficiencies of levels V and VI showed differences of -3% and -5%, respectively. Level VII had no estimate. When compared to transfer efficiencies of the 11-box model obtained by method 1, differences were more pronounced, ranging from +3% to +9% for primary producers. For detritus, estimates for levels IV to VI differed from -6% to +7% when compared to those of the 20-box model obtained by method 2 and from +6% to +16% (level IV) when compared to the 11-box model obtained by method 1. No estimate of transfer efficiency of level VI1 was computed for detritus. Resulting transfer efficiencies for all flows of levels IV to VI showed differences from -5% to +6% when compared to the 20-box model obtained by the same method and from +7% to +14% (level IV) when compared to the 11-box model obtained by method 1. The 11-box model obtained by method 2 includes one discrete trophic level less than the previous models. This is due to the differing composition of carnivores which in the 20- and I I-box models obtained by method 1 discriminate between reef carnivores, schooling pelagics and large pelagic apex predators. In the 11-box model obtained by method 2, these groups are combined into a single group of carnivores.
MIXED TROPHIC IMPACTS. Fig. 3.1 2, showing the direct and indirect impacts on the biomass of prey groups by a raise of biomass of the predator group, was included for comparison of the I I-box model obtained by method 2 with the previous models.
Fig. 3.12. Mixed trophic impacts of an 11-box model (method 2) of a Caribbean coral reef showing the direct and indirect impacts an increase in the biomass of the groups to the left of the histograms will have on the groups above the histograms.
1 Aggregatlon 12
2 Aggregalm 20
3 Aggregatlon 15
4 Aggregatlon 11
5 Aggregation 13
6 Sponges
7 Zooplankton
8 Decomposers1 m~crofauna
9 Phytoplankton
10 Benlhlc producers
11 oetr1tus
The models presented in the "Results1' section show that it is possible to construct a quantitative steady-state model of a coral reef system from published data and parameter estimates based largely on multivariate statistics.
4.1. Compatibility of the Models with the PRVI Coral Reef System
In the following, selected outputs will be compared to "external" estimates, i.e., values not used to produce the models, to assess the "match" between the models and real coral reef ecosystems (unexploited segments of the Puerto Rico-Virgin Islands [PRVI] reef area and coral reef ecosystems in general).
Benthic autotrophs showed a relatively high ecotrophic efficiency (EE) of 0.36 in the five models. According to Jacobsen and Browder (1987), only 5%-10% of net productivity of Thalassia is consumed directly. This corresponds to an EE of 0.05-0.1. Seagrasses formed a sizable fraction of benthic autotrophs but it is well possible that a considerably stronger grazing pressure was exerted on the algae, the other elements of this box. The reef contains a specialized fish fauna feeding directly on benthic plants: mixed aggregations of acanthurids, scarids, chaetodontids, for example, graze on coral-algal reef flats like sheep on a meadow (see e.g., Earle 1972).
Based on rotenone sampling, Randall (1963b) obtained a reef fish biomass of 160 gm-* and 158 gm-2 for two fringing reef areas in the Virgin Islands. Small pelagics as well as large apex predators (sharks, rays, scombrids, jacks) were not included in this figure. These values were not used as biomass inputs for the models presented here because (1) the estimates referred only to a single subsystem and, more important, (2) an independent estimate of reef fish biomass was needed for validation of the models' outputs (subsequent comparison of results from the model with "external" estimates). Only by using independent estimates can the compatibility of both be checked and thus the results confirmed or rejected.
The models' output of total fish biomass amounted to 104 gm-2, including small pelagics and apex predators for an average system composed of the five subsystems in Fig. 2.1. Demersal reef fish biomass was 75 gm-2. This value was only 47% of Randall's (1 963b) estimate. Although his figure was based on a rotenone sampling from the subsystem "coral reef" where biomasses for typical reef fishes usually are higher than for an average square meter from five subsystems, his figure was probably still an underestimate of the real values. Apparently, the two reefs were sampled by fish poison only once each. Even sampling by poison will underestimate fish biomass on a reef probably due to escape of larger individuals or, in case of small cryptic species, by flight into hiding places, where they subsequently die undetected (Pauly 1984).
Smith (1 973) showed that not all individuals present in a specific reef area are killed by the first application of poison. For a more realistic estimate of population size, sampling has to be
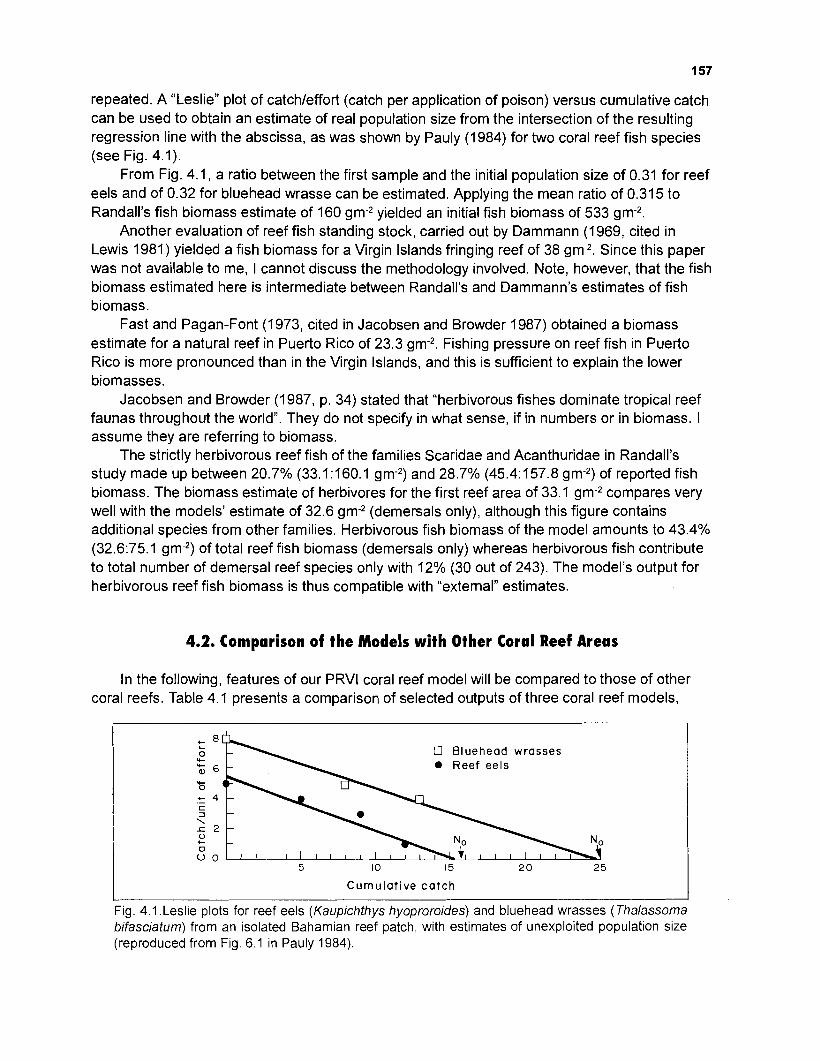
repeated. A "Leslie" plot of catchleffort (catch per application of poison) versus cumulative catch can be used to obtain an estimate of real population size from the intersection of the resulting regression line with the abscissa, as was shown by Pauly (1984) for two coral reef fish species (see Fig. 4.1).
From Fig. 4.1, a ratio between the first sample and the initial population size of 0.31 for reef eels and of 0.32 for bluehead wrasse can be estimated. Applying the mean ratio of 0.315 to Randall's fish biomass estimate of 160 gm-2 yielded an initial fish biomass of 533 gm-2.
Another evaluation of reef fish standing stock, carried out by Dammann (1 969, cited in Lewis 1981) yielded a fish biomass for a Virgin Islands fringing reef of 38 gm-2. Since this paper was not available to me, I cannot discuss the methodology involved. Note, however, that the fish biomass estimated here is intermediate between Randall's and Dammann's estimates of fish biomass.
Fast and Pagan-Font (1973, cited in Jacobsen and Browder 1987) obtained a biomass estimate for a natural reef in Puerto Rico of 23.3 gm-2. Fishing pressure on reef fish in Puerto Rico is more pronounced than in the Virgin Islands, and this is sufficient to explain the lower biomasses.
Jacobsen and Browder (1 987, p. 34) stated that "herbivorous fishes dominate tropical reef faunas throughout the world". They do not specify in what sense, if in numbers or in biomass. I assume they are referring to biomass.
The strictly herbivorous reef fish of the families Scaridae and Acanthuridae in Randall's study made up between 20.7% (33.1 : I 60.1 gm-2) and 28.7% (45.4:157.8 gm-2) of reported fish biomass. The biomass estimate of herbivores for the first reef area of 33.1 gm-2 compares very well with the models' estimate of 32.6 gm-2 (demersals only), although this figure contains additional species from other families. Herbivorous fish biomass of the model amounts to 43.4% (32.6:75.1 gm-2) of total reef fish biomass (demersals only) whereas herbivorous fish contribute to total number of demersal reef species only with 12% (30 out of 243). The model's output for herbivorous reef fish biomass is thus compatible with "externalJ' estimates.
4.2. Comparison of the Models with Other Coral Reef Areas
In the following, features of our PRVl coral reef model will be compared to those of other coral reefs. Table 4.1 presents a comparison of selected outputs of three coral reef models,
I3 Bluehead wrasses Reef eels
-
2 - -
Cumula t ive ca tch
Fig. 4.1.Leslie plots for reef eels (Kaupichthys hyoproroides) and bluehead wrasses (Thalassoma bifasciatum) from an isolated Bahamian reef patch, with estimates of unexploited population size (reproduced from Fig. 6.1 in Pauly 1984).
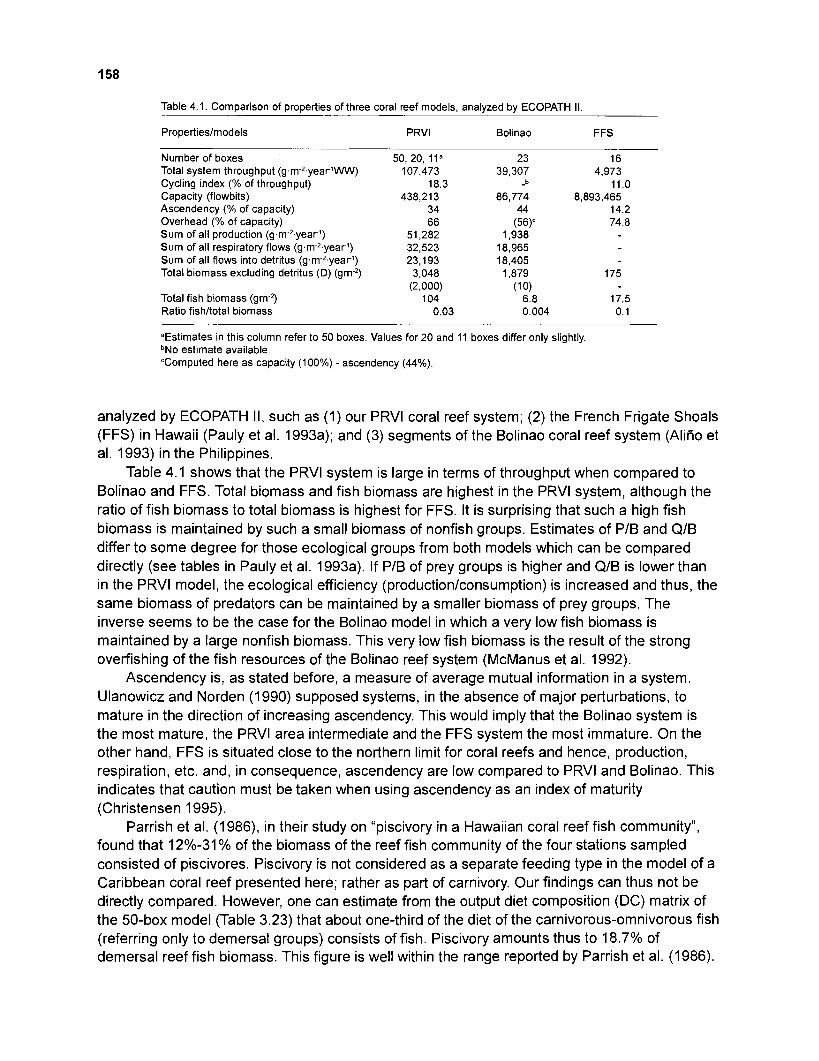
Table 4.1. Comparison of properties of three coral reef models, analyzed by ECOPATH II.
Propeitieslmodels PRVl Bolinao FFS
Number of boxes 50,20, 11" 23 16 Total system throughput (gm2.year1WW) 107,473 39,307 4,973 Cycling index (% of throughput) 18.3 -b 11.0 Capacity (flowbits) 438,213 86,774 8,893,465 Ascendency (% of capacity) 34 44 14.2 Overhead (% of capacity) 66 (56)" 74.8 Sum of all production (gm2.year1) 51,282 1,938 Sum of all respiratory flows (gm2.yearq) 32,523 18,965 Sum of all flows into detritus (gm2.yearq) 23,193 18,405 Total biomass excluding detritus (D) (gm-2) 3,048 1,879 175
(2,000) (1 0) Total fish biomass (gm-2) 1 04 6.8 17.5 Ratio fishltotal biomass 0.03 0.004 0.1
"Estimates in this column refer to 50 boxes. Values for 20 and 11 boxes differ only slightly. bNo estimate available. "Computed here as capacity (100%) - ascendency (44%).
analyzed by ECOPATH II, such as (1) our PRVl coral reef system; (2) the French Frigate Shoals (FFS) in Hawaii (Pauly et al. 1993a); and (3) segments of the Bolinao coral reef system (AliAo et al. 1993) in the Philippines.
Table 4.1 shows that the PRVl system is large in terms of throughput when compared to Bolinao and FFS. Total biomass and fish biomass are highest in the PRVl system, although the ratio of fish biomass to total biomass is highest for FFS. It is surprising that such a high fish biomass is maintained by such a small biomass of nonfish groups. Estimates of P/B and Q/B differ to some degree for those ecological groups from both models which can be compared directly (see tables in Pauly et al. 1993a). If P/B of prey groups is higher and Q/B is lower than in the PRVl model, the ecological efficiency (production/consumption) is increased and thus, the same biomass of predators can be maintained by a smaller biomass of prey groups. The inverse seems to be the case for the Bolinao model in which a very low fish biomass is maintained by a large nonfish biomass. This very low fish biomass is the result of the strong overfishing of the fish resources of the Bolinao reef system (McManus et al. 1992).
Ascendency is, as stated before, a measure of average mutual information in a system. Ulanowicz and Norden (1990) supposed systems, in the absence of major perturbations, to mature in the direction of increasing ascendency. This would imply that the Bolinao system is the most mature, the PRVl area intermediate and the FFS system the most immature. On the other hand, FFS is situated close to the northern limit for coral reefs and hence, production, respiration, etc. and, in consequence, ascendency are low compared to PRVl and Bolinao. This indicates that caution must be taken when using ascendency as an index of maturity (Christensen 1995).
Parrish et al. (1 986), in their study on "piscivory in a Hawaiian coral reef fish community", found that 12%-31% of the biomass of the reef fish community of the four stations sampled consisted of piscivores. Piscivory is not considered as a separate feeding type in the model of a Caribbean coral reef presented here; rather as part of carnivory. Our findings can thus not be directly compared. However, one can estimate from the output diet composition (DC) matrix of the 50-box model (Table 3.23) that about one-third of the diet of the carnivorous-omnivorous fish (referring only to demersal groups) consists of fish. Piscivory amounts thus to 18.7% of demersal reef fish biomass. This figure is well within the range reported by Parrish et al. (1986).
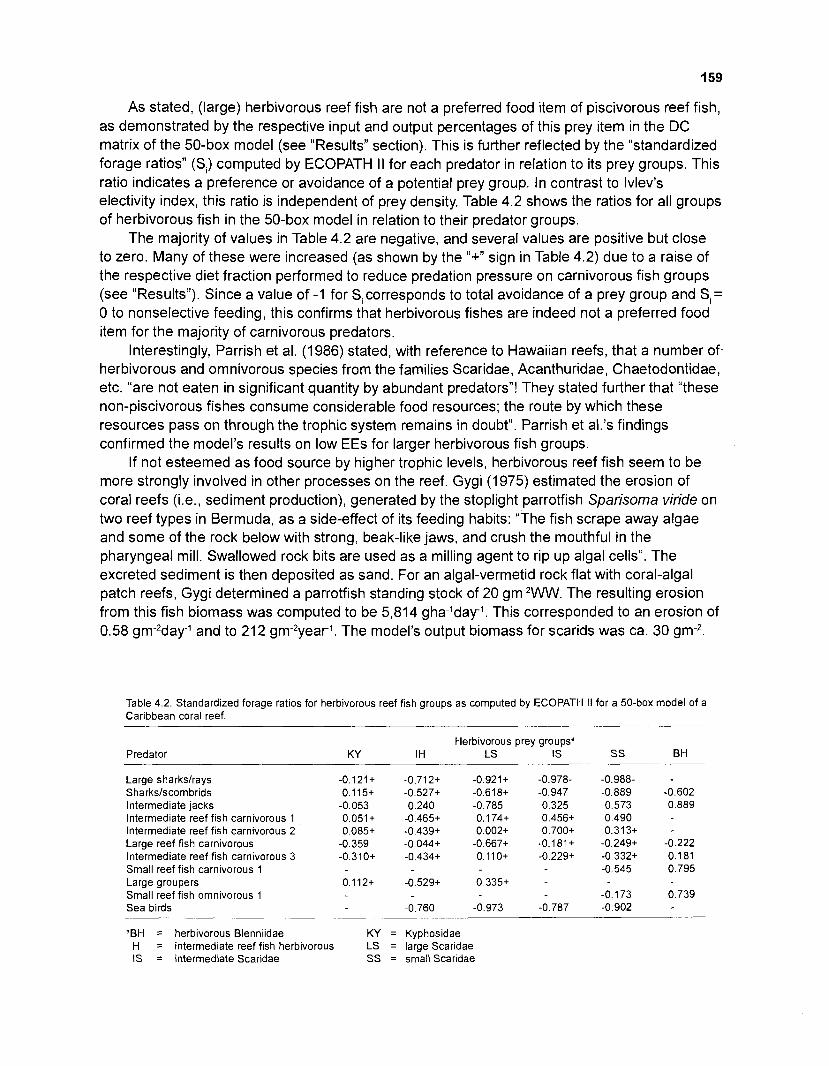
As stated, (large) herbivorous reef fish are not a preferred food item of piscivorous reef fish, as demonstrated by the respective input and output percentages of this prey item in the DC matrix of the 50-box model (see "Results" section). This is further reflected by the "standardized forage ratios" (SI) computed by ECOPATH II for each predator in relation to its prey groups. This ratio indicates a preference or avoidance of a potential prey group. In contrast to Ivlev's electivity index, this ratio is independent of prey density. Table 4.2 shows the ratios for all groups of herbivorous fish in the 50-box model in relation to their predator groups.
The majority of values in Table 4.2 are negative, and several values are positive but close to zero. Many of these were increased (as shown by the "+" sign in Table 4.2) due to a raise of the respective diet fraction performed to reduce predation pressure on carnivorous fish groups (see "Results"). Since a value of -1 for S, corresponds to total avoidance of a prey group and SI = 0 to nonselective feeding, this confirms that herbivorous fishes are indeed not a preferred food item for the majority of carnivorous predators.
Interestingly, Parrish et al. (1 986) stated, with reference to Hawaiian reefs, that a number of- herbivorous and omnivorous species from the families Scaridae, Acanthuridae, Chaetodontidae, etc. "are not eaten in significant quantity by abundant predators"! They stated further that "these non-piscivorous fishes consume considerable food resources; the route by which these resources pass on through the trophic system remains in doubt". Parrish et al.'s findings confirmed the model's results on low EEs for larger herbivorous fish groups.
If not esteemed as food source by higher trophic levels, herbivorous reef fish seem to be more strongly involved in other processes on the reef. Gygi (1975) estimated the erosion of coral reefs (i.e., sediment production), generated by the stoplight parrotfish Sparisoma viride on two reef types in Bermuda, as a side-effect of its feeding habits: "The fish scrape away algae and some of the rock below with strong, beak-like jaws, and crush the mouthful in the pharyngeal mill. Swallowed rock bits are used as a milling agent to rip up algal cells". The excreted sediment is then deposited as sand. For an algal-vermetid rock flat with coral-algal patch reefs, Gygi determined a parrotfish standing stock of 20 gm-2WW. The resulting erosion from this fish biomass was computed to be 5,814 gha-'day-'. This corresponded to an erosion of 0.58 gm-2day-1 and to 212 gm-=year1. The model's output biomass for scarids was ca. 30 gm-2.
Table 4.2. Standardized forage ratios for herbivorous reef fish groups as computed by ECOPATH II for a 50-box model of a Caribbean coral reef.
Predator Herbivorous prey groupsa
KY I H LS IS SS BH
Large sharkslrays Sharkslscombrids lntermediate jacks lntermediate reef fish carnivorous 1 Intermediate reef fish carnivorous 2 Large reef fish carnivorous lntermediate reef fish carnivorous 3 Small reef fish carnivorous 1 Large groupers Small reef fish omnivorous 1 Sea birds
"BH = herbivorous Blenniidae KY = Kyphosidae H = intermediate reef fish herbivorous LS = large Scaridae IS = intermediate Scaridae SS = small Scaridae
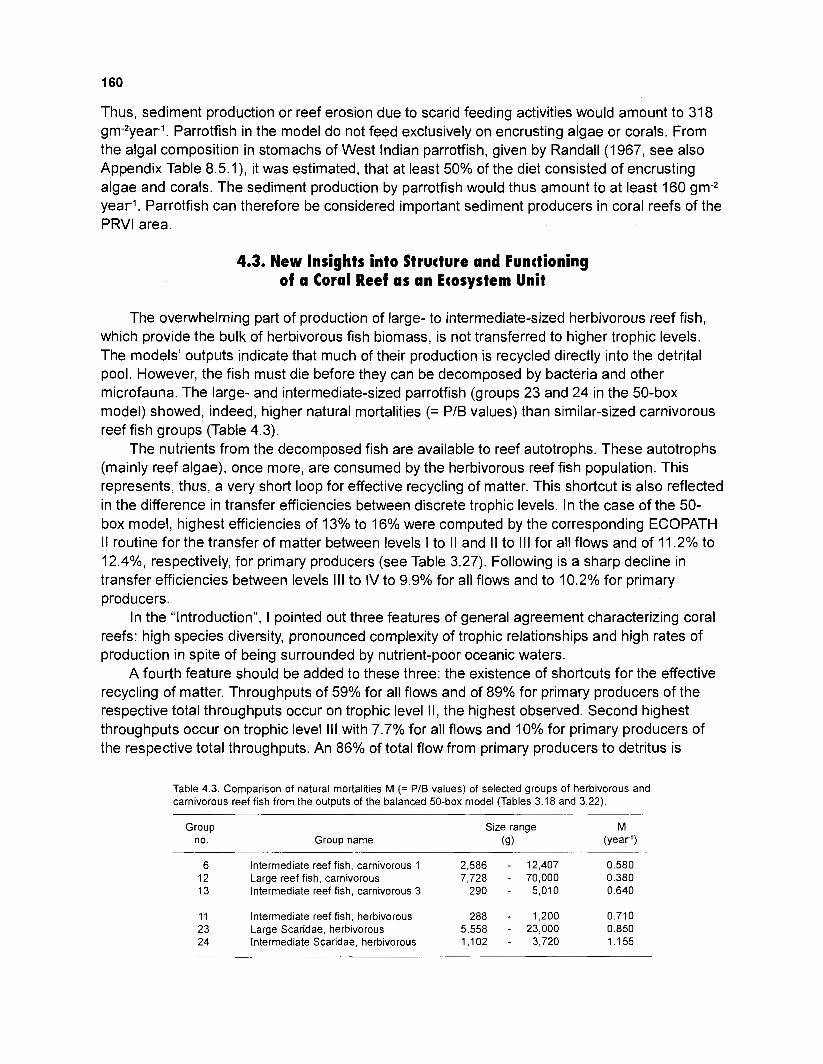
Thus, sediment production or reef erosion due to scarid feeding activities would amount to 31 8 gm-2year1. Parrotfish in the model do not feed exclusively on encrusting algae or corals. From the algal composition in stomachs of West Indian parrotfish, given by Randall (1967, see also Appendix Table 8.5.1), it was estimated, that at least 50% of the diet consisted of encrusting algae and corals. The sediment production by parrotfish would thus amount to at least 160 gm-2 year1. Parrotfish can therefore be considered important sediment producers in coral reefs of the PRVl area.
4.3. New Insights into Structure and Functioning of a Coral Reef as an Ecosystem Unit
The overwhelming part of production of large- to intermediate-sized herbivorous reef fish, which provide the bulk of herbivorous fish biomass, is not transferred to higher trophic levels. The models' outputs indicate that much of their production is recycled directly into the detrital pool. However, the fish must die before they can be decomposed by bacteria and other microfauna. The large- and intermediate-sized parrotfish (groups 23 and 24 in the 50-box model) showed, indeed, higher natural mortalities (= PI6 values) than similar-sized carnivorous reef fish groups (Table 4.3).
The nutrients from the decomposed fish are available to reef autotrophs. These autotrophs (mainly reef algae), once more, are consumed by the herbivorous reef fish population. This represents, thus, a very short loop for effective recycling of matter. This shortcut is also reflected in the difference in transfer efficiencies between discrete trophic levels. In the case of the 50- box model, highest efficiencies of 13% to 16% were computed by the corresponding ECOPATH II routine for the transfer of matter between levels I to II and II to Ill for all flows and of 11.2% to 12.4%, respectively, for primary producers (see Table 3.27). Following is a sharp decline in transfer efficiencies between levels Ill to IV to 9.9% for all flows and to 10.2% for primary producers.
In the "introduction", I pointed out three features of general agreement characterizing coral reefs: high species diversity, pronounced complexity of trophic relationships and high rates of production in spite of being surrounded by nutrient-poor oceanic waters.
A fourth feature should be added to these three: the existence of shortcuts for the effective recycling of matter. Throughputs of 59% for all flows and of 89% for primary producers of the respective total throughputs occur on trophic level II, the highest observed. Second highest throughputs occur on trophic level Ill with 7.7% for all flows and 10% for primary producers of the respective total throughputs. An 86% of total flow from primary producers to detritus is
Table 4.3. Comparison of natural mortalities M (= PIB values) of selected groups of herbivorous and carnivorous reef fish from the outputs of the balanced 50-box model (Tables 3.18 and 3.22).
Group no. Group name
Size range M (9) (year')
6 Intermediate reef fish, carnivorous 1 2,586 - 12,407 0.580 12 Large reef fish, carnivorous 7,728 - 70,000 0.380 13 Intermediate reef fish, carnivorous 3 290 - 5,010 0.640
11 Intermediate reef fish, herbivorous 288 - 1,200 0.710 23 Large Scaridae, herbivorous 5,558 - 23,000 0.850 24 Intermediate Scaridae, herbivorous 1,102 - 3,720 1.155
recycled directly without entering the higher levels of the system. Thus, for primary producers, the corresponding backflows to detritus are second highest for trophic level II with 12.2% and third for Ill with 1.4% of total backflow. For combined flows, as well, they are second highest for trophic level II with 43% and third for Ill with 5.4%.
Coral reef ecosystems are often viewed as "mature" systems, in which structures and processes are maintained at some optimum level, i.e., with minimum leaks (see Odum and Odum 1955). Thus, the reef, as a thermodynamical unit, may not benefit from sharks or tunas which are not an integral part of the actual reef community. "Feeding" these occasional visitors might mean a net loss of energy, since sharks and tunas and other large apex predators, feeding in part on the reef community, tend to migrate away from these systems and take the energy ingested with them.
The reef, as a thermodynamical unit, may also not benefit from passing matter up through many trophic levels. With every additional trophic level through which matter is passed, about 80%-90% of its energy is lost. Thus, direct recycling of matter may be the best way for the reef to conserve energy and to build up biomass. Other reef components with a high biomass for a single taxon, such as the strongly herbivorous echinoids (80% plant food) or the detritivorous sponges, are additional examples for this aspect of reef metabolism. They show rather low exploitation rates as food source for other elements of the system, as expressed by relatively low EEs compared to the majority of nonfish taxa. This feature is furthermore supported by the fact that transfer efficiencies between discrete trophic levels stay on the same rather low level of 9%-11% up to the highest discrete trophic levels in all models. Pauly and Christensen (1995) found, when comparing trophic efficiencies in 48 different ecosystems, all analyzed using ECOPATH II, an average trophic efficiency of lo%, with a range of 2%-34%.
Summarizing, it can be hypothesized that the reef's "strategy" is not to achieve high transfer efficiencies between trophic levels but to build up biomass through maintenance of short cycles for an effective recycling of matter back to its base, the detrital pool. Or else: only ecosystems where those features had developed during evolution could survive in nutrient-poor waters.
During a long-term study on community structure of an artificial reef in the Virgin Islands, Ogden and Ebersole (1 981) found an astonishing stability in species composition. They dis- cussed critically results from the Pacific (Great Barrier Reef, Australia) where this stability was never reported. Sale (1 975,1977) and Talbot et al. (1 978) suggested that high diversity in coral reef fish communities is maintained by the chance arrival-"lotteryv-of larval colonists to unpre- dictably available habitat space. They cited as evidence the stochastic composition of coral reef fish communities on small natural and artificial structures. Ogden and Ebersole (1 981) attributed this stochastic community structure found by some workers in the Pacific to the small struc- tures-natural and artificial-that these workers have studied. Small coral heads are, according to Ogden and Ebersole (1981), too small for detection of "real" differences in community struc- ture. They argued that, when the appropriate scale is selected, coral reef systems become stable (i.e., display flow-through equilibrium) and show an orderly functioning. Moreover, the predictability of the community seems to increase with the size of the reef. From the results of the models presented here, it can be concluded that a coral reef system can straightforwardly be made to reflect a steady-state or flow-through equilibrium, when a whole system approach, such as in our models, is applied.
This does not prevent stochastic events such as predation, disturbance, incidental recruitment of species, etc., from taking place on a smaller scale within that system. As pointed out earlier, for the present models, fish groups were aggregated, based on similarity of energetic
requirements and not on taxonomical closeness. Thus, individuals of a certain fish species within a "box" may easily be replaced by those of another species with similar energetic features. When considering the flow of energy through the reef, the only important feature of a species group or "box1' is its capacity to maintain its biomass and production rate, so that the same amount of energy remains available to other boxes of the system. The species composition within that box may be viewed as a stochastic feature, depending on the above- described "lottery". The results of investigations of community structures, which emphasize their stochastic feature, cannot express anything about overall performance of reef metabolism, such as stability or instability of structures and processes at higher scales (e.g., relationships between boxes, trophic levels, etc.). Thus, from these experiments, it cannot be concluded if the reef as an entity is in a steady state or not.
Hall et al. (1990), in their study on the usefulness of power analysis for the experimental design of energy flow studies, discussed the compatibility of results from energy flow models with those from field experiments. They concluded that field experiments could not be substituted by modelling. They did not specify to what scale of model or experiment they referred. From their examples, it must be assumed that the scale is relatively small, e.g., one predator and a few prey items. I do not doubt the necessity of field experiments on energy flow, on the contrary, they provide urgently needed estimates for modelling energy flows on a larger scale.
Jones (1986, 1987) discussed the hypothesis of recruitment limitation to coral reefs. In general, space and food are assumed to be major limiting factors. Opinions on this subject are divided. Jones (1987) found indications from his experiments with a zooplankton-feeding pomacentrid species at One Tree Island (Great Barrier Reef, Australia) that recruitment of larvae or postlarval O+ cohorts of this species was not limited by the reef community, it was accidental. Mortality did not seem to be density-dependent, but time of maturation of juveniles was influenced by population structure. When individuals from older cohorts were present, maturation time of young fish was longer, suggesting a possible food limitation for recruitment. If this kind of "stock-recruitment interaction" is valid for the majority of species within a box, it would substantiate the hypothesis that a "box" tends to maintain its average standing stock biomass and food requirements.
Most fisheries can be viewed as an apex predator within a system. First, they remove the predators, then take the production these took. When the apex predators of our PRVl reef models, such as sharks, rays, large scombrids, jacks and groupers, are removed, the production of the reef fish community consumed by these groups becomes available to the fisheries. Excluding the schooling pelagic fish (the production of this group consumed by apex predators is 1.9 gm-2.year1), the reef fish production then available to the fisheries amounts to about 4 gm-*.year1 (excluding small blennies and gobies). The fish production available to the fisheries may be increased by extending these to lower trophic levels, such as the large carnivorous reef fish (group 12 in the 50-box model). Recalling the "norm" of 5 t km-2 fisheries yield for Caribbean coral reefs (Munro 1984), it seems possible to attain this yield as well for the unfished parts of the PRVl reef area, without destructive effects for the reef fish community as a whole. Overall, it is advisable to fish large individuals from higher trophic levels. This has a positive effect on prey density and should lead, at least when overall fishing pressure remains low, to increase of recruits to the adult guilds. This, again, may lead to sustainable fisheries yields.
The overfishing of invertebrates, presently occurring in PRVI, can also be explained, if to a small extent, by the results of the model. A strong predation pressure is already exerted in the
unexploited system on, e.g., crustaceans and gastropods (see high EEs for these groups). There is not much surplus production for the fisheries.
The deductions on fisheries potential for the area are very preliminary. The shortcomings of input data for nonfish groups were already pointed out. Actual standing stocks might be higher than outputs from models imply, but the "true" relations among biomass, production and consumption for nonfish groups are to date not known with sufficient accuracy.
4.4. Identification and Solution of Methodological Problems During the Modelling Process
4.4.1. Aggregation of Fish Groups
The high fish species diversity within the PRVl coral reef system was successfully reduced into fewer groups with similar energetic requirements. It is difficult to parametrize and combine ecological information of various dimensions, e.g., spatial, temporal, energetic in a given model. Emphasis should focus on one aspect, depending on the objectives of the model. In the present case, the emphasis was on energy flow and trophic relations. The model reflects to some extent the spatial aspect by the separation of pelagics and demersals and by the explicit consideration of subsystems. The division in two distinct horizontal levels is also reflected by consumption requirements and prey items.
The aggregation of nonfish taxa was achieved by considering as well as possible the energetic aspect, leading to more or less distinct trophic groups. Taxa were aggregated intuitively based on criteria known to be related to energetic requirements. This was only achieved for higher taxonomic categories, since estimates at the species level were generally unavailable. A first attempt to leave the taxonomic level and proceed to an ataxonomic approach for combining elements, including fish and nonfish, was realized in the 20- and 10-box models of methods 1 and 2.
4.4.2. Weighting Factors
Parrish et al. (1986) emphasized the impact of predator abundance on predation pressure for a Hawaiian coral reef system. I agree with these authors. Indeed, it is not only abundance (in weight) of a predator which is of importance, but also its food requirements (QIB). Within species groups, a weighting factor could be calculated for every species of the model from average biomasses and QIB estimates to determine the "throughput" of every species in a group. The percentages of respective prey items (DC matrix) were then weighted by these factors (see "Materials and methods"). Between species groups, this relationship is produced by the key input parameters for each group (biomass, mortality = PIB ratio, and QIB).
Thus, ECOPATH II and some of the methods developed in the course of the work leading to this report provide possible solutions for a variety of problems related to ecosystem analysis.
4.4.3. lnput Estimates for Nonfish Taxa
lnput values for nonfish taxa had to be assembled from a wide geographical range for a wide variety of taxa. Preparation of input values was based on various qualitative and quantitative assumptions. The match between these data and the actual rates and states on the ground is not necessarily close. However, balancing of the model forced the various rates for
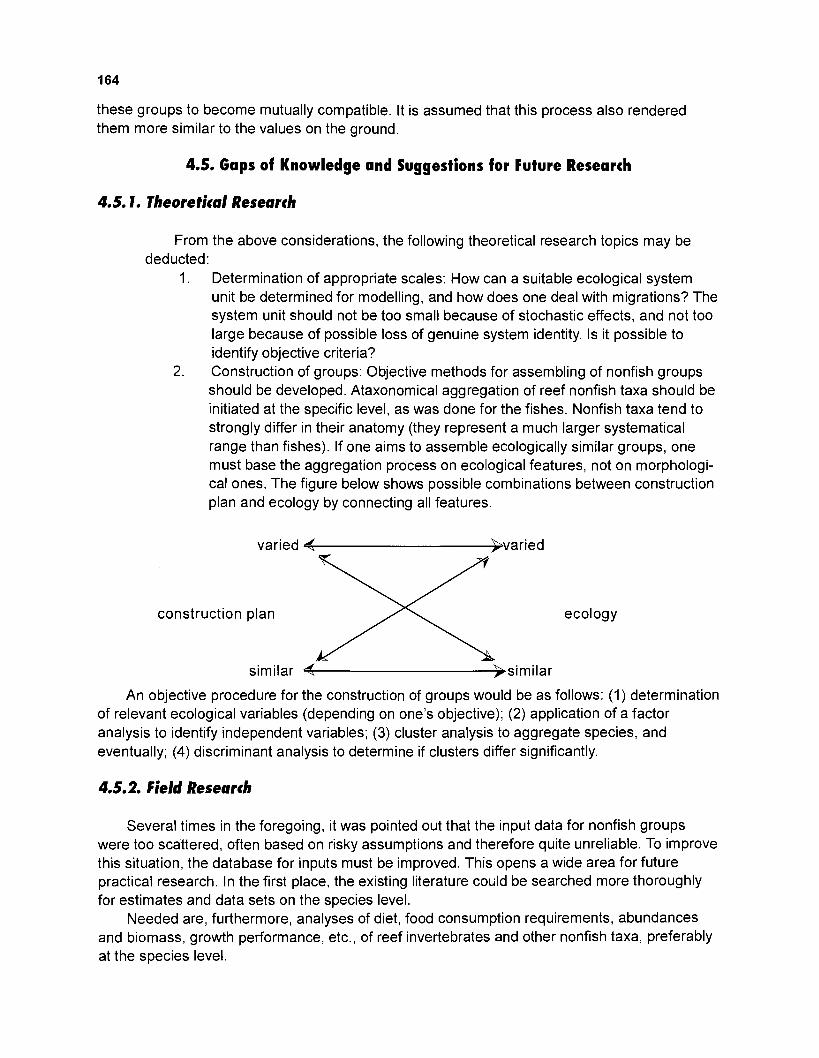
these groups to become mutually compatible. It is assumed that this process also rendered them more similar to the values on the ground.
4.5. Gaps of Knowledge and Suggestions for Future Research
4.5.1. Theoretical Research
From the above considerations, the following theoretical research topics may be deducted:
1. Determination of appropriate scales: How can a suitable ecological system unit be determined for modelling, and how does one deal with migrations? The system unit should not be too small because of stochastic effects, and not too large because of possible loss of genuine system identity. Is it possible to identify objective criteria?
2. Construction of groups: Objective methods for assembling of nonfish groups should be developed. Ataxonomical aggregation of reef nonfish taxa should be initiated at the specific level, as was done for the fishes. Nonfish taxa tend to strongly differ in their anatomy (they represent a much larger systematical range than fishes). If one aims to assemble ecologically similar groups, one must base the aggregation process on ecological features, not on morphologi- cal ones. The figure below shows possible combinations between construction plan and ecology by connecting all features.
varied I > a r i e d
construction plan ecology
similar '"similar
An objective procedure for the construction of groups would be as follows: (1) determination of relevant ecological variables (depending on one's objective); (2) application of a factor analysis to identify independent variables; (3) cluster analysis to aggregate species, and eventually; (4) discriminant analysis to determine if clusters differ significantly.
4.5.2. Field Research
Several times in the foregoing, it was pointed out that the input data for nonfish groups were too scattered, often based on risky assumptions and therefore quite unreliable. To improve this situation, the database for inputs must be improved. This opens a wide area for future practical research. In the first place, the existing literature could be searched more thoroughly for estimates and data sets on the species level.
Needed are, furthermore, analyses of diet, food consumption requirements, abundances and biomass, growth performance, etc., of reef invertebrates and other nonfish taxa, preferably at the species level.
Other areas requiring work are length-weight data and growth parameters for reef fish species which may not be of interest for fisheries, and rigorous studies of the DC of apex predators.
The initial biomasses of fish groups had to be changed considerably to balance the 50-box model. Biomasses of groups, including small pelagic or cryptic fish species, were strongly increased whereas biomasses of groups, including large- to intermediate-sized fish species (both carnivores and herbivores), were decreased, more or less proportional to the size of the fishes. The input biomasses of the large, highly motile predators had to be decreased the most.
Densities, used to compute biomasses of small pelagic fish species, were assumed to correspond to the highest abundance level encountered for reef fish species. More realistic estimates of abundance of small pelagic stocks in a given area should be obtained by the application of, e.g., hydroacoustic techniques (Thorne 1979).
The need to increase input biomasses of groups, including cryptic species, is not surprising: very small, cryptic species tend to be overlooked during visual censuses, and other methods should be used for biomass estimation (e.g., successive rotenone sampling and a Leslie plot, see above).
The case of large, highly motile predators is as straightforward. It could be that the SCUBA divers performing the censuses actually attract faraway apex predators (whose sense of smell and hearing is geared, indeed, to detect faraway, potential preys).
It could also be that census surveys in general, or at least those whose results were used in the present study, do not account appropriately for potential effect on estimated biomass of a brief sighting of a large or very large fish, compared with much longer sightings of smaller fish.
If so, one could imagine a correction factor, proportional to the inverse of the sighting time of any recorded fish, which would lead to estimates of "effective" biomass, i.e., to estimates of the biomass relying on a given reef for its food.
Last but not least, catch data must be considered, since there 1s fishing activity in the area. If it is not possible to obtain such data at the species level, attempts should be made to report catch data for ecological guilds, i.e., at the generic or family level. The f~sh species are divided into three main groups: (1) apex predators, loosely related to the reef; (2) a mainly carnivorous group comprising around 70%-80% of reef fish species; and (3) a mainly herbivorous group comprising a little more than 10% of species but around 40% of total fish biomass. This division could be utillzed for other purposes. The specles-rich cluster of (predominately) carnivores could be grouped by species of the same family or genus and thus better be matched with species clusters used in fisheries statistics. Appeldoorn and Lindeman (1 985) referred to species clusters known from fisheries statistics "in many respects to behave similar to a unispecies stock with size selective mortality". They identified species clusters to "approximating an ecological guild". Many of the model's fish groups contain several species of a family or genus. Examples are members of the families Haemulidae, Muraenidae, Blenniidae, Scaridae, Serranidae, etc. Note that, for fisheries management purposes, it is generally advisable to separate fish groups from nonfish groups.
What are the mechanisms by which stock size of, e.g., herbivorous reef fish is controlled, since predation pressure on these groups is rather low? Are they food- or recruitment-limited?
In future models, the ecological position of the different developmental stages of a fish species could be modelled by treating each stage as a different species with different inputs. These inputs could be prepared and stages clustered according to, e.g., energetic requirements.
Seasonal differences (e.g., rainy and dry seasons) could be modelled by producing one model for each season or month (as done by Jarre-Teichmann and Pauly 1993 for the Peru system).
New insights into structure and functioning of a coral reef as an ecosystem unit were achieved by the modelling process. By modifying inputs deducted from published information on the system (these changes are fully documented in the input-output tables in the "Results" section), a hypothetical reef could be constructed. Overall, the model presented here can be assumed to represent the specific coral reef system from which the majority of information was gathered. This hypothetical reef can now be tested and improved.
5. CONCLUSIONS
1. Quantitative steady-state models of a Caribbean coral reef system could be constructed from published data and estimates, based largely on multivariate statistics.
2. Calculated net primary production necessary to support the system modelled therein, of 20,025 gm-2year1WW, was well within the range of a rough estimate of 15,000-25,000 gm-2year IWW previously available for the Puerto Rico-Virgin Islands (PRVI) coral reef area.
3. Total fish biomass of 104 gm-2WW rendered an intermediate value when compared to model-independent estimates of coral reef fish biomass (23-1 60 gm-2WW) for several segments in the PRVl coral reef area.
4. The estimated total biomass, total fish biomass and total system throughput of the models indicate a large system compared to two other coral reef models analyzed by ECOPATH II (French Frigate Shoals [FFS], Hawaii, and Bolinao reef area, Philippines). The ratio of fish biomassltotal biomass was intermediate for PRVl with a higher ratio for FFS and a very low ratio for Bolinao due to high exploitation by fisheries.
5. The degree of piscivory for the Caribbean reef models presented here of 19% of reef fish biomass is well within the range reported for a Hawaiian coral reef fish community.
6. Large- to intermediate-sized herbivorous reef fish are not a preferred food item of larger piscivorous reef fish. This finding is also in agreement with observations from a Hawaiian coral reef fish community.
7. It was estimated that, based on their output biomass, parrotfish produce at least 160 g sand m-2year1 and may thus be considered as important sediment producers of the PRVl reef area.
8. The models' outputs indicate the existence of short cycles for an effective recycling of organic matter within the reef system. Most of the net primary production is recycled directly to the detrital pool. Transfer efficiencies between trophic levels are low.
9. The fact that the model could be balanced straightforwardly can be interpreted as showing that coral reef systems are in a "steady-state" or "flow-through equilibrium", when the appropriate spatial and temporal scale is selected. Investigations on small scales of reef community structure, which emphasize the stochastic variability of coral reefs, do not necessarily yield information on stability or instability of structures and processes at higher scales.
10. A very preliminary potential fisheries yield of 4 gm-2year1WW for unfished segments of the PRVl reef area was estimated from one of the models' outputs, i.e., the amount consumed by the models' apex predators. When these predators are removed first, their consumption becomes available to the fisheries.
11. A strong predation pressure is exerted on lobsters and conchs in unexploited parts of the PRVI coral reef system as indicated by the high ecotrophic efficiencies for crustaceans and gastropods. This shows how vulnerable these resources may be to an additional exploitation by fisheries.
12. The large number of fish species occurring in the PRVl reefs can effectively be reduced to a smaller number of groups by cluster analysis. Appropriate aggregation parameters are those referring to energetic requirements of a species, such as size, activity level and type of food.
13. For assembling nonfish groups, one should start from the species level and define appropriate energetic aggregation criteria by objective selection of ecological variables.
14. The contribution of predator abundance to predation pressure can be accounted for by weighting the fractions of prey of the diet composition by applying a weighting factor. This should be the product of density, mean weight and relative food consumption (QIB) of a predator.
15. A theoretical task for future models will be to identify objective criteria for the determination of spatial and temporal scales of the system which is to be modelled and define appropriate system boundaries.
16. lnformation on diet, food consumption requirements, abundances and growth performance should be obtained for nonfish taxa in the PRVl reef area. This would strongly improve the reliability of the models' outputs.
17. lnformation on length-weight data and growth parameters for fish species without interest for fisheries (e.g., very small ones) are needed.
18. Density estimates from visual censuses, especially for highly motile species, such as apex predators, should account for factors which may lead to overestimation of biomass. Density estimates for small andlor cryptic reef species should be obtained from repeated rotenone or similar sampling.
Density estimates for small schooling pelagics are urgently needed; appropriate estimates could be obtained by hydroacoustic techniques.
19. Catch data, preferably at the species level, should be obtained and included into the models. If it is impossible to obtain such data, attempts should be made to report catch data for ecological guilds, i.e., at the generic or family level.
20. The models, as they are now, represent a more constraining hypothesis than in the beginning. This new hypothesis can again be tested and improved.
Among all the people who helped and supported me in many ways during the preparation of the thesis upon which this work is based, I particularly thank: Dr. D. Pauly (ICLARM, Manila) for accepting me as his doctoral student, for his professional advice and support throughout the course of the investigation, for valuable critical comments and suggestions on contents and style of earlier drafts of the thesis which led to this report; Prof. Dr. Schnack for being my host during the preparation of this report and for his general support, advice and suggestions; Prof. Dr. Chapman, for critical comments and suggestions on contents and style of an earlier draft of this thesis; Dr. Villy Christensen, for advice on various aspects of the ECOPATH II software; the technical staff of the Fishery Biology Department, K. Burkert, B. Rohloff, H. Worthmann, D. Jarosch, for their friendly and general technical support; C. Klingenberg for his help with the performance of the cluster analyses on the VAX computer at the lnstitut fur Meereskunde; Dr. R. Froese for the preparation of a PC program to estimate and store the aspect ratios of the caudal fin of fishes and for putting an image-analyzing system at my disposal to measure these aspect ratios; the colleagues at the lnstitut fur Meereskunde, Kiel, the Kiel University, and the Alfred Wegener Institute for Polar and Marine Research, Bremerhaven, especially D. Barthel, T. Brey, C. Clemmesen, G. Graf, T. Grunkorn, V. Isaac, A. Jarre, F. Kcester, A. Morales, M. Prein, Prof. Rcettger, M. Ruth, L. Sarmiento, M. Vakily, U. Waller and W. Welsch for their readiness to discuss critical matters and for providing valuable information; I. Achenbach for helping me with the preparation of the figures and for her friendship; and Mrs. Wollweber, the Chief Librarian of the lnstitut fur Meereskunde and Dr. Kinzer for providing me with important literature.
My very special thanks go to my husband, H. Kausch. During the many years of the preparation of this report it was him who supported me financially, took care of the technical aspects of daily life, looked after our son and kept up my good spirit.
Abolmasova, G.I. 1985. Energy metabolism and food requirements in captive squid Sthenoteuthis oualaniensis (Lesson) from the Indian Ocean. Ehkol. Morya l9:lO4-llO.
Acevedo, M., 0 . Gomez and V. Berovides. 1984. Alimentacion de tres especies de quelonios marinos en la plataforma suroccidental de Cuba. Rev. Invest. Mar. 3:29-35.
Akhmeteva, E.A., B.A. Smirnov and O.K. Bordovskij. 1982. On some peculiarities of organic matter compo- sition in the intestine contents of the bottom detritus-feeding holothurians. Okeanologiya 22(6):1021- 1 024.
Alcolado, P.M. 1990. Breve comentario acerca de las comunidades de gorgonaceos de la macrolaguna del Golfo de Batabano, p. 33-36. In P.M. Alcolado (ed.) El bentos de la macrolaguna del Golfo de Batabano. Editorial Academia, La Habana, Cuba. 161 p.
Alifio, P.M., L.T. McManus, J.W. McManus, C.L. Nafiola, Jr., M.D. Fortes, G.C. Trono, Jr. and G.S. Jacinto. 1993. Initial parameter estimations of a coral reef flat ecosystem in Bolinao, Pangasinan, northwestern Philippines, p. 252-258. In V. Christensen and D. Pauly (eds.) Trophic models of aquatic ecosystems. ICLARM Conf. Proc. 26, 390 p.
Allen, K.R. 1971. Relation between production and biomass. J. Fish. Res. Board Can. 28:1573-1581. Alvarez-Lajonchere, L. 1981. Determinacion de la edad y el crecimiento de Mugilliza, M. curema, M. hospes
y M. trichodon (pisces, Mugilidae) en aguas cubanas. Rev. Invest. Mar. 2(1):142-162. Amaratunga, T. 1983. The role of cephalopods in the marine ecosystem, p. 416-452. In J.F. Caddy (ed.)
Advances in assessment of world cephalopod resources. FA0 Fish. Tech. Pap. 231. FAO, Rome. Ambrose, R.F. 1984. Food preferences, prey availability, and the diet of Octopus bimaculatus Verrill. J. Exp.
Mar. Biol. Ecol. 77:29-44. Ambrose, R.F. and B.V. Nelson. 1983. Predation by Octopus vulgaris in the Mediterranean. P.S.Z.N.I:Mar.
Eco~. 4(3):251-261. Andersen, K.P. 1982. An interpretation of the stomach contents of fish in relation to prey abundance. Dana
2: 1-50, Andersen, K.P. and E.A. Ursin. 1977. A multispecies extension to the Beverton and Holt theory of fishing with
accounts of phosphorus circulation and primary production. Medd. Dan. Fisk. Havunders NS 7:319- 435.
Andrew, N.L. and L.J. Stocker. 1986. Dispersion and phagokinesis in the echinoid Evechinus chloroticus (Val.). J. Exp. Mar. Biol. Ecol. 100(1-3):ll-23.
Anon. 1983. A study of the ecology of Turritella gonostoma living in the Gulf of California, Mexico. Abstract presented to the Fifteenth Annual Meeting: Titles and Abstracts. Annu. Rep. West. Soc. Malacol.
Appeldoorn, R.S. and K.C. Lindeman. 1985. Multispecies assessment in coral reef fisheries using higher taxonomic categories as unit stocks, with an analysis of an artisanal haemulid fishery, p. 507-514. In M. Harmelin Vivien and B. Salvat (eds.) Proceedings of the Fifth International Coral Reef Congress, 27 May-I June 1985, Tahiti. Vol. 5. Antenne Museum - EPHE, Moorea, French Polynesia.
Armstrong, D.W., J.R.G. Hislop, A.P. Raobb and M.A. Brown. 1983. A preliminary report on the analysis of whiting stomachs collected during the 1981 North Sea Stomach Sampling Project. ICES, Doc. C.M. 19831 G:59. Au, D. 1975. Considerations on squid (Loligo and Ilex) population dynamics and recommendations for ra-
tional exploitations. ICNAF Res. Doc. 75161, Ser. No. 3543. Augustinovics, M. 1970. Methods of international and intertemporal comparison of structurs, p. 249-269. In
A.P. Carter and A. Brody (eds.) Contributions to input-output analysis. Vol. I. North Holland, Amsterdam. Backhaus, K., B. Erichson, W. Plinke, C. Schuchard-Fischer and R. Weiber. 1987. Multivariate
analysemethoden. Springer Verlag, Berlin, Germany. 404 p.
Baerlocher, F., J. Gordon and R.J. Ireland. 1988. Organic composition of seafoam and its digestion by Corophium volufafor (Pallas). J. Exp. Mar. Biol. Ecol. 11 5(2): 179-1 86.
Baez, M., L.L. Alvarez and B. Pedroso. 1980. Edad y crecimiento del caballerote Lufjanus griseus (Linne), en Tunas de Zaza, Cuba. Rev. Invest. Mar. l(2-3):135-159.
Bajkov, A.D. 1935. How to estimate the daily food consumption of fish under natural conditions. Trans. Am. Fish. Soc. 65:288-289.
Bak, R.P.M., M.J.E. Carpay and E.D. de Ruytervan Steveninck. 1984. Densities of the sea urchin Diadema anfillarum before and after mass mortalities on the coral reefs of Curaqao. Mar. Ecol. (Prog. Ser.) 17: 105- 108.
Balasubramanian,T., C.B. Lalithambika Devi and M. Krishnankutty. 1979. Feeding behaviour and preying efficiency of Mefapenaeus dobsoni. Indian J. Mar. Sci. 8(3): 197-1 99.
Bamber, R.N. and M.H. Davis. 1982. Feeding of Achelia echinafa Hodge (Pycnogonida) on marine algae. J. Exp. Mar. Biol. Ecol. 60(2-3): 181 -1 87.
Bannerot, S.P., W.W. Fox, Jr. and J.E. Powers. 1987. Reproductive strategies and the management of snap- pers and groupers in the Gulf of Mexico and Caribbean, p. 561-604. In J.J. Polovina and S. Ralston (eds.) Tropical snappers and groupers: biology and fisheries management. Westview Press, Boulder, Colorado.
Barnes, R.D. 1963. Invertebrate zoology. W.B. Saunders Co., Philadelphia and London. 632 p. Beal, B.F. 1983. Predation of juveniles of the hard clam Mercenaria mercenaria (Linne) by the snapping
shrimp Alpheus heferochaelis Say and Alpheus normanni Kingsley. J. Shellfish Res. 3(1): 1-9. Beebe, W. and J. Tee-Van. 1928. The fishes of Port-au-Prince Bay, Haiti, with a summary of the known
species of marine fish of the island of Haiti and Santo Domingo. Zoologica 10(1):279 p., 268 text-figures. Beets, J. and L. Lewand. 1986. Collection of common organisms within the Virgin Islands National Park1
Biosphere Reserve. Biosphere Reserve Res. Rep. 3,45 p. Virgin Islands Resource Management Coop- erative, Virgin Islands National Park.
Behrens-Yamada, S. 1982. Growth and longevity of the mud snail Batillaria aftramenfaria. Mar. Biol. 67(2):187- 192.
Berg, C.J., Jr. and D.A. Olsen. 1989. Conservation and management of queen conch (Sfrombus gigas) fisheries in the Caribbean, p. 421-442. In J.F. Caddy (ed.) Marine invertebrate fisheries: their assess- ment and management. J. Wiley and Sons, New York.
Berg, C.J., Jr. and P. Alatalo. 1981. Laboratory culture of Bahamian bivalve molluscs: reproduction and general biology. Biol. Bull. Mar. Biol. Lab. Woods Hole 161:337-338. (Summary only.)
Berkeley, S.A. and E.D. Houde. 1978. Biology of two exploited species of halfbeaks, Hemiramphus brasiliensis and H. balao from southeast Florida. Bull. Mar. Sci. 28(4):624-644.
Berry, A.J. 1984. Umbonium vestiarium (L.) (Gastropoda, Trochacea) as the food source for naticid gastro- pods and a starfish on a Malaysian sandy shore. J. Molluscan Stud. 50(1):1-7.
Berry, A.J. 1988. Annual cycle in Refusa obtusa (Montagu) (Gastropoda, Opisthobranchia) of reproduction, growth and predation upon Hydrobia ulvae (Pennant). J. Exp. Mar. Biol. Ecol. 117(3):197-209.
Berry, P.F. 1982. Biomass and density of detritivores on a littoral rocky reef on the Natal Coast, with an estimate of population production for the ascidian Pyura stolonifera. Oceanogr. Res. Inst. Invest. Rep. 53:12 p.
Bertalanffy, L. von. 1934. Untersuchungen uber die Gesetzlichkeiten des Wachstums I. Roux'. Arch. Entwicklungsmech. 131 :613-652.
Bertalanffy, L. von. 1938. A quantative theory of organic growth (inquiries on growth laws II) Hum. Biol. lO(2): 181-213.
Bertalanffy, L. von. 1951. Theoretische Biologie. Vol.2.A. Francke, A.G. Verlag., Bern. Beverton, R.J.H. and S.J. Holt. 1957. On the dynamics of exploited fish populations. Fish. Invest. Min. Agric.
Fish Food, London, Ser. II, Vol. 19:533 p. Bitter, R. and P.E. Penchaszadeh. 1983. Ecologia trofica de dos estrellas de mar del genero Asfropecfen
coexistentes en Golfo Triste, Venezuela. Stud. Neotrop. Fauna Environ. 18(3):163-180. Bitter, R.A., R. Molinet and P.E. Penchaszadeh. 1980. lnteraccion trofica entre dos estrellas de mar (Astropecten
riensis y Tethyaster vestitus) en Golfo Triste, Venezuela. Bol. Inst. Oceanogr. S. Paulo 29(2):61-63. Bitter Soto, R. 1984. Composicion de la dieta de Astropecten marginatus (Echinodermata: Asteroidea). Bol.
Inst. Oceanogr. Univ. Oriente Cumana 23(1/2):169-176.
Boggs, C.H., J.A. Rice, J.A. Kitchell and J.F. Kitchell. 1984. Predation at a snail's pace: what's time to a gastropod? Oecologia 62(1 ) : I 3-1 7.
Bohlke, J.E. and C.C.G. Chaplin. 1968. Fishes of the Bahamas and adjacent tropical waters. Livingstone Publishing Co., Wynnewood, Pennsylvania. 771 p.
Borja, A. 1986. La alimentacion y distribucion del espacio en tres molluscos gastropodos:Rissoa panla (da Costa), Barleeia unifasciata (Montagu) y Bittium reticulatum (da Costa). Cah. Biol. Mar. 27(1):69-75.
Bouain, A. 1983. Croissance lineaire des serrans des c6tes sud-est de la Tunisie. Rapp. Comm. Int. Mer Medit. 28(5):87-91.
Boulon, R.H., Jr. 1986a. Map of fishery habitats within the Virgin lslands Biosphere Reserve. Biosphere Reserve Res. Rep. 8, 52 p. + appendix. Virgin lslands Resource Management Cooperative, Virgin lslands National Park.
Boulon, R.H., Jr. 198613. Fisheries habitat of the Virgin lslands region of ecological importance to the fishery resources of the Virgin lslands Biosphere Reserve. Biosphere Reserve Res. Rep. 9,22 p. Virgin lslands Resource Management Cooperative, Virgin lslands National Park.
Boulon, R.H., Jr. and I.E. Clavijo. 1986. Utilization of the Virgin lslands Biosphere Reserve by artisanal fishermen. Biosphere Reserve Res. Rep. 11, 36 p. Virgin lslands Resource Management Cooperative, Virgin lslands National Park.
Brawley, S.H. and W.H. Adey. 1981. The effect of micrograzers on algal community structure in a coral reef microcosm. Mar. Biol. 61 (2-3): 167-1 77.
Brawley, S.H. and W.H. Adey. 1982. Coralliophila abbreviata: a significant corallivore. Bull. Mar. Sci. 32(2):595- 599.
Brawley, S.H. and X.G. Fei. 1987. Studies of mesoherbivory in aquaria and in an unbarricaded mariculture farm on the Chinese coast. J. Phycol. 23(4):614-623.
Briscoe, C.S. and K.P. Sebens. 1988. Omnivory in Strongylocentrotus droebachiensis (Mueller) (Echinodermata: Echinoidea): predation on subtidal mussels. J. Exp. Mar. Biol. Ecol. 115(1):1-24.
Brito-Perez, R. and E. Diaz-lglesia. 1983. Observaciones sobre el consumo de aliment0 y su efecto sobre el crecimiento en juveniles de langosta (Panulirus argus) en el laboratorio. Rev. Invest. Mar. 1983:75-90.
Broom, M.J. 1981. Size-selection, consumption rates and growth of the Gastropoda Natica maculosa (Lamarck) and Thais carinifera (Lamarck) preying on the bivalve Anadara granosa (L.). J. Exp. Mar. Biol. Ecol. 56(2-3):213-233.
Broom, M.J. 1983. A preliminary investigation into prey species preference by the tropical gastropods Natica maculosa Lamarck and Thais carinifera (Lamarck). J. Molluscan Stud. 49(1):43-52.
Buchan, P.R. and M.J. Smale. 1981. Estimates of biomass, consumption and production of Octopus vulgaris Cuvier off the east coast of South Africa, Invest. Rep. Oceanogr. Res. Inst. 50:9 p.
Buesa, R.J. 1969. Biology and fishing of spiny lobsters, Panulirus argus (Latreille), p. 62-78. In A. Bogdanov (ed.) Soviet-Cuban fishery research. United States Department of Interior and Israel Program on Sci- ence Translation, Jerusalem.
Buesa, R.J. 1974. Population and biological data on turtle grass Thalassia tesfudinum Konig, 1805, on the northwestern Cuban shelf. Aquaculture 4:207-226.
Burkholder P.R., L.M. Burkholder and J.A. Rivero. 1959. Some chemical constituents of turtle grass Thalassia testudinum. Bull. Torrey Bot. Club 86:88-93.
Buschmann, A. and B. Santelices. 1987. Micrograzers and spore release in lridaea laminarioides Bory (Rhodophyta: Gigartinales). J. Exp. Mar. Biol. Ecol. 1 O8(2): 171 -1 79.
Caddy, J.F. 1983. The cephalopods: factors relevant to their population dynamics and to the assessment and management of stocks, p. 416-452. In J.F. Caddy (ed.) Advances in the assessment of world cephalopod resources. FA0 Fish. Tech. Pap. 231. FAO, Rome.
Cammen, L.M. 1980. Ingestion rate: an empirical model for aquatic deposit feeders and detritivores. Oecologia 44:303-310.
Carefoot, T.H. 1970. A comparison of absorption and utilization of food energy in two species of tropical Aplysia. J. Exp. Mar. Biol. Ecol. 5:47-62.
Carpenter, R.C. 1981. Grazing by Diadema antillarum (Phillippi) and its effects on the benthic algal commu- nity. J. Mar. Res. 39(4):749-765.
Carpenter, R.C. 1985. Relationships between primary production and irradiance in coral reef algal communi- ties. Limnol. Oceanogr. 30(4):784-793.
CFMC (Caribbean Fishery Management Council). 1984. Draft fishery management plan, regulatory impact review, and environmental impact statement for the shallow-water reef fish fishery of Puerto Rico and the U.S. Virgin Islands. Caribbean Fishery Management Council. 67 p. + appendix.
CFMC (Caribbean Fishery Management Council). 1985. Fishery management plan, final environmental im- pact statement, and draft regulatory impact review for the shallow-water reef fish fishery of Puerto Rico and the U.S. Virgin Islands. Caribbean Fishery Management Council. 45 p. + appendix.
CFMC (Caribbean Fishery Management Council). 1990. Amendment number 1 to the fishery management plan for the shallow-water reef fish fishery, preliminary environmental assessment and regulatory im- pact review. Caribbean Fishery Management Council. 30 p. + appendix.
Chang, M., J.S. Hong and H.T. Huh. 1988. Environmental conditions in the pearl oyster culture grounds and food organisms of Pinctada fucata martensii (Dunker) (Bivalvia, Pteroidea). Ocean Res. 10(1):67-77.
Chartock, M.A. 1983. Habitat and feeding observations on species of Ophiocoma (Ophiocomidae) at Enewetak. Micronesia 1 g(Il2): 131 -149.
Chesalin, M.V. 1987. On the feeding of Stenofeuthispferopus (Steenstrup, 1985) on lanternfishes (Myctophidae, Pisces). Ehkol. Morya 2575-80.
Chesson, J. 1983. The estimation and analysis of preference and its relationship to foraging models. Ecology 64(5): 1297-1 304.
Child, C.A. and G.R. Harbison. 1986. A parasitic association between a pycnogonid and a scyphomedusa in midwater. J. Mar. Biol. Assoc. U.K. 66( l ) : l l3 - l l7 .
Chilton, N.B. and C.M. Bull. 1986. Size-related selection of two intertidal gastropods by the reef crab Ozius truncatus. Mar. Biol. 93(3):475-480.
Chiu, S.T., V.W.W. Lam and P.K.S. Shin. 1985. Mollusc predation by Luidia spp. (Echinodermata: Asteroidea) in Tolo Harbour and Channel, Hong Kong, p. 365-379. The Malacofauna of Hong Kong and Southern China: Proceedings of the Second International Workshop on the Malacofauna of Hong Kong and South- ern China, Hong Kong, 6-24 April 1983. Vol. 2.
Chong, V.C. and A. Sasekumar. 1981. Food and feeding habits of the white prawn Penaeus merguiensis. Mar. Ecol. (Prog. Ser.) 5: 185-1 91.
Choy, S.C. 1986. Natural diet and feeding habits of the crabs Liocarcinus puber and L. holsatus (Decapoda, Brachyura, Portunidae). Mar. Ecol. (Prog. Ser.) 31 (1):87-99.
i hristensen, V. 1995. Ecosystem maturity -toward quantification. Ecol. Modelling 77:3-32. hristensen, V. and D. Pauly. 1990. The ECOPATH II model. Poster No. C.M. 1990/L:68 (Sess.Q) presented
at the Annual Meeting of the International Council for the Exploration of the Sea, 2-8 October 1990, Copenhagen.
'christensen. V. and D. Pauly. 1991. A guide to the ECOPATH II program (version 2.0). ICLARM Software 6. 71 p.
khristensen, V. and D. Pauly. 1992a. ECOPATH II: a software for balancing steady-state ecosystem models and calculating network characteristics. Ecol. Modelling 61 :169-185.
'christensen, V. and D. Pauly. 1992b. A guide to the ECOPATH II program (version 2.1). ICLARM Software 6, 72 p.
4~hristensen. V. and D. Pauly. 1995. Fish production, catches and the carrying capacity of the world oceans. Naga, ICLARM Q. 18(3):34-40.
j~hristensen, V. and D. Pauly. 1996. Ecological modelling for all. Naga, ICLARM Q. 19(2):25-26. Clark, E. and K. von Schmidt. 1965. Sharks of the Central Gulf Coast of Florida. Bull. Mar. Sci. 15(1):13-83. Claro, R., Editor. 1990. Asociaciones de peces en el Golfo de Batabano. Editorial Academia, La Habana,
Cuba. 128 p. Clavijo, I.E., J.A. Yntema and J.C. Ogden. 1980. An annotated list of the fishes of St. Croix, U.S.V.I. Second
edition. West lndies Laboratory, Christiansted, St. Croix. Clements, L.A. J. and S.E. Stancyk. 1984. Particle selection by the burrowing brittlestar Micropholis gracillima
(Stimpson) (Echinodermata: Ophiuroidea). J. Exp. Mar. Biol. Ecol. 84(1):1-13. Cockcroft, A. and A. Mclachlan. 1986. Food and feeding habits of the surf zone penaeid prawn Macropefasma
africanus (Balss). P.S.Z.N.1: Mar. Ecol. 7(4):345-357. Coen, L.D. 1988. Herbivory by Caribbean majid crabs: feeding ecology and plant susceptibility. J. Exp. Mar.
Biol. Ecol. 122(3):257-276. Coffroth, M.A. 1990. Mucous sheet formation on poritid corals: an evaluation of coral mucus as a nutrient
source on reefs. Mar. Biol. 105:30-49.
Colin, P.I. 1978. Caribbean reef invertebrates and plants. T.F.H. Publications, Inc., Neptune City, New Jersey. 512 p.
Collette, B.B. and C.E. Nauen. 1983. Scombrids of the world. FA0 Fish. Synop. 125(2), 137 p. FAO, Rome. Collette, B.B. and F.H. Talbot. 1972. Activity patterns of coral reef fishes with emphasis on nocturnal-diurnal
changeover, p. 98-124. In B.B. Collette and S.A. Earle (eds.) Results of the Tektite Program. Ecology of Coral Reef Fishes. Nat. Hist. Mus. L.A. Co. Sci. Bull. 14:180 p.
Collette, B.B. and S.A. Earle. 1972. Results of the Tektite Program: ecology of coral reef fishes. Nat. Hist. Mus. L.A. Co. Sci. Bull. 14:180 p.
Connor, J.L. and W.H. Adey. 1977. The benthic algal composition, standing crop and productivity of a Carib- bean algal ridge. Atoll Res. Bull. 211 :I-40.
Corredor, L. and M.M. Criales. 1977. Ethological and ecological aspects of fish cleaning shrimp (Crustacea: - Stenopodidae, Palaemonidae, Hippolytidae) in the Bay of Santa Marta, Columbia, and Young Island
Channel; St. Vincent, West Indies. Proc. Assoc. Isl. Mar. Lab. Caribb. 12:32 p. Corvea, A., M. Abreu and P.M. Alcolado. 1990. Caracteristicas de las comunidades de equinodermos de la
macrolaguna del Golfo de Batabano, p. 90-112. In P.M. Alcolado (ed.) El bentos de la macrolaguna del Golfo de Batabano. Editorial Academia, La Habana, Cuba.
Coyer, J.A., J.M. Engle, R.F. Ambrose and B.V. Nelson. 1987. Utilization of purple and red sea urchins (Stongylocentrotus purpuratus Stimpson and S. franciscanus Agassiz) as food by the white sea urchin (Lytechinus anamesus Clark) in the field and laboratory. J. Exp. Mar. Biol. Ecol. 105(1):21-38.
Creese, R.G. and A.J. Underwood. 1982. Analysis of inter- and intra-specific competition amongst intertidal limpets with different methods of feeding. Oecologia 53(3):337-346.
Criales, M.M. 1984. Shrimps associated with coelenterates, echinoderms, and molluscs in the Santa Marta region, Columbia. J. Crust. Biol. 4(2):307-317.
Daan, N. 1973. A quantitative analysis of the food intake of North Sea cod (Gadus morhua). Neth. J. Sea Res. 6:279-517.
Daan, N. 1983. Analysis of the cod data collected during the 1981 stomach sampling project. ICES Doc. C.M. 1983/G:61.
Dahl, A.L. 1973. Benthic algal ecology in a deep reef and sand habitat off Puerto Rico. Bot. Mar. 16:171-175. Dammann, A.E. 1969. Study of the fisheries potential of the Virgin Islands. V.I. Ecol. Res. Stn. Contrib. 1: l -
197. Darcy, G.H. 1983. Synopsis of biological data on the pigfish, Orthopristis chrysoptera (Pisces: Haemulidae).
NOAA Tech. Rep. NMFS Circ. 449. FA0 Fish. Synop. 134, 23 p. Davenport, J. 1988. The feeding mechanism of Yoldia (=Aequiyoldia) eights; (Courthouy). Proc. R. Soc.
Lond. Ser. B 232(1269):431-442. Dean, T.A., F.R. Jacobsen, K. Thies and S.L. Lagos. 1988. Differential effects of grazing by white sea urchins
on recruitment of brown algae. Mar. Ecol. (Prog. Ser.) 48(1):99-102. Dearborn, J.H. and K.C. Edwards. 1985. Analysis of data on the feeding biology of Antarctic sea stars and
brittle stars. Antarct. J. U.S. 19(5):138-139. Delille, D., L.D. Guidi and J. Soyer. 1985. Nutrition of Allotanais hirsutus (Crustacea: Tanaidacea) at Kerguelen
Island. Antarct. Nutr. Cycles Food Webs: 378-380. Deslous-Paoli, J.M., M. Heral and H. Masse. 1985. Bilan energetique d'une population naturelle de Crepidula
fornicata dans le bassin de Marennes-Oleron. Base Biologiques de I'Aquaculture, Montpellier, 12-16 December 1983. Actes Colloq. IFREMER: 109-124.
DHI (Deutsches Hydrographisches Institut). 1960. Monatskarten fur den lndischen Ozean. No. 2422. Third edition. Deutsches Hydrographisches Institut, Hamburg.
DHI (Deutsches Hydrographisches Institut). 1967. Monatskarten fur den Nordatlantischen Ozean. No. 2420. Fourth edition. Deutsches Hydrographisches Institut, Hamburg.
Dilly, P.N. 1985. The habitat and behaviour of Cephalodiscus gracilis (Pterobranchia, Hemichordata) from Bermuda. J. Zool. 207(2):223-239.
Dominguez, C.J. and P.M. Alcolado. 1990. Caracteristicas del macrofitobentos de la macrolaguna del Golfo de Batabano, p. 8-17. In P.M. Alcolado (ed.) El bentos de la macrolaguna del Golfo de Batabano. Edito- rial Academia, La Habana, Cuba.
Dominguez, J.H. and M.L. Reaka. 1988. Temporal activity patterns in reef-dwelling stomatopods: a test of alternative hypotheses. J. Exp. Mar. Biol. Ecol. 11 7:47-69:
Doornbos, G. and F. Twisk. 1987. Density, growth and annual food consumption of gobiid fish in the saline lake Grevelingen, the Netherlands. Neth. J. Sea Res. 21(1):45-74.
Downing, N. and C.R. El-Zahr. 1987. Gut evacuation and filling rates in the rock-boring sea urchin, Echinomefra mafhaei. Bull. Mar. Sci.: 579-584.
Drifmeyer, J.E. 1981. Urchin Lyfechinus variegafus grazing on eelgrass, Zostera marina. Estuaries 4(4):374- 375.
Drits, A.V., T.N. Semenova and B.V. Konovalov. 1987. Production of zooxanthellae in planktonic Foraminifera and colonial Radiolaria from the tropical Atlantic. Okeanologiya 27(l): 125-1 31.
Drummond-Davis, N.C., K.H. Mann and R.A. Pottle. 1982. Some estimates of population density and feeding habits of the rock crab, Cancerirroratus, in a kelp bed in Nova Scotia. Can. J. Fish. Aquat. Sci. 39(4):636- 639.
DSouza, M. 1986. The food of some neritid prosobranch mollusks found at Mkomani Mombasa, Kenya. Kenya Aquat. 3:46-49.
DuPreez, H.H. 1984. Molluscan predation by Ovalipes puncfafus (De Haan) (Crustacea: Brachyura: Portunidae). J. Exp. Mar. Biol. Ecol. 84(1):55-71.
Durbin, E.G., A.G. Durbin, R.W. Langtonand R.E. Bowma. 1983. Stomach contents of silver hake Merluccius bilinearis, and Atlantic cod, Gadus morhua, and estimation of their daily rations. Fish. Bull. 81(3):437- 454.
Earle, S.A. 1972. The influence of herbivores on the marine plants of Great Lameshur Bay, with an annotated list of plants, p. 17-44. In B.B. Collette and S.A. Earle (eds.) Results of the Tektite Program: ecology of coral reef fishes. Nat. Hist. Mus. L.A. Co. Sci. Bull. 14,180 p.
Elliot, J.A. and L. Persson. 1978. The estimation of daily rates of food consumption for fish. J. Anim. Biol. EcoI. 471977-991,
Engstrom, N.A. 1977. Behaviour of two snails: escape by Turbo casfanea from predatory attacks of Fasciolaria fulipa. Proc. Assoc. Isl. Mar. Lab. Caribb. 12:35 p.
Erhardt, N.M. and V.R. Restrepo. 1989. The Florida stone crab fishery: a reusable resource?, p. 225-240. In J.F. Caddy (ed.) Marine invertebrate fisheries: their assessment and management. J. Wiley and Sons, New York.
Eyberg, 1. 1984. The biology of Parablennius cornufus (L.) and Scariella emarginata (Gijnther) (Teleostei: Blenniidae) on a Natal Reef. Invest. Rep. Oceanogr. Res. Inst. 54:16 p.
Fauchald, K. and P.A. Jumars. 1979. The diet of worms: a study of polychaete feeding guilds. Oceanogr. Mar. Biol. Annu. Rev. 17:193-284.
Fehlbeck, H. 1983. Sulfide oxidation and carbon fixation by the gutless clam Solemya reidi: an animal- bacteria symbiosis. J. Comp. Physiol. B 152(1):3-11.
Ferreira de Menezes, M. and M. Pinto Paiva. 1966. Notes on the biology of tarpon, Tarpon aflanficus (Cuvier & Valenciennes), from coastal waters of Ceara state, Brazil. Arq. Est. Biol. Mar. Univ. Fed. Ceara 6(1):83-98.
Figueras, A. 1986. Alimentacion de Palaemon adspersus (Rathke, 1837) y Palaemon serratus (Pennant, 1777) (Decapoda: Natantia) en la ria de Vigo (N.O. EspaAa). Cah. Biol. Mar. 27(1):77-90.
Figuereido, J.L. and N.A. Menezes. 1977. Manual de peixes marinhos do sudeste do Brasil. Vol. I-IV. Museu de Zoologia, Universidade de S%o Paulo.
Finn, J.T. 1976. Measure of ecosystem structure and function derived from the analysis of flows. J. Theor. Biol. 56:363-380.
Fischer, W., Editor. 1978. FA0 species identification sheets for fishery purposes. Western Central Atlantic (Fishing Area 31). Vol. I-VII. Food and Agriculture Organization of the United Nations, Rome.
Foster, S.A. 1987. The relative impacts of grazing by Caribbean coral reef fishes and Diadema: effects of habitat and surge. J. Exp. Mar. Biol. Ecol. 105(1):1-20.
Freitas, J.C. de. 1982. Preda~ao de Sfenorhynchus seficornis (Crustacea, Majidae) por Diplasferias brandfii (Asteroidea) e Epinephelus morio (Teleostei). Cienc. Cult. 34(8): 1056-1 058.
Fujioka, Y. and K. Yamazato. 1983. Host selection of some Okinawan coral associated gastropods belonging to the genera Drupella, Coralliophila and Quoyula. Galaxea 2(1):59-73.
Garcia, S. 1985. Reproduction, stock assessment models and population parameters in exploited penaeid shrimp populations, p. 139-158. In P.C. Rothlisberg, B.J. Hill and D.J. Staples (eds.) Second Australian National Prawn Seminar, 22 October 1984, Kooralbyn, Australia.
Garrity, S.D. and S.C. Levings. 1981. A predator-prey interaction between two physically and biologically constrained tropical rocky shore gastropods: direct, indirect and community effects. Ecol. Monogr. 51 (3):267-286.
Gerking, S.D. 1962. Production and food utilization in a population of bluegill sunfish. Ecol. Monogr. 32:31- 78.
Gibbons, M.C. 1984a. Comparison of energetics of hard clam predation by Neopanope sayi, Ovalipes ocellatus, and Pagurus longicarpus. J. Shellfish Res. 4(1):90. (Summary only.)
Gibbons, M.C. 1984b. Predation of juveniles of the hard clam Mercenaria mercenaria (Linne) by fifteen invertebrate species with special reference to crabs. J. Shellfish Res. 4(1):90. (Summary only.)
Giovanardi, 0 . and G. Piccinetti Manfrin. 1984. Report of the Third Technical Consultation on Stock Assess- ment in the Adriatic, Fano, Italy, 6-10 June 1983. FA0 Fish. Rep. 29O:l3l-l34.
Gladfelter, W.B. 1980. Fish community structure and dynamics in five reef environments. In E.H. Gladfelter and W.B. Gladfelter (eds.) Environmental studies of Buck Island Reef National Monument Ill, St. Croix, U.S.V.I. West lndies Laboratory, St. Croix.
Gladfelter, W.B., E.H. Gladfelter, R.K. Monahan, J.C. Ogden and R.F. Dill. 1977. Environmental studies of Buck Island Reef National Monument. U.S. National Park Service Report. 144 p.
Glynn, P.W. 1973. Aspects of the ecology of coral reefs in the Western Atlantic region, p. 271-324. In O.A. Jones and R. Endean (eds.) Biology and geology of coral reefs. Vol. II. Biology 1. Academic Press, New York.
Glynn, P.W. 1983. Increased survivorship in corals harboring crustacean symbionts. Mar. Biol. Lett. 4(2): 105- 111.
Gomez, E.D., R.A. Guieb and E. Aro. 1983. Studies on the predators of commercially important seaweeds. Fish. Res. J. Philipp. 8(1):1-17.
Gomez, O., D. lbarzabal and A. Silva. 1980. Evaluacion cuantitativa de bentos en la region suroccidental de Cuba. Inf. Cient.-Tec. 149:l-25. Academia de Ciencias de Cuba, Havana, Cuba.
Gonzalez-Liboy, J.A. 1979. An examination of the present condition of seagrasses in La Parguera, Puerto Rico. Final Report. Department of Natural Resources and United States F.W.S., Atlanta, Georgia. 87 p.
Gottfried, M. and M.R. Roman. 1983. Ingestion and incorporation of coral-mucus detritus by reef zooplankton. Mar. Biol. 72:211-218.
Graham, R. 1984. Bay scallop mariculture. Underwat. Nat. l4(4): 14-1 7. Greenway, M. 1974. The effects of cropping on the growth of Thalassia fesfudinum (Konig) in Jamaica.
Aquaculture 4: 199-206. Griffiths, R.J. 1981. Predation on the bivalve Choromyfilus meridionalis (Kr.) by the gastropod Natica
(Tecfonafica) fecta Anton. J. Mollusc. Stud. 47(1):112-120. Guerra, A. 1979. Fitting a von Bertalanffy expression to Octopus vulgaris growth. Invest. Pesq. 43(1):319-
326. Guitart, B. and A. Hondares. 1980. Crustaceos. Rev. Cub. Invest. Pesq. 5(3):1-21. Gulland, J.A. 1983. Fish stock assessment: a manual of basic methods. John Wiley and Sons, New York.
223 p. Gunnill, F.C. 1983. Differing distributions of potentially competing amphipods, copepods and gastropods
among specimens of the intertidal alga Pelvetia fastigiata. Mar. Biol. 82(3):277-291. Guo-Xin, Fan-Guangzuan, Jia-Guosheng. 1986. A preliminary study of the feeding habit of Sepiella maindroni
de Rochebrune. J. Zhejiang Coll. Fish. 5(2):171-176. Gygi, R.A. 1975. Sparisoma viride (Bonnaterre), the stoplight parrotfish, a major sediment producer on coral
reefs of Bermuda? Eclogae Geol. Helv. 68(2):327-359. Hall, S.J., D. Raffaelli and W.R. Turrell. 1990. Predator-caging experiments in marine systems: a reexamination
of their value. Am. Nat. 136(5):657-672. Hallock, P. 1981. Production of carbonate sediments by selected large benthic Foraminifera on two Pacific
coral reefs. J. Sediment. Petrol. 51 (2):467-474. Hammond, L.S. 1983. Nutrition of deposit-feeding holothuroids and echinoids (Echinodermata) from a shal-
low reef lagoon, Discovery Bay, Jamaica. Mar. Ecol. (Prog. Ser.) 10(3):297-305. Hammond, L.S. and C.R. Wilkinson. 1985. Exploitation of sponge exudates by coral reef holothuroids. J.
Exp. Mar. Biol. Ecol. 94:l-9. Hannon, B. 1973. The structure of ecosystems. J. Theor. Biol. 41:535-546.
Hannon, B. and C. Joiris. 1989. A seasonal analysis of the southern North Sea ecosystem. Ecology 70(6):1916- 1934.
Hardison, L.K. and C.L. Kitting. 1985. Epiphytic algal browsing by Bittium varium (Gastropoda) among Thalassia testudinum turtlegrass. Papers presented at the Annual Meeting of the Phycological Society of America at the University of Florida, 13-1 5 August 1985, Gainesville. J. Phycol. 21 (Suppl.):I 3. (Summary only.)
Hargrave, B.T. 1985. Feeding rates of abyssal scavenging amphipods (Eurythenes gryllus) determined in situ by time-lapse photography. Deep-sea Res. 32(41):443-450.
Harrold, C. 1982. Escape responses and prey availability in a kelp forest predator-prey system. Am. Nat. 119(1):132-135.
Hatcher, B.G. 1990. Coral reef primary productivity: a hierarchy of pattern and process. Trends Ecol. Evol. 5: 149-1 55.
Hawkins, C.M. 1979. Ecological energetics of the tropical sea urchin Diadema antillarum Philippi in Barba- dos, West Indies. McGill University. Ph.D. thesis.
Hawkins, C.M. 1985. Population carbon budget and the importance of the amphipod Corophium volutator in the carbon transfer on a Cumberland Basin mudflat, Upper Bay of Fundy, Canada. Neth. J. Sea Res. 19(2):165-176.
Hendler, G. and J.E. Miller. 1984. Feeding behavior of Asteroporpa annulata, a gorgonocephalid brittlestar with unbranched arms. Bull. Mar. Sci. 34(3):449-460.
Hensen, R. 1984. Food availability and feeding preferences of the queen conch Strombus gigas (Linne) collected from natural habitats. J. Shellfish Res. 4(1):91. (Summary only.)
Heukelem, W.F., van. 1984. A comparison of food intake, food conversion efficiency, and growth rate of Octopus cyanea Gray and Octopus mya Voss and Solis. J. Shellfish Res. 4(1):102. (Summary only.)
Hillis-Colinvaux, L. 1974. Productivity of the coral reef alga Halimeda (Order Siphonales), p. 35-42. In Pro- ceedings of the Second International Symposium on Coral Reefs 1, 22 June-2 July 1973, Australia.
Hoffman, D.L., W.C. Homan, J. Swanson and P.J. Weldon. 1978. Flight responses of three congeneric spe- cies of intertidal gastropods (Prosobranchia: Neritidae) to sympatric predatory gastropods from Barba- dos. Veliger 21 (2):293-296.
Horn, P.L. 1986. Energetics of Chiton pelliserpentis (Quoy and Gaimard, 1835) (Molluscs: Polyplacophora) and the importance of mucus in its energy budget. J. Exp. Mar. Biol. Ecol. 101:119-141.
Hourigan, T.F., F.G. Stanton, P.J. Motta, C.D. Kelley and B. Carlson. 1989. The feeding ecology of three species of Caribbean angelfishes (family Pomacanthidae). Environ. Biol. Fish. 24(2): 105-1 16.
Howard, R.K. 1982. Impact of feeding activities of epibenthic amphipods on surface-fouling of eelgrass leaves. Aquat. Bot. 14(1):91-97.
Howard, R.K. 1984. The trophic ecology of caridean shrimps in an eelgrass community. Aquat. Bot. 18(11 2): 155-174.
Hubold, G. and M.V. Mazzetti. 1982. Growth, morphometry, and aspects of life history of the scaled sardine Harengula jaguana Poey, 1865 in the Guanabara Bay (Brazil). Meeresforschung 29:80-88.
Huebner, J.D. and D.C. Edwards. 1981. Energy budget of the predatory marine gastropod Polinices duplicatus. Mar. Biol. 61:221-226.
Hughes, R.N. 1985a. Notes on the feeding behaviour of Tonna zonatum (Tonnidae) and Phalium bisulcatum (Cassidae) (Tonnacea). The malacofauna of Hong Kong and Southern China, p. 623-626. In Proceed- ings of the Second International Workshop on the Malacofauna of Hong Kong and Southern China, 6-24 April 1983, Hong Kong. Vol. II.
Hughes, R.N. 1985b. Predatory behaviour of Natica unifasciata feeding intertidally on gastropods. J. Molluscan Stud. 51 (3):331-335.
Hughes, T.P., B.D. Keller, J.B.C. Jackson and M.J. Boyle. 1985. Mass mortality of the echinoid Diadema antillarum Philippi in Jamaica. Bull. Mar. Sci. 36(2):377-384.
Ibarzabal, D.R. 1990. Caracteristicas de las comunidades de poliquetos de la macrolaguna del Golfo de Batabano, p. 37-52. In P.M. Alcolado (ed.) El bentos de la macrolaguna del Golfo de Batabano. Editorial Academia, La Habana, Cuba.
Ivlev, V.S. 1939. Balance of energy in carps. Zool. Zh. 18:303-318. Ivlev, V.S. 1961. Experimental ecology of the feeding of fishes. (Translated from Russian by Douglas Scott).
Yale University, New Haven. 302 p.
Ivlev, V.S. 1966. The biological productivity of the sea. (Translated from Russian by W.E. Ricker). J. Fish. Res. Board Can. 23(l l): 1727-1 759.
Jacobsen, T. and J. Browder. 1987. The ecological basis of fishery yield of the Puerto Rico-Virgin Islands insular shelf. 1. Literature review. (Unpubl.)
Jafari, R.D. and D.M. Mahasneh. 1987. The effect of seagrass grazing on the sexual maturity of the sea urchin Tripneustes gratilla in the Gulf of Aquaba. Dirasat. l4 ( l ) : 127-1 36.
J~arre-~eichmann. A. and D. Pauly 1993. Seasonal changes in the Peruvian upwelling ecosystem, p. 307- 316. In V. Christensen and D. Pauly (eds.) Trophic models of aquatic ecosystems. ICLARM Conf. Proc. , 26,390 p:
Jarre-Teichmann, A., P. Muck and D. Pauly. 1991. Two approaches for modelling fish stock interactions in the Peruvian upwelling ecosystem. ICES Mar. Symp. 193: 171 -1 84.
'~arre-Teichmann. A., M.L. Palomares. M. Soriano. V. Sambilay, Jr. and D. Pauly. 1990. MAXIMS computer - program for estimating food consumption of fishes. ICLARM Software 4. 19 p. Jimenez, C. and D. Ibarzabal. 1982. Evaluacion cuantitativa del mesobentos en la plataforma nororiental de
Cuba. Cienc. Biol. 754-69. Jobling, M. 1981. Mathematical models for gastric emptying and the estimation of daily rates of food con-
sumption for fish. J. Fish Biol. 19:245-257. Johnson, A.G. and C.H. Salomon. 1984. Age, growth, and mortality of gray triggerfish, Balistes capriscus,
from the northeastern Gulf of Mexico. Fish. Bull. 82(3):485-492. Johnson, S.B. and Y.G. Attramadal. 1983. A functional-morphological model of Tanais cavolinii Milne-Edwards
(Crustacea, Tanaidacea) adapted to a tubiculous life strategy. Sarsia 67(1):29-42. Joll, L.M. and B.F. Phillips. 1984. Natural diet and growth of juvenile western rock lobster Panulirus cygnus
George. J. Exp. Mar. Biol. Ecol. 75(2):145-169. Jones, G.P. 1986. Food availability affects growth in a coral reef fish. Oecologia 7O(l): 136-1 39. Jones, G.P. 1987. Competitive interactions among adults and juveniles in a coral reef fish. Ecology 68(5):1534-
1 547. Jones, J.A. 1963. Ecological studies of southeastern Florida patch reefs. Part I. Diurnal and seasonal changes
in the environment. Bull. Mar. Sci. 13:282-307. Jones, R. 1976. Growth of fishes, p. 251-279. In D.H. Cushing and J.J. Walsh (eds.) The ecology of the seas.
Blackwell Scientific Publications, Oxford. Kaminski, M. 1984. Food composition of three bryozoan species (Bryozoa, Phylactolaemata) in a mesotrophic
lake. Pol. Arch. Hydrobiol. 31(1):45-53. Kanwisher, J.W. and S.A. Wainwright. 1967. Oxygen balance in some reef corals. Biol. Bull. 33:378-390. Kasinathan, R., K. Govindan and B.N. Desai. 1975. On the Opisthobranch Haminoea vitrea (A. Adams,
1850) from Madh Island (Bombay). J. Mar. Biol. Assoc. India 17(3):696-701. Kilar, J.A. and R.M. Lou. 1986. The subtleties of camouflage and dietary preference of the decorator crab,
Microphrys bicornutus Latreille (Decapoda: Brachyura). J. Exp. Mar. Biol. Ecol. 101 (1 -2): 143-1 60. Kim, Y.H., S.D. Lee and B.G. Kim. 1983. Ecological studies on the shrimp, Trachypenaeus curvirostris
(Stimpson). Bull. Fish. Res. Dev. Agency, Pusan 32:25-30. Kimmel, J.J. 1985. A characterization of Puerto Rican fish assemblages. Ph. D. dissertation. Univ. Puerto
Rico, Mayagiiez. Kitting, C.L. 1985. Adaptive significance of short-range die1 migration differences in a seagrass meadow snail
population. Migration: mechanisms and adaptive significance. Contrib. Mar. Sci.:227-243. Klumpp, D.W. and A.D. McKinnon. 1989. Temporal and spatial patterns in primary production of a coral-reef
epilithic algal community. J. Exp. Mar. Biol. Ecol. 131:l-22. Klumpp, D.W. and N.V.C. Polunin. 1989. Partitioning among grazers of food resources within damselfish
territories on a coral reef. J. Exp. Mar. Biol. Ecol. 125:145-169. Klumpp, D.W. and P.D. Nichols. 1983. Utilisation of the seagrass Posidonia australis as food by the rock crab
Nectocarcinus integrifons (Latreille) (Crustacea: Decapoda: Portunidae). Mar. Biol. Lett. 4(6):331-339. KNMl (Koninklijk Nederlands Meteorologisch Instituut). 1957. Middellandse Zee. Oceanografische en
meteorologische gegevens. Koninklijk Nederlands Meteorologisch lnstituut Publ. No. 138, 91 p. Knoppers, B.A. and S. Opitz. 1984. An annual cycle of particulate organic matter in mangrove waters,
Laranjeiras Bay, southern Brazil. Arq. Biol. Tecnol. 27(1):79-93. Kobayashi, D.R. 1986. Octopus predation on hermit crabs: A test of selectivity. Mar. Behav. Physiol. 12(2):125-
131.
Kohlmeyer, J. and B. Bebout. 1986. On the occurrence of marine fungi in the diet of Littorina angulifera and observations on the behavior of the periwinkle. P.S.Z.N.1: Mar. Ecol. 7(4):333-343.
Kohn, A.J. 1980. Abundance, diversity, and resource use in an assemblage of Conus species in Enewetak Lagoon. Pac. Sci. 34(4):359-369.
Kohn, A.J. and M.C. Lloyd. 1973. Polychaetes of truncated reef limestone substrates on Eastern Indian Ocean coral reefs: diversity, abundance and taxonomy. Int. Rev. Gesamt. Hydrobiol. 58:369-399.
Kotaki, Y, Y. Oshima and T. Yasumoto. 1985. Bacterial transformation of paralytic shellfish toxins in coral reef crabs and a marine snail. Bull. Japan Soc. Sci. Fish./Nissuishi 51(6):1009-1013.
Kropp, R.K. 1981. Additional porcelain crab feeding methods. (Decapoda, Porcellanidae). Crustaceana 40(3):307-310.
Kurihara, Y. and K. Okamoto. 1987. Cannibalism in a grapsid crab, Hemigrapsus penicillatus. Mar. Ecol. (Prog. Ser.) 41 (2):123-127.
Laevastu, T. and H.A. Larkins. 1981. Marine fisheries ecosystem, its quantitative evaluation and manage- ment. Fishing News Books, Farnham, United Kingdom.
Lafontaine, Y. de and R.H. Peters. 1986. Empirical relationships for marine primary production: the effect of environmental variables. Oceanol. Acta 9(1):65-72.
Lam, V.W.W. and S.T. Chiu. 1985. Prey selection and feeding behaviour of Octopus membranaceus (Quoy and Gaimard 1822). The malacofauna of Hong Kong and Southern China, p. 661-681. In Proceedings of the Second International Workshop on the Malacofauna of Hong Kong and Southern China, 6-24 April 1983, Hong Kong. Vol. 2.
Lau, C.J. 1987. Feeding behavior of the Hawaiian slipper lobster Scyllarides squammosus, with a review of decapod crustacean feeding tactics on molluscan prey. Second International Symposium on Indo-Pa- cific Marine Biology, Western Society of Naturalists, 23-28 June 1986, University of Guam. Bull. Mar. Sci.:378-391.
Laughlin, R.A. 1982. Feeding habits of the blue crab, Callinectes sapidus Rathbun, in the Apalachicola Estu- ary, Florida. Bull. Mar. Sci. 32(4):807-822.
Lawton, P. and R.N. Hughes. 1985. Foraging behaviour of the crab Cancerpagurus feeding on the gastro- pods Nucella lapillus and Littorina littorea: Comparisons with optimal foraging theory. Mar. Ecol. (Prog. Ser.) 27(1-2): 143-1 54.
Lee, J.H., J.S. Hong and S.K. Yi. 1983. Studies on the benthic fauna in Garolim Bay, Korea. Subtidal soft- bottom community. J. Oceanol. Soc. Korea 18(2):111-116.
Leontief, W. 1951. The structure of the American economy, 191 9-1 939. Second edition. Oxford University Press, New York. 264 p.
Lester, S.M. 1985. Cephalodiscus sp. (Hemichordata: Pterobranchia): observations of functional morphol- ogy, behavior and occurrence in shallow water around Bermuda. Mar. Biol. 85(3):263-268.
Lewis, C.A. 1981. Juvenile to adult shift in feeding strategies in the pedunculate barnacle Pollicipespolymerus (Sowerby) (Cirripedia, Lepadomorpha). Crustaceana 41 (1): 14-20.
Lewis, J.B. 1981. Coral reef ecosystems, p. 127-158. In A. Longhurst (ed.) Analysis of marine ecosystems. Academic Press Ltd , San Diego.
Lewis, J.B. 1982. Feeding behaviour and feeding ecology of the Octocorallia (Coelenterata: Anthozoa). J. ZOO^. 196(3):371-384.
Lindeman, R.L. 1942. The trophic-dynamic aspect of ecology. Ecology 23:399-418. Lindsey, C.C. 1978. Form, function and locomotory habits in fish, p. 1-100. In W.S. Hoar and D.J. Randall
(eds.) Fish physiology. Vol. 8: Locomotion. Academic Press, New York. 576 p. Lipinski, M.R. and T.B. Linkowski. 1988. Food of the squid Ommastrephes bartramii (LeSueur, 1981) from
J the Southwest Atlantic Ocean. S. Afr. J. Mar. Sci. 6:43-46. Longhurst, A.R. and D. Pauly. 1987. Ecology of tropical oceans. Academic Press, New York. 407 p. Macdonald, J.S. and R.H. Green. 1983. Redundancy of variables used to describe importance of prey spe-
cies in fish diets. Can. J. Fish. Aquat. Sci. 40:635-637. Mackay, A. 1981. The generalized inverse. Practical Comput. (September): 108-1 10. Maes, V.O. 1982. Observations on the systematics and biology of a turrid gastropod assemblage in the
British Virgin Islands. Bull. Mar. Sci. 33(2):305-335. Mahon, R., Editor. 1987. Report and Proceedings of the Expert Consultation on Shared Fishery Resources
of the Lesser Antilles Region, Mayagiiez, 8-12 September 1986, Puerto Rico. FA0 Fish. Rep. 383, 106 p. FAO, Rome.
'~ajkowski. J. 1982. Usefulness and applicability of sensitivity analysis in a multispecies approach to fisher- ies management, p. 149-166. In D. Pauly and G.I. Murphy (eds.) Theory and management of tropical fisheries. ICLARM Conf. Proc. 9, 360 p.
Majkowski, J. and W.S. Hearns. 1984. Comparison of three methods for estimating the food intake of a fish. Can. J. Fish. Aquat. Sci.41(1):212-215.
Malkov, A.S. 1978. Abundancia del stock comercial de langosta Panulirus argus, Latreille 1804, en la region suroccidental de la plataforma cubana. Rev. Cub. Invest. Pesq. 3(4):1-11.
Mann, K.H. 1978. Estimating the food consumption of fish in nature, p. 250-273. In S.D. Gerking (ed.) Ecol- ogy of freshwater fish production. Blackwell Scientific Publications, Oxford. 520 p.
Mann, K.H. 1982. Ecology of coastal waters: a systems approach. Blackwell Scientific Publications, Oxford. 322 p.
~ a r ~ a l e f , ' R. 1971. The pelagic ecosystem of the Caribbean Sea, p. 477-482. In Symposium on Investiga- tions on and Resources of Caribbean Sea and Adjacent Regions, 1968, Willemstad, Cura~ao. arten en. G.G. and J.J. Polovina. I 9 8 2 A comparative study of fish yields from various tropical ecosystems, p. 255-289. In D. Pauly and G.I. Murphy (eds.) Theory and management of tropical fisheries. ICLARM Conf. Proc. 9, 360 p.
Martinez-Estalella, N. and P.M. Alcolado. l99Oa. Caracteristicas de las comunidades de corales petreos de la macrolaguna del Golfo de Batabano, p. 25-32. In P.M. Alcolado (ed.) El bentos de la macrolaguna del Golfo de Batabano. Editorial Academia, La Habana, Cuba.
Martinez-Estalella, N. and P. M. Alcolado. 1990b. Caracteristicas generales de las comunidades de moluscos de la macrolaguna del Golfo de Batabano, p. 53-74. In P.M. Alcolado (ed.) El bentos de la macrolaguna del Golfo de Batabano. Editorial Academia, La Habana, Cuba.
Martinez-lglesias, J.C. and P.M. Alcolado. 1990. Caracteristicas de la fauna de crustaceos decapodos de la macrolaguna del Golfo de Batabano, p. 75-89. In P.M. Alcolado (ed.) El bentos de la macrolaguna del Golfo de Batabano. Editorial Academia, La Habana, Cuba.
Massin, C. and C. Doumen. 1986. Distribution and feeding of epibenthic holothuroids on the reef flat of Laing Island (Papua New Guinea). Mar. Ecol. (Prog. Ser.) 31 (2): 185-1 95.
Matsui, S., Y. Hagiwara, H. Tou and H. Tsukahara. 1986. Study on the feeding habit of the Japanese blue crab, Portunus trituberculatus (Miers). Sci. Bull. Fac. Agric. Kyushu Univ. 40(2/3):175-182.
Maurer, R.O. and R.E. Bowman. 1985. Food consumption of squids (Illex illecebrosus and Loligo pealeo off the northeastern United States. Biology and ecology of squids lllex illecebrosus and Loligo pealei in the Northwest Atlantic. NAFO Sci. Counc. Stud.:117-124.
McClanahan, T.R. 1988. Coexistence in a sea urchin guild and its implications to coral reef diversity and degradation. Oecologia 77:210-218.
McClintock, J.B. and J.M. Lawrence. 1985. Characteristics of foraging in the soft-bottom benthic starfish Luidia clathrata (Echinodermata: Asteroidea): prey selectivity, switching behavior, functional responses and movement patterns. Oecologia 66(2):291-298.
McClintock, J.B., T.S. Klinger and J.M. Lawrence. 1982. Feeding preferences of echinoids for plant and animal food models. Bull. Mar. Sci. 32(1):365-369.
McDonald, J. 1982. Divergent life history patterns in the co-occurring intertidal crabs Panopeus herbstii and Eurypanopeus depressus (Crustacea: Brachyura: Xanthidae). Mar. Ecol. (Prog. Ser.) 8(2): 173-1 80.
McKillup, S.C. and A.J. Butler. 1983. The measurement of hunger as a relative estimate of food available to populations of Nassarius pauperatus. Oecologia 56(1): 16-22.
McLean, R. 1983. Gastropod shells: a dynamic resource that helps shape benthlc community structure. J.
J Exp. Mar. Biol. Ecol. 69(2):151-174. McManus, J.W., C.L. Naiiola, Jr., R.B. Reyes, Jr. and K.N. Kesner. 1992. Resource ecology of the Bolinao
coral reef system. ICLARM Stud. Rev. 22, 117 p. Meekan, M.G. 1988. Settlement and mortality patterns ofjuvenile reef fishes at Lizard Island, northern Great
Barrier Reef, p. 779-784. In Proceedings of the Sixth International Coral Reef Symposium, 8-12 August 1988, Townsville, Australia. Vol. 2.
Meinkoth, N.A. 1981. The Audubon Society field guide to North American seashore creatures. Alfred A. Knopf, Inc., New York. 799 p.
Menzel, D.W. 1958. Utilization of algae for growth by the angelfish Holacanthus bermudensis. J. Cons. ClEM 241308-31 3.
Menzel, D.W. 1960. Utilization of food by a Bermuda reef fish, Epinephelus guttatus. J. Cons. ClEM 25:216- 222.
Meylan, A. 1988. Spongivory in hawksbill turtles: a diet of glass. Science 239(4838):393-395. Milera, J. F. and I. Cortes. 1979. Habitos alimentarios de Murex (Phyllonotus) pomum Gmelin 1791 (Molluscs:
Neogastropoda: Muricidae), p. 18. In Proceedings of the Fifth Scientific Event of the Oceanological Institute. (Summary only.)
Miller, D.C. 1984 Mechanical post-capture particle selection by suspension- and deposit-feeding Corophium. J. Exp. Mar. Biol. Ecol. 82(1):59-76.
Minchin, D. 1983. Predation on young Pecten maximus (L.) (Bivalvia), by the anemone Anthopleura ballii. J. Molluscan Stud. 49(3):228-231.
Moehlenberg, F. and H.U. Riisgard. 1979. Filtration rate, using a new indirect technique, in thirteen species of suspension-feeding bivalves. Mar. Biol. 54: 143-1 47.
Mook, D. 1986. Absorption efficiencies of the intertidal mangrove dwelling mollusk Melampus coffeus Linne, and the rocky intertidal mollusk Acanthopleura granulata Gmelin. P.S.Z.N. I: Mar. Ecol. 7(2):105-113.
Morales, C. and T. Antezana. 1983. Diet selection of the Chilean stone crab Homalaspis plana. Mar. Biol. 77(1):79-83.
Morgan, M.D. and C.L. Kitting. 1984. Productivity and utilization of the seagrass Halodule wrightii and its attached epiphytes. Limnol. Oceanogr. 29(5): 1066-1 076.
Moriarty, D.J.W. 1982. Feeding of Holothuria atra and Stichopus chloronotus on bacteria, organic carbon and organic nitrogen in sediments of the Great Barrier Reef. Aust. J. Mar. Freshwat. Res. 33(2):255-263.
Moriarty, D.J.W. and M.C. Barcley. 1981. Carbon and nitrogen content of food and the assimilation efficiencies of penaeid prawns in the Gulf of Carpenteria. Aust. J. Mar. Freshwat. Res. 32(2):245-251.
Morrisey, D.J. 1988. Differences in effects of grazing by deposit-feeders Hydrobia ulvae (Gastropoda: Prosobranchia) and Corophium arenarium Crawford (Amphipoda) on sediment microalgal populations. 1. Qualitative differences. J. Exp. Mar. Biol. Ecol. 118(1):33-42.
Motoh, H. 1985. Biology and ecology of Penaeus monodon, p. 27-36. In Proceedings of the First Interna- tional Conference on the Culture of Penaeid PrawnsIShrimps, 4-7 December 1984, lloilo City, Philip- pines.
Mullin, M.M. 1983. In situ measurement of filtering rates of the salp, Thalia democratica, on phytoplankton and bacteria. J. Plankton Res. 5(2):279-288.
'Munro, J.L.. Editor. 1983. Caribbean coral reef fishery resources. ICLARM Stud. Rev. 7. 276 p. J ~ u n r o , J.L. 1984. Report to the Caribbean Fishery Management Council on an assessment of the fisheries
of Puerto Rico and the US Virgin Islands. (Unpubl.) Muskatine, L. and J.W. Porter. 1977. Reef corals: mutualistic symbioses adapted to nutrient-poor environ-
ments. Bioscience 27:454-460. Naim, 0 . and L. Amoureux. 1982. Le peuplement d'annelides polychaetes motiles associe aux algues d'un
recif corallien de Polynesie Francaise (ile de Moorea, Archipel de la Societe). Bull. Ecol. 13(1):25-33. Nelson, W.G. 1981. The role of predation by decapod crustaceans in seagrass ecosystems. In Lower organ-
isms and their role in the food web. Kiel. Meeresforsch. Sonderh. 5:529-536. Nemoto, T., M. Okiyama and M. Takahashi. 1984. Aspects of the roles of squid in food chains of the Antarctic
marine ecosystems, p. 89-92. In Proceedings of the Sixth Symposium on Polar Biology. Mem. Natl. Inst. Polar Res. (Japan) (Spec. Issue).
Nicholson, W. and L. Hartsuijker. 1982. The state of the fisheries resources of the Pedro Bank and South Jamaica shelf, p. 215-254. In FA0 Fish. Rep. 278-Suppl. FAO, Rome.
Nicol, S. and R.K. ODor. 1985. Predatory behaviour of squid (Illex illecebrosus) feeding on surface swarms of euphausiids. Can. J. Zool. 63(1):15-17.
Nielsen, M.V. and L.H. Kofoed. 1982. Selective feeding and epipsammic browsing by the deposit-feeding amphipod Corophium volutator. Mar. Ecol. (Prog. Ser.) 10(1):81-88.
Nigmatullin, Ch.M. and N.M. Toporova. 1982. Food spectrum of the short-finned squid Sthenoteufhispteropus (Steenstrup 1855) in the tropical Atlantic epipelagial, p. 3-8. In Feeding and food relationships of the Atlantic fishes and invertebrates. Atlanticheskij Nauchno lssledovaticheskij Institut, Rybnovo Khozjajstva; Okeanografii, Kaliningrad. (In Russian with English abstract.)
Nishihama, S., S. Nojima and T. Kikuchi. 1986. Distribution, diet and activity of a chiton Liolophura japonica (Lischkel), in Amakusa, West Kyushu. Publ. Amakusa Mar. Biol. Lab. 8(2):113-123.
Nixon, M. and B.U. Budelmann. 1984. Scale worms -occasional food of Octopus. J. Molluscan Stud. 50(1):39- 42.
Nuitja, I.N.S. and I. Uchida. 1982. Preliminary studies on the growth and food consumption of the juvenile loggerhead turtle (Caretta carefta L.) in captivity. Aquaculture 27: 157-160.
Odum, H.T. 1957. Primary production measurements in 11 Florida springs and a marine turtle grass commu- nity. Limnol. Oceanogr. 3:85-97.
Odum, H.T. and C.M. Hoskin. 1958. Comparative studies on the metabolis ters. Publ. Inst. ' Mar. Sci. Univ. Texas 5:16-46. Odum, H.T. and E.P. Odum. 1955. Trophic structure and productivity of a win
Eniwetok Atoll. Ecol. Monogr. 25:291-320. Odum, H.T., P.R. Burkholderand J. Rivero. 1959. Measurements of productivity of turtle grass flats, reefs and
the Bahia Fosforescente of Southern Puerto Rico. Publ. Inst. Mar. Sci. Univ. Texas 6:159-170. Odum, W.E. and E.J. Heald. 1975. The detritus-based food web of an estuarine mangrove community, p.
265-286. In L.E. Cronin (ed.) Estuarine research. Vol. 1. Academic Press, New York. Ogden, J.C. and E.H. Gladfelter. 1983. Coral reefs, seagrass beds and mangroves: their interaction in the
coastal zones of the Caribbean. UNESCO Rep. Mar. Sci. 23, 133 p. Ogden, J..C. and J.C. Zieman. 1977. Ecological aspects of coral reef - seagrass bed contacts in the Carib-
bean. Proc. Int. Coral Reef Symp. 3:377-382. Ogden, J.C. and J.P. Ebersole. 1981. Scale and community structure of coral reef fishes: a long-term study
of a large artificial reef. Mar. Ecol. (Prog. Ser.) 4:97-103. Ohta, S. 1984. Star shaped feeding traces produced by echiuran worms on the deep-sea floor of the Bay of
Bengal. Deep-sea Res. 31 (1 2a): 141 5-1432. OSullivan, D. and J.M. Cullen. 1983. Food of the squid Nototodarus gouldi in Bass Strait. Aust. J. Mar.
Freshwat. Res. 324(2):261-285. Owen, G.P. and L.J. Tilly. 1985. A preliminaryexamination of outwelling from a tropical lagoon. Caribb. J. Sci.
21 (lI2):l3-18. Oya, F. 1987. Growth, stomach contents and parasites in a tidepool population of the hippolytid shrimp
Heptacarpus futilirostris, with reference to reproduction. Mar. Biol. 96(2):225-234. Paloheimo, J.E. and L.M. Dickie. 1966. Food and growth of fishes Ill. Relation among food, body size and
growth efficiency. J. Fish. Res. Board Can. 23:1209-1248. Palomares, M.L. 1987. Comparative studies on the food consumption of marine fishes with emphasis on
species occurring in the Philippines. University of the Philippines, Diliman, Philippines. 107 p. M.S.thesis. Palomares, M.L. and D. Pauly. 1989. A multiple regression model for predicting the food consumption of
marine fish populations. Aust. J. Mar. Freshwat. Res. 40:259-273. Pamatmat, M.M. and S. Flndlay 1983. Metabolism of microbes, nematodes, polychaetes, and their interac-
tions in sediment, as detected by heat flow measurements. Mar. Ecol. (Prog. Ser.) 11:31-38. Parrish, J.D. 1982. Fishes at a Puerto Rican coral reef: distribution, behavior, and response to passive fishing
gear. Caribb. J. Sci. 18(1-4):9-20. Parrish, J.D., J.E. Norris, M.W. Callahan, J.K. Callahan, E.J. Magarifuji and R.E. Schroeder. 1986. Piscivory
in a coral reef fish community, p. 285-297. In C.A. Simenstad and G.M. Cailliet (eds.) Contemporary studies on fish feeding. Dr. W. Junk Publishers, The Netherlands.
Parsons, T.R. and R.J. LeBrasseur. 1970. The availability of food to different trophic levels in the marine food chain, p. 325-343. In J.H Steele (ed.) Marine food chains. Oliver and Boyd, Edinburgh.
Patel, N.M., N.D. Chhaya and M. Bhaskaran. 1979. Stomach contents of Porfunuspelagicus (Linn.) from AD net catches. Indian J. Mar. Sci. 8(1):48-49.
Patriquin, D.G. 1973. Estimation of growth rate, production and age of the marine angiosperm Thalassia testudinum Konig. Caribb. J. Sci. 13:lll-123.
Paul, R.K.G. 1981. Natural diet, feeding and predatory activity of the crabs Callinectes arcuatus and C. toxotes (Decapoda, Brachyura, Portunidae). Mar. Ecol. (Prog. Ser.) 6(1):91-99.
\E. Pauly, D. 1978. A preliminary compilation of fish length growth parameters. Ber Inst. Meereskd. Christian- Albrechts-Univ. Kiel 55, 200 p.
j Pauly D. 1979a. Theory and management of tropical multispecies stocks: a review with emphasis on the Southeast demersal fisheries. ICLARM Stud. Rev. 1, 35 p.
Pauly, D. 197913. Gill size and temperature as governing factors in fish growth: a generalization of von
J Bertalanffy's growth formula. Ber. Inst. Meereskd. Christian-Albrechts-Univ. Kie163, 156 p. Pauly, D. 1980. On the interrelationships between natural mortality, growth parameters and mean environ-
mental temperature in 175 fish stocks. J. Cons. ClEM 39(3):175-192. ' Pauly, D. 1984. Fish population dynamics in tropical waters: a manual for use with programmable calculators. ICLARM Stud. Rev. 8, 325 p.
'pauly, D. 1985. Zur Fischereibiologie Tropischer Nutztiere. Eine Bestandsaufnahme von Konzepten und Methoden. Ber. Inst. Meereskd. Christian-Albrechts-Univ. Kiel 147, 155 p.
' ~ a u l ~ , D. 1986. A simple method for estimating the food consumption of fish populations from growth data and food conversion experiments. Fish. Bull. 84(4):827-840.
'Pauly, D. and G.I. Murphy, Editors. 1982. Theory and management of tropical fisheries. ICLARM Conf. Proc. 9, 360 p. ' pauly, D. and H. Calumpong. 1984. Growth, reproduction and mortality of the sea hare Dolabella auricularia (Gastropoda: Aplysiidae) in the Central Visayas, Philippines. Mar. Biol. 79:289-293. ' Pauly, D. and J. lngles 1981. Aspects of the growth and natural mortality of exploited coral reef fishes. Proc. Fourth Int. Coral Reef Symp. 1:89-98.
J Pauly, D. and M.L. Palomares. 1986. Shrimp consumption by fish in Kuwait waters: a methodology, prelimi- nary results and their implications for management and research. Kuwait Bull. Mar. Sci. 9:101-125.
/ Pauly, D. and V. Christensen. 1993. Graphical representation of steady-state trophic ecosystem models, p. 20-28. In V. Christensen and D. Pauly (eds.) Trophic models of aquatic ecosystems. ICLARM Conf. Proc. 26, 390 p.
Pauly, D. and V. Christensen. 1995. Primary production required to sustain global fisheries. Nature 374:255- 257. ' Pauly, D.. M.L. Soriano-Bark and M.L.D. Palomares. 1993a. Improved construction. parametrization and interpretation of steady-state ecosystem models, p. 1-1 3. In V. Christensen and D. Pauly (eds.) Trophic models of aquatic ecosystems. ICLARM Conf. Proc. 26, 390 p.
Pauly, D., V. Sambilay, Jr. and S. Opitz. 1993b. Estimates of relative food consumption by fish and inverte- brate populations, required for modelling the Bolinao reef ecosystem, Philippines, p. 236-251. In V. Christensen and D. Pauly (eds.) Trophic models of aquatic ecosystems. ICLARM Conf. Proc. 26, 390 p.
PDT (Plan Development Team). 1990. The potential of marine fishery reserves for reef fish management in the U.S. Southern Atlantic. NOAA Tech. Memo. NMFS-SEFC-261,40 p.
Pearson, M. and J.D. Gage. 1984. Diets of some deep-sea brittle stars in the Rockall Trough. Mar. Biol. 82(3):247-258.
Penchaszadeh, P.E. and R. Molinet. 1983. Diet of the sea-star Tethyaster vestitus Say (Astropectinidae) in the Golfo Triste (Venezuela). Bull. Mar. Sci. 33(l): 187-1 91.
Penney, A.J. and C.L. Griffiths. 1983. Prey selection and the impact of a suite of predators on populations of the mussel Choromyfilus meridionalis, p. G20. Abstracts of the Fifth National Oceanographic Sympo- sium, 24-28 January 1983, Rhodes University, Grahamstown.
Pennington, M. 1984. Estimating the average food consumption by fish in the field from stomach contents data. ICES Doc. C.M. 1984/H:28.
Perez, O.S. and D.R. Bellwood. 1988. Ontogenetic changes in the natural diet of the sandy shore crab, Matuta lunaris (ForsskAl) (Brachyura: Calappidae). Aust. J. Mar. Freshwat. Res. 39(2):193-199.
Perron, F.E., G.A. Heslinga and J.O. Fagolimul. 1985. The gastropod Cymatium muricinum, a predator on juvenile tridacnid clams. Aquaculture 48(3/4):2Il-221.
Pielou, E.C. 1984. The interpretation of ecological data. John Wiley and Sons, Inc., New York. 263 p. Platt, T., K.H. Mann and R.E. Ulanowicz. 1981. Mathematical models in biological oceanography. UNESCO
Press, Paris. 156 p. Pohlo, R. 1982. Evolution of the Tellinacea (Bivalvia). J. Molluscan Stud. 48(3):245-256. Polovina, J.J. 1984a. An overview of the ECOPATH model. Fishbyte 2(2):5-7. Polovina, J.J. 198413. Model of a coral reef ecosystem. Part I. The ECOPATH model and its application to
French Frigate Shoals. Coral Reefs 3:l-11. Polovina, J.J. 1984c. ECOPATH -an ecosystem model applied to French Frigate Shoals, p. 375-398. In R.W.
Grigg and K.Y. Tanoue (eds.) Proceedings of the Second Symposium on Resource Investigations in the Northwestern Hawaiian Islands, 25-27 May 1983. Vol. 1. University of Hawaii, Honolulu, Hawaii.
Polovina, J.J. 1985. An approach to estimating an ecosystem box model. U.S. Fish. Bull. 83(3):457-460. 'polovina. J.J. 1986. Corrections for the listing of the ECOPATH model. Fishbyte 4(l):2l.
Polovina, J.J. and M.D. Ow. 1983. ECOPATH: a user's manual and program listings. Southwest Fish. Cent. Adm. Rep. H82-23, 46 p. NMFS, Honolulu.
Polovina, J.J. and S. Ralston, Editors. 1987. Tropical snappers and groupers: biology and fisheries manage- ment. Westview Press, Boulder and London. 659 p.
Poon, P.A. 1987. The diet and feeding behavior of Cadulus tolmiei Dall I897 (Scaphopoda: Siphonodentalioida). Nautilus 101 (2):88-92.
Pozo, E. 1979. Edad y crecimiento del pargo criollo (Lutjanus analis (Cuvier 1828)) en la plataforma nororiental de Cuba. Rev. Cuba. Invest. Pesq. 4(2):1-24.
Prahl, H., F. Guhl and M. Groegl. 1978. Crustaceos decapodos commensales del coral Pocillopora damicornis L. en la lsla de Gorgona, Colombia. Ann. Inst. Invest. Mar. 10:81-93.
Primavera, J.H. and R.Q. Gacutan. 1985. Ruppia maritima and Najas graminea as natural foods for Penaeus monodon juveniles, p. 182-183. In Proceedings of the First International Conference on the Culture of Penaeid PrawnsIShrimps, 4-7 December 1984, lloilo City, Philippines.
Ralston, S. 1976. Age determination of a tropical reef butterfly fish utilizing daily growth rings in otoliths. Fish Bull. 74(4):990-994.
Randall, J.E. 1962. Tagging reef fishes in the Virgin Islands. Proc. Gulf Caribb. Fish. Inst. 14:201-241. Randall, J.E. 1963a. Additional recoveries of tagged reef fishes in the Virgin Islands. Proc. Gulf Caribb. Fish.
Inst. 15155-157. Randall, J.E. 1963b. An analysis of the fish populations of artificial and natural reefs in the Virgin Islands.
Caribb. J. Sci. 3:31-48. Randall, J.E. 1967. Food habits of reef fishes of the West Indies. Stud. Trop. Oceanogr. 5:665-847. Randall, J.E. 1968. Caribbean reef fishes. T.F.H. Publications, Inc., Neptune City, New Jersey. 318 p. Randall, J.E. 1983. Caribbean reef fishes. Second edition. T.F.H. Publications, Inc., Neptune City, New Jer-
sey. Reed, J.K., R.H. Gore, L.E. Scotto and K.A. Wilson. 1982. Community composition, structure, areal and
trophic relationships of decapods associated with shallow- and deep-water Oculina varicosa coral reefs: studies on decapod crustacea from the Indian River region of Florida, XXIV. Bull. Mar. Sci. 32(3):761- 786.
Regis, M.B. and B.A. Thomassin. 1982. Regular echinoids in coral reefs of the Tulear region (S-W Mala- gasy): morphological adaptations of spine's microstructure. Ann. Inst. Oceanogr. Paris (Nouv. Ser.) 58(2): 11 7-1 58.
Reid, R.G.B. 1985. Isognomon: life in two dimensions. The malacofauna of Hong Kong and Southern China, p. 31 1-31 9. In Proceedings of the Second International Workshop on the Malacofauna of Hong Kong and Southern China, 6-24 April 1983, Hong Kong. Vol. 1.
Reiswig, H.M. 1971. Particle feeding in natural populations of three marine demosponges. Biol. Bull. 141:568- 591.
Rice, J.A., J.E. Breck, S.M. Bartell and J.F. Kitchell. 1983. Evaluating the constraints of temperature, activity and consumption on growth of largemouth bass. Environ. Biol Fish. 9:263-275.
Ricker, W.E. 1969. Food from the sea, p. 87-108. In Resources and man: the Report of the Committee on Resources and Man to the US National Academy of Science. W.H. Freeman and Co., San Francisco. 259 p.
Ricker, W.E. 1973. Linear regression in fishery research. J. Fish. Res. Board Can. 30:409-434. Riddle, M.J., D.M. Alongi, P.K. Dayton, J.A. Hansen and D.W. Klumpp 1990. Detrital pathways in a coral reef
lagoon. Mar. Biol. 104: 109-11 8. Rietsma, C.S., I. Vzliela and A. Sylvester-Serianni. 1982. Food preferences of dominant salt marsh herbiv-
ores and detritivores. P.S.Z. N. I: Mar. Ecol. 3(2): 179-1 89. Robertson, J.R. and W.J. Pfeiffer. 1981. Deposit-feeding by the ghost crab Ocypode quadrata (Fabricius). J.
Exp. Mar. Biol. Ecol. 56(2/3):165-177. Robertson, R. and P.L. Schutt. 1984. Golden wentletraps on golden corals. Hawaii. Shell News 32(11). Rogers, C.S. and N. Salesky. 1981. Productivity of Acropora palmata (Lamarck), macroscopic algae, and
algal turf from Tague Bay reef, St. Croix, U.S.V.I. J. Exp. Mar. Biol. Ecol. 49:179-187. Roushdy, H.M. and V.K. Hansen. 1960. Ophiuroids feeding on phytoplankton. Nature 188:517-518.
Rudloe, A. 1983. Preliminary studies of the mariculture potential of the slipper-lobster, Scyllarides nodifer. Aquaculture 34(1/2):165-169.
Saccardo, S.A. 1983. Biologia y disponibilidad de sardina (Sardinella brasiliensis, Steindachner 1879) en la costa sudeste del Brasil. FA0 Fish. Rep. 291(2):449-464.
Saisho, T., T. Noguchi, K. Koyama, A. Uzu, T. Kikuta and K. Hashimoto. 1983. Examination of stomach contents in xanthid crabs. Bull. Jap. Soc. Sci. Fish. 49(6):939-947.
Sale, P.F. 1975. Patterns of use of space in a guild of territorial reef fishes. Mar. Biol. 29:89-97. Sale, P.F. 1977. Maintenance of high diversity in coral reef fish communities. Am. Nat. 111:337-359. Salvat, B and M. Denizot. 1982. La distribution des mollusques supralittoraux sur substrats carbonates
' tropicaux (Polynesie Fran~aise) et leur regime alimentaire, p. 541-544. In Proceedings of the Seventh International Malacological Congress, 31 August-7 September 1980. Malacologia.
Salzwedel, H. 1980. Energy budgets for two populations of the bivalve Tellina fabula in the German Bight. Veroff. Inst. Meeresforsch. Bremerh. 18(2):257-287.
Sandifer, P.A. and J.H. Kerby. 1983. Early life history and biology of the common fish parasite, Lironeca ovalis (Say) (Isopoda, Cymothoidae). Estuaries 6(4):420-425.
Scheibling, R.E. 1982. Feeding habits of Oreaster reticulatus (Echinodermata: Asteroidea). Bull. Mar. Sci. 32(2):504-510.
Schembri, P.J. 1981. Feeding in Ebalia tuberosa (Pennant) (Crustacea: Decapoda: Leucosiidae). J. Exp. Mar. Biol. Ecol. 55(1): 1-1 0.
Schembri, P.J. and V. Jaccarini. 1978. Some aspects of the ecology of the echiuran worm Bonellia viridis and associated infauna. Mar. Biol. 47:55-61.
Schmid, P. H. and R. Schaerer. 1981. Predator-prey interaction between two competing sea star species of the genus Astropecten. P.S.Z.N.1: Mar. Ecol. 2(3):207-214.
Schwinghamer, P., B. Hargrave, D. Peer and C.M. Hawkins. 1986. Partitioning of production and respiration among size groups of organisms in an intertidal benthic community. Mar. Ecol. (Prog. Ser.) 31:131-142.
Scott, P.J.B. 1988. Distribution, habitat and morphology of the Caribbean coral- and rock-boring bivalve, Lithophaga bisulcata (dlOrbigny) (Mytilidae: Lithophaginae). J. Molluscan Stud. 54(1):83-95.
Scott, P.J.B , H.M. Reiswig and B.M. Marcotte. 1988. Ecology, functional morphology, behaviour, and feeding in coral- and sponge-boring species of Upogebia (Crustacea: Decapoda: Thalassinidea). Can. J. Zool. 66(2):483-495.
Sebens, K.P. and M.A.R. Koehl. 1984. Predation on zooplankton by the benthic anthozoans Alcyonium siderium (Alcyonacea) and Metridium senile (Actiniaria) in the New England subtidal. Mar. Biol. 81 (3):255-271.
Segal, E. 1987. Behavior of juvenile Nerocila acuminata (Isopoda, Cymothoidae) during attack, attachment and feeding on fish prey. Bull. Mar. Sci. 41(2):351-360.
Seiple, W. and M. Salmon. 1982. Comparative social behavior of two grapsid crabs, Sesarma reticulatum (Say) and S. cinereum (Bosc). J. Exp. Mar. Biol. Ecol. 62(1):1-24.
Shafir, A. and Y Loya. 1983. Consumption and assimilation of coral mucus by the burrowing mussel Lithophaga lessepsiana. Bull. Inst. Oceanogr. Fish. (Cairo):135-140.
Shivji, M., D. Parker, B. Hartwick, M.J. Smith and N.A. Sloan. 1983. Feeding and distribution study of the sunflower sea star Pycnopodia helianthoides (Brandt 1835). Pac. Sci. 37(2): 133-140.
Sierra, L.M. and J. Diaz-Zaballa. 1984. Alimentacion de 2 especies de sardina Harengula humeralis (Cuvier, 1829) y Harengula clupeola (Cuvier, 1829), en la costa norte de la Ciudad de La Habana (rada del lnstituto de Oceanologia). Rep. Invest. Inst. Oceanol. Acad. Cienc. Cuba 25, 18 p.
Signor, P.W. 111. 1985. The role of shell geometry as a deterrent to predation in terebrid gastropods. Veliger 28(2): 179-1 85.
Silvert, W.L. 1981. Principles of ecosystem modelling, p. 651-676. In A.R. Longhurst (ed.) Analysis of marine ecosystems. Academic Press, New York. 741 p.
Sisak, M.M. and F. Sander. 1987. On the general ecology of Holothuria glaberrima Selenka (Echinodermata). \
Proc. Assoc. Isl. Mar. Lab. Caribb. 17:14. (Summary only.) Smale, M.J. 1978. Migration, growth and feeding in the Natal rock lobster Panulirus homarus (Linnaeus).
Oceanogr. Res. Inst. Invest. Rep. 47, 56 p. Smale, M.J. and P.R. Buchan. 1981. Biology of Octopus vulgaris off the East coast of South Africa. Mar. Biol.
65(l): 1-12.
Smith, C.L. 1973. Small rotenone stations: a tool for studying coral reef fish communities. Am. Mus. Novit. 251211-21.
Smith, C.L. and J.C. Tyler. 1972. Space resource sharing in a coral reef fish community, p. 125-170. In B.B. Collette and S.A. Earle (eds.) Results of the Tektite program: ecology of coral reef fishes. Nat. Hist. Mus. L. A. Co. Sci. Bull. 14, 180 p.
Sorokin, Yu.1. 1987. Problems of productivity, trophology, and energy balance of coral reef ecosystems. Sov. J. Mar. Biol. (Transl. Biol. Morya) 12(6):325-335.
Stanhope, J.J. 1980. Marine benthic algae, with an indication of their distribution, relative abundance, and standing crop. In E.H. Gladfelter and W.B. Gladfelter (eds.) Environmental studies of Buck Island Reef National Monument Ill, St. Croix, U.S.V.I.: Chapter II. West lndies Laboratory, St. Croix.
Staples, D.A. and J.E. Watson. 1987. Associations between pycnogonids and hydroids, p. 215-226. In Mod- ern trends in the systematics, ecology, and evolution of hydroids and hydromedusae. Oxford Sci. Publ.
Steele, H. 1974. The structure of marine ecosystems. Blackwell Scientific Publications, Oxford. 128 p. Steinberg, P.D. 1985. Feeding preferences of Tegula funebralis and chemical defenses of marine brown
algae. Ecol. Monogr. 55(3):333-349. Steneck, R.S. 1982. A limpet-coralline algal association: adaptations and defenses between a selective
herbivore and its prey. Ecology 63(2):507-522. Steneck, R.S. and L. Watling. 1982. Feeding capabilities and limitation of herbivorous molluscs: a functional
group approach. Mar. Biol. 68:299-319. Stevenson, J.C. 1988. Comparative ecology of submersed grass beds in freshwater, estuarine, and marine
environments. Limnol. Oceanogr. 33(4/2):867-893. Stewart, D.J., D. Weininger, D.V. Rottiers and T.A. Edsall. 1983. An energetics model for lake trout Salvelinus
namaycush: application to the Lake Michigan population. Can. J. Fish. Aquat. Sci. 40:681-698. Stoner, A.W. and R.J. Zimmerman. 1988. Food pathways associated with penaeid shrimps in a mangrove-
fringed estuary. Fish. Bull. 86(3):543-552. Stuart, V and D.W. Klumpp. 1984. Evidence for food-resource partitioning by kelp-bed filter feeders. Mar.
Ecol. (Prog. Ser.) 16(1/2):27-37. Stuart, V., E.J.H. Head and K.H. Mann. 1985. Seasonal changes in the digestive enzyme levels of the amphipod
Corophium volutator (Pallas) in relation to diet. J. Exp. Mar. Biol. Ecol. 88(3):243-256. Sushchenya, L.M. 1970. Food rations, metabolism and growth of crustaceans, p. 127-141. In J. H. Steele
(ed.) Marine food chains. Oliver and Boyd, Edinburgh. Suthers, I.M. and D.T. Anderson. 1981. Functional morphology of mouthparts and gastric mill of lbacus
peronii (Leach) (Palinura: Scyllaridae). Aust. J. Mar. Freshwat. Res. 32(6):931-944. Talbot, F.H., B.C. Russell and G.R.V. Anderson. 1978. Coral reef fish communities: unstable, high diversity
system? Ecol. Monogr. 48:425-440. Taylor, J.D. 1982. Diets of sublittoral predatory gastropods of Hong Kong, p. 907-920. In B. Morton and C.K.
Tseng (eds.) The marine flora and fauna of Hong Kong and Southern China. Vol. 2: ecology, morphol- ogy, behaviour and physiology. Proceedings of the lnternational Marine Biological Workshop, 18 April 1980, Hong Kong.
Taylor, J.D. 1987. Feeding ecology of some common intertidal neogastropods at Djerba, Tunisia. Vie Milieu 37(1): 13-20.
Tertschnig, W.P. 1989. Diel activity patterns and foraging dynamics of the sea urchin Tripneustes ventricosus in a tropical seagrass community and a reef environment (Virgin Islands). P.S.Z.N. I. Mar. Ecol. 10(1):3- 21.
Thangavelu, R. and P. Muthiah. 1983. Predation of oyster Crassostrea madrasensis by gastropod Cymatium cingulatum (Lamarck) in the oyster farm at Tuticorin, p. 488-494. In Proceedings of the Symposium on Coastal Aquaculture, 12-18 January 1980, Cochin, India. Part 2: Molluscan culture.
Thorne, R.E. 1979. The application of hydroacoustics to stock assessment for tropical small-scale fisheries, p. 11 0-11 8. In P.M. Roedel and S.B. Saila (eds.) Stock assessment for tropical small-scale fisheries. Proceedings of an International Workshop, 19-21 September 1979, University of Rhode Island, King- ston, Rhode Island.
Tomita, K. and T. Mizushima. 1984. Mollusks on leaves of Zostera marina in Notsuke Bay. 1. Fauna and growth of the major three species. Venus Jap. J. Malacol. 43(4):331-338.
Town, J.C. 1981. Prey characteristics and dietary composition in intertidal Asfrosfole scabra (Echinodermata: Asteroidea). N.Z. J. Mar. Freshwat. Res. 15(1):69-80.
Tsikhon-Lukanina, E.A., G.G. Nikolaeva and O.G. Reznichenko. 1986. Food spectra of oceanic fouling or- ganisms. Okeanologiya 26(6): 1006-1 009. ,
Tsikhon-Lukanina, Y.A. 1982. Food spectra of bottom molluscs. Oceanology 22(6):751-754. Ulanowicz, R.E. 1980. An hypothesis on the development of natural communities. J. Theor. Biol. 85:223-245. Ulanowicz, R.E. 1986. Growth and development. Ecosystems phenomenology. Springer Verlag, New York.
203 p. Ulanowicz, R.E. and J.S. Norden. 1990. Symmetrical overhead in flow networks. Int. J. Syst. Sci. 21(2):429-
437. Ulanowicz, R.E. and T. Platt, Editors. 1985. Ecosystem theory for biological oceanography. Can. Bull. Fish.
Aquat. Sci. 213:260 p. Underwood, A.J. 1984. Vertical and seasonal patterns in competition for microalgae between intertidal gas-
tropods. Oecologia 64(2):211-222. Ursin, E. 1967. A mathematical model of some aspects of fish growth, respiration and mortality. J. Fish. Res.
Board Can. 24:2355-2435. Vadas, R.L., T. Fenchel and J.C. Ogden. 1982. Ecological studies on the sea urchin, Lytechinus variegatus,
and the algal-seagrass communities of the Miskito Cays, Nicaragua. Aquat. Bot. 14(2):139-150. Vahl, 0 . 1980. Volume of water pumped and particulate matter deposited by the Iceland scallop (Chlamys
islandica) in Balsfjord, Northern Norway. Fjord oceanography. NATO Conf. Ser. 4. Mar. Sci.:639-644. Vakily, J.M. 1992. Determination and comparison of bivalve growth with emphasis on Thailand and other
tropical areas. ICLARM Tech. Rep. 36, 125 p. VanMontfrans, J., R.J. Orth and S.A. Vay. 1982. Preliminary studies of grazing by Bitfium varium on eelgrass
periphyton. Aquat. Bot. 14(1):75-89. Vevers, H.G. 1956. Observations on feeding mechanisms in some echinoderms. Proc. Zool. Soc. London
126~484-485. Vittor, B.A. and P.G. Johnson. 1977. Polychaete abundance, diversity and trophic role in coral reef communi-
ties at Grand Bahama Island and the Florida Middle Ground, p. 163-168. In D.L. Taylor (ed.) Proceed- ings of the Third Coral Reef Symposium 1. Rosenstiel School of Marine and Atmospheric Science, Miami.
Vovk, A.N. 1985. Feeding spectrum of longfin squid (Loligo pealei) in the Northwest Atlantic and its position in the ecosystem. NAFO Sci. Counc. Stud. 8:33-38.
Vreeland, H.V. and H.R. Lasker. 1989. Selective feeding of the polychaete Hermodice carunculafa Pallas on Caribbean gorgonians. J. Exp. Mar. Biol. Ecol. 129:265-277.
Waegele, J.W. 1982. Redescription and comparison of the Mediterranean species of Paranthura (Crustacea, Isopoda, Anthuridea). P.S.Z.N. I: Mar. Ecol. 3(2):109-132.
Wanders, J.B.W. 1976a. The role of benthic algae in the shallow reef of Cura~ao (Netherlands Antilles) I. Primary productivity in the coral reef. Aquat. Bot. 2:235-270.
Wanders, J.B.W. 1976b. The role of benthic algae in the shallow reef of Cura~ao (Netherlands Antilles) II. Primary productivity of the Sargassum beds in the north-east coast submarine plateau. Aquat. Bot. 2:327-335.
Watanabe, J.M. 1984. Food preference, food quality and diets of three herbivorous gastropods (Trochidae:Tegula) in a temperate kelp forest habitat. Oecologia 62(1):47-52.
Wear, R.G. and M. Haddon. 1987. Natural diet of the crab Ovalipes catharus (Crustacea, Portunidae) around central and northern New Zealand. Mar. Ecol. (Prog. Ser.) 35(1/2):39-49.
Weil, E., F. Losada and D. Bone. 1984. Spatial variations in density and size of the echinoid Diadema antillarum Philippi on some Venezuelan coral reefs. Bijdr. Dierkd. 54(1):73-82.
Wicksten, M.K. 1988. Antennary cast net feeding in California hermit crabs (Decapoda, Paguridea). Crustaceana 54(3):321-324.
Wilber, D.H. and T. P. Wilber, Jr. 1989. The effects of holding space and diet on the growth of the West Indian spider crab Mithrax spinosissimus (Lamarck). J. Exp. Mar. Biol. Ecol. 131 :215-222.
Wilkinson, C.R. 1987. Interocean differences in size and nutrition of coral reef sponge populations. Science 236:1654-1657.
Wilkinson, C.R. and A.C. Cheshire. 1988. Growth rate of Jamaican coral reef sponges after hurricane Allen. Biol. Bull. 175:175-179.
Williams, M.J. 1982. Natural food and feeding in the commercial sand crab Porfunus pelagicus Linnaeus 1766 (Crustacea: Decapoda: Portunidae) in Moreton Bay, Queensland. J. Exp. Mar. Biol. Ecol. 59(2- 3): 165-1 76.
Winberg, G.G. 1956. Rate of metabolism and food requirements of fishes. Fish. Res. Board Can. Trans. Ser. 194,202 p.
Windell, J.T. 1978. Estimating food consumption rates of fish populations, p. 227-254. In T. Bagenal (ed.) Methods for assessment of fish production in fresh waters. Blackwell Scientific, Oxford. 365 p.
Winfree, R.A. and S. Weinstein. 1989. Food habits of the Caribbean king crab Mifhrax spinosissimus (Lamarck), p. 458-464. In G.T. Waugh and M.H. Goodwin (eds.) Proceedings of the 39th Annual Gulf and Carib- bean Fisheries Institute, November 1986, Hamilton, Bermuda.
Winston, J.E. 1986. Victims of Avicularia. P.S.Z.N. I: Mar. Ecol. 7(3):193-199. Winter, M.A. and P.V. Hamilton. 1985. Factors influencing swimming in bay scallops, Argopecfen irradians
(Lamarck, 1819). J. Exp. Mar. Biol. Ecol. 88(3):227-242. Witzell, W.N. 1983. Synopsis of biological data on the hawksbill turtle Erefmochelys imbricafa (Linnaeus,
1766). FA0 Fish. Synop. 137, 78 p. Wulff, F., J.G. Field and K.H. Mann, Editors. 1989. Network analysis in marine ecology: methods and applica-
tions. Coast. Estuar. Stud. 32, 284 p. Springer Verlag, New York. Wurzian, R.S. 1984. The role of higher trophic levels in a sublittoral benthic community. 1. Estimates of
ingestion in Asfropecfen aranciacus (Linne). P.S.Z.N. I.: Mar. Ecol. 5(1):1-8. Yamashita, Y., D. Kitagawa and T. Aoyama. 1985. A field study of predation of the hyperiid amphipod
Parafhemisto japonica on larvae of the Japanese sand eel Ammodyfes personafus. Bull. Jap. Soc. Sci. Fish./Nissuishi 51 (1 0): 1599-1 607.
Yang, W.T., R.F. Hixon, P.E. Turk, M.E. Krejci, W.H. Hulet and R.T. Hanlon. 1986. Growth, behaviour, and sexual maturation of the market squid, Loligo opalescens cultured through the life cycle. Fish. Bull. 84(4):771-798.
Yoshioka, B.B. and P.M. Yoshioka. 1990. Size-specific patterns of colony survivorship in shallow-water gorgonians. Paper presented at the 2d0 Congreso de Ciencias del Mar, 18-22 June 1990, La Habana, Cuba. (Abstract only).
Zieman, J.C., G.W. Thayer, M.B. Robblee and R.T. Zieman. 1979. Production and export of seagrassesfrom a tropical bay, p. 21-33. In R.J. Livingston (ed.) Ecological processes in coastal and marine systems. Plenum Press, New York. 348 p.
Zimmerman, R.J. 1979. Seagrasses and the evolution of marine gammaridean amphipods. Proc. Assoc. Isl. Mar. Lab. Caribb. 1979, 17 p.
Zimmerman, R.J., R.A. Gibson and J.B. Harrington. 1977. Gammaridean amphipod feeding strategies in a Florida seagrass bed. Proc. Assoc. Isl. Mar. Lab. Caribb. 12:20 p.
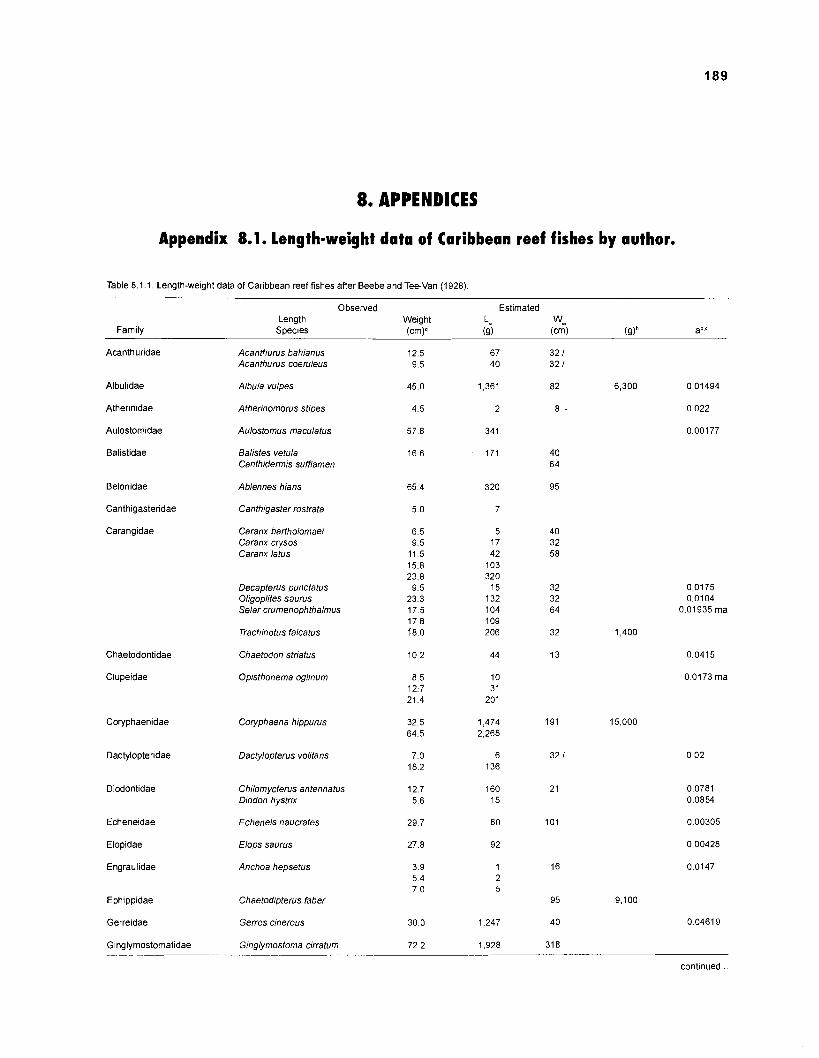
8. APPENDICES
Appendix 8.1. Length-weight data of Caribbean reef fishes by author.
Table 8.1.1. Length-weight data of Caribbean reef fishes after Beebe and Tee-Van (1928)
Observed Estimated Length Weight L-
Family w-
Species ( W a (9) (cm) mb a b . ~
Acanthuridae
Albulidae
Atherinidae
Aulostomidae
Balistidae
Belonidae
Canthigasteridae
Carangidae
Chaetodontidae
Clupeidae
Coryphaenidae
Dactylopteridae
Diodontidae
Echeneidae
Elopidae
Engraulidae
Ephippidae
Gerreidae
Ginglymostomatidae
Acanthurus bahianus Acanthurus coeruleus
Albula vulpes
Atherinomorus stipes
Aulostomus maculatus
Balistes vetula Canthidermis sufflamen
Ablennes hians
Canthigaster rostrata
Caranx bartholomaei Caranx crysos Caranx latus
Decapterus punctatus Oligoplites s a w s Selar crumenophthalmus
Trachinotus falcatus
Chaetodon striatus
Opisthonema oglinum
Coryphaena hippurus
Dactylopterus volitans
Chilomycterus antennatus Diodon hystrix
Echeneis naucrates
Elops saurus
Anchoa hepsetus
Chaetodipterus faber
Gerres cinereus
Ginglymostoma cirratum
continued ..
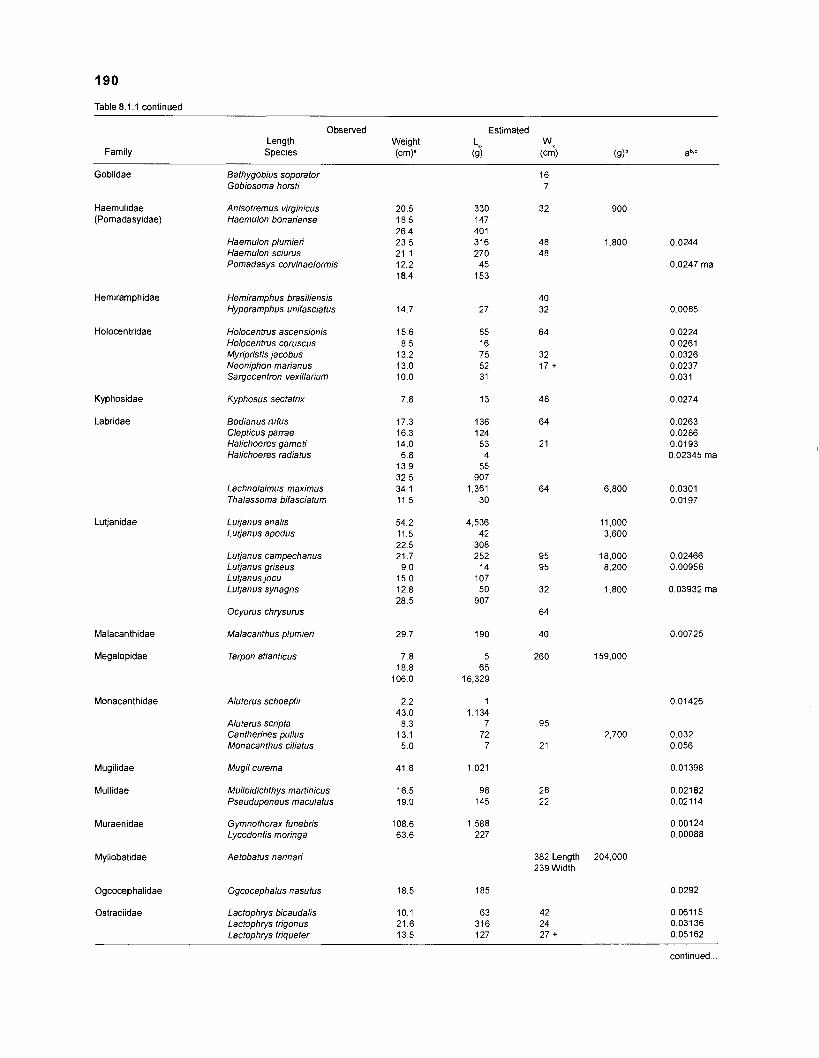
Table 8.1.1 continued
Observed Estimated Length Weight Lm
Species WD
(cm). (g) (cm) ( d b ab.c Family
Gobiidae Bathygobius soporator Gobiosoma horsti
Haemulidae (Pomadasyidae)
Anisotremus virginicus Haemulon bonariense
Haemulon plumieri Haemulon sciurus Pomadasys cofvinaeformis
Hemirarnphidae
Holocentridae
Hemiramphus brasiliensis Hyporamphus unifasciatus
Holocentrus ascensionis Holocentrus coruscus Myripristis jacobus Neoniphon marianus Sargocentron vexillarium
Kyphosidae
Labridae
Kyphosus sectatrix
Bodianus rufus Clepticus parrae Halichoeres garnoti Halichoeres radiatus
Lachnolaimus maximus Thalassoma bifasciatum
Lutjanus analis Lutjanus apodus
Lutjanus campechanus Lutjanus griseus Lutjanus jocu Lutjanus synagris
Ocyurus chrysurus
Malacanthidae
Megalopidae
Malacanthus plumier;
Tarpon atlanticus
Monacanthidae Aluterus schoepfii
Aluterus scripta Cantherines pullus Monacanthus ciliatus
Mugil curema Mugilidae
Mullidae Mulloidichthys martinicus Pseudupeneus maculatus
Muraenidae Gymnothorax funebris Lycodontis moringa
Myliobatidae Aetobatus narinari 382 Length 239 Width
Ogcocephalidae
Ostraciidae
Ogcocephalus nasutus
Lactophrys bicaudalis Lactophrys trigonus Lactophrys triqueter
continued ...
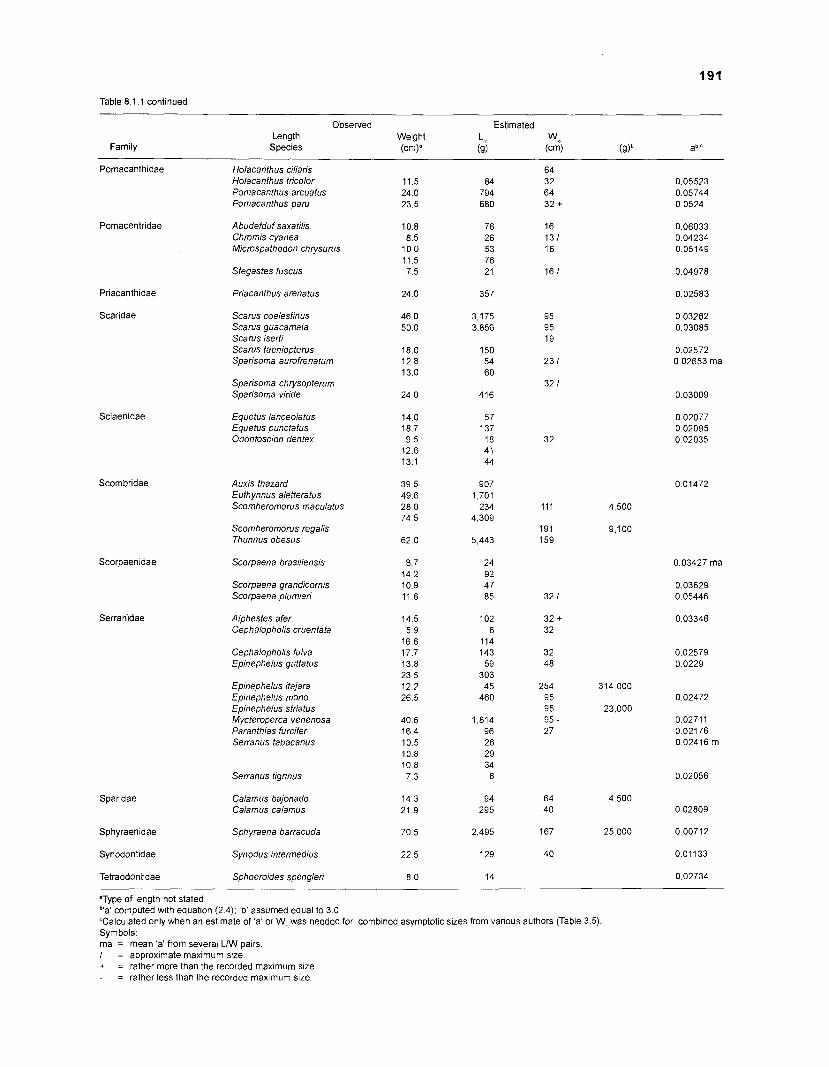
Table 8.1 .I continued
Family
Observed Estimated Length Weight L* w-
Species (cm). (9) (cm) (g)b ab,c
Pomacanthidae
Pomacentridae
Priacanthidae
Scaridae
Sciaenidae
Scombridae
Scorpaenidae
Serranidae
Sparidae
Sphyraen~dae
Synodontidae
Tetraodoniidae
Holacanthus ciliaris Holacanthus tricolor Pomacanthus arcuatus Pomacanthus paru
Abudefduf saxatilis Chromis cyanea Microspathodon chrysurus
Stegastes fuscus
Priacanthus arenatus
Scarus coelestinus Scarus guacamaia Scarus iserti Scarus taeniopterus Sparisoma aurofrenatum
Sparisoma chrysopterum Sparisoma viride
Equetus lanceolatus Equetus punctatus Odontoscion dentex
Auxis thazard Euthynnus aletteratus Scomberomorus maculatus
Scomberomorus regalis Thunnus obesus
Scorpaena brasiliensis
Scorpaena grandicornis Scorpaena plumier;
Alphestes afer Cephalopholis cruentata
Cephalopholis fulva Epinephelus guttatus
Epinephelus itajara Epinephelus morio Epinephelus striatus Mycteroperca venenosa Paranthias furcifer Serranus tabacarius
Serranus tigrinus
Calamus bajonado Calamus calamus
Sphyraena barracuda
Synodus intermedius
Sphoeroides spengleri
Type of length not stated b'a'computed w ~ t h equation (2.4); 'b' assumed equal to 3.0 "Calculated only when an estimate of 'a' or W-was needed for combined asymptotic sizes from varlous authors (Table 3.5) Symbols: ma = mean 'a' from several LAN pairs. / = approximate maximum size. + = rather more than the recorded maximum size - = rather less than the recorded maximum size
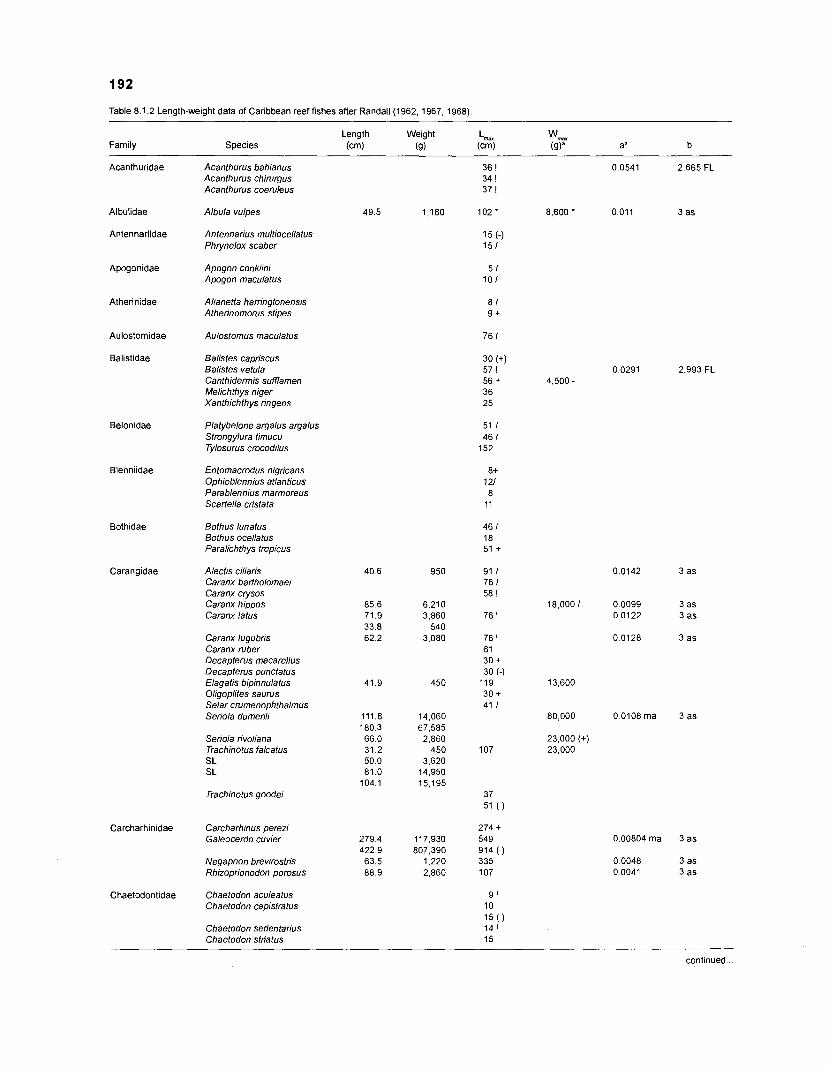
192
Table 8.1.2 Length-weight data of Caribbean reef fishes after Randall (1962, 1967, 1968)
Length (cm)
Weight (9)
1,180
950
6,210 3,860
540 3.080
450
14.060 67,585
2.860 450
3,620 14,950 15,195
117,930 807.390
1,220 2.860
Family Species
Acanthuridae Acanthurus bahianus Acanthurus chirurgus Acanthurus coeruleus
Albulidae
Antennariidae
Albula vulpes
Antennarius multiocellatus Phrynelox scaber
Apogonidae Apogon conklini Apogon maculatus
Atherinidae Allanetta harringtonensis Atherinomorus stipes
Aulostomidae
Balistidae
Aulostomus maculatus
Balistes capriscus Balistes vetula Canthidermis sufflamen Melichthys niger Xanthichthys ringens
Belonidae
Blenniidae
Platybelone argalus argalus Strongylura timucu Tylosurus crocodilus
Entomacrodus nigricans Ophioblennius atlanticus Parablennius marmoreus Scartella cristata
Bothidae
Carangidae
Bothus lunatus Bothus ocellatus Paralichthys tropicus
Alectis ciliaris Caranx bartholomae~ Caranx crysos Caranx hippos Caranx latus
Caranx lugubris Caranx ruber Decapterus macarellus Decapterus punctatus Elagatis bipinnulatus Oligoplites saurus Selar crurnenophthalmus Seriola dumerili
Seriola rivoliana Trachinotus falcatus SL SL
Trachinotus goodei
Carcharhinidae
Chaetodontidae
Carcharhinus perezi Galeocerdo cuvier
Negaprion brevirostris Rhizoprionodon porosus
Chaefodon aculeatus Chaetodon capistratus
Chaetodon sedentarrus Chaetodon striatus
continued
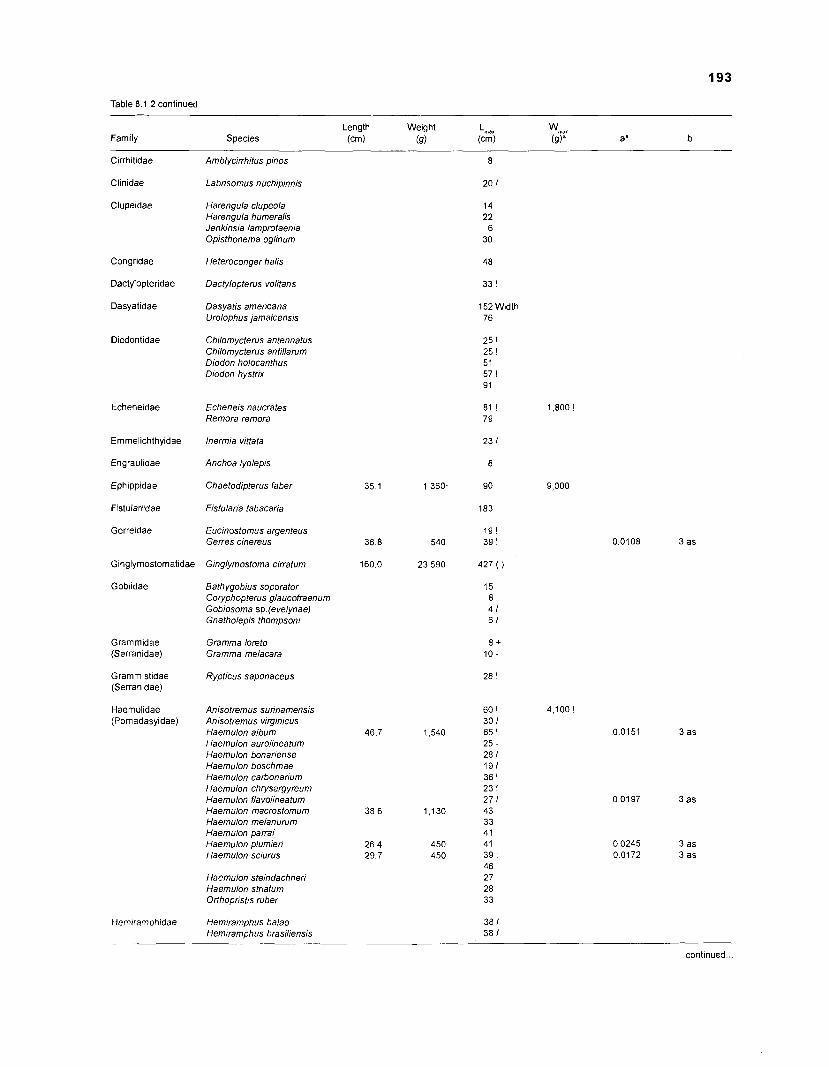
193
Table 8.1.2 continued
Length Weight La,, %ax
Species (cm) (9) (cm) (9)" aa b Family
Cirrhitidae
Clinidae
Clupeidae
Amblycirrhitus pinos
Labrisomus nuchipinnis
Harengula clupeola Harengula humeralis Jenkinsia lamprotaenia Opisthonema oglinum
Congridae
Dactylopteridae
Dasyatidae
Heteroconger halis
Dactylopterus volitans
Dasyatis americana Urolophus jamaicensis
152 Width 76
Diodontidae Chilomycterus antennatus Chilomycterus antillarum Diodon holocanthus Diodon hystrix
Echeneidae Echeneis naucrates Remora remora
Emmelichthyidae
Engraulidae
Ephippidae
Fistulariidae
Gerreidae
lnermia vittata
Anchoa lyolepis
Chaetodipterus faber
Fistularia tabacaria
Eucinostomus argenteus Gerres cinereus
Ginglyrnostornatidae
Gobiidae
Ginglymostoma cirratum
Bathygobius soporator Coryphopterus glaucofraenum Goblosoma sp.(evelynae) Gnatholepis thompsoni
Grarnmidae (Serranidae)
Gramma loreto Gramma melacara
Grammistidae (Serranidae)
Rypticus saponaceus
Haernulidae (Pornadasyidae)
Anisotremus surinamensis Anisotremus virginicus Haemulon album Haemulon aurolineatum Haemulon bonariense Haemulon boschmae Haemulon carbonarium Haemulon chrysargyreum Haemulon flavolineatum Haemulon macrostomum Haemulon melanurum Haemulon parrai Haemulon plumier; Haemulon sciurus
Haernulon steindachneri Haemulon strlatum Orthoprist~s ruber
Hemlrarnphus balao Hemiramphus brasiliensis
continued ...
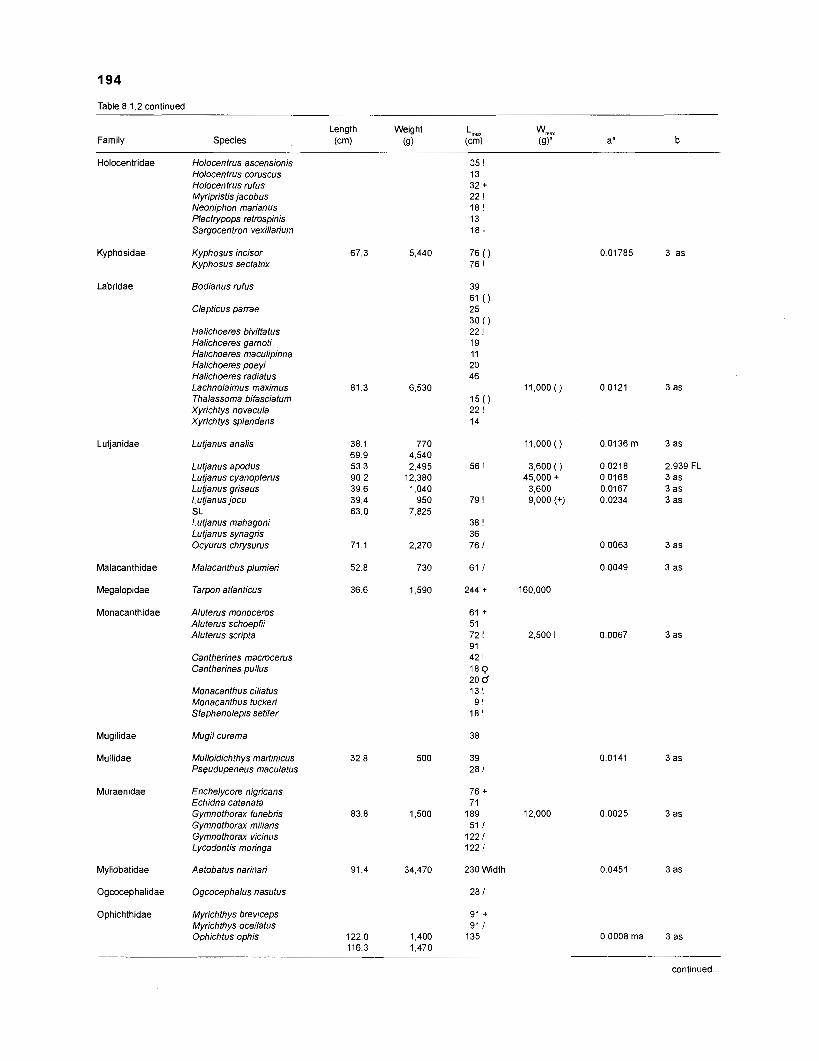
Table 8.1.2 continued
Length Weight Lax wmax
Family Species (cm) (9) (cm) (9)" aa b
Holocentridae Holocentrus ascensionis Holocentrus coruscus Holocentrus rufus Myripristis jacobus Neoniphon marianus Plectrypops retrospinis Sargocentron vexillarium
Kyphosidae
Labridae
Kyphosus incisor Kyphosus sectatrix
Bodianus rufus
Clepticus parrae
Halichoeres bivittatus Halichoeres garnoti Halichoeres maculipinna Halichoeres poeyi Halichoeres radiatus Lachnolaimus maximus Thalassoma bifasciatum Xyrichtys novacula Xyrichtys splendens
Lutjanidae Lutjanus analis
Lutjanus apodus Lutjanus cyanopterus Lutjanus griseus Lutjanus jocu SL Lutjanus mahagoni Lutjanus synagris Ocyurus chrysurus
79 !
38 ! 36 76 /
61 /
244 + 160,000
61 + 51 72 ! 2,500 ! 91 42 1
1 8 9 20 d l 3 ! 9 !
l 8 !
38
39 28 I
76 + 71
I 8 9 51 1
122 1 122 1
230 Width
28 1
91 + 91 1
135
Malacanthidae Malacanthus plumreri
Megalopidae Tarpon atlanticus
Monacanthidae Aluterus monoceros Aluterus schoepfii Aluterus scripta
Cantherines macrocerus Cantherines pullus
Monacanthus ciliatus Monacanthus tuckeri Stephanolepis setifer
Mugil curema Mugilidae
Mullidae Mulloidichthys martinicus Pseudupeneus maculatus
Muraenidae Enchelycore nigricans Echidna catenata Gymnothorax funebris Gymnothorax miliaris Gymnothorax vicinus Lycodontis moringa
Myliobatidae Aetobatus narinari
Ogcocephalidae Ogcocephalus nasutus
Ophichthidae Myrichthys breviceps Myrichthys ocellatus Ophichtus ophis
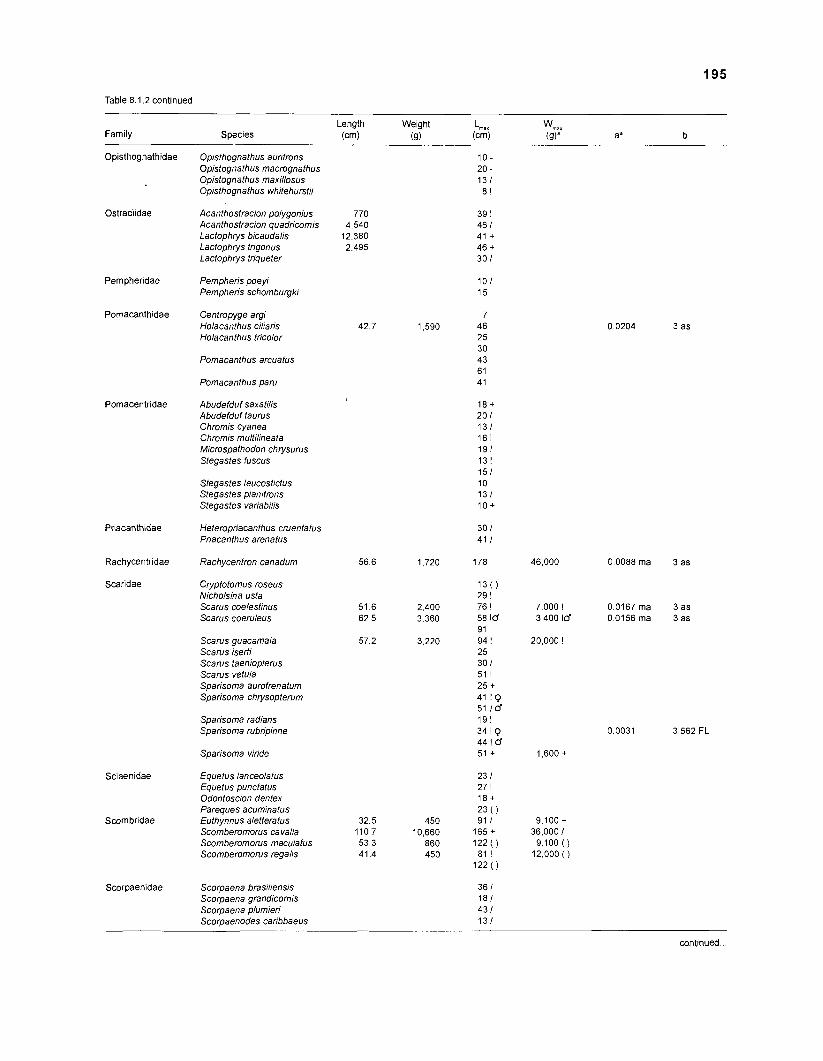
Table 8.1.2 continued
Length Weight Lax Family Species (cm) (9) (cm)
Opisthognathidae Opisthognathus aurifrons Opistognathus macrognathus Opistognathus mavillosus Opisthognathus whitehurstii
Ostraciidae Acanthostracion polygonius Acanthostracion quadricornis Lactophrys bicaudalis Lactophrys trigonus Lactophrys triqueter
Pempheridae
Pomacanthidae
Pempheris poeyi Pempheris schomburgki
Centropyge argi Holacanthus ciliaris Holacanthus tricolor
Pomacanthus arcuatus
Pomacanthus paru
Pomacentridae Abudefduf saxatilis Abudefduf taurus Chromis cyanea Chromis multilineata Microspathodon chrysurus Stegastes fuscus
Stegastes leucostictus Stegastes planifrons Stegastes variabilis
Heteropriacanthus cruentatus Priacanthus arenatus
Rachycentridae
Scaridae
Rachycentron canadum
Cryptotomus roseus Nicholsina usta Scarus coelestinus Scarus coeruleus
Scarus guacamaia Scarus iserti Scarus taeniopterus Scarus vetula Sparisoma aurofrenatum Sparisoma chiysopterum
Sparisoma radians Sparisoma rubripinne
Sparisoma vir~de
Sciaenidae
Scombridae
Scorpaenidae
Equetus lanceolatus Equetus punctafus Odontoscion dentex Pareques acumhatus Euthynnus aletteratus Scomberomorus cavalla Scomberomorus maculatus Scomberomorus regalis
Scorpaena brasiliensis Scorpaena grandicornis Scorpaena plumier; Scorpaenodes caribbaeus
continued ...
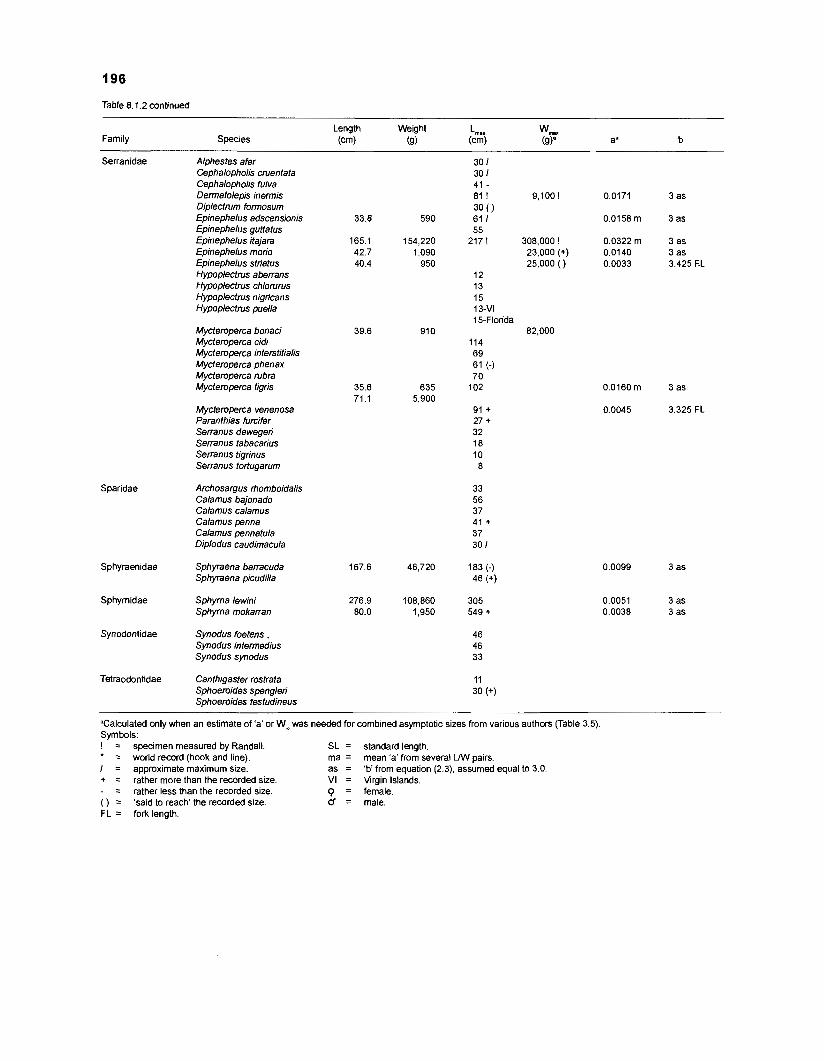
Table 8.1.2 continued
Family Length Weight '-,"ax wm
Species (cm) (9) (cm) (9)" aa b
Serranidae Alphestes afer Cephalopholis cruentata Cephalopholis fulva Dermatolepis inermis Diplectrum formosum Epinephelus adscensionis Epinephelus guttatus Epinephelus itajara Epinephelus morio Epinephelus striatus Hypoplectrus aberrans Hypoplectrus chlorurus Hypoplectrus nigricans Hypoplectrus puella
Sparidae
Mycteroperca bonaci Mycteroperca cidi Mycteroperca interstitialis Mycteroperca phenax Mycteroperca bra Mycteroperca tigris
Mycteroperca venenosa Paranthias furcjfer Serranus dewegeri Serranus tabacarius Serranus tigrinus Serranus tortugarum
Archosargus rhornboidalis Calamus bajonado Calamus calarnus Calamus penna Calamus pennatula Diplodus caudimacula
Sphyraenidae Sphyraena barracuda Sphyraena picudilla
Sphyrnidae Sphyrna lewini Sphyrna mokarran
Synodontidae Synodus foetens. Synodus intermedius Synodus synodus
Tetraodontidae Canthigaster rostrafa Sphoeroides spengleri Sphoeroides testudineus
"Calculated only when an estimate of 'a' or W was needed for combined asymptotic sizes from various authors (Table 3.5). Symbols: ! = specimen measured by Randall. SL = standard length. * - - world record (hook and line). ma = mean 'a' from several LNV pairs. I = approximate maximum size. as = 'b' from equation (2.3), assumed equal to 3.0. + = rather more than the recorded size. VI = Virgin Islands. - - - rather less than the recorded size. 9 = female. ( ) = 'said to reach' the recorded size. d = male. FL = fork length.
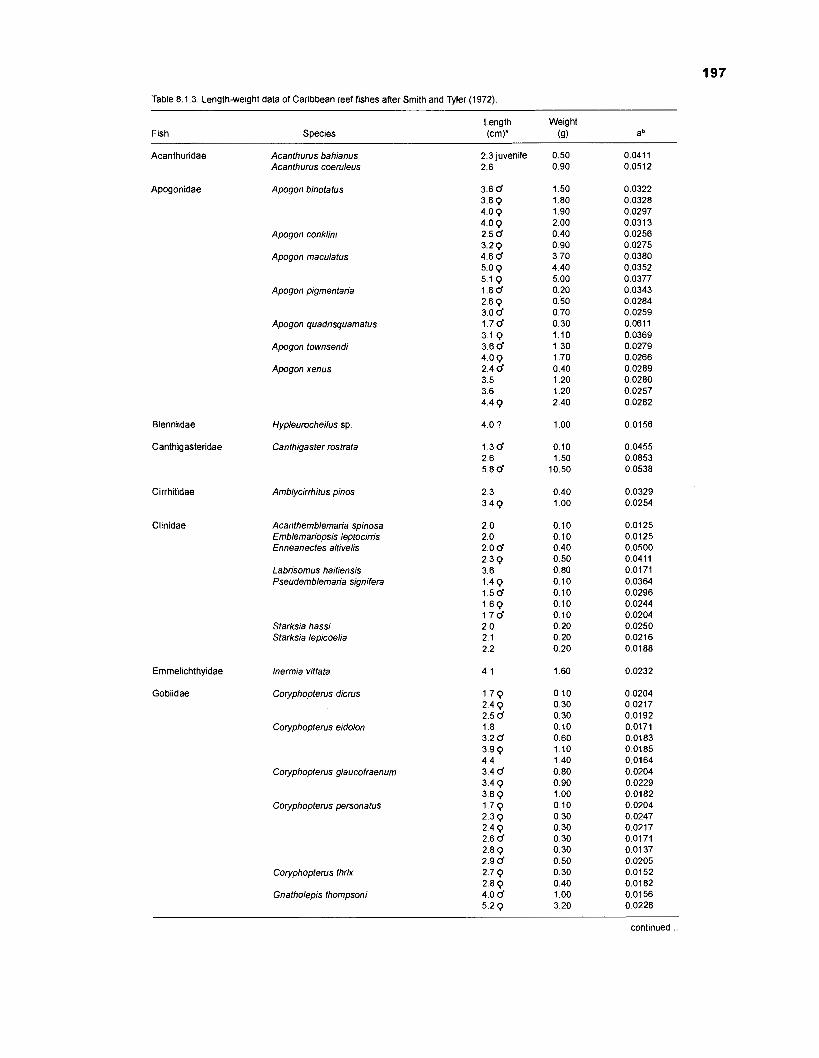
Table 8.1.3. Length-weight data of Caribbean reef fishes after Smith and Tyler (1972)
Fish Species Length Weight (ern). (9) ah
Acanthuridae
Apogonidae
Acanthurus bahianus Acanthurus coeruleus
Apogon binotatus
Apogon conklini
Apogon maculatus
Apogon pigmentaria
Apogon quadrisquamatus
Apogon townsendi
Apogon xenus
Blenniidae Hypleurocheilus sp.
Canthigasteridae Canthigaster rostrata
Cirrhitidae
Clinidae
Amblycirrhitus pinos
Acanthemblemaria spinosa Emblemariopsis leptocirris Enneanectes altivelis
Labrisomus haitiensis Pseudemblemaria signifera
Starksia hassi Starksia lepicoelia
Ernrnelichthyidae lnermia vittata
Gobiidae Coryphopterus dicrus
Coryphopterus eidolon
Coryphopterus glaucofraenum
Coryphopterus personatus
Coryphopterus thrix
Gnatholepis thompsoni
2.3 juvenile 2.6
3.6 d 3.8 Q 4.0 Q 4.0 Q 2.5 d 3.2 Q 4.6 d 5.0 Q 5.1 Q 1.8d 2.6 Q 3.0 d 1.7 d 3.1 Q 3.6 d 4.0 Q 2.4 d 3.5 3.6 4.4 Q
4.0 ?
1.36 2.6 5.8 d
2.3 3.4 Q
2.0 2.0 2.0 d 2.3 Q 3.6 1.49 1.5 6 1.69 1.7d 2.0 2.1 2.2
4.1
1.79 2.4 Q 2.5 d 1.8 3.2 d 3.9 Q 4.4 3.4 d 3.4 Q 3.8 Q 1.79 2.3 Q 2.4 Q 2.6 d 2.8 Q 2.9 d 2.7 Q 2.8 Q 4.0 d 5.2 Q
continued ...
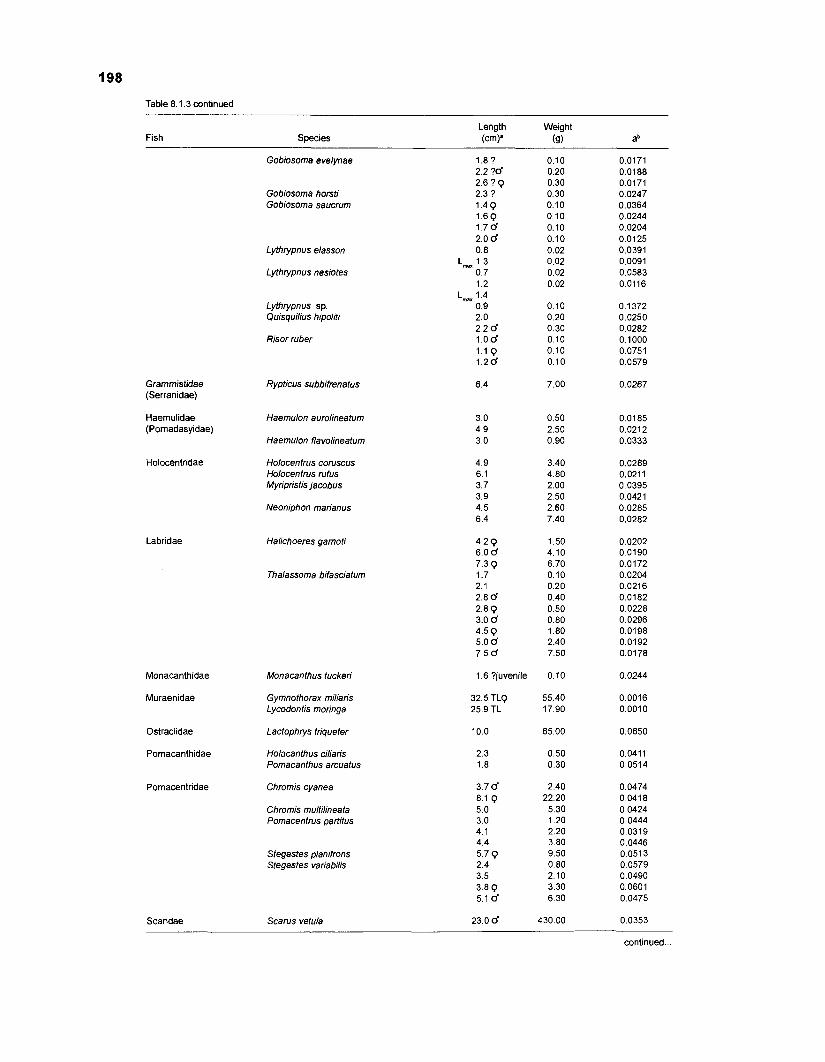
Table 8.1.3 continued
Length Weight Fish Species (cm). (9) ab
Gobiosoma evelynae
Gobiosoma horsti Gobiosoma saucrum
Lythrypnus elasson
Lythrypnus nesiotes
Lythrypnus sp. Quisquilius hipoliti
Risor ruber
Grammistiiae (Serranidae)
Rypticus subbifrenatus
Haernulidae (Pomadasyidae)
Haemubn aurolineatum
Haemulon flavolineatum
Holocentridae Holocentrus coruscus Holocentrus rufus Myrip ristis jacobus
Neoniphon marianus
Labridae Halichoeres garnoti
Thalassoma bifasciatum
Monacanthidae
Muraenidae
Monacanthus tuckeri
Gymnothorax miliaris Lycodontis moringa
Ostraciidae
Pomacanthidae
Lactophtys triqueter
Hobcanthus ciliaris Pomacanthus arcoatus
Pomacentridae Chromis cyanea
Chromis multilineata Pomacentrus partitus
Stegastes planifrons Stegastes variabilis
Scaridae Scarus vetula
continued ...
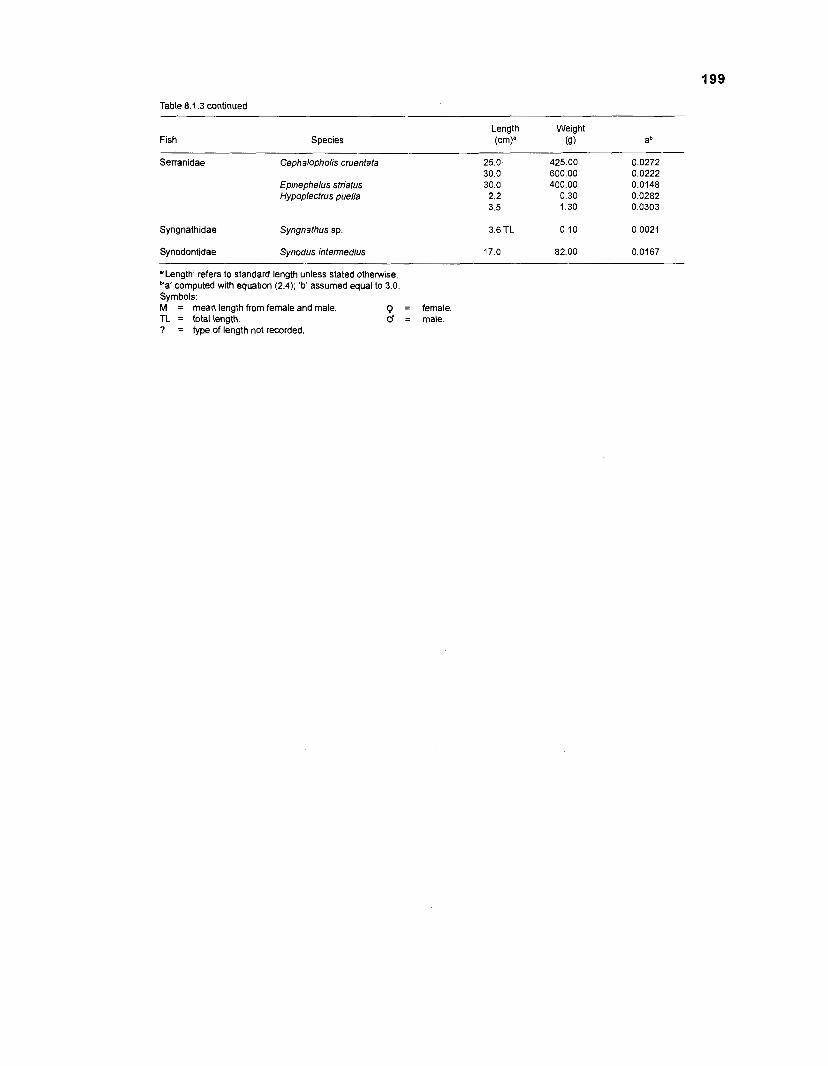
Table 8.1.3 continued
Fish Species Length (cmY
Weight (9)
Serranidae Cephalopholis cruentata
Epinephelus striatus Hypoplectrus puella
Syngnathidae Syngnathus sp.
Synodontidae Synodus intermedius
"'Length' refers to standard length unless stated otherwise. b'a' computed with equation (2.4); 'b' assumed equal to 3.0. Symbols: M = mean length from female and male. 9 = female. TL = total length. d = male. ? = type of length not recorded.
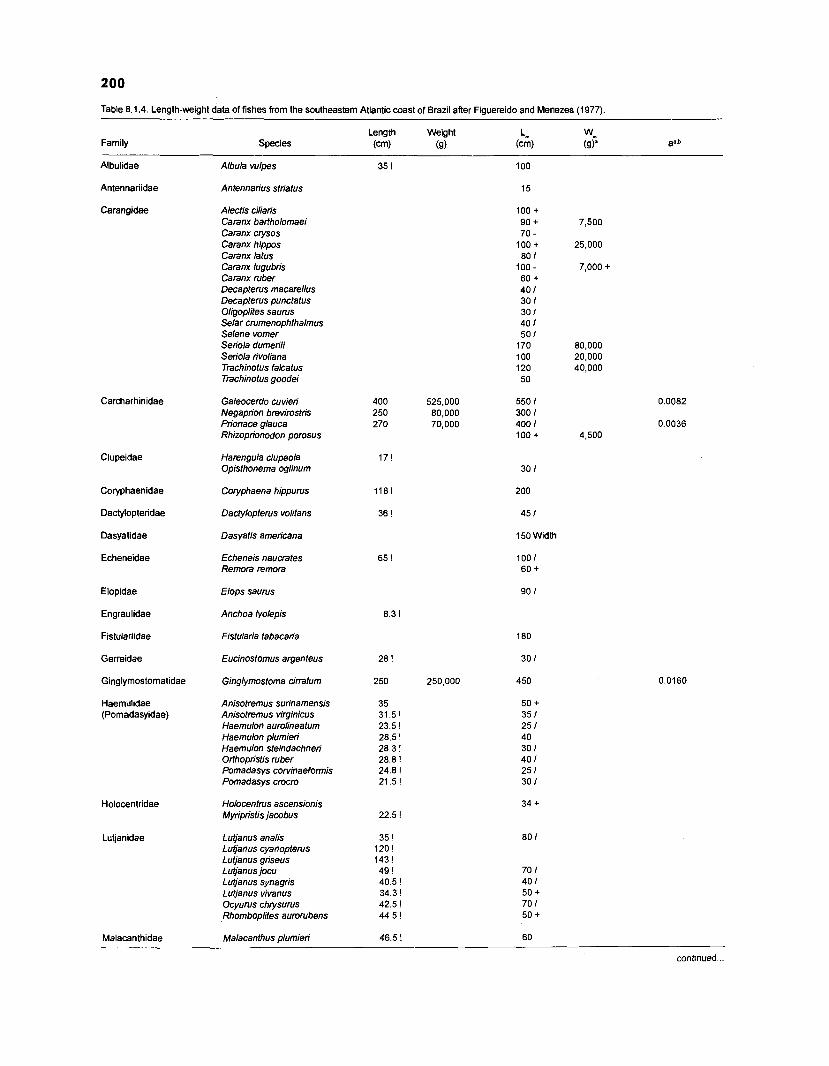
Table 8.1.4. Length-weight data of fishes from the southeastern Atlantic coast of Brazil after Figuereido and Menezes (1977).
Length Weight L, Family Species (cm) (9) ( W (9)' a=.b
wm
Albulidae Albula vulpes
Antennariidae Antennarios striatus
Carangidae Alectis ciliaris Caranx bartholomaei Caranx crysos Caranx hippos Caranx latus Caranx lugubris Caranx ruber Decapterus macarellus Decapterus punctatus Oligoplites saurus Selar crumenophthalmus Selene vomer Seriola dumerili Seriola rivoliana Trachinotus falcatus Trachinotus goodei
Galeocerdo cuvieri Negaprion brevirostris Prionace glauca Rhizoprionodon porosus
Carcharhinidae
Clupeidae Harengula clupeola Opisthonema oglinum 30 1
200
45 1
150 Width
100 I 60 +
90 1
Coryphaenidae
Dactylopteridae
Dasyatidae
Echeneidae
Coryphaena hippurus
Dactylopterus volitans
Dasyatis americana
Echeneis naucrates Remora remora
Elopidae Elops saurus
Engraulidae Anchoa lyolepis
Fistulariidae Fistularia tabacaria
Gerreidae Eucinostomus argenteus
Ginglymostomatidae Ginglymostoma cirratum
Haemulidae (Pomadasyidae)
Anisotremus surinamensis Anisotremus virginicus Haemulon aurolineatum Haemulon plumieri Haemulon steindachneri Orthopristis ruber Pomadasys cowinaefonnis Pomadasys crocro
Holocentridae
Lutjanidae
Holocentrus ascensionis Myripristis jacobus
Lutjanus analis Lutjanus cyanopterus Lutjanus griseus Lutjanus jocu Lutjanus synagris Lutjanus vivanus Ocyurus chrysurus Rhomboplites aurorubens
Malacanthidae Malacanthus plumieri
continued ...
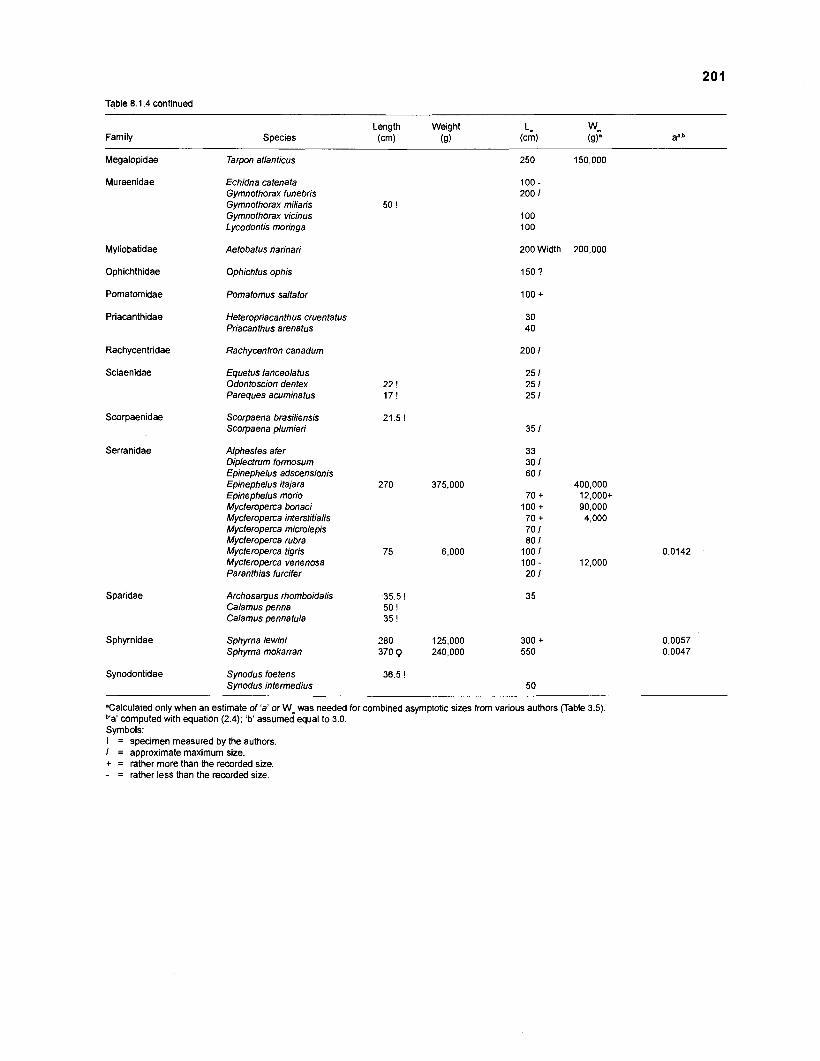
Table 8.1.4 continued
Length Species (cm) Family
Megalopidae Tarpon atlanticus
Muraenidae Echidna catenata Gymnothorax funebris Gymnothorax miliaris Gymnothorax vicinus Lycodontis moringa
Myliobatidae
Ophichthidae
Pomatomidae
Priacanthidae
Aetobatus narinari 200 Width
Ophichtus ophis
Pomatomus saltator
Heteropriacanthus cruentatus Priacanthus arenatus
Rachycentridae
Sciaenidae
Rachycentron canadum
Equetus lanceolatus Odontoscion dentex Pareques acuminatus
Scorpaenidae Scorpaena brasiliensis Scorpaena plumieri
Serranidae Alphestes afer Diplectrom formosum Epinephelus adscensionis Epinephelus itajara Epinephelus morio Mycteroperca bonaci Mycteroperca interstitialis Mycteroperca miciolepis Mycteroperca rubra Mycteroperca tigris Mycteroperca venenosa Paranthias furcifer
Sparidae Archosargus rhomboidalis Calamus penna Calamus pennatula
Sphyrnidae Sphyrna lewini Sphyrna mokarran
Synodontidae Synodus foetens Synodus intermedius
"Calculated only when an estimate of 'a' or W was needed for combined asymptotic sizes from various authors (Table 3.5). b'a' computed with equation (2.4); 'b' assumed equal to 3.0. Symbols: ! = specimen measured by the authors. I = approximate maximum size. + = rather more than the recorded size. - = rather less than the recorded size.
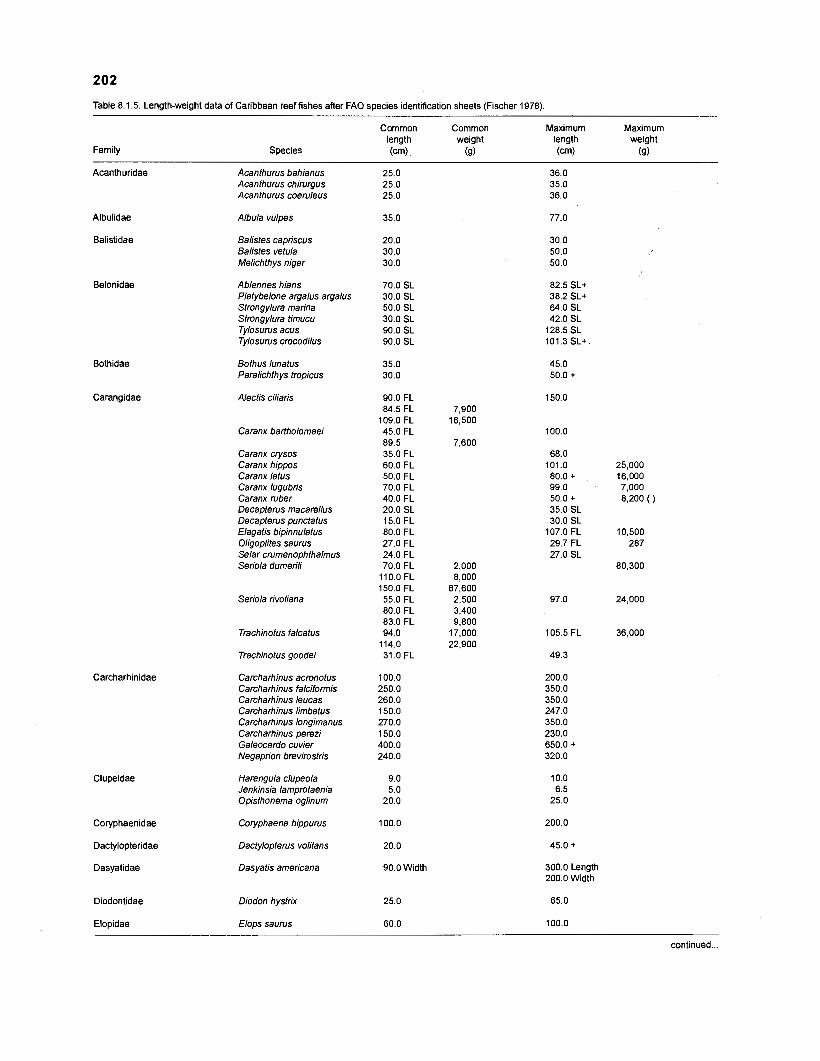
Table 8.1.5. Length-weight data of Caribbean reef fishes after FA0 species identification sheets (Fischer 1978).
Family
Common Common Maximum Maximum length weight length weight
Species (m) (9) (cm) (9)
Acanthuridae
Albulidae
Balistidae
Belonidae
Bothidae
Carangidae
Carcharhinidae
Clupeidae
Coryphaenidae
Dactylopteridae
Dasyatidae
Diodontidae
Elopidae
Acanthurus bahianus Acanthurus chirurgus Acanthurus coeruleus
Albula vulpes
Balistes capriscus Balistes vetula Melichthys niger
Ablennes hians Platybelone argalus argalus Strongylura marina Strongylura timucu Tylosurus acus Tylosurus crocodilus
Bothus lunatus Paralichthys tropicus
Alectis ciliaris
Caranx bartholomaei
Caranx crysos Caranx hippos Caranx latus Caranx lugubris Caranx ruber Decapterus macarellus Decapterus punctatus Elagatis bipinnulatus Oligoplites saurus Selar crumenophthalmus Seriola dumerili
Seriola rivoliana
Trachinotus falcatus
Trachinotus goodei
Carcharhinus acronotus Carcharhinus falciformis Carcharhinus leucas Carcharhinus limbatus Carcharhinus longimanus Carcharhinus perezi Galeocerdo cuvier Negaprion brevirostris
Harengula clupeola Jenkinsia lamprotaenia Opisthonema oglinum
Cofyphaena hippurus
Dactylopterus volitans
Dasyatis americana
Diodon hystrix
Elops saurus
25.0 25.0 25.0
35.0
20.0 30.0 30.0
70.0 SL 30.0 SL 50.0 SL 30.0 SL 90.0 SL 90.0 SL
35.0 30.0
90.0 FL 84.5 FL 109.0 FL 45.0 FL 89.5 35.0 FL 60.0 FL 50.0 FL 70.0 FL 40.0 FL 20.0 SL 15.0 FL 80.0 FL 27.0 FL 24.0 FL 70.0 FL 110.0 FL 150.0 FL 55.0 FL 80.0 FL 83.0 FL 94.0 114.0 31.0 FL
100.0 250.0 260.0 150.0 270.0 150.0 400.0 240.0
9.0 5.0 20.0
100.0
20.0
90.0 Width
25.0
60.0
105.5 FL
49.3
200.0 350.0 350.0 247.0 350.0 230.0 650.0 + 320.0
10.0 6.5 25.0
200.0
45.0 +
300.0 Length 200.0 Width
65.0
100.0
continued ...
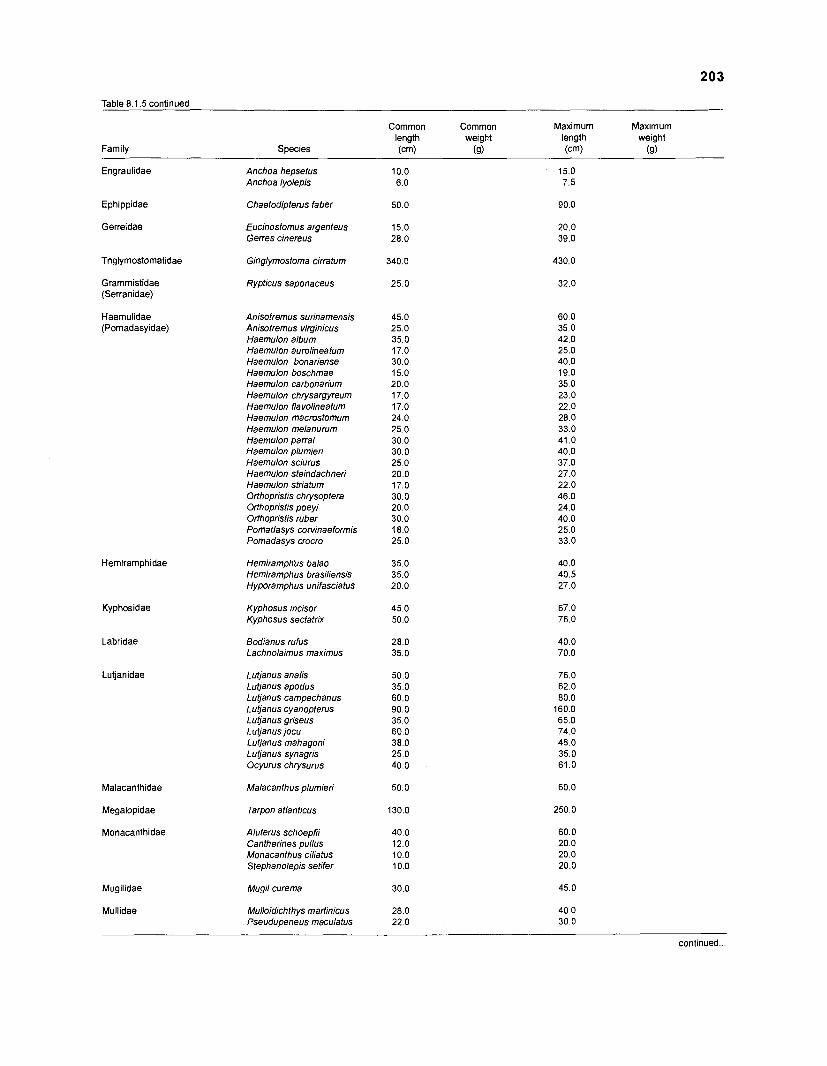
203
Table 8.1.5 continued
Family
Common length
Species (m)
Engraulidae Anchoa hepsetus Anchoa lyolepis
Ephippidae
Gerreidae
Tnglymostomatidae
Grammistidae (Serranidae)
Haemulidae (Pomadasyidae)
Hemiramphidae
Kyphosidae
Labridae
Lutjanidae
Malacanthidae
Megalopidae
Monacanthidae
Mugilidae
Mullidae
Chaetodipterus faber
Eucinostomus argenteus Gerres cinereus
Ginglymostoma cirratum
Rypticus saponaceus
Anisotremus surinamensis Anisotremus virginicus Haemulon album Haemulon aurolineatum Haemulon bonariense Haemulon boschmae Haemulon carbonarium Haemulon chrysargyreum Haemulon flavolineatum Haemulon macrostomum Haemulon melanurum Haemulon parrai Haemulon plumieri Haemulon sciurus Haemulon sfeindachneri Haemulon striatum Orihopristis chrysoptera Orihopristis poeyi Orihopristis ruber Pomadasys corvinaeformis Pomadasys crocro
Hemiram~hbs balao ~emiramphus brasiliensis Hyporamphus unifasciatus
Kyphosus incisor Kyphosus sectatrix
Bodianus rufus Lachnolaimus maximus
Lutjanus analis Lutjanusapodus Lutjanus campechanus Lutjanus cyanopterus Lutjanus griseus Lutjanus jocu Lutjanus mahagoni Lutjanus synagris Ocyurus chrysurus
Malacanthus plumieri
Tarpon atlanticus
Aluterus schoepfii Cantherines pullus Monacanthus ciliatus Stephanolepis setifer
Mugil curema
Mulloidichthys martinicus Pseudupeneus maculatus
Common Maximum Maximum we~ght length weight
(9) (cm) (9)
15.0 7.5
continued ...
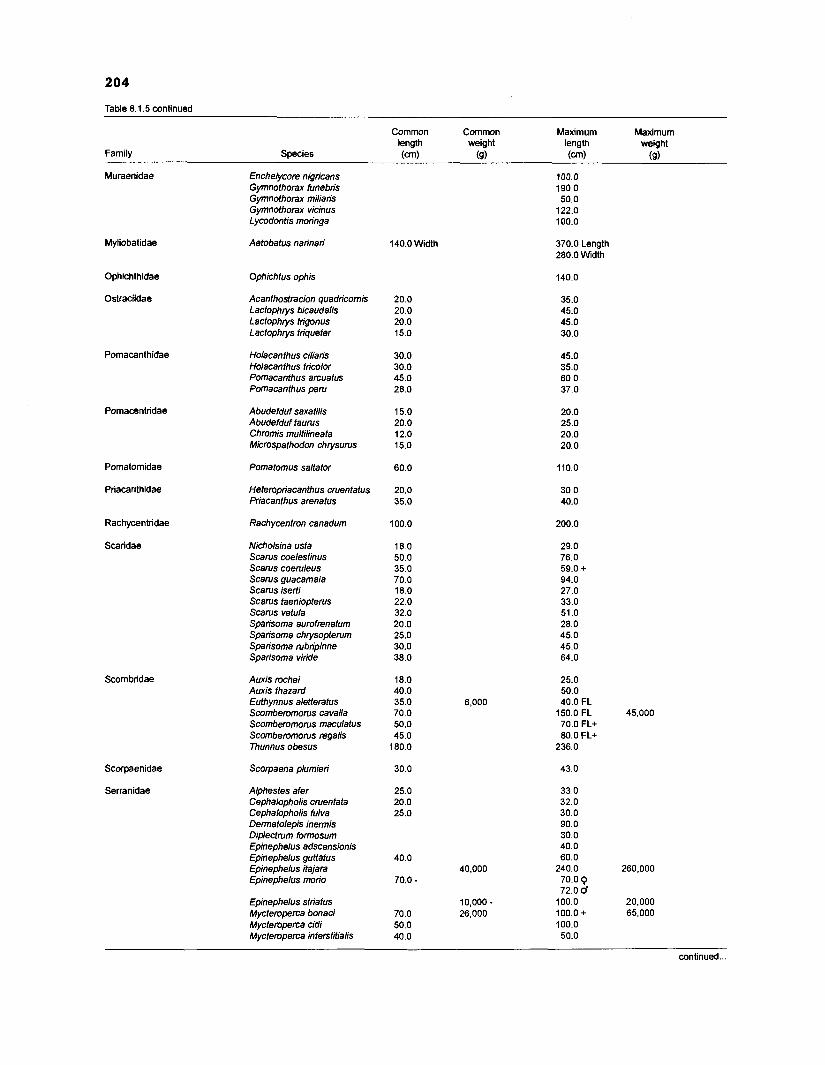
Table 8.1.5 continued
Common Common Maximum Maximum length weight length weight
Family Species (cm) (a) (cml (a)
Muraenidae Enchetycore nigricans Gymnothorax funebris Gymnothorax miliaris Gymnothorax vicinus Lycodontis moringa
Myliobatidae Aetobatus narinari 140.0 Width 370.0 Length 280.0 Width
Ophichthidae
Ostraciidae
Ophichtus ophis
Acanthostracion quadricomis Lactophrys bicaudalis Lactophrys trigonus Lactophrys triqueter
Pomacanthidae Holacanthus ciliaris Holacanthus tricolor Pomacanthus arcuatus Pomacanthus paru
Pomacentridae Abudefduf saxatilis Abudefduf taurus Chromis multilineata Microspathodon chrysurus
Pomatomidae
Priacanthidae
Pomatomus saltator
Heteropriacanthus cruentatus Priacanthus arenatus
Rachycentridae
Scaridae
Rachycentron canadum
Nicholsina usta Scarus coelestinus Scarus coeruleus Scarus guacamaia Scarus isefti Scarus taeniopterus Scarus vetula Soarisoma aurofrenatum .Sparisoma chrysopterum Sparisoma rubrioinne ~parisoma viride
Scombridae Auxis rochei Auxis thazard Euthynnus alefferatus Scomberomorus cavalla Scomberomorus maculatus Scomberomorus regalis Thunnus obesus
Scorpaena plumieri Scorpaenidae
Serranidae Alphestes afer Cephalopholis cruentata Cephalopholis fulva Dermatolepis inermis Diplectrum formosum Epinephelus adscensionis Epinephelus guffatus Epinephelus itajara Epinephelus morio
Epinephelus striatus Mycteroperca bonaci Mycteroperca cidi Mycteroperca interstitialis
continued ...
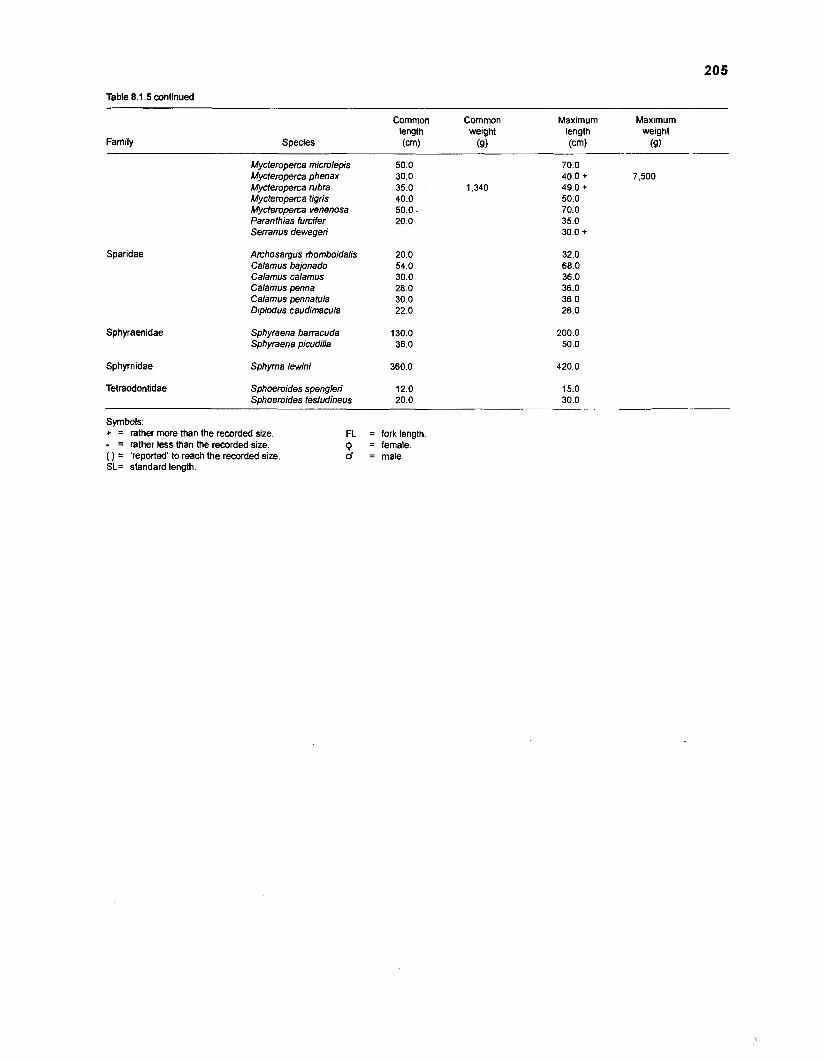
Table 8.1.5 continued
Family
Common Common Maximum Maximum length weight length weight
Species (cm) (9) (Cm) (S)
Sparidae
Sphyraenidae
Mycteroperca microlepis 50.0 Mycteroperca phenax 30.0 Mycteroperca rubra 35.0 1,340 Mycteroperca tigris 40.0 Mycteroperca venenosa 50.0 - Paranthias furcifer 20.0 Senanus dewegeri
Archosargus rhomboidalis 20.0 Calamus bajonado 54.0 Calamus calamus 30.0 Calamus penna 28.0 Calamus pennatula 30.0 Diplodus caudimacula 22.0
Sphyraena barracuda 130.0 Sphyraena picudilla 36.0
Sphyrnidae Sphyrna lewini 360.0 420.0
Tetraodontidae Sphoeroides spengleri 12.0 Sphoeroides testudineus 20.0
Symbols: + = rather more than the recorded size. - = rather less than the recorded size. ( ) = 'reported' to reach the recorded size. SL= standard length.
FL = fork length Q = female. d = male.
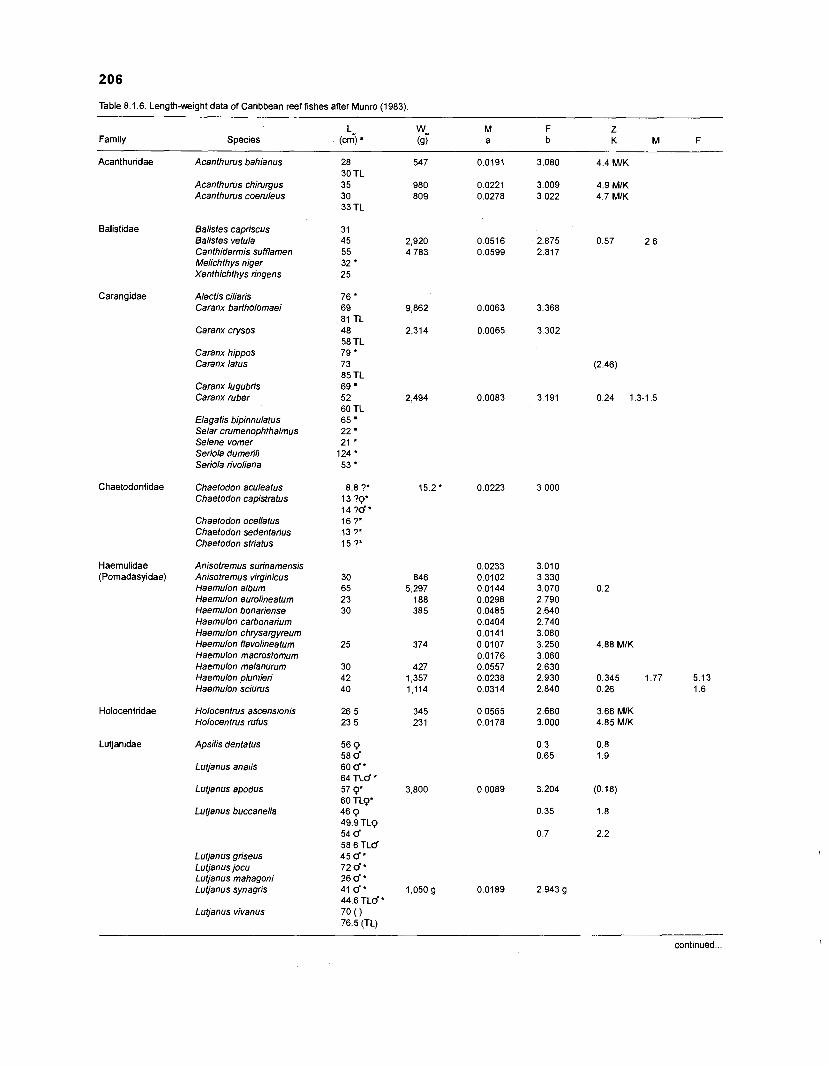
Table 8 1 6 Length-we~ght data of Car~bbean reef fishes after Munro (1983)
L, wp M F Z Fam~ly Specles (cm) a (9) a b K M F
Acanthuridae Acanthurus bahianus 28 30 TL 35 30 33 T L
31 45 55 32 ' 25
76 * 69 81 TL 48 58 TL 79 ' 73 85 TL 69 52 60 T L 65 22 21 *
124 ' 53 *
8.8 ?* 13 ?Q* I4 ? d a I6 ?" I 3 ?* 15 ?*
30 65 23 30
25
30 42 40
26.5 23.5
56 Q 58 d 6 0 d 9 64 T L d * 57 Q* 60 TLQ* 4 6 9 49.9 TLQ 54 d 58.6 T L d 45 d* 72 6' 2613' 41 d'
4.4 MIK
4.9 MIK 4.7 MIK
Acanthurus chirurgus Acanthurus coeruleus
Balistidae Balistes capriscus Balistes vetula Canthidermis sufflamen Melichthys niger Xanthichthys ringens
Carangidae Alectis ciliaris Caranx bartholomaei
Caranx crysos
Caranx hippos Caranx latus
Caranx lugubris Caranx ruber
Elagatis bipinnulatus Selar crumenophthalmus Selene vomer Seriola dumerili Seriola rivoliana
Chaetodontidae Chaetodon aculeatus Chaetodon capisfratus
Chaetodon ocellatus Chaetodon sedentarius Chaetodon striatus
Haemulidae (Pomadasyidae)
Anisotremus surinamensis Anisotremus virginicus Haemulon album Haemulon aurolineatum Haemulon bonariense Haemulon carbonarium Haemulon chrysargyreum Haemulon flavolineatum 4.88 MIK Haemulon macrostomum Haemulon melanurum Haemulon pluniieri Haemulon sciurus
Holocentrus ascensionis Holocentrus rufus
Apsilis dentatus
Lutjanus analis
Lutjanus apodus
Luoanus buccanella
Holocentridae
Lutjanidae
3.66 MIK 4.85 M/K
Lutjanus griseus Lutjanus jocu Lutjanus mahagoni Lutjanus synagris
44.6 T L d 7 0 0 76.5 (TL)
Lutjanus vivanus
continued ...
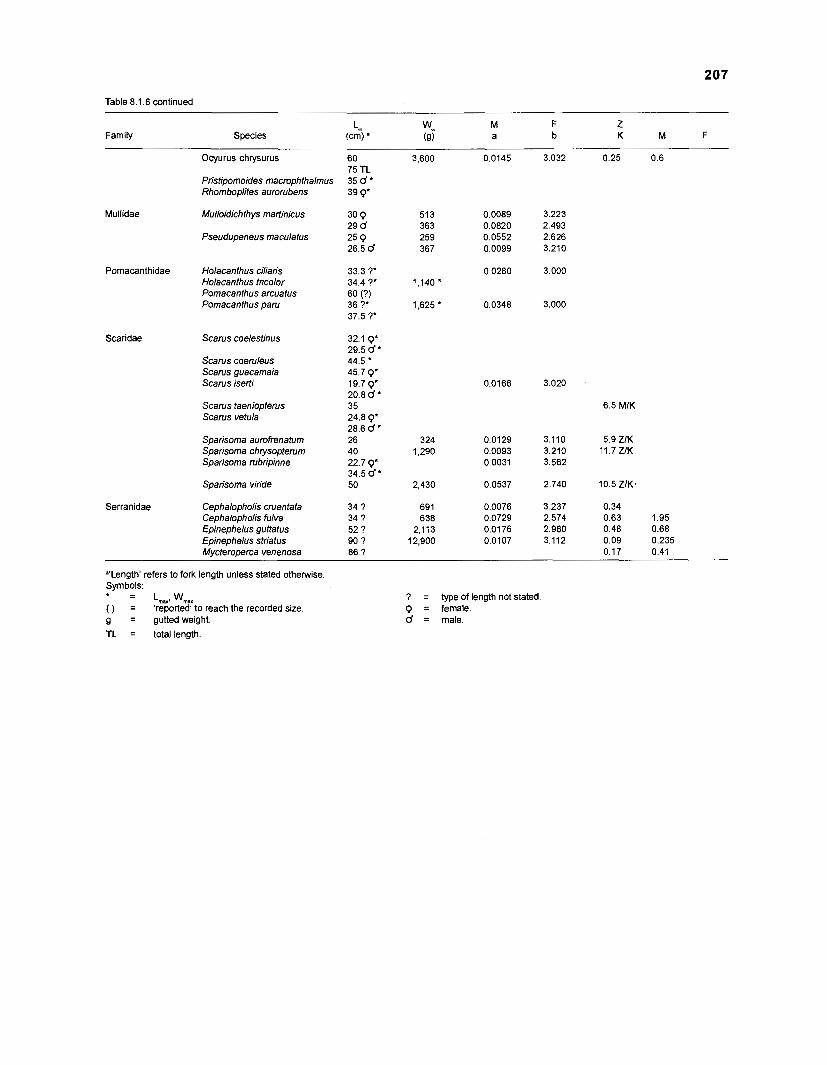
Table 8.1.6 continued
Family Lm ww M F Z
Species (cm) a (9) a b K M F
Ocyurus chrysurus
Pristipomoides macrophthalmus Rhomboplites aurorubens
Mullidae Mulloidichthys martinicus
Pseudupeneus maculatus
Pomacanthidae Holacanthus ciliaris Holacanthus tricolor Pomacanthus arcuatus Pomacanthus paru
Scaridae Scarus coelestinus
Scarus coeruleus Scarus guacamaia Scams iserti
Scarus taeniopterus Scarus vetula
Sparisoma aurofrenatum Sparisoma chrysopterum Sparisoma rubripinne
Serranidae
Sparisoma viride
Cephalopholis cruentata Cephalopholis fulva Epinephelus guttatus Epinephelus striatus Mycteroperca venenosa
6.5 MIK
5.9 ZIK 11.7 U K
"'Length' refers to fork length unless stated otherwise. Symbols: " -
- Lrnd Wrnm ( ) = 'reported' to reach the recorded size g = gutted weight. TL = total length.
? = type of length not stated 9 = female. d = male.
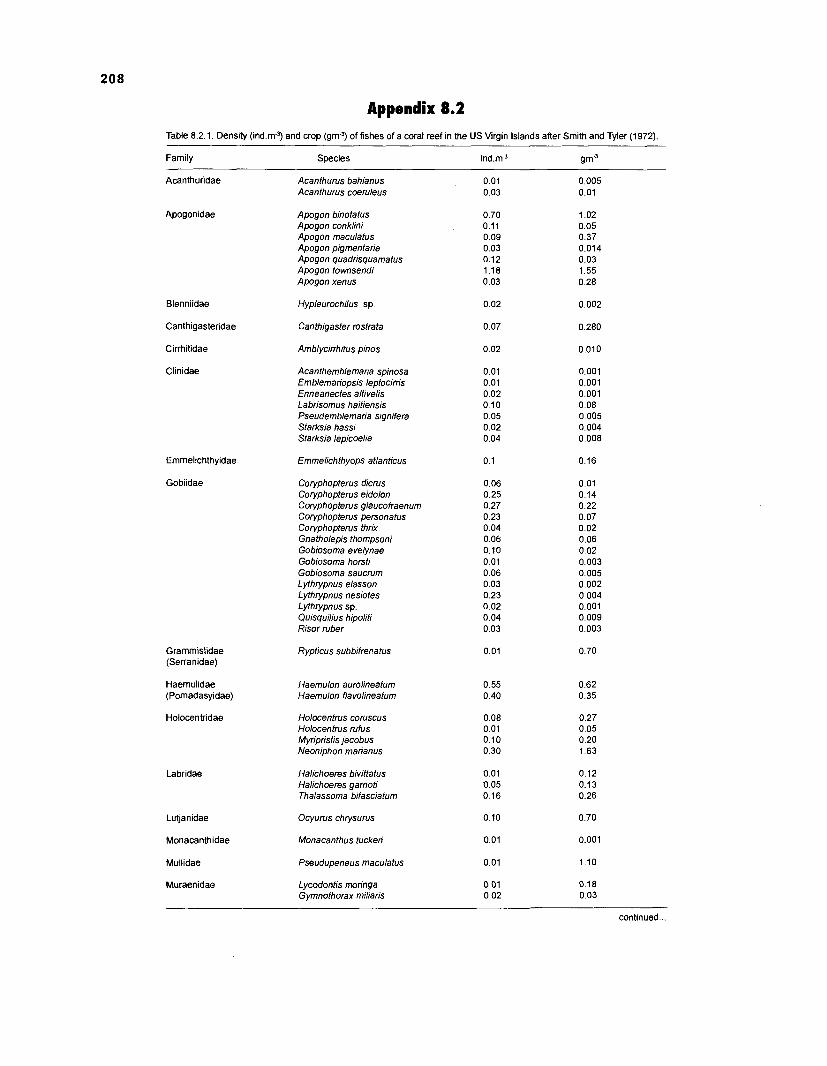
Appendix 8.2 Table 8.2.1. Density (ind.mJ) and crop (gmJ) of fishes of a coral reef in the US Virgin Islands after Smith and Tyler (1972).
Family Species ind.mJ W J
Acanthuridae
Apogonidae
Acanthurus bahianus Acanthurus coeruleus
Apogon binotatus Apogon conklini Apogon maculatus Apogon pigmentaria Apogon quadrisquamatus Apogon townsendi Apogon xenus
Blenniidae
Canthigasteridae
Cirrhitidae
Clinidae
Hypleurochilus sp
Canthigaster rostrata
Amblycirrhitus pinos
Acanthemblemaria spinosa Emblemariopsis leptocirris Enneanectes altivelis Labrisomus haitiensis Pseudemblemaria signifera Starksia bassi Starksia lepicoelia
Emmelichthyops atlanticus Emmelichthyidae
Gobiidae Coryphopterus dicrus Coryphopterus eidolon Coryphopterus glaucofraenum Coryphopterus personatus Coryphopterus thrix Gnatholepis thompsoni Gobiosoma evelynae Gobiosoma horsti Gobiosoma saucrurn Lythrypnus elasson Lythrypnus nesiotes Lythrypnus sp. Quisquilius hipoliti Risor ruber
Grammistidae (Serranidae)
Rypticus subbifrenatus
Haemulidae (Pomadasyidae)
Haemulon aurolineatum Haemulon flavolineatum
Holocentridae Holocentrus coruscus Holocentrus rufus Myripristis jacobus Neoniphon marianus
Labridae Halichoeres bivittatus Halichoeres garnoti Thalassoma bifasciatum
Lutjanidae
Monacanthidae
Mullidae
Muraenidae
Ocyurus chrysurus
Monacanthus tuckeri
Pseudupeneus maculatus
Lycodontis moringa Gymnothorax miliaris
continued ...
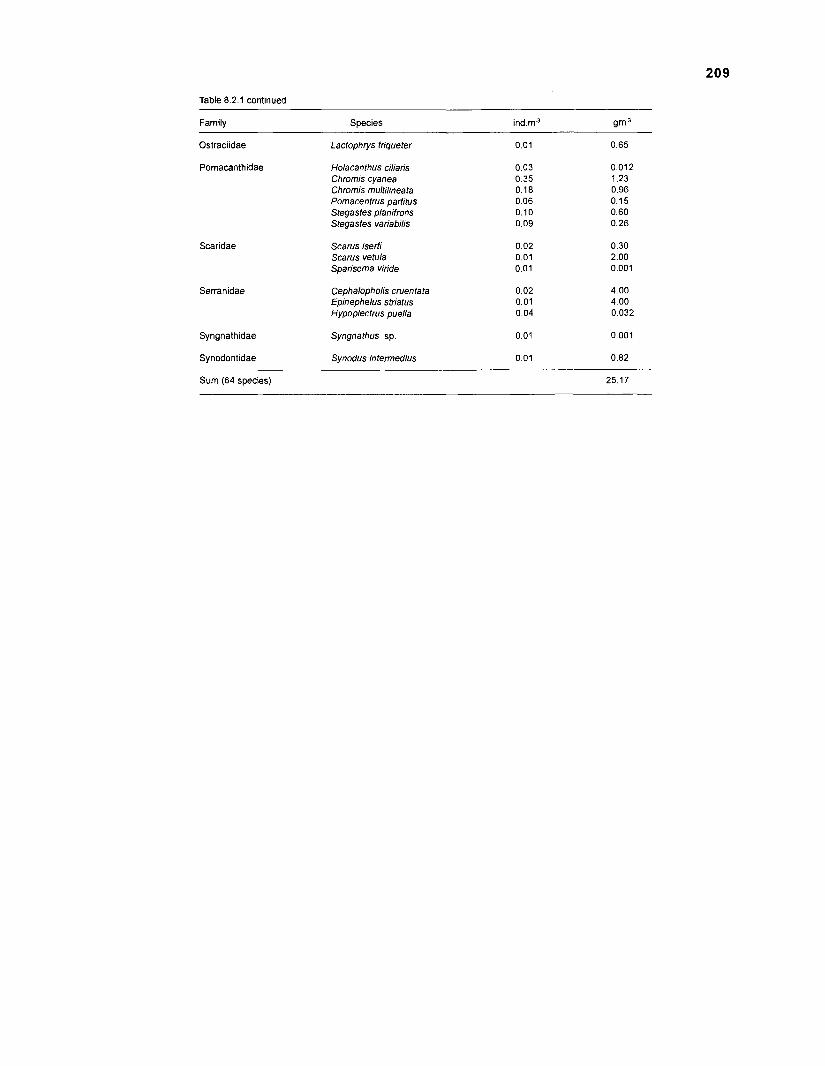
Table 8.2.1 continued
Family Species ind.m" 9m3
Ostraciidae Lactophfys triqueter 0.01 0.65
Pomacanthidae
Scaridae
Serranidae
Holacanthus ciliaris Chromis cyanea Chromis multilineata Pomacentrus parfifus Stegastes planifrons Stegastes variabilis
Scarus iserti Scarus vetula Sparisoma viride
Cephalopholis cruentata Epinephelus striatus Hypoplectrus puella
Syngnathidae Syngnathus sp. 0.01 0.001
Synodontidae Synodus intermedius 0.01 0.82
Sum (64 species) 25.17
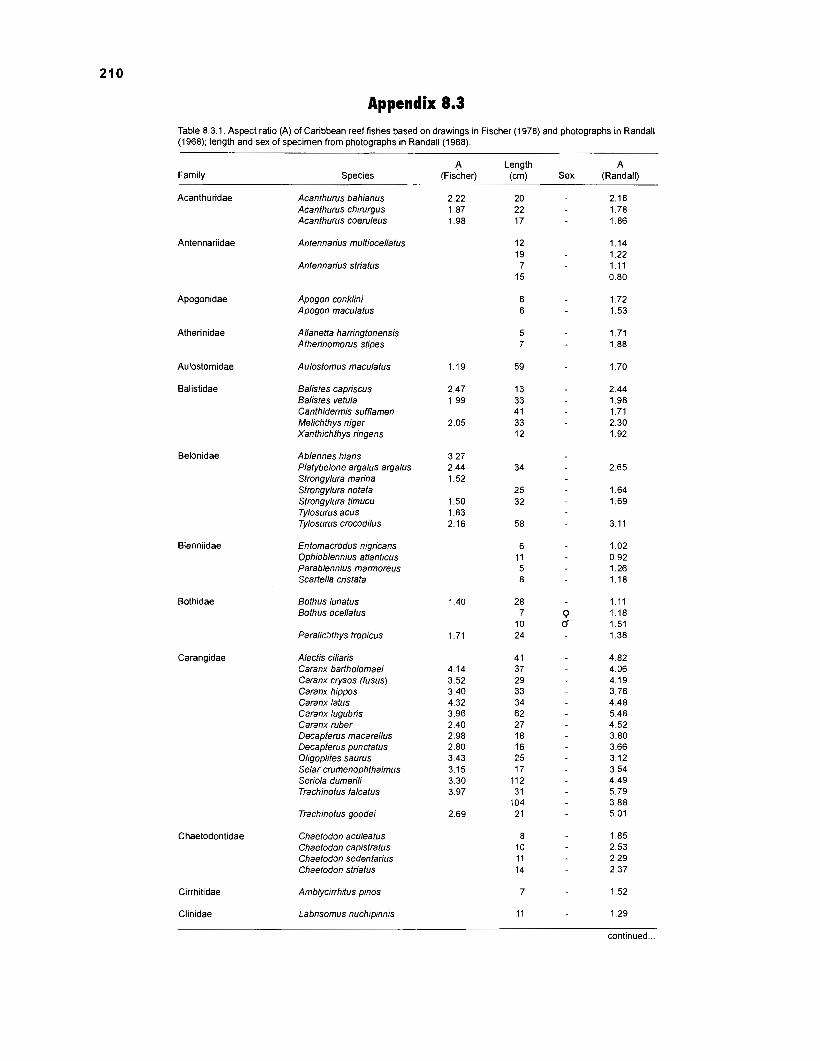
Appendix 8.3 Table 8.3.1. Aspect ratio (A) of Caribbean reef fishes based on drawings in Fischer (1978) and photographs in Randall (1968); length and sex of specimen from photographs in Randall (1968).
Family Species
Acanthuridae
Antennariidae
Apogonidae
Atherinidae
Aulostomidae
Balistidae
Belonidae
Blenniidae
Bothidae
Carangidae
Chaetodontidae
Cirrhitidae
Clinidae
Acanthurus bahianus Acanthurus chirurgus Acanthurus coeruleus
Antennarius multiocellatus
Antennarius striatus
Apogon conklini Apogon maculatus
Allanetta harringtonensis Atherinomorus stipes
Aulostornus rnaculatus
Balistes capriscus Balistes vetula Canthiderrnis sufflamen Melichthys niger Xanthichthys ringens
Ablennes hians Platybelone argalus argalus Strongylura marina Strongylura notata Strongylura timucu Tylosurus acus Tylosurus crocodilus
Entornacrodus nigricans Ophioblennius atlanticus Parablennius marmoreus Scarfella cristata
Bothus lunatus Bothus ocellatus
Paralic,>thys tropicus
Alectis ciliaris Caranx bartholomaei Caranx crysos (fusus) Caranx hippos Caranx latus Caranx lugubris Caranx ruber Decapterus macarellus Decapterus punctatus Oligoplites saurus Selar crumenophthalrnus Seriola durnerili Trachinotus falcatus
Trachinotus goodei
Chaetodon aculeatus Chaetodon capistratus Chaetodon sedentanus Chaetodon striatus
Amblycirrhitus pinos
Labrisomus nuchipinnis
A (Fischer)
2.22 1 87 1.98
1.19
2.47 1.99
2.05
3.27 2.44 1.52
1.50 1.83 2.16
1.40
1.71
4.14 3.52 3.40 4.32 3.96 2.40 2.98 2.80 3.43 3.15 3.30 3.97
2.69
Length (cm) -
20 22 17
12 19 7
15
6 6
5 7
59
13 33 41 33 12
34
25 32
58
6 11 5 8
28 7
10 24
41 37 29 33 34 62 27 18 16 25 17
112 3 1
104 2 1
8 10 11 14
7
11
A Sex (Randall)
continued.
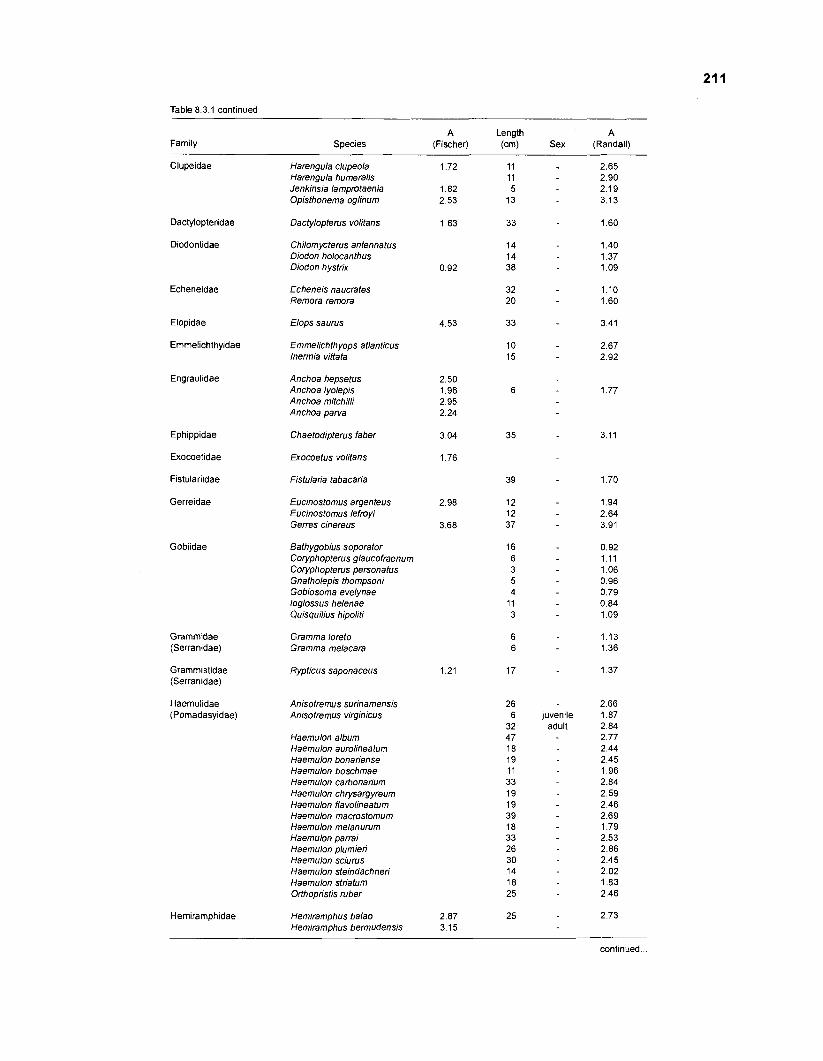
Table 8.3.1 continued
A Length A Family Species (Fischer) (cm) Sex (Randall)
Clupeidae Harengula clupeola Harengula humeralis Jenkinsia lampmtaenia Opisthonema oglinum
juvenile adult
Dactylopteridae
Diodontidae
Dactylopterus volitans
Chilomycterus antennatus Diodon holocanthus Diodon hystrix
Echeneidae Echeneis naucrates Remora remora
Elopidae
Emmelichthyidae
Elops saurus
Emrnelichthyops atlanticus lnermia vittata
Engraulidae Anchoa hepsetus Anchoa lyolepis Anchoa mitchilli Anchoa parva
Ephippidae Chaetodipterus faber
Exocoetidae
Fistulariidae
Gerreidae
Exocoetus volitans
Fistularia tabacaria
Eucinostomus argenteus Eucinostomus lefmyi Gems cinereus
Gobiidae Bathygobius soporator Coryphopterus glaucofraenum Coryphopterus personatus Gnatholepis thompsoni Gobiosoma evelynae loglossus helenae Quisguilius hipoliti
Grammidae (Serranidae)
Gramma loreto Gramma melacara
Gramrnistidae (Serranidae)
Rypticus saponaceus
Haemulidae (Pomadasyidae)
Anisotremus surinamensis Anisotremus virginicus
Haemulon album Haemulon aurolineatum Haemulon bonariense Haemulon boschmae Haemulon carbonarium Haemulon chrysargyreum Haemulon flavolineatum Haemulon macrostomum Haemulon melanurum Haemulon parrai Haemulon plumieri Haemulon sciurus Haemulon steindachneri Haemulon striatom Orfhopristis ruber
Hemiramphidae Hemiramphus balao Hemiramphus bermudensis
continued ...
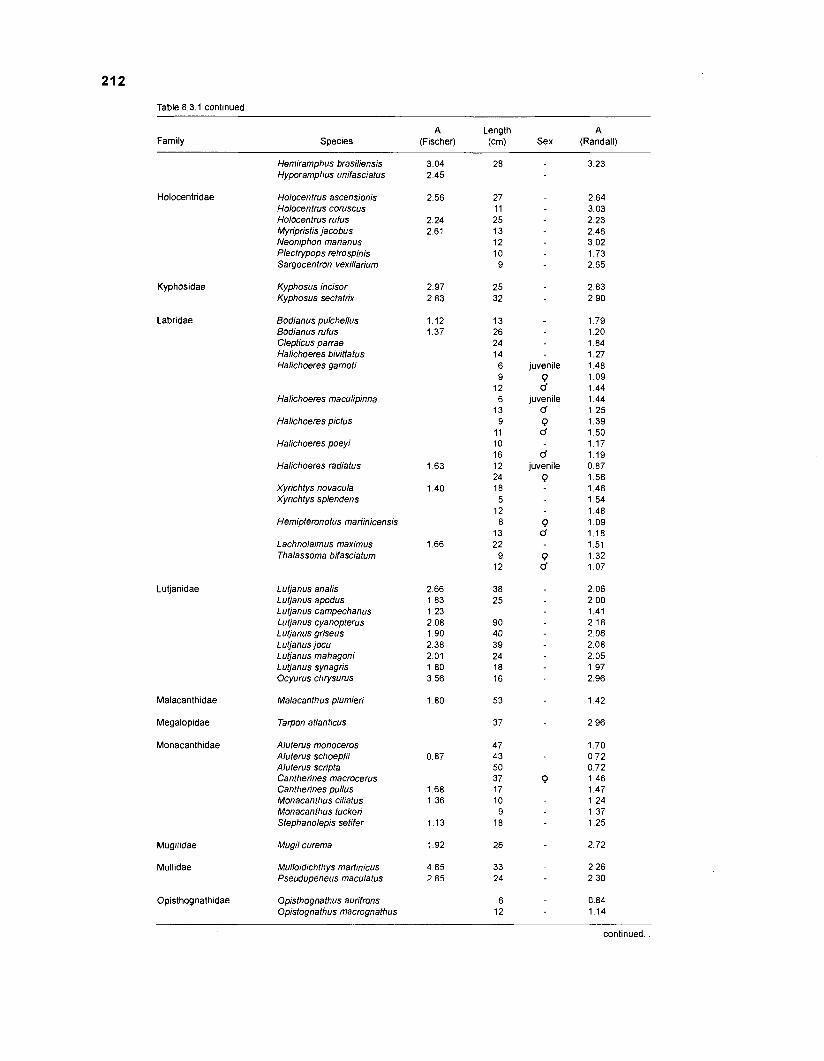
Table 8.3.1 continued
Family A Length A
Species (Fischer) (cm) Sex (Randall)
Kyphosidae
Labridae
Hemiramphus brasiliensis Hyporamphus unifasciatus
Holocentridae Holocentrus ascensionis Holocentrus coruscus Holocentrus rufus Myripristis jacobus Neoniphon marianus Plectrypops retrospinis Sargocentron vexillarium
Kyphosus incisor Kyphosus sectatrix
Lutjanidae
Bodianus pulchellus Bodianus rufus Clepticus parrae Halichoeres biviffatus Halichoeres garnoti
Halichoeres maculipinna
Halichoeres pictus
Halichoeres poeyi
Halichoeres radiatus
Xyrichtys novacula Xyrichtys splendens
Hemipteronotus martinicensis
Lachnolaimus maximus Thalassoma bifasciatum
Lutjanus analis Lutjanus apodus Lutjanus campechanus Lufianus cyanopterus Lufianus griseus Lutjanus jocu Lutjanus mahagoni Lutjanus synagris Ocyurus chrysurus
Malacanthidae Malacanthus plumieri
Megalopidae Tarpon atlanticus
Monacanth~dae Aluterus monoceros Aluterus schoepfii Aluterus scripta Cantherines rnacrocerus Cantherines pullus Monacanthus ciliatus Monacanthus tuckeri Stephanolepis setifer
Mugilidae Mugil curema
Mullidae Mulloidichthys maltmicus Pseudupeneus maculatus
Opisthognathidae Opisthognathus aurifrons Opistognathus macrognathus
juvenile 9 d
juvenile d 9 d
d juvenile
Q
Q d
9 d
0
- continued ...
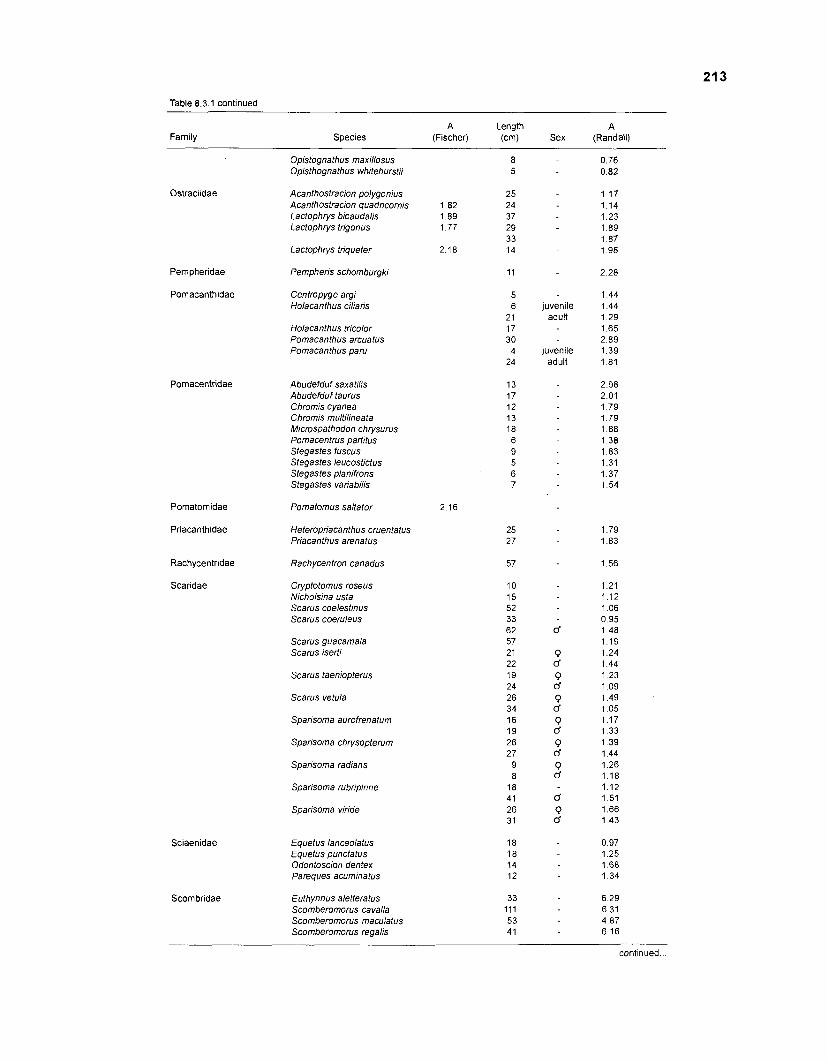
Table 8.3.1 continued
A Length A Species (Fischer) (cm) Sex (Randall) Family
Opistognathus rnaxillosus Opisthognathus whitehurstii
juvenile adult
juvenile adult
d
9 d 9 d Q d Q d Q d Q d
d 0 d
Ostraciidae Acanthostracion polygonius Acanthostracion quadricornis Lactophrys bicaudalis Lactophrys trigonus
Lactophrys triqueter
Pempheridae
Pomacanthidae
Pernpheris schornburgki
Centropyge argi Holacanthus ciliaris
Holacanthus tricolor Pornacanthus arcuatus Pornacanthus oaru
Pomacentridae Abudefduf saxatilis Abudefduf t a m s Chrornis cyanea Chrornis multilineata Microspathodon chrysurus Pornacentrus partitus Stegastes fuscus Stegastes leucostictus Stegastes planifrons Stegastes variabilis
Pomatomidae
Priacanthidae
Pornatornus saltator
Heteropriacanthus cruentatus Priacanthus arenatus
Rachycentridae
Scaridae
Rachycentron canadus
Cryptotornus roseus Nicholsina usta Scarus coelestinus Scarus coeruleus
Scarus guacarnaia Scarus iserti
Scarus taeniopterus
Scarus vetula
Sparisorna aurofrenaturn
Sparisorna chrysopterurn
Sparisorna radians
Sparisorna rubripinne
Soarisorna viride
Sciaenidae Equetus lanceolatus Equetus punctatus Odontoscion dentex Pareques acurninatus
Scombridae Euthynnus aletteratus Scornberornorus cavalla Scornberornorus rnaculatus Scornberornorus regalis
continued.
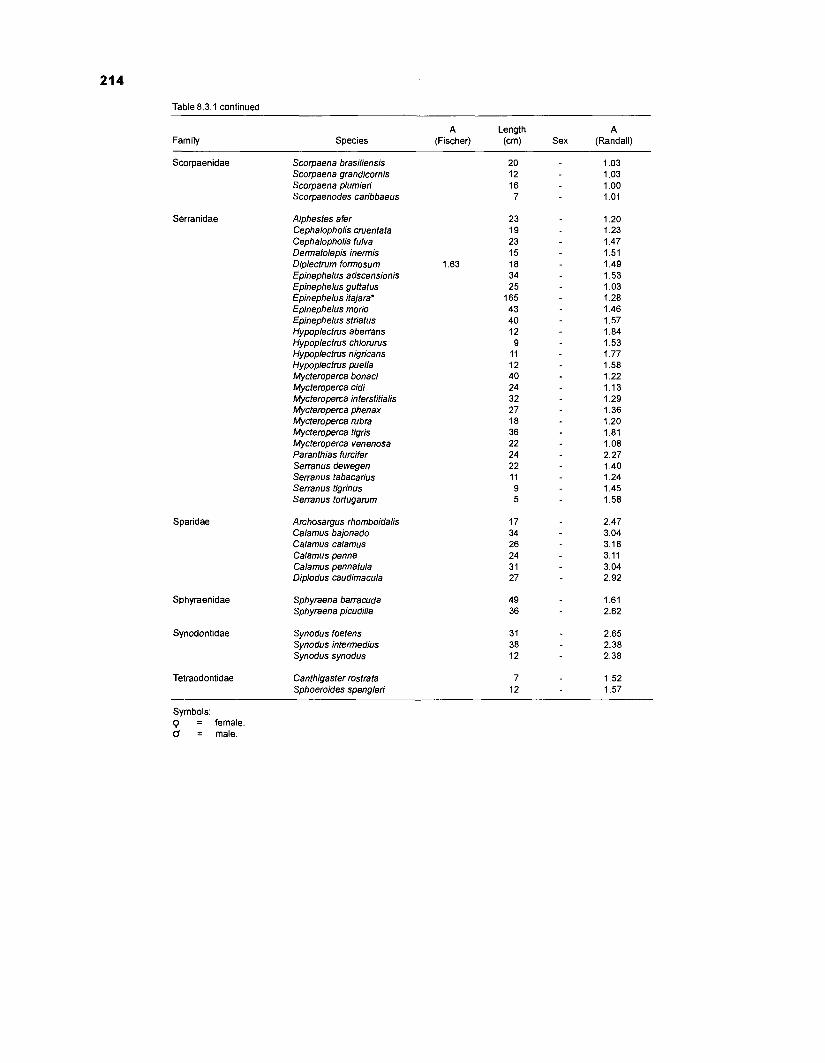
Table 8.3.1 continued
Family Species A Length A
(Fischer) (cm) Sex (Randall)
Scorpaenidae Scorpaena brasiliensis Scorpaena grandicomis Scorpaena plumieri Scorpaenodes caribbaeus
Serranidae
Sparidae
Sphyraenidae
Synodontidae
Alphestes afer Cephalopholis cruentata Cephalopholis fulva Dermatolepis inerrnis Diplectrurn formosum Epinephelus adscensionis Epinephelus guttatus Epinephelus itajara* Epinephelus morio Epinephelus striatus Hypoplectrus aberrans Hypoplectrus chlorurus Hypoplectrus nigricans Hypoplecfrus puella Mycteroperca bonaci Mycteroperca cidi Mycteroperca interstitialis Mycteroperca phenax Mycteroperca rubra Mycteroperca tigris Mycteroperca venenosa Paranthias furcifer Serranus dewegeri Serranus tabacarius Serranus tigrinus Serranus tortugarum
Archosargus rhomboidalis Calarnus bajonado Calarnus calamus Calamus penna Calamus pennatula Diplodus caudimacula
Sphyraena barracuda Sphyraena picudilla
Synodus foetens Synodus intermedius Synodus synodus
Tetraodontidae Canthigaster rostrata Sphoeroides spenglen
Symbols: Q = female. d = male.
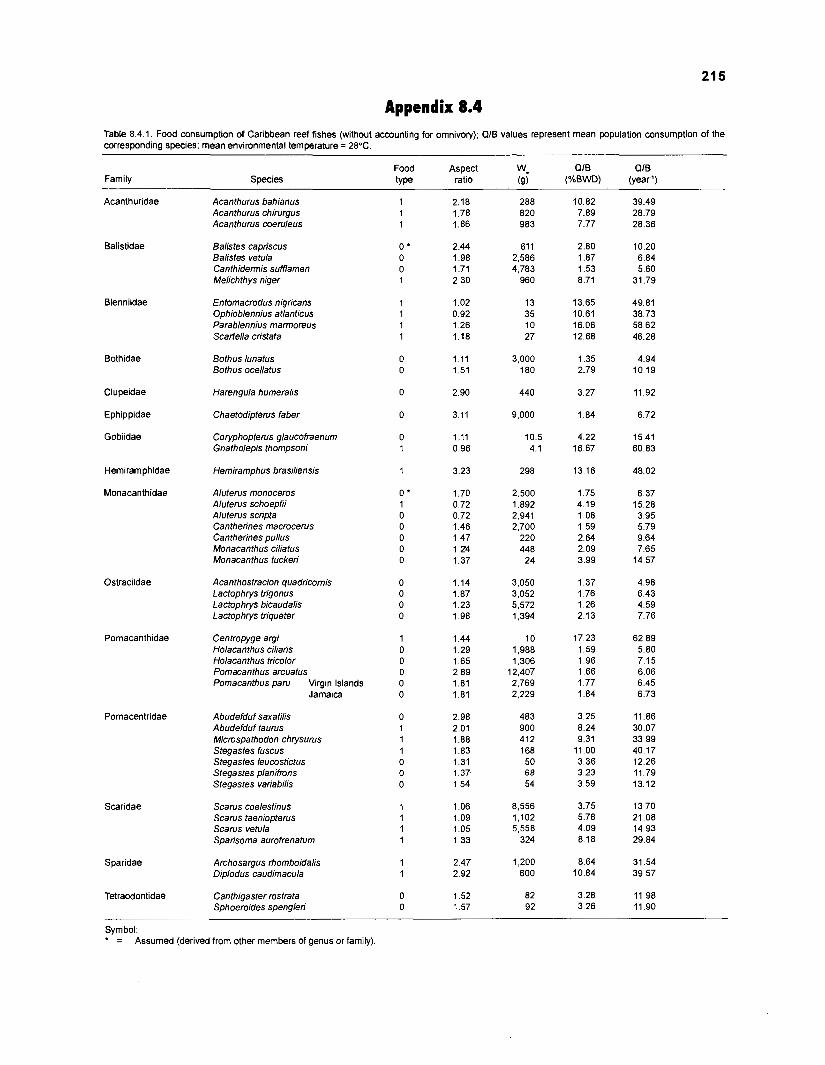
Appendix 8.4 Table 8.4.1. Food consumption of Caribbean reef fishes (without accounting for omnivory); QIB values represent mean population consumption of the corresponding species; mean environmental temperature = 28%.
Family Species Food Aspect wm QIB QIB type ratio (9) (%BWD) (year1)
Acanthuridae
Balistidae
Blenniidae
Bothidae
Clupeidae
Ephippidae
Gobiidae
Hemiramphidae
Monacanthidae
Ostraciidae
Pomacanthidae
Pomacentridae
Scaridae
Sparidae
Tetraodontidae
Acanthurus bahianus Acanthurus chirurgus Acanthurus coeruleus
Balistes capriscus Balistes vetula Canthidermis sufflamen Melichthys niger
Entomacrodus nigricans Ophioblennius atlanticus ~arablennius mamoreus Scarfella cristata
Bothus lunatus Bothus ocellatus
Harengula humeralis
Chaetodipterus faber
Coryphopterus glaucofraenum Gnatholepis thompsoni
Hemiramphus brasiliensis
Aluterus monoceros Aluterus schoepfii Aluterus scripta Cantherines macrocerus Cantherines pullus Monacanthus ciliatus Monacanthus tuckeri
Acanthostracion quadricornis Lactophrys trigonus Lactophrys bicaudalis Lactophrys triqueter
Centropyge argi Holacanthus ciliaris Holacanthus tricolor Pomacanthus arcuatus Pomacanthus paru Virgin Islands
Jamaica
Abudefduf saxatilis Abudefduf taurus Microspathodon chrysurus Stegastes fuscus Stegastes leucostictus Stegastes planifrons Stegastes variabilis
Scarus coelestinus Scarus taeniopterus Scarus vetula Sparisoma aurofrenatum
Archosargus rhomboidalis Diplodus caudimacula
Canthigaster rostrata Sphoeroides spengleri
Symbol: . - - Assumed (derived from other members of genus or family)
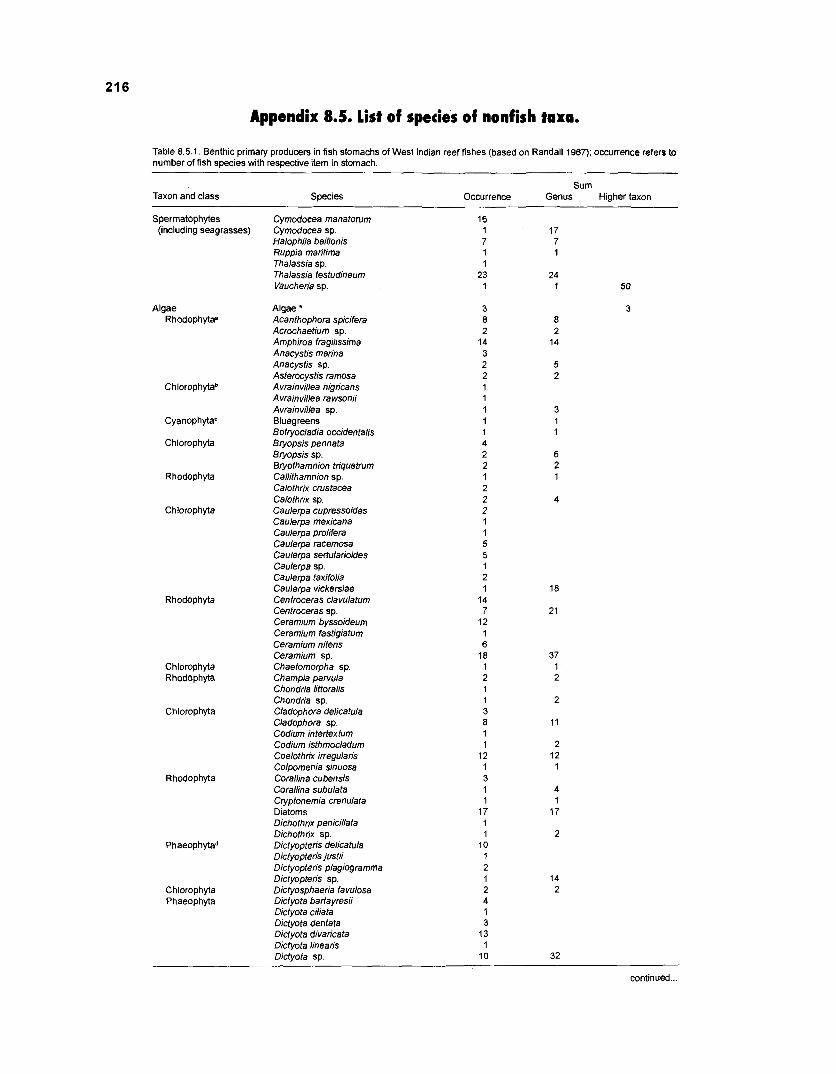
Appendix 8.5. List of species of nonfish taxa.
Table 8.5.1. Benthic primary producers in fish stomachs of West Indian reef fishes (based on Randall 1967); occurrence refers to number of fish species with respective item in stomach.
Taxon and class Species
Spermatophytes (including seagrasses)
Algae Rhodophytaa
Chlorophytab
Cyanophytac
Chlorophyta
Rhodophyta
Chlorophyta
Rhodophyta
Chlorophyta Rhodophyta
Chlorophyta
Rhodophyta
Chlorophyta Phaeophyta
-
Cymodocea manatorurn Cymodocea sp. Halophila baillonis Ruppia maritima Thalassia sp. Thalassia testudineum Vaucheria sp.
Algae * Acanthophora spicifera Acrochaetium sp. Amphiroa fragilissima Anacystis marina Anacystis sp. Asterocystis ramosa A vrainvillea nigricans Avrainvillea rawsonii Avrainvillea sp. Bluegreens Botryocladia occidentalis B~yopsis pennata Bryopsis sp. Btyothamnion triquetrum Callithamnion sp. Calothrix crustacea Calothrix sp. Caulerpa cupressoides Caulerpa mexicana Caulerpa prolifera Caulerpa racemosa Caulerpa serfularioides Caulerpa sp. Caulerpa taxifolia Caulerpa vickersiae Centroceras clavulatum Centroceras sp. Ceramium byssoideum Ceramium fastigiatum Ceramium nitens Ceramium sp. Chaetomorpha sp. Champia parvula Chondria littoralis Chondria sp. Cladophora delicatula Cladophora sp. Codium intertextum Codium isthmocladum Coelothrix irregularis Colpomenia sinuosa Corallina cubensis Corallina subulata Cryptonemia crenulata Diatoms Dichothrix penicillata Dichothrix sp. Dictyopteris delicatula Dictyopteris justii Dictyopteris plagiogramma Dictyopteris sp. Dictyosphaeria favulosa Dictyota bartayresii Dictyota ciliata Dictyota dentata Dictyota divaricata Dictyota linearis Dictyota sp.
- -
Sum Occurrence Genus Higher taxon
16 1 17 7 7 1 1 1
23 24 1 1
continued ...
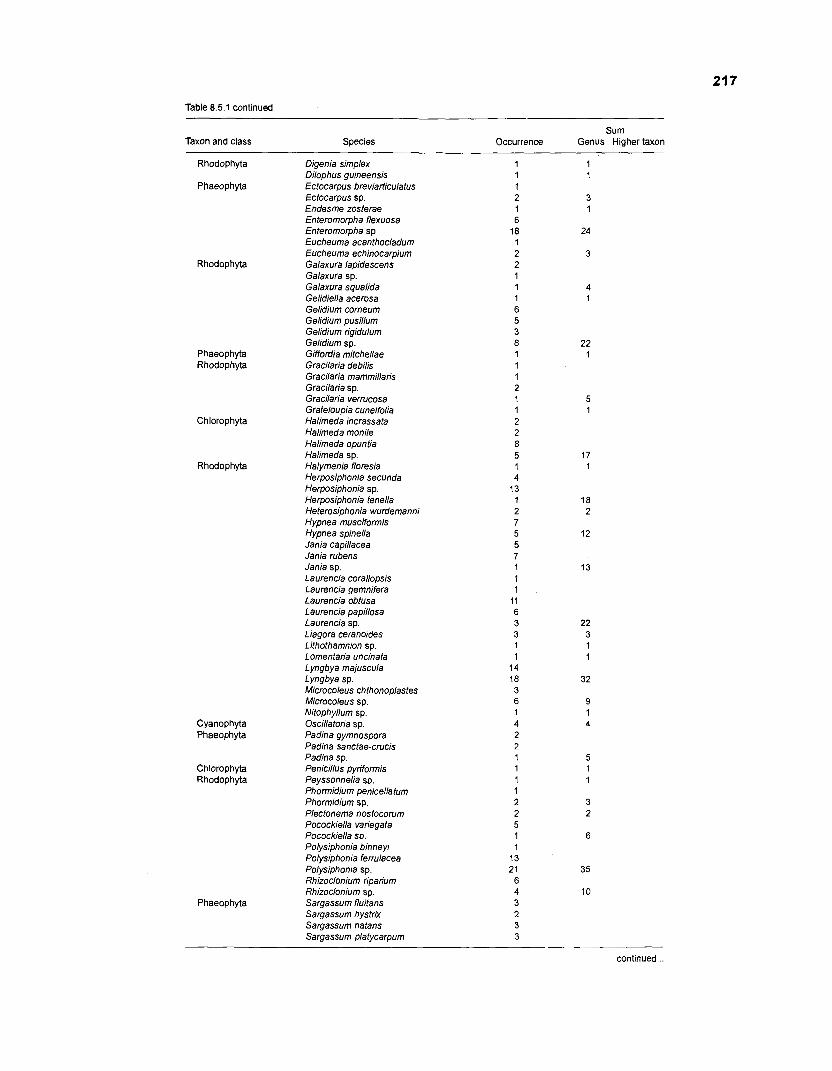
Table 8.5.1 continued
Sum Taxon and class Species Occurrence Genus Higher taxon
Rhodophyta
Phaeophyta
Rhodophyta
Phaeophyta Rhodophyta
Chlorophyta
Rhodophyta
Cyanophyta Phaeophyta
Chlorophyta Rhodophyta
Phaeophyta
Digenia simplex Dilophus guineensis Ectocarpus breviarticulatus Ectocarpus sp. Endesme zosferae Enteromorpha flexuosa Enteromorpha sp. Eucheuma acanthocladum Eucheuma echinocarpium Galaxura lapidescens Galaxura sp. Galaxura squalida Gelidiella acerosa Gelidium corneum Gelidium pusillum Gelidium rigidulum Gelidium sp. Giffordia mitchellae Gracilaria debilis Gracilaria mammillaris Gracilaria sp. Gracilaria verrucosa Grateloupia cuneifolia Halimeda incrassafa Halimeda monile Halimeda opuntia Halimeda sp. Halymenia floresia Herposiphonia secunda Herposiphonia sp. Herposiphonia fenella Heterosiphonia wurdemanni Hypnea musciformis Hypnea spinella Jania capillacea Jania rubens Jania sp. Laurencia corallopsis Laurencia gemnifera Laurencia obfusa Laurencia papillosa Laurencia sp. Liagora ceranoides Lithothamnion sp. Lomenfaria uncinata Lyngbya majuscula Lyngbya sp. Microcoleus chthonoplastes Microcoleus sp. Nitophyllum sp. Oscillatoria sp. Padina gymnospora Padina sanctae-crucis Padina sp. Penicillus pyriformis Peyssonnelia sp. Phorrnidium penicellatum Phormidium sp. Plecfonema nosfocorum Pocockiella variegata Pocockiella sp. Polysiphonia binneyi Polysiphonia ferrulacea Polysiphonia sp. Rhizoclonium riparium Rhizoclonium sp. Sargassum fluitans Sargassum hystrix Sargassum natans Sargassum platycarpum
continued
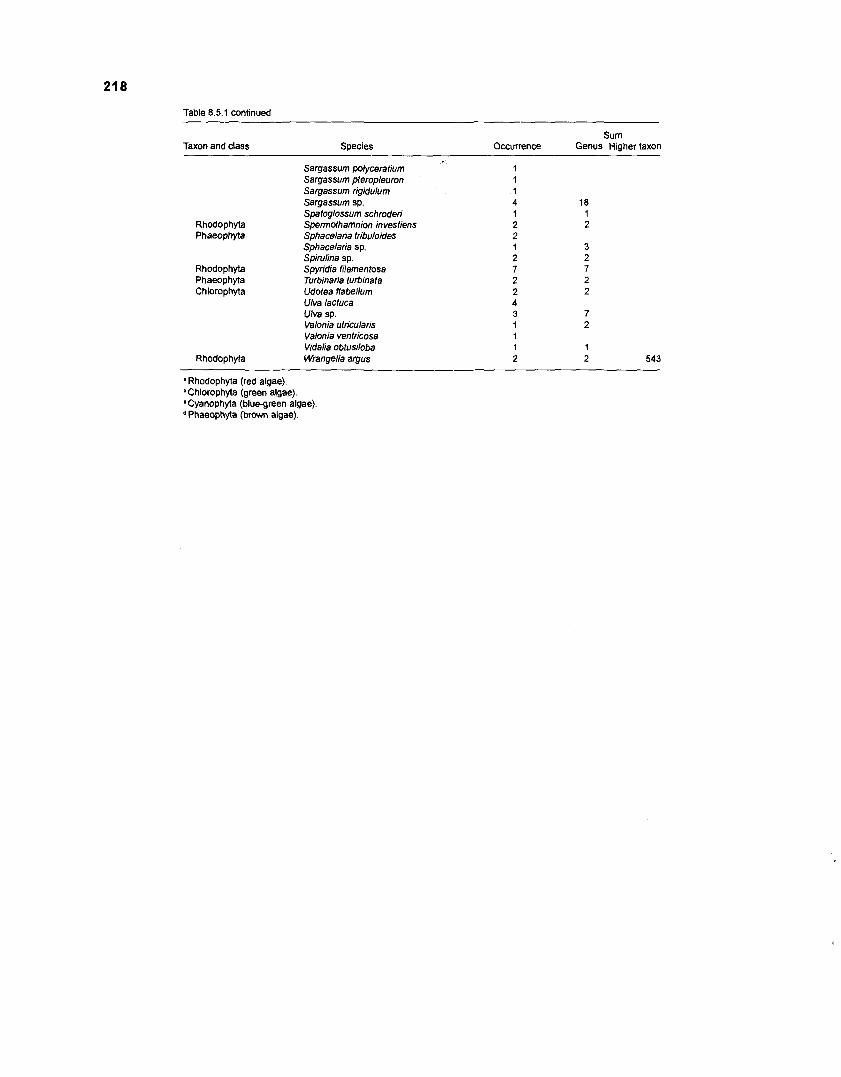
Table 8.5.1 continued
Taxon and class Species Sum
Occurrence Genus Higher taxon
Rhodophyta Phaeophyta
Rhodophyta Phaeophyta Chlorophyta
Sargassum polycerafium Sargassum pteropleuron Sargassum rigidulum Sargassum sp. Spatoglossum schroderi Spermothamnion investiens Sphacelaria tribuloides Sphacelaria sp. Spirulina sp. Spyridia filamentosa Turbinaria turbinata Udotea flabellum Ulva lactuca Ulva sp. Valonia utricularis Valonia ventricosa Vidalia obtusiloba
Rhodophyta Wrangelia argus
a Rhodophyta (red algae). Chlorophyta (green algae).
'Cyanophyta (blue-green algae) Phaeophyta (brown algae).
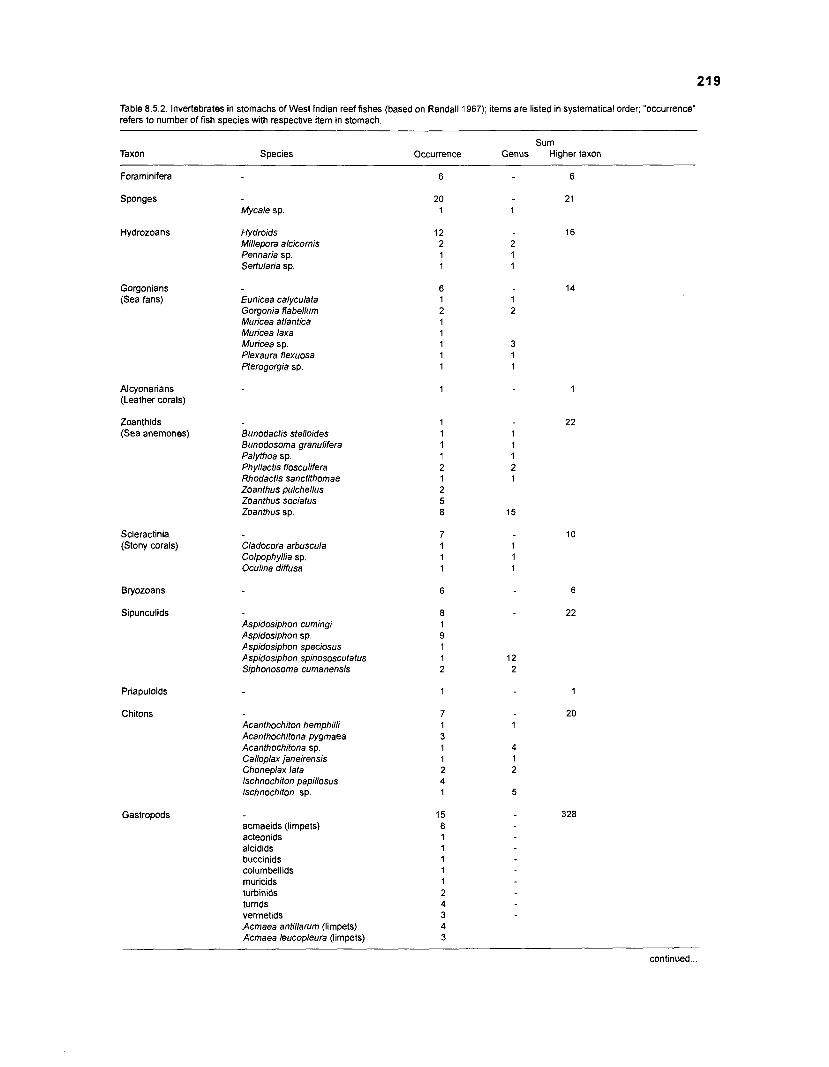
Table 8.5.2. Invertebrates in stomachs of West Indian reef fishes (based on Randall 1967); items are listed in systematical order; "occurrence" refers to number of fish species with respective item in stomach.
Taxon Species Sum
Occurrence Genus Higher taxon
Foraminifera
Sponges Mycale sp
Hydrozoans
Gorgonians (Sea fans)
Hydroids Millepora alcicornis Pennaria sp. Sertularia sp.
Eunicea calyculata Gorgonia flabellum Muricea atlantica Muricea laxa Muricea sp. Plexaura flexuosa Pferogorgia sp.
Alcyonarians (Leather corals)
Zoanthids (Sea anemones) Bunodactis stelloides
Bunodosoma granulifera Palythoa sp. Phyllactis flosculifera Rhodactis sanctithomae Zoanthus pulchellus Zoanthus sociatus Zoanthus sp.
Scleractinia (Stony corals) Cladocora arbuscula
Colpophyllia sp. Oculina diffusa
Bryozoans
Sipunculids Aspidosiphon cumingi Aspidosiphon sp. Aspidosiphon speciosus Aspidosiphon spinososcutatus Siphonosoma cumanensis
Priapuloids
Chitons Acanthochiton hemphilli Acanthochitona pygrnaea Acanthochitona sp. Calloplax janeirensis Choneplax lata lschnochiton papillosus lschnochiton sp.
Gastropods acmaeids (limpets) acteonids alcidids buccinids columbellids muricids turbinids turrids vermetids
.Acmaea antillarum (limpets) Acmaea leucopleura (limpets)
continued.
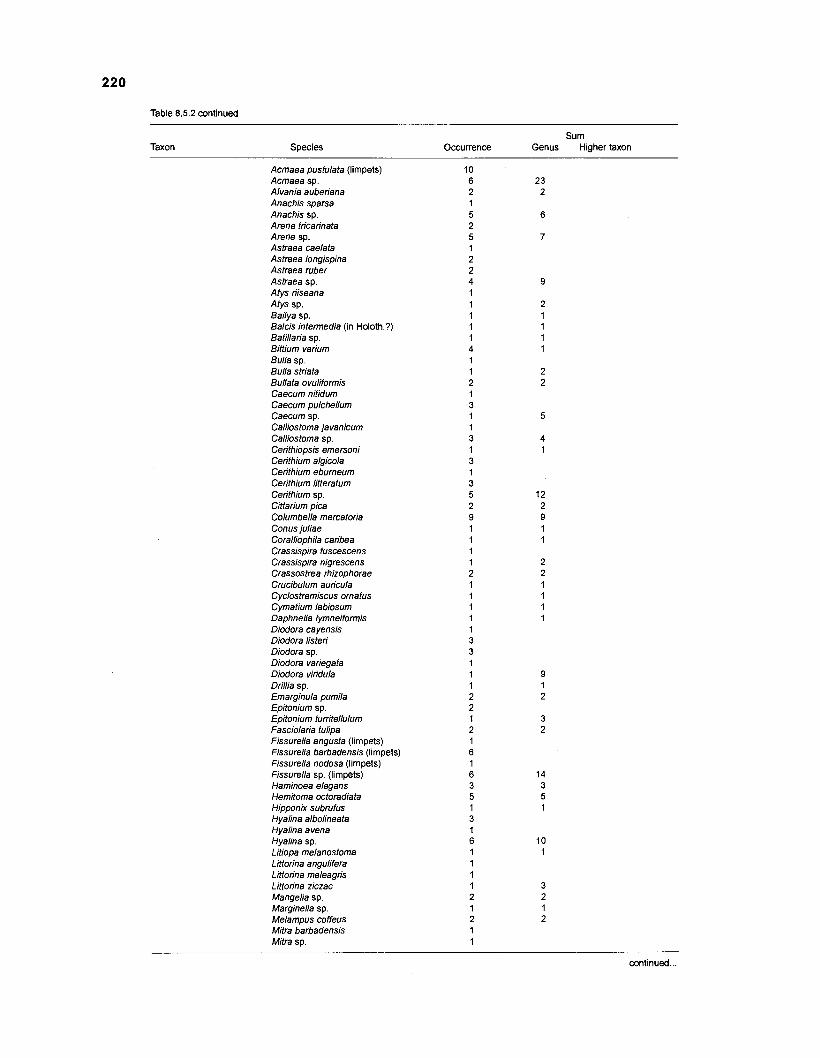
Table 8.5.2 continued
Taxon Species Sum
Occurrence Genus Higher taxon
Acmaea pustulata (limpets) Acmaea sp. Alvania auberiana Anachis sparsa Anachis sp. Arene tricarinata Arene sp. Astraea caelata Astraea longispina Astraea ~ b e r Astraea sp. Atys riiseana Atys sp. Bailya sp. Balcis intermedia (in Holoth.?) Batillaria sp. Bittiurn varium Bulla sp. Bulla striata Bullata ovuliformis Caecum nitidom Caecum pulchellum Caecum sp. Calliostoma javanicum Calliostoma sp. Cerithiopsis emersoni Cerithium algicola Cerithium eburneum Cerithium litteratom Cerithium sp. Cittarium pica Columbella mercatoria Conus juliae Coralliophila caribea Crassispira fuscescens Crassispira nigrescens Crassostrea rhizophorae Crucibulum auricula Cyclostremiscus ornatus Cymatium labiosum Daphnella lymneiformis Diodora cayensis Diodora listeri Diodora sp. Diodora variegata Diodora viridula Drillia sp. Emarginula pumila Epitonium sp. Epitonium tunitellulum Fasciolaria tulipa Fissurella angusta (limpets) Fissurella barbadensis (limpets) Fissurella nodosa (limpets) Fissurella sp. (limpets) Haminoea elegans Hemitoma octoradiata Hipponix subrufus Hyalina albolineata Hyalina avena Hyalina sp. Litiopa melanostoma Littorina angulifera Littorina meleagris Littorina ziczac Mangelia sp. Marginella sp. Melampus coffeus Mitra barbadensis Mitra sp.
continued ...
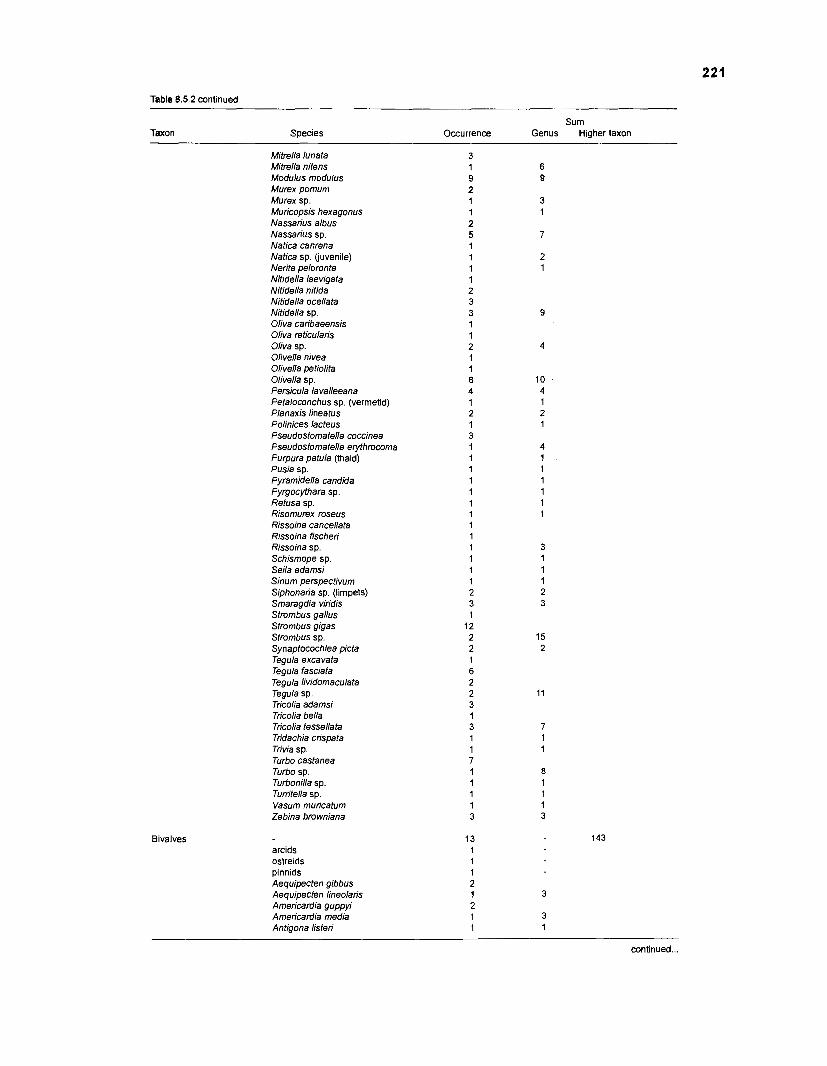
Table 8.5.2 continued
Species Sum
Occurrence Genus Hioher taxon
Bivalves
Mitrella lunata Mitrella nitens Modulus modulus Murex pomum Murex sp. Muricopsis hexagonus Nassarios albus Nassariirs sp. Natica canrena Natica sp. (juvenile) Nerita peloronta Nitidella laevigata Nitidella nitida Nitidella ocellata Nitidella sp. Oliva caribaeensis Oliva reticularis Oliva sp. Olivella nivea Olivella petiolita Olivella sp. Persicula lavalleeana Petaloconchus sp. (vermetid) Planaxis lineatus Polinices lacteus Pseudostomatella coccinea Pseudostomatella erythrocoma Purpura patula (thaid) Pusia sp. Pyramidella candida Pyrgocythara sp. Retusa sp. Risomurex roseus Rissoina cancellata Rissoina fischeri Rissoina sp. Schismope sp. Seila adamsi Sinum perspectivum Siphonaria sp. (limpets) Smaragdia viridis Strombus gallus Strombus gigas Strombus sp. Synaptocochlea picta Tegula excavata Tegula fasciata Tegula lividomaculata Tegula sp. Tricolia adamsi Tricolia bella Tricolia tessellata Tridachia crispata Trivia sp. Turbo castanea Turbo sp. Turbonilla sp. Turritella sp. Vasum muricatum Zebina browniana
arcids ostreids pinnids Aequipecten gibbus Aequipecten lineolaris Americardia guppyi Americardia media Antigona listeri
continued ...
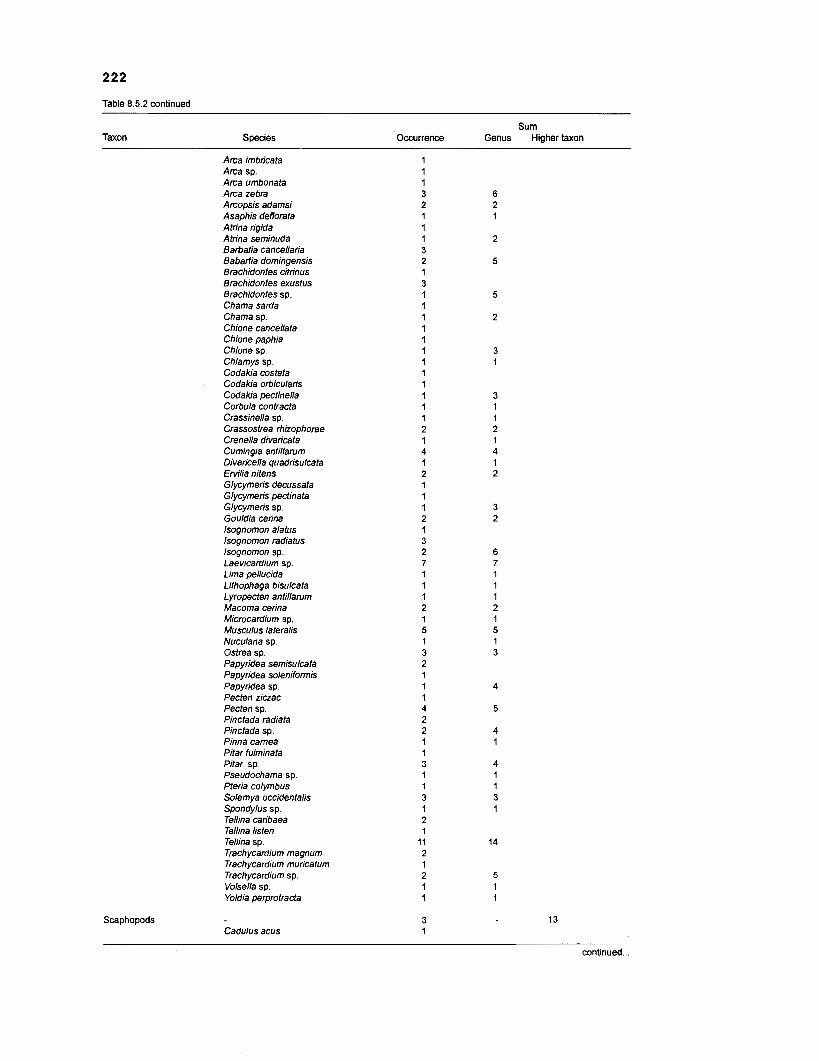
222
Table 8.5.2 continued
Sum Taxon Species Occurrence Genus Higher taxon
Arca imbricata Arca sp. Arca umbonata Arca zebra Arcopsis adamsi Asaphis deflorata Atrina rigida Atrina seminuda Barbatia cancellaria Babartia domingensis Brachidontes citrinus Brachidontes exustus Brachidontes sp. Chama sarda Chama sp. Chione cancellata Chione paphia Chione sp. Chlamys sp. Codakia costata Codakia orbicularis Codakia pectinella Corbula contracta Crassinella sp. Crassostrea rhizophorae Crenella divaricata Cumingia antillarum Divaricella quadrisulcata Ervilia nitens Glycymeris decussata Glycymeris pectinata Glycymeris sp. Gouldia cerina lsognomon alatus lsognomon radiatus Isognomon sp. Laevicardium sp. Lima pellucida Lithophaga bisulcata Lyropecten antillarum Macoma cerina Microcardium sp. Musculus lateralis Nuculana sp. Ostrea sp. Papyridea semisulcata Papyridea solenifomis Papyridea sp. Pecten ziczac Pecfen sp. Pinctada radiata Pinctada sp. Pinna camea Pitar fulminata Pitar sp. Pseudochama sp. Pteria colymbus Solemya occidentalis Spondylus sp. Tellina caribaea Tellina listeri Tellina sp. Trachycardium magnum Trachycardium muricatum Trachycardium sp. Volsella sp. Yoldia perprotracta
Scaphopods Cadulus acus
- continued ...
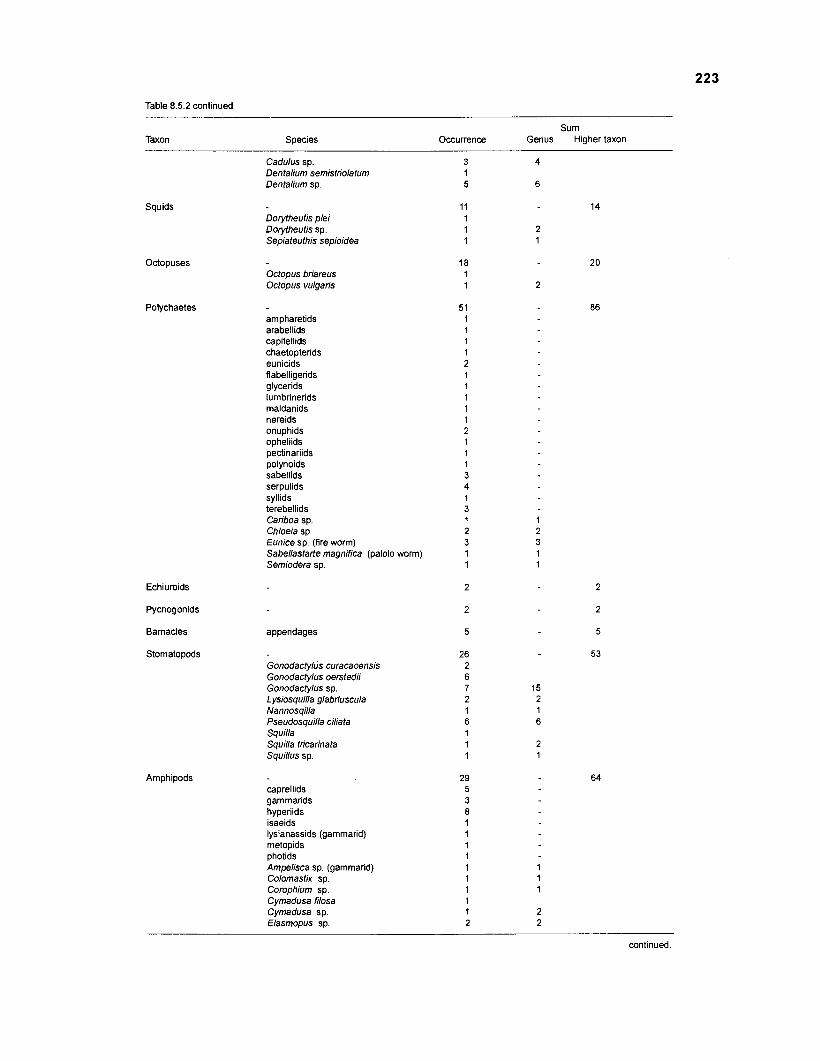
Table 8.5.2 continued
Sum Taxon Species Occurrence Genus Higher taxon
Squids
Octopuses
Cadulus sp. Dentalium semistriolatom Dentalium sp.
Dorytheutis plei Dorytheutis sp. Sepiateuthis sepioidea
Octopus briareus Octopus vulgaris
Polychaetes ampharetids arabellids capitellids chaetopterids eunicids flabelligerids glycerids lumbrinerids maldanids nereids onuphids opheliids pectinariids polynoids sabellids serpulids syllids terebellids Cariboa sp. Chloeia sp. Eunice sp. (fire worm) Sabellastarfe magnifica (palolo worm) Semiodera sp.
Echiuroids
Pycnogonids
Barnacles
Stomatopods
Amphipods
appendages
Gonodactylus curacaoensis Gonodactylus oerstedii Gonodactylus sp. Lysiosquilla glabriuscula Nannosqilla Pseudosquilla ciliata Squilla Squilla tricarinata Squillus sp.
caprellids gammarids hyperiids isaeids lysianassids (gammarid) metopids photids Ampelisca sp. (gammarid) Colomastix sp. Corophium sp. Cymadusa filosa Cymadusa sp. Elasmopus sp.
continued.
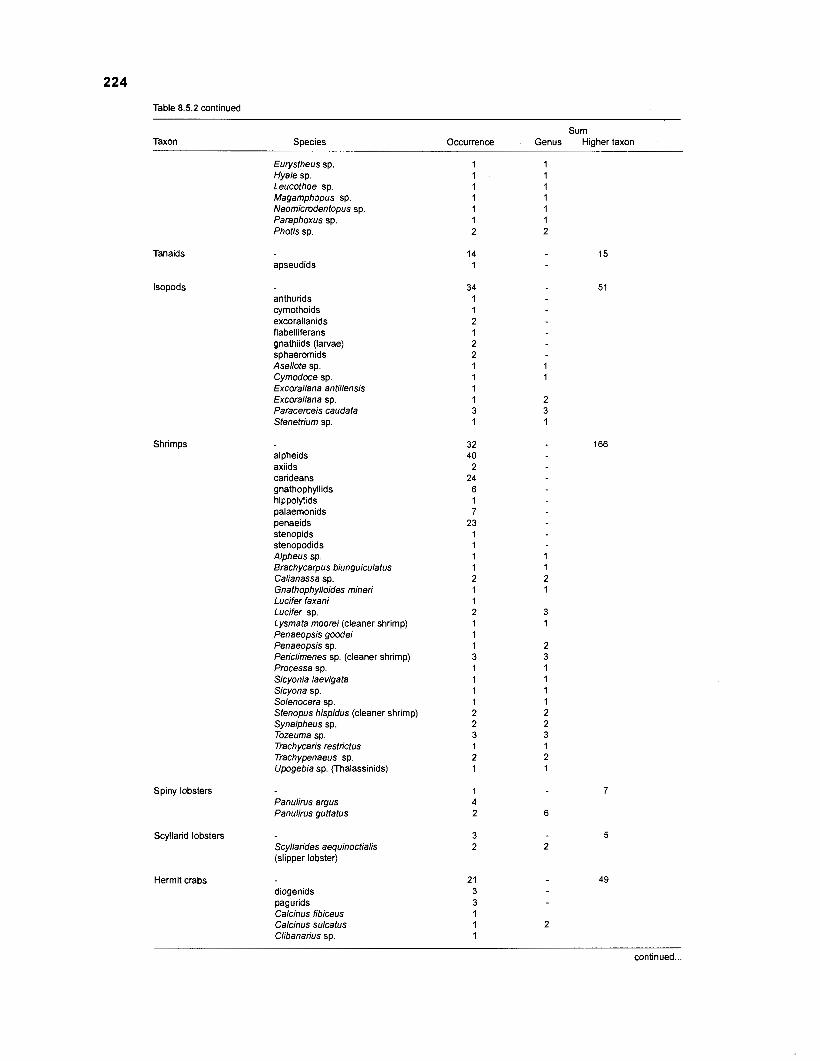
Table 8.5.2 continued
Sum Taxon Soecies Occurrence Genus Hiaher taxon
Tanaids
lsopods
Shrimps
Eurystheus sp. Hyale sp. Leucothoe sp. Magamphapus sp. Neomicrodentopus sp Paraphoxus sp. Photis sp.
apseudids
anthurids cymothoids excorallanids flabelliferans gnathiids (larvae) sphaeromids Asellote sp. Cymodoce sp. Excorallana antillensis Excorallana sp. Paracerceis caudata Stenetrium sp.
alpheids axiids carideans gnathophyllids hippolytids palaemonids penaeids stenopids stenopodids Alpheus sp. Brachycarpus biunguiculatus Calianassa sp. Gnathophylloides miner; Lucifer faxani Lucifer sp. Lysmata moorei (cleaner shrimp) Penaeopsis goodei Penaeopsis sp. Periclimenes sp. (cleaner shrimp) Processa sp. Sicyonia laevigata Sicyona sp. Solenocera sp. Stenopus hispidus (cleaner shrimp) Synalpheus sp. Tozeuma sp. Trachycaris restrictus Trachypenaeus sp. Upogebia sp. (Thalassinids)
Spiny lobsters Panulirus argus Panulirus guttatus
Scyllarid lobsters Scyllarides aequinoctialis (slipper lobster)
Hermit crabs diogenids pagurids Calcinus fibiceus Calcinus sulcatus Clibanarius sp.
continued ...
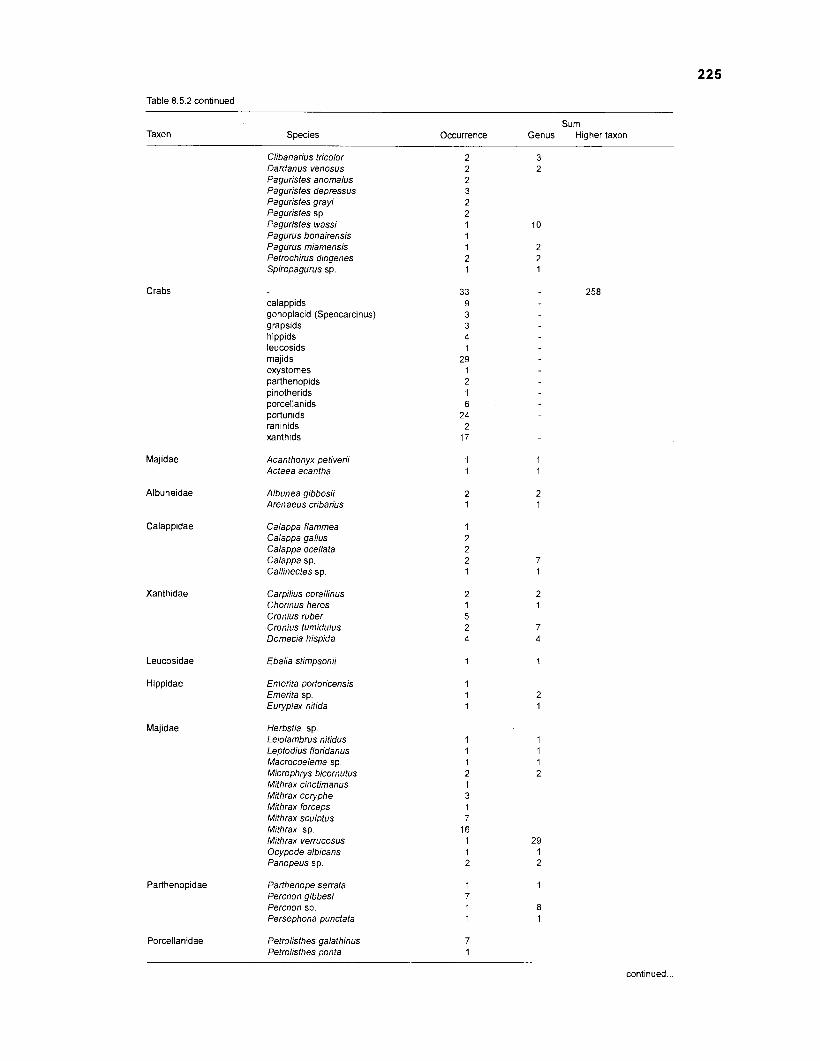
Table 8.5.2 continued
Sum Occurrence Genus Higher taxon Taxon Species
Clibanarius tricolor Dardanus venosus Paguristes anomalus Paguristes depressus Paguristes grayi Paguristes sp. Paguristes wassi Pagurus bonairensis Pagurus miamensis Petrochirus diogenes Spiropagurus sp.
Crabs calappids gonoplacid (Speocarcinus) grapsids hippids leucosids majids oxystomes parthenopids pinotherids porcellanids portunids ranmids xanthids
Majidae
Albuneidae
Calappidae
Acanthonyx petiverii Actaea acantha
Albunea gibbesii Arenaeus cribarius
Calappa flammea Calappa gallus Calappa ocellata Calappa sp. Callinectes sp.
Xanthidae Carpilius corallinus Chorinus heros Cronius ruber Cronius tumidulus Domecia hispida
Leucosidae
Hippidae
Ebalia stimpsonii
Emerita portoricensis Emerita sp. Euryplax nitida
Majidae Herbstia sp. Leiolambrus nitidus Leptodius floridanus Macrocoelema sp. Microphrys bicornutus Mithrax cinctimanus Mithrax coryphe Mithrax forceps Mithrax sculptus Mithrax sp. Mithrax verrucosus Ocypode albicans Panopeussp
Parthenopidae Parthenope serrata Percnon gibbesi Percnon sp. Persephona punctata
Porcellanidae Petrolisthes galathinus Petrolisthes ponta
continued ...
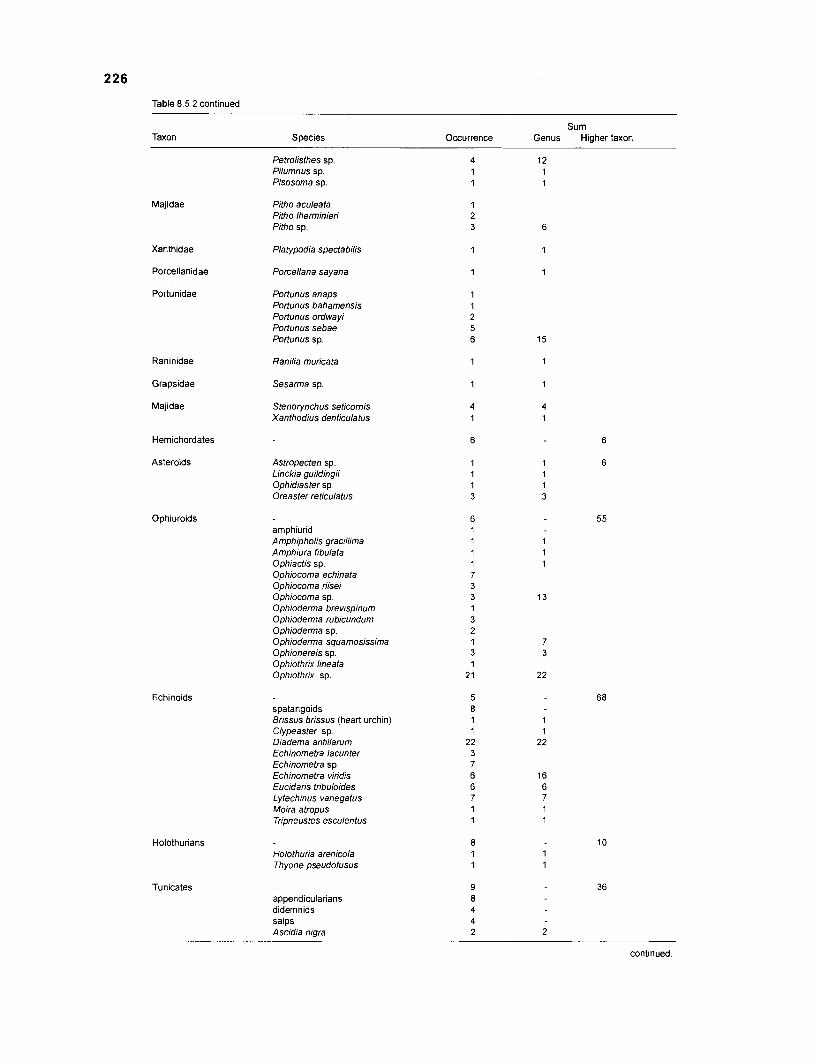
Table 8.5.2 continued
Taxon Species Sum
Occurrence Genus Higher taxon
Majidae
Xanthidae
Porcellanidae
Portunidae
Raninidae
Grapsidae
Majidae
Hemichordates
Asteroids
Petrolisthes sp. Pilurnnus sp. Pisosoma sp.
Pitho aculeata Pitho lherminieri Pitho sp.
Platypodia spectabilis
Porcellana sayana
Portunus anaps Portunus baharnensis Portunus ordwayi Portunus sebae Portunus sp.
Ranilia muricata
Sesarma sp
Stenofynchus seticornis Xanthodius denticulatus
Astropecten sp. Linckia guildingii Ophidiaster sp. Oreaster reticulatus
Ophiuroids amphiurid Amphipholis gracillima Amphiura fibulata Ophiactis sp. Ophiocoma echinata Ophiocoma riisei Ophiocoma sp. Ophioderma brevispinurn Ophioderma rubicundurn Ophioderma sp. Ophioderma squamosissima Ophionereis sp. Ophiothrix lineata Ophiothrix sp.
Echinoids spatangoids Brissus brissus (heart urchin) Clypeaster sp. Diadema antillarum Echinometra lacunter Echinometra sp. Echinornetra viridis Eucidaris tribuloides Lytechinus variegatus Moira atropus Tripneustes esculentus
Holothurians Holothuria arenicola Thyone pseudofusus
Tunicates appendicularians didemnids salps Ascidia nigra
continued ...
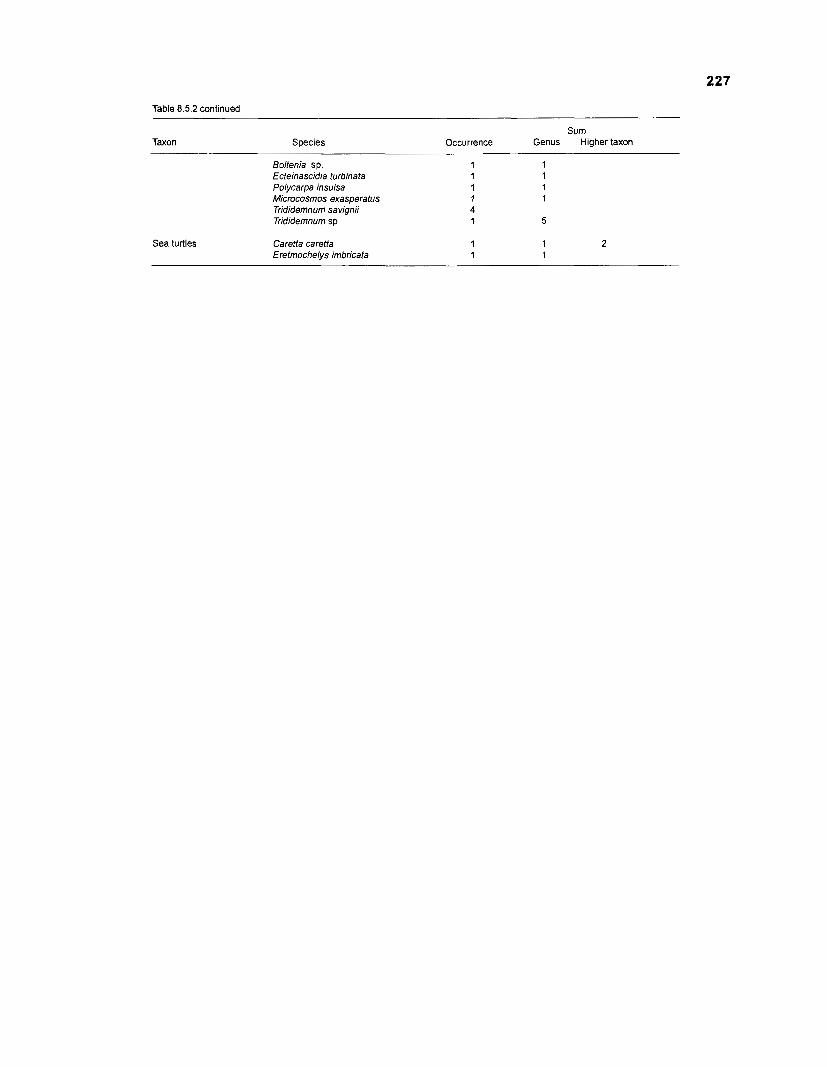
Table 8.5.2 continued
Taxon Species Sum
Occurrence Genus Higher taxon
Sea turtles
Boltenia sp. Ecteinascidia turbinata Polycarpa insulsa Microcosmos exasperatus Trididemnum savignii Trididemnum sp.
Caretta caretta Eretmochelys imbricata
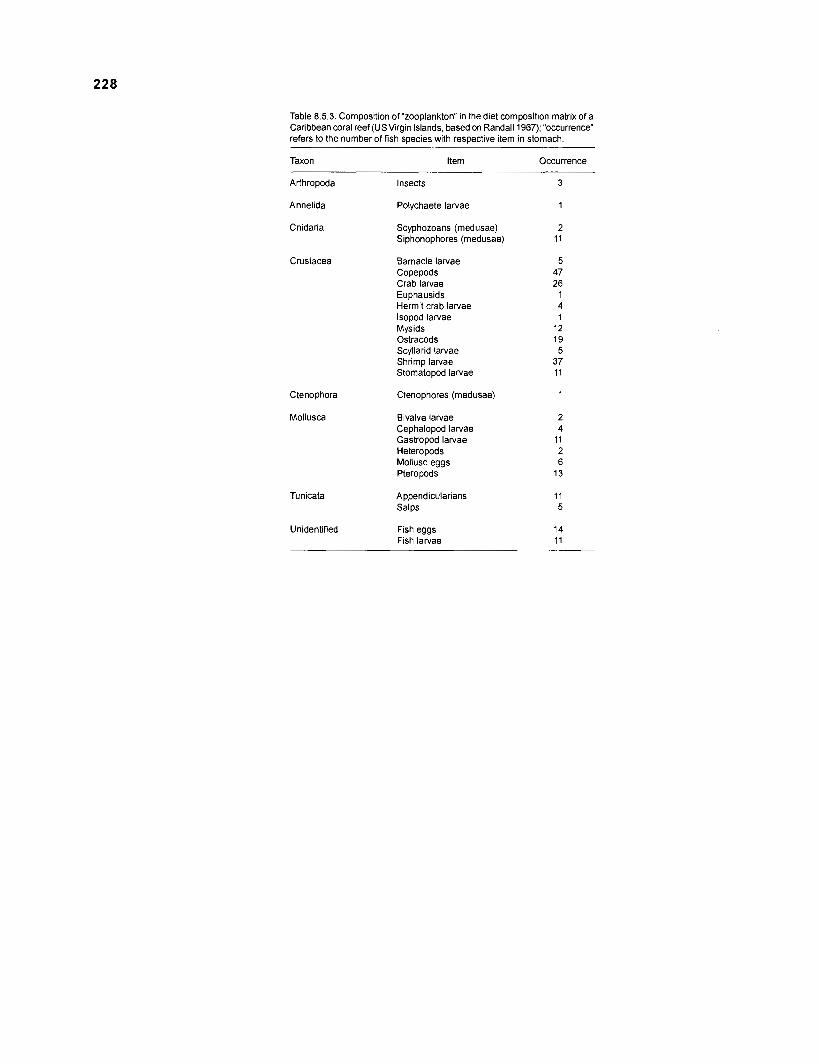
Table 8.5.3. Composition of "zooplankton" in the diet composition matrix of a Caribbean coral reef (US Virgin Islands, based on Randall 1967); "occurrence" refers to the number of fish species with respective item in stomach.
Taxon Item
Arthropoda Insects
Annelida Polychaete larvae
Cnidaria Scyphozoans (medusae) Siphonophores (medusae)
Crustacea Barnacle larvae Copepods Crab larvae Euphausids Hermit crab larvae lsopod larvae Mysids Ostracods Scyllarid larvae Shrimp larvae Stomatopod larvae
Ctenophora
Mollusca
Tunicata
Ctenophores (medusae)
Bivalve larvae Cephalopod larvae Gastropod larvae Heteropods Mollusc eggs Pteropods
Appendicularians Salps
Unidentified Fish eggs Fish larvae
Occurrence
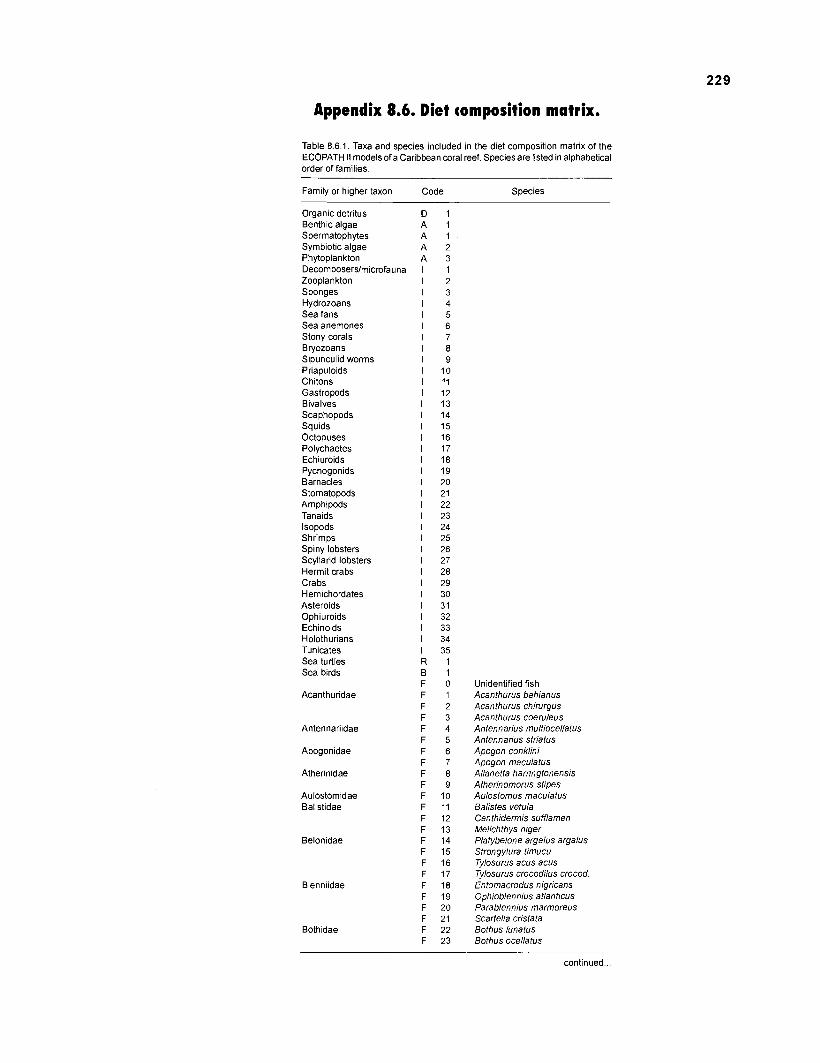
Appendix 8.6. Diet composition matrix.
Table 8.6.1. Taxa and species included in the diet composition matrix of the ECOPATH II models of a Caribbean coral reef. Species are listed in alphabetical order of families.
Family or higher taxon Code Species
Organic detritus Benthic algae Spermatophytes Symbiotic algae Phytoplankton Decomposerslmicrofauna Zooplankton Sponges Hydrozoans Sea fans Sea anemones Stony corals Bryozoans Sipunculid worms Priapulolds Chitons Gastropods Bivalves Scaphopods Squids Octopuses Polychaetes Echiuroids Pycnogonids Barnacles Stomatopods Amphipods Tanaids lsopods Shrimps Spiny lobsters Scyllarid lobsters Hermit crabs Crabs Hemichordates Asteroids Ophiuroids Echinoids Holothurians Tunicates Sea turtles Sea birds
Acanthuridae
Antennarildae
Apogonidae
Atherinidae
Aulostomidae Balistidae
Belonidae
Blenniidae
Bothidae
Unidentified fish Acanthurus bahianus Acanthurus chirurgus Acanthurus coeruleus Antennarius multiocellatus Antennarius striatus Apogon conklini Apogon maculatus Allanetta harringtonensis Atherinomorus stipes Aulostomus maculatus Balistes vetula Canthidermis sufflamen Melichthys niger Platybelone argalus argalus Strongylura timucu Tylosurus acus acus Tylosurus crocodilus crocod. Entomacrodus nigricans Ophioblennius atlant~cus Parablennius marmoreus Scarfella cristata Bothus lunatus Bothus ocellatus
continued ...
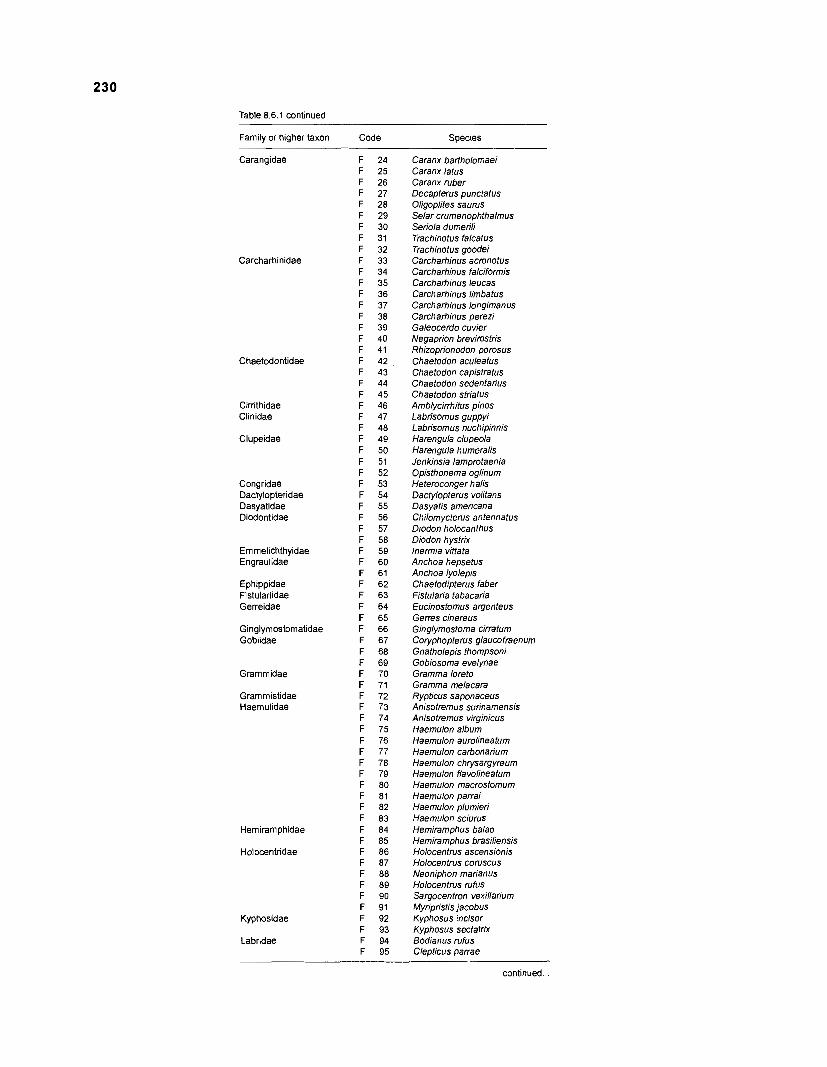
Table 8.6.1 continued
Family or higher taxon Code Species
Carangidae
Carcharhinidae
Chaetodontidae
Cirrithidae Clinidae
Clupeidae
Congridae Dactylopteridae Dasyatidae Diodontidae
Emrnelichthyidae Engraulidae
Ephippidae Fistulariidae Gerreidae
Ginglymostomatidae Gobiidae
Grammidae
Grammistidae Haemulidae
Hemiramphidae
Holocentridae
Kyphosidae
Labridae
Caranx bartholomaei Caranx latus Caranx ruber Decapterus punctatus Oligoplites saurus Selar crumenophthalmus Seriola dumerili Trachinotus falcatus Trachinotus goodei Carcharhinus acronotus Carcharhinus falciformis Carcharhinus leucas Carcharhinus limbatus Carcharhinus longimanus Carcharhinus perezi Galeocerdo cuvier Negaprion brevirostris Rhhoprionodon porosus Chaetodon aculeatus Chaetodon capistratus Chaetodon sedentarius Chaetodon striatus Amblycirrhitus pinos Labrisomus guppyi Labrisomus nuchipinnb Harengula clupeola Harengula humeralis Jenkinsia lamprotaenia Opisthonema oglinum Heteroconger halis Dactylopterus volitans Dasyatis americana Chilomycterus antennatus Diodon hobcanthus Diodon hystrix lnerm~a vittata Anchoa hepsetus Anchoa lyolepis Chaetodipterus faber Fistularia tabacaria Eucinostomus argenteus Genes cinereus Ginglymostoma cirratum Coryphopterus glaucofraenum Gnatholepis thompsoni Gobiosoma evelynae Gramma loreto Gramma melacara Rypticus saponaceus Anisotremus surinamensis Anisotremus virginicus Haemulon album Haemulon aurolineatum Haemulon carbonarium Haemulon chrysargyreum Haemulon flavolineatum Haemulon macrostomum Haemulon parrai Haemulon plumieri Haemulon sciurus Hemiramphus balao Hemiramphus brasiliensis Holocentrus ascensionis Holocentrus coruscus Neoniphon marianus Holocentrus rufus Sargocentron vexillarium Myripristis jacobus Kyphosus incisor Kyphosus sectatrix Bodianus rufus Clepticus parrae
continued ...
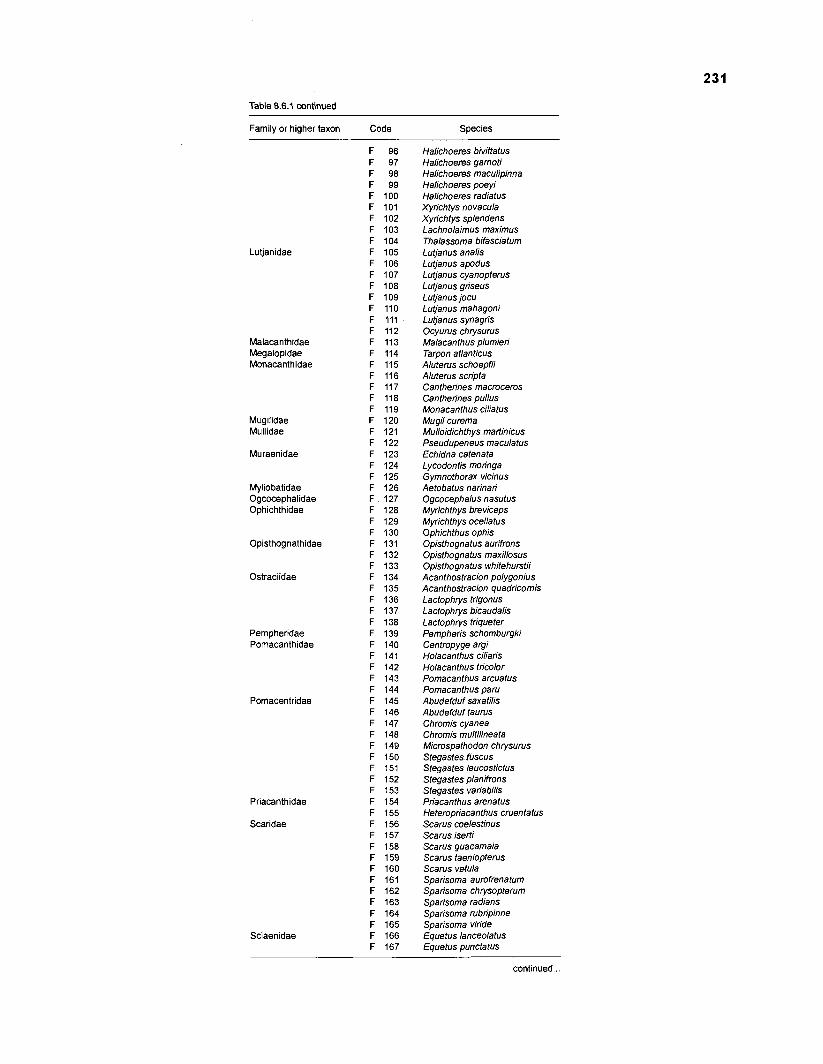
Table 8.6.1 continued
Family or higher taxon Code Species
Lutjanidae
Malacanthidae Megalopidae Monacanthidae
Mugilidae Mullidae
Muraenidae
Myliobatidae Ogcocephalidae Ophichthidae
Opisthognathidae
Ostraciidae
Pempheridae Pomacanthidae
Pomacentridae
Priacanthidae
Scaridae
Sciaenidae
Halichoeres bivittatus Halichoeres garnoti Halichoeres maculipinna Halichoeres poeyi Halichoeres radiatus Xyrichtys novacula Xyrichtys splendens Lachnolaimus maximus Thalassoma bifasciatum Lutjanus analis Lutjanus apodus Lutjanus cyanopterus Lutjanus griseus Lutjanus jocu Lutjanus mahagoni Lutjanus synagris Ocyurus chrysurus Malacanthus plumieri Tarpon atlanticus Aluterus schoepfii Aluterus scripta Cantherines macroceros Cantherines pullus Monacanthus ciliatus Mugil curema Mulloidichthys marfinicus Pseudupeneus maculatus Echidna catenata Lycodontis moringa Gymnothorax vicinus Aetobatus narinari Ogcocephalus nasutus Myrichthys breviceps Myrichthys ocellatus Ophichthus ophis Opisthognatus aurifrons Opisthognatus maxillosus Opisthognatus whitehurstii Acanthostracion polygonius Acanthostracion quadricornis Lactophrys trigonus Lactophiys bicaudalis Lactophiys triqueter Pempheris schomburgki Centropyge argi Holacanthus ciliaris Holacanthus tricolor Pomacanthus arcuatus Pomacanthus paru Abudefduf saxatilis Abudefduf taurus Chromis cyanea Chromis multilineata Microspathodon chrysurus Stegastes fuscus Stegastes leucostictus Stegastes planifrons Stegastes variabilis Priacanthus arenatus Heteropriacanthus cruentatus Scarus coelestinus Scarus isedi Scarus guacamaia Scarus taeniopterus Scarus vetola Sparisoma aurofrenatum Sparisoma chrysopterum Sparisoma radians Sparisoma ~br ip inne Sparisoma viride Equetus lanceolatus Equetus punctatus
continued ...
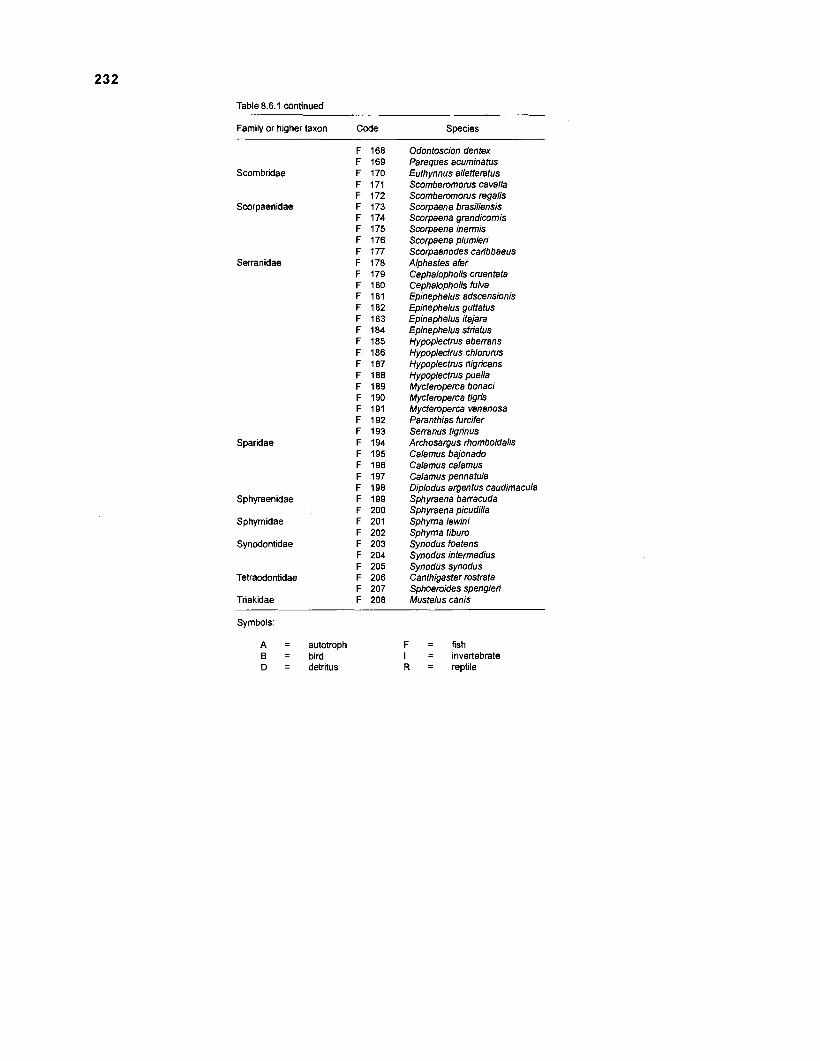
Table 8.6.1 continued
Family or higher taxon Code Species
Scombridae
Scorpaenidae
Serranidae
Sparidae
Sphyraenidae
Sphyrnidae
Synodontidae
Tetraodontidae
Triakidae
Odontoscion dentex Pareques acuminatus Euthynnus allefferatus Scomberomotus cavalla Scomberomorus regalis Scorpaena brasiliensis Scorpaena grandicornis Scorpaena inermis Scorpaena plumieri Scorpaenodes caribbaeus Alphestes afer Cephalopholis cruentata Cephalopholis fulva Epinephelus adscensionis Epinephelus guttatus Epinephelus itajara Epinephelus stfiatus Hypoplectrus aberrans Hypoplectrus chloturus Hypoplectrus nigricans Hypoplecttus puella Mycteroperca bonaci Mycteroperca tigris Mycteroperca venenosa Paranthias furcifer Serranus tigrinus Archosargus rhomboidalis Calamus bajonado Calamus calamus Calamus pennatula Diplodus argentus caudimacula Sphyraena barracuda Sphyraena picudilla Sphyma lewini Sphyrna tiburo Synodus foetens Synodus intermedius Synodus synodus Canthigaster rostrata Sphoeroides spengleri Mustelus canis
Symbols:
A = autotroph F = fish B = bird I = invertebrate D = detritus R = reptile
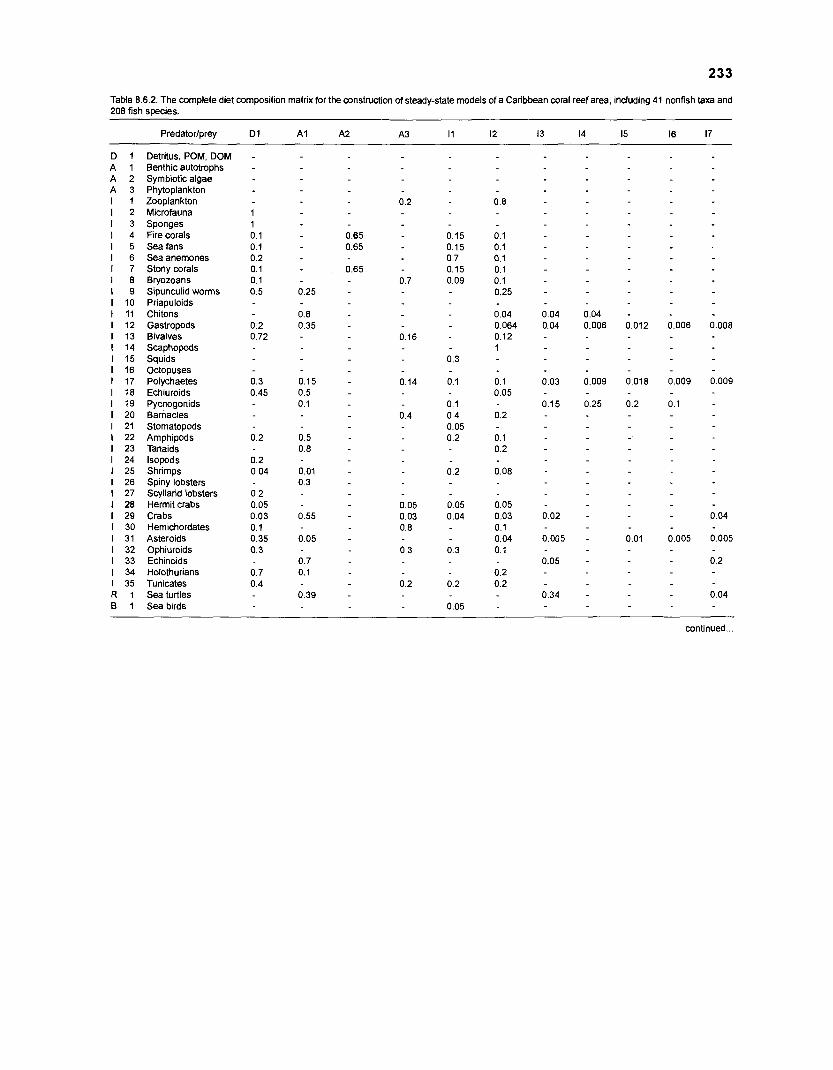
Table 8.6.2. The complete diet composition matrix for the construction of steady-state models of a Caribbean coral reef area, including 41 nonfish taxa and 208 fish species.
Detritus, POM. DOM Benthic autotrophs Symbiotic algae Phytoplankton Zooplankton Microfauna Sponges Fire corals Sea fans Sea anemones Stony corals Bryozoans Sipunculid worms Priapuloids Chitons Gastropods Bivalves Scaphopods Squids Octopuses Polychaetes Echiuroids Pycnogonids Barnacles Stomatopods Amphipods Tanaids lsopods Shrimps Spiny lobsters Scyllarid lobsters Hermit crabs Crabs Hemichordates Asteroids Ophiuroids Echinoids Holothurians Tunicates Sea turtles Sea birds
continued ...
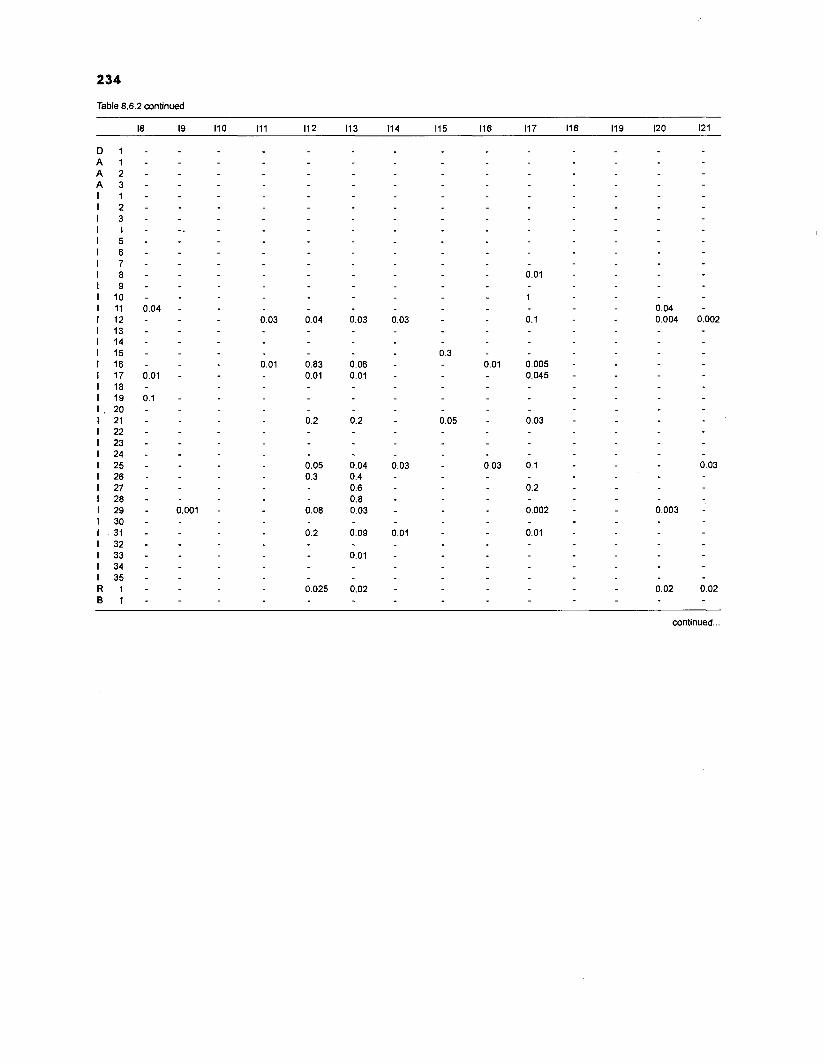
Table 8.6.2 continued
continued ...
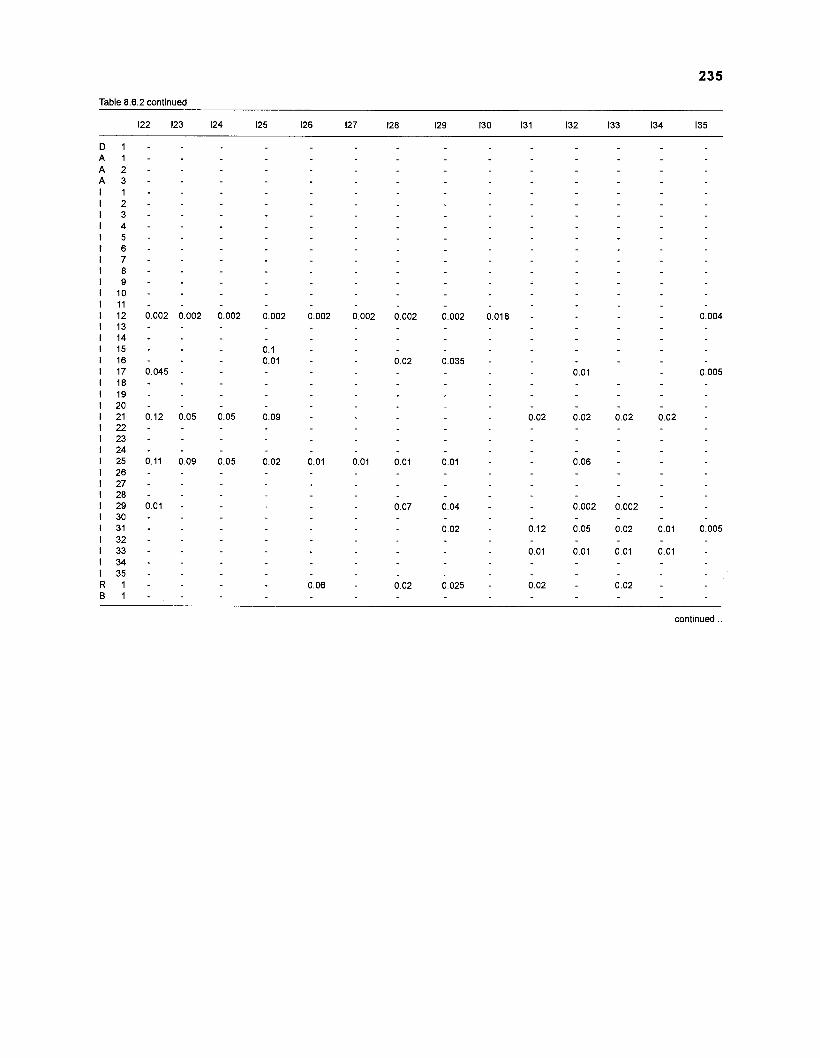
235
Table 8.6.2 continued
continued ...
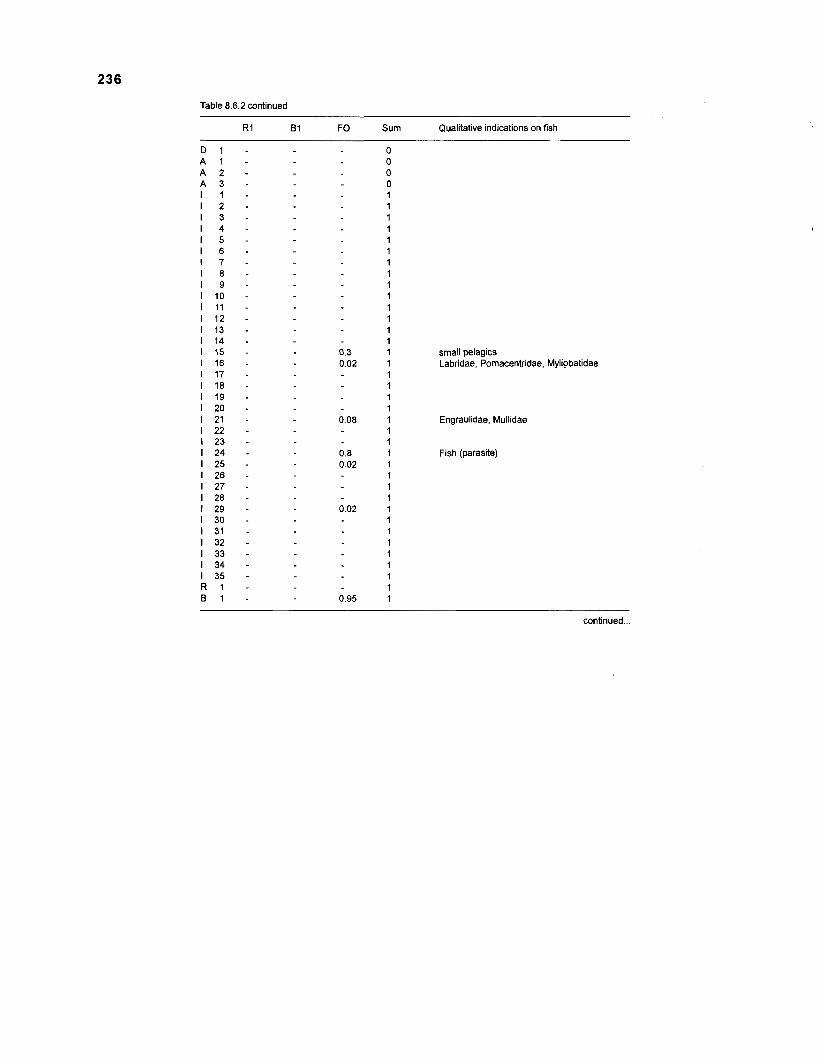
Table 8.6.2 continued
R1 B1 FO Sum Qualitative indications on fish
small pelagics Labridae, Pornacentridae, Mylipbatidae
Engraulidae, Mullidae
Fish (parasite)
continued ...
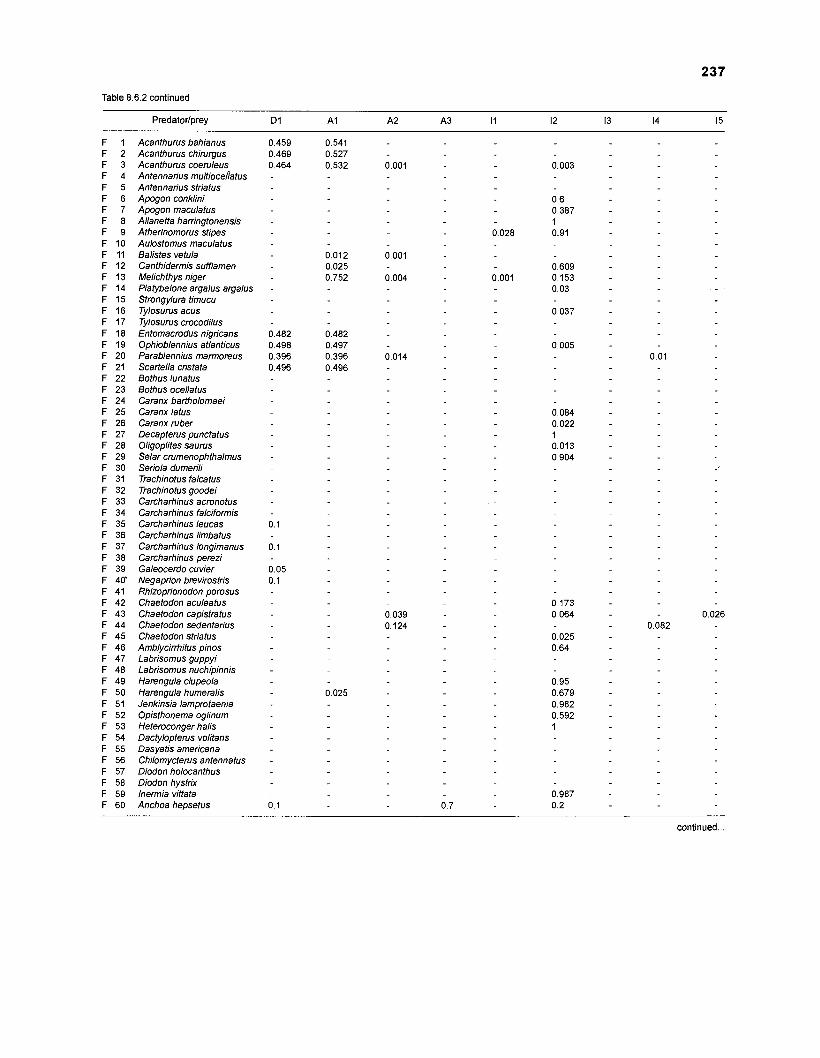
237
Table 8.6.2 continued
Predatorlprey D l A1 A2 A3 I I 12 13 14 15
Acanthurus bahianus Acanthurus chirurgus Acanthurus coeruleus Antennarius multioceliatus Antennarius striatus Apogon conklini Apogon maculatus Allanetta haringtonensis Atherinomorus stipes Aulostomus maculatus Balistes vetula Canthidermis suflamen Melichthys niger Platybelone argalus argalus Strongylura timucu Tylosurus acus Tylosurus crocodilus Entomacrodus nigricans Ophioblennius atlanticus Parablennius marmoreus Scarfella cristata Bothus lunatus Bothus ocellatus Caranx barfholomaei Caranx latus Caranx ruber Decapterus punctatus Oligoplites saurus Selar crumenophthalmus Seriola dumerili Trachinotus falcatus Trachinotus goodei Carcharhinus acronotus Carcharhinus falciformis Carcharhinus leucas Carcharhinus limbatus Carcharhinus longimanus Carcharhinus perezi Galeocerdo cuvier Negaprion brevirostris Rhizoprionodon porosus Chaetodon aculeatus Chaetodon capistratus Chaetodon sedentarius Chaetodon striatus Amblycirrhitus pinos Labrisomus guppyi Labrisomus nuchipinnis Harengula clupeola Harengula humeralis Jenkinsia lamprotaenia Opisthonema oglinum Heteroconger halis Dactylopterus volitans Dasyatis americana Chilomycterus antennatus Diodon holocanthus Diodon hystrix lnermia vittata Anchoa hepsetus
continued ...
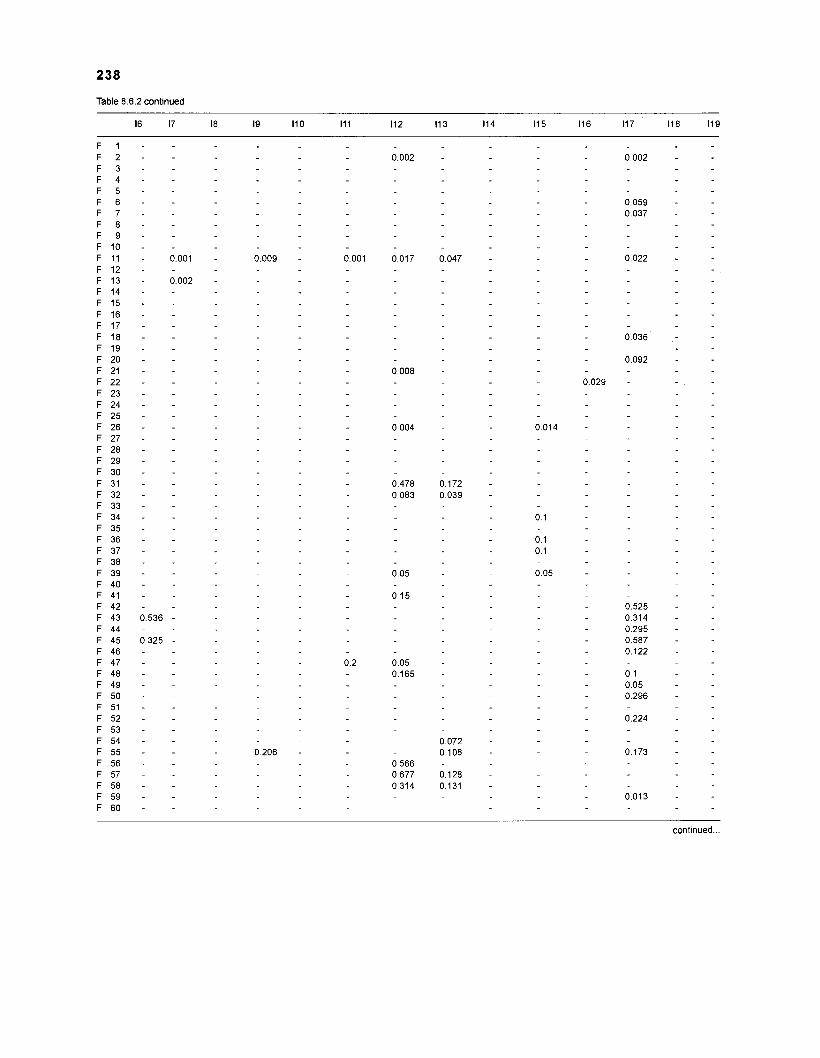
Table 8.6.2 continued
continued ...
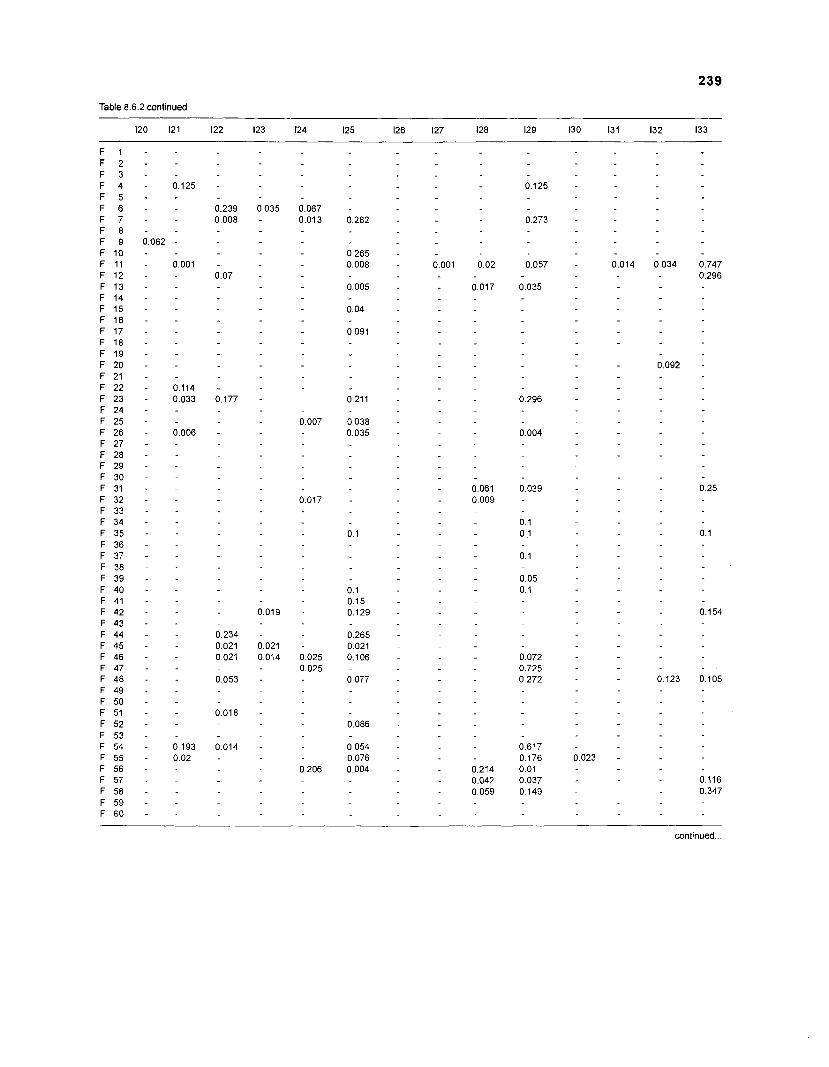
239
Table 8.6.2 continued
continued
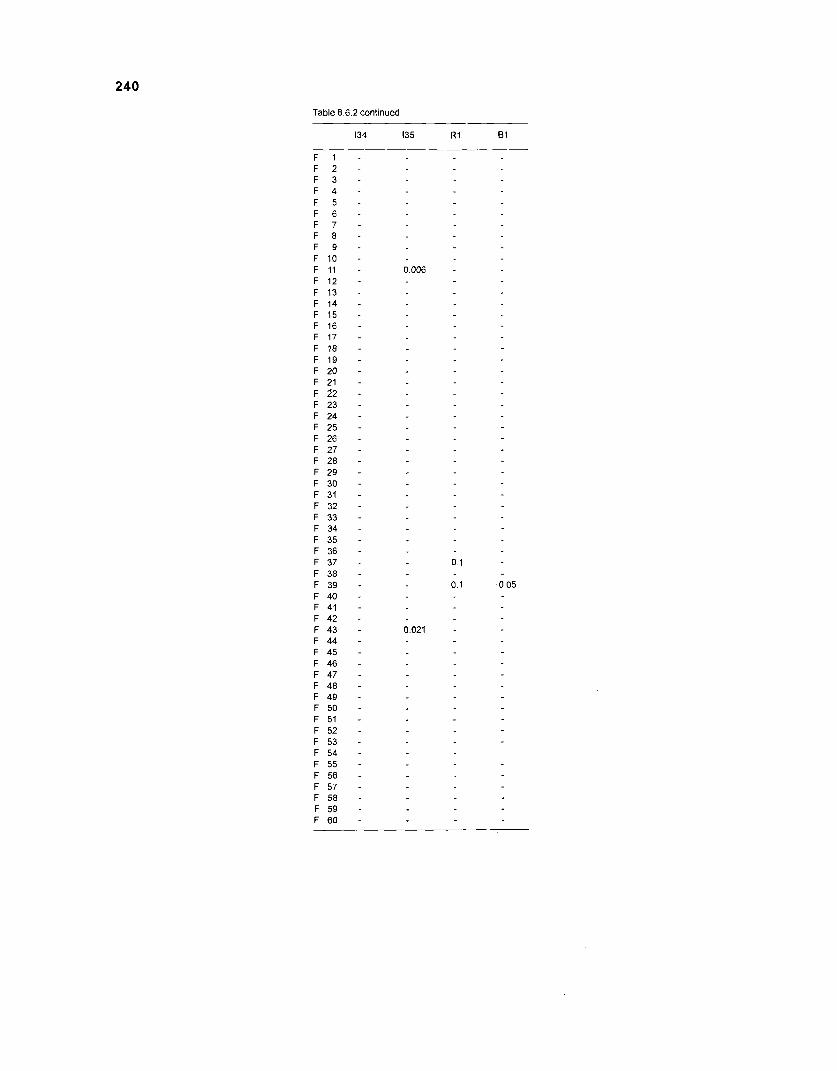
Table 8.6.2 continued
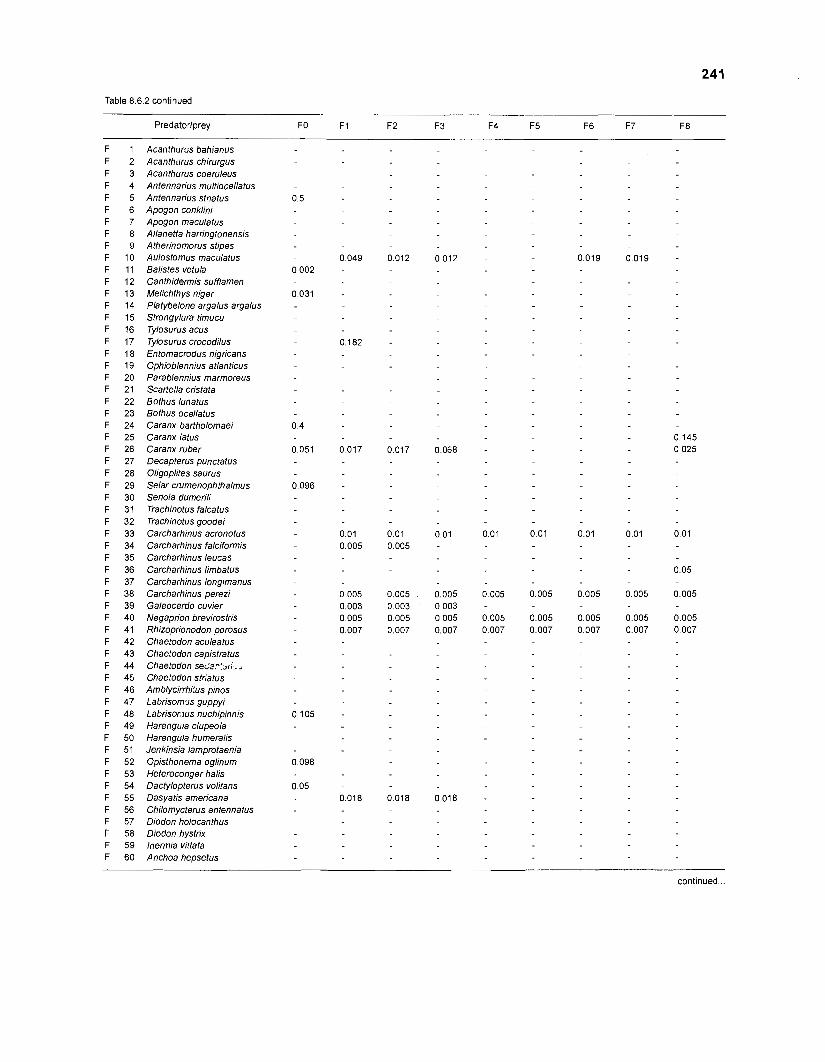
241
Table 8.6.2 continued
Predatorlprey
Acanthurus bahianus Acanthurus chirurgus Acanthurus coeruleus Antennarius multiocellatus Antennarius striatus Apogon conklini Apogon maculatus Allanetta harringtonensis Atherinomorus stipes Aulostomus maculatus Balistes vetula Canthidermis sufflamen Melichthys niger Platybelone argalus argalus Strongylura timucu Tylosurus acus Tylosurus crocodilus Entomacrodus nigricans Ophioblennius atlanticus Parablennius marmoreus Scartella cristata Bothus lunatus Bothus ocellatus Caranx bartholomaei Caranx latus Caranx ruber Decapterus punctatus Oligoplites saurus Selar crumenophthalmus Seriola dumerili Trachinotus falcatus Trachinotus goodei Carcharhinus acronotus Carcharhinus falciformis Carcharhinus leucas Carcharhinus limbatus Carcharhinus longimanus Carcharhinus perezi Galeocerdo cuvier Negaprion brevirostris Rhizoprionodon porosus Chaetodon aculeatus Chaetodon capistratus Chaetodon s e i : . - f ~ ~ ~ - , Chaetodon striatus Amb1ycirrhi:us pinos Labrisomx guppy; Labrisor, ius nuchipinnis Harenguia clupeola Harengula humeralis Jenkinsia lamprotaenia Opisthonema oglinum Heteroconger halis Dactylopterus volitans Dasyatis americana Chilomycterus antennatus Diodon holocanthus Diodon hystrix lnermia vittata Anchoa hepsetus
continued ...
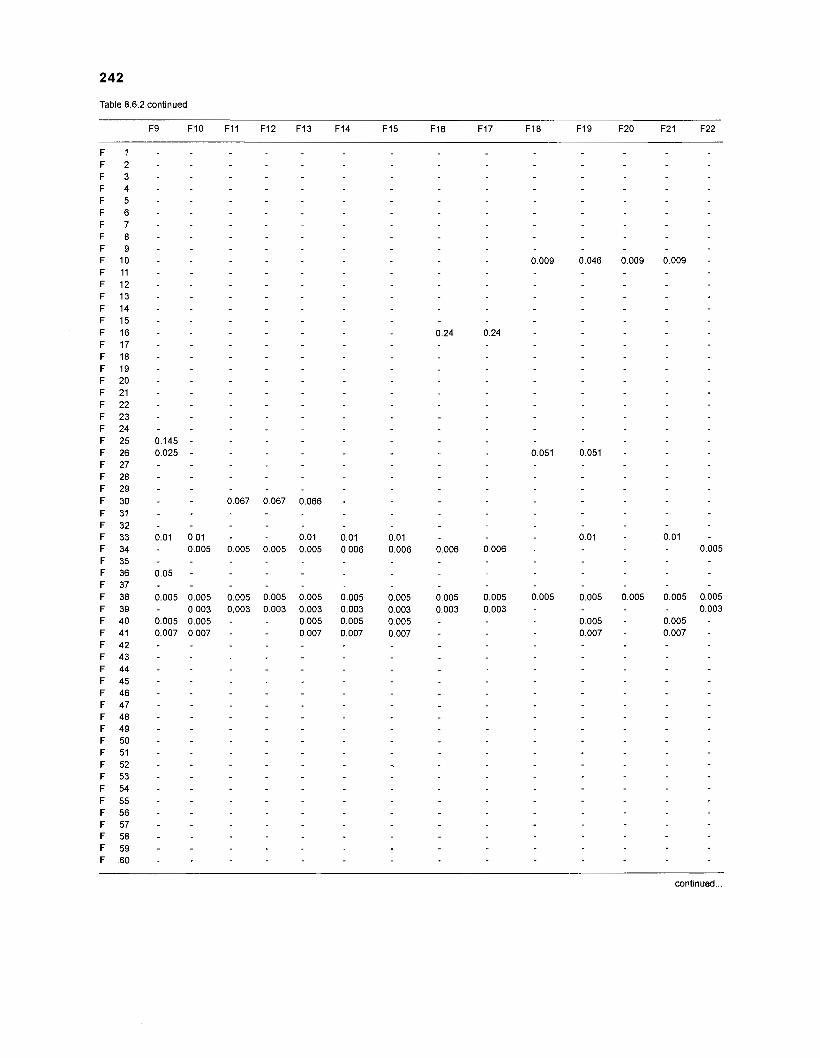
Table 8.6.2 continued
F 1 - F 2 - F 3 - F 4 - F 5 - F 6 - F 7 - F 8 - F 9 - F 10 - 0.009 0.046 0.009 0.009 - F 11 - F 12 - F 13 - F 14 - F 15 - F 16 - 0.24 0.24 F 17 - F 18 - F 19 - F 20 - F 21 - F 22 - F 23 - F 24 - F 25 0.145 - F 26 0.025 - 0.051 0.051 - F 27 - F 28 - F 29 - F 30 - 0.067 0.067 0.066 - F 31 - F 32 - F 33 0.01 0.01 - 0.01 0.01 0.01 0.01 - 0.01 - F 34 - 0.005 0.005 0.005 0.005 0.006 0.006 0.006 0.006 - 0.005 F 35 - F 36 0.05 - F 37 - F 38 0.005 0.005 0.005 0.005 0.005 0.005 0.005 0.005 0.005 0.005 0.005 0.005 0.005 0.005 F 39 - 0.003 0.003 0.003 0.003 0.003 0.003 0.003 0.003 - 0.003 F 40 0.005 0.005 - 0.005 0.005 0.005 - 0.005 - 0.005 - F 41 0.007 0.007 - 0.007 0.007 0.007 - 0.007 - 0.007 - F 42 - F 43 - F 44 - F 45 - F 46 - F 47 - F 48 - F 49 - F 50 - F 51 - F 52 - -. F 53 - F 54 - F 55 - F 56 - F 57 - F 58 - F 59 - F 60 -
continued ...
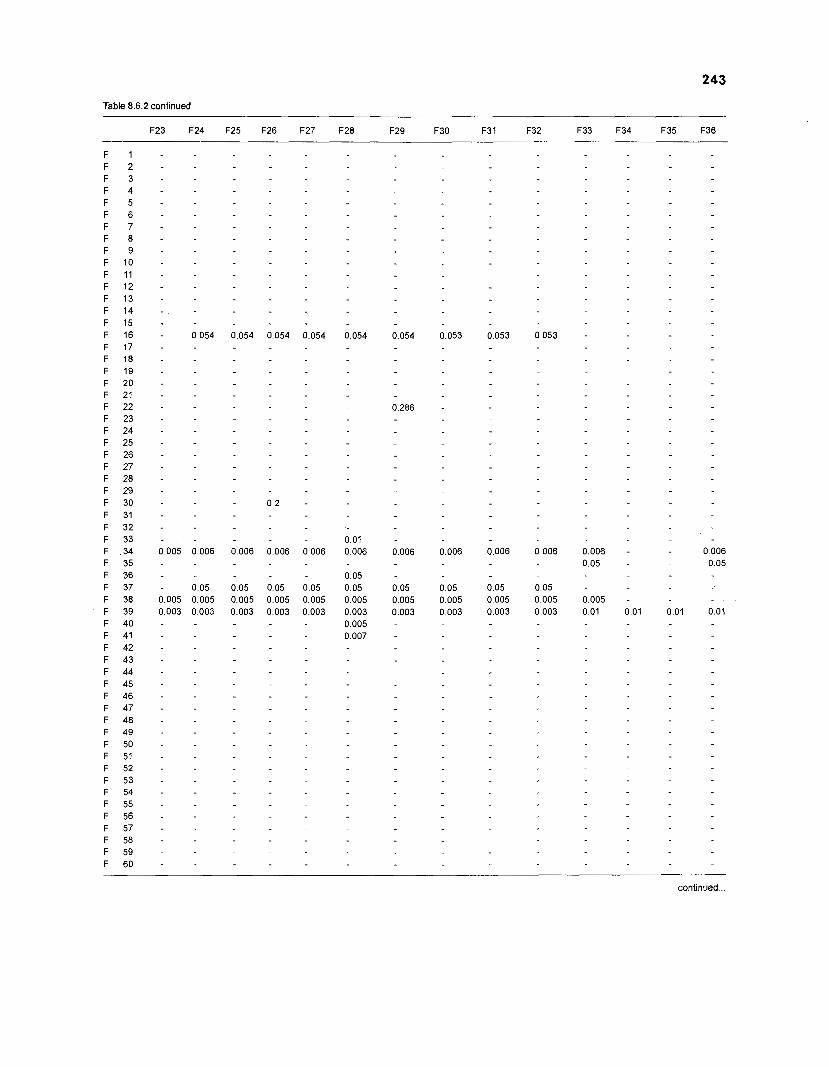
Table 8.6.2 continued
F23 F24 F25 F26 F27 F28 F29 F30 F3 1 F32 F33 F34 F35 F36
continued ...
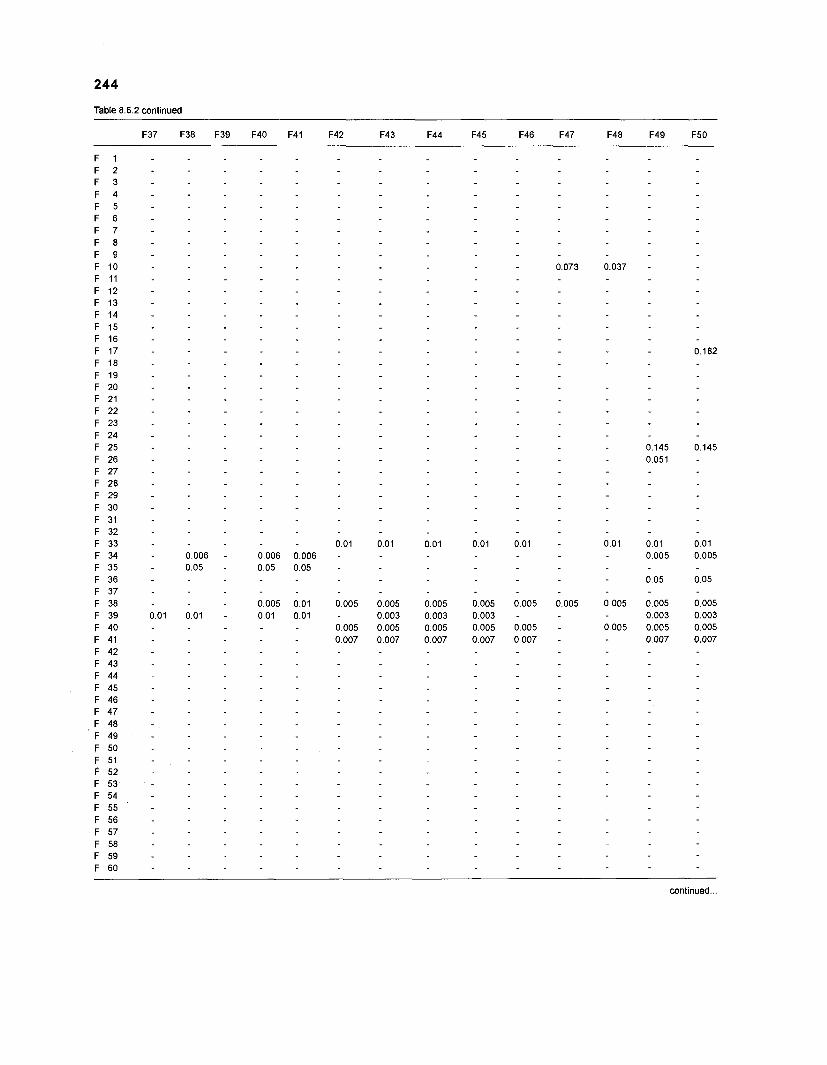
Table 8.6.2 continued
continued ...
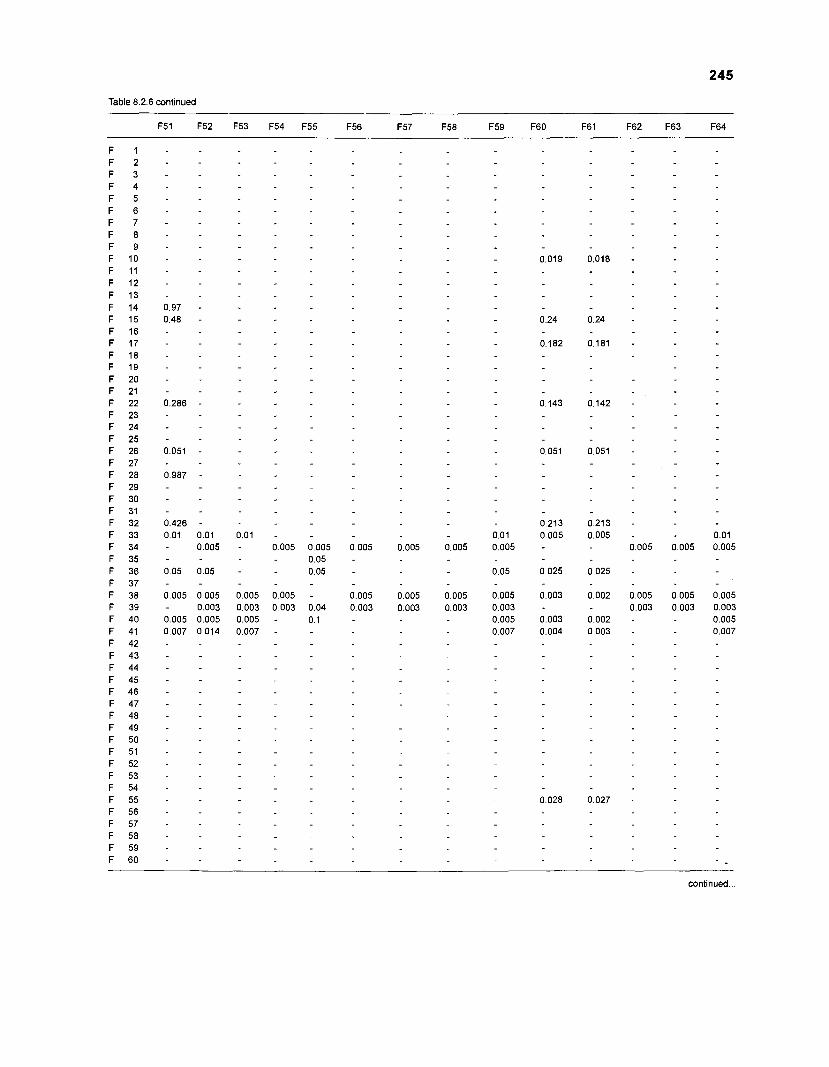
Table 8.2.6 continued
continued ...
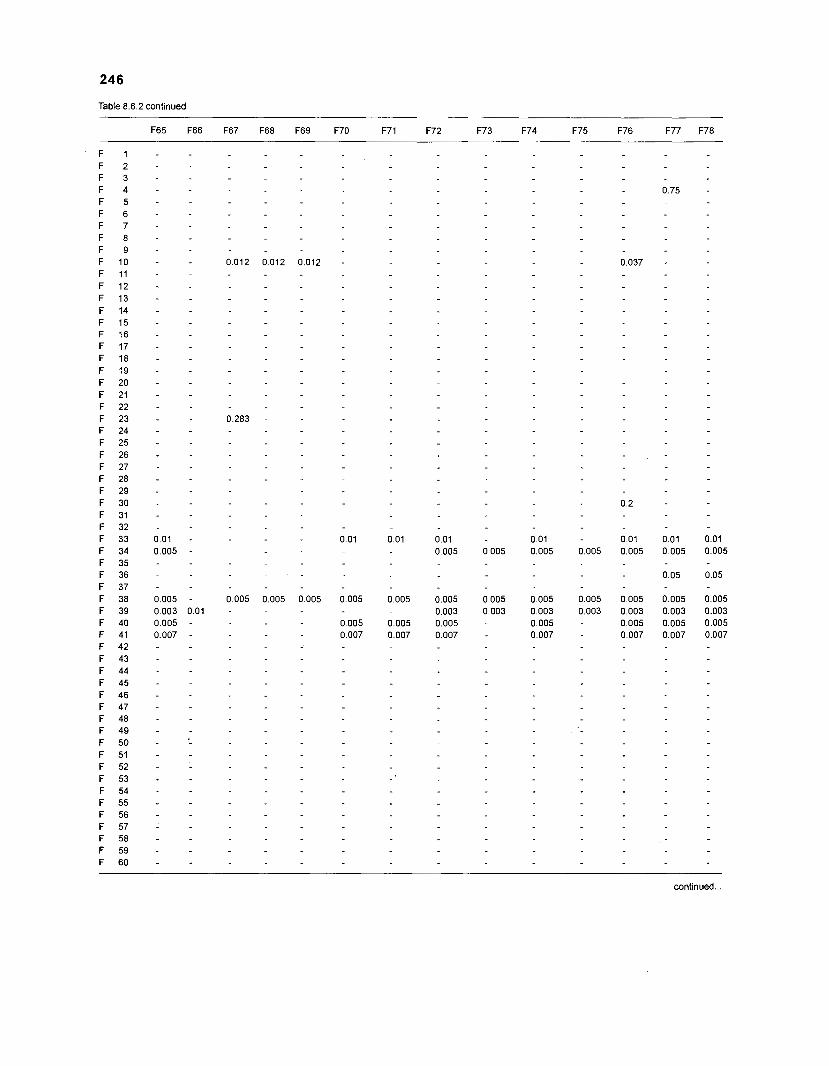
246
Table 8.6.2 continued
continued ...
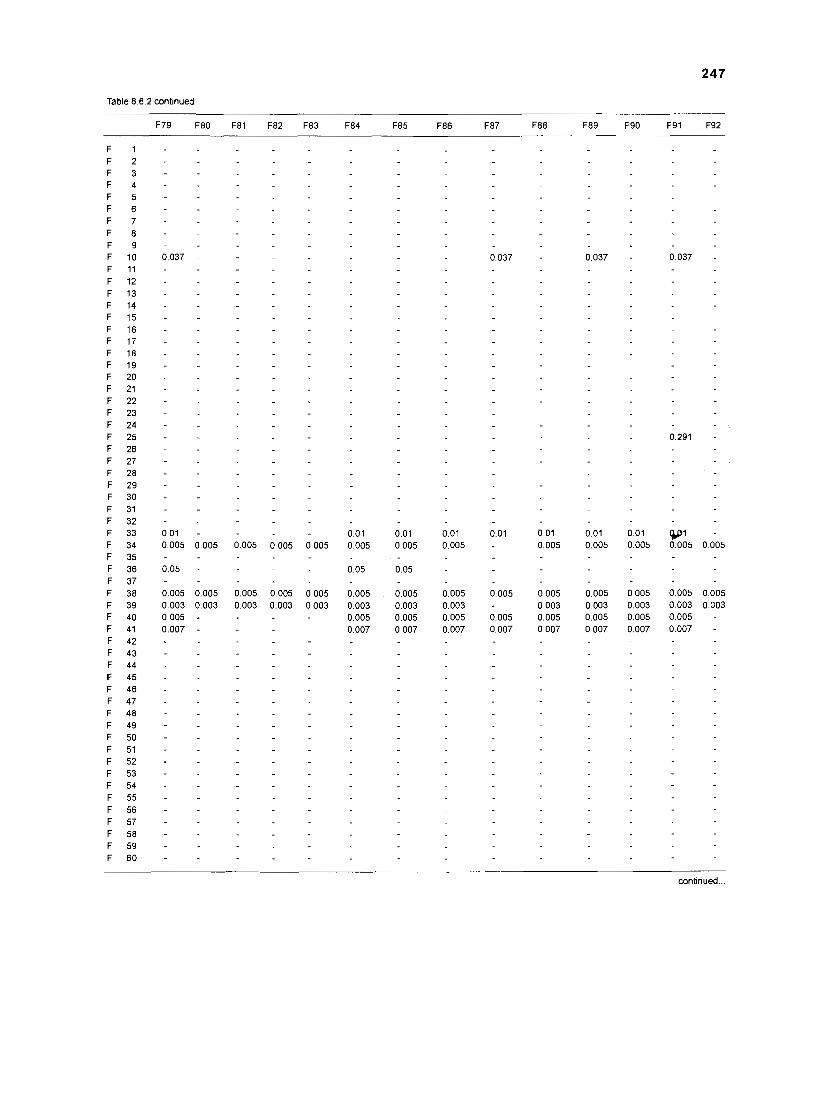
Table 8.6.2 continued
F79 F80 F81 F82 F83 F84 F85 F86 F87 F88 F89 F90 F91 F92
continued ...
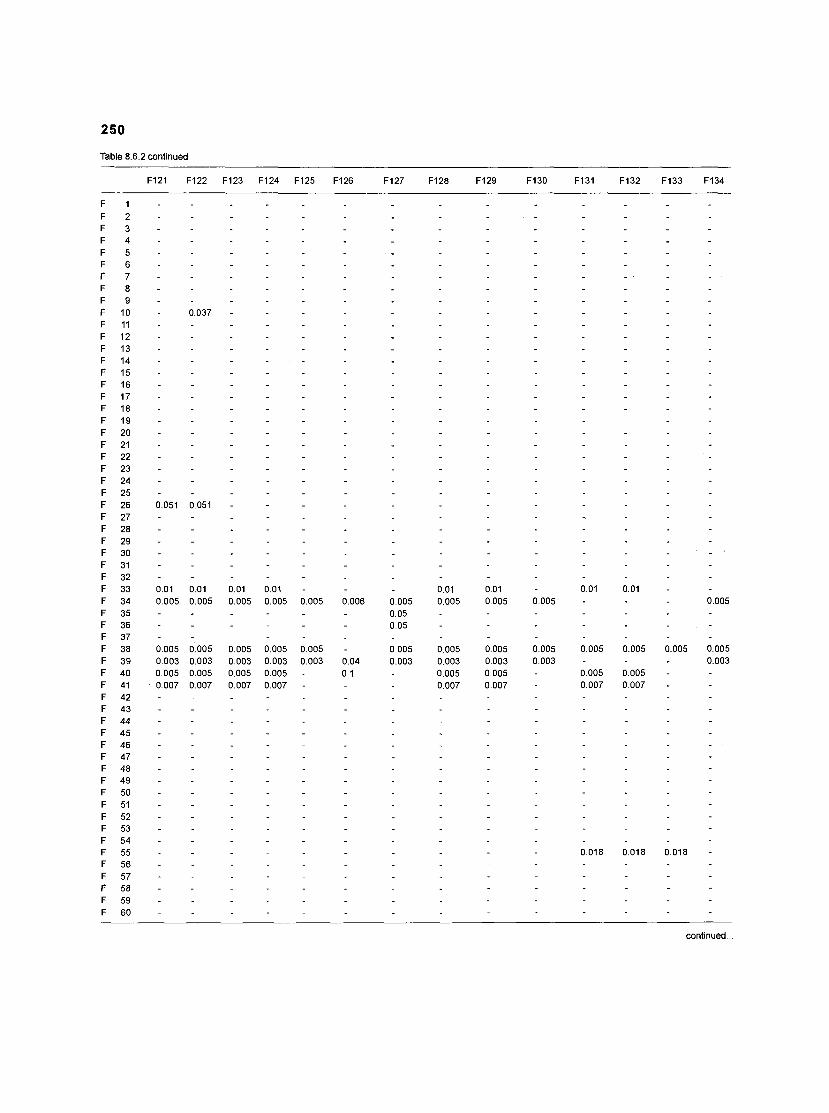
Table 8.6.2 continued
continued ...
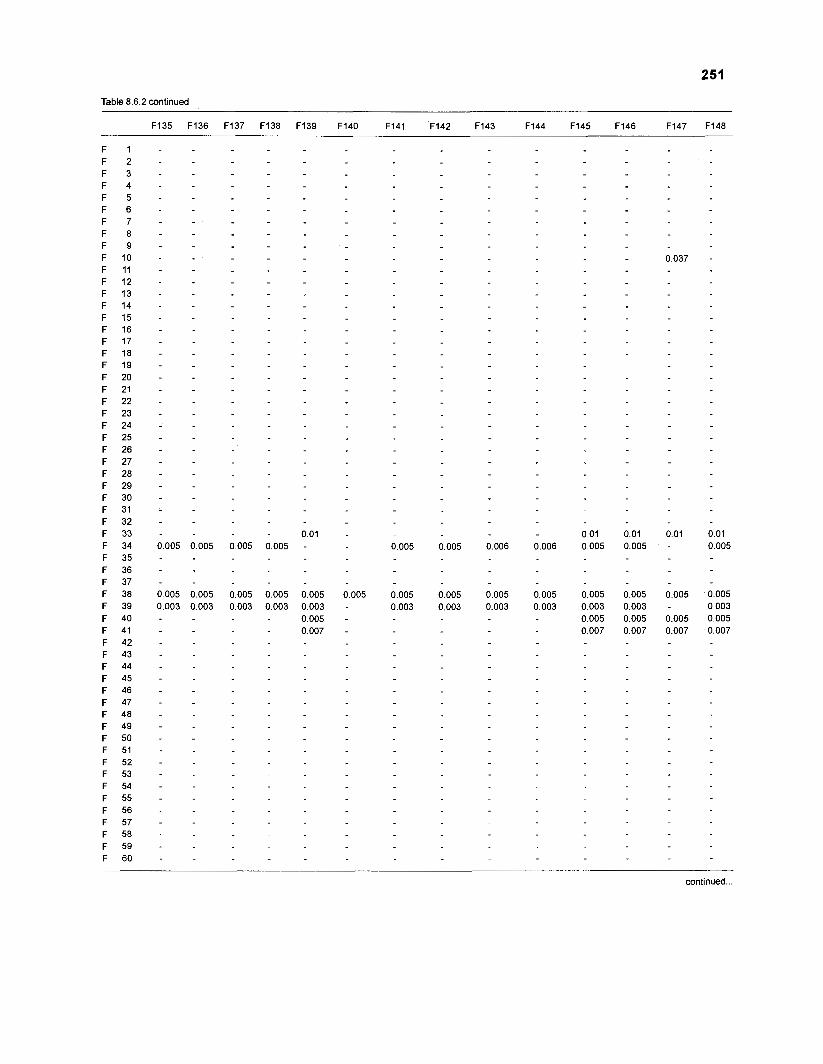
Table 8.6.2 continued
F 1 - F 2 - F 3 - F 4 - F 5 - F 6 - F 7 - F 8 - F 9 - F 10 - 0.037 - F 11 - F 12 - F 13 - F 14 - F 15 - F 16 - F 17 - F 18 - F 19 - F 20 - F 21 - F 22 - F 23 - F 24 - F 25 - F 26 - F 27 - F 28 - F 29 - F 30 - F 31 - F 32 - F 33 - 0.01 - 0.01 0.01 0.01 0.01 F 34 0.005 0.005 0.005 0.005 - 0.005 0.005 0.006 0.006 0.005 0.005 - 0.005 F 35 - F 36 - F 37 - F 38 0.005 0.005 0.005 0.005 0.005 0.005 0.005 0.005 0.005 0.005 0.005 0.005 0.005 0.005 F 39 0.003 0.003 0.003 0.003 0.003 - 0.003 0.003 0.003 0.003 0.003 0.003 - 0.003 F 40 - 0.005 - 0.005 0.005 0.005 0.005 F 41 - 0.007 - 0.007 0.007 0.007 0.007 F 42 - F 43 - F 44 - F 45 - F 46 - F 47 - F 48 - F 49 - F 50 - F 51 - F 52 - F 53 - F 54 - F 55 - F 56 - F 57 - F 58 - F 59 - F 60 -
continued ...
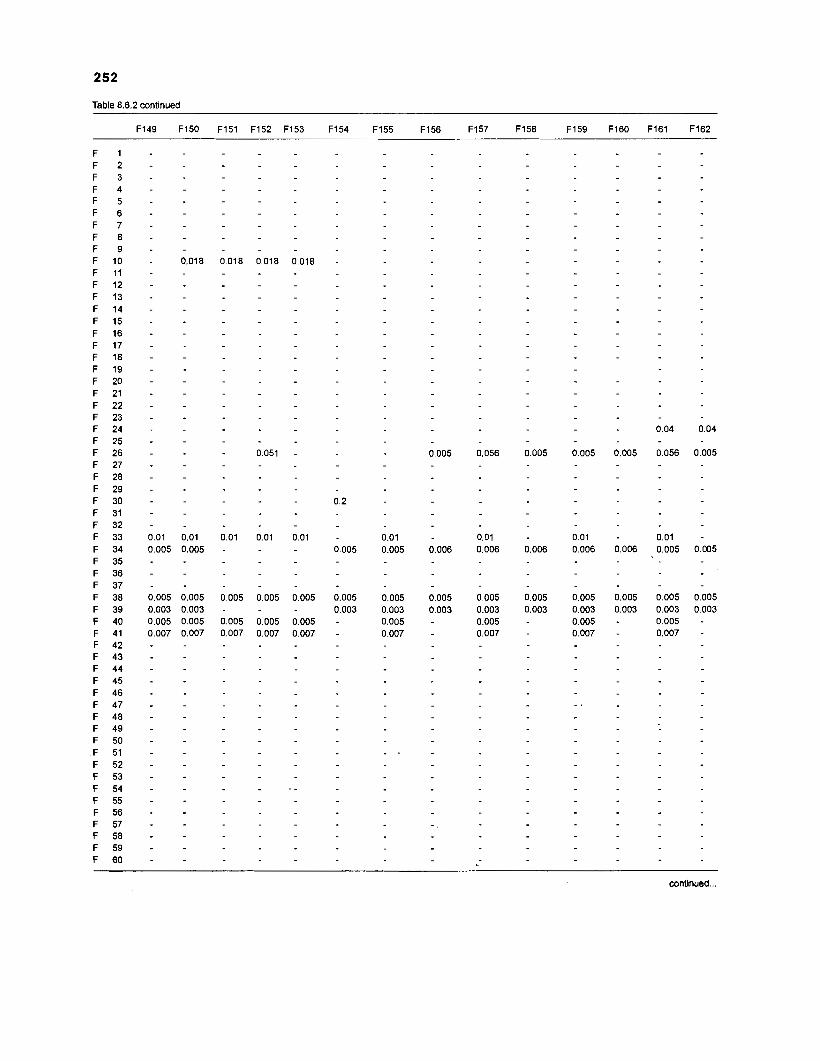
Table 8.6.2 continued
continued ...
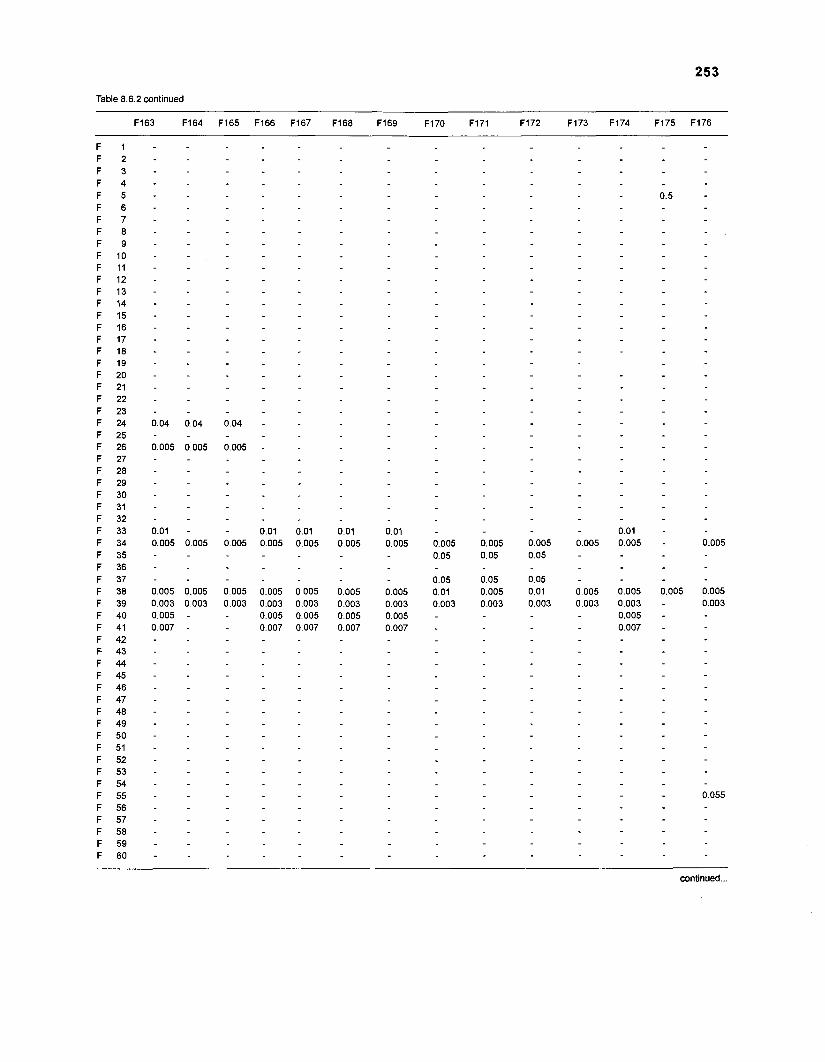
Table 8.6.2 continued
continued ...
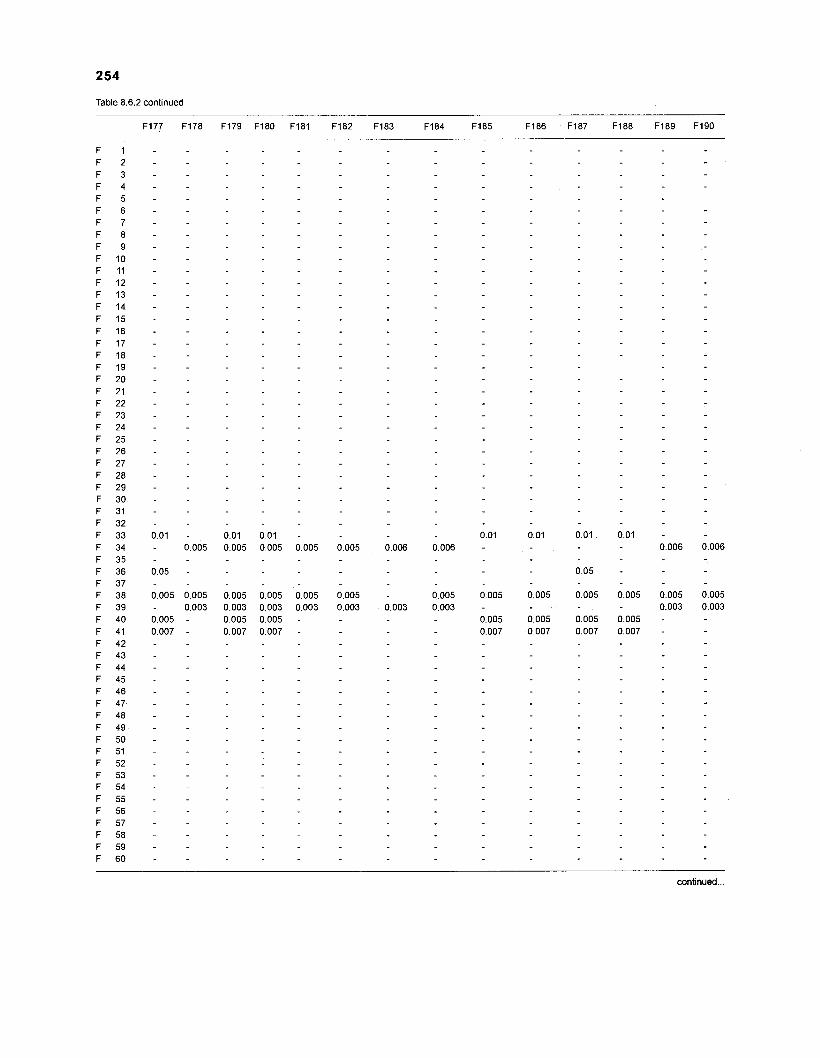
Table 8.6.2 continued
continued ...
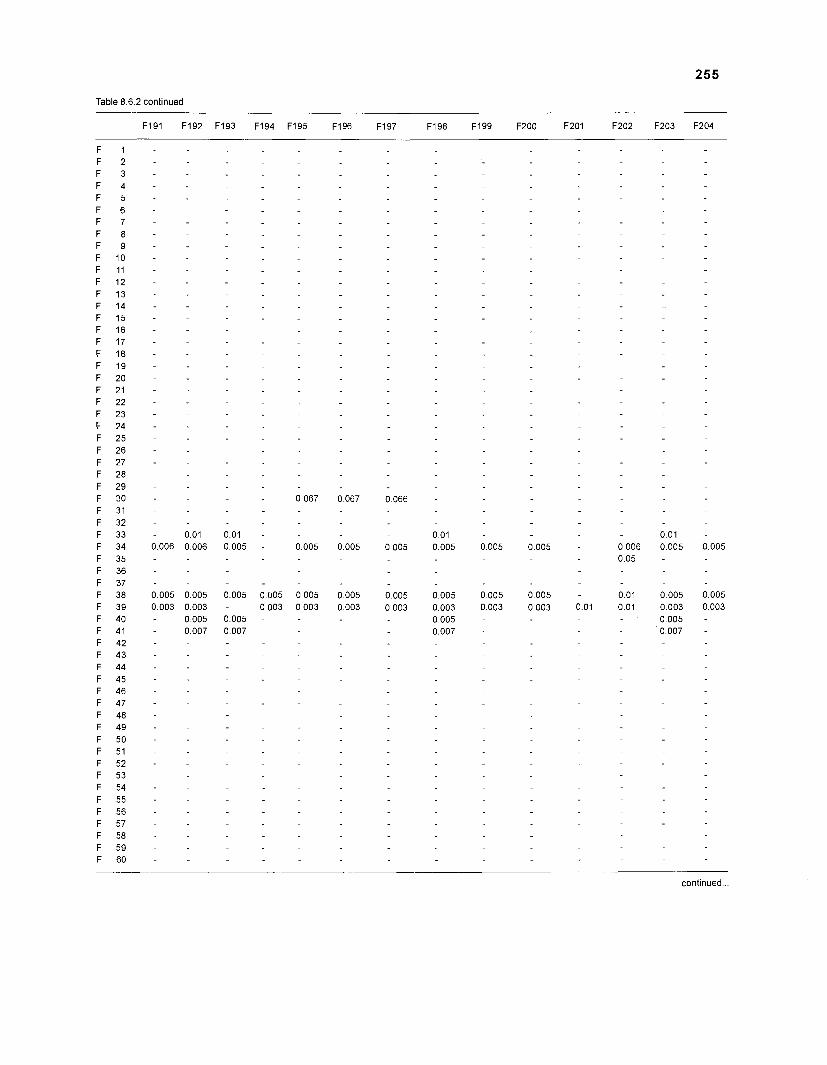
Table 8.6.2 continued
continued
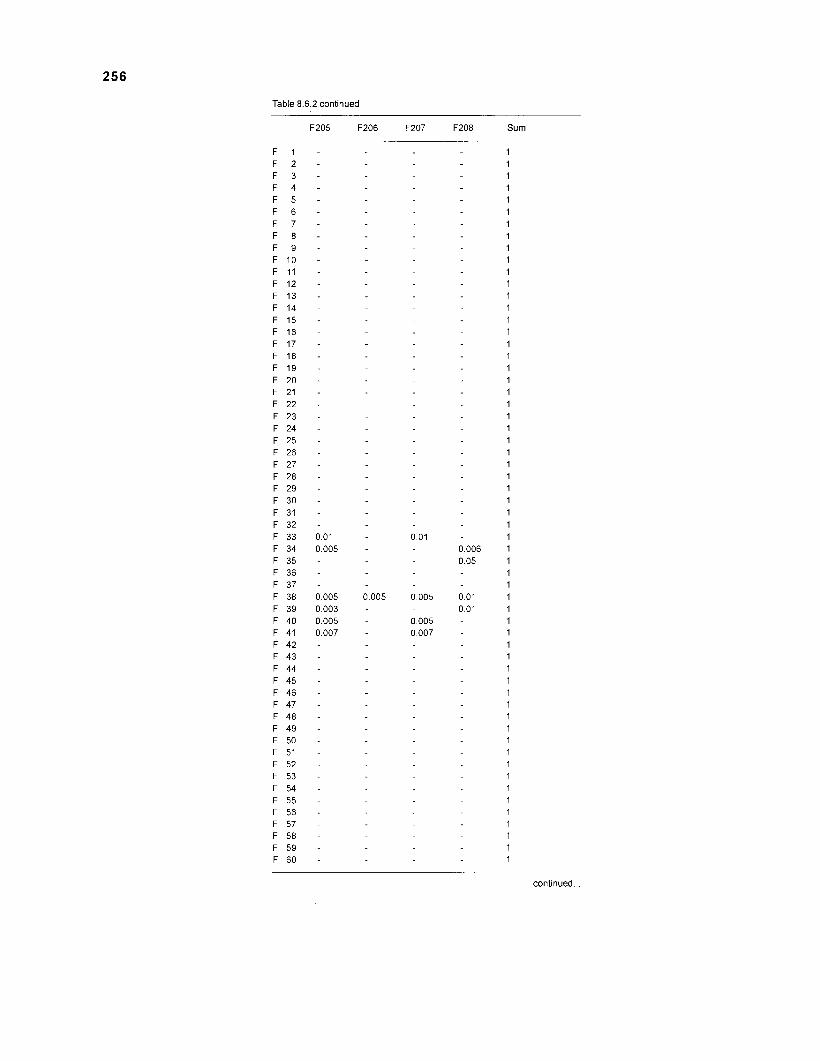
Table 8.6.2 continued
F205 F206 F207 F208 Sum
continued.. .
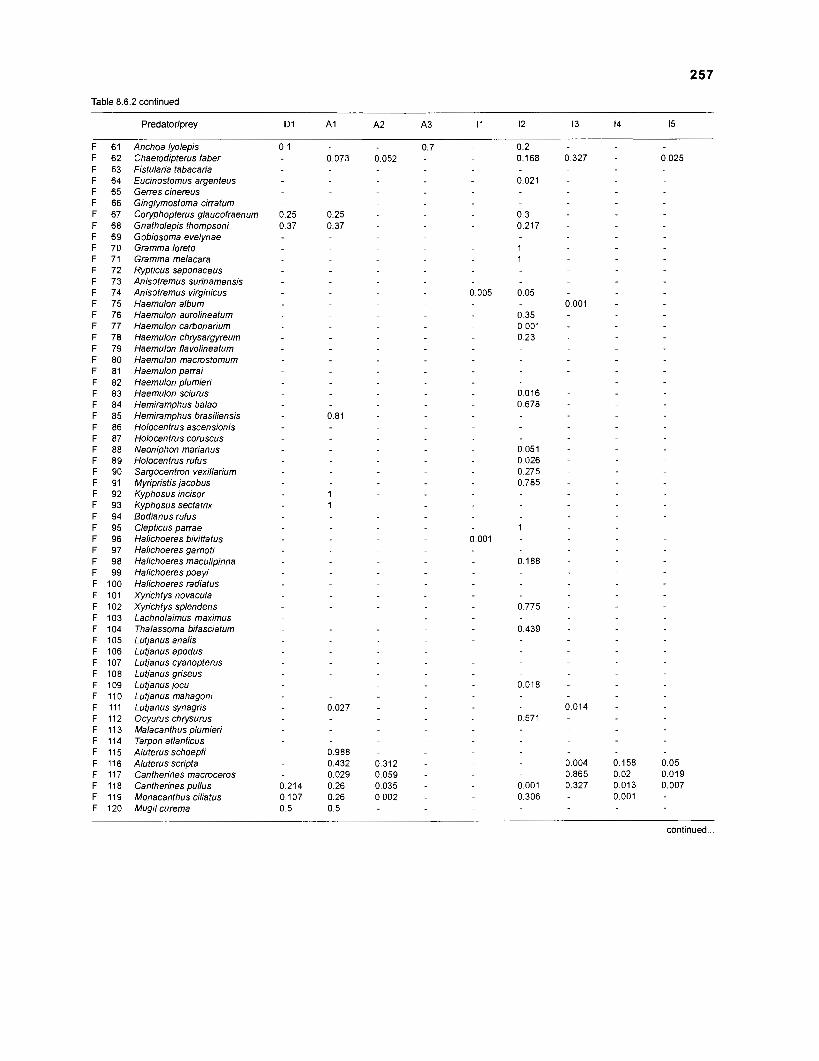
Table 8.6.2 continued
Predatorlprey D 1 A1 A2 A3 I1 12 13 14 15
Anchoa lyolepis Chaetodipterus faber Fistularia tabacaria Eucinostomus argenteus Gerres cinereus Ginglymostoma cirratum Coryphopterus glaucofraenum Gnatholepis thompsoni Gobiosoma evelynae Gramma loreto Gramma melacara Rypticus saponaceus Anisotremus surinamensis Anisotremus virginicus Haemulon album Haemulon aurolineatum Haemulon carbonarium Haemulon chrysargyreum Haemulon flavolineatum Haemulon macrostomum Haemulon parrai Haemulon plumier; Haemulon sciurus Hemiramphus balao Hemiramphus brasiliensis Holocentrus ascensionis Holocentrus coruscus Neoniphon marianus Holocentrus rufus Sargocentron vexillarium Myripristis jacobus Kyphosus incisor Kyphosus sectatrix Bodianus rufus Clepticus parrae Halichoeres bivittatus Halichoeres garnoti Halichoeres maculipinna Halichoeres poeyi Halichoeres radiatus Xyrichtys novacula Xyrichtys splendens Lachnolaimus maximus Thalassoma bifasciatum Lutjanus analis Lutjanusapodus Lutjanus cyanopterus Lutjanus griseus Lutjanus jocu Lutjanus mahagoni Lutjanus synagris Ocyurus chrysurus Malacanthus plumieri Tarpon atlanticus Aluterus schoepfi Aluterus scripta Cantherines macroceros Cantherines pullus Monacanthus ciliatus Mugd curema
continued ...
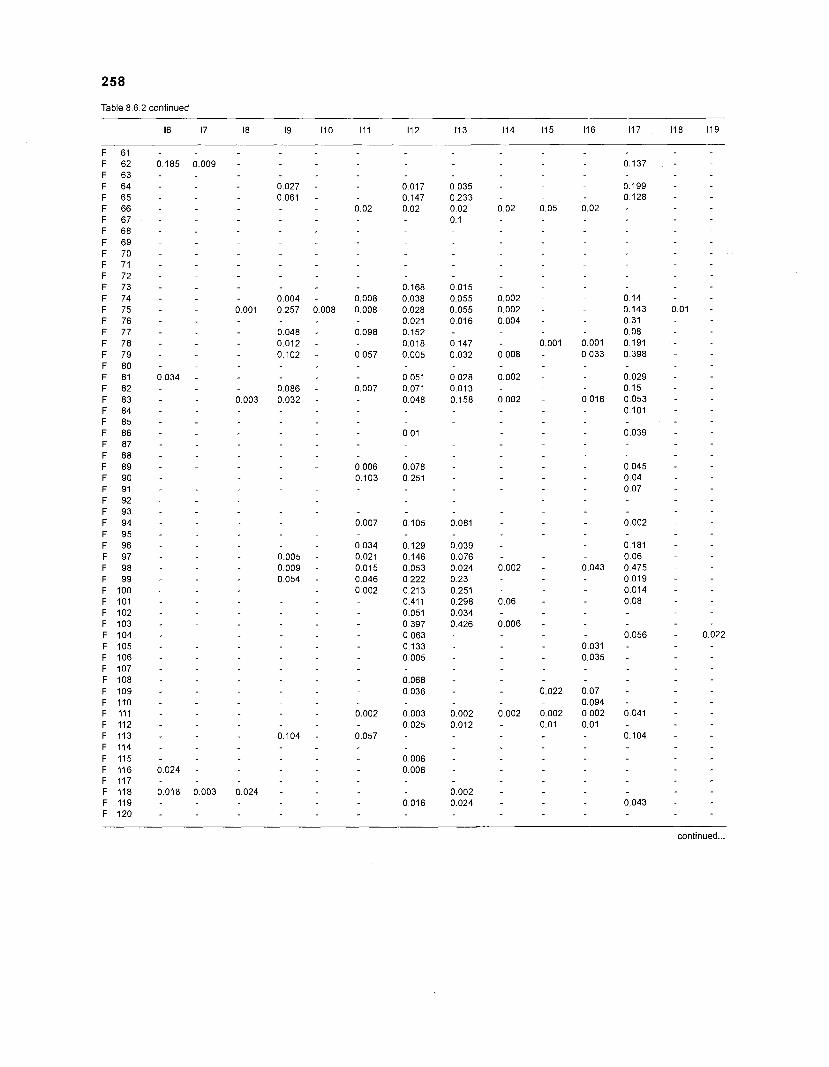
Table 8.6.2 continued
16 17 18 19 110 111 112 11 3 114 115 116 117 118 119
F 61 -
F 62 0.185 0.009 - 0.137 - F 63 - F 64 - 0.027 - 0 017 0.035 - 0.199 -
F 65 - 0.061 - 0.147 0.233 - 0.128 - F 66 - 0.02 0.02 0.02 0 02 0.05 0.02 - F 67 - 0.1 F 68 - F 69 -
F 70 -
F 71 -
F 72 - F 73 - 0.168 0.015 - F 74 - 0.004 - 0.008 0.038 0.055 0.002 - 0 14 F 75 - 0.001 0 257 0.008 0 008 0.028 0.055 0.002 - 0.143 0.01 - F 76 - 0.021 0.016 0.004 - 0.31 F 77 - 0.048 - 0.098 0.152 - 0.08 F 78 - 0.012 - 0.018 0 147 - 0.001 0.001 0.191 - F 79 - 0.102 - 0 057 0.005 0.032 0.008 - 0.033 0.398 -
F 80 - F 81 0.034 - 0 051 0.028 0.002 - 0.029 - F 82 - 0.086 - 0.007 0 071 0.013 - 0.15 F 83 - 0 003 0.032 - 0.048 0158 0.002 - 0.016 0.053 - F 84 - 0.101 - F 85 - F 86 - 0 01 0.039 - F 87 - F 88 - F 89 - 0.006 0.078 - 0.045 - F 90 - 0 103 0.251 - 0.04 F 91 - 0.07 F 92 - F 93 - F 94 - 0.007 0.105 0.081 - 0.002 - F 95 - F 96 - 0.034 0.129 0.039 - 0.181 - F 97 - 0.005 - 0.021 0.146 0.076 - 0.06 F 98 - 0 009 - 0.015 0.053 0.024 0.002 - 0.043 0.475 -
F 99 - 0.054 - 0.046 0 222 0 23 0019 - F I O O - 0.002 0.213 0.251 - 0.014 - F 1 0 1 - 0.411 0.298 0.06 - 0.08 F 1 0 2 - 0.051 0.034 - F 1 0 3 - 0.397 0.426 0.006 - F 1 0 4 - 0.063 - 0.056 - 0.022 F 1 0 5 - 0.133 - 0.031 - F 1 0 6 - 0.005 - 0.035 - F 1 0 7 - F 1 0 8 - 0.068 - F 1 0 9 - 0.036 - 0.022 0.07 - F 170 - 0.094 - F 111 - 0.002 0.003 0.002 0.002 0.002 0.002 0.041 - F 112 - 0.025 0.012 - 0.01 0.01 - F 113 - 0.104 - 0.057 - 0.104 - F 114 - F 115 - 0.006 - F 116 0.024 - 0.006 - F 117 - F 118 0.018 0.003 0.024 - 0.002 - F 119 - 0.016 0.024 - 0.043 - F 1 2 0 -
continued ...
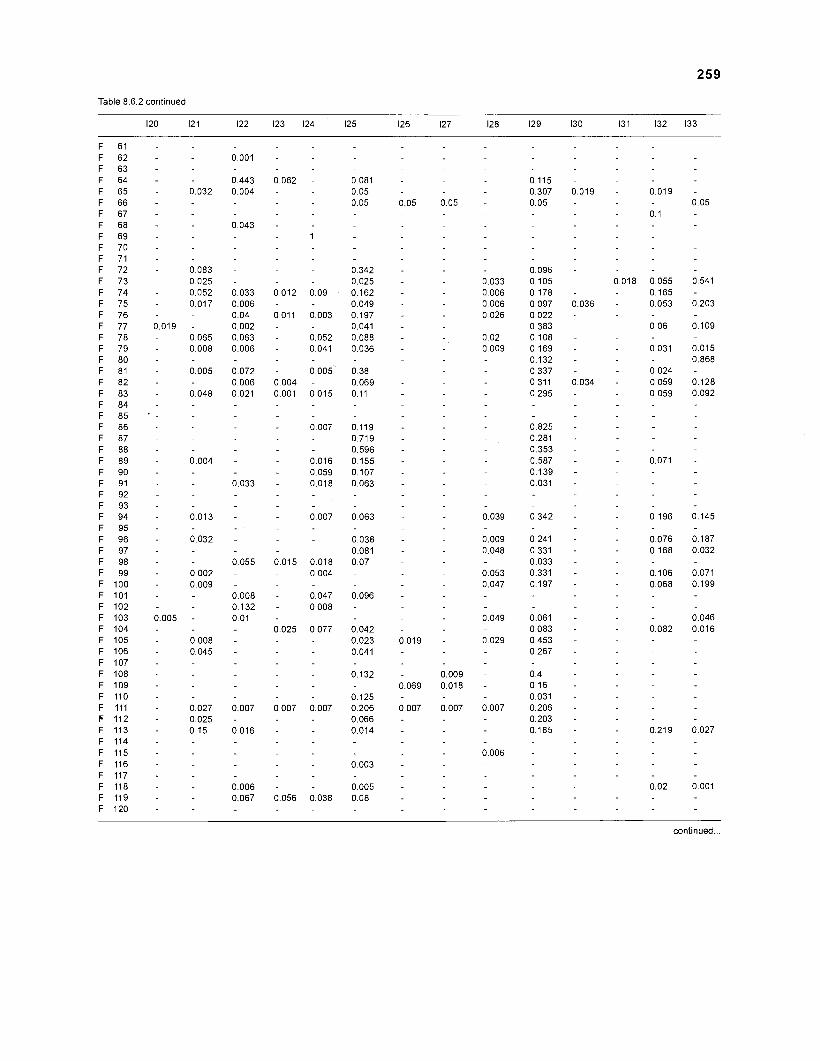
Table 8 6 2 contmued
120 121 122 123 124 125 126 127 128 129 130 131 132 133
continued ...
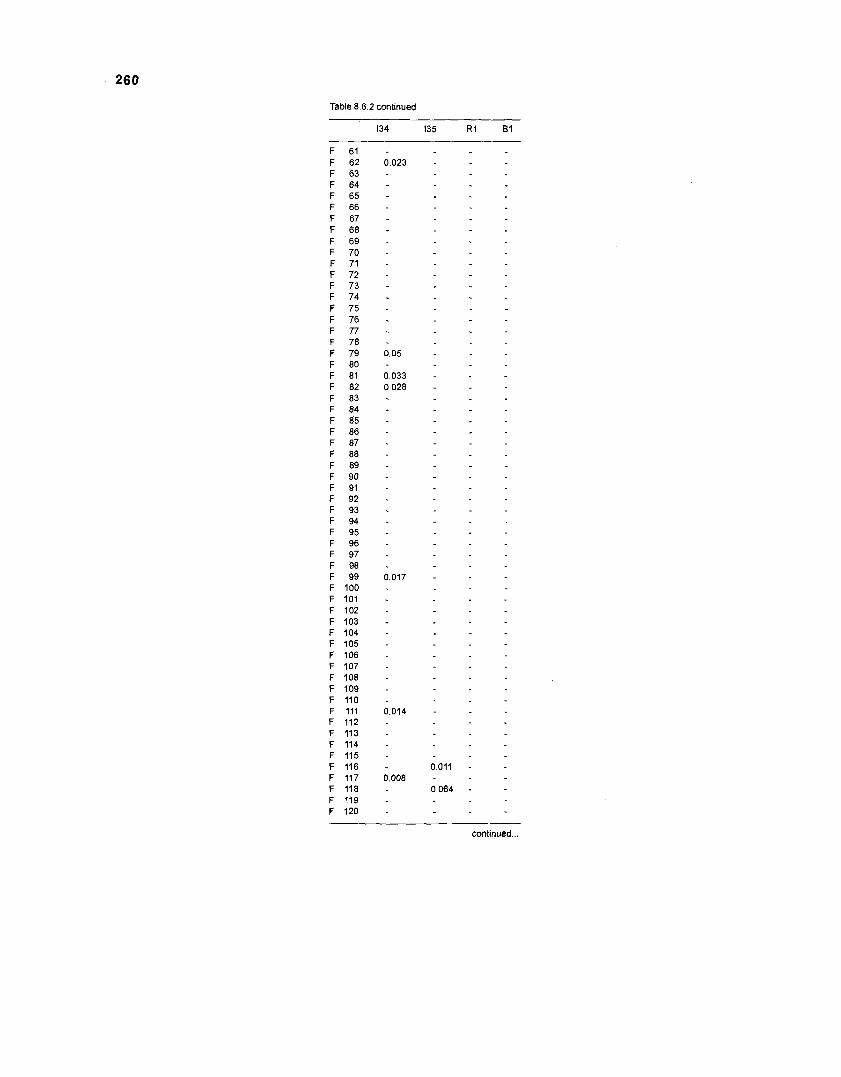
Table 8.6.2 continued
continued ...
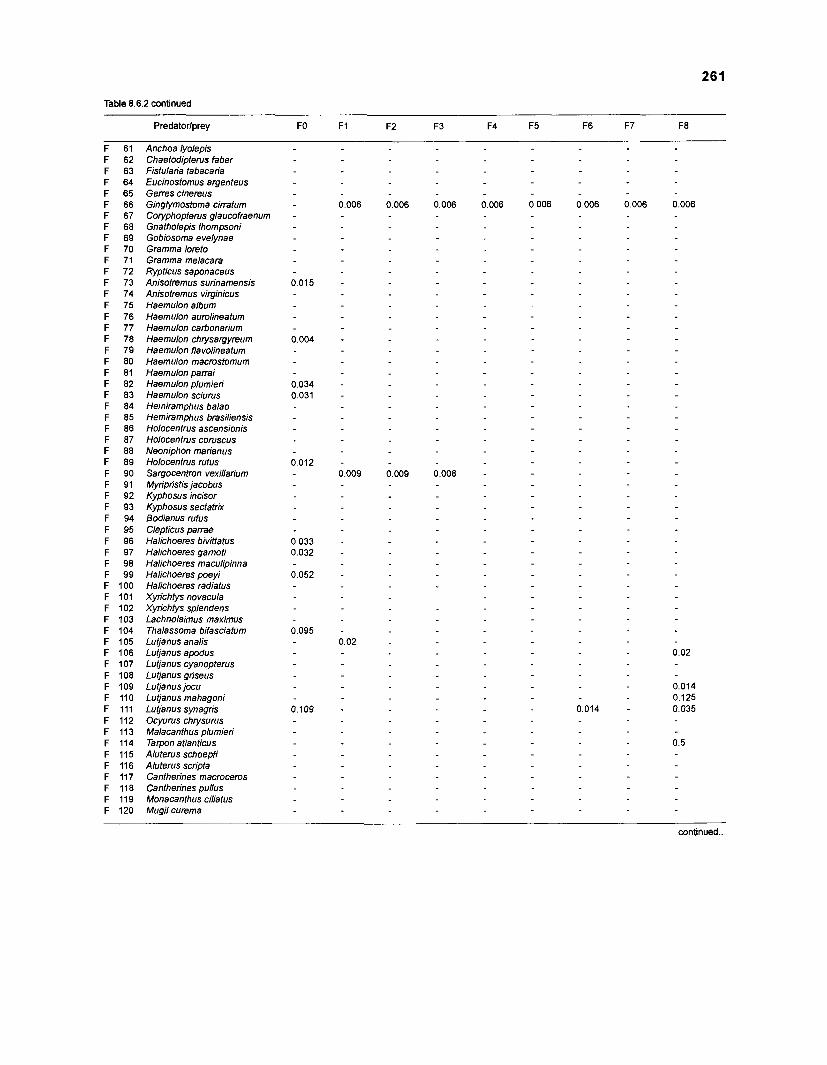
261
Table 8.6.2 continued
Predatorlprey FO F1 F2 F3 F4 F5
F 61 Anchoa lyolepis Chaetodipterus faber Fistularia tabacaria Eucinostomus argenteus Gerres cinereus Ginglymostoma cirratum Coryphopterus glaucofraenum Gnatholepis thompsoni Gobiosoma evelynae Gramma loreto Gramma melacara Rypticus saponaceus Anisotremus surinamensis Anisotremus virginicus Haemulon album Haemulon aumlineatum Haemulon carbonarium Haemulon chrysargyreum Haemulon llavolineatum Haemulon macmstomum Haemulon parrai Haemulon plumieri Haemulon sciurus Herniramphus balao Hemiramphus brasiliensis Holocentrus ascensionis Holocentrus coruscus Neoniphon marianus Holocentrus rufus Sargocentmn vexillarium Myrip ristis jacobus Kyphosus incisor Kyphosus sectatrix Bodianus rufus Clepticus parrae Halichoeres bivittatus Halichoeres garnoti Halichoeres maculipinna Halichoeres poeyi Halichoeres radiatus Xyrichtys novacula Xyrichtys splendens Lachnolaimus maximus Thalassoma bifasciatum Lutjanus analis Lutjanusapodus Lutjanus cyanopterus Lovanus griseus Lutjanus jocu Lutjanus mahagoni Luljanus synagris Ocyurus chtysurus Malacanthus plumieri Tarpon atlanticus Aluterus schoepfi Aluterus scripta Cantherines macroceros Cantherines pullus Monacanthus ciliatus Mugil curema
continued ...
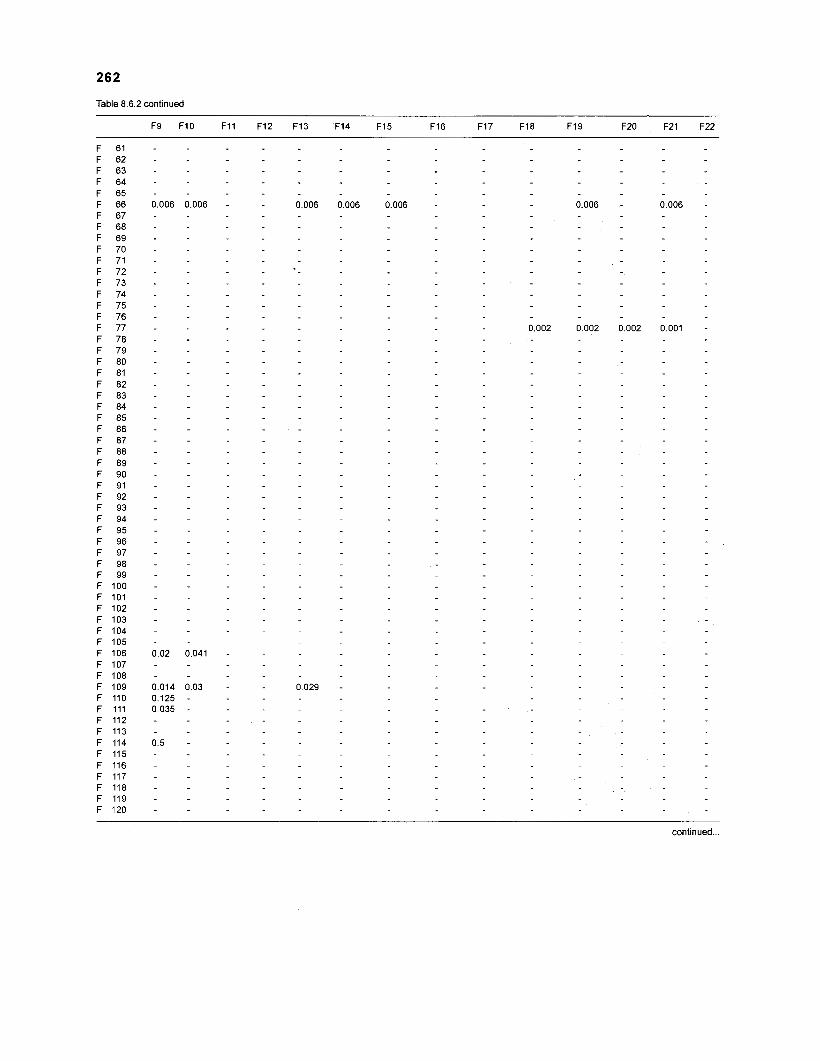
Table 8.6.2 continued
continued ...
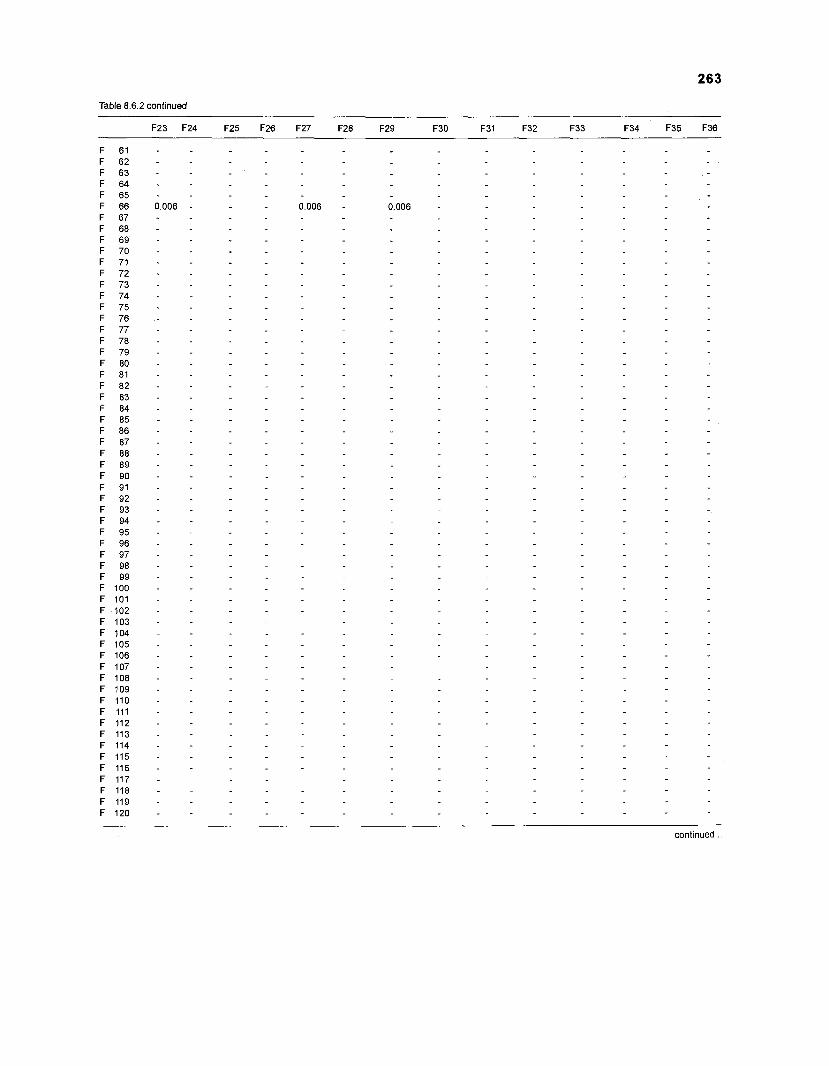
Table 8.6.2 continued
continued ...
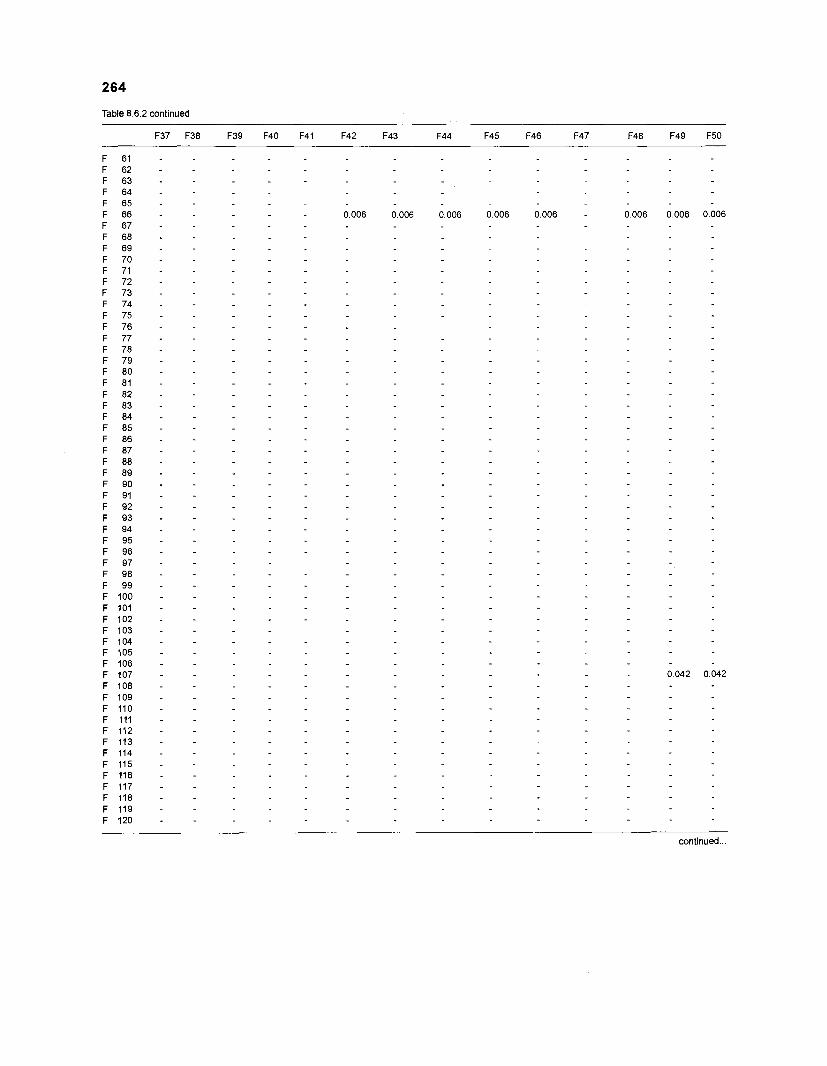
Table 8.6.2 continued
continued ...
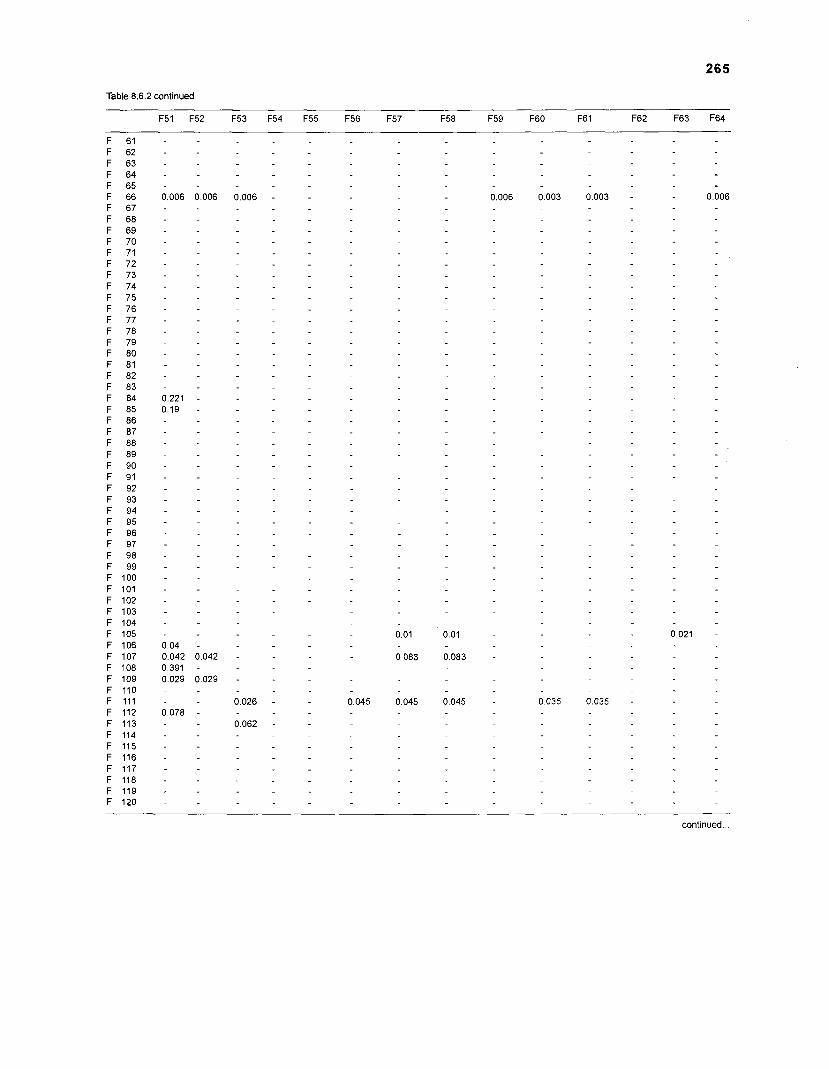
265
Table 8.6.2 continued
continued ...
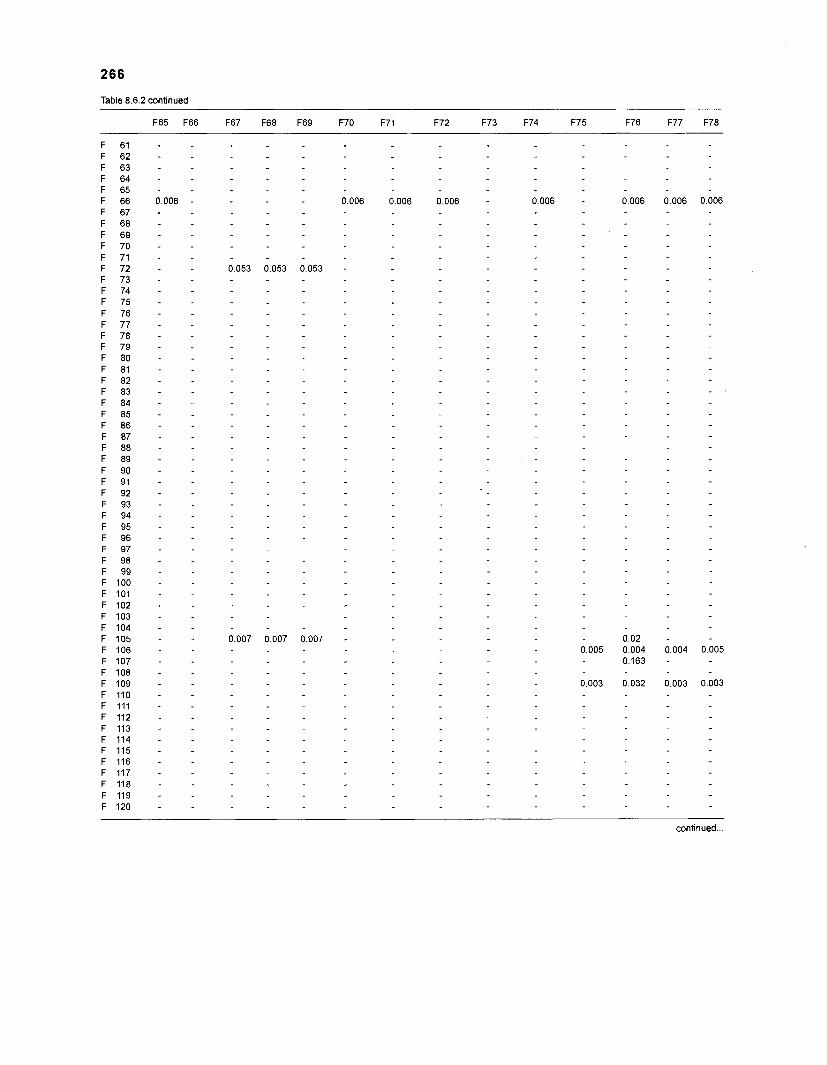
Table 8.6.2 continued
F65 F66 F67 F68 F69 F70 F71 F72 F73 F74 F75 F76 F77 F78
continued ...
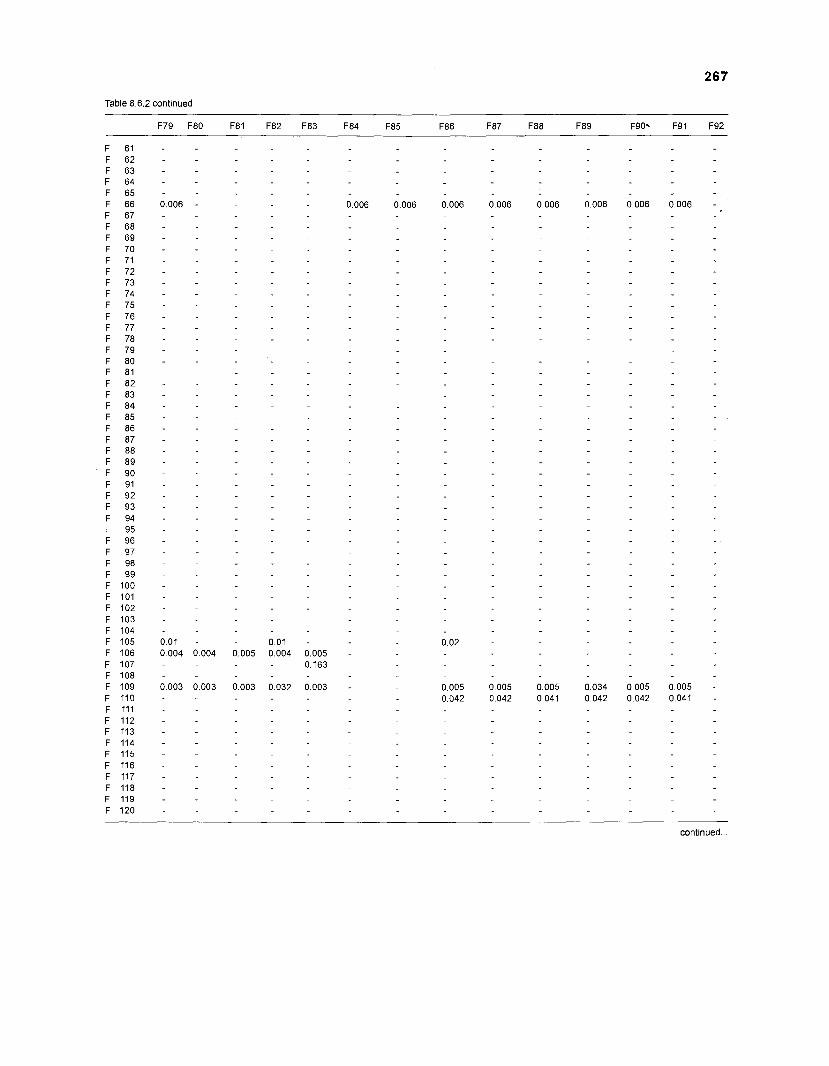
Table 8.6.2 continued
continued ...
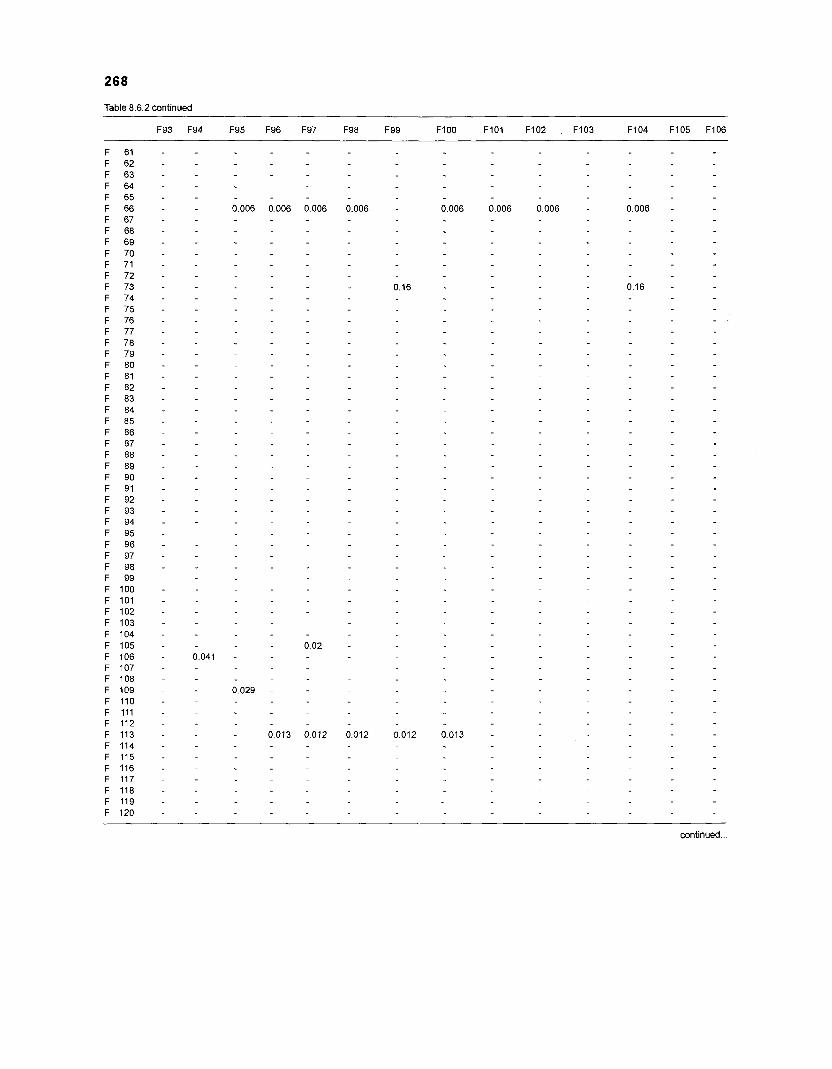
268
Table 8.6.2 continued
F93 F94 F95 F96 F97 F98 F99 FlOO FlOl F102 F103 F104 Fi05 F106
continued ...
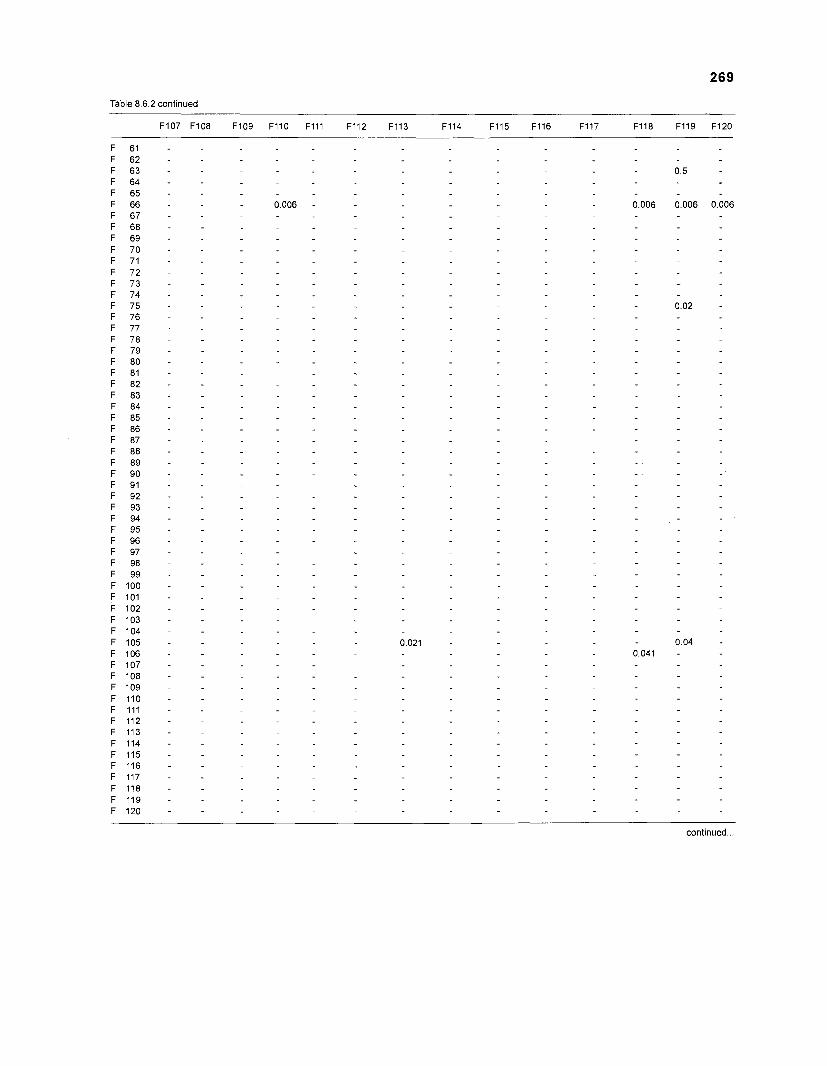
269
Table 8.6.2 continued
F107 F108 FA09 F l lO F l l l F112 F113
continued ...
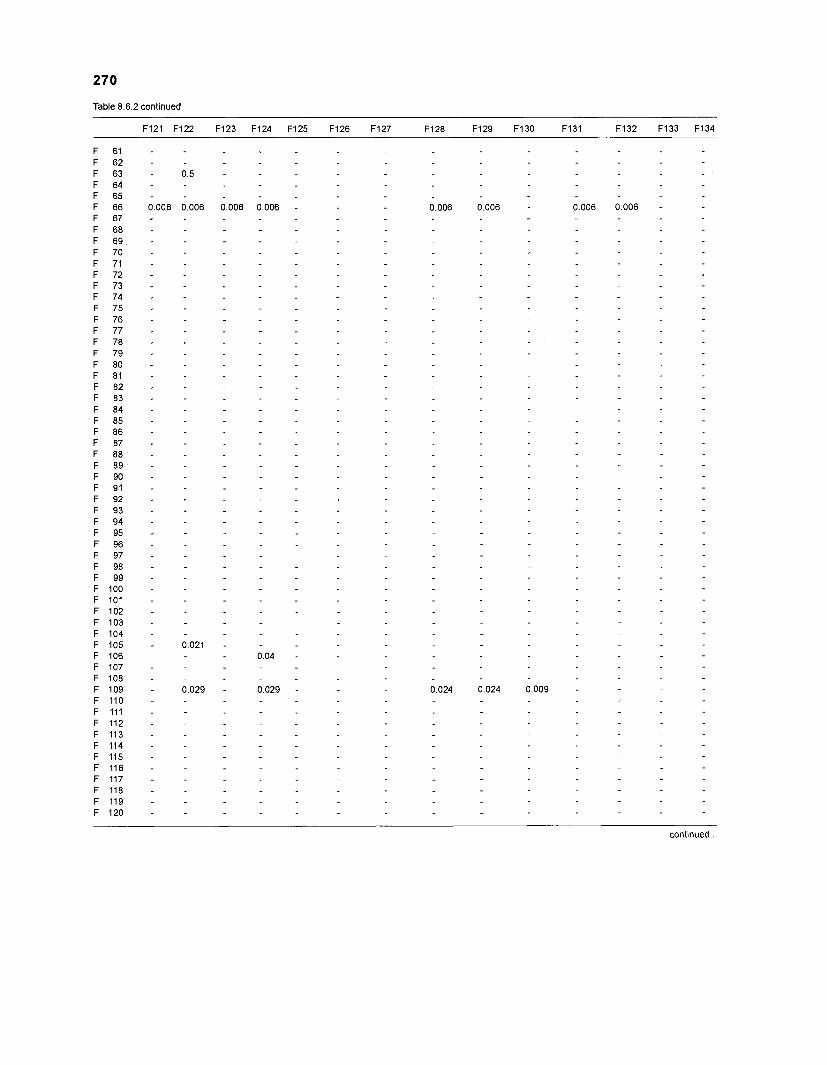
Table 8.6.2 continued
F121 F122 F123 F124 F125 F126 F127 F128 F129 F130 F131 F132 F133 F134
continued ...
271
Table 8.6.2 continued
continued ...
Table 8.6.2 continued
continued ...
Table 8.6.2 continued
continued ...
274
Table 8.6.2 continued
continued
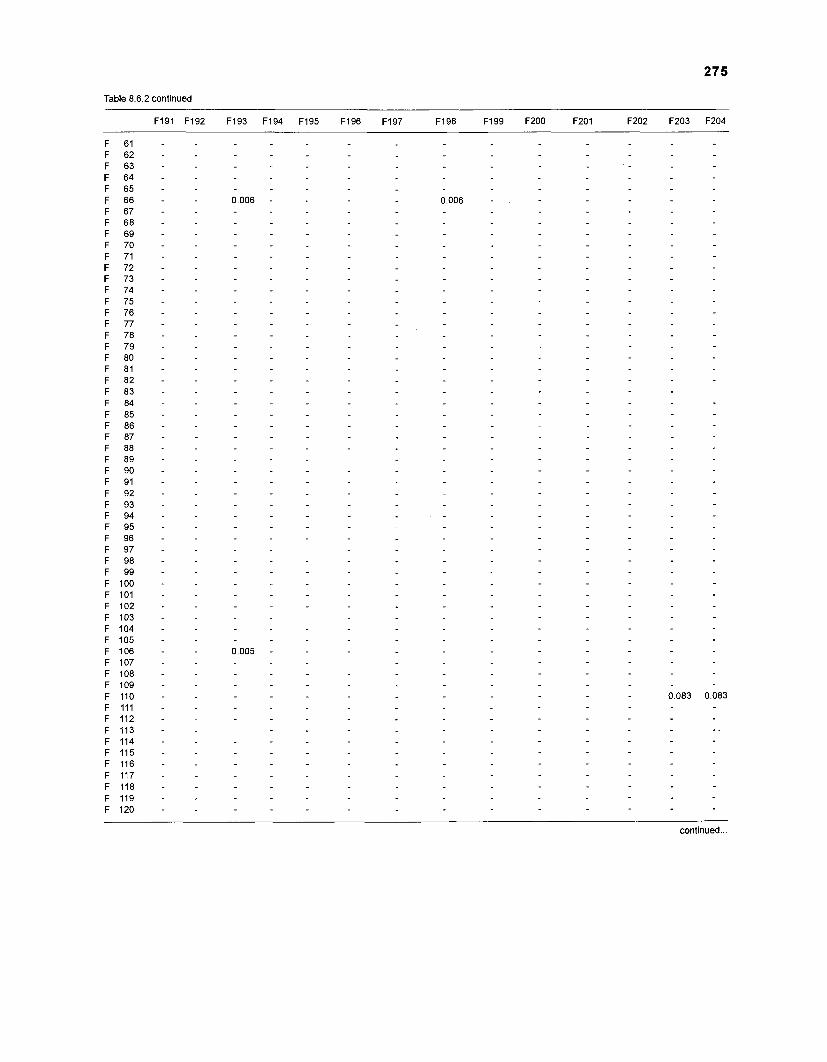
Table 8.6.2 continued
continued ...
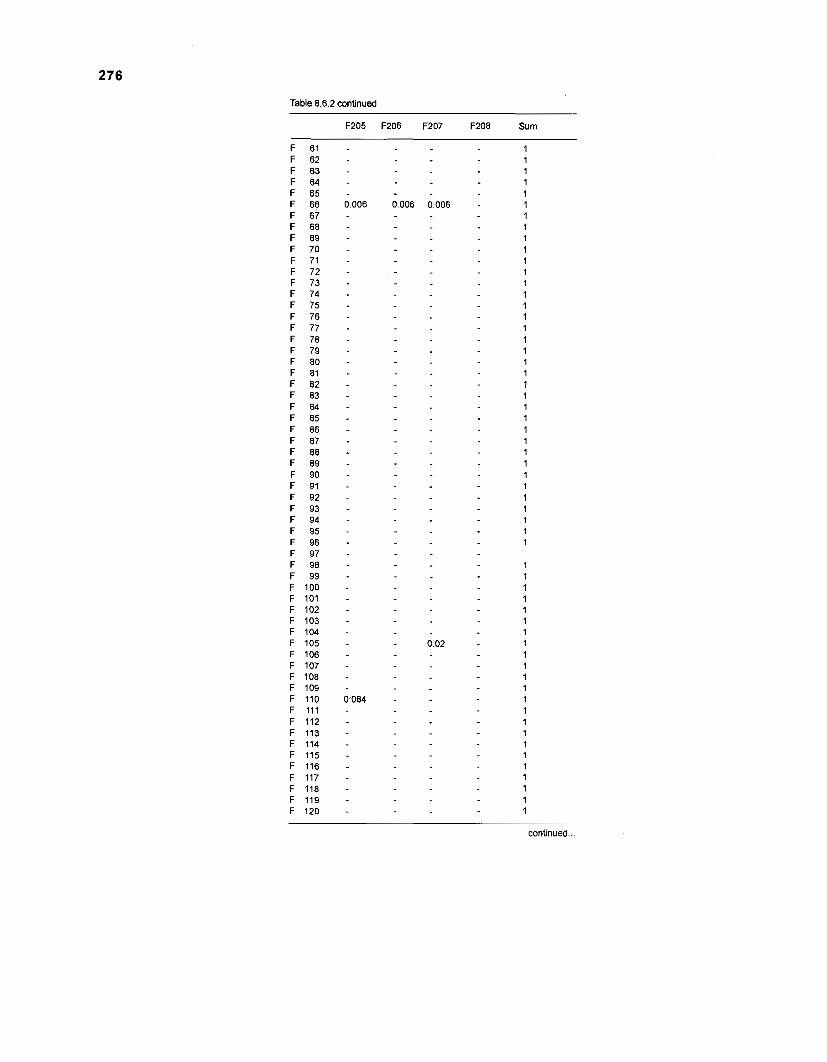
Table 8.6.2 continued
F205 F206 F207 F208 Sum
continued
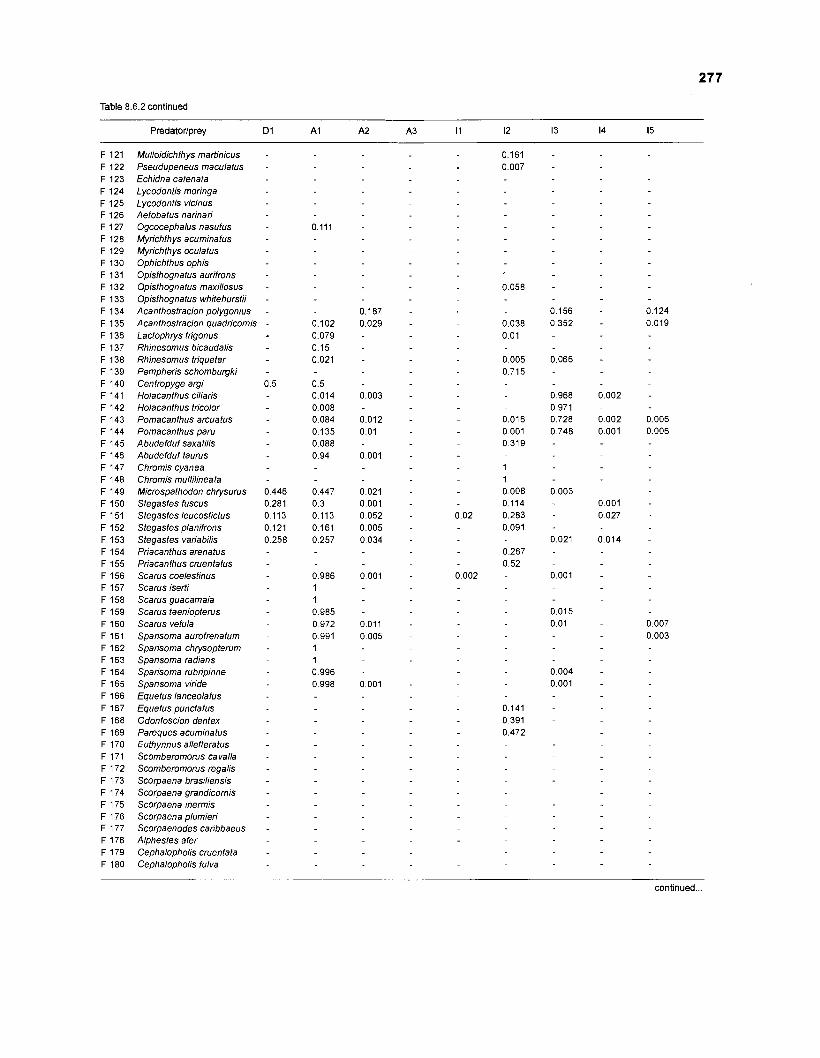
Table 8.6.2 continued
Predatorlprey Dl
Mulloidichthys marfinicus - Pseudupeneus maculatus - Echidna catenata Lycodontis moringa Lycodontis vicinus Aetobatus narinari Ogcocephalus nasutus Myrichthys acuminatus Myrichthys oculatus Ophichthus ophis Opisthognatus aurifrons - Opisthognatus maxillosus - Opisthognatus whitehurstii - Acanthostracion polygonius - Acanthostracion guadricornis - Lactophrys frigonus Rhinesomus bicaudalis Rhinesomus trigueter Pempheris schomburgki Centropyge argi Holacanthus ciliaris Holacanthus tricolor Pomacanthus arcuatus Pomacanthus paru Abudefduf saxatilis Abudefduf taurus Chromis cyanea Chromis multilineata Microspathodon chrysurus Stegastes fuscus Stegastes leucostictus Stegastes planifrons Stegastes variabilis Priacanthus arenatus Priacanthus cruentatus Scarus coelestinus Scarus iserfi Scarus guacamaia Scarus taeniopterus Scarus vetula Sparisoma aurofrenatum Sparisoma chrysopterum Sparisoma radians Sparisoma rubripinne Sparisoma viride Equetus lanceolatus Equetus punctatus Odontoscion dentex Pareques acuminatus Euthynnus alletteratus Scomberomorus cavalla Scomberomorus regalis Scorpaena brasiliensis Scorpaena grandicornis Scorpaena inermis Scorpaena plumieri Scorpaenodes caribbaeus Alphestes afer Cephalopholis cruentata Cephalophohs fulva
continued ...
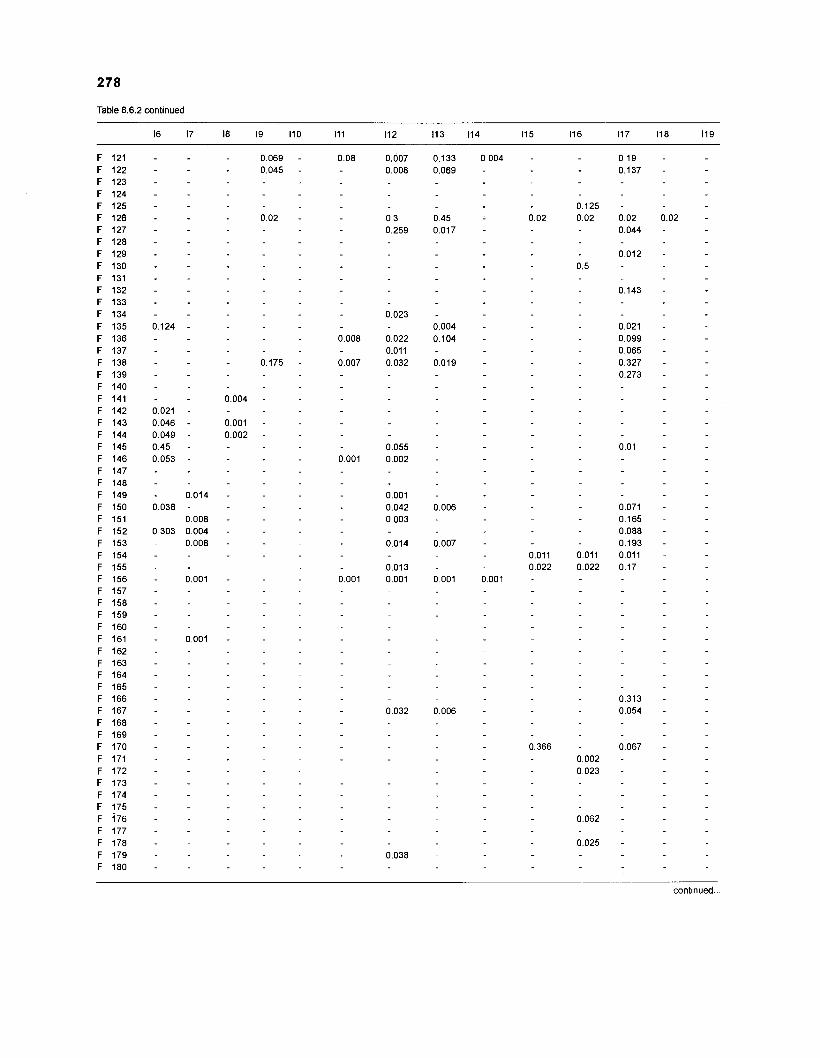
Table 8.6.2 continued
continued ...
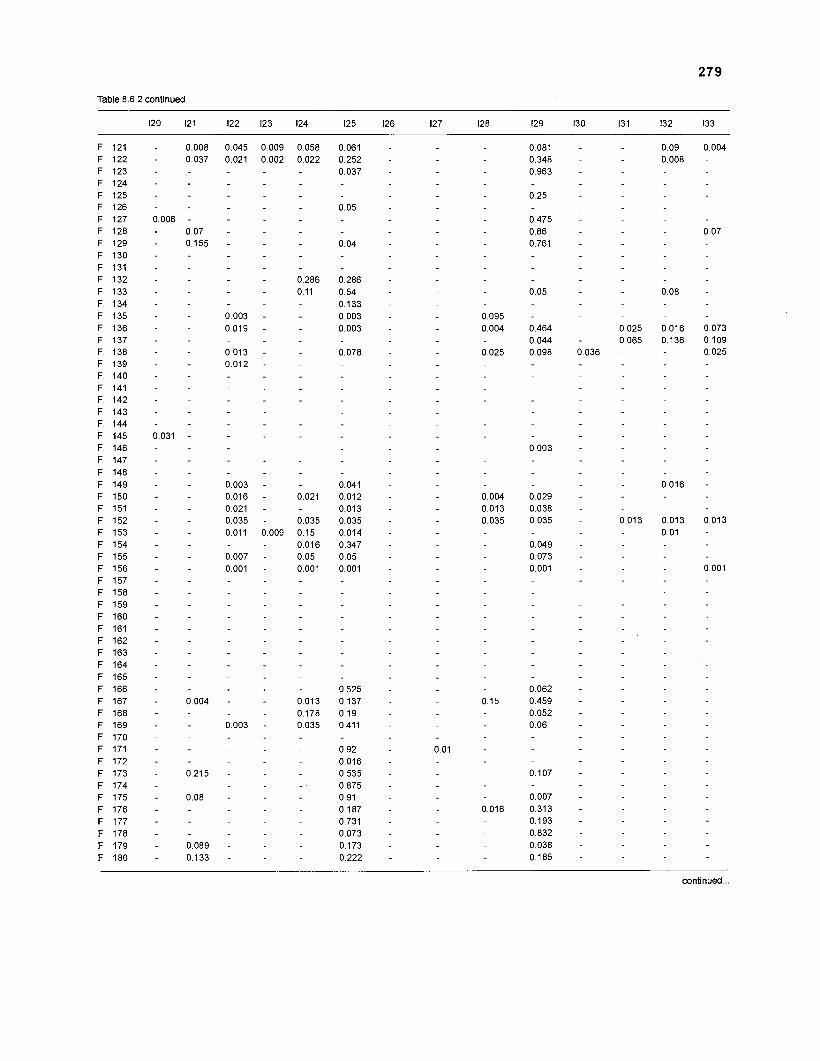
279
Table 8.6.2 continued
- continued ...
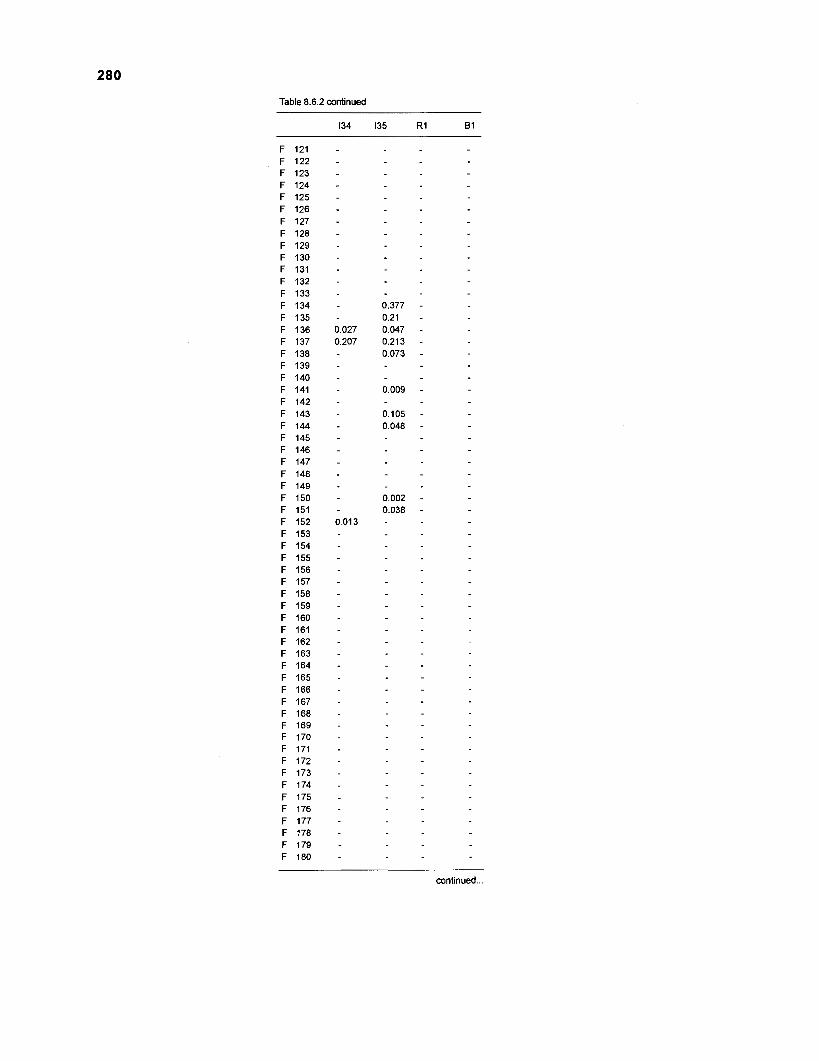
Table 8.6.2 continued
continued ...
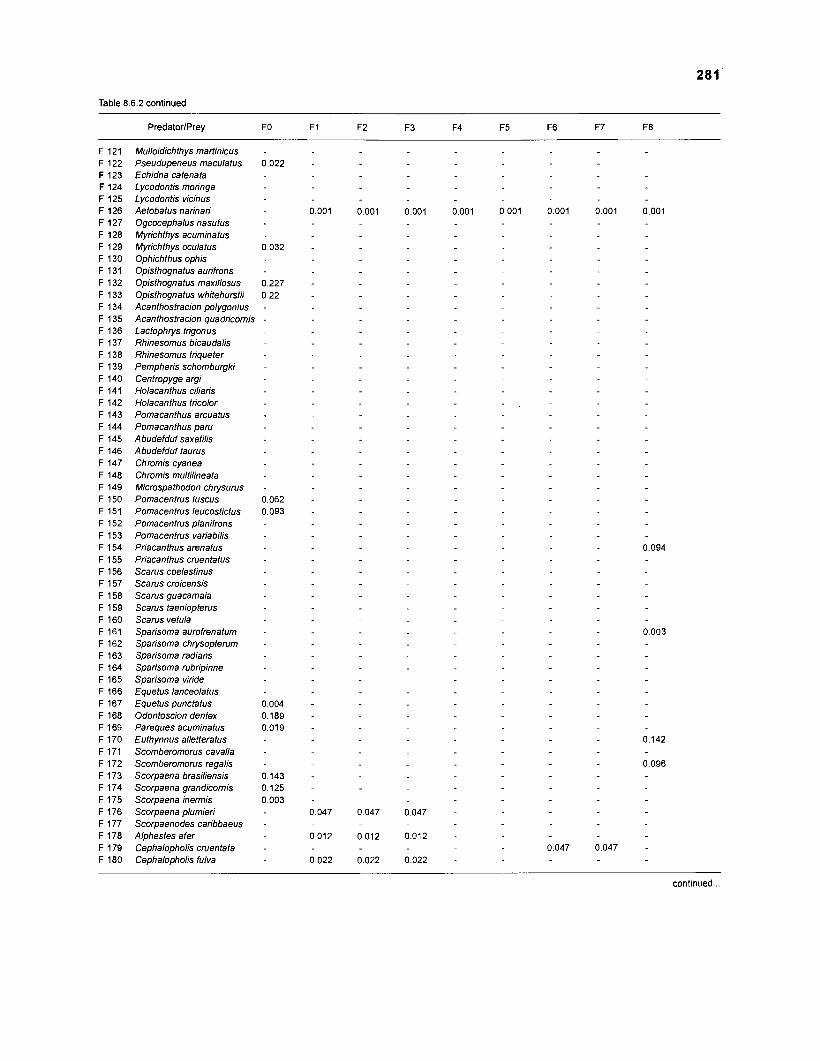
Table 8.6.2 continued
PredatorlPrey FO F1 F2 F3 F4 F5 F6 F7 F8
Mulloidichthys martinicus - Pseudupeneus maculatus 0.022 Echidna catenata Lycodontis moringa Lycodontis vicinus Aetobatus narinari Ogcocephalus nasutus Myrichthys acuminatus Myrichthys oculatus 0.032 Ophichthus ophis Opisthognatus aurifrons - Opisthognatus maxillosus 0.227 Opisthognatus whitehurstii 0.22 Acanthostracion polygonius - Acanthostracion quadricomis - Lactophrys trigonus Rhinesomus bicaudalis Rhinesomus triqueter Pempheris schomburgki Centropyge argi Holacanthus ciliaris Holacanthus tricolor Pomacanthus arcuatus Pomacanthus paru Abudefduf saxatilis Abudefduf taurus Chromis cyanea Chromis multilineata Microspathodon chrysurus Pomacentrus fuscus Pomacentrus leucostictus Pomacentrus planifrons Pomacentrus variabilis Priacanthus arenatus Priacanthus cmentatus Scarus coelestinus Scams croicensis Scarus guacamaia Scarus taeniopterus Scarus vetula Sparisoma aurofrenatum Sparisoma chrysopterum Sparisoma radians Sparisoma rubripinne Sparisoma viride Equetus lanceolatus Equetus punctatus Odontoscion dentex Pareques acuminatus Euthynnus alletteratus Scomberomorus cavalla Scomberomorus regalis Scorpaena brasiliensis Scorpaena grandicornis Scorpaena inermis Scorpaena plumieri Scorpaenodes caribbaeus Alphestes afer Cephalopholis cmentata Cephalopholis fulva
continued ...
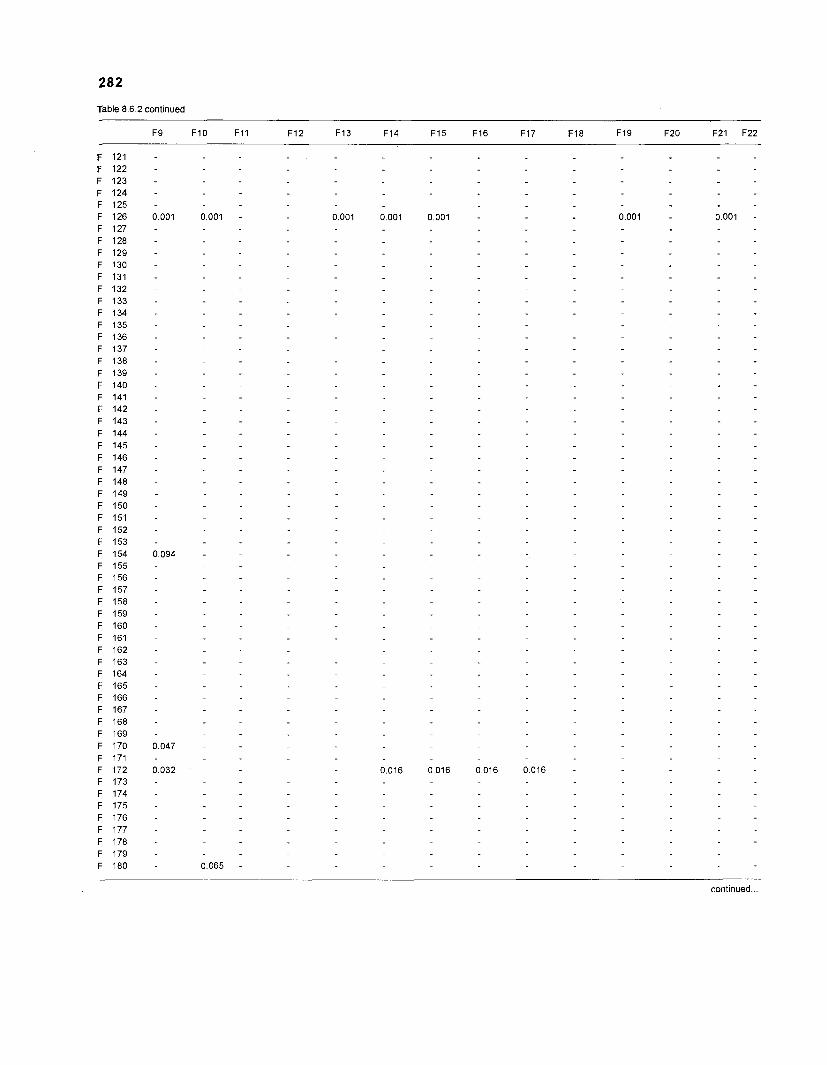
282
Table 8.6.2 continued
continued

Table 8.6.2 continued
continued
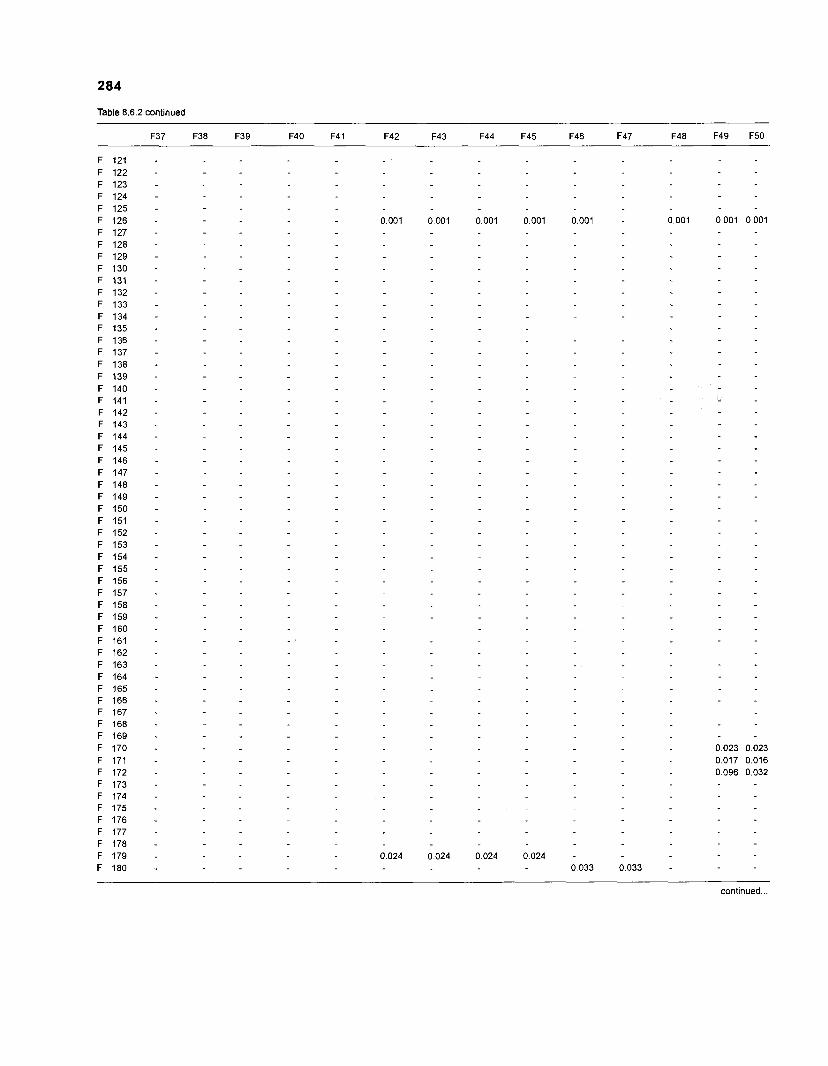
284
Table 8.6.2 continued
continued ...
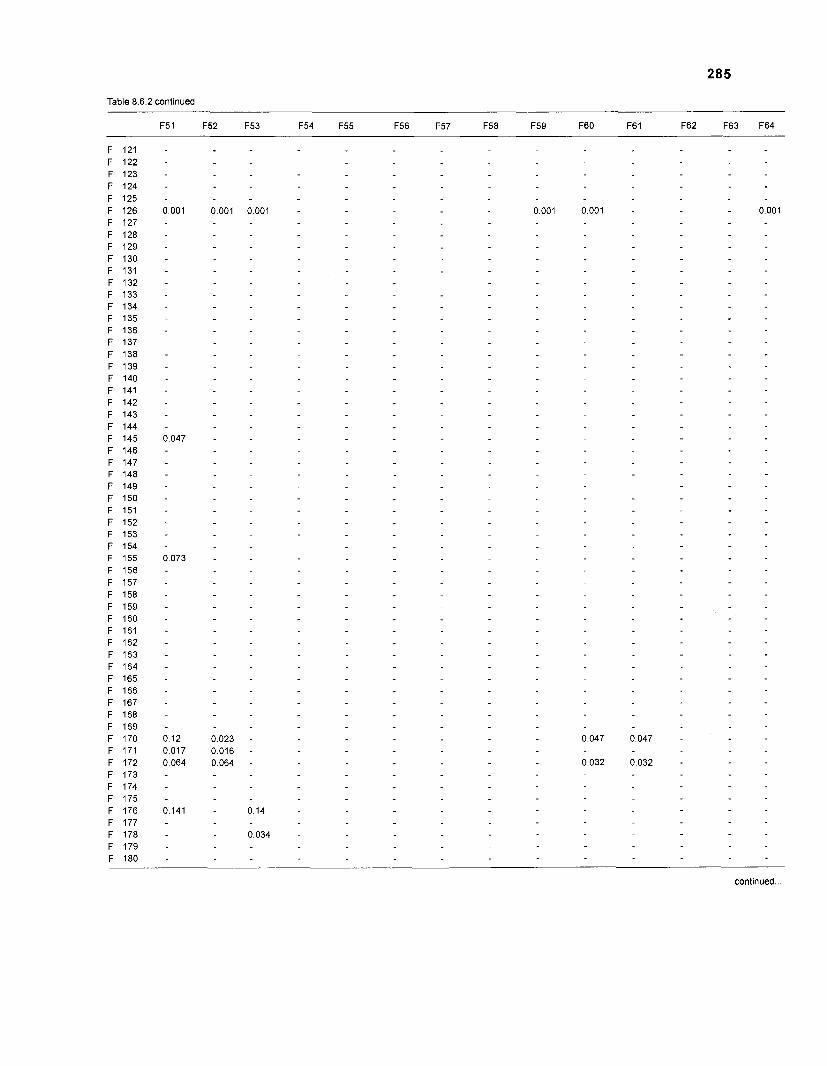
Table 8.6.2 continued
continued ...
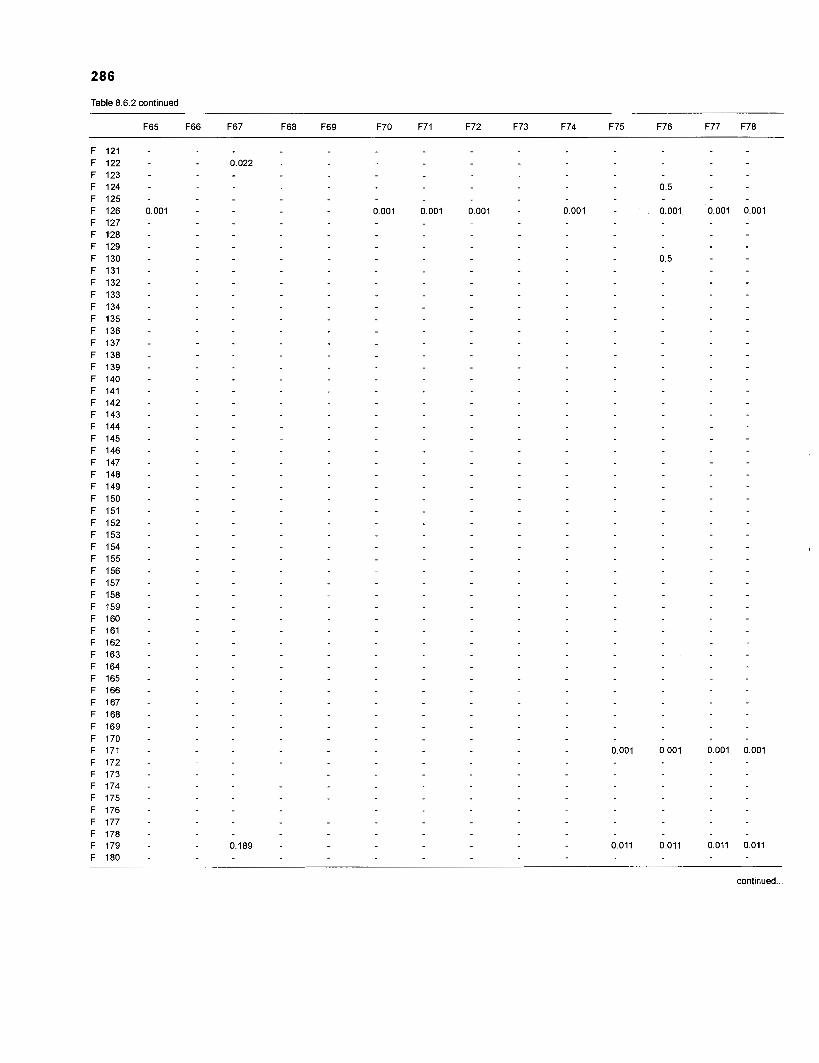
Table 8.6.2 continued
F65 F66 F67 F68 F69 F70 F71 F72 F73 F74 F75 F76 F77 F78
continued ...
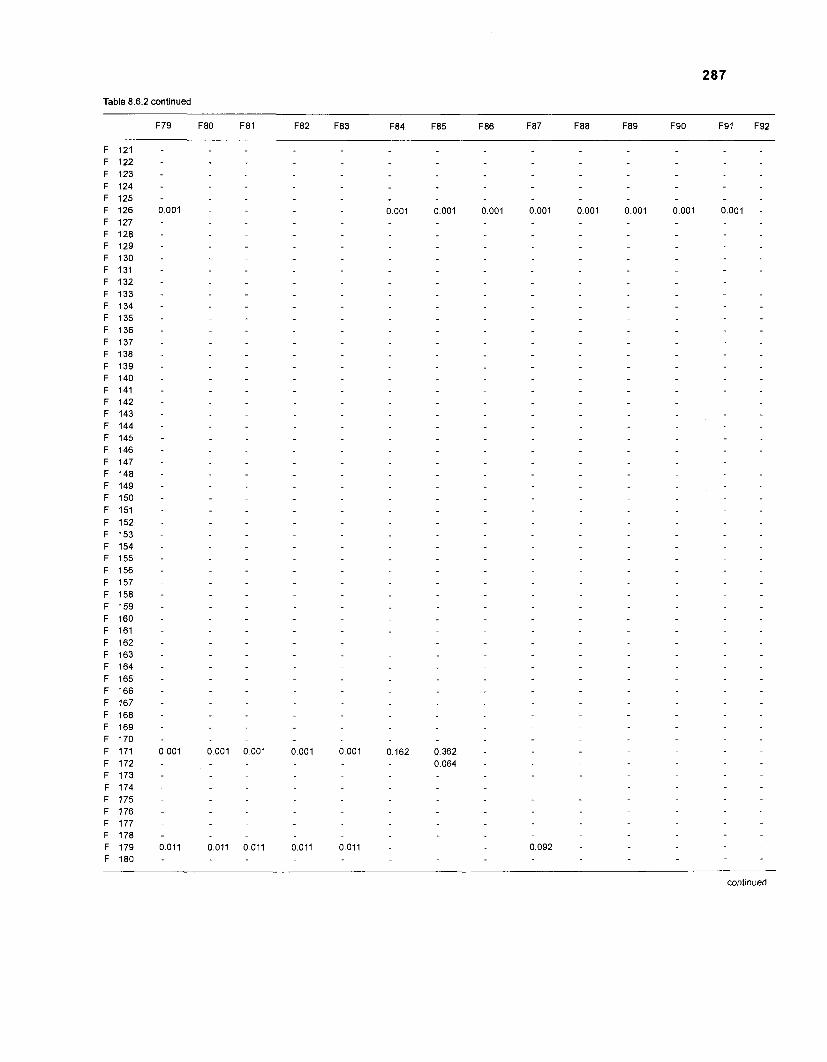
287
Table 8.6.2 continued
continued ...
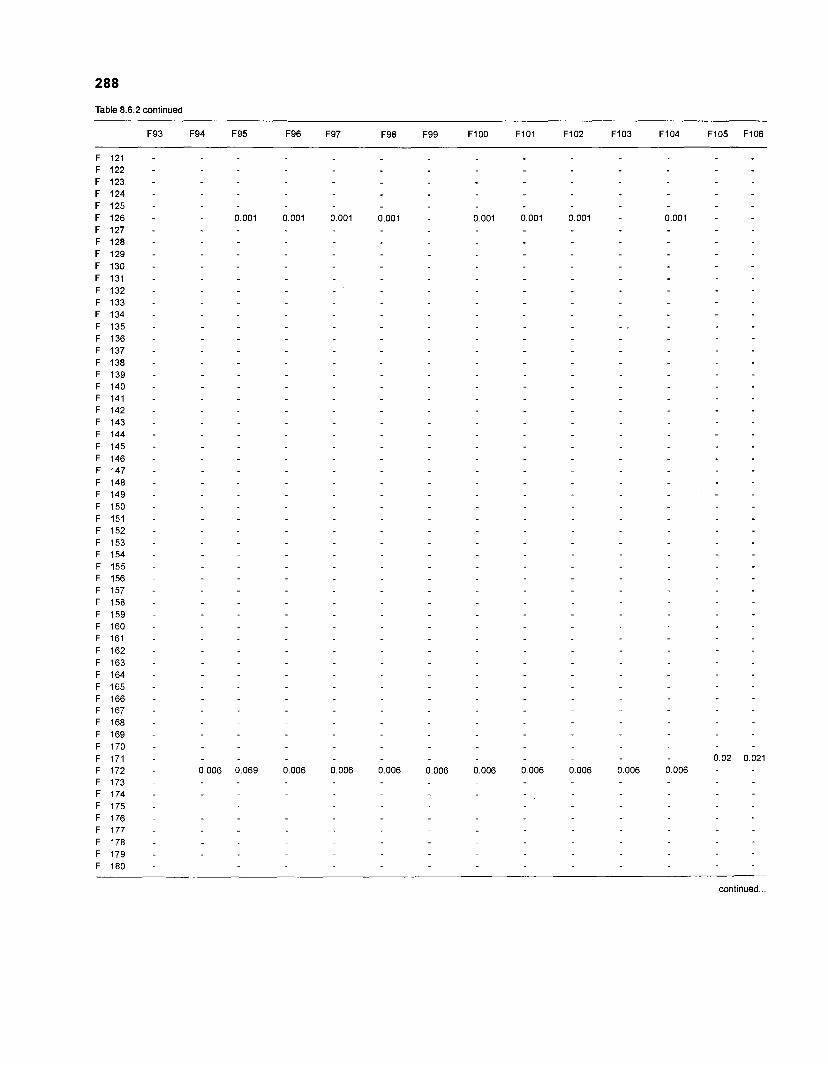
Table 8.6.2 continued
F93 F94 F95 F96 F97 F98 F99 FlOO FlOl F102 F103 F104 F105 F106
continued ...
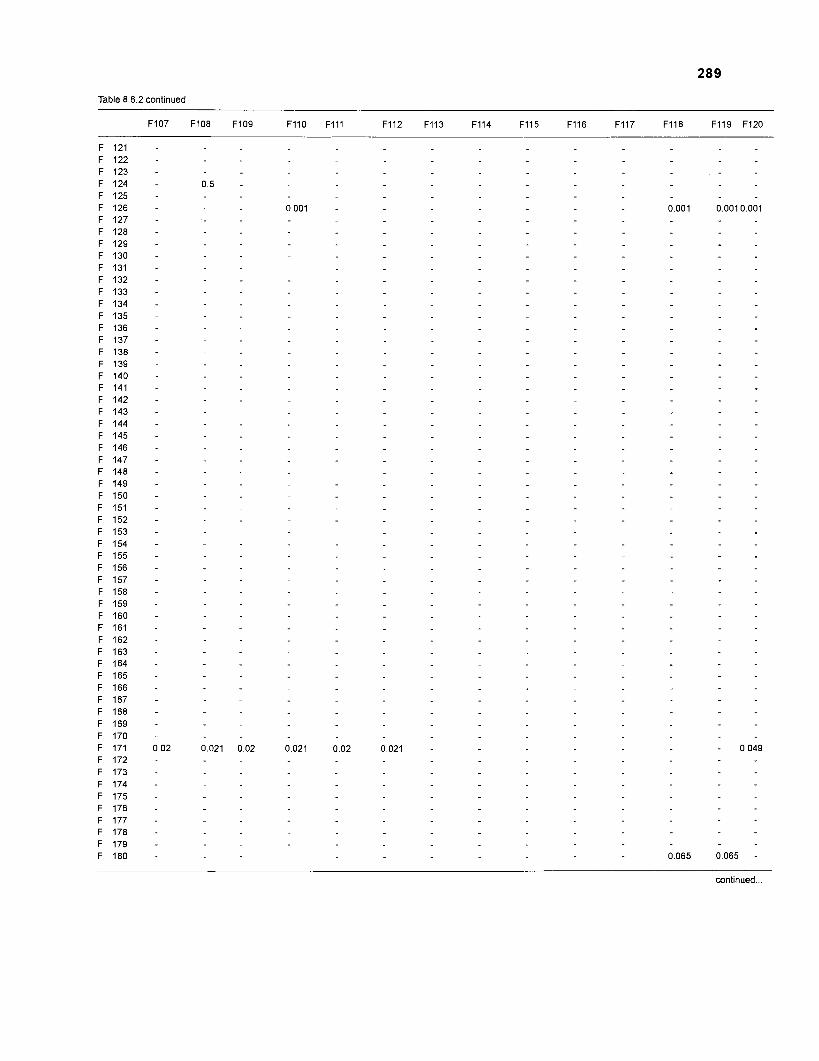
289
Table 8.6.2 continued
F107 F108 FA09 Fl lO F l l l F112 F113 F114 F115 F116 F117 F118 F 1 1 9 F 1 2 0
continued ...
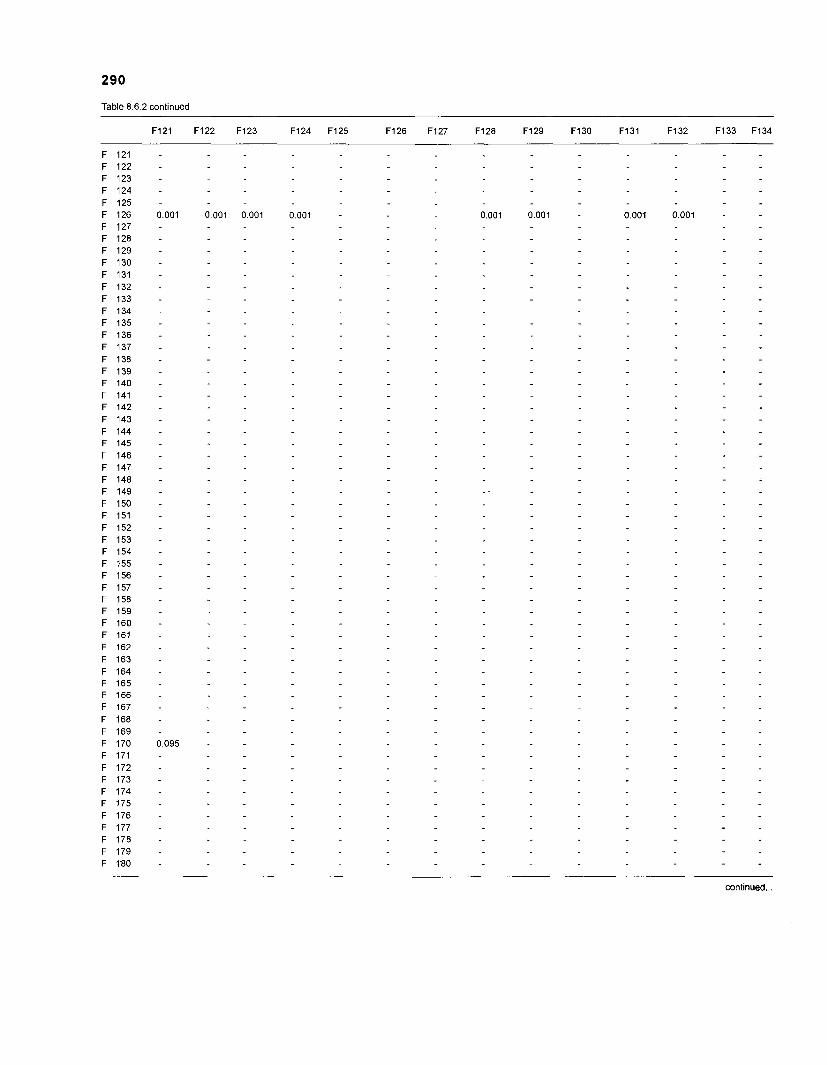
Table 8.6.2 continued
continued ...
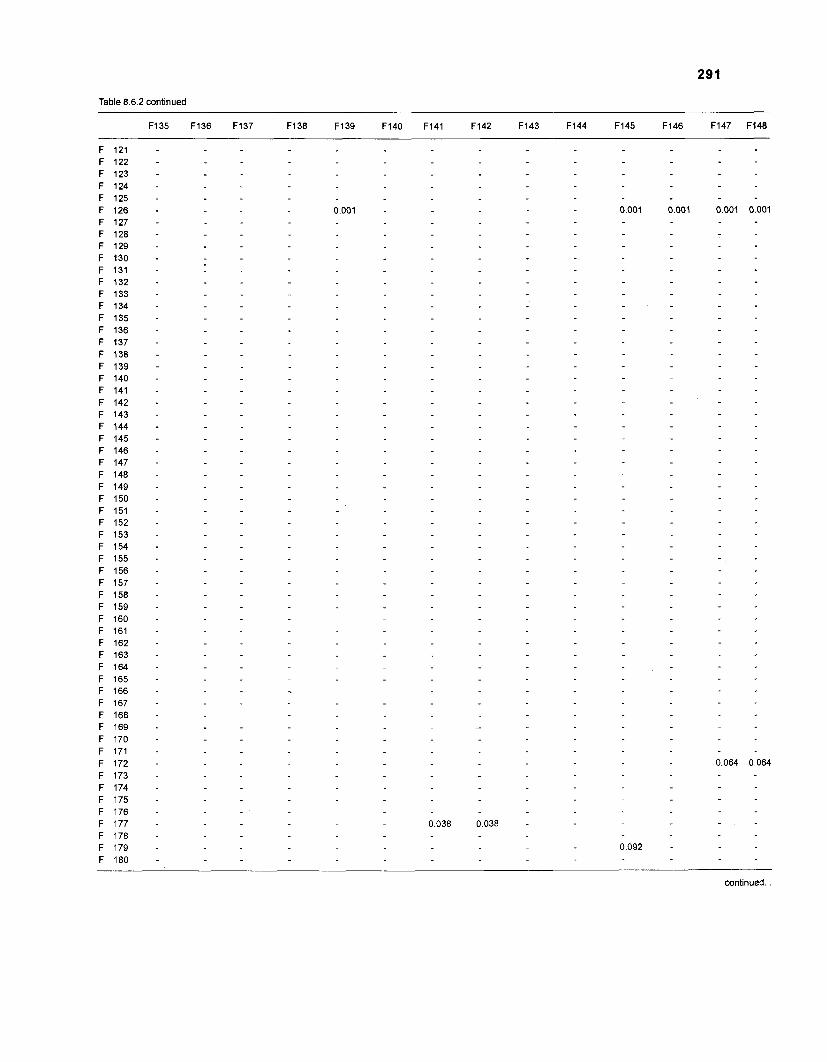
Table 8.6.2 continued
F 121 - F 1 2 2 - F 1 2 3 - F 1 2 4 - F 1 2 5 - F 1 2 6 - 0,001 - 0.001 0.001 0.001 0.001 F 1 2 7 - F 1 2 8 - F 1 2 9 - F 1 3 0 - F 131 - F 1 3 2 - F 1 3 3 - F 1 3 4 - F 1 3 5 - F 1 3 6 - F 1 3 7 - F 138 - F 1 3 9 - F 1 4 0 - F 141 - F 1 4 2 - F 1 4 3 - F 1 4 4 - F 1 4 5 - F 1 4 6 - F 1 4 7 - F 148 - F 149 - F 1 5 0 - F 1 5 1 - F 1 5 2 - F 1 5 3 - F 1 5 4 - F 1 5 5 - F 1 5 6 - F 1 5 7 - F 1 5 8 - F 1 5 9 - F 1 6 0 - F 161 - F 1 6 2 - F 1 6 3 - F 1 6 4 - F 1 6 5 - F 1 6 6 - F 1 6 7 - F 1 6 8 - F 1 6 9 - F 1 7 0 - F 171 - F 1 7 2 - 0.064 0,064 F 1 7 3 - F 1 7 4 - F 1 7 5 - F 1 7 6 - F 1 7 7 - 0.038 0.038 - F 1 7 8 - F 1 7 9 - 0.092 - F 1 8 0 -
continued ...
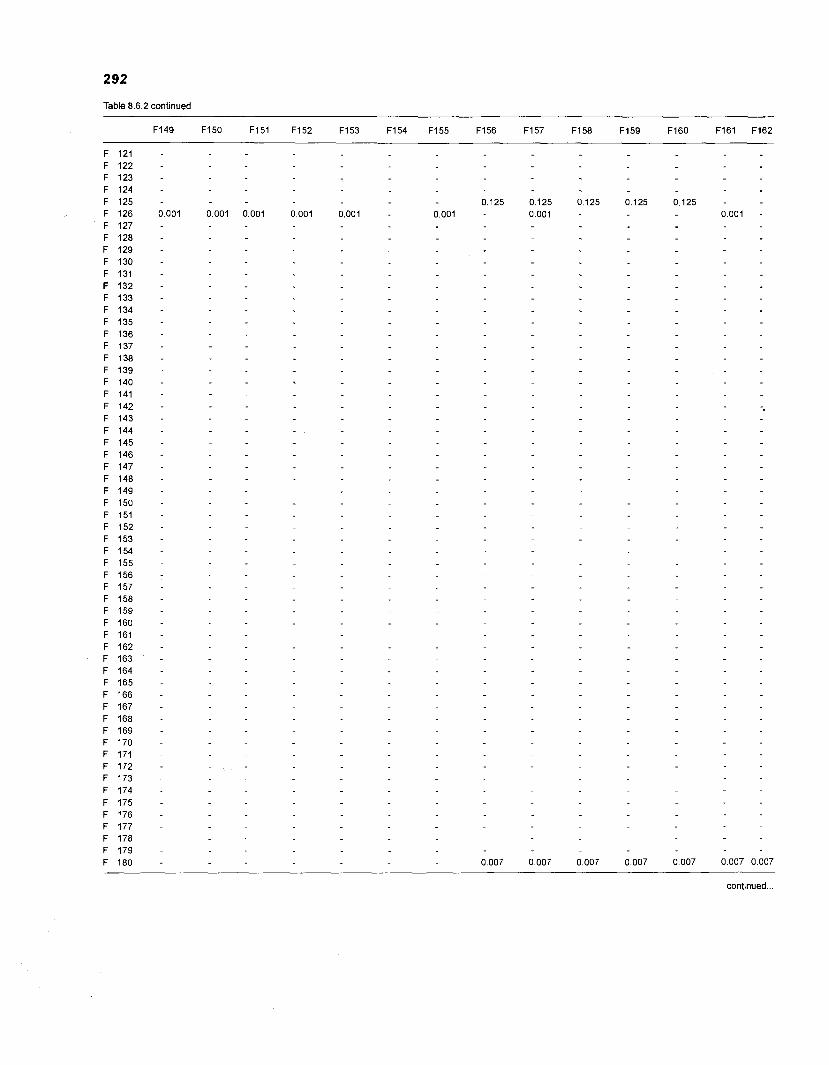
Table 8.6.2 continued
continued ...
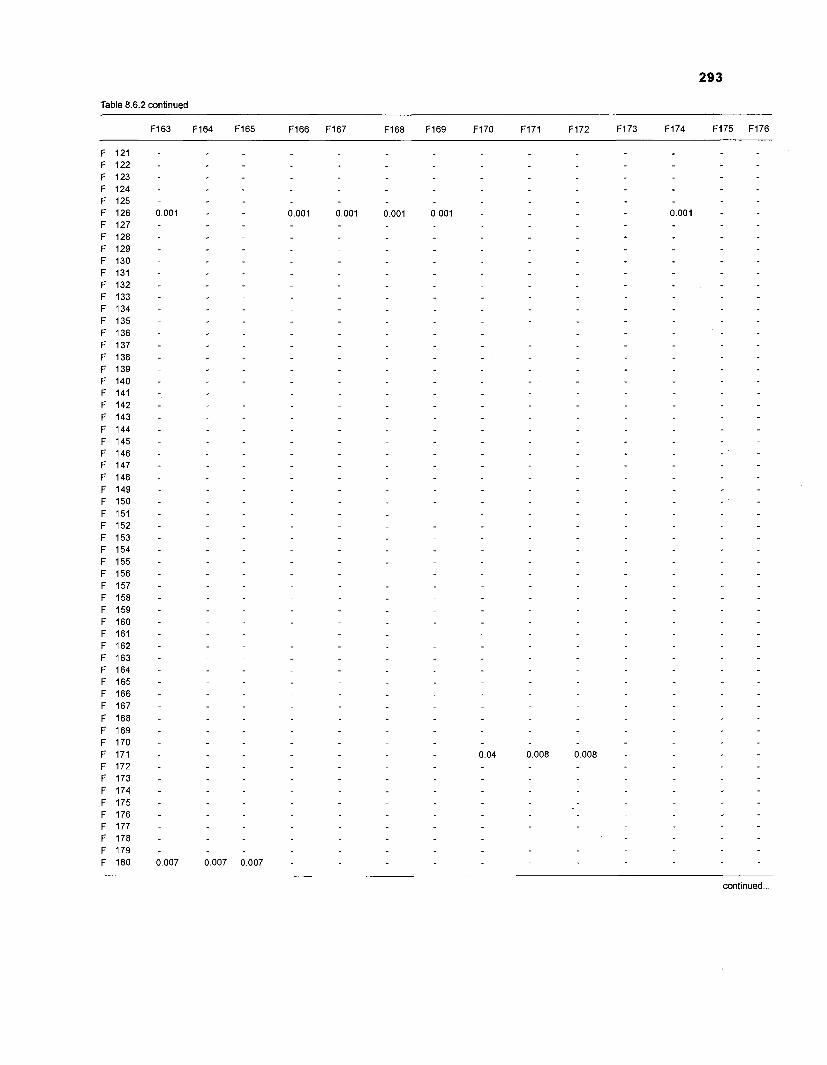
Table 8.6.2 continued
continued ...
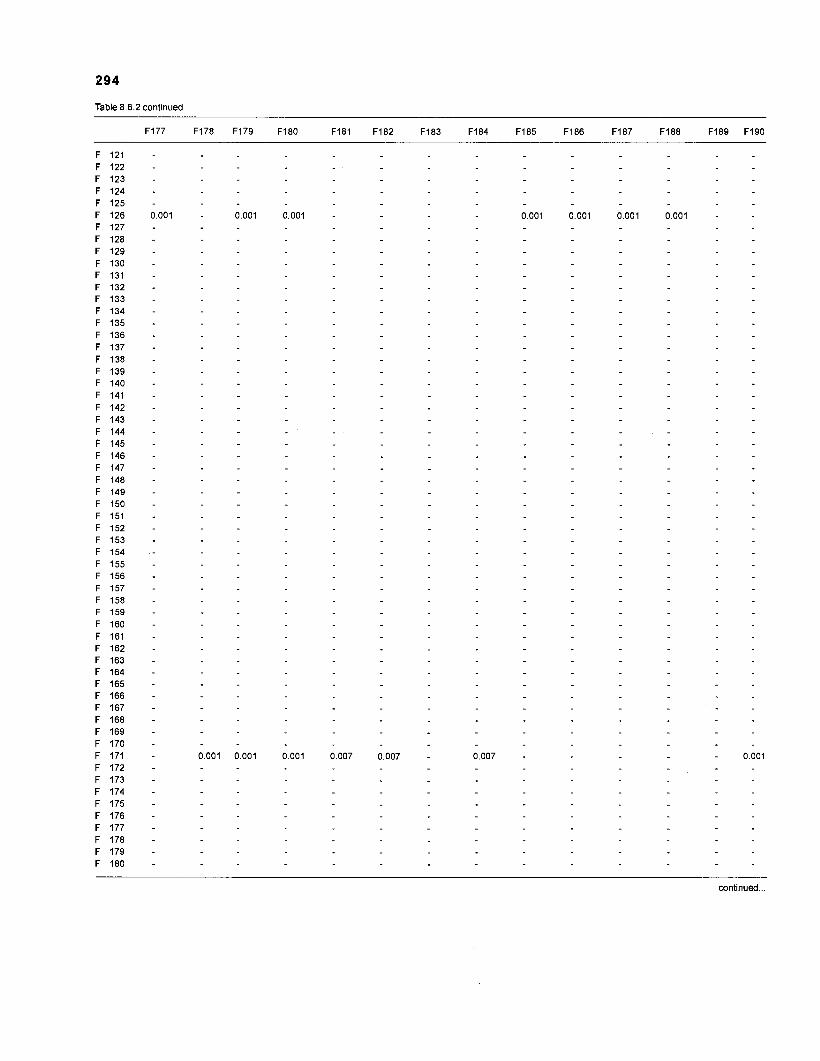
Table 8.6.2 continued
continued ...
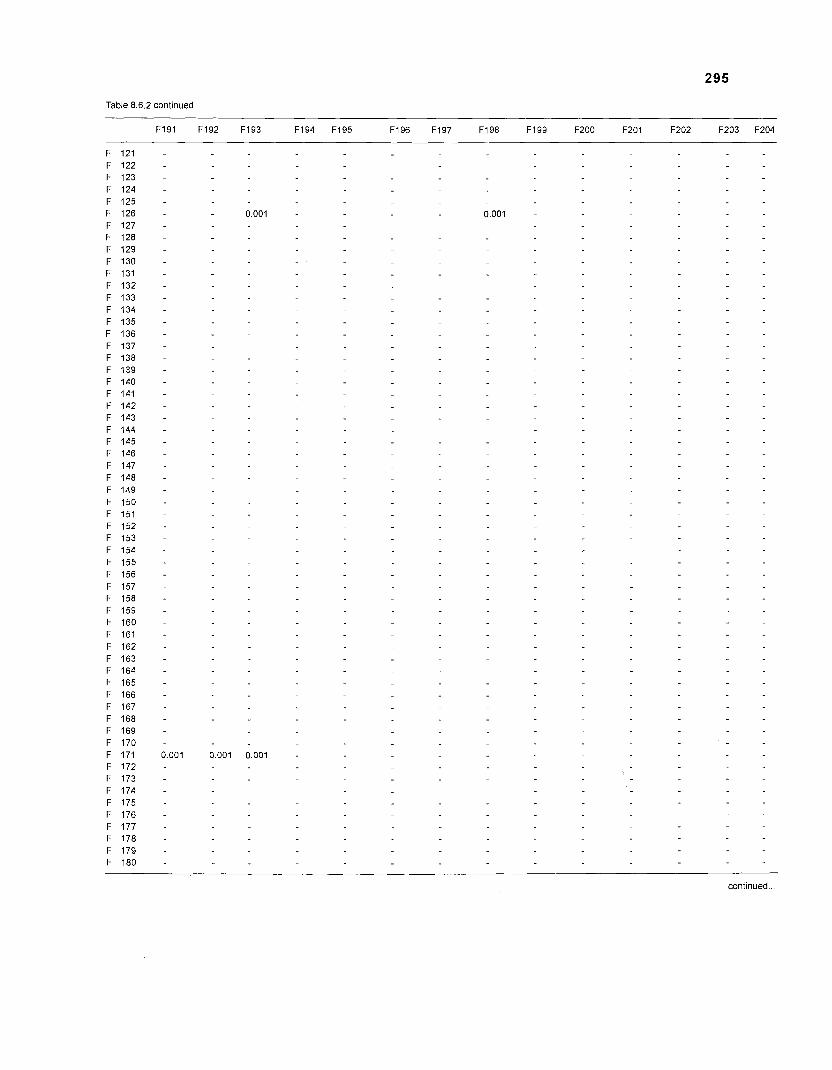
Table 8.6.2 continued
F191 F192 F193 F194 F195 F196 F197 FA98 F199 F200 F201 F202 F203 F204
continued ...
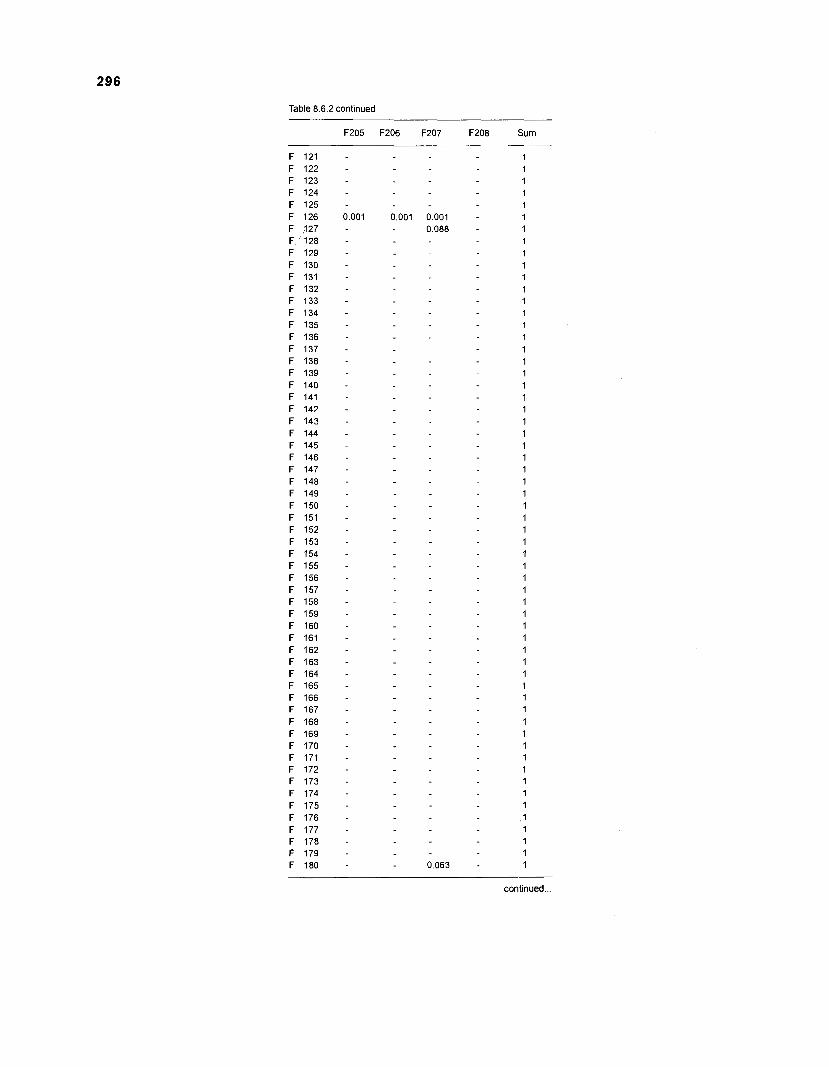
Table 8.6.2 continued
F205 F206 F207 F208 Sum
continued ...
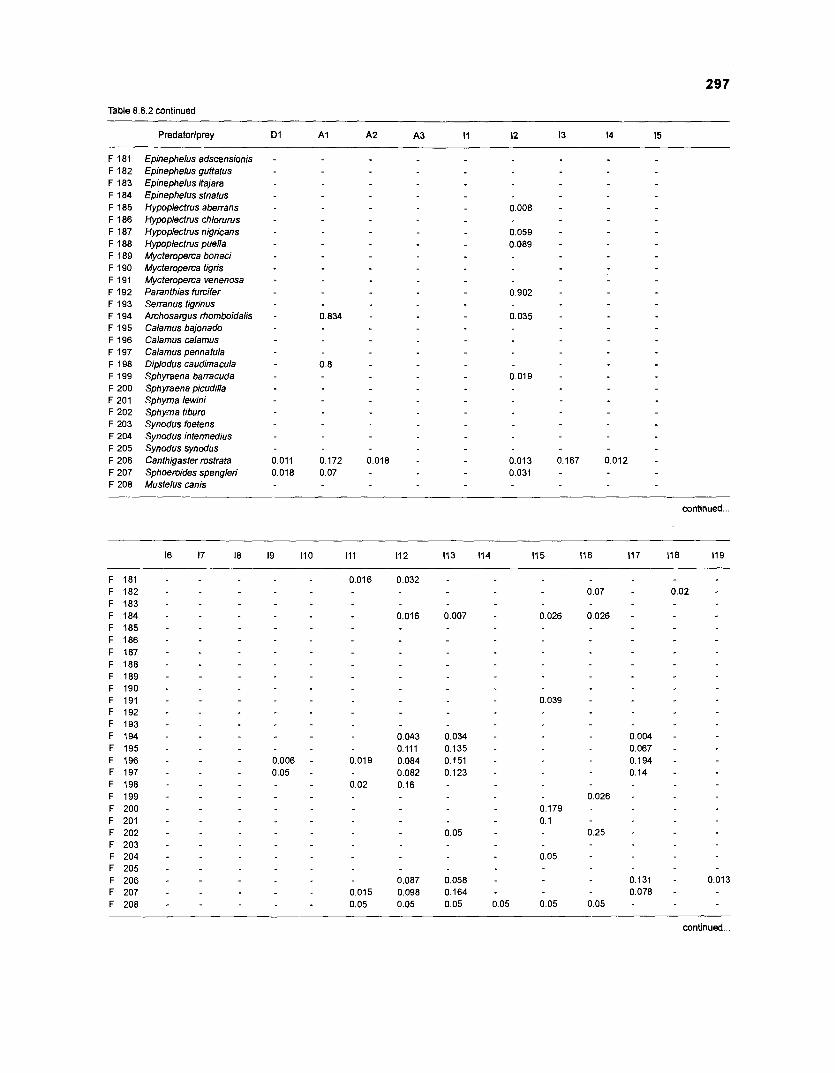
Table 8.6.2 continued
Epinephelus adscensionis Ephephelus guttatus Epinephelus itajara Epinephelus striatus Hypoplectrus aberrans Hypoplectrus chlorurus Hypoplectrus nigricans Hypoplectrus puella Mycteroperca bonaci Mycteroperca tigris Mycteroperca venenosa Paranthias furcifer Serranus tigrinus Archosargus rhomboidalis Calamus bajonado Calamus calamus Calamus pennatula Diplodus caudimacula Sphyraena barracuda Sphyraena picudilla Sphyma lewini Sphyma tiburo Synodus foetens Synodus intermedius Synodussynodus Canthigaster rostrata Sphoeroides spengleri Mustelus canis
continued ...
continued ...
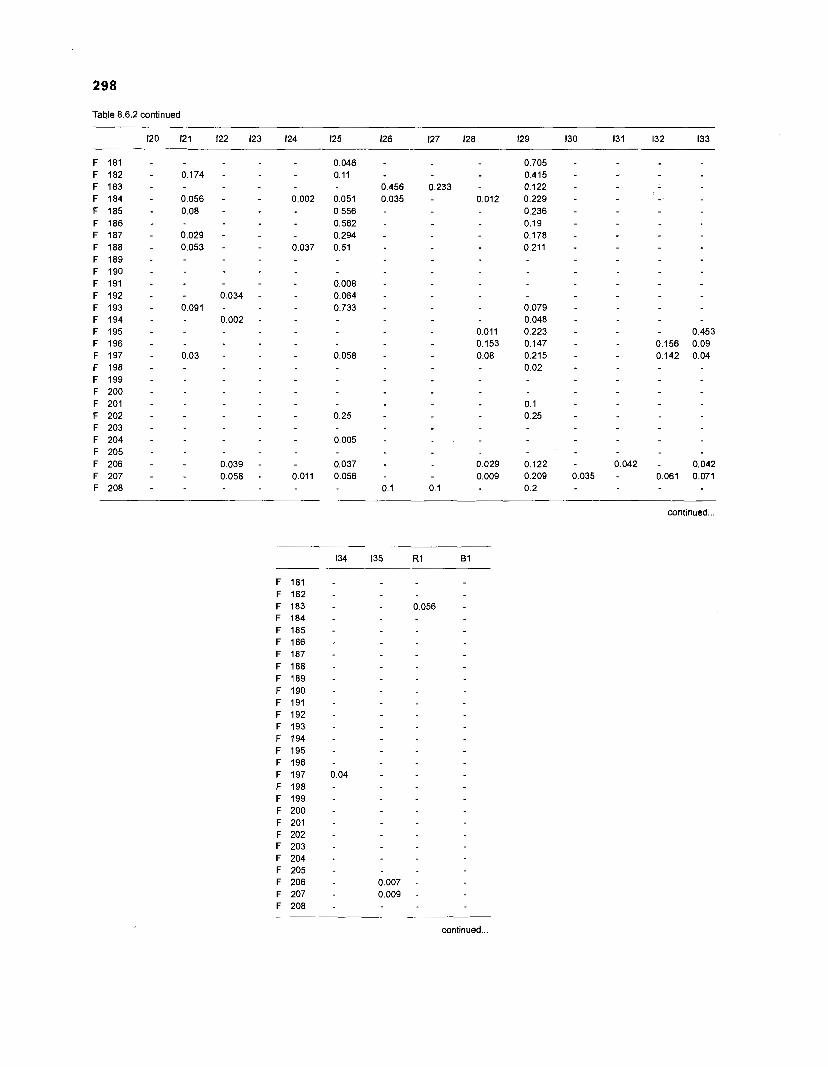
298
Table 8.6.2 continued
continued ...
continued ...
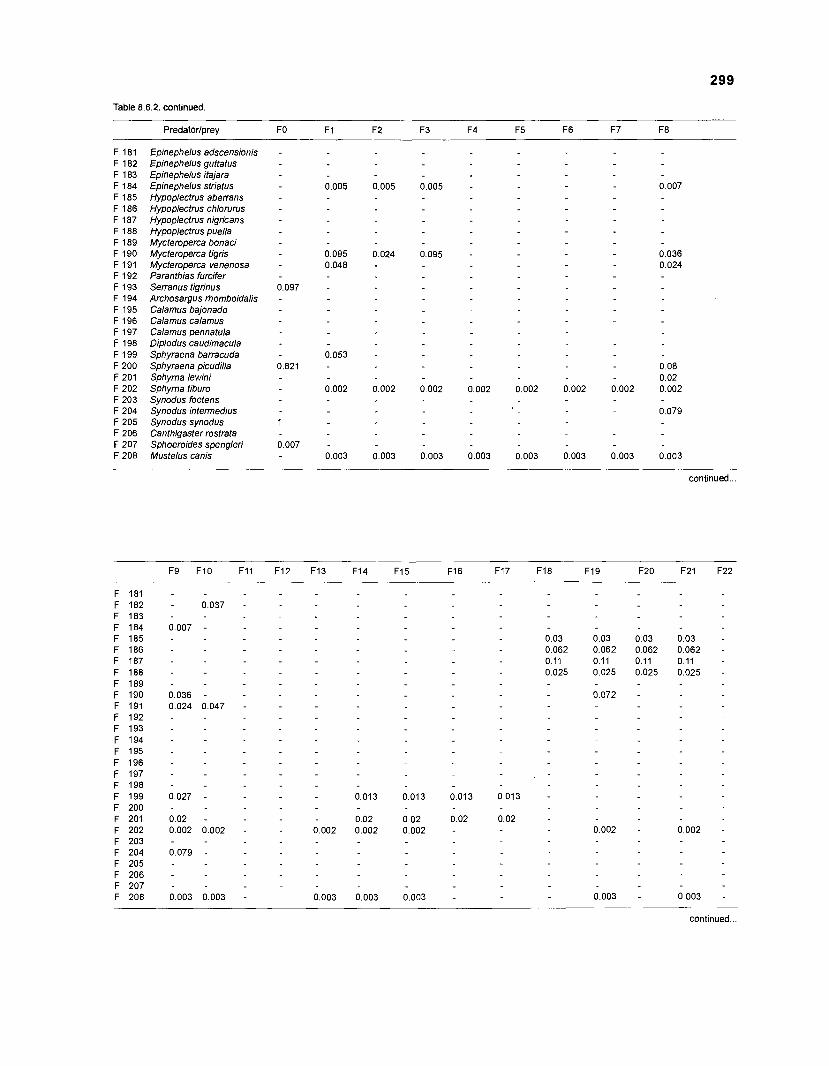
Table 8.6.2. continued.
Predatorlprey FO F1 F2 F3 F4 F5 F6 F7 F8
Epinephelus adscensionis Epinephelus guttatus Epinephelus itajara Epinephelus striatus Hypoplectrus aberrans Hypoplectrus c h l o m s Hypoplectrus nigricans Hypoplectrus puella Mycteroperca bonaci Mycteroperca tigris Mycteroperca venenosa Paranthias furcifer Serranus tigrinus Archosargus rhomboidalis Calamus bajonado Calamus calamus Calamus pennatula Diplodus caudimacula Sphyraena barracuda Sphyraena picudilla Sphyrna lewini Sphyrna tiburo Synodus foetens Synodus intermedius Synodussynodus Canthigaster rostrata Sphoeroides spengleri Mustelus canis
continued ...
continued ...
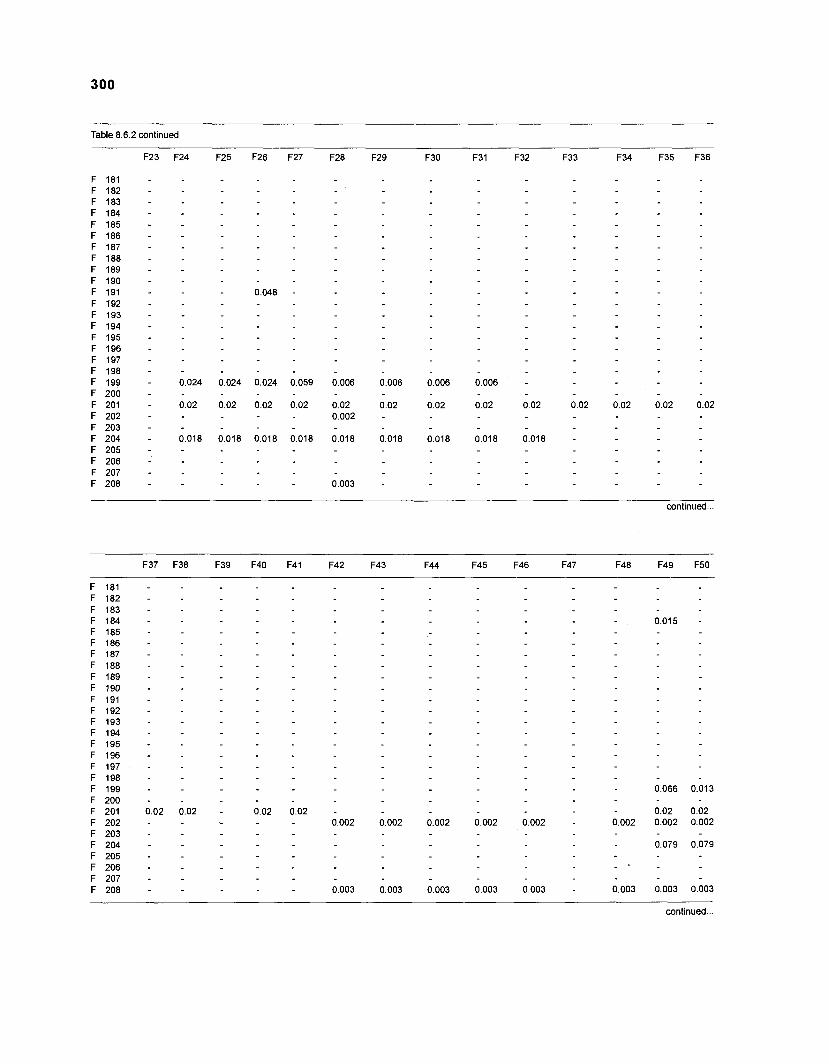
Table 8.6.2 continued
continued ...
continued ...
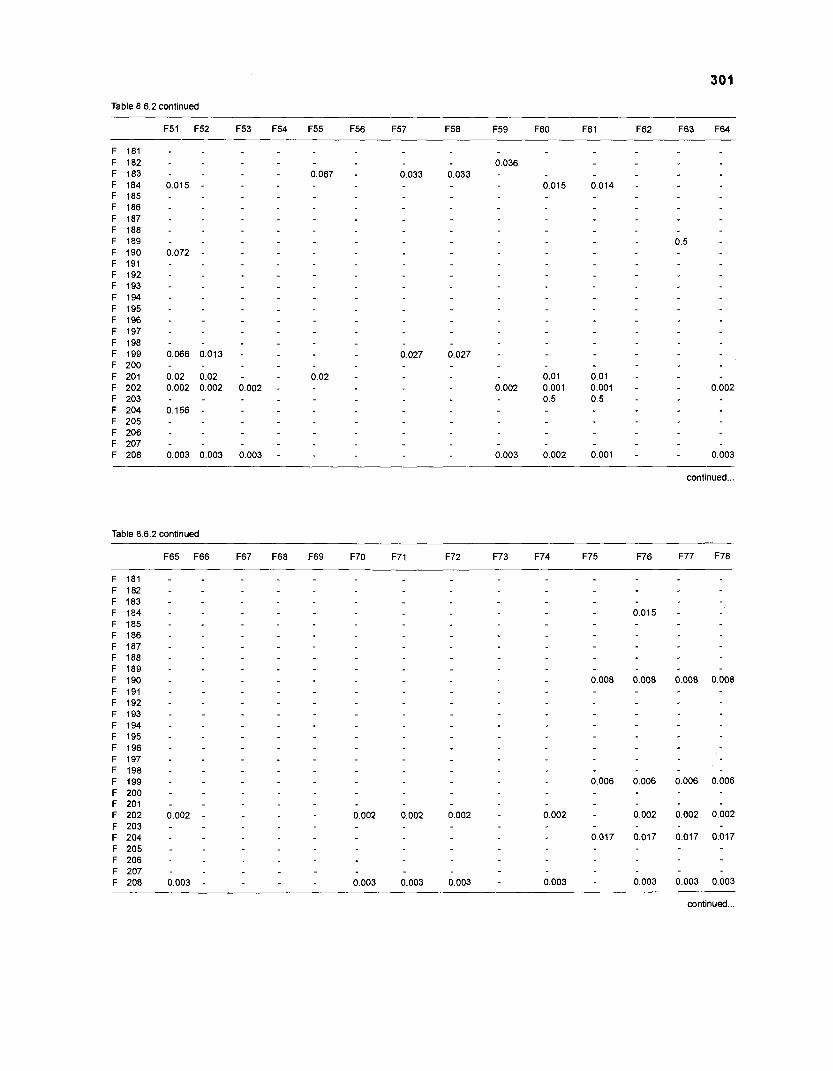
301
Table 8.6.2 continued
continued ...
Table 8.6.2 continued
continued ...
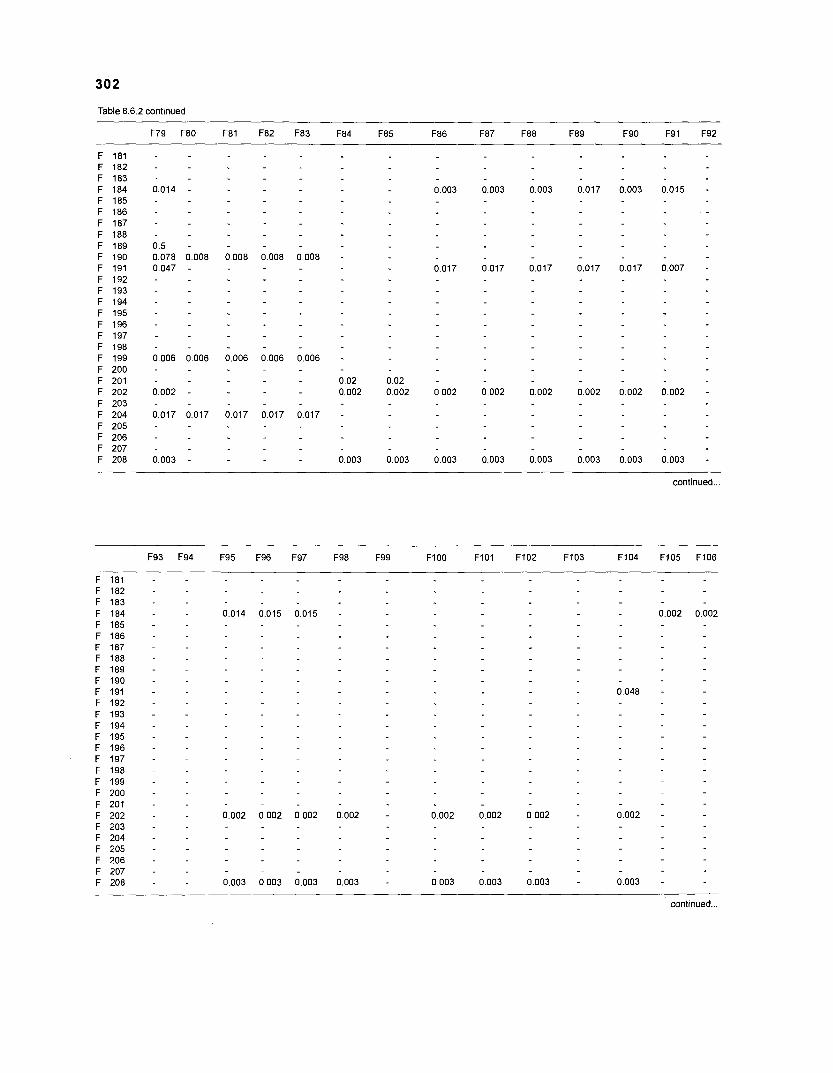
302
Table 8.6.2 continued
continued ...
F97 F98 F99 FlOO FlOl F102 F103 F104 F105 F106
continued ...
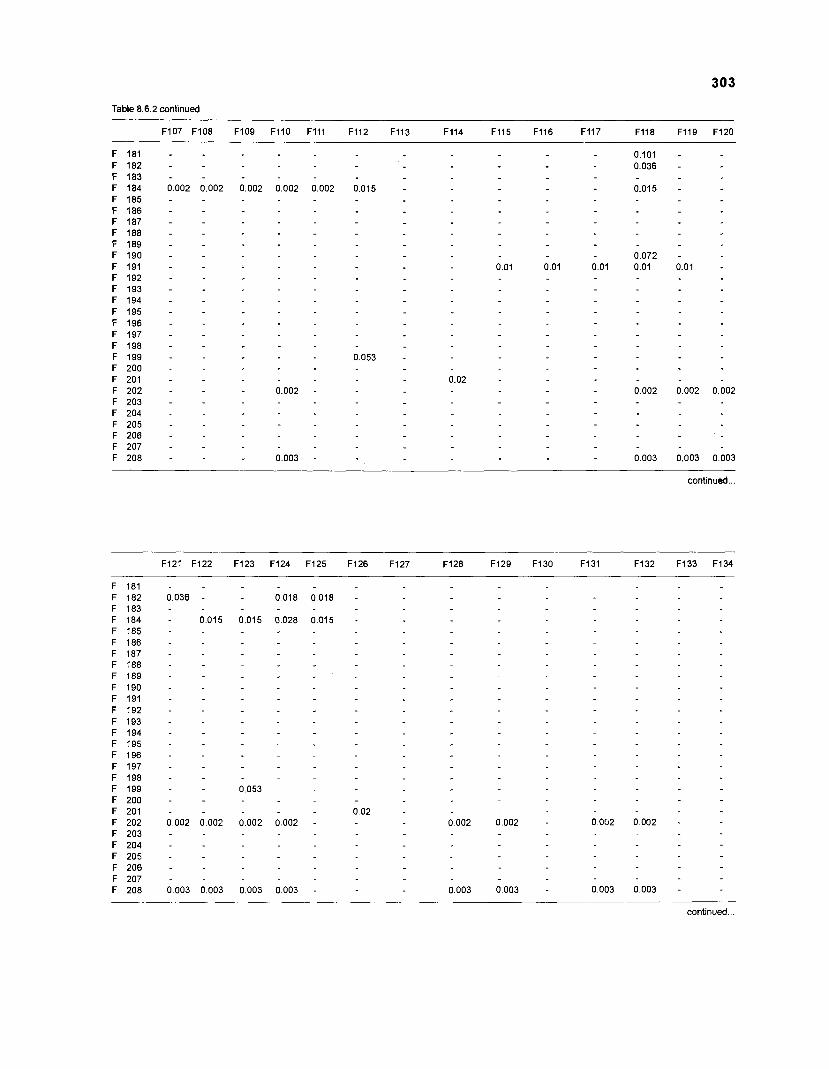
Table 8.6.2 continued
F107 F108 F109 F110 F l l l F112 F113 F114 F115 F116 F117 F118 F119 F120
continued.. .
continued ...
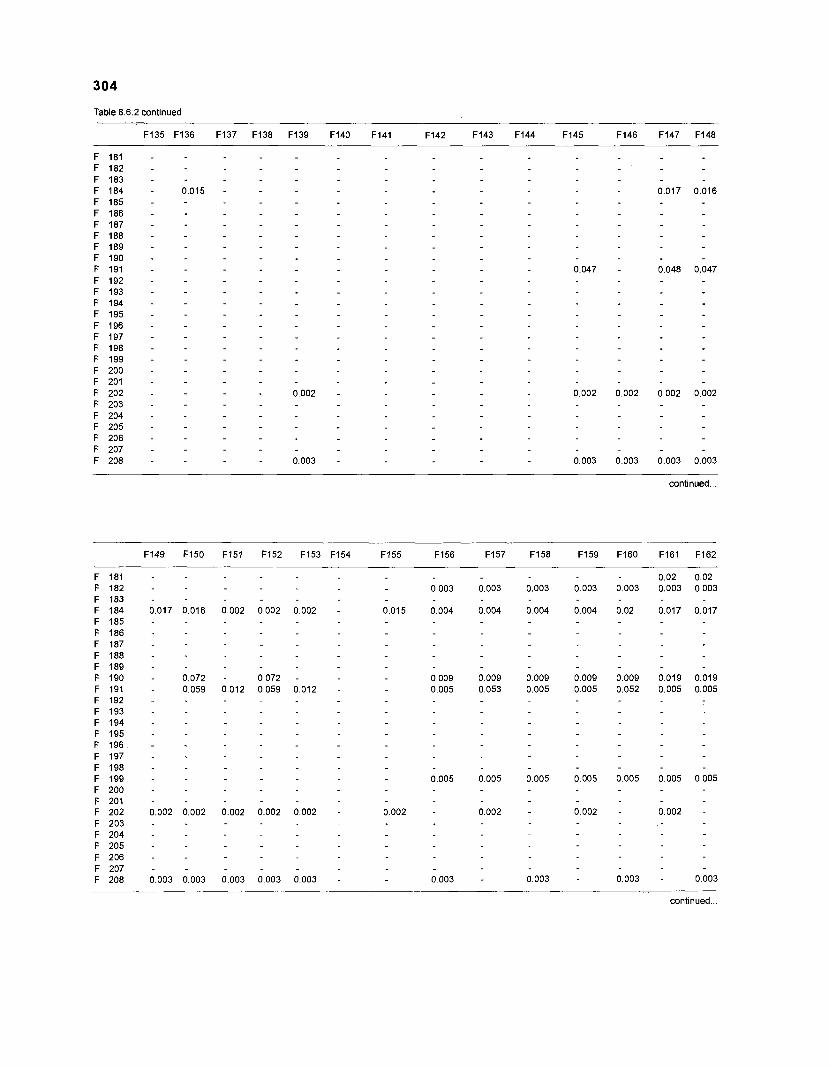
304
Table 8.6.2 continued
continued ...
continued ...
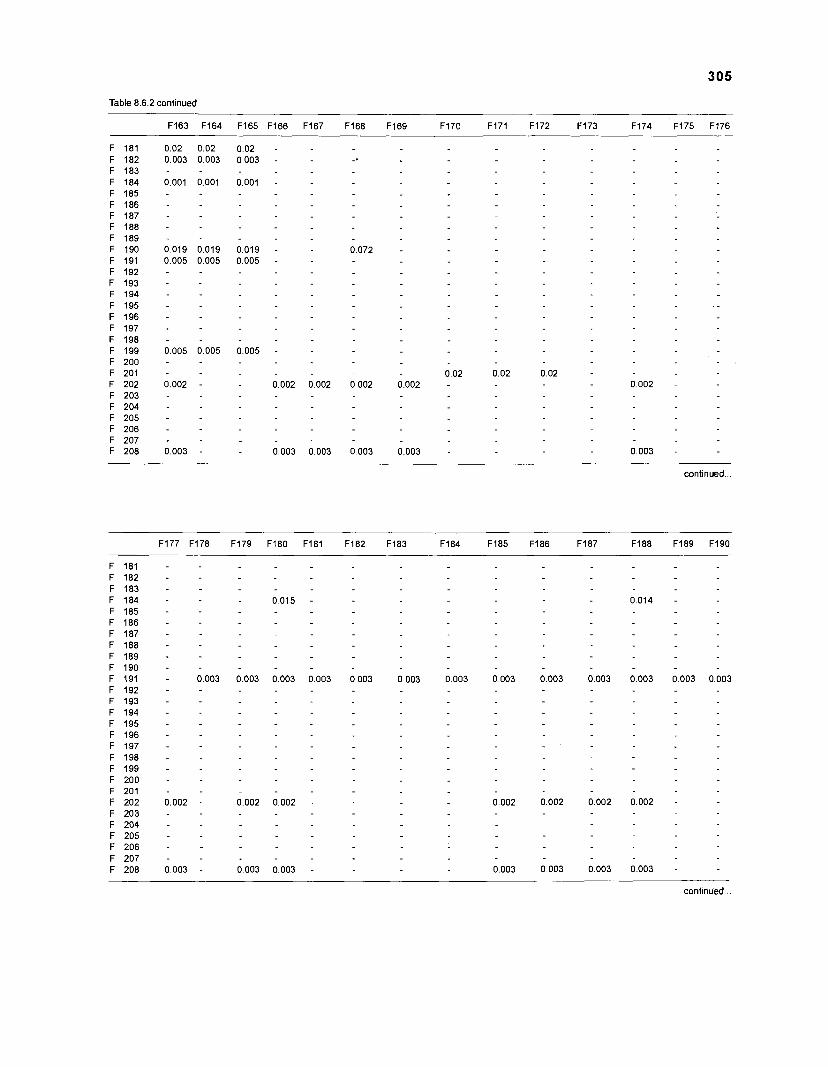
Table 8.6.2 continued
continued
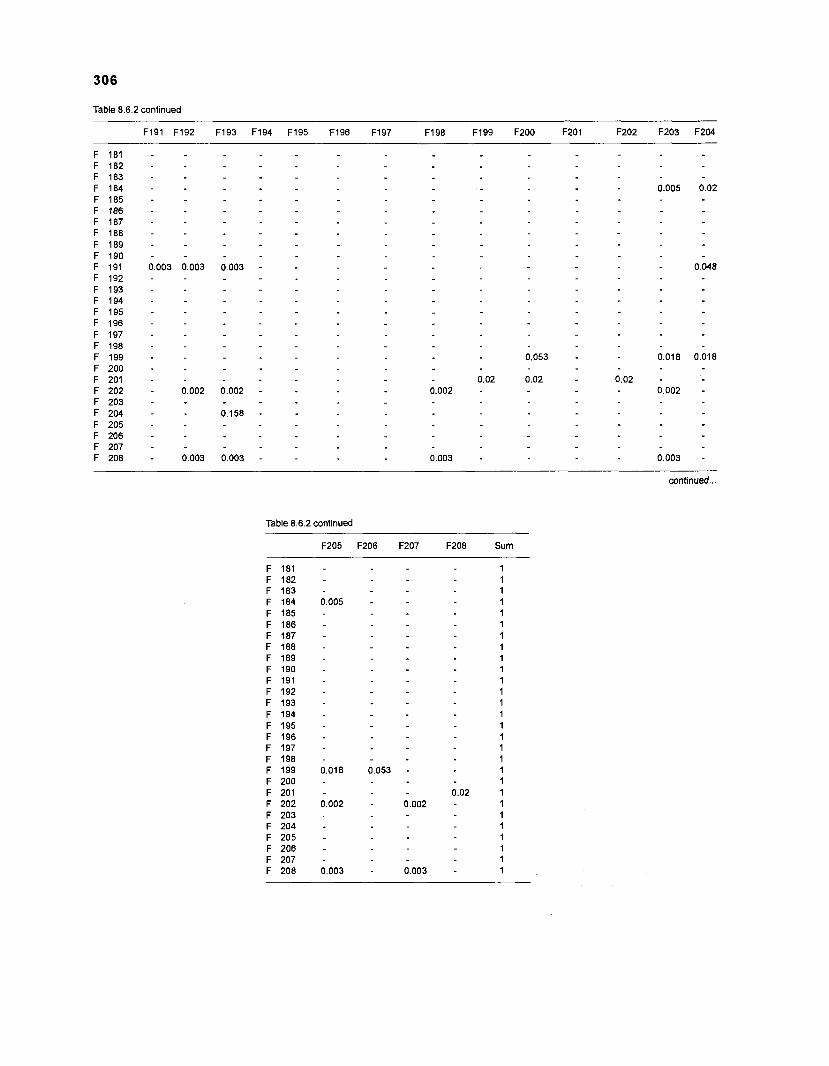
306
Table 8.6.2 continued
continued ...
Table 8.6.2 continued
F205 F206 F207 F208 Sum
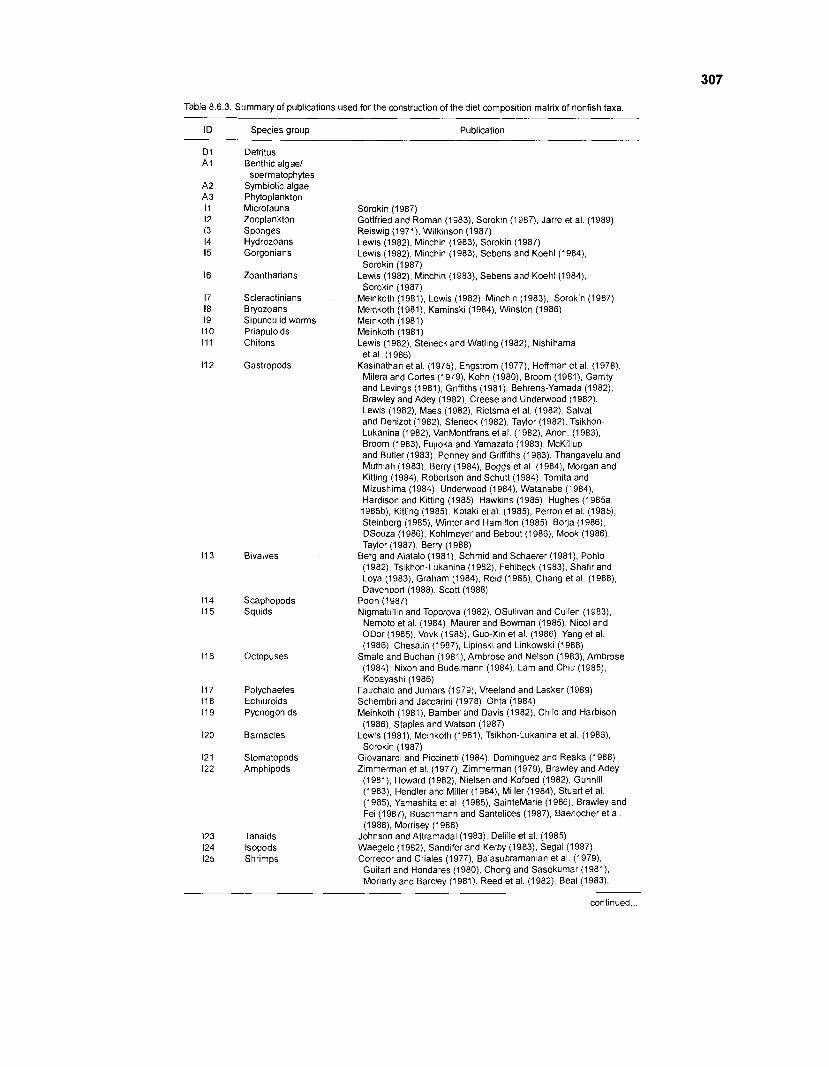
Table 8.6.3. Summary of publications used for the construction of the diet composition matrix of nonfish taxa
Species group
Detritus Benthic algael sperrnatophytes
Symb~otic algae Phytoplankton Microfauna Zooplankton Sponges Hydrozoans Gorgonians
Zoantharians
Scleractinians Bryozoans Sipunculid worms Priapulolds Chitons
Gastropods
11 3 Bivalves
11 4 Scaphopods 11 5 Squids
11 6 Octopuses
11 7 Polychaetes 11 8 Echiuroids 11 9 Pycnogonlds
120 Barnacles
121 Stornatopods 122 Amphipods
Tanaids lsopods Shrim~s
Publication
Sorokin (1987) Gottfried and Roman (1 983), Sorokin (1 987), Jarre et at. (1 989) Reiswig (1971). Wilkinson (1987) Lewis (1982), Minchin (1983), Sorokin (1987) Lewis (1982), Minchin (1983), Sebens and Koehl (1984), Sorokin (1 987)
Lewis (1982), Minchin (1983), Sebens and Koehl (1984), Sorokin (1 987)
Meinkoth (1981), Lewis (1982), Minchin (1983), Sorokin (1987) Meinkoth (1981), Kaminski (1984), Winston (1986) Meinkoth (1981) Meinkoth (1981) Lewis (1982), Steneck and Watling (1982), Nishihama et at. (I 986)
Kasinathan et al. (1975), Engstrom (1977), Hoffman et at. (1978), Milera and Cortes (1979), Kohn (1980), Broom (1981), Garrity and Levings (1981), Grlffiths (1981), Behrens-Yamada (1982), Brawley and Adey (1982), Creese and Underwood (1982). Lewis (1 982), Maes (1 982), Rietsma et at. (1 982), Salvat and Denizot (1982), Steneck (1982), Taylor (1982), Tsikhon- Lukanina (1982), VanMontfrans et al. (1982), Anon. (1983), Broom (1983), Fujioka and Yamazato (1983), McKillup and Butler (1983), Penney and Grifflths (1983), Thangavelu and Muthiah (1983), Berry (1984), Boggs et at. (1984), Morgan and Kitting (1984), Robertson and Schutt (1984), Tornita and Mizushirna (1984), Underwood (1984), Watanabe (1984), Hardison and Kitting (1985), Hawkins (1985), Hughes (1985a, 1985b), Kitting (1985), Kotaki et al. (1985), Perron et al. (1985), Steinberg (1985), Winter and Hamllton (1985), Borja (1986), DSouza (1 986), Kohlmeyer and Bebout (1 986), Mook (1 986), Taylor (1 987), Berry (1 988)
Berg and Alatalo (1981), Schmid and Schaerer (1981), Pohlo (1982), Tsikhon-Lukanina (1982), Fehlbeck (1983), Shafir and Loya (1983). Graham (1984), Reid (1985), Chang et at. (1988), Davenport (1 988), Scott (1 988)
Poon (1 987) Nigmatullin and Toporova (1982), OSullivan and Cullen (1983), Nemoto et al. (1984), Maurer and Bowman (1985). Nlcol and ODor (1985), Vovk (1985), Guo-Xln et al. (1986), Yang et at. (1986), Chesalin (1987), Lipinsk~ and Linkowski (1988)
Smale and Buchan (1981), Ambrose and Nelson (1983), Ambrose (1984), Nixon and Budelrnann (1984), Lam and Chiu (1985), Kobayashi (1986)
Fauchald and Jurnars (1979), Vreeland and Lasker (1989) Schernbri and Jaccarini (1978), Ohta (1984) Meinkoth (1981), Bamber and Davis (1982), Chlld and Harbison (1986), Staples and Watson (1987)
Lewis (1981), Meinkoth (1981), Tsikhon-Lukan~na et at. (1986), Sorokin (1 987)
Giovanardi and Piccinetti (1 984), Dorninguez and Reaka (1 988) Zlmrnerman et al. (1977), Zirnrnerrnan (1979), Brawley and Adey
(1981), Howard (1982), Nielsen and Kofoed (1982), Gunnill (1983), Hendler and Miller (1984), Miller (1984), Stuart et at. (1985), Yarnashlta et al (1985). SainteMarie (1986), Brawley and Fei (1987), Buschrnann and Santelices (1987), Baerlocher et at. (1 988), Morrisey (1 988)
Johnson and Attramadal (1983), Delille et a1 (1985) Waegele (1982), Sandlfer and Kerby (1983), Segal (1987) Corredor and Criales (1977), Balasubramanian et at. (1979), Gultart and Hondares (1980), Chong and Sasekumar ( l98 l ) , Moriarty and Barcley (1981), Reed et at. (1982), Beal (1983),
continued ...
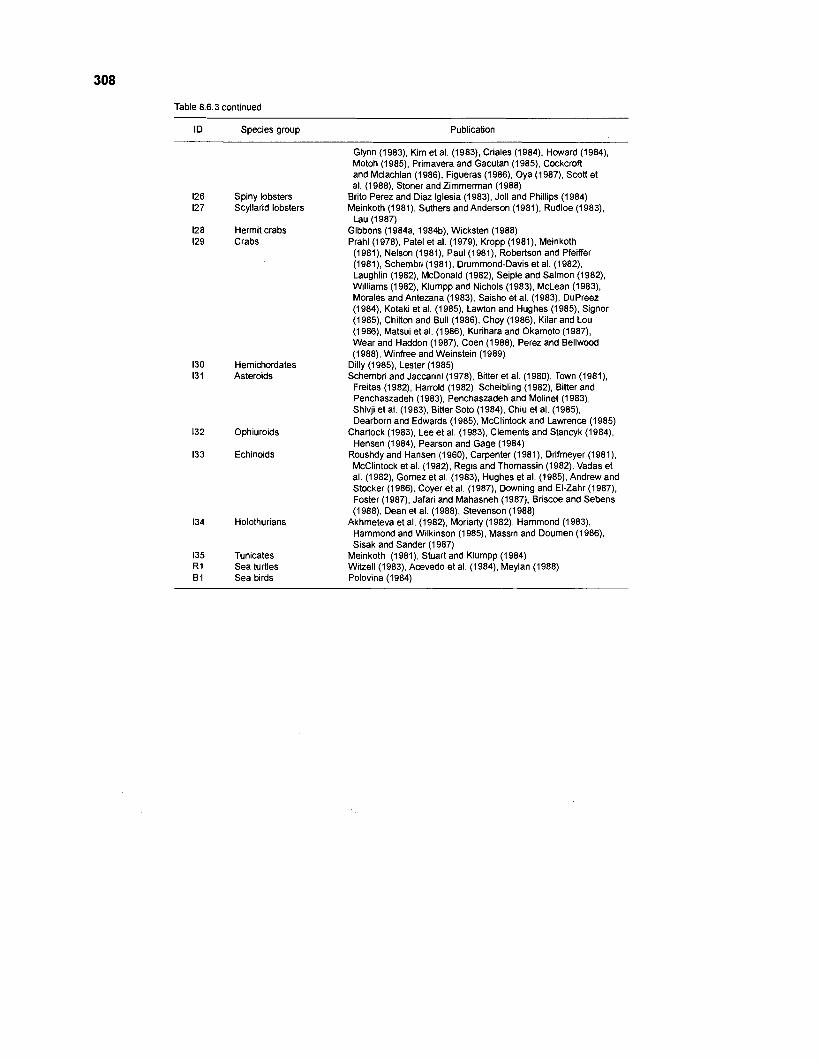
Table 8.6.3 continued
ID Species group Publication
Glynn (1983), Kim et al. (1983), Criales (1984). Howard (1984), Motoh (1985), Primavera and Gacutan (1985), Cockcroft and Mclachlan (1986). Figueras (1986). Oya (1987), Scott et al. (1988), Stoner and Zimmerman (1988)
126 Spiny lobsters Brito Perez and Diaz lglesia (1 983), Joll and Phillips (1984) 127 Scyllarid lobsters Meinkoth (1981), Suthers and Anderson (1981), Rudloe (1983),
Lau (1 987) 128 Hermit crabs Gibbons (1984a, 1984b), Wicksten (1988) 129 Crabs Prahl (1978), Patel et al. (1979), Kropp (1981), Meinkoth
(1981), Nelson (1981), Paul (1981), Robertson and Pfeiffer (1981), Schembri (1981), Drummond-Davis et al. (1982), Laughlin (1982), McDonald (1982), Seiple and Salmon (1982), Williams (1982), Klumpp and Nichols (1983), McLean (1983), Morales and Antezana (1983), Saisho et al. (1983), DuPreez (1984), Kotaki et al. (1985), Lawton and Hughes (1985), Signor (1985), Chilton and Bull (1986), Choy (1986), Kilar and Lou (1986), Matsui et al. (1986), Kurihara and Okamoto (1987), Wear and Haddon (1987), Coen (1988), Perez and Bellwood (1988), Winfree and Weinstein (1989)
Dilly (1 985), Lester (1985) Schembri and Jaccarini (1978), Bitter et al. (1980), Town (1981), Freitas (1982), Harrold (1982), Scheibling (1982), Bitter and Penchaszadeh (1983), Penchaszadeh and Molinet (1983), Shivji et al. (1983), Bitter Soto (1984), Chiu et al. (1985), Dearborn and Edwards (1 985), McClintock and Lawrence (1985)
Chartock (1983), Lee et al. (1983), Clements and Stancyk (1984), Hensen (1984), Pearson and Gage (1984)
Roushdy and Hansen (1960), Carpenter (1981), Drifmeyer (1981), McClintock et al. (1982), Regis and Thomassin (1982). Vadas et al. (1982), Gomez et al. (1983), Hughes et al. (1985), Andrew and Stocker (1 986), Coyer et al. (1987), Downing and El-Zahr (1 987), Foster (1987), Jafari and Mahasneh (1987), Briscoe and Sebens (1988), Dean et al. (1988). Stevenson (1988)
134 Holothurians Akhmeteva et al. (1982), Moriarty (1982), Hammond (1983), Hammond and Wilkinson (1 985), Massin and Doumen (1 986), Sisak and Sander (1987)
135 Tunicates Meinkoth (1981), Stuart and Klumpp (1984) R1 Sea turtles Witzell (1983), Acevedo et al. (1984), Meylan (1988) B1 Sea birds Polovina (1 984)
130 Hemichordates 131 Asteroids
132 Ophiuroids
133 Echinoids
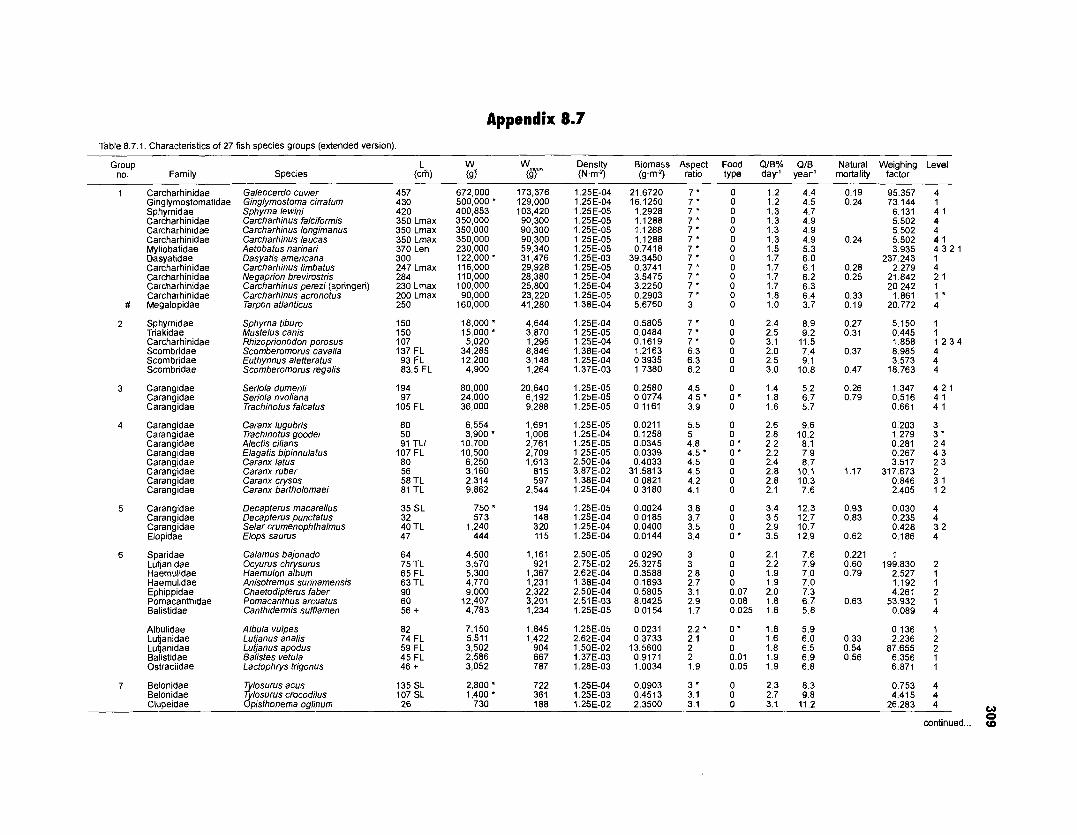
Appendix 8.7 Table 8.7.1. Characteristics of 27 fish species groups (extended version).
Group no. Family Species
L W W m an Density Biomass Aspect Food Q/B% Q/B (cf i) ( d ( d ( N m 2 ) ( g m 2 ) ratio type day1 year1
Natural Weighing Level mortality factor
Carcharhinidae Ginglymostomatidae Sphyrnidae Carcharhinidae Carcharhinidae Carcharhinidae Myliobatidae Dasyatidae Carcharhinidae Carcharhinidae Carcharhinidae Carcharhinidae Megalopidae
Galeocerdo cuvier Ginglymostoma cirratum Sphyrna lewini Carcharhinus falciformis Carcharhinus longimanus Carcharhinus leucas Aetobatus narinari Dasyatis americana Camharhinus limbatus
457 430 420 350 Lmax 350 Lmax 350 Lmax 370 Len 300 247 Lmax 284 230 Lmax 200 Lmax 250
150 150 lo7 137 FL 93 FL 83.5 FL
194 97
105 FL
80 50 91 T U
107 FL 80 56 58 TL 81 TL
35 SL 32 40 TL 47
64 75 TL 65 FL 63 TL 90 60 56 +
82 74 FL 59 FL 45 F L 46 +
135 SL 107 SL 26
Negapnon brev~rostrrs Carcharh~nus perezr (sprmger~) Carcharh~nus acronotus Tarpon atlanticus
Sphyrnidae Triakidae Carcharhinidae Scombridae Scombridae Scombridae
Sphyrna tiburo Mustelus canis Rhizoprionodon porosus Scomberomorus cavalla Euthynnus aletteratus Scomberomorus regalis
Carangidae Carangidae Carangidae
Seriola dumerili Seriola rivoliana Trachinotus falcatus
Carangidae Carangidae Carangidae Carang~dae Carang~dae Carangidae Carangidae Carangidae
Caranx lugubris Trachinotus goodei Alecfis ciliaris Elagatis bipinnulatus Caranx latus Caranx ruber Caranx crysos Caranx baffholomaei
Carangidae Carangidae Carangidae Elopidae
Decapterus macarellus Decapterus punctatus Selar crumenophthalmus Elops saurus
Sparidae Lutjanidae Haemulidae Haemulidae Ephippidae Pomacanthidae Balistidae
Calamus bajonado Ocvurus chwsurus ~akmulon aibum Anisotremus surinamensis Chaetodipterus faber Pomacanfhus arcuatus Canthidermis sufflamen
Albulidae Lutjanidae Lutjanidae Balistidae Ostraciidae
Albula vulpes Lutjanus analis Lutjanus apodus Balistes vetula Lactophtys trigonus
Belonidae Belonidae Cluoeidae
Tylosurus acus Tylosurus crocodilus O ~ i ~ t h ~ n e m a oolinum
- .- 4.41 5 11 2 26.283 4 0
0 continued ... (O
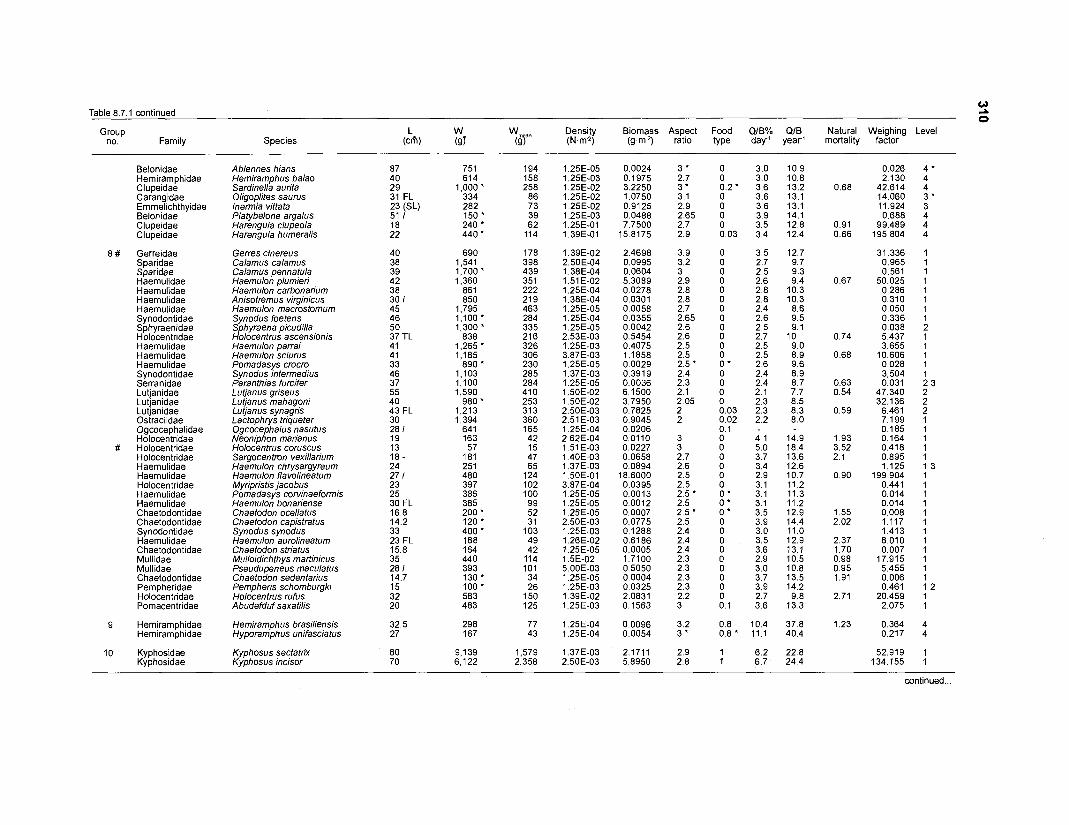
Table 8.7.1 continued
Group no. Family
2 0
L W W m an Density Biomass Aspect Food QIB% QIB Natural Weighing Level @A) ( d (d (N.mQ) (g.m2) ratlo type day1 year1 mortality factor Species
Belonidae Hemiramphidae Clupeidae Carangidae Emmelichthyidae Belonidae Clupeidae Clupeidae
8 # Gerreidae Sparldae Sparidae Haemulidae Haemulidae Haemulidae Haemulidae Synodontidae Sphyraenidae Holocentridae Haemulidae Haemulidae Haemulidae Synodontidae Serranidae Lutjanidae Lutjanidae Lutjanidae Ostraciidae Ogcocephalidae Holocentridae
# Holocentridae Holocentridae Haemulidae Haemulidae Holocentridae Haemulidae Haemulidae Chaetodontidae Chaetodontidae Synodontidae Haemulidae Chaetodontldae Mullidae Mullidae Chaetodontidae Pempheridae Holocentridae Pomacentridae
9 Hemiramphidae Hemiramphidae
10 Kyphosidae Kyphosidae
Ablennes hians Hemiramphus balao Sardinella aurita Oligoplites saurus lnermia viffata Platybelone argalus Harengula clupeola Harengula humeralrs
Gerres cinereus Calamus calamus Calamus pennatula Haemulon plumieri Haemulon carbonarium Anisotremus virginicus Haemulon macrostomum Synodus foetens Sphyraena p~cud~lla Holocentrus ascens~onrs Haemulon parrar Haemulon sciurus Pomadasvs crocro Synodus htermedius Paranthias furcifer Lutjanus griseus Lutjanus mahagoni Lutjanus synagris Lactophrys triqueter Ogcocephalus nasutus Neoniphan marianus Holocentrus coruscus Sargocentron vexillarium Haemulon chrysargyreum Haemulon flavolineatum Myripristis jacobus Pomadasys corvinaeformis Haemulon bonanense Chaetodon ocellatus Chaetodon capistratus Synodussynodus Haemulon aurolineatum Chaetodon striatus Mulloidichthys martinicus Pseudupeneus maculatus Chaetodon sedentarius Pem~hefls schomburaki ~olocentrus rufus Abudefduf saxatilis
Hemiramphus brasiliensis Hyporamphus unifasciatus
Kyphosus sectatrix Kyphosus incisor
continued ...
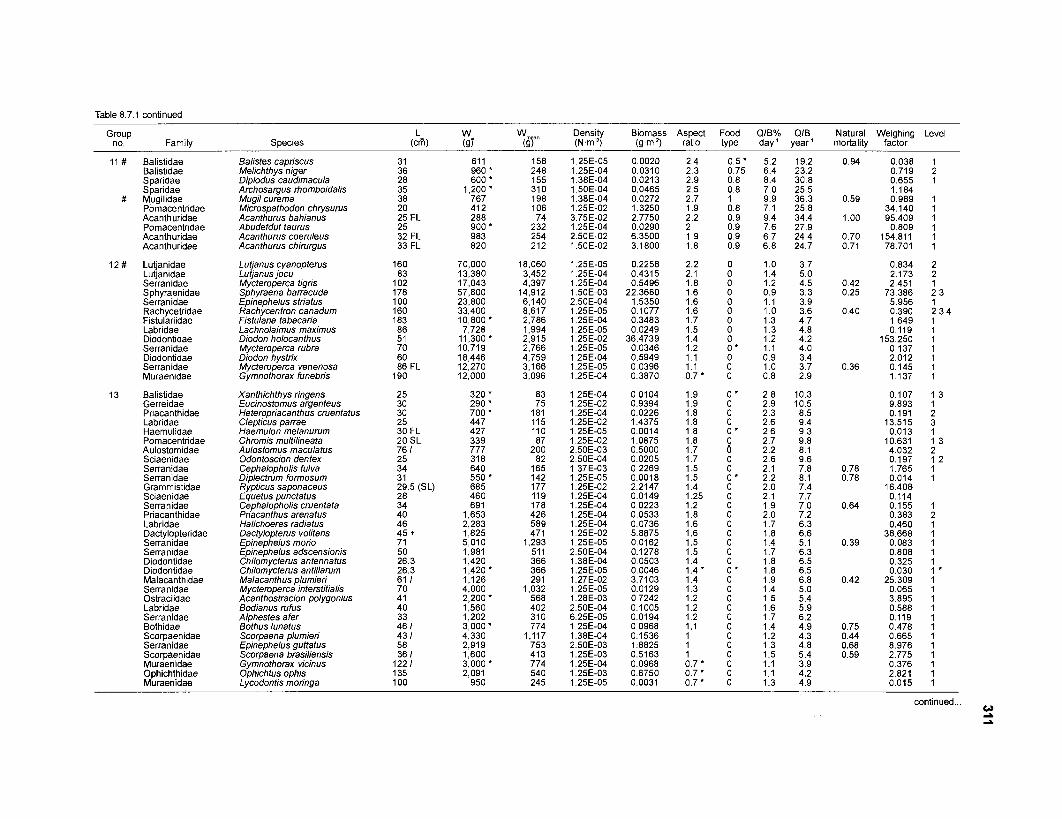
Table 8.7.1 continued
Group L W Wm an Density Biomass Aspect Food QIB% QIB Natural Weighing Level no. Family Species (cf i) (gT ( ~ 7 (N.m") (gm") ratio type day1 year1 mortality factor
Balistidae Balistidae Sparidae Sparidae Mugilidae Pomacentridae Acanthuridae Pomacentridae Acanthuridae Acanthuridae
Lutjanidae Lutjanidae Serranidae Sphyraenidae Serranidae Rachycetridae Fistulariidae Labridae Diodontidae Serranidae Diodontidae Serranidae Muraenidae
Balistidae Gerreidae Priacanthidae Labridae Haernulidae Pomacentridae Aulostomidae Sciaenidae Serranidae Serranidae Grammistidae Sciaenidae Serranidae Priacanthidae Labridae Dactylopteridae Serranidae Serranidae Diodontidae Diodontidae Malacanthidae Serranidae Ostraciidae Labridae Serranidae Bothidae Scorpaenidae Serranidae Scorpaenidae Muraenidae Ophichthidae Muraenidae
Balistes capriscus Melichthys niger Diplodus caudimacula Archosargus rhomboidalis Mugil curema Microspathodon chtysurus Acanthurus bahianus Abudefduf taurus Acanthurus coeruleus Acanthurus chirurgus
Lutjanus cyanopterus Lutjanus jocu Mycteroperca tigris Sphyraena barracuda Epinephelus striatus Rachycentron canadum Fistularia tabacaria Lachnolaimus maximus Diodon holocanthus Mycteroperca rubra Diodon hystrix Mycteroperca venenosa Gymnothorax funebris
Xanthichthys ringens Eucinostomus argenteus Heteropriacanthus cruentatus Clepticus parrae Haemulon melanurum Chromis multilineata Aulostomus maculatus Odontoscion dentex Cephalopholis fulva Diplectrum formosum Rypticus saponaceus Equetus punctatus Cephalopholis cruentata Priacanthus arenatus Hallchoeres radiatus D a ~ f v l ~ ~ t e r ~ S vol~tans Epinephelus morio Epinephelus adscensionis Chilomycterus antennatus Chilomycterus antillarum Malacanthus plumier!. Mycteroperca interstlt/alis Acanthostracion polygonius Bodianus rufus Alphestes afer Bothus lunatus Scor~aena ~lumieri ~pin.ephe1f.1~ guttatus Scorpaena brasil~ensrs Gvmnothorax vicinus obhichtus ophis Lycodontis moringa
31 36 28 35 38 20 25 FL 25 32 FL 33 FL
160 83 102 I78 100 160 183 86 5 1 70 60 86 FL 190
25 30 30 25 30 FL 20 SL 76 I 25 34 31 29.5 (SL) 28 34 40 46 45 + 71 50 26.3 26.3 61 I 70 41 40 33 46 / 43 / 58 36 1 122 1 135 100
continued ... 2
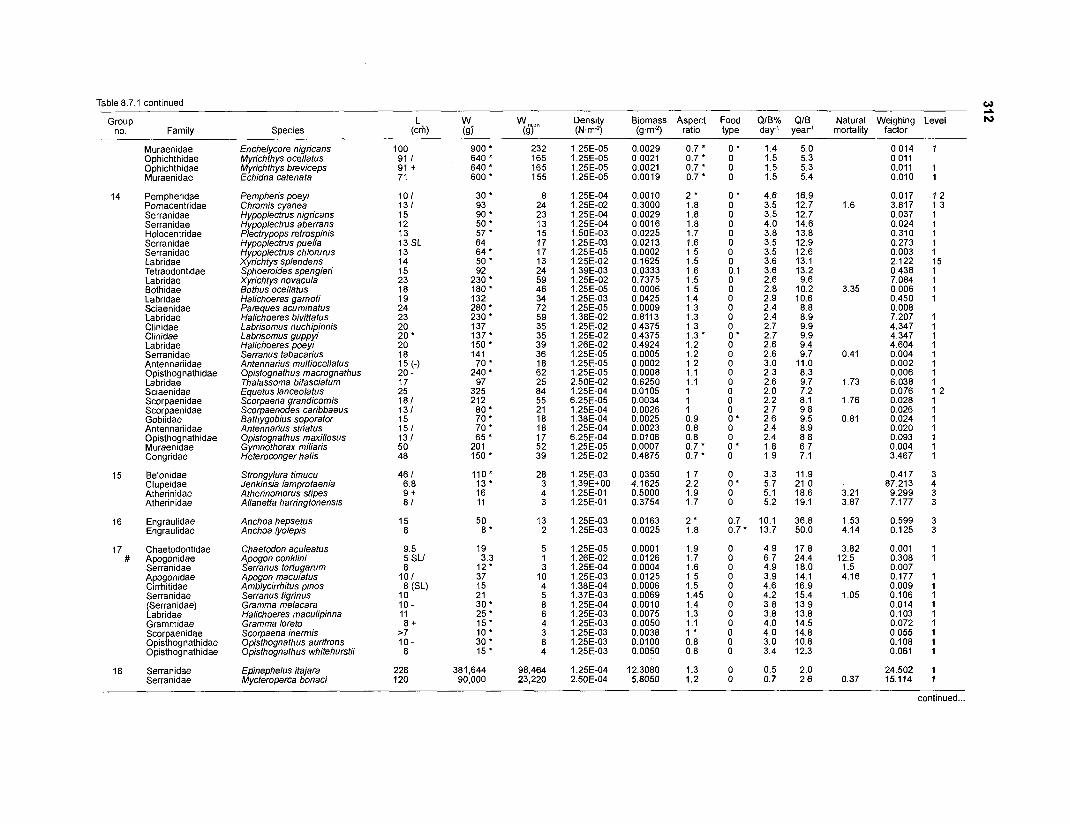
Table 8.7.1 continued
Group no. Family Species
Muraenidae Ophichthidae Ophichthidae Muraenidae
14 Pernpheridae Pomacentridae Serranidae Serranidae Holocentridae Serranldae Serranidae Labridae Tetraodontldae Labridae Bothidae Labridae Sciaenidae Labridae Clinidae Clinidae Labridae Serranidae Antennar~ldae Opisthognathidae Labridae Sciaenidae Scorpaenidae Scorpaenidae Gobiidae Antennariidae Opisthognathidae Muraenidae Congridae
15 Belonidae Clupe~dae Atherinidae Atherlnidae
16 Engraulidae Engraulrdae
17 Chaetodontidae # Apogonidae
Serranidae Apogonidae Cirrhitidae Serranidae (Serranidae) Labridae Gramrnidae Swrpaenidae Opisthognathidae Opisthognathidae
18 Serranidae Serranidae
Enchelycore nigricans Myrichthys ocellatus Myrichthys breviceps Echidna catenata
Pempheris poeyi Chromis cyanea Hypoplectrus nigricans Hj;poplectrus aberrans Plectwooos retrosoinls ~ ~ p o j i e c i r u s pueka Hypoplectrus chlorurus Xyrichtys splendens Sphoeroides spengleri Xyrichtys novacula Bothus ocellatus Halichoeres garnoti Pareques acuminatus Halichoeres bivittatus Labrisomus nuchipinnis Labrisomus guppyi Halichoeres poeyi Serranus tabacanus Anlennar~us multiocellatus Oplstognathus macrognathus Thalassoma brfasclatum Eguetus lanceolatus Scorpaena grandicorn~s Scoroaenodes canbbaeus ~athygobius soporator Antennarius striatus Opistognathus maxillosus Gymnothorax miliaris Heteroconger halis
Strongylura timucu Jenkinsia lamprotaenia Atherinomorus stipes Allanetta harringtonensis
Anchoa hepsetus Anchoa lyolepis
Chaetodon aculeatus Apogon conklini Serranus tortugarum Apogon macul&s Amblvcirrhitus oinos erri in us tigrinus Gramma melacara Halichoeres maculipinna Gramma loreto Scorpaena inermis Opisthognathus aurifrons Opisthognathus whitehurstii
Epinephelus itajara Mycteroperca bonaci
2 L W wm an Density Biomass Aspect Food QIB% QIB Natural Weighing Level N
(c f i ) (!3y ( ~ 7 ( N m 2 ) (g.m") ratio type day1 year' mortality factor
continued
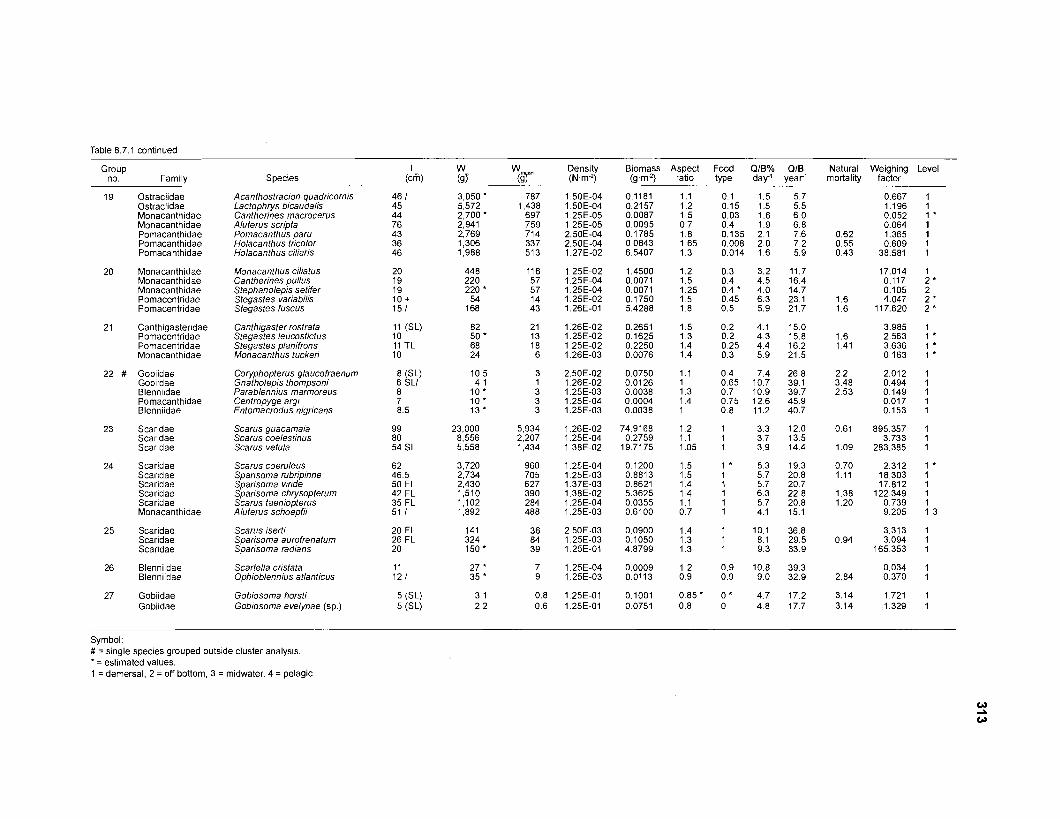
Table 8.7.1 continued
Group L W Wm an Density Biomass Aspect Food QIB% QIB no. Family Species (c f i ) (ST (sf (N,m-2) ( g m 2 ) ratio type day1 year1
Natural Weighing Level mortality factor
19 Ostraciidae Ostrac~idae Monacanthidae Monacanthidae Pornacanthidae Pomacanthidae Pomacanthidae
Acanthostrac~on quadricornis 46 / Lactophrys bicaudalis 45 Cantherines macrocerus 44 Aluterus scripta 76 Pomacanthus paru 43 Holacanthus tricolor 36 Holacanthus ciliaris 46
20 Monacanthldae Monacanthldae Monacanthidae Pomacentridae Pomacentridae
Monacanthus ciliatus Cantherines pullus Stephanolepis setifer Stegastes variabilis Stegastes fuscus
21 Canthigasteridae Pornacentridae Pornacentridae Monacanthidae
Canthigaster rostrata Stegastes leucostictus Stegastes planifrons Monacanthus tucker!
11 (SL) 10 11 T L 10
22 # Goblidae Gob~idae Blenn~idae Pornacanth~dae Blenniidae
Coryphopterus glaucofraenum Gnathole~is th0fnD~0ni
8 (SL) 6 SL/
~arablennius mahnoreus Centropyge argi Entomacrodus nigricans
23 Scarldae Scaridae Scarldae
Scarus guacama~a Scarus coelestinus Scarus vetula
24 Scaridae Scaridae Scarldae Scaridae Scaridae Monacanthidae
Scarus coeruleus Sparisoma rubripinne Sparisoma v~ride Sparisoma chrysopterum Scarus taeniopterus Aluterus schoepfii
25 Scaridae Scaridae Scaridae
Scarus isem Sparisoma aurofrenatum Sparisoma radlans
26 Blennildae Blennildae
Scarfella crktata Ophioblennius atlanticus
27 Gobiidae Gobiidae
Gobiosoma horsfi Gobiosoma evelynae (sp.)
Symbol: # = single species grouped outside cluster analysls * = estimated values. 1 = dernersal, 2 = off bottom, 3 = midwater, 4 = pelagic.
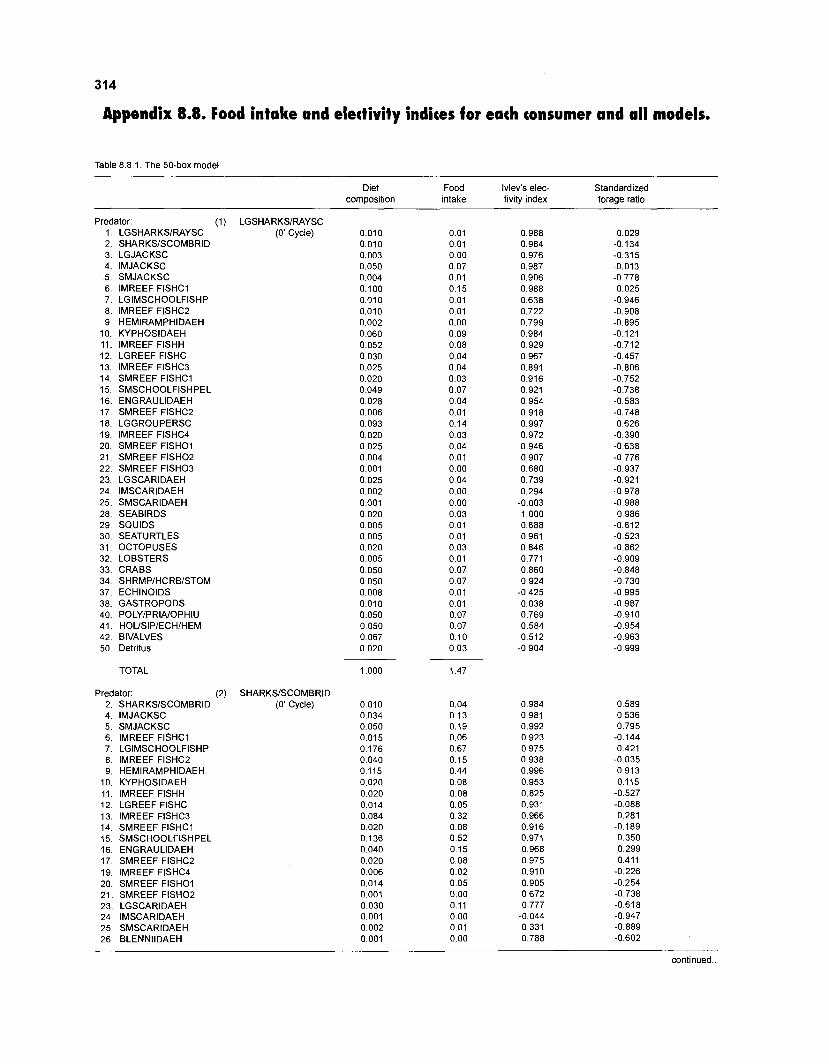
314
Appendix 8.8. Food intake and elettivity indites for each consumer and all models.
Table 8.8.1. The 50-box model
Diet Food Ivlev's elec- Standardized composition intake tivity index forage ratio
Predator: (1) LGSHARKSIRAYSC LGSHARKSIRAYSC SHARKSISCOMBRID LGJACKSC IMJACKSC SMJACKSC IMREEF FlSHCl LGIMSCHOOLFISHP IMREEF FISHC2 HEMIRAMPHIDAEH KYPHOSIDAEH IMREEF FlSHH LGREEF FlSHC IMREEF FlSHC3 SMREEF FlSHCl SMSCHOOLFISHPEL ENGRAULIDAEH SMREEF FISHC2 LGGROUPERSC IMREEF FISHC4 SMREEF FlSHOl SMREEF FISH02 SMREEF FISH03 LGSCARIDAEH IMSCARIDAEH SMSCARIDAEH SEABIRDS SQUIDS SEATURTLES OCTOPUSES LOBSTERS CRABS SHRMPIHCRBISTOM ECHlNOlDS GASTROPODS POLYIPRIAIOPHIU HOUSlPlECHlHEM BIVALVES Detritus
TOTAL
(o' Cycle) 0.01 0 0.010 0.003 0.050 0.004 0.100 0.010 0.010 0.002 0.060 0.052 0.030 0.025 0.020 0.049 0.028 0.006 0.093 0.020 0.025 0.004 0.001 0.025 0.002 0.001 0.020 0.005 0.005 0.020 0.005 0.050 0.050 0.008 0.010 0.050 0 050 0.067 0.020
1.000
Predator: (2) SHARKSISCOMBRID SHARKSISCOMBRID (0' Cycle) 0 010 IMJACKSC SMJACKSC IMREEF FlSHCl LGIMSCHOOLFISHP IMREEF FlSHC2 HEMIRAMPHIDAEH KYPHOSIDAEH IMREEF FlSHH LGREEF FlSHC IMREEF FISHC3 SMREEF FlSHCl SMSCHOOLFISHPEL ENGRAULIDAEH SMREEF FISHC2 IMREEF FISHC4 SMREEF FlSHOl SMREEF FISH02 LGSCARIDAEH IMSCARIDAEH SMSCARIDAEH BLENNHDAEH
continued..
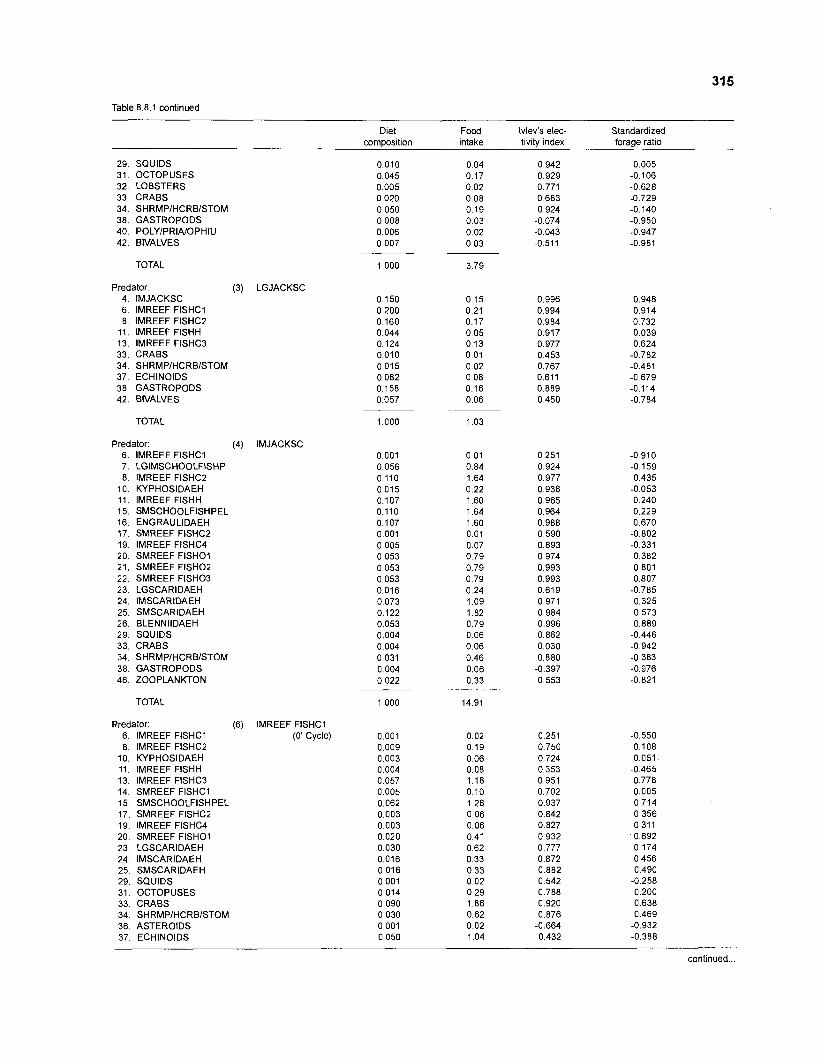
31 5
Table 8.8.1 continued
Diet composition
29. SQUIDS 31. OCTOPUSES 32. LOBSTERS 33. CRABS 34. SHRMPIHCRBISTOM 38. GASTROPODS 40. POLYlPRIA/OPHIU 42. BIVALVES
TOTAL
Predator: 4. IMJACKSC 6. IMREEF FlSHCl 8. IMREEF FISHC2
11. IMREEF FlSHH 13. IMREEF FlSHC3 33. CRABS 34. SHRMPIHCRBISTOM 37. ECHlNOlDS 38. GASTROPODS 42. BIVALVES
(3) LGJACKSC
TOTAL
Predator: (4) 6. IMREEF FlSHCl 7. LGIMSCHOOLFISHP 8. IMREEF FlSHC2
10. KYPHOSIDAEH 11. IMREEF FlSHH 15. SMSCHOOLFISHPEL 16. ENGRAULIDAEH 17. SMREEF FISHC2 19. IMREEF FISHC4 20. SMREEF FlSHOl 21. SMREEF FISH02 22. SMREEF FISH03 23. LGSCARIDAEH 24. IMSCARIDAEH 25. SMSCARIDAEH 26. BLENNllDAEH 29. SQUIDS 33. CRABS 34. SHRMPIHC RBISTOM 38. GASTROPODS 46. ZOOPLANKTON
TOTAL
Predator: (6) 6. IMREEF FlSHCl 8. IMREEF FISHC2
10. KYPHOSIDAEH 11. IMREEF FlSHH 13. IMREEF FlSHC3 14. SMREEF FlSHCl 15. SMSCHOOLFISHPEL 17. SMREEF FISHC2 19. IMREEF FISHC4 20. SMREEF FlSHOl 23. LGSCARIDAEH 24. IMSCARIDAEH 25. SMSCARIDAEH 29. SQUIDS 31. OCTOPUSES 33. CRABS 34. SHRMPIHCRBISTOM 36. ASTEROIDS 37. ECHlNOlDS
IMJACKSC
IMREEF FlSHCl (0' Cycle)
Food Ivlev's elec- Standardized intake tivity index forage ratio
continued ...
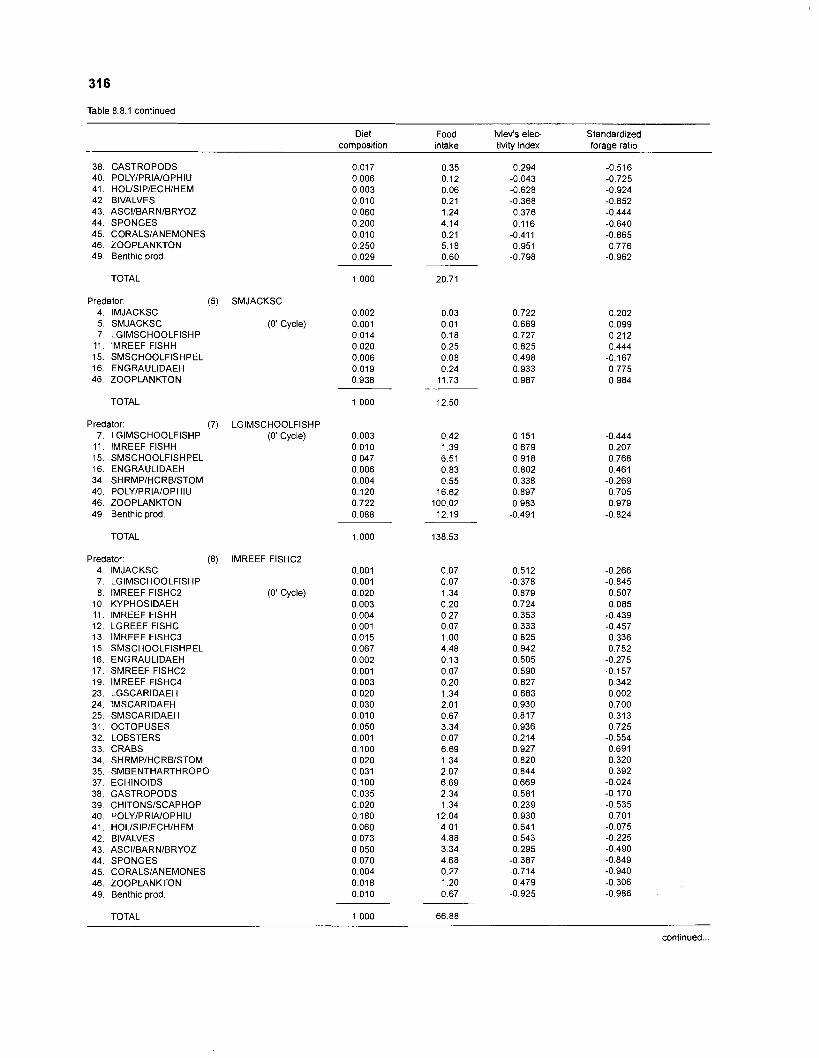
Table 8.8.1 continued
Diet Food Ivlev's elec- Standardized composition intake tivity index forage ratio
GASTROPODS POLYIPRINOPHIU HOLlSlPlECHlHEM BIVALVES ASCIIBARNIBRYOZ SPONGES CORALSIANEMONES ZOOPLANKTON Benthic prod.
TOTAL
Predator: (5) SMJACKSC 4, IMJACKSC 5. SMJACKSC (0' Cycle) 7 LGIMSCHOOLFISHP
11. IMREEF FlSHH 15. SMSCHOOLFISHPEL 16. ENGRAULIDAEH 46. ZOOPLANKTON
TOTAL
Predator: (7) LGIMSCHOOLFISHP 7. LGIMSCHOOLFISHP (0' Cycle)
11. IMREEF FlSHH 15. SMSCHOOLFISHPEL 16. ENGRAULIDAEH 34. SHRMPIHCRBISTOM 40. POLYlPRlNOPHlU 46. ZOOPLANKTON 49 Benthic prod.
TOTAL
Predator: (8) IMREEF FlSHC2 . . IMJACKSC LGIMSCHOOLFISHP IMREEF FISHC2 (O' Cycle) KYPHOSIDAEH IMREEF FlSHH LGREEF FlSHC IMREEF FlSHC3 SMSCHOOLFISHPEL ENGRAULIDAEH SMREEF FISHC2 IMREEF FISHC4 LGSCARIDAEH IMSCARIDAEH SMSCARIDAEH OCTOPUSES LOBSTERS CRABS SHRMPIHCRBISTOM SMBENTHARTHROPO ECHlNOlDS GASTROPODS CHITONSISCAPHOP POLYIPRINOPHIU HOLlSlPlECHlHEM BIVALVES ASCIIBARNIBRYOZ SPONGES CORALSIANEMONES ZOOPLANKTON Benthic prod.
TOTAL
continued ...
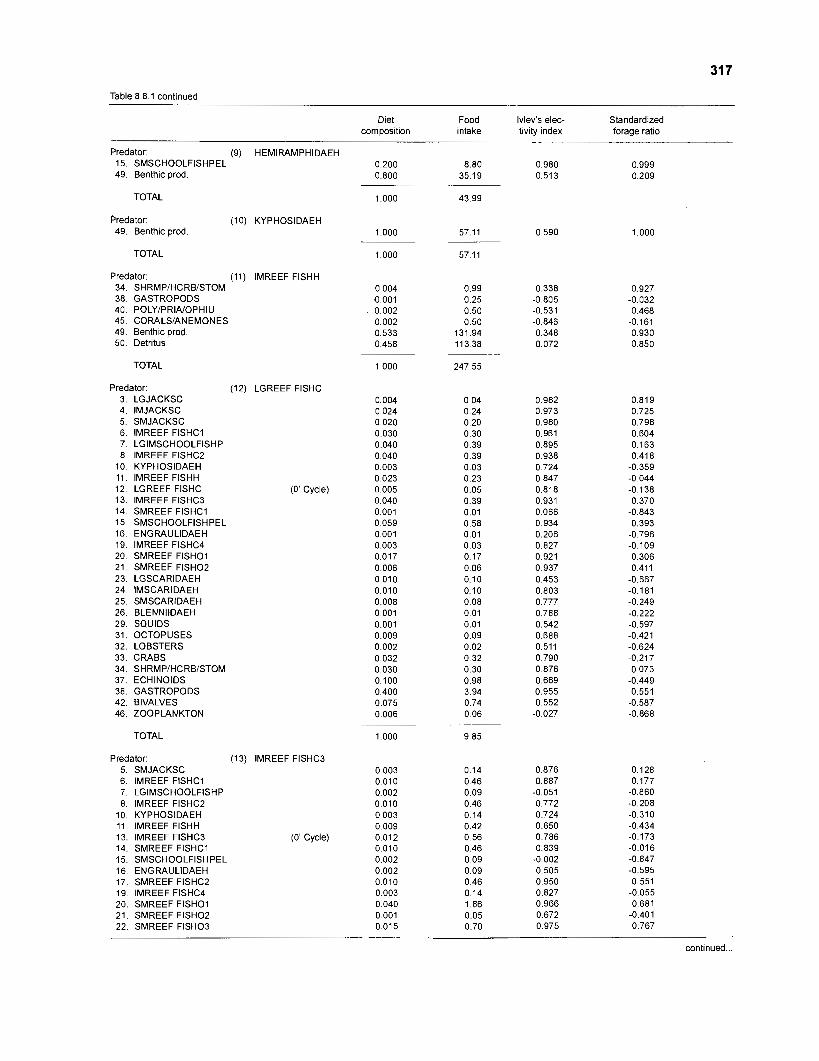
31 7
Table 8.8.1 continued
- --
Predator (9) HEMIRAMPHIDAEH 15 SMSCHOOLFISHPEL 49 Benthlc prod
TOTAL
Predator: (10) KYPHOSIDAEH 49. Benthic prod
TOTAL
Predator: (11) IMREEF FlSHH 34. SHRMPIHCRBISTOM 38. GASTROPODS 40. POLYlPRIA/OPHIU 45. CORALSIANEMONES 49. Benthic prod. 50. Detritus
TOTAL
Predator: 3. LGJACKSC 4. IMJACKSC 5. SMJACKSC 6. IMREEF FlSHCl 7. LGIMSCHOOLFISHP 8. IMREEF FISHC2
10. KYPHOSIDAEH 11. IMREEF FlSHH 12. LGREEF FlSHC 13. IMREEF FlSHC3 14. SMREEF FlSHCl 15. SMSCHOOLFISHPEL 16. ENGRAULIDAEH 19. IMREEF FISHC4 20. SMREEF FlSHOl 21. SMREEF FISH02 23. LGSCARIDAEH 24 IMSCARIDAEH 25. SMSCARIDAEH 26. BLENNllDAEH 29. SQUIDS 31. OCTOPUSES 32. LOBSTERS 33. CRABS 34. SHRMPIHCRBISTOM 37. ECHlNOlDS 38. GASTROPODS 42. BIVALVES 46. ZOOPLANKTON
(12) LGREEF FlSHC
(0' Cycle)
TOTAL
Predator: (13) IMREEF FlSHC3 5. SMJACKSC 6. IMREEF FlSHCl 7. LGIMSCHOOLFISHP 8. IMREEF FISHC2
10. KYPHOSIDAEH 11. IMREEF FlSHH 13. IMREEF FISHC3 (0' Cycle) 14. SMREEF FlSHCl 15. SMSCHOOLFISHPEL 16 ENGRAULIDAEH 17. SMREEF FISHC2 19. IMREEF FISHC4 20. SMREEF FlSHOl 21. SMREEF FISH02 22. SMREEF FISH03
Diet Food composition intake
Ivlev's elec- Standardized tivity index forage ratio
continued ...
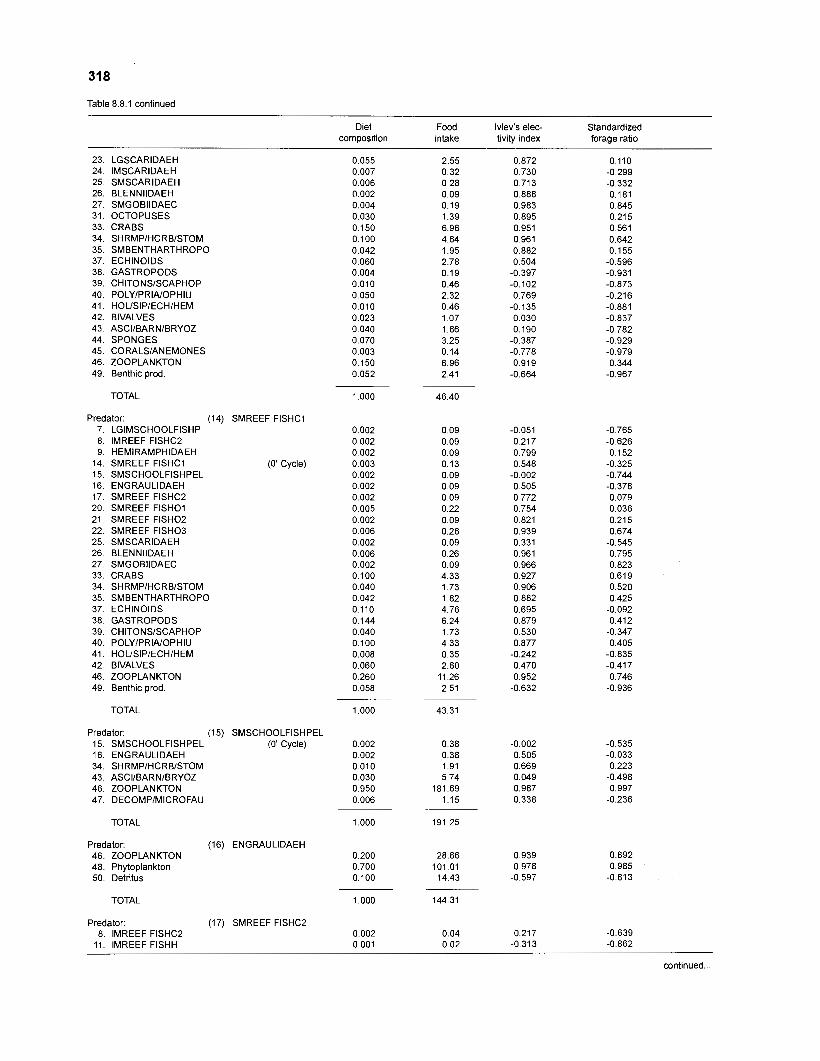
Table 8.8.1 continued
23. LGSCARIDAEH 24. IMSCARIDAEH 25. SMSCARIDAEH 26. BLENNllDAEH 27. SMGOBllDAEC 31. OCTOPUSES 33. CRABS 34. SHRMPIHCRBISTOM 35. SMBENTHARTHROPO 37. ECHlNOlDS 38. GASTROPODS
41. HOUSlPlECHlHEM 42. BIVALVES 43. ASCllBARNlBRYOZ 44. SPONGES 45. CORALSIANEMONES 46. ZOOPLANKTON 49. Benthic prod.
TOTAL
(0' Cycle)
Predator: (14) SMREEF FlSHCl 7. LGIMSCHOOLFISHP 8. IMREEF FISHC2 9. HEMIRAMPHIDAEH
14. SMREEF FlSHCl 15. SMSCHOOLFISHPEL 16. ENGRAULIDAEH 17. SMREEF FISHC2 20. SMREEF FISH01 21. SMREEF FISH02 22. SMREEF FISH03 25. SMSCARIDAEH 26. BLENNllDAEH 27. SMGOBllDAEC 33. CRABS 34. SHRMPIHCRBISTOM 35. SMBENTHARTHROPO 37. ECHlNOlDS 38. GASTROPODS 39. CHITONSISCAPHOP 40. POLYIPRIAIOPHIU 41. HOLlSlPlECHlHEM 42. BIVALVES 46. ZOOPLANKTON 49. Benthic prod.
TOTAL
Predator: (15) SMSCHOOLFISHPEL 15. SMSCHOOLFISHPEL (0' Cycle) 16. ENGRAULIDAEH 34. SHRMPIHCRBISTOM 43. ASCllBARNlBRYOZ 46. ZOOPLANKTON 47. DECOMPIMICROFAU
TOTAL
Predator: (16) ENGRAULIDAEH 46. ZOOPLANKTON 48. Phytoplankton 50. Detritus
TOTAL
Predator (17) SMREEF FISHC2 8. IMREEF FISHC2
11 IMREEF FlSHH
Diet composition
Food intake
Ivlev's elec- tivity index
Standardized forage ratio
continued ...
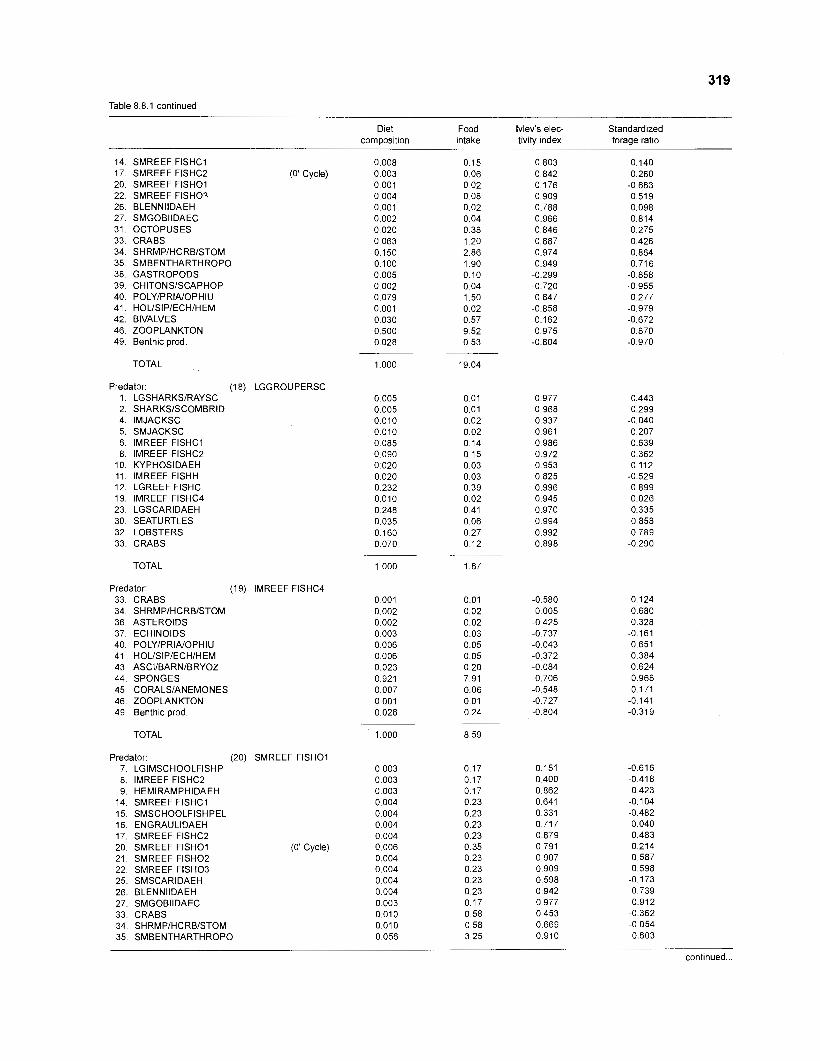
Table 8.8.1 continued
Diet Food Ivlev's elec- Standardized composition intake tivity index forage ratio
SMREEF FlSHCl SMREEF FISHC2 (O' Cycle) SMREEF FlSHOl SMREEF FISHO? BLENNllDAEH SMGOBllDAEC OCTOPUSES CRABS SHRMPIHCRBISTOM SMBENTHARTHROPO GASTROPODS CHITONSISCAPHOP POLYIPRIAIOPHIU HOLISIPIECHIHEM BIVALVES ZOOPLANKTON Benthic prod
-
TOTAL
Predator: (18) LGGROUPERSC 1. LGSHARKSIRAYSC 2. SHARKSISCOMBRID 4. IMJACKSC 5. SMJACKSC 6. IMREEF FlSHCl 8. IMREEF FlSHC2
10. KYPHOSIDAEH 11, IMREEF FlSHH 12. LGREEF FlSHC 19, IMREEF FlSHC4 23 LGSCARIDAEH 30. SEATURTLES 32. LOBSTERS 33. CRABS
TOTAL
Predator: (19) IMREEF FISHC4 CRABS SHRMPIHCRBISTOM ASTEROIDS ECHlNOlDS POLYlPRlAlOPHlU HOLlSlPlECHlHEM ASCIIBARNIBRYOZ SPONGES CORALSIANEMONES ZOOPLANKTON Benthic prod.
TOTAL
Predator: (20) SMREEF FISH01 7. LGIMSCHOOLFISHP 8. IMREEF FISHC2 9. HEMIRAMPHIDAEH
14. SMREEF FlSHCl 15. SMSCHOOLFISHPEL 16. ENGRAULIDAEH 17. SMREEF FlSHC2 20. SMREEF FISH01 (0' Cycle) 21 SMREEF FISH02 22. SMREEF FISH03 25. SMSCARIDAEH 26. BLENNllDAEH 27. SMGOBllDAEC 33. CRABS 34. SHRMPIHCRBISTOM 35. SMBENTHARTHROPO
continued ...
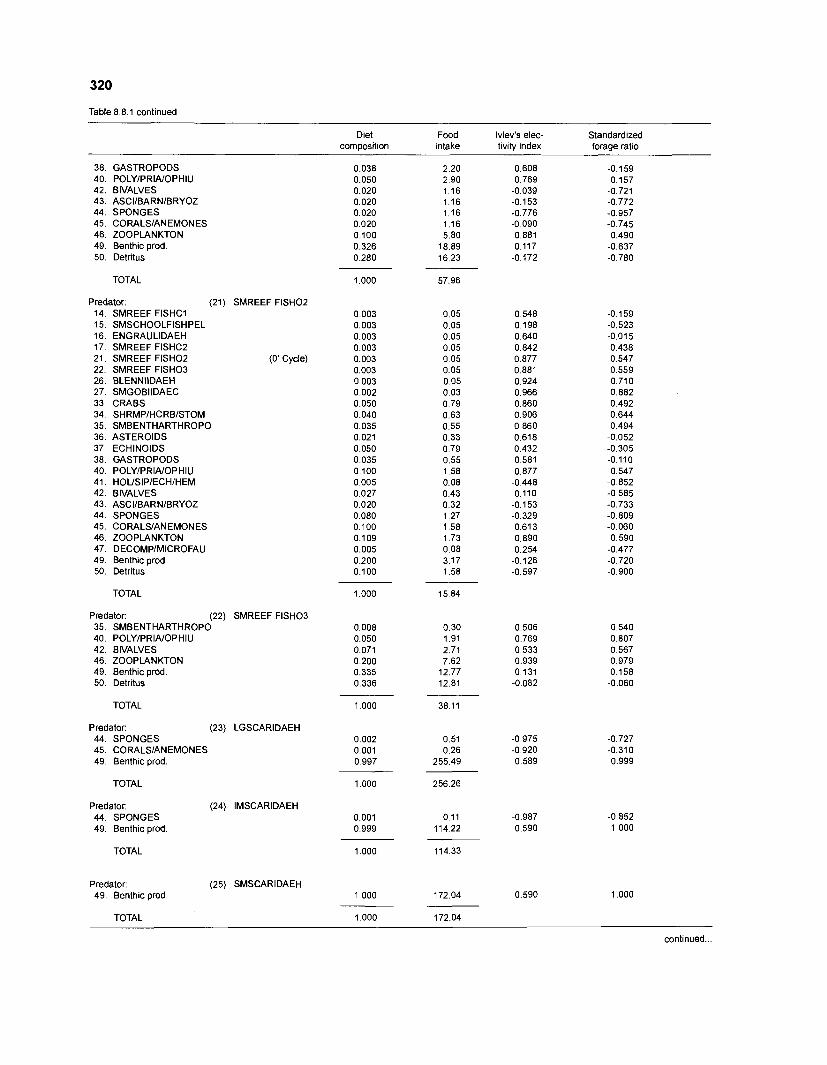
Table 8.8.1 continued
Diet Food Ivlev's elec- Standardized corngosition intake tivitv index foraqe ratio
GASTROPODS POLYIPRINOPHIU BIVALVES ASCIIBARNIBRYOZ SPONGES CORALSIANEMONES ZOOPLANKTON Benthic prod. Detritus
TOTAL
Predator: (21) SMREEF FISH02 SMREEF FlSHCl SMSCHOOLFISHPEL ENGRAULIDAEH SMREEF FISHC2 SMREEF FISH02 (O' Cycle) SMREEF FISH03 BLENNllDAEH SMGOBllDAEC CRABS SHRMPIHCRBISTOM SMBENTHARTHROPO ASTEROIDS ECHlNOlDS GASTROPODS POLYIPRINOPHIU HOUSlPlECHlHEM BIVALVES ASCIIBARNIBRYOZ SPONGES CORALSIANEMONES ZOOPLANKTON DECOMPIMICROFAU Benthic prod. Detritus
TOTAL
Predator: (22) SMREEF FISH03 35. SMBENTHARTHROPO 40. POLYIPRINOPHIU 42. BIVALVES 46. ZOOPLANKTON 49. Benthic prod. 50. Detritus
TOTAL
Predator: (23) LGSCARIDAEH 44. SPONGES 45. CORALSIANEMONES 49. Benthic prod.
TOTAL
Predator: (24) IMSCARIDAEH 44. SPONGES 49. Benthic prod.
TOTAL
Predator: (25) SMSCARIDAEH 49. Benthic prod.
TOTAL
continued ...
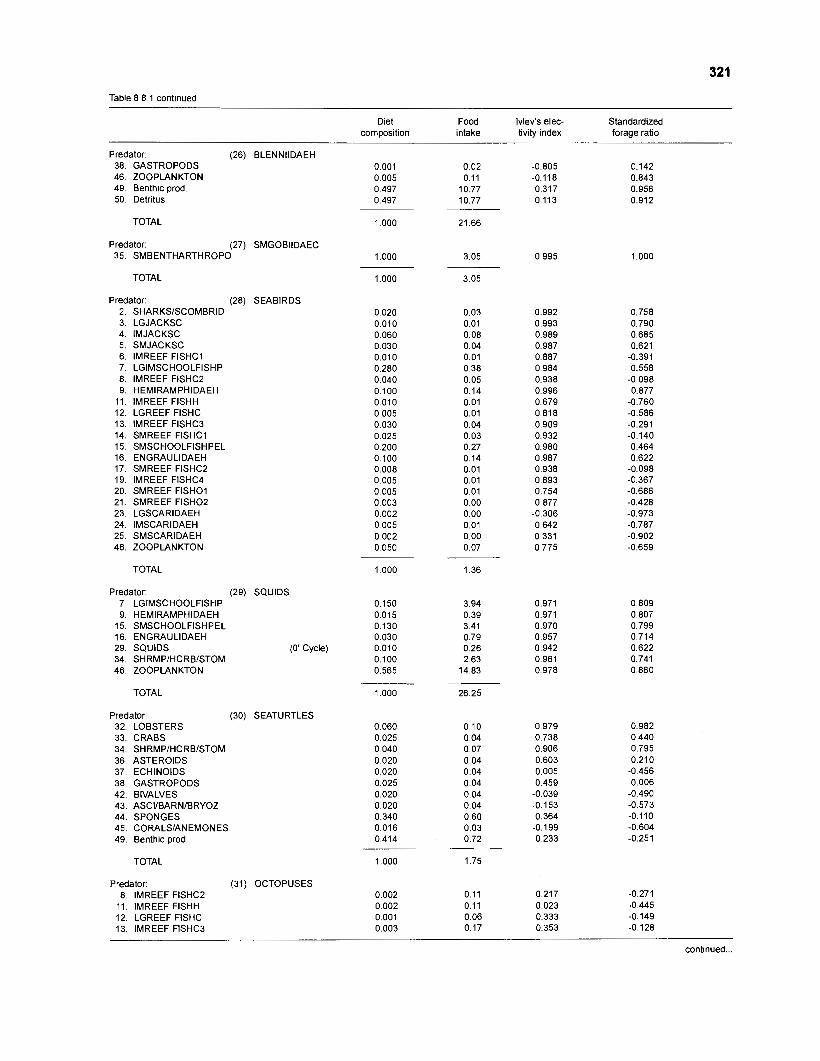
Table 8.8.1 continued
Diet Food Ivlev's elec- Standardized composition intake tivity index forage ratio
Predator: (26) BLENNllDAEH 38. GASTROPODS 46. ZOOPLANKTON 49. Benthic prod. 50. Detritus
TOTAL
Predator: (27) SMGOBIIDAEC 35. SMBENTHARTHROPO
TOTAL
Predator: (28) SEABIRDS 2. SHARKSISCOMBRID 3. LGJACKSC 4. IMJACKSC 5. SMJACKSC 6. IMREEF FlSHCl 7. LGIMSCHOOLFISHP 8. IMREEF FlSHC2 9. HEMIRAMPHIDAEH
11. IMREEF FlSHH 12. LGREEF FlSHC 13. IMREEF FlSHC3 14. SMREEF FlSHCl 15. SMSCHOOLFISHPEL 16. ENGRAULIDAEH 17. SMREEF FISHC2 19. IMREEF FISHC4 20. SMREEF FISH01 21. SMREEF FISH02 23. LGSCARIDAEH 24. IMSCARIDAEH 25. SMSCARIDAEH 46. ZOOPLANKTON
TOTAL
Predator: (29) SQUIDS 7. LGIMSCHOOLFISHP 9. HEMIRAMPHIDAEH
15. SMSCHOOLFISHPEL 16. ENGRAULIDAEH 29. SQUIDS 34. SHRMPIHCRBISTOM 46. ZOOPLANKTON
(O' Cycle)
TOTAL
Predator: (30) SEATURTLES 32. LOBSTERS 33. CRABS 34. SHRMPIHCRBISTOM 36. ASTEROIDS 37. ECHlNOlDS 38. GASTROPODS 42. BIVALVES 43. ASCllBARNlBRYOZ 44. SPONGES 45. CORALSIANEMONES 49. Benthic prod.
TOTAL
Predator: (31) OCTOPUSES 8. IMREEF FISHC2
11. IMREEF FlSHH 12. LGREEF FlSHC 13. IMREEF FlSHC3
continued ...
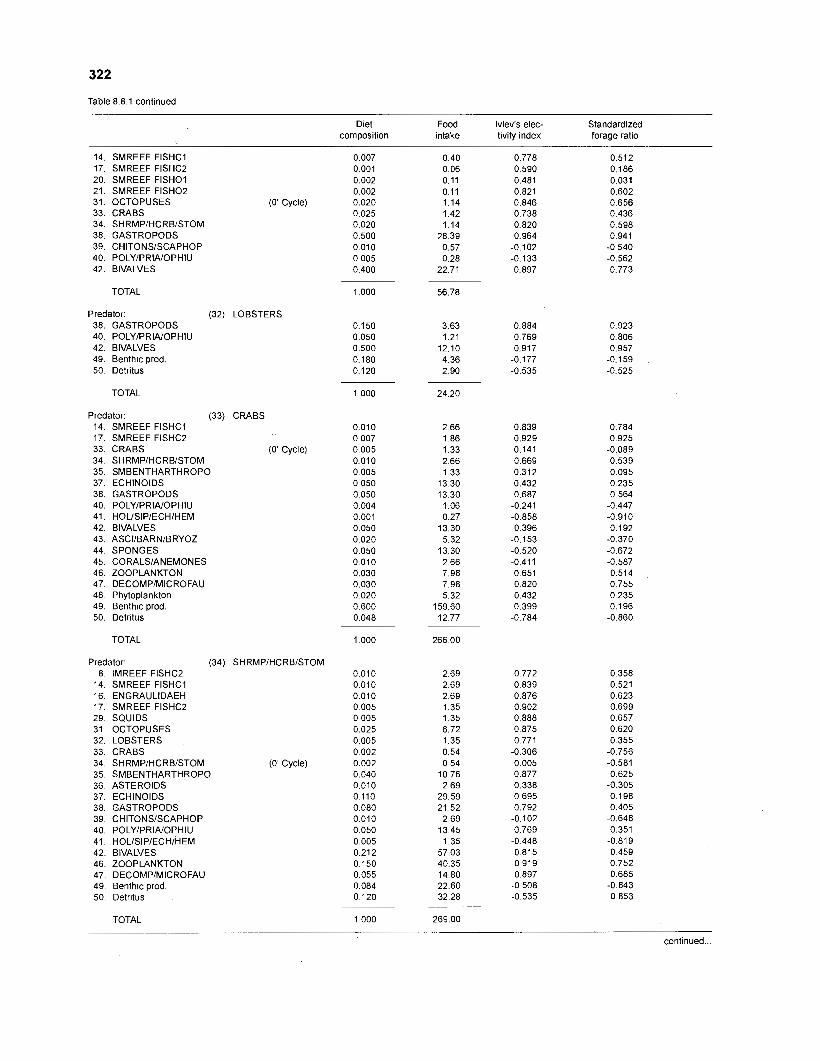
Table 8.8.1 continued
Diet Food Ivlev's elec- Standardized composition intake tivity index forage ratio
SMREEF FlSHCl SMREEF FISHC2 SMREEF FISH01 SMREEF FISH02 OCTOPUSES (0' Cycle) CRABS SHRMPIHCRBISTOM GASTROPODS CHITONSISCAPHOP POLYIPRIAIOPHIU BIVALVES
TOTAL
Predator: (32) LOBSTERS 38. GASTROPODS 40. POLYIPRINOPHIU 42. BIVALVES 49. Benthic prod. 50. Detritus
TOTAL
Predator: (33) CRABS SMREEF FlSHCl SMREEF FISHC2 CRABS (0' Cycle) SHRMPIHCRBISTOM SMBENTHARTHROPO ECHlNOlDS GASTROPODS POLYIPRINOPHIU HOLlSlPlECHlHEM BIVALVES ASCIIBARNIBRYOZ SPONGES CORALSIANEMONES ZOOPLANKTON DECOMPIMICROFAU Phytoplankton Benthic prod. Detritus
TOTAL
Predator. (34) SHRMPIHCRBISTOM IMREEF FlSHC2 SMREEF FlSHCl ENGRAULIDAEH SMREEF FISHC2 SQUIDS OCTOPUSES LOBSTERS CRABS SHRMPIHCRBISTOM (0' Cycle) SMBENTHARTHROPO ASTEROIDS ECHlNOlDS GASTROPODS CHITONSISCAPHOP POLYIPRIAIOPHIU HOLlSlPlECHlHEM BIVALVES ZOOPLANKTON DECOMPIMICROFAU Benth~c prod Detr~tus
TOTAL
continued ...
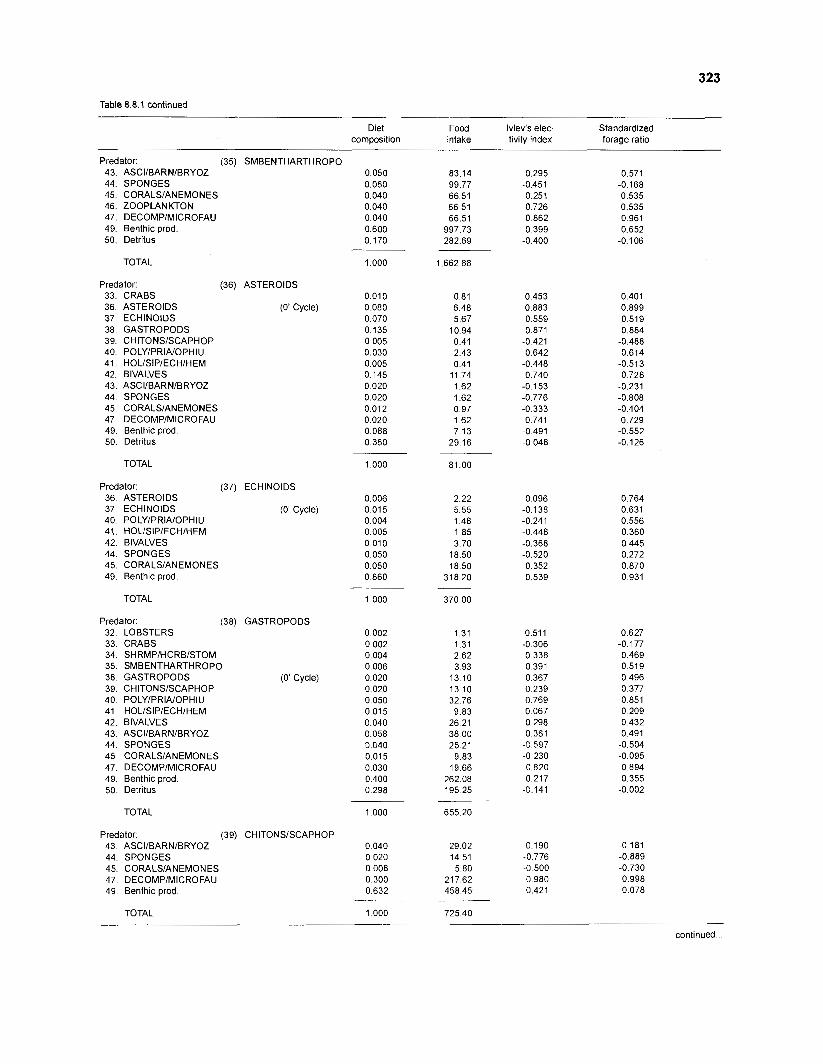
Table 8.8.1 continued
Diet Food Ivlev's elec- Standardized composition intake tivity index forage ratio
Predator: (35) SMBENTHARTHROPO 43. ASCIIBARNIBRYOZ 44. SPONGES 45. CORALSIANEMONES 46. ZOOPLANKTON 47. DECOMPIMICROFAU 49. Benthic prod. 50. Detritus
TOTAL
Predator: (36) ASTEROIDS . . CRABS ASTEROIDS (0' Cycle) ECHlNOlDS GASTROPODS CHITONSISCAPHOP POLYIPRIAIOPHIU HOLlSlPlECHlHEM BIVALVES ASCIIBARNIBRYOZ SPONGES CORALSIANEMONES DECOMPIMICROFAU Benthic prod. Detritus
TOTAL
Predator: (37) ECHlNOlDS ~, ASTEROIDS ECHlNOlDS (0' Cycle) POLYlPRIA/OPHIU HOLlSlPlECHlHEM BIVALVES SPONGES CORALSIANEMONES Benthic prod.
TOTAL
Predator: (38) GASTROPODS 32. LOBSTERS 33. CRABS 34. SHRMPIHCRBISTOM 35. SMBENTHARTHROPO 38. GASTROPODS (0' Cycle) 39. CHITONSISCAPHOP 40. POLYlPRIA/OPHIU 41 HOLlSlPlECHlHEM 42. BIVALVES 43. ASCIIBARNIBRYOZ 44. SPONGES 45 CORALSIANEMONES 47. DECOMPIMICROFAU 49. Benthic prod. 50 Detritus
TOTAL
Predator: (39) CHITONSISCAPHOP 43. ASCIIBARNIBRYOZ 44. SPONGES 45. CORALSIANEMONES 47. DECOMPIMICROFAU 49. Benthic prod.
TOTAL
continued
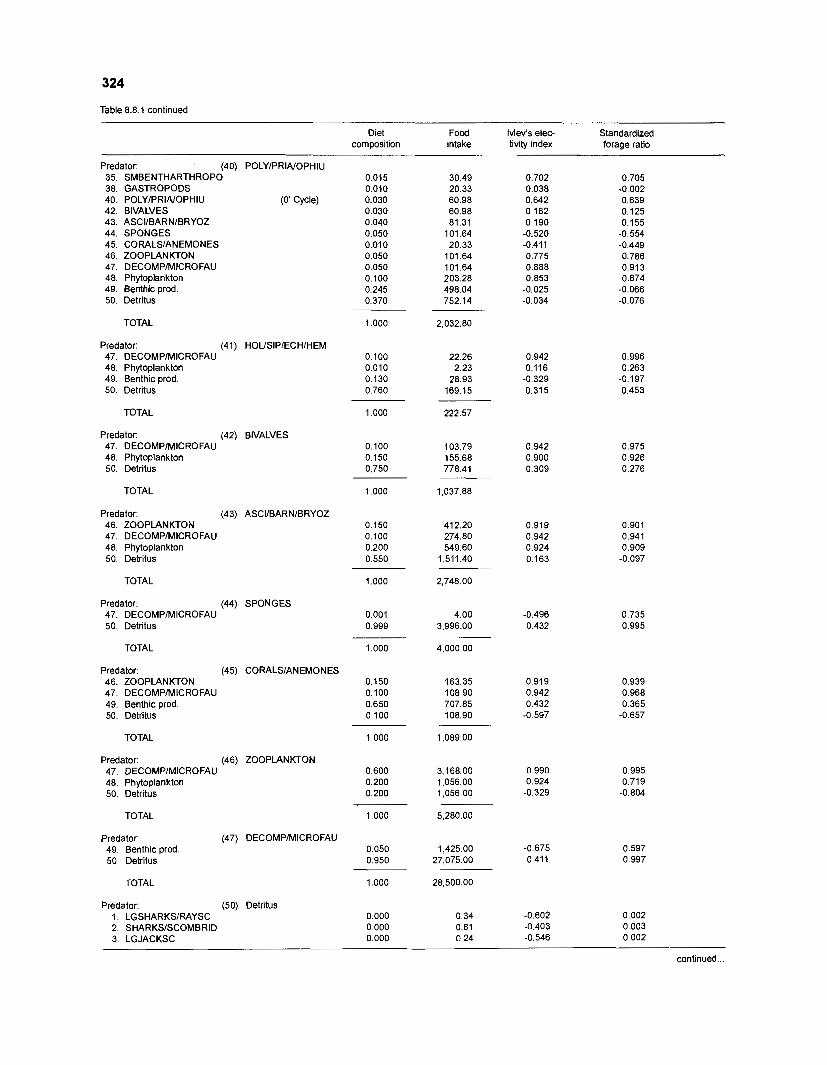
Table 8.8.1 continued
Diet Food Ivlev's elec- Standardized composition intake tivity index forage ratio
Predator: (40) SMBENTHARTHROPO GASTROPODS POLYIPRIAIOPHIU BIVALVES ASCIIBARNIBRYOZ SPONGES CORALSIANEMONES ZOOPLANKTON DECOMPIMICROFAU Phytoplankton Benthic prod. Detritus
TOTAL
Predator: (41) 47. DECOMPlMlCROFAU 48. Phytoplankton 49. Benthic prod. 50. Detritus
TOTAL
Predator: (42) 47. DECOMPlMICROFAU 48. Phytoplankton 50. Detritus
TOTAL
Predator: (43) 46. ZOOPLANKTON 47. DECOMPIMICROFAU 48. Phytoplankton 50. Detritus
TOTAL
Predator: (44) 47. DECOMPIMICROFAU 50. Detritus
TOTAL
Predator: (45) 46. ZOOPLANKTON 47. DECOMPlMICROFAU 49. Benthic prod. 50. Detritus
TOTAL
Predator: (46) 47. DECOMPIMICROFAU 48. Phytoplankton 50. Detritus
TOTAL
Predator: (47) 49. Benthic prod. 50. Detritus
TOTAL
Predator: (50) 1. LGSHARKSIRAYSC 2. SHARKSISCOMBRID 3. LGJACKSC
POLYIPRIAIOPHIU
(0' Cycle)
BIVALVES
ASCIIBARNIBRYOZ
SPONGES
CORALSIANEMONES
ZOOPLANKTON
DECOMPIMICROFAU
Detritus
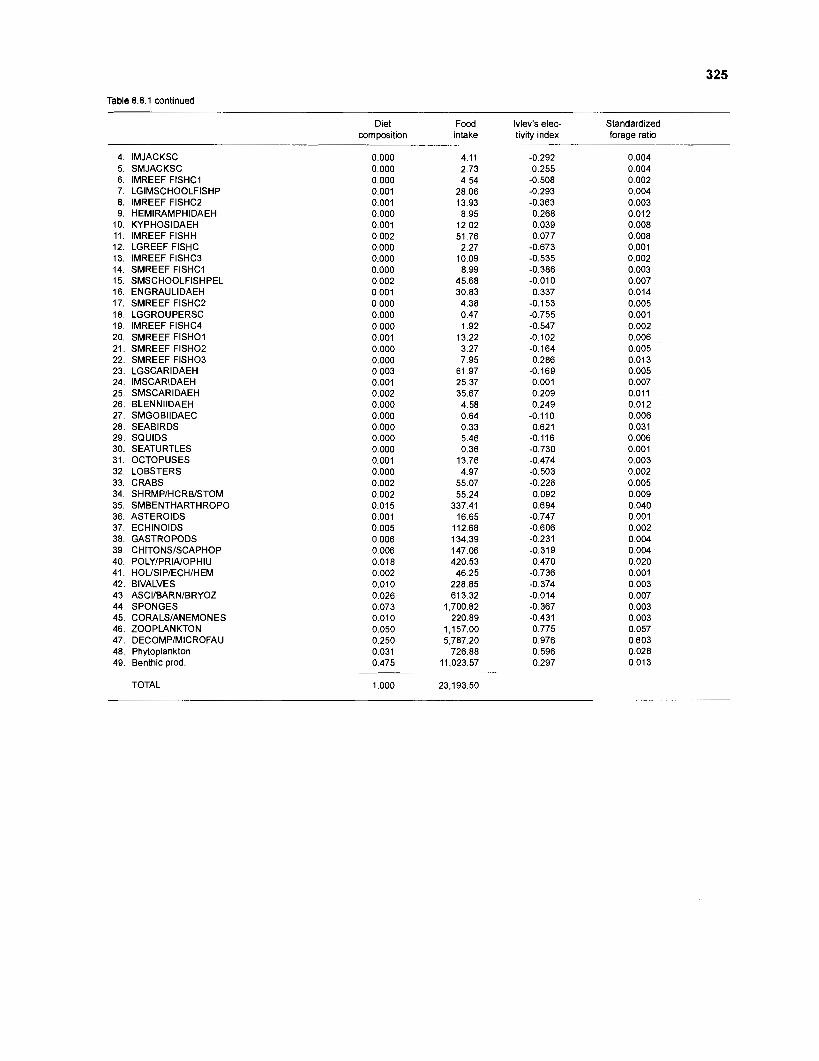
Table 8.8.1 continued
4. IMJACKSC 5. SMJACKSC 6. IMREEF FISHCI 7. LGIMSCHOOLFISHP 8. IMREEF FISHC2 9. HEMIRAMPHIDAEH
10. KYPHOSIDAEH 11. IMREEF FlSHH 12. LGREEF FlSHC 13. IMREEF FlSHC3 14. SMREEF FISHCI 15. SMSCHOOLFISHPEL 16. ENGRAULIDAEH 17. SMREEF FISHC2 18. LGGROUPERSC 19. IMREEF FISHC4 20. SMREEF FISH01 21. SMREEF FISH02 22. SMREEF FISH03 23. LGSCARIDAEH 24. IMSCARIDAEH 25. SMSCARIDAEH 26. BLENNllDAEH 27. SMGOBllDAEC 28. SEABIRDS 29. SQUIDS 30. SEATURTLES 31. OCTOPUSES 32. LOBSTERS 33. CRABS 34. SHRMPIHCRBISTOM 35. SMBENTHARTHROPO 36. ASTEROIDS 37. ECHlNOlDS 38. GASTROPODS 39. CHITONSISCAPHOP 40. POLYIPRINOPHIU 41. HOLlSlPlECHlHEM 42. BIVALVES 43. ASCllBARNlBRYOZ 44. SPONGES 45. CORALSIANEMONES 46. ZOOPLANKTON 47. DECOMPIMICROFAU 48. Phytoplankton 49. Benthic prod.
TOTAL
Diet composition
Food intake
Ivlev's elec- tivity index
Standardized forage ratio
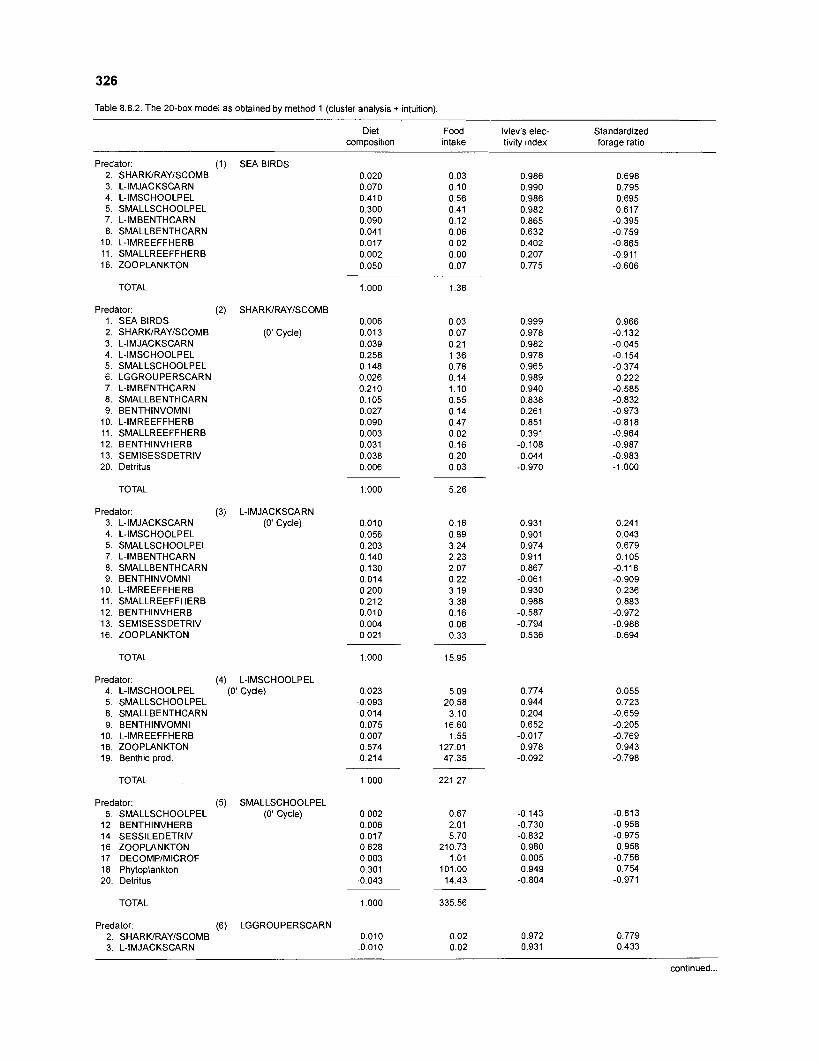
Table 8.8.2. The 20-box model as obtained by method 1 (cluster analysis + intuition).
Diet Food Ivlev's elec- Standardized composition intake tivity index forage ratio
Predator: (1) SEA BIRDS SHARWRAYISCOMB L-IMJACKSCARN L-IMSCHOOLPEL SMALLSCHOOLPEL L-IMBENTHCARN SMALLBENTHCARN L-IMREEFFHERB SMALLREEFFHERB ZOOPLANKTON
TOTAL
Predator: (2) SHARWRAYISCOMB 1. SEA BIRDS 2. SHARWRAYISCOMB (0' Cycle) 3. L-IMJACKSCARN 4. L-IMSCHOOLPEL 5. SMALLSCHOOLPEL 6. LGGROUPERSCARN 7. L-IMBENTHCARN 8. SMALLBENTHCARN 9 BENTHINVOMNI
10. L-IMREEFFHERB 11. SMALLREEFFHERB 12. BENTHINVHERB 13. SEMISESSDETRIV 20. Detritus
TOTAL
Predator: (3) L-IMJACKSCARN 3. L-IMJACKSCARN (0' Cycle) 4. L-IMSCHOOLPEL 5. SMALLSCHOOLPEL 7 L-IMBENTHCARN 8. SMALLBENTHCARN 9. BENTHINVOMNI
10. L-IMREEFFHERB 11. SMALLREEFFHERB 12. BENTHINVHERB 13. SEMISESSDETRIV 16. ZOOPLANKTON
TOTAL
Predator: (4) L-IMSCHOOLPEL 4. L-IMSCHOOLPEL (0' Cycle) 5. SMALLSCHOOLPEL 8. SMALLBENTHCARN 9. BENTHINVOMNI
10. L-IMREEFFHERB 16 ZOOPLANKTON 19. Benthic prod.
TOTAL
Predator: (5) SMALLSCHOOLPEL 5 SMALLSCHOOLPEL (o' Cycle)
12 BENTHINVHERB 14. SESSILEDETRIV 16. ZOOPLANKTON 17. DECOMPIMICROF 18. Phytoplankton 20. Detritus
TOTAL
Predator: (6) LGGROUPERSCARN 2. SHARKRAYISCOMB 3. L-IMJACKSCARN
-
continued ...
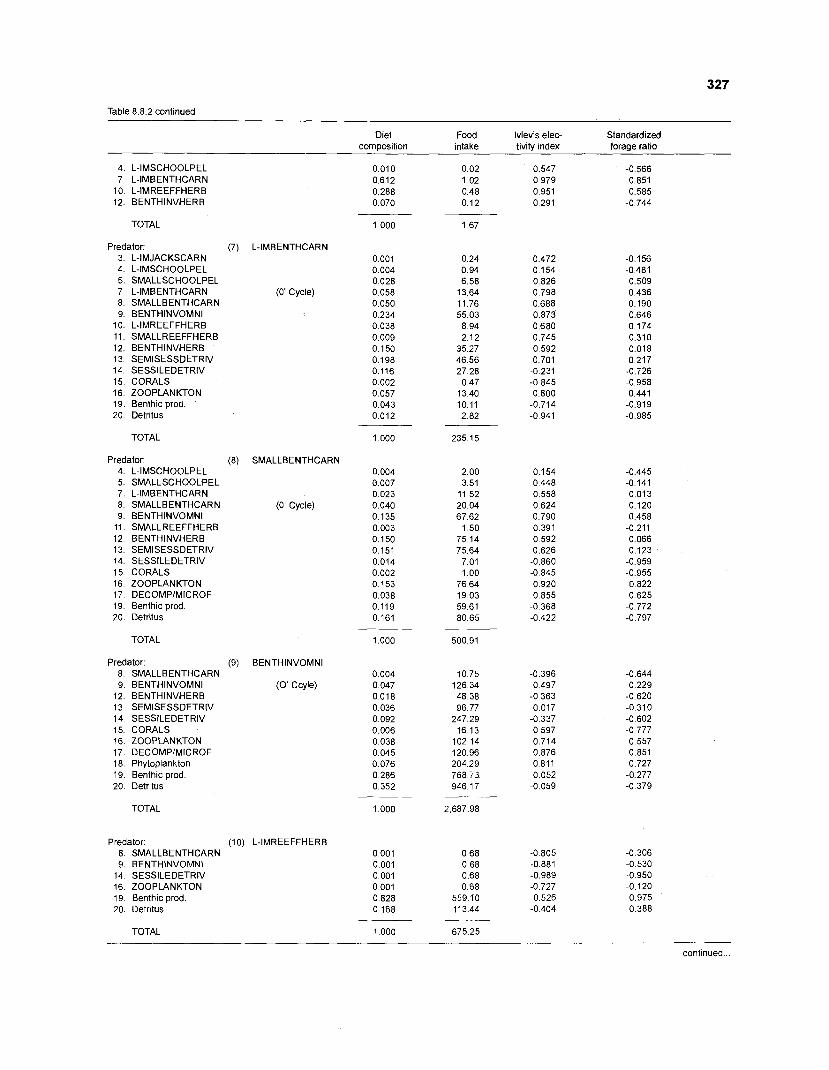
Table 8.8.2 continued
Diet Food Ivlev's elec- Standardized composition intake tivity mdex forage ratio
4. L-IMSCHOOLPEL 7. L-IMBENTHCARN
10. L-IMREEFFHERB 12. BENTHINVHERB
TOTAL
Predator: (7) L-IMBENTHCARN 3. L-IMJACKSCARN 4. L-IMSCHOOLPEL 5. SMALLSCHOOLPEL 7. L-IMBENTHCARN (O' Cycle) 8. SMALLBENTHCARN 9. BENTHINVOMNI
10. L-IMREEFFHERB 11. SMALLREEFFHERB 12. BENTHINVHERB 13. SEMISESSDETRIV 14. SESSILEDETRIV 15. CORALS 16. ZOOPLANKTON 19. Benthic prod. 20. Detritus
TOTAL
Predator: (8) SMALLBENTHCARN 4. L-IMSCHOOLPEL 5. SMALLSCHOOLPEL 7. L-IMBENTHCARN 8. SMALLBENTHCARN (0' Cycle) 9. BENTHINVOMNI
11. SMALLREEFFHERB 12. BENTHINVHERB 13. SEMISESSDETRIV 14. SESSILEDETRIV 15. CORALS 16. ZOOPLANKTON 17. DECOMPIMICROF 19. Benthic prod. 20. Detritus
TOTAL
Predator: (9) BENTHINVOMNI 8. SMALLBENTHCARN 9. BENTHINVOMNI (0 ' Ccyle)
12. BENTHINVHERB 13. SEMISESSDETRIV 14 SESSILEDETRIV 15. CORALS 16. ZOOPLANKTON 17. DECOMPIMICROF 18. Phytoplankton 19. Benthic prod. 20. Detritus
TOTAL
Predator: SMALLBENTHCARN BENTHINVOMNI SESSILEDETRIV ZOOPLANKTON Benthic prod. Detritus
TOTAL
(10) L-IMREEFFHERB
continued ...
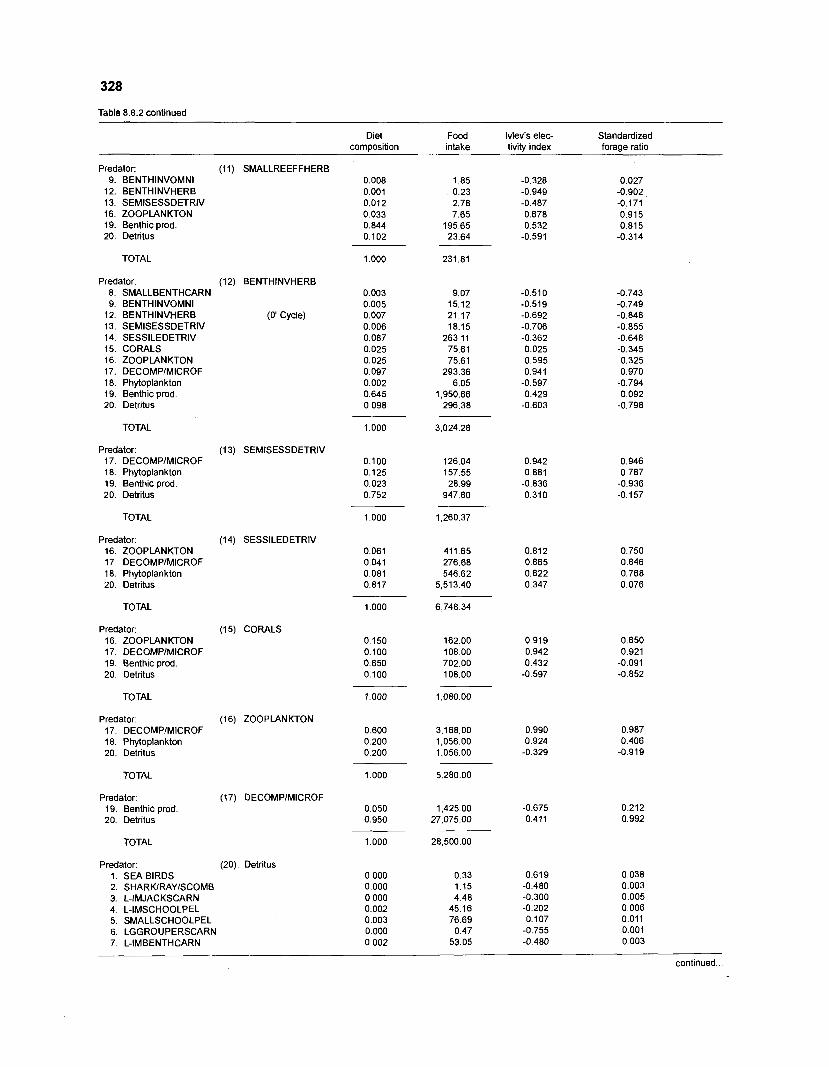
Table 8.8.2 continued
Diet Food Ivlev's elec- Standardized composition intake tivity index forage ratio
Predator: (11) SMALLREEFFHERB 9. BENTHINVOMNI
12. BENTHINVHERB 13. SEMISESSDETRIV 16. ZOOPLANKTON 19. Benthic prod. 20. Detritus
TOTAL
Predator: (12) BENTHINVHERB 8. SMALLBENTHCARN 9. BENTHINVOMNI
12. BENTHINVHERB 13. SEMISESSDETRN 14. SESSILEDETRIV 15. CORALS 16. ZOOPLANKTON 17. DECOMPIMICROF 18. Phytoplankton 19. Benthic prod. 20. Detritus
TOTAL
Predator: 17. DECOMPIMICROF 18. Phytoplankton 19. Benthic prod. 20. Detritus
TOTAL
Predator: 16. ZOOPLANKTON 17. DECOMPIMICROF 18. Phytoplankton 20. Detritus
TOTAL
Predator: 16. ZOOPLANKTON 17. DECOMPIMICROF 19. Benthic prod. 20. Detritus
TOTAL
Predator: 17. DECOMPIMICROF 18. Phytoplankton 20. Detritus
TOTAL
Predator: 19. Benthic prod. 20. Detritus
TOTAL
Predator: 1. SEA BIRDS 2. SHARWRAYISCOMB 3. L-IMJACKSCARN 4. L-IMSCHOOLPEL 5. SMALLSCHOOLPEL 6. LGGROUPERSCARN 7. L-IMBENTHCARN
(O' Cycle)
(13) SEMISESSDETRIV
(14) SESSILEDETRIV
(15) CORALS
(16) ZOOPLANKTON
(17) DECOMPIMICROF
(20) Detritus
continued
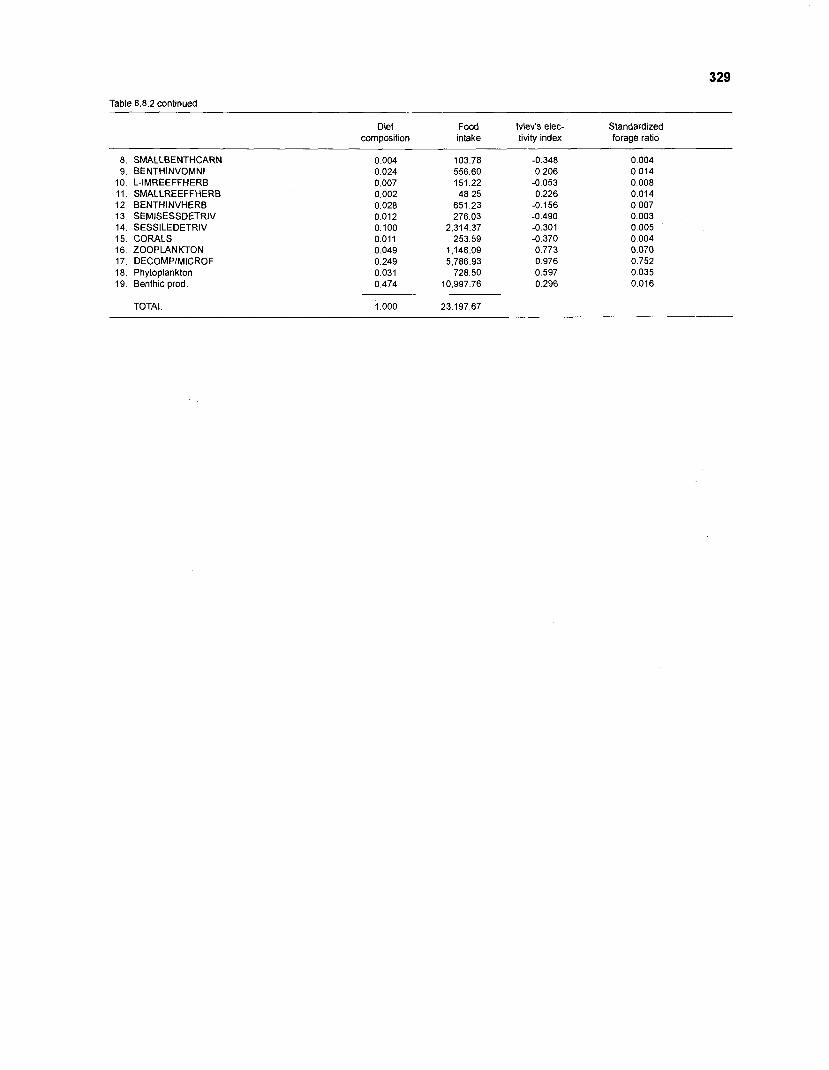
Table 8.8.2 continued
Diet Food Ivlev's elec- Standardized composition intake tivity index forage ratio
SMALLBENTHCARN BENTHINVOMNI L-IMREEFFHERB SMALLREEFFHERB BENTHINVHERB SEMISESSDETRIV SESSILEDETRIV CORALS ZOOPLANKTON DECOMPlMlCROF Phytoplankton Benthic prod.
TOTAL
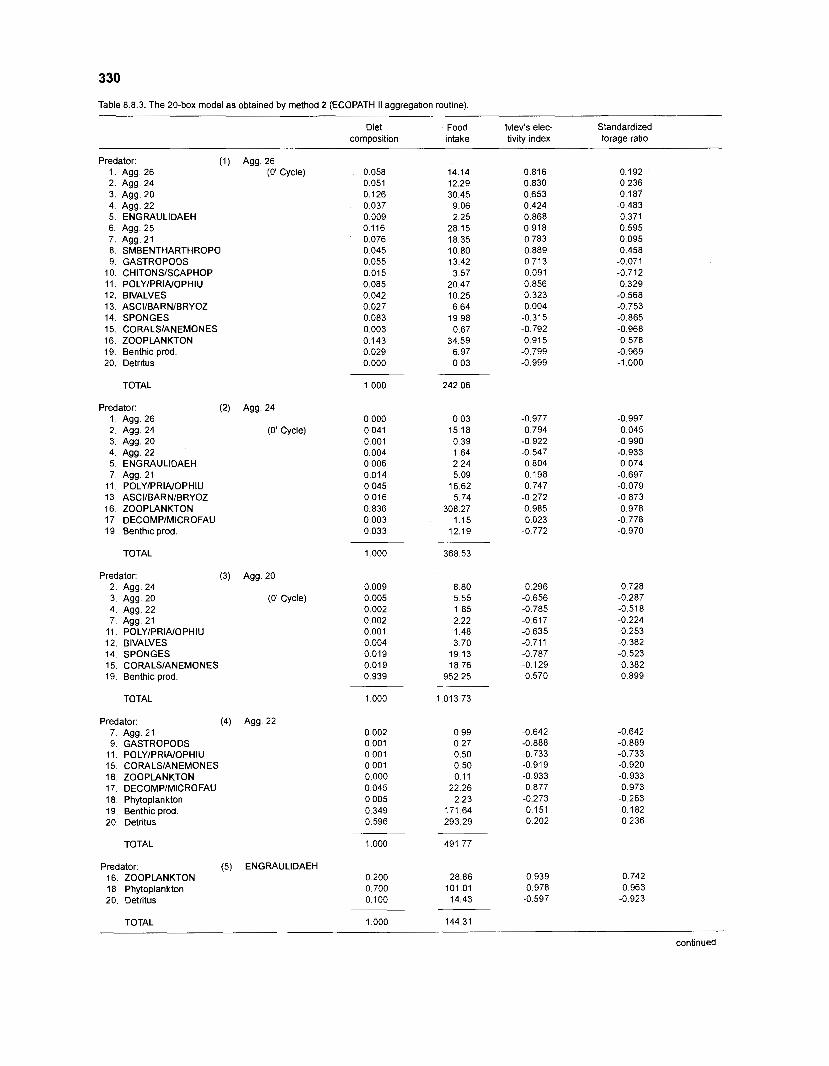
Table 8.8.3. The 20-box model as obtained by method 2 (ECOPATH II aggregation routine). -- -
Dlet Food composition lntake
Ivlev's elec- tivity index
Standardized forage ratio
Predator: (1) 1. Agg. 26 2. Agg. 24 3. Agg. 20 4. Agg. 22 5. ENGRAULIDAEH
Agg. 26 (O' Cycle) 0.058
0.051 0.126 0.037 0.009 0.116 0.076 0.045 0.055 0.015 0.085 0.042 0.027 0 083 0.003 0.143 0.029 0 000
6. Aaa. 25 7. ~ g g . 21 8. SMBENTHARTHROPO 9. GASTROPODS
10. CHITONSISCAPHOP 11. POLYIPRIAIOPHIU 12. BIVALVES 13. ASCIIBARNIBRYOZ 14. SPONGES 15. CORALSIANEMONES 16. ZOOPLANKTON 19. Benthic prod. 20. Detritus
TOTAL
Predator: 1. Agg. 26 2. Agg. 24 3. Agg. 20 4. Agg. 22 5. ENGRAULIDAEH 7. Agg. 21
11. POLYIPRIAIOPHIU 13. ASCIIBARNIBRYOZ 16. ZOOPLANKTON 17. DECOMPIMICROFAU 19. Benthic prod.
TOTAL
Predator: 2. Agg. 24 3. Agg. 20 4. Agg. 22 7. Agg. 21
11. POLYIPRIAIOPHIU 12. BIVALVES 14. SPONGES 15. CORALSIANEMONES 19. Benthic prod.
(3) Agg. 20
(0' Cycle)
TOTAL
Predator: 7. Agg. 21 9. GASTROPODS
11. POLYIPRIAIOPHIU 15. CORALSIANEMONES 16. ZOOPLANKTON 17 DECOMPIMICROFAU 18. Phytoplankton 19. Benthic prod. 20. Detritus
TOTAL
Predator: (5) 16. ZOOPLANKTON 18. Phytoplankton 20. Detritus
ENGRAULIDAEH 0.200 0.700 0.100
1.000 TOTAL
continued
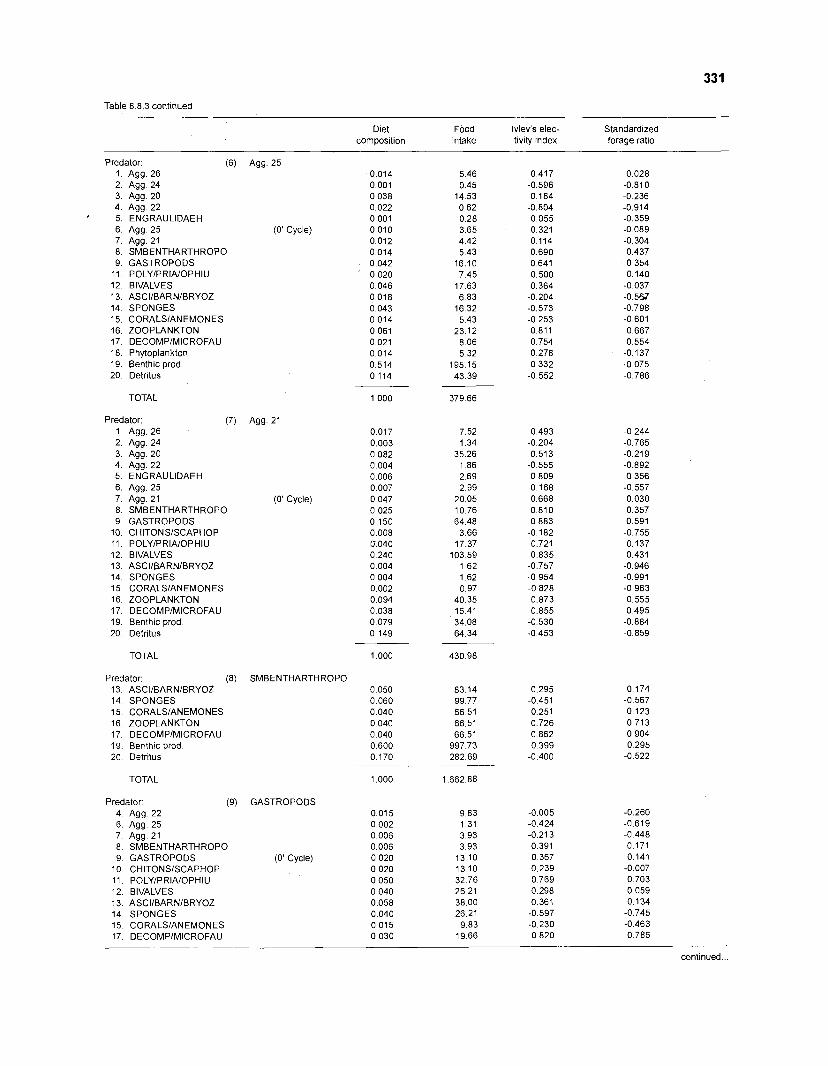
Table 8.8.3 continued
Diet Food Ivlev's elec- Standardized composition ~ntake tivity index forage ratio
Predator: 16) ~, Agg. 26 Agg 24 Agg. 20 Agg. 22 ENGRAULIDAEH Agg 25 Agg. 21 SMBENTHARTHROPO GASTROPODS POLYIPRIAIOPHIU BIVALVES ASCIIBARNIBRYOZ SPONGES CORALS/ANEMONES ZOOPLANKTON DECOMPIMICROFAU Phytoplankton Benthic prod. Detritus
TOTAL
Predator. Agg. 26 Agg. 24 Agg. 20 Agg. 22 ENGRAULIDAEH Agg. 25 Agg. 21 SMBENTHARTHROPO GASTROPODS CHITONSISCAPHOP POLYlPRlAlOPHlU BIVALVES ASCIIBARNIBRYOZ SPONGES CORALSIANEMONES ZOOPLANKTON DECOMPIMICROFAU Benthic prod. Detritus
TOTAL
Agg. 25 0.014 0.001 0.038 0.022 0.001
(0' Cycle) 0.010 0.012 0.014 0.042 0 020 0.046 0.018 0.043 0.014 0.061 0.021 0.014 0.514 0.114
Predator: (8) 13. ASCIIBARNIBRYOZ 14. SPONGES 15. CORALSIANEMONES 16. ZOOPLANKTON 17. DECOMPIMICROFAU 19. Benthic prod. 20. Detritus
TOTAL
Predator: (9) 4 Agg. 22 6. Agg 25 7. Agg 21 8. SMBENTHARTHROPO 9. GASTROPODS
10. CHITONSISCAPHOP 11. POLYIPRIAIOPHIU 12. BIVALVES 13. ASCIIBARNIBRYOZ 14. SPONGES 15 CORALSIANEMONES 17. DECOMPIMICROFAU
0 017 0.003 0.082 0.004 0.006 0.007
(0' Cycle) 0 047 0.025 0.150 0 008 0.040 0.240 0.004 0.004 0.002 0.094 0.038 0.079 0.149
1.000
SMBENTHARTHROPO 0.050 0.060 0.040 0 040 0.040 0.600 0.170
GASTROPODS 0.015 0.002 0.006 0.006
(0' Cycle) 0.020 0.020 0.050 0.040 0 058 0.040 0.015 0.030
continued ...
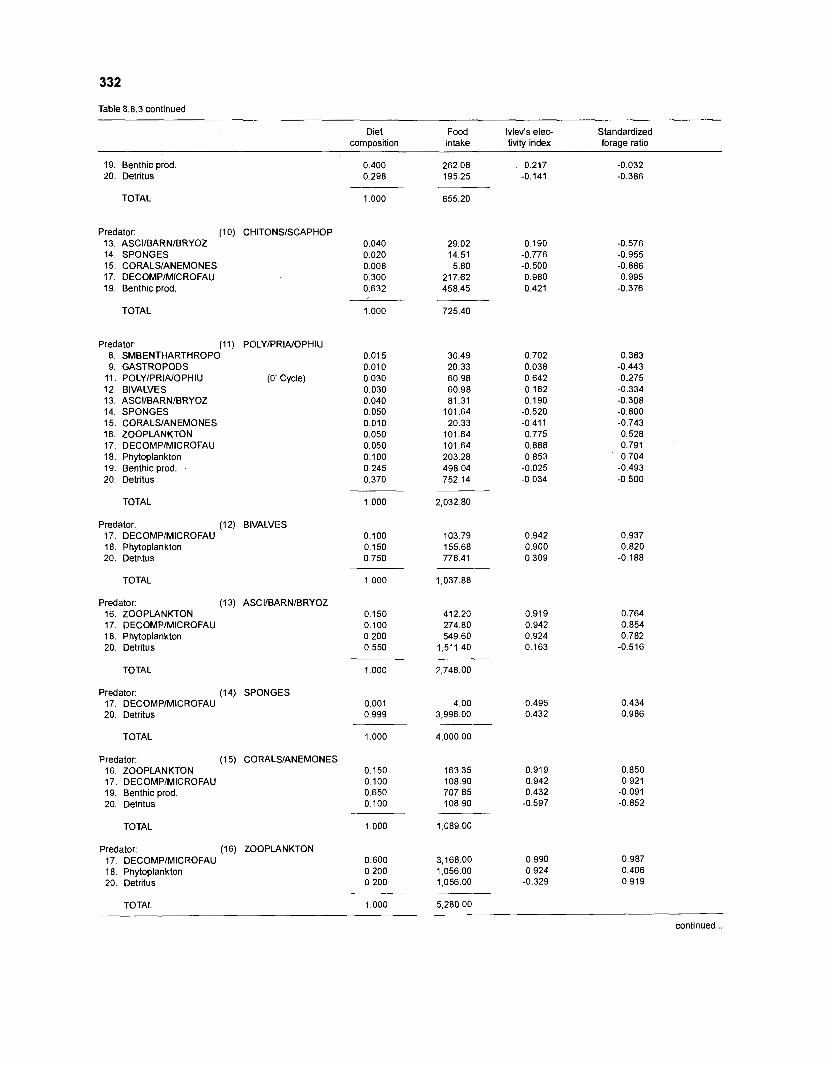
Table 8.8.3 continued
Diet Food Ivlev's elec- Standardized composition intake tivity index forage ratio
19. Benthic prod. 20. Detritus
TOTAL
Predator: (1 0) 13. ASCllBARNlBRYOZ 14. SPONGES 15. CORALSIANEMONES 17. DECOMPIMICROFAU 19. Benthic prod.
TOTAL
Predator: (11) SMBENTHARTHROPO GASTROPODS POLYIPRIAIOPHIU BIVALVES ASCllBARNlBRYOZ SPONGES CORALSIANEMONES ZOOPLANKTON DECOMPIMICROFAU Phytoplankton Benthic prod. Detritus
TOTAL
Predator: (1 2) 17. DECOMPIMICROFAU 18. Phytoplankton 20. Detritus
TOTAL
Predator: (1 3) 16. ZOOPLANKTON 17. DECOMPIMICROFAU 18. Phytoplankton 20. Detritus
TOTAL
Predator: (1 4) 17. DECOMPIMICROFAU 20. Detritus
TOTAL
Predator: (1 5) 16. ZOOPLANKTON 17. DECOMPIMICROFAU 19. Benthic prod. 20. Detritus
TOTAL
Predator: (1 6) 17 DECOMPIMICROFAU 18. Phytoplankton 20. Detritus
TOTAL
POLY/PRIA/OPHIU
(0' Cycle)
BIVALVES
ASCllBARNlBRYOZ
SPONGES
CORALSIANEMONES
ZOOPLANKTON
continued ...
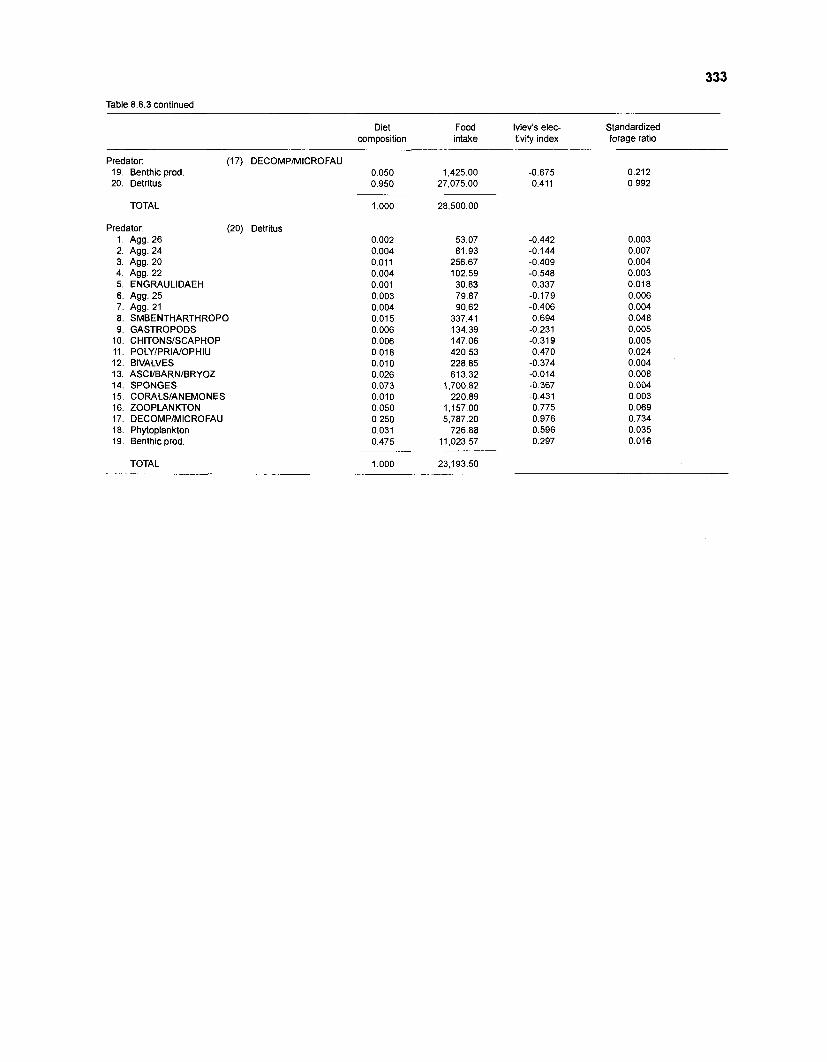
Table 8.8.3 continued
Diet Food Ivlev's elec- Standardized composition intake tivity index forage ratio
Predator: (17) DECOMPIMICROFAU 19. Benthic prod. 0.050 1,425.00 -0.675 0.212 20. Detritus 0.950 27,075.00 0.411 0.992
TOTAL 1.000 28,500.00
Predator: (20) Detritus Agg. 26 Agg. 24 Agg. 20 Agg. 22 ENGRAULIDAEH Agg. 25 Agg. 21 SMBENTHARTHROPO GASTROPODS CHITONSISCAPHOP POLY/PRIA/OPHIU BIVALVES ASCIIBARNIBRYOZ SPONGES CORALSIANEMONES ZOOPLANKTON DECOMPIMICROFAU Phytoplankton Benthic prod.
TOTAL
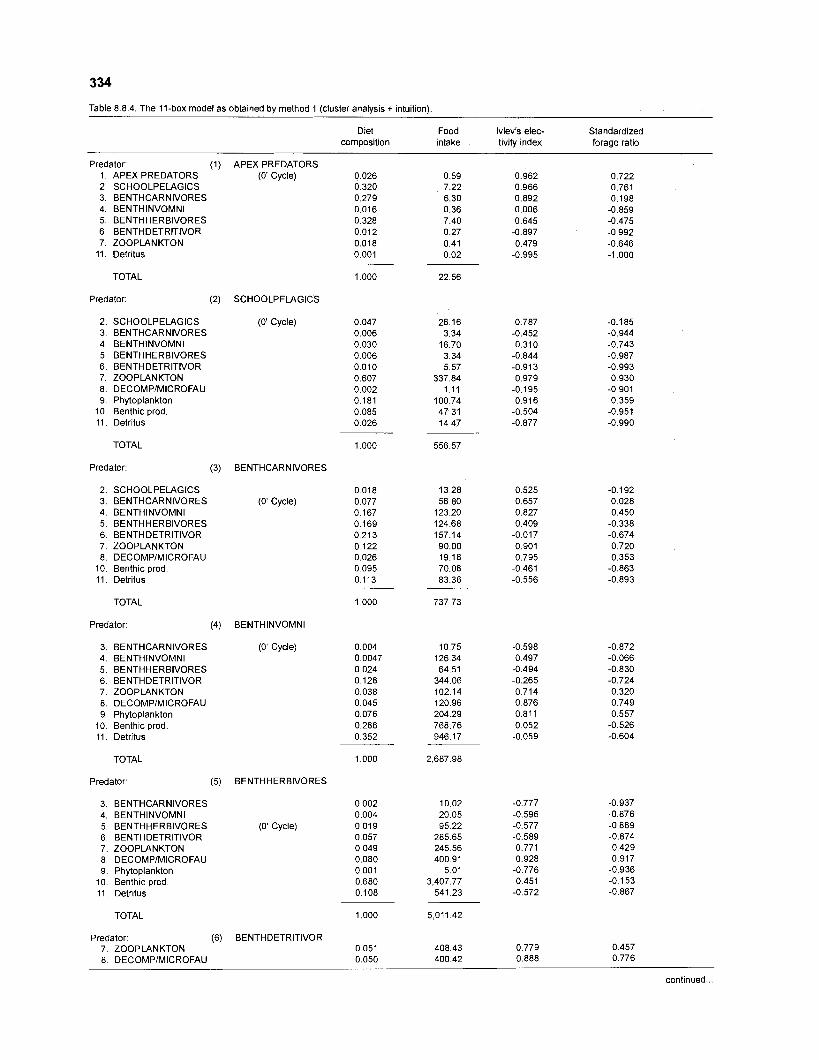
Table 8.8.4. The 11-box model as obtained by method 1 (cluster analysis + intuition).
Dtet Food Ivlev's elec- Standardized cornpositlon intake tiv~ty mdex forage ratio
Predator: (1) APEX PREDATORS 1. APEX PREDATORS (0' Cycle) 2. SCHOOLPELAGICS 3. BENTHCARNIVORES 4. BENTHINVOMNI 5. BENTHHERBIVORES 6. BENTHDETRITIVOR 7. ZOOPLANKTON
11. Detritus
TOTAL
Predator: (2) SCHOOLPELAGICS
SCHOOLPELAGICS (0' Cycle) BENTHCARNIVORES BENTHINVOMNI BENTHHERBIVORES BENTHDETRITIVOR ZOOPLANKTON DECOMPIMICROFAU Phytoplankton Benthic prod. Detritus
TOTAL
Predator: (3) BENTHCARNIVORES
2. SCHOOLPELAGICS 3. BENTHCARNIVORES (0' Cycle) 4. BENTHINVOMNI 5. BENTHHERBIVORES 6. BENTHDETRITIVOR 7. ZOOPLANKTON 8. DECOMPIMICROFAU
10. Benthic prod. 11. Detritus
TOTAL
Predator: (4) BENTHINVOMNI
BENTHCARNIVORES (0' Cycle) BENTHINVOMNI BENTHHERBIVORES BENTHDETRITIVOR ZOOPLANKTON DECOMPIMICROFAU Phytoplankton Benthic prod. Detritus
TOTAL
Predator. (5) BENTHHERBIVORES
3. BENTHCARNIVORES 4. BENTHINVOMNI 5. BENTHHERBIVORES (0' Cycle) 6. BENTHDETRITIVOR 7. ZOOPLANKTON 8 DECOMPIMICROFAU 9. Phytoplankton
10. Benthic prod. 11 Detritus
TOTAL
Predator: (6) BENTHDETRITIVOR 7. ZOOPLANKTON 8. DECOMPIMICROFAU
continued ...
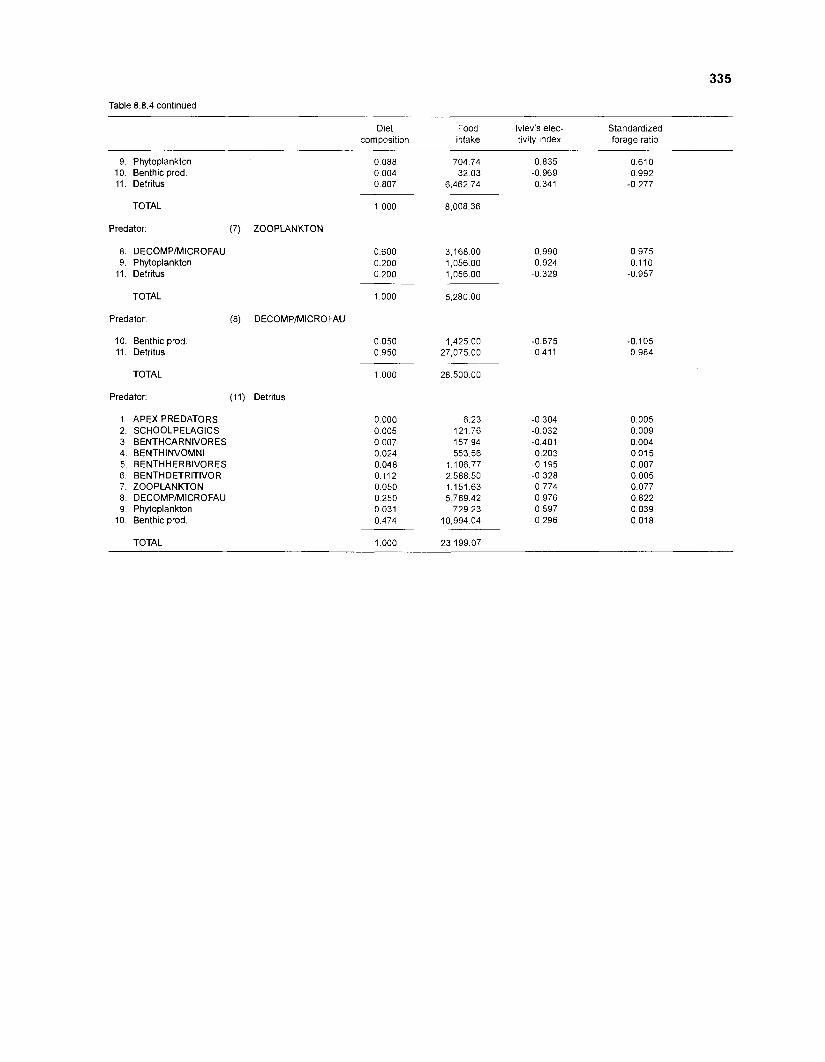
335
Table 8.8.4 continued
9. Phytoplankton 10. Benthic prod. 11. Detritus
TOTAL
Predator: (7) ZOOPLANKTON
DECOMPIMICROFAU Phytoplankton Detritus
TOTAL
Predator: (8) DECOMPIMICROFAU
10. Benthic prod 11. Detritus
TOTAL
Predator: (11) Detritus
1. APEX PREDATORS 2. SCHOOLPELAGICS 3. BENTHCARNIVORES 4. BENTHINVOMNI 5. BENTHHERBIVORES 6. BENTHDETRITIVOR 7. ZOOPLANKTON 8. DECOMPIMICROFAU 9. Phytoplankton
10. Benthic prod.
Diet composition
0.088 0 004 0.807
Food intake
704 74 32 03
6,462.74
Ivlev's elec- Standard~zed tivity mdex forage ratio
TOTAL
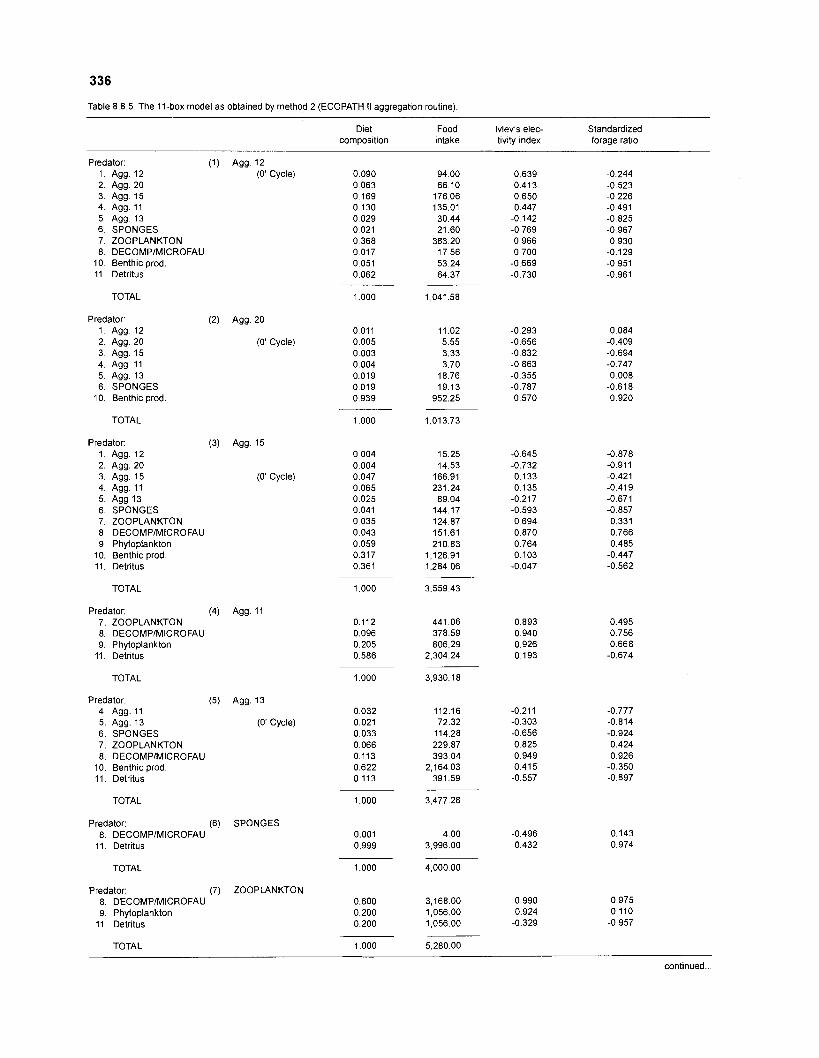
Table 8.8.5. The I l -box model as obtained by method 2 (ECOPATH 11 aggregation routine).
Diet Food Ivlev's elec- Standardized composition intake tivity index forage ratio
Predator: (1) A g g 1 2 1. Agg. 12 (0' Cycle) 2. Agg. 20 3. Agg. 15 4. Agg. 11 5. Agg. 13 6. SPONGES 7. ZOOPLANKTON 8. DECOMPIMICROFAU
10. Benthic prod. 11. Detritus
TOTAL
Predator. 1. Agg. 12 2. Agg. 20 3. Agg. 15 4. Agg 11 5. Agg. 13 6. SPONGES
10. Benthic prod
TOTAL
Predator: 1. Agg. 12 2. Agg. 20 3. Agg. 15 4. Agg. 11 5. Agg I 3 6. SPONGES 7. ZOOPLANKTON 8. DECOMPIMICROFAU 9. Phytoplankton
10. Benthic prod. 11. Detritus
TOTAL
Predator: (4) Agg. 11 7. ZOOPLANKTON 8. DECOMPIMICROFAU 9. Phytoplankton
11. Detritus
TOTAL
Predator: (5) Agg. 13 4. Agg. 11 5. Agg. 13 (0' Cycle) 6. SPONGES 7. ZOOPLANKTON 8. DECOMPIMICROFAU
10. Benthic prod. 11. Detritus
TOTAL
Predator: (6) SPONGES 8. DECOMPIMICROFAU
11. Detritus
TOTAL
Predator: (7) ZOOPLANKTON 8. DECOMPIMICROFAU 9. Phytoplankton
11. Detritus
TOTAL
continued ...
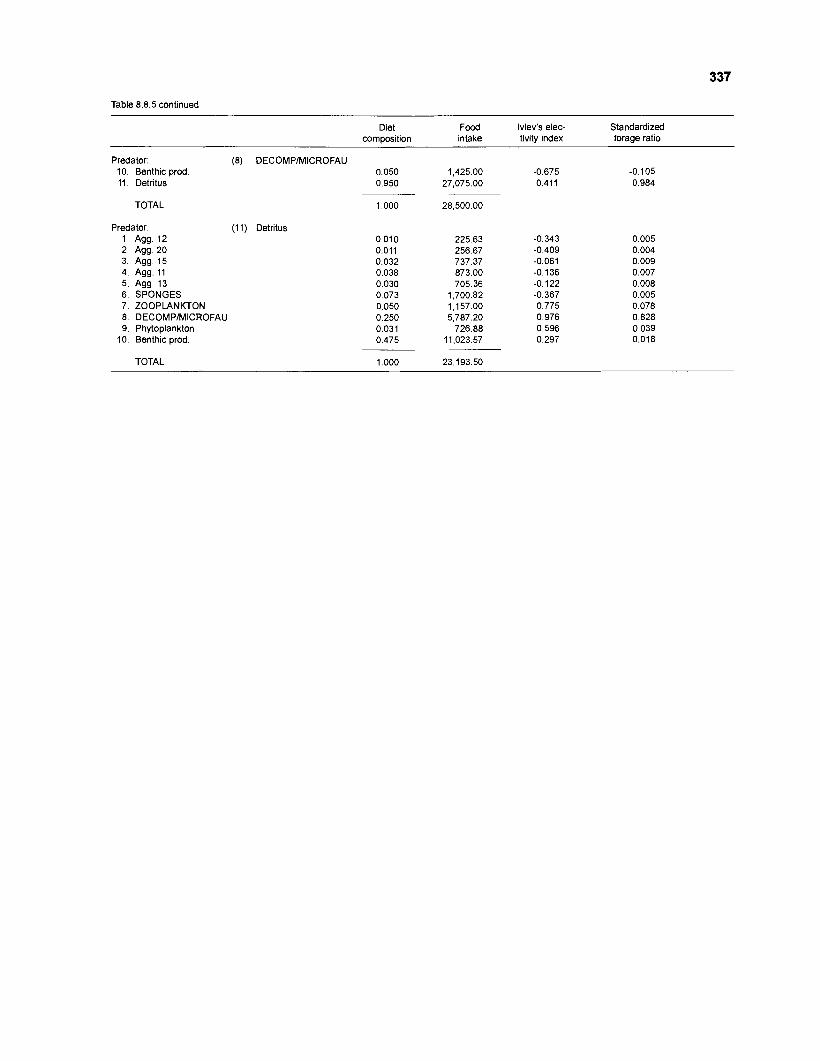
Table 8.8.5 continued
Diet Food Ivlev's elec- Standardized composition intake tivity index forage ratio
Predator: (8) 10. Benthic prod. 11. Detritus
TOTAL
Predator: 1. Agg. 12 2. Agg. 20 3. Agg. 15 4. Agg. 11 5. Agg. 13 6. SPONGES 7. ZOOPLANKTON 8. DECOMPIMICROFAU 9. Phytoplankton
10. Benthic prod.
TOTAL
DECOMPIMICROFAU 0.050 0.950
(11) Detritus
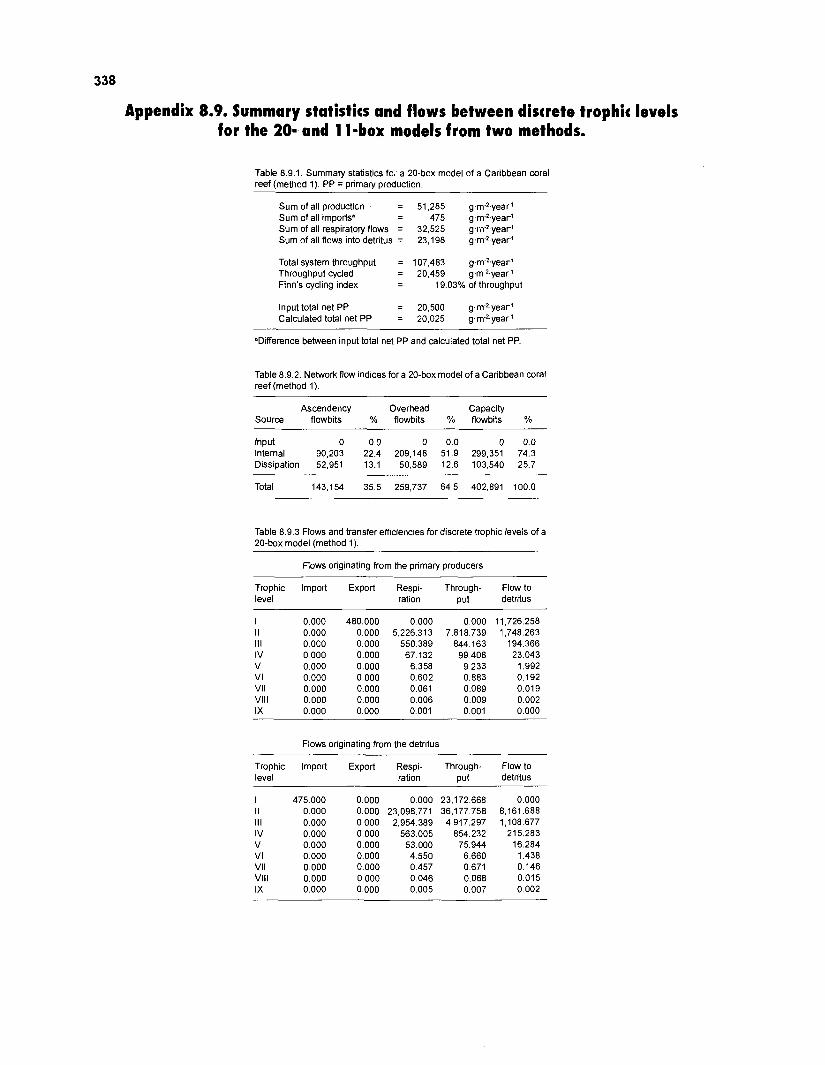
Appendix 8.9. Summary statistics and flows between discrete trophic levels for the 209 and 1 1-box models from two methods.
Table 8.9.1. Summary statistics fo, a 20-box model of a Caribbean coral reef (method 1). PP = primary production.
Sum of all producticn = 51,285 gm2.year1 Sum of all importsa = 475 gm2.year1 Sum of all respiratory flows = 32,525 g.rn".yearl Sum of all flows into detritus = 23,198 g.m4.year'
Total system throughput = 107.483 gm2.year1 Throughput cycled = 20,459 gm2.year' Finn's cycling index - - 19.03% of throughput
Input total net PP = 20,500 gm2.year' Calculated total net PP = 20,025 gm2.year1
"Difference between input total net PP and calculated total net PP.
Table 8.9.2. Network flow indices for a 20-box model of a Caribbean coral reef (method 1).
Ascendency Overhead Capacity Source flowbits % flowbits % flowbits %
Input 0 0 0 0 0.0 0 0.0 Internal 90,203 22.4 209,148 51.9 299,351 74.3 Dissipation 52,951 13.1 50,589 12.6 103,540 25.7
Total 143,154 35.5 259,737 64.5 402,891 100.0
Table 8.9.3 Flows and transfer efficiencies for discrete trophic levels of a 20-box model (method 1).
Flows originating from the primary producers
Trophic level
I I I 111 IV v VI VII Vlll IX
lmport Export Respi- ration
480.000 0.000 0.000 5,226.313 0.000 550.389 0.000 67.132 0.000 6.358 0.000 0.602 0.000 0.061 0.000 0.006 0.000 0.001
Through- put
Flow to detritus
Flows originating from the detritus
Trophic Import Export Respi- Through- Flow to level ration put detritus
I I I 111 IV v VI VII Vlll IX
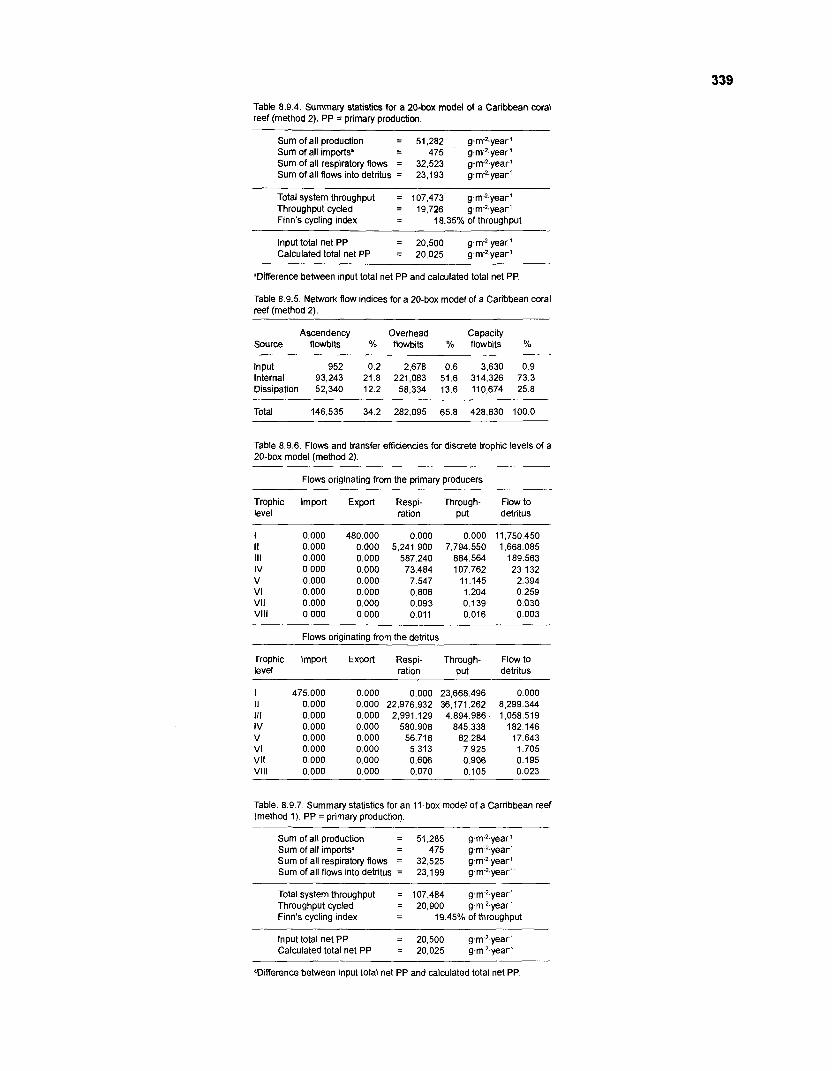
Table 8.9.4. Summary statistics for a 20-box model of a Caribbean coral reef (method 2). PP = primary production.
Sum of all production = 51,282 g.m2.year1 Sum of all importsa = 475 g.ma.yearl Sum of all respiratory flows = 32.523 g.m-2.year1 Sum of all flows into detritus = 23,193 gm2.year'
Total system throughput = 107,473 gm2.year1 Throughput cycled = 19,726 gm2.year' Finn's cycling index - - 18.35% of throughput
Input total net PP = 20,500 gm2.year1 Calculated total net PP = 20,025 g.m2.year1
"Difference between input total net PP and calculated total net PP
Table 8.9.5. Network flow indices for a 20-box model of a Caribbean coral reef (method 2).
Ascendency Overhead Capacity Source flowbits % flowbits % flowbits %
Input 952 0.2 2,678 0.6 3.630 0.9 Internal 93,243 21.8 221,083 51.6 314,326 73.3 Dissipation 52,340 12.2 58,334 13.6 110,674 25.8
Total 146.535 34.2 282.095 65.8 428,630 100.0
Table 8.9.6. Flows and transfer efficiencies for discrete trophic levels of a 20-box model (method 2).
Flows originating from the primary producers
Trophic Import Export Respi- Through- Flow to level ration put detritus
I 0.000 480.000 0.000 I I 0.000 0.000 5.241.900 111 0.000 0.000 587.240 IV 0.000 0.000 73.484 v 0.000 0.000 7.547 VI 0.000 0.000 0.806 VII 0.000 0.000 0.093 Vlll 0.000 0.000 0.011
--
Flows oriainatina from the detr~tus
Troph~c Import Export Respl- Through- Flowto level ration put detr~tus
I II 111 IV v VI VII Vlll
Table. 8.9.7. Summary statistics for an 11-box model of a Carribbean reef (method 1). PP = primary production.
Sum of all production = 51,285 g.m-2-year1 Sum of all importsa = 475 gm2.year1 Sum of all respiratory flows = 32,525 g-m-2.year1 Sum of all flows into detritus = 23,199 gm2.year1
Total system throughput = 107,484 g.ma.yearl Throughput cycled = 20,900 g-m2.year1 Finn's cycling index - - 19.45% of throughput
Input total net PP = 20,500 g m 2 year1 Calculated total net PP = 20,025 gm2.year'
'Difference between input total net PP and calculated total net PP.
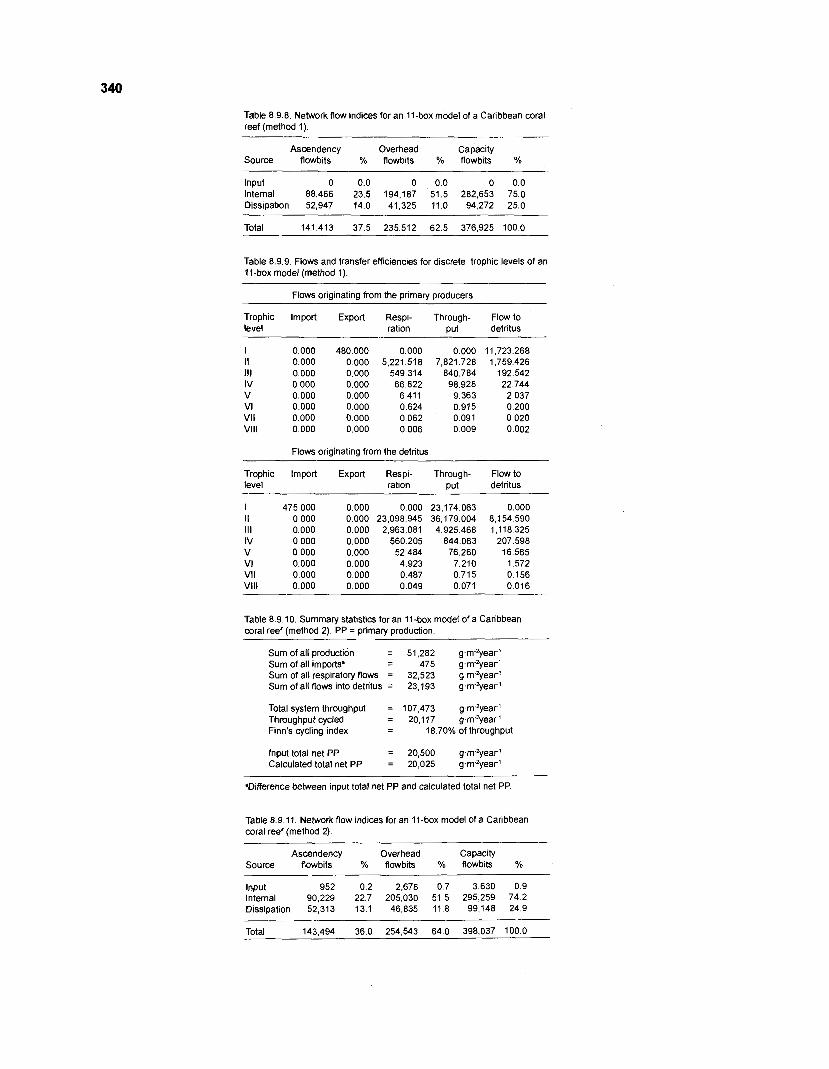
Table 8.9.8. Network flow indices for an 11-box model of a Caribbean coral reef (method 1).
Ascendency Overhead Capacity Source flowbits % flowbits % flowbits %
Input 0 0.0 0 0.0 0 0.0 Internal 88.466 23.5 194,187 51.5 282,653 75.0 Dissipation 52,947 14.0 41,325 11.0 94.272 25.0
Total 141,413 37.5 235,512 62.5 376,925 100.0
Table 8.9.9. Flows and transfer efficiencies for discrete trophic levels of an 11-box model (method 1).
Flows originating from the priman/ producers
Trophic Import Export Respi- Through- Flow to level ration Put detritus
I II 111 IV v VI VII Vlll
Flows originating from the detritus
Trophic Import Export Respi- Through- Flowto level ration put detritus
I 475.000 I I 0.000 111 0.000 IV 0.000 v 0.000 VI 0.000 VII 0.000 Vlll 0.000
Table 8.9.10. Summary statistics for an 11-box model of a Caribbean coral reef (method 2). PP = primary production.
Sum of all production = 51,282 gm2year' Sum of all importsa = 475 g.m-2year' Sum of all respiratoly flows = 32,523 g-m-'year1 Sum of all flows into detritus = 23,193 gm2year'
Total system throughput = 107,473 gm2year' Throughput cycled = 20,117 gm2year' Finn's cycling index - - 18.70% of throughput
Input total net PP = 20,500 g.m"yearl Calculated total net PP = 20,025 gm2year'
"Difference between input total net PP and calculated total net PP.
Table 8.9.11. Network flow indices for an 11-box model of a Caribbean coral reef (method 2).
Ascendency Overhead Capacity Source flowbits % flowbits % flowbits % -- -
Input 952 0.2 2,678 0.7 3,630 0.9 Internal 90,229 22.7 205,030 51.5 295,259 74.2 Dissipation 52,313 13.1 46,835 11.8 99,148 24.9
Total 143,494 36.0 254,543 64.0 398,037 100.0
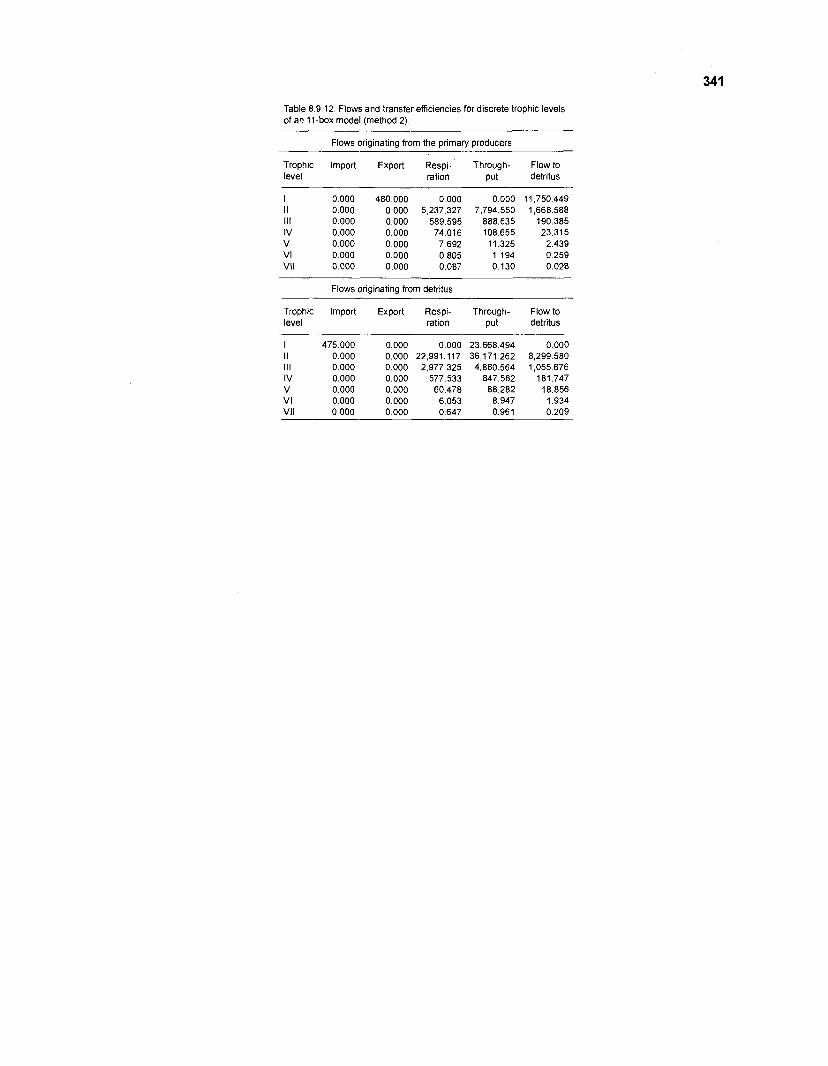
Table 8.9.12. Flows and transfer efficiencies for discrete trophic levels of an 11-box model (method 2).
Flows originating from the primaly producers
Trophic Import Export Respi- Through- Flowto level ration put detritus
I 0.000 480.000 0.000 0.000 11,750.449 I I 0.000 0.000 5,237.327 7,794.550 1,668.588 111 0.000 0.000 589.595 888.635 190.385 IV 0.000 0.000 74.016 108.655 23.315 V 0.000 0.000 7.692 11.325 2.439 VI 0.000 0.000 0.805 1.194 0.259 VII 0.000 0.000 0.087 0.130 0.028
Flows originating from detritus
Trophic Import Export Respi- Through- Flowto level ration put detritus
I 475.000 0 000 0.000 23,668.494 0.000 I I 0.000 0.000 22,991.117 36,171.262 8,299.580 111 0.000 0.000 2,977.325 4,880.564 1,055.676 IV 0.000 0.000 577.533 847.562 181.747 V 0.000 0.000 60.478 88.282 18.856 VI 0.000 0 000 6.053 8.947 1.934 VII 0.000 0 000 0.647 0.961 0.209
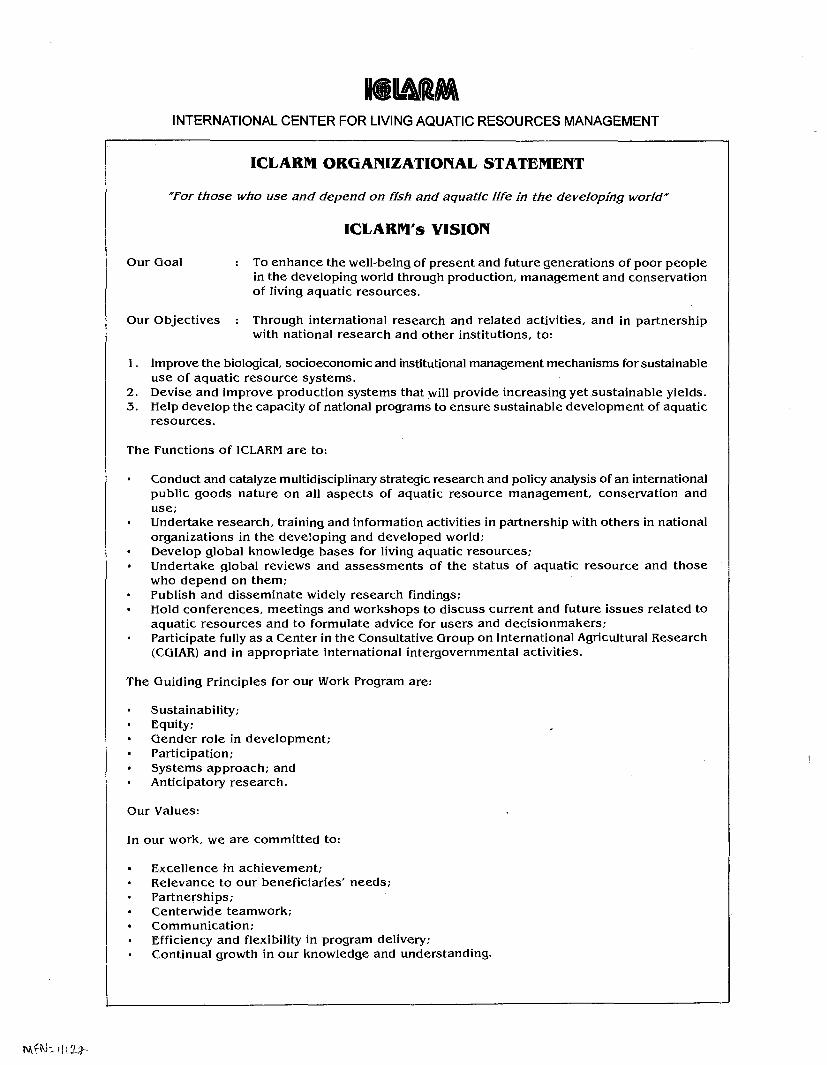
INTERNATIONAL CENTER FOR LIVING AQUATIC RESOURCES MANAGEMENT
ICLARM ORGANIZATIONAL STATEMENT
"For those who use and depend on fish and aquatic life in the developing world"
ICLARM's VISION
Our Goal : To enhance the well-being of present and future generations of poor people in the developing world through production, management and conservation of living aquatic resources.
Our Objectives : Through international research and related activities, and in partnership with national research and other institutions, to:
1 . Improve the biological, socioeconomic and institutional management mechanisms for sustainable use of aquatic resource systems.
2. Devise and improve production systems that will provide increasing yet sustainable yields. 3. Help develop the capacity of national programs to ensure sustainable development of aquatic
resources.
The Functions of ICLARM are to:
Conduct and catalyze multidisciplinary strategic research and policy analysis of an international public goods nature on all aspects of aquatic resource management, conservation and use; Undertake research, training and information activities in partnership with others in national organizations in the developing and developed world; Develop global knowledge bases for living aquatic resources: Undertake global reviews and assessments of the status of aquatic resource and those who depend on them; Publish and disseminate widely research findings; Hold conferences, meetings and workshops to discuss current and future issues related to aquatic resources and to formulate advice for users and decisionmakers; Participate fully a s a Center in the Consultative Group on International Agricultural Research (CGIAR) and in appropriate international intergovernmental activities.
The Quiding Principles for our Work Program are:
Sustainability; Equity: Gender role in development; Participation; Systems approach; and Anticipatory research.
Our Values:
In our work, we are committed to:
Excellence in achievement: Relevance to our beneficiaries' needs; Partnerships; Centerwide teamwork; Communication; Efficiency and flexibility in program delivery; Continual growth in our knowledge and understanding.