Embed Size (px)
Citation preview

Journal of Colloid and Interface Science 410 (2013) 43–51
Contents lists available at ScienceDirect
Journal of Colloid and Interface Science
www.elsevier .com/locate / jc is
High-yield aqueous phase exfoliation of graphene for facilenanocomposite synthesis via emulsion polymerization
0021-9797/$ - see front matter � 2013 Elsevier Inc. All rights reserved.http://dx.doi.org/10.1016/j.jcis.2013.08.006
⇑ Corresponding author. Fax: +61 2 93512854.E-mail address: [email protected] (V.G. Gomes).
Mahbub Hassan, Kakarla Raghava Reddy, Enamul Haque, Andrew I. Minett, Vincent G. Gomes ⇑School of Chemical and Biomolecular Engineering, The University of Sydney, NSW 2006, Australia
a r t i c l e i n f o
Article history:Received 22 April 2013Accepted 4 August 2013Available online 14 August 2013
Keywords:GrapheneExpanded graphitePolymerizationPolymeric nanocompositeThermal stabilityElectrical impedance
a b s t r a c t
Aqueous phase exfoliation was developed for producing high-yield graphene nanosheets from expandedgraphite (EG). The process included ultrasonication with sodium dodecyl sulfate (SDS) emulsion in aque-ous phase. The high throughput exfoliation process was characterized by UV–vis spectroscopy, transmis-sion electron microscopy (TEM) and electrical impedance spectroscopy (EIS). Controlled sonicationexperiments revealed that optimum exfoliation corresponds to maxima in UV–vis spectra. TEM resultsshowed that the exfoliated graphene comprised nanoflakes having 65 layers (�60%) and 610 layersfor 90% of the product. The potential use of this highly dispersed graphene was demonstrated by one-pot synthesis of graphene/polymer composite via in situ emulsion polymerization with styrene. The inte-grated role of SDS included adsorption and exfoliation of graphite, dispersion of graphene produced andassisting with micelle formation in emulsion. The high surface area graphene nanosheets as dispersedphase in polymeric nanocomposites showed significant improvement in thermal stability and electricalconductivity.
� 2013 Elsevier Inc. All rights reserved.
1. Introduction
Graphene is a two dimensional, atomistically thick planar sheetbuilt on sp2 hybridized carbon atoms. It is regarded as the funda-mental building block for all sp2 carbon allotropes including graph-ite in which large numbers of single layer graphene sheets arestacked together by weak van der Waals forces. Since the discoveryof mono-layer graphene by Geim et al. [1], subsequent studies havedemonstrated its outstanding properties [2], including exceptionalYoung’s modulus (1 TPa), intrinsic strength (130 GPa), thermalconductivity (>3 kW m�1 K�1), electron mobility (2.5 � 105 cm2 -V�1 s�1), ability to sustain high densities of electric current (>106
relative to copper) and ease of functionalization. Individual graph-ene nanosheets (GNS) and graphene based hybrid materials areemerging as fundamental building blocks for electronics [3], rein-forced composite materials [4] and multifunctional scaffolds inbiomedical applications [5].
Several routes have been developed for synthesis of grapheneand they fall under three major categories: liquid phase exfoliation[6], mechanical exfoliation [1], and substrate based deposition [7]and growth [8]. Graphene via liquid phase exfoliation has advanta-ges in terms of simplicity and yield, and is feasible for use in a widespectrum of applications. A current trend is to employ chemical
reactions, electrochemical potential and ultrasonication to exfoli-ate graphene in colloidal suspensions. Chemical reaction basedexfoliation method such as oxidation/reduction of graphite [6] isa widely exploited synthesis route; however, any covalent func-tionalization with molecular graphene causes irreversible latticedefects on the pristine electronic structure, thus compromisingits unique properties. Electrochemical technique as an alternativehas major drawbacks of low yield and some degree of defects inthe GNS produced [9]. In contrast, combined ultrasonication andnon-covalent functionalization of graphite in selected solventsare showing promise of ease in exfoliation with defect free rela-tively mono-layer graphene.
Early research [10,11] indicated mono-layer graphene exfolia-tion in NMP and DMF where the solvent surface energy is matchedto that of graphene and exfoliation occurs readily. However thesesolvents provide harsh treatments, are expensive and require spe-cial care in handling. Moreover, such dispersions are not suitablefor use in aqueous or biocompatible systems. Lotya et al. [12] pio-neered a surfactant assisted aqueous phase exfoliation of mono-layer graphene but still substantial potential exists for increase inthe yield and concentration of graphene relevant for industrialapplication.
An aim of our work was to develop a route with improvedyield, concentration and quality of graphene nanosheets throughsurfactant assisted aqueous phase exfoliation. This could beachieved by relaxation of the tightly held graphene sheets in

44 M. Hassan et al. / Journal of Colloid and Interface Science 410 (2013) 43–51
graphite prior to its final exfoliation process. The spacing betweenthe superposed sheets can be appreciably opened up to provideexpansion in the c-direction for an expanded or intumescedstructure. Graphite intercalation compounds (GICs) and its ther-mal expansion to expanded graphite (EG) has been an ideal pre-cursor for the widely used Hummers method for graphenesynthesis.
We aim to use EG as a precursor for direct exfoliation in theliquid phase via facile processing for high yield graphene produc-tion as shown schematically in Fig. 1, a promising route yet to beexplored fully. Li et al. [13] reported monolayer graphene exfolia-tion by oleum intercalation in EG, followed by extended processing(96 h) in the liquid phase. 4–5 wt% single/double layer graphene inDMF was prepared [14] using a re-exfoliated precursor from EG.However, the focus was largely on the role of repeat intercalationand exfoliation rather than liquid phase exfoliation. The extra stepof intercalation by acids and exfoliation at high temperatures raiseconcerns regarding product integrity and process expense. Besidesoverall process optimization and detail yield estimations were notperformed.
We present the production of graphene nanosheets in the aque-ous phase with sodium dodecyl sulfate (SDS), as a surfactant andstabilizing agent [15,16]. The unique properties of graphene canbe demonstrated as filler in manufacturing high performance com-posites. Preliminary work [17] has shown a very low content ofgraphene significantly enhanced properties of polymer nanocom-posite. A key challenge in using graphene in polymer-based com-posites is due to its native agglomerated state. We aimed at a90% yield of stable graphene in water having only a few layers(<10), starting from an EG intake of 1 mg/mL. The potential ofaqueous dispersion of graphene for one-pot industrial synthesiswas demonstrated by preparing high quality polymer compositesvia in situ emulsion polymerization. The nanocomposites synthe-sized with polystyrene and 1 wt% graphene nanosheets weretested for thermal stability and electrical conductivity to targetcorresponding applications. Our key objectives were to develop afacile route for the synthesis of high yield graphene nanosheetsand of graphene–polymer nanocomposites in the aqueous phasewithout the use of organic solvents or additives.
Fig. 1. Schematic for exfoliation of EG and o
2. Experimental details
2.1. Materials
Commercially available graphite intercalated compound (GIC,Asbury Graphite, USA), sodium dodecyl sulfate (SDS), styrene,potassium persulfate (KPS), sodium bicarbonate (NaHCO3) andmethyl alcohol were obtained from Sigma Aldrich. Deionized waterto Millipore standards was used for our experiments.
2.2. Synthesis of thermally expanded graphite
About 50 mg of GIC was placed on a small ceramic boat andloaded into a moving-bed tubular furnace (OTF-1200X, MTI Corpo-ration), preheated to 900 �C. The boat was placed at one end of the0.4 m axial path of the furnace and moved gently during a 10 s per-iod till it reached the oven exit. The thermally expanded exfoliatedgraphite was cooled to room temperature and removed from theboat for further processing.
2.3. Synthesis of graphene sheets
The EG obtained is held by weak van der Waals forces. Thus, toobtain the desired GNS, the EG was subjected to a final exfoliationstage. A dispersion was prepared in 20 mL distilled water by mix-ing 0.1 wt% EG with variable amounts (0.1–0.5 wt%) of SDS pow-der. The resulting mixture was sonicated for 60–80 min at roomtemperature. All sonication processes were carried out with a tiphorn sonicator (Branson 450D) with a cylindrical tip (10 mm endcap diameter). The output power was fixed at 30 W to deliver en-ergy at the 1650–1800 J/min level. The vial was placed in an icebath during sonication in order to prevent any significant rise intemperature. The dispersion produced was preserved for furtherprocessing and characterization.
2.4. Preparation of graphene–polymer composite
In situ emulsion polymerization, the most widely used methodin industry, was conducted to synthesize poly(styrene)–graphene
ne pot synthesis of polymer composite.

M. Hassan et al. / Journal of Colloid and Interface Science 410 (2013) 43–51 45
nanocomposite. For our one pot synthesis, graphene in aqueousmedia was used as the medium of choice. After removing sedi-ments (10%), the graphene dispersion (1 wt%) was sonicated for10 min and placed in a 500 mL reactor. Styrene 18.75 g (afterremoving butylcatechol inhibitor), SDS 0.25 g and 100 g waterwere charged into the reactor, equipped with temperature sensorsand magnetically driven agitator with pitched blade impeller(350 rpm). The temperature, controlled by a heater circulator(Julabo, Germany), was increased gradually to 70 �C. The initiator,KPS 0.075 g and buffer, NaHCO3 0.0125 g were simultaneouslypre-heated to 70 �C and added to the reactor under nitrogen atmo-sphere. The polymerization was conducted for 3 h, following whichboth the emulsion and oven-dried samples were stored forcharacterization.
3. Results and discussion
3.1. UV–vis spectra of graphene
UV–vis absorption spectra (Varian Cary 50) were measured atwavelengths of 200–1100 nm. Samples were taken at regular inter-vals during sonication and diluted by a factor of 10. The baselineused was the original SDS solution diluted by the same factor un-der the same conditions as the samples.
Dispersed graphene sheets respond to UV–vis excitation andshow characteristic peaks corresponding to p–p� transitions of aro-matic CAC bonds and additional absorption for quasi 2D van Hovesingularities [18]. However, the peaks for graphite or micro-platelet graphite (Fig. 2b) are not significant at this characteristicwavelength as the photoluminescence is suppressed due toelectronic compressibility developed by the polarization effectfrom adjacent layers in tight stacks. On considering these limitswe can establish relationships between the exfoliated grapheneand the intensity of the corresponding absorption spectrum tomonitor the exfoliation dynamics, the dispersion process andoptimal sonication time under specified conditions.
Fig. 2 shows UV–vis spectra for variable degrees of exfoliatedgraphene with 0.3 wt% SDS dispersion as a function of sonicationtimes. A strong absorbance band at about 270 nm is noted for eachsample taken at 10 min intervals for 80 min continuous ultrasoni-cation with a 10 mM SDS background spectrum (Fig. 2a).This characteristic peak 270 nm is attributed to the presence of
Fig. 2. Evolution of UV–vis spectra for aqueous phase dispersion of 0.1 wt% EG and0.3 wt% SDS as functions of sonication time.
sp2-conjugated pristine graphene nanosheets successfully exfoli-ated by SDS-assisted ultrasonication process [19]. In addition, thebasal planes and edges of our synthesized graphene are relativelyfree of oxygen moieties (C@O), as no peak is observed at 300 nm[14]; this indicates the formation of graphitic structure with min-imum (below measurement threshold) chemical defect.
3.2. Effect of SDS and ultrasonication on EG exfoliation
Due to instantaneous voltage fluctuations, sonication powerspectrum is not constant throughout the duration of the experi-ments. Since the energy delivered by sonication is related to soni-cation power and duration, hence it is appropriate to analyze theabsorbance in terms of total energy input rather than sonicationtime alone. We expect this approach to be effective in interpretingthe exfoliation and dispersion dynamics of EG in SDS solution dueto the time integration to even out the power fluctuations.
In Fig. 2, the UV–vis response of 0.1 wt% EG with 0.3 wt% SDSsolution shows that the characteristic peak for all samples is foundaround 270 nm but their absorbance intensities vary with differentsonication periods (0–80 min). The maximum absorbance inten-sity, found after 60 min (Fig. 2h) of sonication, is related to themaximum achievable exfoliation and dispersion of EG by SDS. Tofurther analyze the dispersion dynamics of 0.1 wt% EG in aqueousmedia, the absorbance intensity corresponding to each timeinterval is plotted as a function of total energy input (Fig. 3) withvariable concentration (0.1–0.5 wt%). The increasing trend of theUV–vis profiles up to 110 kJ are similar with clear maxima for0.3–0.5 wt% SDS and steady states beyond. The peak regionsignifies the role of optimum surfactant concentration in theaqueous phase exfoliation of GNS by ultrasonication.
With small amounts of SDS (Fig. 3a and b), the relatively lowadsorbances show inadequate intercalation and exfoliation evenwith successive increase in ultrasonic energy. Hence an inhomoge-neous aggregated dispersion is produced because of insufficientsurfactant to coat the exfoliated material produced. On the otherhand, the adsorbance of excess surfactant on GNS surface may re-tard charge transport through GNS network which is important forits electronic applications. Therefore, an optimum amount of sur-factant is essential that will lead to maximum exfoliation and dis-persion of GNS.
The total energy used in the exfoliation process also plays animportant role for the method to be effective as low energies pro-duce incomplete exfoliation, while relatively high energies maycause defects in the physical structure of GNS. We find that the30 W input from sonication produces reasonable result in terms
Fig. 3. Evolution of maximum absorbance for 0.1 wt% EG in aqueous media withvariable SDS concentration.
46 M. Hassan et al. / Journal of Colloid and Interface Science 410 (2013) 43–51
of time and SDS concentration. From Fig. 3 we note that with60 min ultrasonication (equivalent to 108 kJ energy) use of EG toSDS ratio 0.1:0.3 wt% is close to an optimum for our capacity.
The ripples in individual curves of Fig. 3 is probably due to theoccurrence of disproportionate fraying at nanoscale interfaces ofSDS and EG. Previous work [20] noted that the ends of SWCNTsbundles are ‘‘frayed’’ by local shear during sonication and becomesites for additional SDS adsorption; the SDS molecules therebygradually help exfoliate the SWCNT bundles via an ‘‘unzippering’’mechanism. In case of EG edges, a similar mechanism with a differ-ent outcome is anticipated due to the nature of the loosely adheredCNTs and tightly attached graphene layers. Here the occurrence ofdisproportionate fraying is related to the heterogeneous dissipa-tion of mechanical and thermal energies which was observed inthe form of turbulence and uncontrolled temperature rise in ultra-sonication baths.
To confirm exfoliation of graphene nanosheets and to validatethe UV–vis data, TEM investigations were conducted. The TEM(JEM 1400, JEOL, Japan) experiments were performed with anaccelerating voltage till 120 kV with samples chosen randomlyfrom the bulk vial with ten-fold dilution in ethanol. The drop cast-ing method was employed to disperse graphene on a holey lacey200 mesh carbon coated grid.
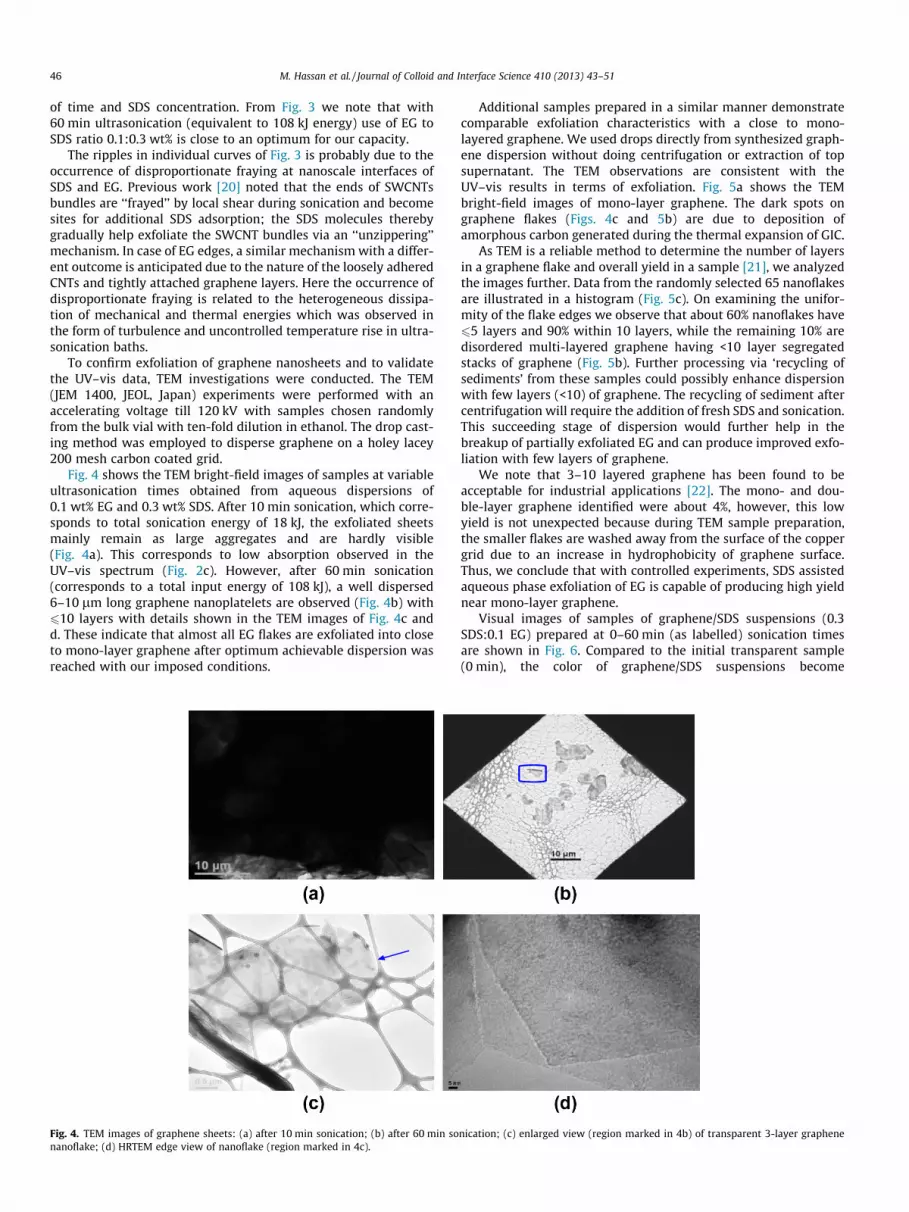
Fig. 4 shows the TEM bright-field images of samples at variableultrasonication times obtained from aqueous dispersions of0.1 wt% EG and 0.3 wt% SDS. After 10 min sonication, which corre-sponds to total sonication energy of 18 kJ, the exfoliated sheetsmainly remain as large aggregates and are hardly visible(Fig. 4a). This corresponds to low absorption observed in theUV–vis spectrum (Fig. 2c). However, after 60 min sonication(corresponds to a total input energy of 108 kJ), a well dispersed6–10 lm long graphene nanoplatelets are observed (Fig. 4b) with610 layers with details shown in the TEM images of Fig. 4c andd. These indicate that almost all EG flakes are exfoliated into closeto mono-layer graphene after optimum achievable dispersion wasreached with our imposed conditions.
Fig. 4. TEM images of graphene sheets: (a) after 10 min sonication; (b) after 60 min sonanoflake; (d) HRTEM edge view of nanoflake (region marked in 4c).
Additional samples prepared in a similar manner demonstratecomparable exfoliation characteristics with a close to mono-layered graphene. We used drops directly from synthesized graph-ene dispersion without doing centrifugation or extraction of topsupernatant. The TEM observations are consistent with theUV–vis results in terms of exfoliation. Fig. 5a shows the TEMbright-field images of mono-layer graphene. The dark spots ongraphene flakes (Figs. 4c and 5b) are due to deposition ofamorphous carbon generated during the thermal expansion of GIC.
As TEM is a reliable method to determine the number of layersin a graphene flake and overall yield in a sample [21], we analyzedthe images further. Data from the randomly selected 65 nanoflakesare illustrated in a histogram (Fig. 5c). On examining the unifor-mity of the flake edges we observe that about 60% nanoflakes have65 layers and 90% within 10 layers, while the remaining 10% aredisordered multi-layered graphene having <10 layer segregatedstacks of graphene (Fig. 5b). Further processing via ‘recycling ofsediments’ from these samples could possibly enhance dispersionwith few layers (<10) of graphene. The recycling of sediment aftercentrifugation will require the addition of fresh SDS and sonication.This succeeding stage of dispersion would further help in thebreakup of partially exfoliated EG and can produce improved exfo-liation with few layers of graphene.
We note that 3–10 layered graphene has been found to beacceptable for industrial applications [22]. The mono- and dou-ble-layer graphene identified were about 4%, however, this lowyield is not unexpected because during TEM sample preparation,the smaller flakes are washed away from the surface of the coppergrid due to an increase in hydrophobicity of graphene surface.Thus, we conclude that with controlled experiments, SDS assistedaqueous phase exfoliation of EG is capable of producing high yieldnear mono-layer graphene.
Visual images of samples of graphene/SDS suspensions (0.3SDS:0.1 EG) prepared at 0–60 min (as labelled) sonication timesare shown in Fig. 6. Compared to the initial transparent sample(0 min), the color of graphene/SDS suspensions become
nication; (c) enlarged view (region marked in 4b) of transparent 3-layer graphene

Fig. 5. (a) TEM of single layered graphene; (b) TEM of edges of a multilayered graphene flake overlapped by graphene stacks; (c) histogram of number of layers per flakeidentified by TEM images.
(a)
(b)
log (frequency, Hz)
Impe
danc
e (O
hm-m
2 )
Fig. 7. Electrical impedance of dispersion: (a) after 10 min and (b) after 60 minsonication.
M. Hassan et al. / Journal of Colloid and Interface Science 410 (2013) 43–51 47
increasingly darker with sonication time. This indicates increasedexfoliation of graphene nanosheets with sonication.
Besides microscopic and optical image based investigations, weperformed electrochemical characterization to verify the UV–visresults. Previous work [19] supports the idea that for graphene/SDS suspensions, increase in graphene concentration increasesthe overall conductivity of the dispersion. We used a high resolu-tion electrical impedance spectroscopy (EIS) (INPHAZE, Australia)to accurately determine changes in conductivity at the electrode/electrolyte interface. Two Ag/AgCl electrodes were used to mea-sure the electrical impedance of graphene dispersions in 10 mMKCl electrolyte over frequencies of 1–106 Hz. Fig. 7 shows theimpedance of samples after (a) 10 min and (b) 60 min ultrasonica-tion of EG. The impedance of sample (a) is consistently higherthroughout the frequency spectrum compared to those (Fig. 7)for sample (b). These trends denote that more effective conductivesurfaces have been created by ultrasonically assisted exfoliation ofgraphene nanosheets for the longer duration treatment whichspeeds up the charge transfer between the two electrodes.
Fig. 6. Optical images of graphene/SDS suspensions for 0–60 min sonication.
3.3. Raman spectra of graphene
Raman spectroscopy was used to probe the structural and elec-tronic properties of our graphene samples including defect struc-tures, defect density and number of layers. Raman spectra wererecorded using an Invia Raman spectrometer (Renishaw plc, UK)with laser excitation source at 514 nm. All samples were testedin a powder form on silicon wafer.
Raman spectra of graphene (Fig. 8) are characterized by threemain peaks, D, G and 2D. The D peak is due to the breathing modesof sp2 atoms in rings and the G peak is for the bond stretching of

48 M. Hassan et al. / Journal of Colloid and Interface Science 410 (2013) 43–51
sp2 atoms in both rings and chains. The 2D peak in graphene exhib-its the evolution of the electronic bands with the number of layers.
The Raman spectra of EG and exfoliated graphene sample(60 min sonication) show (Fig. 8) that the most intense peaks ofD, G and 2D are observed at wavelengths of 1350, 1580 and2700 cm�1, respectively. Another peak at 3250 cm�1 is greater thanthe G peak frequency by a factor of two; however, it is not of sec-ond order [22]. The peaks observed (Fig. 8) are due to graphiticstructures and none are observed for SDS when we compare theseto Raman spectra of SDS [19].
Flakes of thermally EG consist more than few layers of graphene[14] and the 2D peak of Raman spectrum of exfoliated graphite ishardly distinguishable from that of bulk graphite when the numberof graphene layers exceeds five [23]. However, a significant changeis observed with respect to shape and intensity of the 2D peak forour exfoliated graphene (Fig. 8b) compared to EG (Fig. 8a). The3 cm�1 right shift of G band and the 2 cm�1 left shift of 2D bandof exfoliated graphene (Fig. 8b) compared to the original peak po-sition of EG (Fig. 8a), indicate the formation of few layer [23].Moreover, for mono-layer graphene, the 2D peak is symmetricaland sharp. The nonsymmetrical peak with a shoulder attached ata lower wave number can be distinguished when the layers in-crease to 5 and beyond [24]. The inner shoulder peak of exfoliatedgraphene shifts to a lower level at 25 cm�1 (Fig. 8 inset) comparedto that for EG (Fig. 8a). Hence, we infer that there are less than fivelayers in our graphene samples. This finding also confirms our TEMobservations (Fig. 5c) where 60% of the flakes are within 5-layers.Thus, the broader and intense shape of the 2D band can be attrib-uted to the extensive exfoliation of EG to form few layered graph-ene sheets.
The defects in exfoliated graphene in comparison to the D bandof EG is relatively greater, however, the defect density (ID/IG = 0.07) is significantly smaller than the defects (ID/IG = 0.6) typ-ically caused by tip-horn ultrasonication [25] typically applied toachieve exfoliation of graphene directly from graphite. Thus, Ra-man spectroscopy confirms that the sonication of EG at low energyproduces high quality graphene with low sp2 disruption.
3.4. X-ray diffraction spectra of graphene
X-ray diffraction (XRD, Siemens D-5000, Cu Ka radiation) wasused to characterize the structural features of EG and the sampleobtained after 60 min sonication. Graphite is a highly condensedstack of layers of graphene sheets in which adjacent layers arenon-covalently attached by weak van der Waals forces. The adja-cent layer distance (d-spacing) in graphite is 0.33539 nm whichcorresponds to 2h angle 26.555� [26].
Fig. 8. Raman spectra of (a) EG and (b) exfoliated graphene obtained after 60 minsonication.
Fig. 9 shows that the (002) diffraction peak 2h for EG is 26.20�which corresponds to increase of interlayer spacing to 0.3398 nm.The d-spacing was calculated using the Bragg equation:
d ¼ nk2Sinh
where d is the spacing between the planes in the atomic lattice, n isan integer, k is the wavelength of incident X-ray beam, and h is theangle between the incident ray and the scattering planes.
The d-spacing value of EG is higher compared to the cited valueof graphite which can be related to the background preparationprocess of EG , in which intercalation and thermal expansion ofgraphite significantly diminish the cohesive forces between graph-ene laminates and enlarges the d-spacing. However, after ultrason-ication of EG, interlayer spacing further increases to 0.3424 nmcorresponding to 2h angle of 25.98� with a sharp and strong signal(Fig. 9b). Moreover, the center position at lower values of Fig. 9balso shows a larger spacing between layers. Thus, the XRD dataindicate greater extent of expansion of EG after ultrasonication inSDS assisted aqueous medium.
3.5. Stability of aqueous phase dispersion of graphene
Zeta-potential (Zetasizer-3000, Malvern Instruments, UK) mea-surements were performed to determine the aqueous dispersibilityof exfoliated graphene. Zeta-potential values indicate electro-kinetic potential of a colloidal system important for determiningthe stability of dispersions and suitability for polymerization pro-cess. For particles that are sufficiently small, a high zeta-potential(either positive or negative) confers stability, whereas a low valueindicates that attraction exceeds repulsion, and the dispersion willlikely flocculate [16]. Zeta-potential for graphene dispersion wasmeasured to be �39 mV which indicates good stability per ASTMcriteria [16,27]. This indicates that the SDS assisted aqueous dis-persion of graphene is suitable for emulsion polymerization withwater as the continuous phase.
3.6. Graphene–polymer nanocomposite structural characterization
We conducted one pot synthesis of poly(styrene)–graphenenanoplatelet (PS/GP) based composite via in situ emulsion poly-merization. The in situ process with the large surface area of thegraphene sheet provided excellent adhesion at the contact regions.This adhesion can be attributed to interactions between the phenylgroups in PS and in graphene through its p–p stacking. FTIR anal-ysis confirmed the chemical nature of the nanocomposite. Fig. 10Ashows the FTIR spectra (500–4000 cm�1 Varian 660-IR) of (a) pure
(b)
(a)
Fig. 9. XRD patterns for (a) worm like exfoliated graphite or EG and (b) exfoliatedgraphene after 60 min ultrasonication.

100 200 300 400 500 600 7000
20
40
60
80
100
(b)
(a)
Wei
ght l
oss
(Wt%
)
Temperature (oC)
340 360 380 400 420 440 460
(b)(a)
dw/d
t
Temperature (oC)
(A)
(B)Fig. 11. A. TG curves of the PS (a) and graphene-PS nanocomposite (b). B. DTGcurves of the PS (a) and graphene-PS nanocomposite (b).
M. Hassan et al. / Journal of Colloid and Interface Science 410 (2013) 43–51 49
PS and (b) PS/GP nanocomposite. Prominent peaks in PS nanopar-ticles and composite at approximately 2820–2967 cm�1, 2994–3043 cm�1, 1500 cm�1 and 700–1400 cm�1 indicate aliphaticCAH stretching, aromatic CAH stretching, aliphatic CH2A and dif-ferent conformation sensitive vibration modes of polystyrene,respectively. These confirm that the polymerization reaction pro-duced PS from styrene. The similarity in peaks for both samplessignifies that graphene/polystyrene nanocomposite was producedwith structural properties of graphene intact in the final product.The polystyrene nanospheres formed and coated on graphenesheets as shown in TEM measurements (Fig. 10B) and its high con-trast image (inset).
3.7. Thermal stability of PS/graphene
A material with high thermal stability, graphene improves theoverall thermal characteristics of the composite. Thermogravimet-ric analysis (TGA) of PS and PS/graphene composite were con-ducted (DST-Q600, TA Instruments, USA) under nitrogenatmosphere at a heating rate of 5 �C min�1. Fig. 11 shows the TGdata of (a) PS and (b) 1 wt% graphene–PS nanocomposite.
The sharp weight loss of both samples within the temperaturerange of 340–440 �C is due to main-chain pyrolysis of polymer.The degradation temperature of the nanocomposite has beenenhanced by about 18 �C compared to pure PS. This is becausegraphene assists in dissipating the heat efficiently, throughoutthe polymer matrix and retards thermal decomposition. This resultindicates that the well dispersed graphene sheets form strongp–p interaction with the polymers during in situ emulsionpolymerization.
The thermal behavior of graphene–PS nanocomposite and purePS are further probed using the derivative thermogram (DTG)curves (Fig. 11B). The DTG peaks of pure PS and graphene–PS are404.2 �C (Fig. 11B(a)) and 422.6 �C (Fig. 11B(b)), respectively dueto the thermal decomposition of the polymer chains. The higherdegradation temperature for the nanocomposite indicates greaterthermal stability for graphene–PS composite due to the stronginteraction between graphene nanosheets and PS nanoparticles.
3.8. Electrochemical characterization of synthesized graphene–polystyrene composite
The electrical conductivity of the GNS–PS nanocomposites wasmeasured at room temperature by a four-probe electro-conduc-tance method (JANDEL, UK). We measured the conductances ofthe GNS–PS nanocomposite (1.0 wt% GNS) and pure PS to be
Fig. 10. A. FTIR spectra of (a) polystyrene and (b) PS/GP composite. B. TEM im
3.4 � 10�4 S/m and 10�10 S/m, respectively. Thus, the conductanceof the nanocomposite has been enhanced significantly by a factorof about 3 � 106. The nanocomposite is suitable for use in elec-tronic devices as it satisfies the limiting antistatic conductance of>10�6 S/m. The higher electrical conductivity of the nanocompositeis due to: (i) effective charge transfer from large surface area of thehighly conductive graphene, (ii) enhanced thermal stability ofgraphene which favors the mobility of electrons, (iii) morphologyof the ordered structure originating from the improved dispersionof graphene nanosheets.
age of composite (40–50 nm PS nanospheres coated on 3-layer graphene).

(A) (B)
(a)
(b)
Fig. 12. A. CV at 50 mV/s scan rate using: (a) bare GCE (�) and (b) PS/graphene modified GCE (�). B. CV with PS/graphene modified GCE at 25–200 mV/s scan rates.
50 M. Hassan et al. / Journal of Colloid and Interface Science 410 (2013) 43–51
To confirm our result from the four probe method, we per-formed cyclic voltametry (CV) to ascertain the uniform percolationnetwork formation throughout the composite. CV measurementswere undertaken with an electrochemical analyzer (SP300, Bio-Logic Science Instruments, France). A conventional three-electrodecell was used, including a glassy carbon electrode (GCE) as theworking electrode, an Ag/AgCl (saturated KCl) electrode as thereference electrode, and a platinum foil as the counter electrodein 0.1 M H2SO4. The CV curves (Fig. 12) show that larger currentdensities are achieved with GCE modified by PS/graphene nano-composite (Fig. 12A(b)) compared to bare GCE (Fig. 12A(a)). Sincepolystyrene is an insulator, the high electrochemical activitiesexhibited by GNS–PS nanocomposites are due to the dispersionof the conductive graphene nanosheets in the polymer matrix.
Fig. 12B shows that the anodic and cathodic current densitiesbecome wider as the scan rates increase gradually from 25 to200 mV/s. These results indicate that effective conductive percola-tion networks are developed in the composite by the anchoring ofPS nanospheres (TEM, Fig. 10b) at the defect sites generated duringsonication at basal planes and edges of graphene nanosheets (in-tense D peak in Raman spectra, Fig. 8b). Thus, the conductiveGNS–PS composite is suitable for use in electro-active devices rel-ative to the polymer substrate.
4. Conclusions
We developed a facile method to produce high yield graphenenanosheets from expanded graphite using SDS assisted aqueousphase exfoliation with ultrasonication. Graphene sheets were exfo-liated by sonication due to the weaker interlayer forces in EG andsubsequent dispersive effects in water with SDS. The sonication-driven exfoliation mechanism and the factors optimizing itsefficiency was investigated using UV–vis spectroscopy and subse-quently with TEM, EIS, Raman spectroscopy and XRD. Themaximum achievable degree of exfoliation of graphene was at-tained after 60 min of ultrasonication using 0.1 EG:0.3 SDS (wt%)with 30 W power input. TEM observations revealed that 90%graphene having 610 layers were obtained. The features of the2D peak in Raman spectra indicate the presence of mostly nearmono-layer graphene. The XRD pattern of graphene shows a sharpintense peak which corresponds to increase in interlayer spacingfrom 0.3398 nm to 0.3424 nm. The zeta potential value of�39 mV was found to be within satisfactory range for colloidal sta-bility. The nanoscale distribution of graphene nanosheets, helped
in significantly enhancing the thermal stability and in a 6-fold in-crease in electrical conductivity of the GNS–PS nanocomposite overpure PS. The method developed is suitable for high-yield exfolia-tion of other nanosheets (e.g., molybdenum sulfite), and forsynthesis of graphene based composites with polymers. Investiga-tions on potential applications for sensing and catalysis withGNS-based nanocomposites are currently in progress.
Acknowledgments
MH gratefully acknowledges a scholarship based on ARC Link-age project and the assistance received from Ghasemi with TEM,Dr. Darestani for EIS and Faisal for CV while conducting experi-ments for this project.
References
[1] K.S. Novoselov, A.K. Geim, S.V. Morozov, D. Jiang, Y. Zhang, S.V. Dubonos,Science 306 (2004) 666–669.
[2] K.S. Novoselov, V.I. Falko, L. Colombo, P.R. Gellert, M.G. Schwab, K. Kim, Nature490 (2012) 192–200.
[3] M.F. El-Kady, V. Strong, S. Dubin, R.B. Kaner, Science 335 (2012) 1326–1330.[4] M. Fang, A.K. Wang, A.H. Lu, A.Y. Yanga, S. Nutt, J. Mater. Chem. 19 (2009)
7098–7105.[5] Y. Wang, Z. Li, J. Wang, J. Li, Y. Lin, Trends Biotechnol. 29 (2011) 205–212.[6] S. Stankovich, D.A. Dikin, R.D. Piner, K.A. Kohlhaas, A. Kleinhammes, Y. Jia, Y.
Wu, S.Y. Nguyen, R.S. Ruoff, Carbon 45 (2007) 1558–1565.[7] X. Li, W. Cai, J. An, S. Kim, J. Nah, D. Yang, R. Piner, A. Velamakanni, I. Jung, E.
Tutuc, S.K. Banerjee, L. Colombo, R.S. Ruoff, Science 324 (2009) 1312–1314.[8] Y.M. Lin, C. Dimitrakopoulos, K.A. Jenkins, D.B. Farmer, H.Y. Chiu, A. Grill, P.
Avouris, Science 327 (2010) 662.[9] N. Liu, F. Luo, H. Wu, Y. Liu, C. Zhang, J. Chen, Adv. Funct. Mater. 18 (2008)
1518–1525.[10] P. Blake, P.D. Brimicombe, R.R. Nair, T.J. Booth, D. Jiang, F. Schedin, L.A.
Ponomarenko, S.V. Morozov, H.F. Gleeson, E.W. Hill, A.K. Geim, K.S. Novoselov,Nano Lett. 8 (2008) 1704–1708.
[11] Y. Hernandez, V. Nicolosi, M. Lotya, F.M. Blighe, Z. Sun, S. De, Nat. Nanotechnol.3 (2008) 563–568.
[12] M. Lotya, Y. Hernandez, P.J. King, R.J. Smith, V. Nicolosi, L.S. Karlsson, J. Am.Chem. Soc. 131 (2009) 3611–3620.
[13] X. Li, G. Zhang, X. Bai, X. Sun, X. Wang, E. Wang, H. Dai, Nat. Nanotechnol. 3(2008) 538–542.
[14] S.R. Dhakate, N. Chauhana, S. Sharma, J. Tawale, S. Singh, P.D. Sahare, R.B.Mathur, Carbon 49 (2011) 1946–1954.
[15] K.R. Reddy, B.C. Sin, C.H. Yoo, D. Sohn, Y.J. Lee, J. Col, Int. Sci. 340 (2009) 160–165.
[16] U.K. Miftah, V.G. Gomes, I.S. Altarawneh, Carbon 48 (2010) 25–33.[17] S. Stankovich, D.A. Dikin, G.H.P. Dommett, K.M. Kohlhaas, E.J. Zimney, E.A.
Stach, R.D. Piner, Nature 442 (2006) 282–286.[18] G. Li, A. Luican, Nat. Phys. 6 (2010) 109–113.[19] M. Alanyalıoglu, J.J. Segura, J.O. Sole, N.C. Pastor, Carbon 50 (2012) 142–152.[20] M.S. Strano, V.C. Moore, M.K. Miller, M.J. Allen, E.H. Haroj, C. Kittrell, R.H.
Hauge, R.E. Smalley, J. Nanosci. Nanotechnol. 3 (2003) 81–86.

M. Hassan et al. / Journal of Colloid and Interface Science 410 (2013) 43–51 51
[21] J.C. Meyer, A.K. Geim, M.I. Katsnelson, K.S. Novoselov, T.J. Booth, S. Roth,Nature 446 (2007) 60–63.
[22] A.K. Geim, K.S. Novoselov, Nat. Mater. 6 (2007) 183–191.[23] A.C. Ferrari, Solid State Commun. 143 (2007) 47–57.[24] D. Graf, F. Molitor, K. Ensslin, S. Stampfer, A. Jungen, C. Hierold, L. Wirtz, Nano
Lett. 7 (2007) 238–242.
[25] T. Skaltsas, N. Karousis, H.J. Yan, C.R. Wang, S. Pispas, N. Tagmatarchis, J. Mater.Chem. 22 (2012) 21507–21512.
[26] X.S. Du, M. Xiao, Y.Z. Meng, A.S. Hay, Polym. Adv. Technol. 15 (2004) 320–323.[27] ASTM. Zeta potential of colloids in water and waste water, in: ASTM D 4187–
82. American Society for Testing and Materials, 1985.


