Embed Size (px)
Citation preview

Highly crystalline and oriented high-strength poly(ethyleneterephthalate) fibers by using low molecular weight polymer
Huseyin Avci,1,2 Mesbah Najafi,1 Ali Kilic,3 Richard Kotek1
1College of Textiles, Textile Engineering Chemistry and Science, North Carolina State University, Raleigh, North Carolina2Metallurgical and Materials Engineering, Eskisehir Osmangazi University, Eskisehir, Turkey3Department of Textile Engineering, Istanbul Technical University, Istanbul, TurkeyCorrespondence to: R. Kotek; (E - mail: [email protected])
ABSTRACT: High-strength poly(ethylene terephthalate) (PET) fibers were obtained using low molecular weight (LMW) polymervia
horizontal isothermal bath (hIB), followed by postdrawing process. We investigated the unique formations of different precursors,
which differentiated in its molecular orientation and crystalline structures from traditional high-speed spinning PET fibers. Sharp
increase in crystallinity was observed after drawing process even though the fibers showed almost no any crystallinity before the draw-
ing. Properties of as-spun and drawn hIB and control filaments at different process conditions were compared. As would be expected,
performances of resulted treated undrawn and drawn fibers have dramatically improved with developing unique morphologies. Tenac-
ities more than 8 g/d for as-spun and 10 g/d for drawn treated fibers after just drawn at 1.279 draw ratio were observed. These per-
formances are considerably higher than that of control fibers. An explanation of structural development of high-strength fibers using
LMW polymer spun with hIB is proposed. VC 2015 Wiley Periodicals, Inc. J. Appl. Polym. Sci. 2015, 132, 42747.
KEYWORDS: extrusion; fibers; mechanical properties; polyesters; X-ray
Received 25 March 2015; accepted 18 July 2015DOI: 10.1002/app.42747
INTRODUCTION
High-strength polyester fibers are widely used in industry and
our daily lives. Hence, studies on structural improvement of fil-
ament and its relation to production conditions have been
examined carefully by researchers for many years. This resulted
in 60% of the world’s total polyester production having been
consumed as fiber in 2010.1 In general, zone drawing/zone
annealing, microwave heating, one or two step drawing high-
speed spinning, vibrational hot drawing, two-step spin draw
processes, solution spinning, and solid-state extrusion are the
most important production methods to manufacture high-
performance polyester fibers.2,3 Structural development of fibers
in one-step high-speed spinning process is limited even if it
appears promising in the case of economical and high through-
puts. Therefore, two-step spin-draw and multistep drawing
processes are widely accepted and utilized to obtain high modu-
lus and tenacity polyester filaments.2,4 On the other hand, the
solution spinning technique is one of the crucial methods by
using ultra-high molecular weight polymers to produce high-
performance poly(ethylene terephthalate) (PET) fibers, but use
some organic solvents raise questions about their toxicity.5,6
This method is expensive and the production speed is slow.
Sometimes more than one bath is required in the production
lines and a very high draw ratio (DR) is needed to manufacture
high-performance fibers.
Full understanding of precursors for crystallization and crystalli-
zation in polyester fibers is limited because of fast crystallization
kinetic and the different formation of precursors. According to
process conditions and polymer properties, a number of precur-
sor models have been proposed. These precursors can be
nematic, smectic, other less unidentified structures, and some-
times microvoids and/or banded structure can be associated
with these forms.7 In addition, all these forms have some com-
mon structural properties, as they are highly oriented but have
noncrystallized molecular chains or chain segments. Nicholson
et al.8 have observed mesophase formation by drawing at the
drawing temperature of 1108C with the DR of 4 using a very
low oriented as-spun yarn. After the drawing process, the fibers
were rapidly cooled to inhibit the crystallization, which showed
a different usual form of triclinic and were described as
“mesophase” form. However, this mesophase form, yet still
exhibiting spatial order, was not very stable, and the annealing
process could easily destroy it. In addition, Carr et al.9 have
produced nematic phase by drawing PEN: Polyethylene naph-
thalate films uniaxially at 1208C at the DRs range from 3.5 to
5.5 with observing long-range noncrystalline order when the
VC 2015 Wiley Periodicals, Inc.
WWW.MATERIALSVIEWS.COM J. APPL. POLYM. SCI. 2015, DOI: 10.1002/APP.4274742747 (1 of 15)

drawing temperature increased to 1408C for the films which
showed a partially crystalline morphology. Generally, the meso-
phase forms when the sample is cooled rapidly after the proc-
essing to inhibit any crystallization. Afterwards, the drawing
process can be applied at the temperature close to the glass
transition temperature (Tg) or between glass transition and
crystal melting temperature.10 The critical DR is also very
important because it sets up the onset of the crystallization. As
seen in the past, the effect of temperature and DRs is significant
for crystallization in the polymers. Higher DRs for PET increase
the rate of strain-induced crystallization; however, the higher
temperature will lead to an increase in molecular mobility to
promote relaxation and crystallization.
Commonly, strain-induced crystallization occurs for PET mate-
rials, which are mechanically drawn close to the Tg within the
temperature range between 208C and 80.11 Alfonso et al.12 stud-
ied the crystallization kinetics in the orientated state for PET fil-
aments. They showed that the orientation of the amorphous
phase is very important and has a very strong relationship with
crystallization and the rate of crystallization. In addition,
increasing the temperature to a certain point causes an increase
in the crystallinity.
On the other hand, Smith and Steward13 investigated the rate of
crystallization by carefully drawing different oriented noncrys-
talline PET fibers at 1008C, 1208C, and 1508C. Afterwards, the
produced fibers were quenched rapidly to prevent any crystal-
line formation. It has been demonstrated that the degree of ori-
entation had a great influence on the rate of crystallization. The
resulting fibers showed the nucleation and initial growth of
crystallites as a very rapid process for oriented PET at 1208C,
which is about the order of milliseconds. However, when unor-
iented fibers were used, the crystallization time was several
minutes. Moreover, Lu and Hay14 observed that the crystalliza-
tion rate for a strain-induced mechanism was much higher than
a thermally induced mechanism at the same temperature. It was
explained that the entropy of extension is the main factor,
which increases the driving force for crystallization while reduc-
ing the free energies for nucleation and crystal growth. It has
been also observed14 the lower degree of orientation and crystal-
linity after increasing the temperature at a certain point of
strain rate and elongation because of increasing molecular chain
relaxation.
As a result, many researchers have investigated many structural
developments to understand and make a better correlation
between internal structure and material performance. Conse-
quently, the researchers have developed numerous production
techniques to improve the material’s mechanical and thermal
properties. One of the most important methods was revealed in
the 1990s, a novel melt-spinning process with the liquid isother-
mal bath (LIB).6,7,15–17 In this method, the resulted as-spun
fibers had a very high degree of orientation and low and/or no
crystallinity but had a high tenacity and modulus. Superior
fiber mechanical properties were observed by drawing the fibers
spun with LIB to a low DR. The synthetic melt spun fibers were
extruded into a LIB, which should be at least 308C above the Tg
of the polymer with the take-up speed between 3000 and
7000 m/min. Numerous attempts have been performed by vary-
ing the liquid’s temperature, liquid depth, distance between the
spinneret and the tank, take-up speed, etc., to observe and
make correlation between the resulted fibers’ performance and
process conditions. These studies have concluded that the high
level of threadline stress, which occurred during the fibers mov-
ing through the liquid, hindered the molecular chains and seg-
ments mobility to form a very high orientation level and
effectively prevent the crystal growth for undrawn filaments.
This method was eventually modified by the utilization of a
horizontal liquid isothermal bath (hIB),7 to reduce energy con-
sumption. It requires less capital equipment and can be used in
large-scale production setting. As a result, hIB technique is sim-
pler, safer, and can be applied to many different types of ther-
moplastic polymers.
Almost all researchers have been using high molecular weight
polymers for their studies to produce high-performance fibers,
also for the hIB method as well. For this study, we will present,
for the first time, the spinning of high-strength PET fibers by
using a low molecular weight polymer via hIB method with
unusual structural developments.
EXPERIMENTAL
Materials and Production Methodology
Fiber forming PET chips having intrinsic viscosity (IV) of 0.65
dL/g was used in this study. The PET chips were vacuum dried
at 1408C for 16 h. As-spun PET fibers with and without hIB
were produced by using a Fourne single-screw extruder, which
had a single hole with a hyperbolic spinneret with 0.6 mm exit
diameter with the take-up speeds around 3000 m/min. Figure 1
shows that the production parameters which we used during
the fiber production.
Figure 1. Melt spinning process with hIB spinning system.18
ARTICLE WILEYONLINELIBRARY.COM/APP
WWW.MATERIALSVIEWS.COM J. APPL. POLYM. SCI. 2015, DOI: 10.1002/APP.4274742747 (2 of 15)

Modified Instron tensile testing equipment with a 60 cm long
heating tube was used to draw fibers with the draw speed of
50 mm/min, and the draw temperature of 2208C.
Experiments and Characterization
Vibromat ME Tester equipment was used to determine denier
of the monofilaments. The measurements are based on the
resonance frequency principle. The fiber modulus and tenacity
(gf/denier), in addition to the percentage strain at break, were
observed via a MTS Q-test/5 universal testing machine using
TestWorks 4EM V4.11B software according to ASTM (American
Society for Testing and Materials) D3822.
Fiber surface and cross-section morphology were investigated
using JEOL 6400 model of a cold field emission scanning electron
microscope after fiber coating with a layer of Au/Pd at 0.5–30 keV
accelerating voltage. The fiber cross-section was obtained to put
the fibers into the liquid nitrogen and then broken apart in it.
X-ray generator that is Rigaku SmartLab X-ray diffractometer
(XRD) equipped with CuKa radiation source, k 5 1.542 A, was
operated at the power of 40 kV and 44 mA. The diffracting
intensities were determined every 0.02o from 2h scans in the
range of 5–40o. Crystallites sizes were determined by using the
Scherrer equation19:
Lhkl5Kk
bcos H(1)
where b is the peak half width, K is taken to be unity, k is the
radiation wavelength (1.542 A), and h is the Bragg angle.
DSC (Differential Scanning Calorimetry) measurements were
performed on a Perkin Elmer Diamond DSC Model 7 with
Pyris software version 5. A small amount of 3–5 mg of the
fibers was used for the DSC measurements with the heating rate
of 208C/min under a flow of nitrogen gas up to 2808C. Degree
of crystallinity of PET fibers was calculated20 from eq. (2):
Degree of crystallinity %ð Þ5 DHf 3100
DH0f
(2)
where DHf is the heat of fusion of PET fibers. DH0f is the heat
of fusion of 100% crystalline PET which is 140 J/g.21
Density measurements for all untreated and treated fibers were
carried out by using ASTM D1505-10 standard. The experiment
was run at 238C by using a density gradient column containing
sodium bromide solution (NaBr) in the density range of 1.335–
1.415 g/cm3. The volume fraction crystallinity (Xv) was deter-
mined from eq. (3)22:
Xv5p2pa
pc2pa
(3)
where p is the determined fiber density, pa and pc are the den-
sity of the amorphous and crystalline phases with the values of
1.335 and 1.455 g/cm3, respectively.
Birefringence for the fibers was observed by using a Nikon
polarizing microscope. At least three individual sample meas-
urements were done for each fiber sample. A series of mineral
oil refractive index liquids were used as an immersion liquid.
The mean birefringence values were determined with the eq.
(4)15:
Dn5nII 2n? (4)
where nII and n?are parallel and perpendicular refractive index
of the sample, respectively.
RESULTS AND DISCUSSION
Mechanical Properties of the PET Fibers Spun With and
Without hIB
In general, polymer chips having a high intrinsic viscosity (IV)
close to 1 are used to produce high-tenacity PET fibers by
achieving a high degree of the orientation for the undrawn
fibers and the formation of tie chains connecting to the crystals.
Hence, high tenacity and modulus fiber products can be
obtained. However, it is known that the threadline dynamics of
the fibers can be controlled with a liquid isothermal bath (hIB)
spinning followed by a hot drawing process to improve the
morphology of the fibers. Therefore, different set of as-spun
fibers with a lower IV of 0.65 dL/g PET chips were spun with
the hIB technology at take-up speed in the range of 2900–
3000 m/min. Fiber properties of the as-spun and control fibers
of each process were compared. Unlike PET control samples,
the hIB as-spun and drawn fibers showed unique structural
developments with demonstration of high tenacity and high
modulus. The spinning conditions and comparison of the
mechanical fiber properties of the hIB as-spun, control fibers,
and the fibers after hot drawing process are listed in Tables (I–
III), respectively.
As can be seen from Table II, the results indicated that the
fibers’ tenacity significantly increased with hIB technology. PET
fibers tenacity increased by ca. 58%, 95%, 88%, and 90% from
4.19 6 0.10 g/d to 6.60 6 0.26, 8.19 6 0.09, 7.87 6 0.12, and
7.97 6 0.13 g/d for undrawn fibers at 90 cm distance between
the spinneret and tank with the bath temperature of 608C,
1008C, 1258C, and 1408C, respectively. At the same time, the
modulus tremendously increased by ca. 70%, 80%, 58%, and
86% from 64.62 6 3.83 g/d to 109.54 6 6.39, 116.52 6 9.19,
102.40 6 4.93, and 120.14 6 4.05 g/d at the same production
parameters. In addition, the percentage of elongation decreased
from 73.50 6 6.74 to 33.38 6 4.23, 24.55 6 2.79, 28.57 6 2.57,
and 25.50 6 1.35% for the undrawn hIB fibers with the bath
temperature of 60, 100, 125, and 1408C by ca. 55%, 67%, 61%,
and 65% respectively.
It is obvious that the hIB fibers have not only a higher initial
modulus and higher strength, but also a lower percent elonga-
tion at break than those of the control fibers. In the study, the
effect of changes in the mechanical properties of PET fibers was
assessed in terms of its tenacity, modulus, and elongation at
break for different distances between the spinneret and hIB
bath. The highest tenacity and modulus of 8.04 6 0.14 g/d (1.02
GPa) and 120.52 6 4.33 g/d (15.32 GPa) by the increasing ca.
270.51% and 215.25% from the control sample without hIB,
respectively, were obtained by using the hIB technology at the
bath temperature of 1408C with 120 cm distance (see Tables I
and II) for the undrawn fibers. This performance for the treated
as-spun fibers is very surprising and tremendous because the
ARTICLE WILEYONLINELIBRARY.COM/APP
WWW.MATERIALSVIEWS.COM J. APPL. POLYM. SCI. 2015, DOI: 10.1002/APP.4274742747 (3 of 15)

traditional PET fibers can show this performance after very
high DRs and more than two step drawing processes by using
high molecular weight polymers. In the case of 150 cm produc-
tion distance, the significant effect of the hIB spinning system
on fiber tenacity and modulus was observed. As shown in Table
II, a positive improvement is found between the hIB bath tem-
perature and the tenacity values of PET fibers spun with hIB at
150 cm production distance between the spin pack and the
tank.
Associated with this matter, an interesting point of data shows
which of the modulus values for the bath temperature of 608C,
1008C, and 1258C of the as-spun fibers are very close to each
other at about 103 g/d. The modulus value has reached approx-
imately 118 g/d for the undrawn fibers spun with hIB when the
liquid temperature was set to 1408C. The tenacity value
increased from 2.05 6 0.04 g/d to 8.07 6 0.12 g/d, with increas-
ing the modulus values from 27.22 6 5.80 g/d to 118.05 6
6.50 g/d by ca. 294%, and 334% respectively, while the sample
ID’s of PET000 and PET444 are compared.
After the drawing process, as expected, the hIB fibers with a DR
of 1.279 had an increased tenacity and modulus with a lower
elongation, as seen in Figure 2. All samples were drawn at the
same temperature of 2208C with the same DR, which is near to
the maximum DRs for the treated fibers at this temperature. It
was noted that the mean value of tenacity increased with an
increasing of the hIB temperature, but there was no significiant
difference between tenacity values at different hIB bath tempera-
tures when standard deviation are considered for tretaed PET
filaments. Interestingly, the modulus values for PET fibers pro-
duced with hIB were similar after the hot drawing for the bath
temperature of 608C, 1008C, and 1258C. The mean value for
modulus relatively increased for the bath temperature of 1408C
and reached 145.27 6 9.27 g/d at the distance of 90 cm. At the
production distance of 90 cm between the spin pack and the
hIB tank, the difference in tenacity between the hIB and control
fibers is 4.41, 4.54, 5.31, and 5.56 g/d for 608C, 1008C, 1258C,
and 1408C, respectively, in which it is clear that the differences
increased by increasing the liquid temperature. The highest
improvement for the tenacity is ca. 121% from 4.67 6 0.13 g/d
to 10.30 6 0.27 g/d for tretaed fibers at the liquid temperature
of 1408C. In addition, the initial modulus increased by ca. 25%,
36%, 28%, and 48% from 98.17 6 9.46 g/d to 123.09 6 5.60,
Table II. Mechanical Properties of PET AsSpun Fibers Spun With and
Without hIB
SampleID
Tenacity(g/d)
Modulus(g/d)
Elongation(%)
PET0 4.19 6 0.10 64.62 6 3.83 73.50 6 6.74
PET00 2.17 6 0.08 38.23 6 3.20 137.47 6 10.29
PET000 2.05 6 0.04 27.22 6 5.80 160.14 6 26.84
PET1 6.60 6 0.26 109.54 6 6.39 33.38 6 4.23
PET11 6.26 6 0.31 105.72 6 5.69 39.21 6 5.87
PET111 6.05 6 0.24 103.33 6 5.35 51.45 6 5.17
PET2 8.196 0.09 116.52 6 9.19 24.55 6 2.79
PET22 7.85 6 0.14 116.94 6 6.55 22.13 6 2.88
PET222 7.41 6 0.21 103.59 6 6.06 24.97 6 4.44
PET3 7.87 6 0.12 102.40 6 4.93 28.57 6 2.57
PET33 7.91 6 0.13 108.36 6 5.04 27.14 6 2.68
PET333 7.66 6 0.19 103.53 6 5.21 24.49 6 4.57
PET4 7.97 6 0.13 120.14 6 4.05 25.50 6 1.35
PET44 8.04 6 0.14 120.52 6 4.33 28.14 6 3.68
PET444 8.07 6 0.12 118.05 6 6.50 26.00 6 2.51
Table I. Spinning Conditions of PET Fibers Spun With and Without hIB
Sample IDTake-upspeed (m/min)
Liquidtemp. (8C)
Liquiddepth (cm)
Distance(cm) Denier
PET0 2910 90 9.20 6 0.25
PET00 2910 CONTROL FIBERS 120 10.93 6 0.39
PET000 2910 150 10.14 6 0.18
PET1 2880 90 10.86 6 0.15
PET11 2885 60 20 120 10.30 6 0.15
PET111 2900 150 11.12 6 0.22
PET2 2913 90 10.29 6 0.08
PET22 2913 100 20 120 10.98 6 0.18
PET222 2913 150 12.13 6 0.36
PET3 2923 90 10.44 6 0.10
PET33 2931 125 20 120 10.61 6 0.32
PET333 2919 150 11.02 6 0.40
PET4 2921 90 10.35 6 0.07
PET44 2909 140 20 120 10.08 6 0.21
PET444 2909 150 9.77 6 0.13
ARTICLE WILEYONLINELIBRARY.COM/APP
WWW.MATERIALSVIEWS.COM J. APPL. POLYM. SCI. 2015, DOI: 10.1002/APP.4274742747 (4 of 15)

133.64 6 4.40, 125.61 6 7.99, and 145.27 6 9.27 g/d for the
same hIB temperature range, respectively. The elongation per-
centage has similar values and remains essentially constant for
the different process conditions, which are approximately
between 11% and 13%.
On the contrary, an increase in tenacity became more promi-
nent at the distance of 120 and 150 cm for the drawn control
and treated fibers (see Figure 2). In addition, many fibers’
breaks occurred during the drawing process for the control
sample at 2208C because the control fibers were not stable at
high temperature, hence easily degraded and finally broke. After
many trials, a few samples were obtained, and these fibers have
unusual and very low elongation at break percentage, which was
about 19.28% with tenacity value of 2.06 g/d for 150 8C pro-
duction distance.
It lends credence to the statement that the hIB technology has
the potential to produce high tenacity and high modulus fila-
ments at a low DR (1.279 DR), even if a low IV PET (0.65 dL/
g) polymer was used. In addition, the comparison of perform-
ance analysis for the low (0.65 dL/g) and high (0.90 and 0.97
dL/g) molecular weight PET fibers spun with hIB method show
no any significant difference for the undrawn and drawn fibers.
Therefore, it can be concluded that the hIB method is more
beneficial for the low molecular weight PET polymers. The fine
structural development for the low molecular weight fibers is
provided in the next sections.
Scanning Electron Microscopic (SEM) Analysis
As demonstrated in the previous studies and our work, the
banded morphology is one of the most crucial parameters for
hIB polyester fibers. It represents a precursor for crystallization
Table III. Fibril Diameters for Control and hIB Treated Fibers
Fibril diameters (nm)
Undrawn Drawn
Coarse Coarse Fine
PET0 (Control) – 418.39 6 88.27 –
PET1 (60oC) – 215.15 6 75.80 45.10 6 17.10
PET2 (100oC) – 181.94 6 44.17 36.84 6 11.34
PET3 (125oC) 344.44 6 56.34 210.37 6 39.28 37.65 6 8.18
PET4 (140oC) 341.18 6 83.78 196.08 6 57.41 33.93 6 10.78
Figure 2. Comparison of the strength of drawn fibers at 1.279 DR with the drawing temperature of 220oC at (a) 90 cm, (b) 120 cm, and (c) 150 cm
production distance.
ARTICLE WILEYONLINELIBRARY.COM/APP
WWW.MATERIALSVIEWS.COM J. APPL. POLYM. SCI. 2015, DOI: 10.1002/APP.4274742747 (5 of 15)

that has highly oriented amorphous structures.7 High molecular
weight PET (0.97 dL/g) filaments were spun with hIB, and then
drawn at 1328C with 1.279 DR. The resulted fibers showed the
banded structure for drawn and also for undrawn fibers, as seen
in Figure 5. The ordering process is one of the most dominant
factors to form the banded structure.7,23 Hence, lower molecular
weight PET (0.65 dL/g) fibers were analyzed based on this
point. The fibers were marked in three zones to observe any
possible structural changes during the drawing process. A sec-
tion outside the heating tube was unheated; the second zone
was the transit zone between the outside and inside drawn
zone, and the third zone was the drawn zone in the tube in
which the filaments was fully heated and drawn. All control and
treated fibers were drawn at 1.279 DR with the drawing temper-
ature of 2208C.
Firstly, there is no any significant difference for hIB and control
fibers for surface analysis before and after the drawing process.
Figure 3. Low and high (letter with apostrophe) magnification of SEM images for PET as-spun fibers treated with hIB at (a) 60oC, (b) 100oC,
(c) 125oC, and (d) 140oC liquid temperatures. (Scale bar 5 10 and 2 lm for low and high magnifications, respectively.)
Figure 4. SEM images of drawn PET fibers spun with hIB at the temperature of 125oC. (Scale bar 5 10 and 2 lm for low and high magnifications,
respectively).
ARTICLE WILEYONLINELIBRARY.COM/APP
WWW.MATERIALSVIEWS.COM J. APPL. POLYM. SCI. 2015, DOI: 10.1002/APP.4274742747 (6 of 15)

As Figures 3 and 4 show, interestingly, there is not any banded
structure either perpendicular or along the fiber axis on the hIB
fiber surface for low molecular weight PET (0.65 dL/g) fibers;
however, the banded structure was observed for high molecular
weight fibers produced from 0.97 dL/g (Figure 5). Even if the
low molecular weight fibers demonstrated superior mechanical
performance for both as-spun and drawn fibers, the banded mor-
phology was unexpectedly not observed. The formation of the
banded structure can be related to the skin and core structure24
when the skin layer has higher molecular orientation and bire-
fringence. The molecular orientation difference between skin and
core structure also should be more than a certain value. In addi-
tion, the banded morphology contains highly oriented, amor-
phous, crystalline, or just newly developed, less ordered
crystallites with some highly entangled polymer chains.15,25 These
conclusions are coming from the structural observation of copo-
lyester type materials.24,25 Furthermore, the banded structure was
also observed for LIB-treated polyester fibers in which the fibers
also showed the smaller crystal size.15 Firstly, the effects of the
process conditions on low and high molecular weight PET might
be different. Therefore, more studies with different process condi-
tions should be done to document the development of the
banded structure. However, in our case, we observed higher crys-
tal sizes after low molecular weight (LMW) PET filaments with
hIB than HMW (high molecular weight) PET fibers produced by
LIB method in the past. Secondly, the difference of molecular ori-
entation for skin-core structure might be less than a certain value
which leads to the banded structure. Thirdly, the low molecular
weight PET may cause less “highly entangled polymer chains” to
form when compared to the high molecular weight PET. A com-
bination of these reason(s) might possibly account for the
absence of the banded morphology for the low molecular weight
PET fibers spun with hIB before and after the drawing processes.
To further investigate, the fiber samples were broken in the
liquid nitrogen, and the cross-section was observed via a
field-emission scanning electron microscope to study the inner
morphology. Figure 6 shows the fractured surface of the
undrawn treated fibers. There is significant effect of the temper-
ature of the hIB spinning system on the formation of fibrillar
structures. Fibrillar structure did not form for fibers spun with
hIB at the temperature of 608C and 1008C, although they
showed ultrahigh performance. This result further supports the
hindrance of crystal growth under high levels of stress and
appropriate temperatures in which lamellar slip can lead to c-
axis orientation until obtaining a fully oriented structure.26 On
the other hand, fibrillar structures have been observed in fibers
spun with hIB spinning systems at the temperature of 1258C
and 1408C for as-spun fibers. This is very interesting and
showed the dependence of crystallinity on the liquid tempera-
ture. In this experiment, it can be speculated that the mecha-
nism for the formation of the fibrillar morphology was formed
after fully oriented structure was reached and an additional
extension caused a new type of deformation mechanism, which
is called crystal cleavage.26 Hence, the fibers show separation of
lamellae in blocks and become more oriented to evolve into a
fibrillar structure at the liquid temperature of 1258C and 1408C.
X-ray data for undrawn fibers clearly supported this relationship
between the fibrillar structure and the liquid temperature, which
will be given in the next section. A higher hIB temperature
probably increased the chains mobility to form three-
dimensional arrangements of the crystals to evolve into the
fibrillar structure. These fibers performed an outstanding per-
formance with a higher degree of crystallinity and crystal size.
Figure 6 demonstrates the fractured surface of the drawn PET
fibers. It is clear that the drawn and transparent fiber had a
smooth surface with stretched fibrils inside in which the diame-
ter is decreasing from the sheath to the core of the fibers. This
is a strong evidence to demonstrate a highly crystallized fibrillar
structure. The as-spun hIB fibers had highly ordered structures,
which can be transformed into fibrillar crystals via a little hot
drawing to produce high-performance filaments; this could
potentially increase the fraction of taut tie molecules in amor-
phous regions and lead to the formation of higher orientation
after the drawing processes. It has been generally accepted that
polymers normally undergo chain-folding during crystallization,
and microfibrils which consist of alternating chain-folded lamel-
lae and amorphous regions to make the conventional fibers.27
Stacked lamellae are the main reason to form the fibrils, and
they are typically about 10 nm in diameter with approximately
50 nm lengths along the fiber axis.28
It can be seen in Figure 6 that the cross-section of the drawn
PET control without hIB fiber has poorly developed, sparse
Figure 5. SEM images of PET (0.97 dL/g) fibers spun with hIB for undrawn (left) and outside drawn zone (right) fibers. (Scale bar 5 10 lm).
ARTICLE WILEYONLINELIBRARY.COM/APP
WWW.MATERIALSVIEWS.COM J. APPL. POLYM. SCI. 2015, DOI: 10.1002/APP.4274742747 (7 of 15)

fibrillar morphology after drawing at 1.279 DR with the draw-
ing temperature of 2208C. This phenomenon is related to the
fact that the traditional process produces the fibers with low
strength and relatively poor occurrence of fibrillar structure.
This is a weak point and is undesirable in industrial end-use
applications for high performance fibers.
The further investigations of the fibril diameters are shown in
Table III for control and treated fibers before and after the
drawing processes. As stated previously, some poorly developed
fibrils were observed for drawn control fibers with the mean
diameters of more than 400 nm, but there was not any fibril for
undrawn control filaments. The fibers were produced at the liq-
uid temperature of 1258C and 1408C and had the similar fibril
diameters for undrawn fibers, in which the diameters are about
350 nm. However, after the drawing process, the mean value of
fibrils for PET4 is smaller than PET3. There are two distinct
populations of microfibrils which are “coarse” fibril at about
�200 nm, and “fine” fibril at about �38 nm in diameters for
drawn fibers. The fibers which have been produced at the liquid
temperature of 1008C, 1258C, and 1408C showed the similar
“coarse” and “fine” fibrils diameters, but the 608C liquid tem-
perature one has a little higher mean value for the diameters, as
demonstrated in Table III.
It might be speculated that we were able to demonstrate just a
group of lamellae for the “fine” fibrils, which were obtained by
hIB method. As Murthy et al.28 have stated, the typical lamellae
diameter is about 10 nm.
Wide-Angle X-Ray Data Analysis
Figures 7 and 8 show the wide-angle X-ray diffraction (WAXD)
patterns of the PET filaments spun without hIB and with hIB at
different liquid temperatures with the distance of 90 cm. The
equatorial diffraction profile was fitted using PDXL with ICDD
PDF file software program. Murthy and Correale29 have shown
Figure 7. Equatorial X-ray diffraction profiles of PET as-spun fibers spun
with hIB spinning system.
Figure 6. SEM images of cross section of undrawn (right) and drawn (left) PET fibers spun with hIB spinning system at different liquid temperatures.
(For Undrawn: Scale bar 5 10 and 2 lm for low and high magnifications for 60oC, 100oC, and 140oC, respectively. Scale bar 5 1 lm for high magnifica-
tions for 125oC; For Drawn: Scale bar range between 10 lm and 500 nm for low and high magnifications, respectively).
ARTICLE WILEYONLINELIBRARY.COM/APP
WWW.MATERIALSVIEWS.COM J. APPL. POLYM. SCI. 2015, DOI: 10.1002/APP.4274742747 (8 of 15)

at least two amorphous peaks, which are 17.5o and 23.5o,
observed for the most “amorphous” sample.
In Figure 7, as expected, a noisy, weak diffraction of X-ray pat-
tern was collected for undrawn control samples. However, as
seen in Figure 7, using hIB method even at different process
conditions demonstrated a great influence on as-spun fiber
morphology. It can be seen in Figure 7 that, until the bath tem-
perature is 1258C, the first indication is a less developed crystal-
lites phase, which contains highly oriented PET molecules, as
supported by demonstrating high tensile performance and the
birefringence analysis. The filaments were produced at 608C and
1008C, the equatorial X-ray diffraction trace is given for the hIB
as-spun fibers, which only gave rise to broad, unresolved traces
with high intensity which are not related to the crystals. One of
the most important results of this study is that this structural
phenomenon was exactly observed by SEM cross-sectional
images; as we have described, there was not any fibril formation
at these temperatures. In addition, the degree of crystallinity
increased from 7.66% to 37.41% when the temperature of hIB
increased from 608C to 1408C (Table IV).
It is clear that increasing hIB temperature contributes to crystalli-
zation that is observed at 1258C and higher hIB temperatures.
The higher hIB temperature would presumably increase the rate
of crystallization, as seen in Figure 7. Low crystallinity, low elon-
gation, and high tenacity and modulus for hIB fibers might be
looked upon as the first evidence that the mostly noncrystalline
chains of the hIB as-spun fibers with poorly developed crystalline
are highly ordered or oriented. In addition, the amorphous phase
can be divided in two-component systems, the oriented (aniso-
tropic) and the unoriented (isotropic) components.30 Different
weak peaks in the amorphous phase can be explained as the
order of different crystallographic directions and/or evidence for
incipient crystalline order in samples.29 Table IV demonstrates
the crystal growth of these fibers was significantly suppressed,
hence smaller apparent crystal sizes range from 13 A to 27 A at
the hIB temperature of 608C and 1008C when they were formed.
The percent crystallinity for the control and treated fibers at the
liquid temperature of 1008C is comparable; hence, it can be con-
cluded that the treated one has a higher number of crystals
because of smaller crystal sizes as demonstrated in Table IV. The
highest crystallinity and crystal size were observed at 1408C liquid
temperature. These prominent features of the as-spun treated fila-
ments at the temperature of 1408C promoted crystal growth, pos-
sibly because of the increasing of local molecular mobility.
Furthermore, the sharp peaks in the Figure 7 might have
occurred due to the undrawn polycrystalline precursor.
After the hot drawing at 1.279 DR at the temperature of 2208C,
the treated and untreated fibers show distinct crystal peaks, as
observed in Figure 8. The treated fibers have gained the fibrillar
structures; hence, well-developed crystals were detected at a low
DR. The crystallinity and crystallite sizes were calculated by
using WAXD data and are shown in Table IV. After the drawing
process, the equatorial diffraction scan demonstrated better
resolved peaks, indicating a more highly developed crystalline
structure in which the crystal growth was significant. However,
the data for untreated fibers are still noisy and weak, which
points out that less developed and unoriented parts are more
dominant in the morphology.
Table IV demonstrates the degree of crystallinity and crystalline
dimensions for the drawn fibers. After the drawing, the appa-
rent crystal sizes and degree of crystallinity of fibers increased
for both hIB and without hIB fibers. In general, degree of crys-
tallinity and crystallite sizes of fibers spun using hIB are greater
than those of fibers without hIB treatment. After the drawing
process, the degree of crystallinity has increased approximately
14% from 39.56% to 45.06% when the liquid temperature was
set to 1408C. However, when the liquid temperature increased
from 608C to 1408C, the degree of crystallinity increased from
39.78% to 45.06% by ca. 13%. Despite the fact that the crystal-
linity for control and the fibers, which were obtained at the liq-
uid temperature of 608C, are close to each other, the tenacity
and modulus value differences are about 94% and 25%, respec-
tively, higher for the treated one. The occurrence of this differ-
ence is considered to be at least partly due to the fact that the
Figure 8. Equatorial X-ray diffraction profiles of drawn PET fibers spun
without hIB (small figure) and with hIB.
Table IV. Degree of Crystallinity and Crystalline Dimensions of PET As-Spun and Drawn (Brackets) Fibers under Various hIB Temperatures
Crystallite size (Å)
hIB Temperature (oC) Crystallinity (%) L100 L�110 L010
– 28.92 (39.56) 29 (73) 25 (51) 36 (57)
60 7.66 (39.78) 13 (83) 17 (58) 13 (62)
100 26.51 (44.23) 23 (82) 20 (56) 27 (59)
125 32.37 (44.32) 31 (83) 25 (60) 33 (58)
140 37.41 (45.06) 40 (85) 28 (59) 34 (59)
ARTICLE WILEYONLINELIBRARY.COM/APP
WWW.MATERIALSVIEWS.COM J. APPL. POLYM. SCI. 2015, DOI: 10.1002/APP.4274742747 (9 of 15)
result of the hot liquid that presumably caused the formation of
higher crystal size, higher orientation, and the higher number
of taut-tie molecules. Fibers spun with hIB at 608C and without
hIB have almost the same crystallinity level as that of the small
crystal sizes for the control fibers, implying that the number of
crystals is higher than that of hIB-treated fibers. Furthermore,
the degree of crystallinity and crystallite size of fibers spun with
hIB at the temperature of 1008C, 1258C, and 1408C has essen-
tially the similar value as seen in Table IV.
Differential Scanning Calorimetry Data Analysis
It has been found that DSC curves do not show the state of a
direct reflection of the material at room temperature.31 During
the heating process, crystallites, which are formed at low tem-
peratures, undergo a continuous perfection process, hence par-
tial melting and recrystallization can occur during the scan
before the polymer is totally melted, which leads to an increase
in the overall crystallinity.
Table V and Figure 9 present the thermal properties and DSC
curves of as-spun control and its respective hIB-treated fibers
made at a spinning speed of about 3000 m/min. Tg was not
observed for both fibers probably because of the presence of a
relatively rigid amorphous phase.15 However, it might be
observed for fibers spun at a lower take-up speed and heating
rate for DSC analysis, and also for fibers with a lower degree of
crystallinity. Moreover, the dual melting peak can be observed
for the fibers. The first melting peak represents less developed
and less ordered crystals. More ordered with greater perfection
crystals for the higher temperature peak is observed with
extended chain segments.
On the other hand, it can be seen that the as-spun control and
treated fibers have a broad melting range from initial melting to
final melting, as shown in Figure 9, which indicates a typical
semi-crystalline polymer.
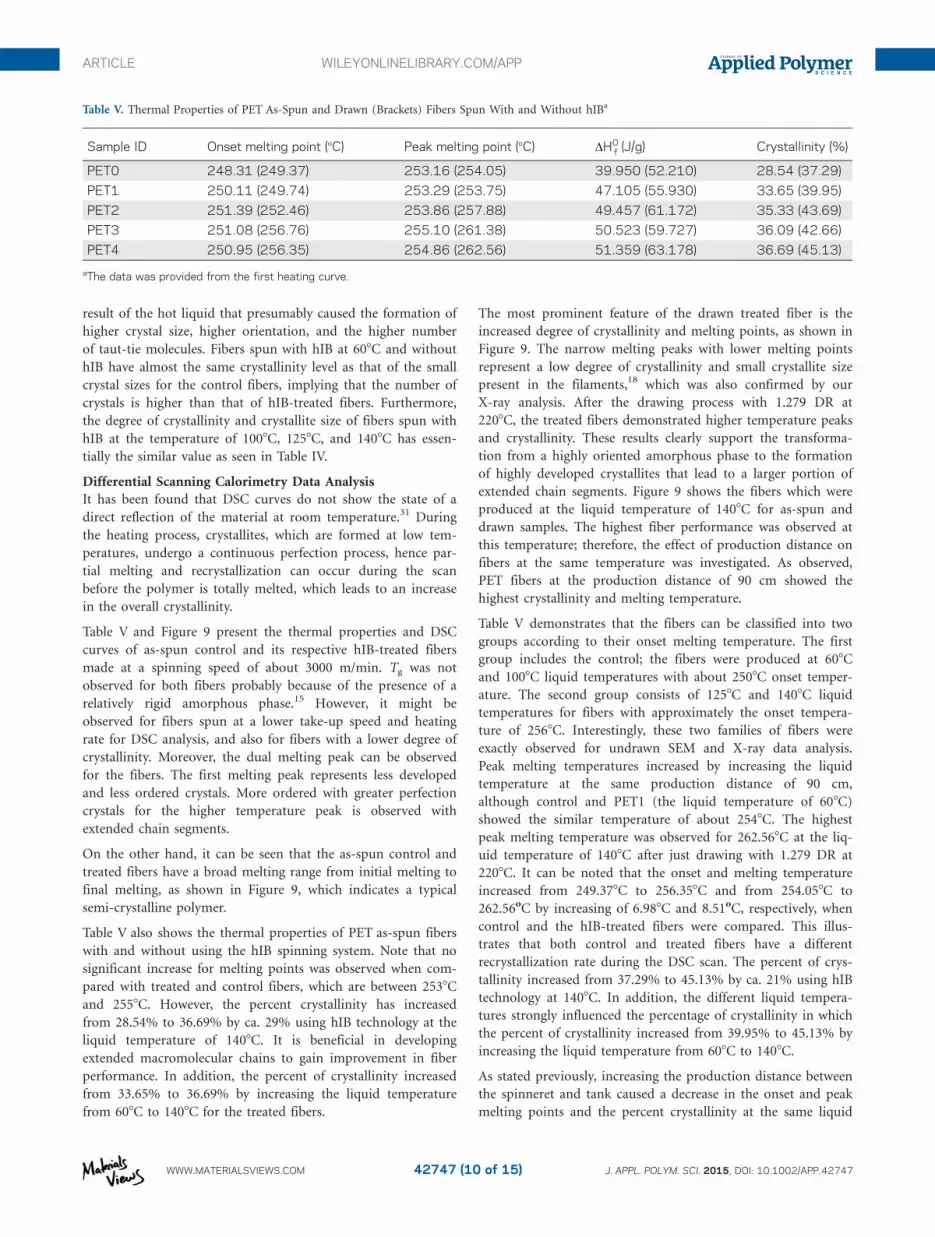
Table V also shows the thermal properties of PET as-spun fibers
with and without using the hIB spinning system. Note that no
significant increase for melting points was observed when com-
pared with treated and control fibers, which are between 2538C
and 2558C. However, the percent crystallinity has increased
from 28.54% to 36.69% by ca. 29% using hIB technology at the
liquid temperature of 1408C. It is beneficial in developing
extended macromolecular chains to gain improvement in fiber
performance. In addition, the percent of crystallinity increased
from 33.65% to 36.69% by increasing the liquid temperature
from 608C to 1408C for the treated fibers.
The most prominent feature of the drawn treated fiber is the
increased degree of crystallinity and melting points, as shown in
Figure 9. The narrow melting peaks with lower melting points
represent a low degree of crystallinity and small crystallite size
present in the filaments,18 which was also confirmed by our
X-ray analysis. After the drawing process with 1.279 DR at
2208C, the treated fibers demonstrated higher temperature peaks
and crystallinity. These results clearly support the transforma-
tion from a highly oriented amorphous phase to the formation
of highly developed crystallites that lead to a larger portion of
extended chain segments. Figure 9 shows the fibers which were
produced at the liquid temperature of 1408C for as-spun and
drawn samples. The highest fiber performance was observed at
this temperature; therefore, the effect of production distance on
fibers at the same temperature was investigated. As observed,
PET fibers at the production distance of 90 cm showed the
highest crystallinity and melting temperature.
Table V demonstrates that the fibers can be classified into two
groups according to their onset melting temperature. The first
group includes the control; the fibers were produced at 608C
and 1008C liquid temperatures with about 2508C onset temper-
ature. The second group consists of 1258C and 1408C liquid
temperatures for fibers with approximately the onset tempera-
ture of 2568C. Interestingly, these two families of fibers were
exactly observed for undrawn SEM and X-ray data analysis.
Peak melting temperatures increased by increasing the liquid
temperature at the same production distance of 90 cm,
although control and PET1 (the liquid temperature of 608C)
showed the similar temperature of about 2548C. The highest
peak melting temperature was observed for 262.568C at the liq-
uid temperature of 1408C after just drawing with 1.279 DR at
2208C. It can be noted that the onset and melting temperature
increased from 249.378C to 256.358C and from 254.058C to
262.56oC by increasing of 6.988C and 8.51oC, respectively, when
control and the hIB-treated fibers were compared. This illus-
trates that both control and treated fibers have a different
recrystallization rate during the DSC scan. The percent of crys-
tallinity increased from 37.29% to 45.13% by ca. 21% using hIB
technology at 1408C. In addition, the different liquid tempera-
tures strongly influenced the percentage of crystallinity in which
the percent of crystallinity increased from 39.95% to 45.13% by
increasing the liquid temperature from 608C to 1408C.
As stated previously, increasing the production distance between
the spinneret and tank caused a decrease in the onset and peak
melting points and the percent crystallinity at the same liquid
Table V. Thermal Properties of PET As-Spun and Drawn (Brackets) Fibers Spun With and Without hIBa
Sample ID Onset melting point (8C) Peak melting point (8C) DH0f (J/g) Crystallinity (%)
PET0 248.31 (249.37) 253.16 (254.05) 39.950 (52.210) 28.54 (37.29)
PET1 250.11 (249.74) 253.29 (253.75) 47.105 (55.930) 33.65 (39.95)
PET2 251.39 (252.46) 253.86 (257.88) 49.457 (61.172) 35.33 (43.69)
PET3 251.08 (256.76) 255.10 (261.38) 50.523 (59.727) 36.09 (42.66)
PET4 250.95 (256.35) 254.86 (262.56) 51.359 (63.178) 36.69 (45.13)
aThe data was provided from the first heating curve.
ARTICLE WILEYONLINELIBRARY.COM/APP
WWW.MATERIALSVIEWS.COM J. APPL. POLYM. SCI. 2015, DOI: 10.1002/APP.4274742747 (10 of 15)

temperature, as demonstrated in Table VI for the treated fibers.
There is a 4.358C and 5.048C difference between the onset and
peak melting points when the production distance increased
from 90 to 150 cm, respectively. In addition, the percentage of
crystallinity decreased by ca. 8.4% from 45.13% to 41.65% by
increasing the production distances.
Birefringence and Density Data Analysis
The degree of molecular orientation and the extent of crystalli-
zation are two important parameters for polymer morphology,
which has a strong relationship with its fiber application areas.
WAXD patterns of undrawn and drawn hIB treated and
untreated samples, shown in Figures 7 and 8 demonstrate sig-
nificantly different crystalline structure and orientation, as
shown by the intensity and sharpness of the equatorial reflec-
tions. The determination of birefringence and the indication of
overall orientation is another pathway that can be employed to
predict the orientation of these fibers. It is also known that the
orientation has an impact on fiber modulus performance. In
general, the overall orientation is affected by crystalline and the
amorphous orientation factor, and the crystalline orientation
factor is usually high for semi-crystalline polymeric fibers. In
this case, the amorphous orientation factor is a key factor for
overall orientation. In the industry, different levels of orienta-
tion can be obtained, which depends on the operating speeds.32
If the speed is between 500 to 1500 m/min, it will yield low ori-
ented, whereas partially oriented yarn can be produced at the
speed range of 2500 and 4000 m/min. The roller and/or winder
speed should be more than 6000 m/min to manufacture fully
oriented materials. As mentioned before, the degree of align-
ment of chains along the fiber axis has a significant relation
with the operation speed.
Figure 10 shows the birefringence of treated and untreated
fibers at the production distance of 90 cm at about 3000 m/min
take-up speed. At first glance, there is no any significant differ-
ence for the birefringence value between treated fibers at differ-
ent liquid temperatures, although an increasing trend was
observed with the increasing liquid temperatures. The birefrin-
gence increased from 0.195 to 0.215 and from 0.200 to 0.235
for treated as-spun and drawn fibers, respectively, by increasing
the liquid temperature from 608C to 1408C. The highest
Figure 9. DSC curves of undrawn (up-left), drawn (up-right) PET fibers spun with and without hIB under different liquid temperatures, and PET4 as-
spun and drawn fibers (bottom) spun with hIB at 140oC at different production distance.
ARTICLE WILEYONLINELIBRARY.COM/APP
WWW.MATERIALSVIEWS.COM J. APPL. POLYM. SCI. 2015, DOI: 10.1002/APP.4274742747 (11 of 15)

birefringence were observed for the fibers produced at the liquid
temperature of 1408C for as-spun and drawn fibers (1.279 DR)
at a value of 0.215 and 0.235, respectively. The lowest birefrin-
gence was always observed for the control samples for both
undrawn and drawn filaments at the value of 0.110 and 0.120,
respectively. Birefringence values for as-spun and drawn control
fibers are in the range as expected for the traditional melt spin-
ning production method. At the 90 cm of production distance,
the birefringence for the treated fibers with 1408C almost
doubled that of the control samples for undrawn and drawn
fibers. This indicates the molecular orientation level for the
treated fiber is probably coming close to the highest level, as
demonstrated by cross-section SEM images and X-ray data.
Moreover, the effect of hot liquid with its drag force allowed us
to obtain improved molecular chain orientation for lower
molecular weight PET fibers during the treatment. Therefore,
this highly oriented precursor hindered a poorly developed
structure, which was rapidly formed during the traditional melt
spinning process.
Amorphous region in the semi-crystalline polymers is divided
into two main groups, namely anisotropic (oriented) and iso-
tropic (unoriented) phases.30 Hence, the orientation factor is
strongly related with orientation degree of anisotropic phase
and, in general, isotropic phase does not contribute to the over-
all birefringence and orientation factor. As seen in Figure 11,
there is a strong correlation between the tenacity and birefrin-
gence values for undrawn and drawn fibers. The correlation for
undrawn fibers of R2 5 0.9703 is an exponential trend line as
shown in the eq. (5).
y 5 2:067e6:3434x (5)
where y is the tenacity (g/d) and x is the birefringence.
In addition, the correlation for drawn fibers of R2 5 0.9998 is a
well fit for polynomial trend line in the eq. (6).
y 5 2180:51x2 1 112:56x 2 6:2384 (6)
where y is the tenacity (g/d) and x is the birefringence.
Figure 11 also demonstrates increased birefringence from 0.110
to 0.215 for undrawn fibers that correlates with improvement of
tenacity from 4.19 to 7.97 g/d by ca. 96 and 90%, respectively.
Even if the highest mean tenacity for undrawn fibers was
observed at the value of 8.19 g/d with the bath temperature of
1008C, when the standard deviation is considered, tenacity for
fibers that were produced at 1008C and 1408C are almost the
same. Another interesting point from Figure 11 is that the
undrawn fibers produced at 1008C and higher bath temperature
till 1408C demonstrated almost the same performance in the
terms of tenacity values and had the similar birefringence of
around 0.2. Although the fibers were produced at the bath tem-
perature of 608C and showed the birefringence value of 0.195,
these fibers demonstrated relatively lower tenacity than that of
other treated as-spun fibers. It strongly indicates the birefrin-
gence value of 0.2 is an important threshold to obtain ultra-
high performance PET fibers. It is also supported by the similar
tenacity values for all drawn treated fibers which showed bire-
fringence greater than 0.2 (as seen in Figure 11). The highest
jump was observed for the tenacity values from undrawn to
drawn fibers by ca. 38%, which were produced at the bath tem-
perature of 608C. This is due to the fact that the drawn fibers
were obtained at this bath temperature shows the birefringence
of 0.2.
It can be concluded that the bath temperature should be at least
1008C to obtain birefringence values higher than 0.2 to obtain
Table VI. Thermal Properties of As-Spun and Drawn PET Fibers Spun With hIB at 1408Ca
Sample ID Onset melting point (8C) Peak melting point (8C) DH0f (J/g) Crystallinity (%)
PET4 250.95 254.86 51.359 36.69
PET4 drawn @ 90 cm 256.35 262.56 63.178 45.13
PET4 drawn @ 120 cm 253.53 259.37 60.627 43.31
PET4 drawn @ 150 cm 252.00 257.52 58.312 41.65
aThe data was provided from the first heating curve.
Figure 10. The relation between birefringence of treated and untreated
PET fibers at various hIB temperatures for undrawn and drawn fibers.
Figure 11. The relation between birefringence and tenacity of treated and
untreated PET fibers at various hIB temperatures for undrawn and drawn
fibers (draw ratio 5 1.279) (Exponential (undrawn) R2 5 0.9703, and Poly-
nomial (drawn) R2 5 0.9998).
ARTICLE WILEYONLINELIBRARY.COM/APP
WWW.MATERIALSVIEWS.COM J. APPL. POLYM. SCI. 2015, DOI: 10.1002/APP.4274742747 (12 of 15)

ultra-high tenacity for the as-spun fibers. Figure 11 indicates
that after the drawing process with only 1.279 DR, the fiber
tenacity increased from 4.67 to 10.23 by increasing birefringence
from 0.120 to 0.235 by ca. 119% and 96%, respectively. Increas-
ing bath temperature from 608C to 1408C caused tenacity values
to improve from 9.08 to 10.23 g/d. In this case, birefringence
varied from 0.200 to 0.235 by ca. 13% and 18%, respectively.
Another curious phenomenon is that the overall orientation
(birefringence) has a strong influence on the fiber tenacity. The
orientation is sometimes more important than the crystals’
growth and crystallinity for semicrystalline polymers until a cer-
tain value of crystallinity. For example, even if the treated fibers
showed the close tenacity values to each other, which were man-
ufactured at the liquid temperature of 1008C, 1258C, and 1408C,
the only fibers, which have some crystalline morphology, were
observed at the bath temperature of 1258C and 1408C when Fig-
ure 7 is checked.
Figure 12 demonstrates the fibers density before and after the
drawing process as a function of hIB liquid temperature at the
same production distance of 90 cm and similar take-up speed
of around 3000 m/min. Even if the trend for the density values
was improved for as-spun fibers as the liquid temperature
increased, it is hard to make a correlation between the density
values and the liquid temperature. On the other hand, an expo-
nential trend line was well fitted between the fibers’ density and
hIB liquid temperature for drawn fibers of R2 5 0.9138. The eq.
(7) for this correlation is shown below:
y 5 1:3747e6E-05x (7)
where y is the fiber density (g/cm3) and x is the liquid tempera-
ture (8C).
As seen in Figure 12, the as-spun fibers density increased from
1.357 to 1.368 g/cm3 when the fibers were spun with hIB at
1408C. As the liquid temperature increased from 608C to 1408C,
the density raised from 1.359 to 1.368 g/cm3. It is quite clear
that monotonical increase in density over the range investigated
for drawn fibers is an exponential trend line. The density of
1.385 g/cm3 for the hIB spun drawn fibers at the liquid temper-
ature of 1008C, 1258C, and 1408C was not changed significantly
with the increasing liquid temperature. After drawing process,
the lowest density was observed for the control sample at the
value of 1.375 g/cm3. However, the highest density value of
1.386 g/cm3 has been demonstrated as the liquid temperature
increased further to 1408C.
It is known that if a fiber has a lower crystallinity after produc-
tion with a traditional high speed spinning method, usually this
fiber can be more extended than that of a fiber with a higher
crystallinity. As demonstrated in Table VII, the volume fraction
crystallinity for untreated control sample (PET0) is lower than
that of all treated fibers before and after drawing process. Thus,
as expected, control fibers were able to be drawn to higher draw
ratios than that of all treated fibers.
Demonstrating a low extensibility, higher birefringence, higher
tenacity, and modulus show that all hIB fibers most probably
have taut–tie noncrystalline chains and highly ordered amor-
phous phase structures. On the other hand, when the degree of
crystallinity, which was obtained by X-ray (Table IV) and deter-
mined by density measurement (Table VII), was compared, the
volume fraction crystallinity for as-spun PET1 (the liquid tem-
perature of 608C) changed drastically and became higher than
that of the values for PET0 (control) fibers. These differences at
least suggest that there is less formation of a void structure and
higher orientation of chains for treated fibers, which were
formed during the hIB processes. A reason for the formation of
void structure is generally associated with the use of much
higher take-up speeds for the melt spinning methods. In Table
VII, the volume fraction crystallinity increased from 18.33% to
27.50% when the fibers were treated at the liquid temperature
of 1408C by ca. 50% for as-spun fibers. For the drawn fibers,
the crystallinity improved by ca. 28% from 33.33% to 42.50%
at a DR of 1.279 with the drawing temperature of 2208C when
the fibers spun with hIB at the temperature of 1408C. The effect
of the liquid temperature on the volume fraction crystallinity
for treated fibers is also significant and increased from 20.00%
to 27.50% and from 35.83 to 42.50 by increasing the liquid
temperature from 60 to 1408C for as-spun and drawn fibers,
respectively. Despite the fact that the crystallinity for drawn
PET2, PET3, and PET4 are close to each other, it cannot be
stated that these fibers should have also similar crystallinity
before the drawing process (see Table VII).
CONCLUSIONS
Ultra-high strength as-spun and drawn PET fibers with unique
properties were produced by using a horizontal isothermal bath
Figure 12. Fibers density of untreated and treated fibers by hIB before
and after drawing process (draw ratio 5 1.279).
Table VII. Volume Fraction Crystallinity of Untreated and \ Fibers by hIB
before and after Drawing Process (draw ratio 5 1.279)
Sample ID
Volume fractioncrystallinity (%) forundrawn fibers
Volume fractioncrystallinity (%) fordrawn fiber
PET0 18.33 33.33
PET1 20.00 35.83
PET2 26.67 41.67
PET3 22.50 40.83
PET4 27.50 42.50
ARTICLE WILEYONLINELIBRARY.COM/APP
WWW.MATERIALSVIEWS.COM J. APPL. POLYM. SCI. 2015, DOI: 10.1002/APP.4274742747 (13 of 15)

(hIB). This study is the first known report of a production of
high-strength PET filament from a lower molecular weight
polymer having IV of 0.65 dL/g. The highest tenacity was
observed more than 8 and 10 g/d for as-spun and drawn fibers,
respectively.
At the liquid temperature of 608C and 1008C and the production
distance of 90 cm, the fibers demonstrated relatively higher
tenacity and modulus values than that of the distance of 120 and
150 cm. However, when the liquid temperatures were fixed to
1258C and 1408C, the tenacity and modulus values came close to
each other at three different production distances for undrawn
fibers. The effects of production distances became a more promi-
nent feature for the drawn fibers for their mean modulus per-
formance at different liquid temperatures. Increasing production
distance caused a decrease in the modulus of fibers for each liq-
uid temperature. Therefore, almost all other characterization
methods for the fibers which were presented in this study were
obtained from the production distance of 90 cm.
SEM analysis indicates that there was not any banded structure
either perpendicular or along the fiber axis on the hIB treated
fiber surface for PET fibers. In addition, the significant effect of
the temperature of the hIB spinning system on fibrillar structure
was demonstrated. The fibrillar structure has not been observed
for fibers spun with hIB at the temperature of 608C and 1008C,
although the fibrillar structures was formed at the liquid tem-
perature of 1258C and 1408C for the as-spun fibers. The fibrillar
morphology can be formed after a fully oriented structure was
reached but, interestingly, we probably obtained this unique
structure for undrawn fibers at the liquid temperature of 1258C
and 1408C with the liquid depth and production distance of 20
and 90 cm, respectively. Strong similarities were found when
SEM images of cross-section and X-ray diffraction for the as-
spun treated fibers were compared. If the equatorial X-ray dif-
fraction profile showed clear crystalline peaks that caused us to
observe the fibrillar structure in the cross-section for the same
fiber.
Other characterization methods in this work, such as DSC, X-
ray, birefringence, etc., demonstrated that the resulted as-spun
fibers developed a rare formation of precursors for crystalliza-
tion with a highly oriented structure which transformed into a
highly crystallized fibrillar structure after only drawing at 1.279
DR at the drawing temperature of 2208C.
Depending on the process conditions for the PET fibers, the
precursor for the crystallization can be formed during the draw-
ing process at the drawing temperature higher or closer to its
Tg at a very high DR and strain rate. However, the precursor
can be developed, as we observed during the hIB melt spinning
process where certain conditions are satisfied. As clearly demon-
strated by cross-section of SEM images and X-ray data for the
undrawn treated fibers, the type of precursor can be different
according to the liquid temperatures. The effects of a higher
level threadline tension and the lower liquid temperatures, while
cooling at a very slow rate, restricted for the fibers the forma-
tion and growth of crystallites; however, this probably increased
the residual frozen-in orientation and the higher rate of motion
of neighboring chain segments, which promoted the occurrence
of tree-dimensional structure when fibers were treated at higher
liquid temperatures. This phenomenon may also lead to a
higher molecular orientation. Furthermore, at a higher liquid
temperature, the threadline temperature is much higher than
the Tg of the polymer. Hence, there is a greater probability to
form three-dimensional arrangements and obtain more devel-
oped crystals for the as-spun fibers (Figure 7).
Finally, this study contributes a further understanding of the
structure development of lower molecular weight PET fibers
spun via hIB with highly improved mechanical and thermal
properties.
REFERENCES
1. Wang, L. A.; Wang, Y. W.; Deng, Z. X.; Xia, X. L.; Liu, W.
T.; Han, S. Q.; Zhu, C. S. Adv. Mat. Res. 2011, 332–334,
526.
2. Wu, G.; Zhou, Q.; Chen, J. Y.; Hotter, J. F.; Tucker, P. A.;
Cuculo, J. A. J. Appl. Polym. Sci. 1995, 55, 1275.
3. Hobbs, T.; Lesser, A. J. Polymer 2000, 41, 6223.
4. Wu, G.; Jiang, J. D.; Tucker, P. A.; Cuculo, J. A. J. Polym.
Sci. Part B: Polym. Phys. 1996, 34(12), 2035.
5. Ito, M.; Takahashi, K.; Kanamoto, T. J. Appl. Polym. Sci.
1990, 40, 1257.
6. Wu, G.; Cuculo, J. A. J. Appl. Polym. Sci. 1995, 56, 869.
7. Chen, P.; Afshari, M.; Cuculo, J. A.; Kotek, R. Macromole-
cules 2009, 42, 5437.
8. Nicholson, T. M.; Davies, G. R.; Ward, I. M. Polymer 1994,
35, 4259.
9. Carr, P. L.; Nicholson, T. M.; Ward, I. M. Polym. Adv. Tech-
nol. 1997, 8, 592.
10. Welsh, G. E.; Blundell, D. J.; Windle, A. H. J. Mater. Sci.
2000, 35, 5225.
11. Zaroulis, J. S. Temperature, Strain Rate and Strain State
Dependence of Evaluation of Mechanical Behavior and
Structure of Poly(ethylene terephthalate) with Finite Strain
Deformation. MS Thesis, Massachusetts Institute of Tech-
nology, Cambridge, MA, March, 1996.
12. Alfonso, G. C.; Verdona, M. R.; Wasiak, A. Polymer 1978,
19, 711.
13. Smith, F.; Steward, R. Polymer 1974, 15, 283.
14. Lu, X. F; Hay, J. N. Polymer 2001, 42(19), 8055.
15. Hotter, J. F.; Cuculo, J. A.; Tucker, P. A.; Annis, B. K. J.
Appl. Polym. Sci. 1998, 69, 2051.
16. Cuculo, J. A. (NC State University). U.S. patent
US005149480A, September 22, 1992.
17. Cuculo, J. A. (NC State University). U.S. patent
US005733653A, March 31, 1998.
18. Lin, C. Y.; Tucker, P. A.; Cuculo, J. A. J. Appl. Polym. Sci.
1992, 46, 531.
19. Wang, I. C.; Dobb, M. G.; Tomka, J. G. J. Text. Inst. 1995,
86, 383.
20. Avci, H. Novel Approaches to the Development and Characteri-
zation of Antimicrobial Conventional and Nanostructured
ARTICLE WILEYONLINELIBRARY.COM/APP
WWW.MATERIALSVIEWS.COM J. APPL. POLYM. SCI. 2015, DOI: 10.1002/APP.4274742747 (14 of 15)

Materials. MS thesis, North Carolina State University:
Raleigh, NC, March 2010.
21. Duhovic, M.; Bhattacharyya, D.; Fakirov, S. Macromol.
Mater. Eng. 2010, 295, 95.
22. Chen, J. Y.; Tucker, P. A.; Cuculo, J. A. J. Appl. Polym. Sci.
1997, 66, 2441.
23. Abou-Kandil, A. I.; Windle, A. H. Polymer 2007, 48, 4824.
24. Takeuchi, Y.; Shuto, Y.; Yamamoto, F. Polymer 1988, 29(4), 605.
25. Abou-Kandil, A.; Windle, A. H. Polymer 2007, 48, 4824.
26. Ohta, T. Polym. Eng. Sci. 1983, 23(13), 697.
27. Mukhopadhyay, S.; Deopura, B. L.; Alagirusamy, R. J. Ind.
Text. 2004, 33(4), 245.
28. Murthy, N. S.; Grubb, D. T. J. Polym. Sci. Part B: Polym.
Phys. 2003, 41, 1538.
29. Murthy, N. S.; Correale, S. T.; Minor, H. Macromolecules
1991, 24, 1185.
30. Harget, P. J.; Oswald, H. J. J. Polym. Sci. Polym. Phys. Ed.
1979, 17(3), 531.
31. Holdsworth, P. J.; Turner-Jones, A. Polymer 1971, 12, 195.
32. Karacan, I. Fibers Polym. 2005, 6(3), 186.
ARTICLE WILEYONLINELIBRARY.COM/APP
WWW.MATERIALSVIEWS.COM J. APPL. POLYM. SCI. 2015, DOI: 10.1002/APP.4274742747 (15 of 15)


