Embed Size (px)
Citation preview
1 This article is protected by copyright. All rights reserved.
Histone deacetylases (HDACs) in Frontotemporal Lobar Degeneration 1
Amy Whitehouse1, Klara Doherty
1, Hsin Hsien Yeh
1, Andrew C. Robinson
1, Sara
Rollinson1,2
, Stuart Pickering-Brown1,2
, Julie Snowden1, Jennifer C Thompson
1, Yvonne
S. Davidson1, David M. A. Mann
1
1,2 Clinical and Cognitive Sciences Research Group, Institute of Brain, Behaviour and
Mental Health, Faculty of Medical and Human Sciences, University of Manchester, 1Salford Royal Hospital, Salford, M6 8HD and
2A.V Hill Building, Oxford Rd,
Manchester, M13 9PL, UK
Correspondence to:
Prof. David M.A. Mann,
Clinical and Cognitive Neuroscience Research Group,
University of Manchester,
Salford Royal Foundation NHS Trust,
Salford M6 8HD, UK.
Email: [email protected]
Tel. +44 (0) 161-206-2580
Fax. +44 (0) 161-206-0388
This article has been accepted for publication and undergone full peer review but has not been through the
copyediting, typesetting, pagination and proofreading process, which may lead to differences between this
version and the Version of Record. Please cite this article as doi: 10.1111/nan.12153
Acc
epte
d A
rticl
e

2 This article is protected by copyright. All rights reserved.
Abstract
Aims: Frontotemporal lobar degeneration (FTLD) is clinically and pathologically
heterogeneous. Although associated with variations in MAPT, GRN and C9ORF72, the
pathogenesis of these, and of other non-genetic, forms of FTLD, remains unknown.
Epigenetic factors such as histone regulation by histone deacetylases (HDAC) may play a
role in the dysregulation of transcriptional activity, thought to underpin the
neurodegenerative process.
Methods: The distribution and intensity of HDACs 4, 5 and 6 was assessed semi-
quantitatively in immunostained sections of temporal cortex with hippocampus, and
cerebellum, from 33 pathologically confirmed cases of FTLD and 27 controls.
Results: We found a significantly greater intensity of cytoplasmic immunostaining for
HDAC4 and HDAC6 in granule cells of the dentate gyrus in cases of FTLD overall
compared to controls, and specifically in cases of FTLD tau-Picks compared to FTLD
tau-MAPT and controls. No differences were noted between FTLD-TDP subtypes, or
between the different genetic and non-genetic forms of FTLD. No changes were seen in
HDAC5 in any FTLD or control cases.
Conclusions: Dysregulation of HDAC4 and/or HDAC6 could play a role in the
pathogenesis of FTLD-tau associated with Pick bodies, though their lack of
immunostaining implies that such changes do not contribute directly to the formation of
Pick bodies. Acc
epte
d A
rticl
e
3 This article is protected by copyright. All rights reserved.
Introduction
Frontotemporal Lobar Degeneration (FTLD), after Alzheimer’s disease, is the second
most common cause of dementia in the under 65s, accounting for 20% of cases [1]. It is a
primary neurodegenerative disorder characterized by circumscribed neurodegeneration of
the frontal and anterior temporal lobes. It is clinically, pathologically and genetically,
heterogeneous, and may in fact represent several distinct disorders united under this
umbrella [1]. In pathological terms, about half of cases can be defined by the presence of
tau-immunoreactive changes in neurones, and sometimes glial cells, of the frontal and
temporal cortex, and hippocampus, characterised by either neurofibrillary tangle-like
structures or Pick bodies; some of these cases are associated with mutations in the tau
gene, MAPT and have been classified as FTLD-tau [2]. Most of the remaining cases of
FTLD are associated with inclusion bodies (neuronal cytoplasmic inclusions, NCI and
neuronal intranuclear inclusions, NII) containing the transactive response (TAR) DNA
binding protein with Mw 43kDa, known as TDP-43, within neurones of the same regions
of cerebral cortex [3-5]. Such cases are termed FTLD-TDP [2], and have been associated
with mutations in various genes, but chiefly in progranulin (GRN) [6] and most recently
in C9ORF72 [7,8] where an expansion of a hexanucleotide repeat within the first intron
has now been identified as responsible for disease. Lastly, around 5% of cases are
characterized by NCI containing fused in sarcoma protein (FUS) [9], and are termed
FTLD-FUS [2].
Both TDP-43 and FUS are normally found in the nucleus of neurons, shuttling between
nucleus and cytoplasm. However, in FTLD-TDP and FTLD-FUS they become Acc
epte
d A
rticl
e

4 This article is protected by copyright. All rights reserved.
translocated to the cytoplasm and accumulate as the characterizing inclusion bodies.
TDP-43 is part of the heterogeneous nuclear ribonucleoprotein (hnRNP) family and thus
regulates the transcription and splicing of RNA and the transport and translation of
mRNA. In this role it can act both as a suppressive or enhancing factor. Physiologically
the role of FUS, like TDP-43, involves regulation of DNA expression, RNA splicing,
mRNA transport into the nucleus, and mRNA translation, including local translation at
specific dendritic spines, thereby implying a role in synaptic plasticity [10].
In eukaryotic cells, DNA lies in a protein complex known as chromatin, the individual
units of which, called nucleosomes, consist of 146 base pairs of DNA wound around 8
histone proteins (2 each of H2A, H2B, H3 and H4). Epigenetic modifications involve
regulating how easily transcription machinery can access the DNA; setting up obstacles
or opening up the DNA respectively and can include (i) modifications of the nucleotides
i.e. methylation of the DNA or synthesis of non-coding RNAs which interferes with gene
transcription and translation; (ii) nucleosome remodelling where energy is required to
move the DNA along the histone octomers, thus changing what DNA is accessible for
transcription and (iii) ‘post-translational modifications’ of histones involving acetylation,
methylation, phosphorylation, ribosylation and ubiquitination. In acetylation, an acetyl
group is transferred onto the ε-amino group of a specific lysine residue located on the tail
of the histone, reducing affinity between neighbouring histones and facilitating DNA
translation [11]. Without its acetyl group (ie on deacetylation) the histone tail has a
positive charge and high affinity for the negative DNA, resulting in tightly packed DNA
which cannot be accessed by transcription machinery. Acetylation and deacetylation is Acc
epte
d A
rticl
e

5 This article is protected by copyright. All rights reserved.
mediated by two groups of enzymes; histone acetyltransferases (HAT) and histone
deacetylases (HDAC), respectively. The human genome encodes 11 HDAC proteins,
divided into 5 classes according to structure; class I, IIa, IIb, III and IV. Class IIa
(HDAC4, 5, 7 and 9) and class IIb (HDAC6 and 10) are differentially expressed in brain
tissue [12,13], and some HDACs have been implicated in neurodegenerative disease. For
example, studies have shown HDAC4 to have a protective role against oxidative stress
and neurotoxicity [14], whereas others conclude that HDAC4 promotes cell death [15],
especially when it undergoes accumulation in the nucleus. Quinti et al [16] demonstrated
significant increases in HDAC1 and decreases in HDAC4, 5 and 6 in R6/2 Huntington
mice, though others have shown increases in HDAC4 and 5 to occur in human patients
with Huntington’s disease [17].
HDAC6 is present mainly in the cytoplasm where it deacetylates α-tubulin and
colocalises with microtubules [18], and therefore plays a role in the regulation of
intracellular transport. It has been shown to interact with tau and promote
phosphorylation at residue Thr231, which is believed to encourage hyperphosphorylation
of tau at other residues [19], thereby reducing the binding and stabilisation of
microtubules and promoting inclusion formation [20,21]. It also controls the fusion of
autophagosomes and lysosomes, and therefore may play a part in the sequestration and
elimination of intracellular aggregates such as huntingtin in HD [22] and α-synuclein in
Parkinson’s disease [23]. Importantly, it has been suggested that both FUS and TDP-43
regulate expression of HDAC6 [24,25]. The proteins were found to form a complex
which associates with HDAC6 mRNA at endogenous expression levels in mammalian Acc
epte
d A
rticl
e

6 This article is protected by copyright. All rights reserved.
cell culture [24]. Expression of HDAC6 was reduced by RNAi silencing of either TDP-
43 or FUS [24]. Additionally, depletion of TDP-43 in HEK-293E cells has been shown to
reduce levels of HDAC6 [25,26]. Moreover, work showing that parkin ubiquitinates
TDP-43 and promotes its cytosolic accumulation via interactions with HDAC6 [27]
emphasise the potential role changes in HDAC might play in these forms of FTLD.
Thus, as with FTLD-tau, dysregulation of HDACs may play a role in FTLD-TDP and
FTLD-FUS. Indeed, Odagira et al [28] reported increased HDAC6 immunoreactivity in
the temporal cortex in patients with FTLD-TDP, but not in patients with AD, relative to
controls, and this was also raised in glial cells in the cerebellar white matter in Multiple
System Atrophy. In a preliminary study [17], we noted increased levels of HDAC4 and
HDAC5 in the cerebellum of FTLD cases, especially those with FTLD-TDP. Therefore,
the aim of the present study was to follow up these observations in more cases of FTLD,
and to expand the study to include neocortical and hippocampal regions, and to include
HDAC6 in the analysis. Temporal cortex and hippocampus were chosen as sites for
analysis because the principal changes of all histological forms of FTLD (ie Pick bodies
in FTLD-tau, TDP-43 and p62 inclusions in FTLD-TDP) fall on this region. We included
cerebellum as an area of interest because it is known that this region is affected in FTLD
(p62 immunoreactive inclusions in granule cells) associated with an expansion in
C9ORF72, at least [7,8]. We also compared cases of FTLD-tau with those of FTLD-TDP,
both overall and as separate histological and/or genetic subtypes, in order to determine
whether any changes in HDAC might be preferentially associated with any of these
particular variants of FTLD. Acc
epte
d A
rticl
e

7 This article is protected by copyright. All rights reserved.
Patients and Methods
Patients
The patient groups comprised 33 patients with FTLD and 27 controls (Table 1). The
mean age of disease onset in the whole FTLD group was 57 years (range 43-73 years),
the mean duration of disease was 7.7 years (range 2 – 18 years) and the mean age at death
was 64 years (range 45-77 years). The latter was not significantly different from that of
the control group, where mean age at death was 64 years (range 26-92 years). Sections
from FTLD cases were obtained from the Manchester Brain Bank through appropriate
consenting procedures for the collection and use of the human brain tissues. Sections
from control cases were from Manchester Brain Bank (12 cases) or Thomas Willis Brain
Bank (15 cases) these, again, having been obtained through appropriate consenting
procedures.
All FTLD cases fulfilled Lund-Manchester clinical diagnostic criteria for FTLD [29] and
the more recent consensus criteria [30]. All had been longitudinally assessed within the
Cerebral Function Unit, Salford Royal Hospital, employing the Manchester
Neuropsychological Test Battery. Data collected on each patient included gender, age at
diagnosis and at death, and clinical diagnosis. All cases were from the Manchester Brain
Bank. Pathological diagnoses were made by an experienced neuropathologist (Professor
David Mann) and genetic analyses (for C9ORF72, MAPT and GRN) were performed in
the laboratory of Professor Stuart Pickering-Brown.
Acc
epte
d A
rticl
e

8 This article is protected by copyright. All rights reserved.
The FTLD group was composed of 14 males and 19 females. There were 23 patients with
bvFTD (67%), 5 with FTD+MND (15%), 2 with SD (6%) and 3 with PNFA (9%).
Pathological examination of the FTLD group showed 20 patients with FTLD-TDP (61%),
of which 10 had type A pathology (50%), 8 had type B pathology (40%) and 2 had type
C pathology (10%) [2]. Thirteen cases had FTLD-tau (39%), of which 7 had Pick’s
disease (54%) and 6 had tau pathology consistent with exon 10 +16 MAPT mutation. The
FTLD-TDP type A group comprised 8 patients with bvFTD and 2 with PNFA. The
FTLD-TDP type B group comprised 5 patients with FTD+MND and 3 with bvFTD. Both
of the patients with FTLD-TDP C had SD. One patient with PNFA had FTLD-tau (Pick’s
disease type), whereas the other 2 patients had FTLD-TDP type A pathology. Of the 22
patients with bvFTD, 12 showed FTLD-tau pathology (6 with Pick’s disease and 6 with
exon 10 +16 MAPT mutation) and 10 showed FTLD-TDP pathology (8 type A and 2 type
B).
Nineteen of the FTLD cases (58%) had a positive first-degree family history, of which 17
bore a mutation on the MAPT, GRN or C9ORF72 gene. Of these 17 familial cases, 7 bore
a mutation on GRN gene, one with exon 1 C31LfsX34, one with exon 4 Q130SfsX124,
two with exon 10 V452WfsX38 mutation, one with exon 10 Q468X, and one with exon
11 R493X. These all had FTLD-TDP type A pathology, 4 with bvFTD and 2 with PNFA.
6 patients bore MAPT mutation (+16 splice site mutation on intron to exon 10) and all
had a family history of a FTLD-type disorder. The other 4 patients bore a hexanucleotide
repeat expansion on C9ORF72 gene. One of these had FTLD-TDP type A based Acc
epte
d A
rticl
e
9 This article is protected by copyright. All rights reserved.
pathology, with a diagnosis of bvFTD but three had a pathological diagnosis of FTLD-
TDP type B, 2 with FTD+MND and one with bvFTD.
The mean duration of disease for each mutation type was similar (8-10 years), though the
mean age at onset of disease varied significantly (59 years for GRN; 48 years for MAPT
and 58 years for C9ORF72; p=0.028 between GRN and MAPT).
The 27 controls (11 males and 16 females) were judged to be clinically normal. Twelve
of these were obtained from the Manchester Brain Bank whereas the other 15 were
obtained from the Thomas Willis Brain Bank, University of Oxford. None of the 27
control cases showed any pathology beyond that which might be anticipated for age.
Consequently, 10 cases (over 65 years of age) showed mild deposition of amyloid beta
protein, mostly in the form of diffuse amyloid plaques, and 6 of these showed mild
neurofibrillary pathology (Braak stages I-II), confined essentially to amygdala and
hippocampal formation. Two cases showed moderate cerebrovascular disease and 1
showed mild cerebrovascular disease post-mortem: the remaining 13 cases were
apparently histological abnormality.
Methods
Immunohistochemistry
Sections of temporal cortex with hippocampus (Brodmann areas 21/22) and cerebellar
cortex were cut at 6µm thickness from formalin fixed, paraffin embedded blocks and
mounted on to glass slides. Acc
epte
d A
rticl
e

10 This article is protected by copyright. All rights reserved.
The same immunostaining protocol was performed on each of the HDAC antibodies for
all of the 33 FTLD cases and 27 control cases. A single antibody for HDAC4, HDAC 5
and HDAC6 was employed. All 3 antibodies were obtained from Cell Signaling
Technology. The HDAC4 antibody (#2072) was produced by immunizing rabbit with a
synthetic KLH-coupled peptide corresponding to residues surrounding amino acid 10 of
human HDAC4. In mouse brain it detects a single band at the predicted 140kDa level.
The HDAC5 antibody (#2082) was produced by immunizing rabbits with a synthetic
peptide corresponding to the carboxy-terminal sequence of human HDAC5. In cell lines
it detects a single band at the predicted 124kDa level. The HDAC6 antibody (#7558) is a
monoclonal antibody (clone D2E5) produced by immunizing rabbits with a recombinant
protein specific to the carboxy-terminal sequence of human HDAC6. In cell lines it
detects a single band at the predicted 160kDa level. A second series of HDAC antibodies
were purchased from Santa Cruz Biotechnology, and employed on a subseries of sections
from both FTLD and control groups. Of these, the HDAC4 antibody (H-92: sc-11418) is
a rabbit polyclonal antibody raised against residues 530-561 of human HDAC4. In
NIH/3T3 cells it detects a single band at the predicted 140kDa level. The HDAC5
antibody (B-11; sc-133106) is a mouse monoclonal antibody raised against residues 371-
443 of human HDAC5 and in cell lines detects a single band at 140-150kDa level. The
HDAC6 antibody (D11: sc-28326) is a mouse monoclonal antibody raised against
residues 916-1215 of human HDAC6. In cell lines it detects a single band at the predicted
160kDa level.
Acc
epte
d A
rticl
e

11 This article is protected by copyright. All rights reserved.
Sections were firstly hydrated through successive baths of xylene, alcohols of decreasing
concentration and distilled water. Antigen unmasking was performed by pressure cooking
in citrate buffer (pH 6 10mM) for 30 minutes, reaching 120 degrees Celsius and >15 kPa
pressure. Sections were incubated for 30 minutes at room temperature in 0.3% peroxide
in methanol to quench endogenous peroxidise activity, and then for a further 30 minutes
at room temperature in Vectastain Elite PK-6101 goat serum as blocking buffer. Sections
were then incubated for one hour at room temperature in the appropriate Cell Signalling
or Santa Cruz antibody, at a concentration of 1 in 50 of blocking buffer for both sets of
antibodies. The sections were incubated for 30 minutes in a biotinylated secondary
antibody followed by 30 minutes in Avidin Biotin Complex (ABC) reagent (both
Vectastain Elite PK-6101 Rabbit IgG), both at room temperature.
Sites of immunoreactions were visualised by incubating in DAB (3,3′-diaminobenzidine
tetrahydrochloride) for 5 minutes, followed by light counterstaining with haematoxylin
(Vector H-3401). Sections were dehydrated and mounted for analysis under the
microscope.
Microscopic analysis
Sections of hippocampus and temporal cortex, immunostained using the Cell Signaling
antibodies, were scored for the degree of staining of granular neurons in the dentate gyrus
(DG) of the hippocampus and pyramidal cells of the inferior temporal gyrus (ITG).
Because not all cells in DG or ITG showed nuclear and/or cytoplasmic staining, it was
decided to assess these separately. Staining was rated on a scale of 0-3 both for the Acc
epte
d A
rticl
e

12 This article is protected by copyright. All rights reserved.
proportion of cells stained, and for the intensity of staining, in both the cytoplasm and
nucleus (where appropriate).
The proportion of cells/nuclei staining was scored according to:
0 = no cells staining
1 = a few cells staining
2 = a moderate number of cells staining
3 = most/all cells staining
The relative strength of cytoplasmic/nuclear staining was scored according to:
0 = no staining
1 = mild staining; some light brown or slightly denser granules present
2 = moderate staining; moderate number of medium brown or denser staining granules
present
3 = strong staining; many dark brown granules present
After scoring, the proportion and strength ratings in the nucleus and cytoplasm were
summated separately to give a total score for each (maximum score of 6) in each region.
The cerebellar sections were scored for immunostaining of Purkinje cells (PC), again
when using the Cell Signaling antibodies. Because the PC nucleus was unstained in all
instances, each PC was given a score according to the strength of immunostaining in the
cytoplasm alone (see scoring system for hippocampus and ITG) each cell thereby
attaining a potential maximum score of 3. In order to account for significant variation in Acc
epte
d A
rticl
e

13 This article is protected by copyright. All rights reserved.
the strength of cytoplasmic immunostaining between PC in the same section, it was
decided to examine 30 consecutively located PC per section.
Each ‘set’ of stained sections (ie all section from each area stained by each antibody) was
evaluated at x20 magnification at one sitting by the same assessor. Assessments were
repeated twice on a subset of sections, and any cases where there was disagreement from
the original staining assessment were subject to reconciliation with a second observer
(DMAM).
Statistical Analysis
Statistical analysis was performed using IBM® SPSS® Statistics Version 20. Differences
in HDAC staining in each area of the brain between all FTLD cases and controls,
between all FTLD-tau and all FTLD-TDP cases, and between the histological subtypes of
FTLD-tau (tau-MAPT and tau-Pi) were analysed using Mann-Whitney U tests. Kruskal-
Wallis analysis with post-hoc Dunn’s test (if significant) was used to test for differences
in staining between the histological subtypes of FTLD-TDP (TDP-A, TDP-B and TDP-
C) as well as between cases of FTLD-TDP with different genetic backgrounds (mutations
in MAPT, C9ORF72 and GRN with cases with no known mutation).
Acc
epte
d A
rticl
e

14 This article is protected by copyright. All rights reserved.
Results
HDAC4
Using the Cell Signalling antibody, a moderate to strong, granular cytoplasmic staining
for HDAC4 was observed in most, if not all, nerve cells of both the DG (Figure 1a, b)
and ITG (not shown) in most of the control cases (Figure 1a), as well as in most cases of
FTLD cases (Figure 1b). To the eye, there were no unambiguous group differences
between the FTLD cases and controls (compare Figure 1a and 1b), as regards either the
proportion of cells showing cytoplasmic staining, or the intensity of that staining, in
either region. In the cerebellum, most cases of FTLD and controls showed no
immunostaining of PC cytoplasm, though occasional cases in both groups showed a weak
immunostaining of isolated cells. There was usually no nuclear staining in DG (Figure
1a,b), ITG or PC in any case, though an occasional cell in all regions showed some weak
immunoreactivity. The Santa Cruz HDAC4 antibody showed a similar pattern of
immunostaining (on line supplementary figure 1a, b).
Nonetheless, the total cytoplasmic staining score (ie the sum of scores of proportion of
cells staining plus that of the relative strength of staining) was significantly higher in cells
of the DG (p=0.013) in FTLD overall compared to controls. This was due to both to an
increase in the proportion of cells showing cytoplasmic staining (p=0.016), as well as an
increase in the intensity of staining (p=0.050). Otherwise, there were no significant
differences in nuclear staining between FTLD and controls in DG, or between FTLD and
controls for both cytoplasmic and nuclear staining in ITG or in PC. There were no Acc
epte
d A
rticl
e

15 This article is protected by copyright. All rights reserved.
differences in the degree of staining of nuclei or cytoplasm between all FTLD-tau and all
FTLD-TDP cases, in DG, ITG or PC. However, comparison of FTLD-Picks and FTLD-
MAPT cases with controls showed a highly significant (p=0.007) difference in total
cytoplasmic (but not nuclear) staining in DG between the groups. Post-hoc testing
showed that this was due to higher staining scores in FTLD-Picks than in FTLD-MAPT
(p=0.038) and controls (p=0.022), which did not differ significantly from each other
(p=0.058). Furthermore, the higher staining score in DG cells in FTLD-Picks was due to
a higher level of cytoplasmic staining (p=0.018), rather than a greater proportion of cells
staining (p=0.332). There were no significant differences in either nuclear or cytoplasmic
staining between the different subtypes of FTLD-TDP, or the different genetic types of
FTLD overall.
HDAC5
Cytoplasmic immunostaining for HDAC5 in the DG was generally absent or weak, with
only a small to moderate proportion of cells showing slight nuclear staining in both
individual control or FTLD cases (Figure 1c, d). In the ITG, more cells showed a granular
cytoplasmic staining for HDAC5, though this was generally weak (not shown). However,
nuclear immunostaining for HDAC5 in nerve cells of the ITG was more intense, though
again the number of cells that stained varied widely between cases, but usually affecting
only a small proportion of cells. The Santa Cruz HDAC5 antibody showed a similar
pattern of immunostaining (on line supplementary figure 1c, d).
Acc
epte
d A
rticl
e

16 This article is protected by copyright. All rights reserved.
Statistically, there were no significant differences in any measure of HDAC5
immunostaining in cells of DG or ITG, or in PC, between all FTLD and control cases,
between FTLD-tau and FTLD-TDP cases, between the different histological subtypes of
FTLD-TDP, or the different genetic types of FTLD overall, Also, there were no
significant differences in staining between FTLD-MAPT and FTLD-Picks.
HDAC6
Generally, in control cases, no cells showed any cytoplasmic immunostaining for
HDAC6 (Figure 1e), though in some instances a few cells did show a very weak
immunostaining. However, the proportion of cells staining, and the intensity of staining,
was greater in some FTLD cases, especially those with FTLD-tau associated with Pick
bodies (Figure 1f). In the ITG, the intensity of cytoplasmic staining, and the proportion of
cells staining, again varied greatly, though there were no obvious differences between
FTLD cases and controls. Nuclear staining was present only in a small proportion of
cells, whether they were in FTLD or control cases, and was weak when present (Figure
1e, f). Little, or no, staining was observed in PC in control cases, with only a few FTLD
cases showing a weak, diffuse cytoplasmic staining of isolated cells. The Santa Cruz
HDAC6 antibody showed a similar pattern of immunostaining (on line supplementary
figure 1e, f).
The total cytoplasmic staining score was significantly higher in cells of the DG (p=0.013)
in FTLD overall compared to controls. Again, this was due to both to an increase in the
proportion of cells showing cytoplasmic staining (p=0.023), as well as an increase in the Acc
epte
d A
rticl
e

17 This article is protected by copyright. All rights reserved.
intensity of staining (p=0.039). Otherwise, there were no significant differences in
nuclear staining between FTLD and controls in DG, or between FTLD and controls for
both cytoplasmic and nuclear staining in ITG or in PC.
There were no differences in the degree of staining of nuclei or cytoplasm between all
FTLD-tau and all FTLD-TDP cases, in DG, ITG or PC. However, comparison of FTLD-
Picks and FTLD-MAPT cases with controls showed a significantly higher total
cytoplasmic (but not nuclear) score in DG in FTLD-Picks (p=0.01) compared to FTLD-
MAPT (p=0.01) and controls (p=0.008). This was due to an increase in the intensity of
cytoplasmic staining (p=0.033), as well as an increase in proportion of cells staining
(p=0.018). There were no significant differences in either nuclear or cytoplasmic staining
between the different subtypes of FTLD-TDP, or the different genetic types of FTLD
overall.
There were no changes in any of the HDAC scores, in any region, with age within the
control cases, either when all 27 cases were examined by regression analysis, or when
comparing elderly cases with minimal pathology with younger cases without pathology.
Other observations
None of the HDACs, from either source, immunostained the inclusion bodies in any of
the FTLD histological subtypes including Pick bodies in FTLD tau-Pi, neurofibrillary
tangle-like structures and glial cell tangles in FTLD tau-MAPT, neuronal cytoplasmic
inclusions and/or neurites in FTLD-TDP, neuronal intranuclear inclusions in FTLD Acc
epte
d A
rticl
e

18 This article is protected by copyright. All rights reserved.
associated with GRN mutations or p62 positive inclusions in hippocampus and
cerebellum in FTLD associated with C9ORF72 hexanucleotide expansions.
Discussion
The main findings from the present study are that certain HDACs may be dysregulated in
particular groups of patients with FTLD compared either to control cases, or when
compared as ‘internal’ subgroups. Although some of the more elderly control cases
showed minimal amounts of tau and/or Aβ pathology, especially, in hippocampus and
temporal lobe, there was no association between scores for any of the HDACs and age at
death for either of these regions, or cerebellum. We therefore conclude that such minor
amounts of pathology are unlikely to have influenced overall control values, and
therefore unlikely to have affected outcomes when comparing FTLD cases and controls.
Firstly, we found a significantly stronger cytoplasmic immunostaining for HDAC4 in
cells of DG in FTLD tau-Picks compared to FTLD tau-MAPT, suggesting that
dysregulation of HDAC4 could play a role in the pathogenesis of this form of FTLD-tau.
No differences in nuclear staining were seen between FTLD tau-Picks and FTLD tau-
MAPT, nor were any similar changes seen in ITG or cerebellum. Likewise, no changes in
HDAC4 were seen in other forms of FTLD (ie FTLD-TDP), or to be associated with any
of the other mutations which cause FTLD (ie GRN or C9ORF72). The increase in
cytoplasmic staining in cells of DG could be due to an increased expression of HDAC4,
or alterations in the cellular localisation of HDAC4, or a combination of the two. Since
HDAC4 is able to translocate between nucleus and cytoplasm, a process regulated in part Acc
epte
d A
rticl
e

19 This article is protected by copyright. All rights reserved.
by calcium/calmodulin-dependent kinase, tau-Pi pathology may involve increased
translocation of HDAC4 from the nucleus to the cytoplasm [15]. Downstream effects of
this could induce changes in gene expression or cell viability since nuclear accumulation
of HDAC4 has been linked to neuronal apoptosis [15]. However, since the only
significant difference in immunostaining that was observed was in cytoplasmic, rather
than nuclear, staining, and because HDAC4 is normally localised to the cytoplasm of
neurons [15], it is suggested that dysregulation of HDAC4 in FTLD-tau-Picks may exert
its pathological effects through a cytoplasmic substrate or substrates, rather than changes
in histone acetylation or promotion of apoptosis through nuclear accumulation.
Nevertheless, the differences in cytoplasmic staining observed here may represent subtle
alterations in the balance between nuclear and cytoplasmic levels of HDAC4, thus
affecting histone acetylation or cell viability.
There were no significant differences in immunostaining for HDAC5 in DG, ITG or
cerebellum between any of the groups. This conflicts with previous observations, made
by Yeh et al of increases in HDAC4 and HDAC5 in the caudate and cerebellum (Purkinje
cells (PC)) of FTLD-TDP type B cases compared to controls, with corresponding
reductions in the levels of histone acetylation [17]. However, in this latter study such
observations were based on only a few cases, and no statistical comparison of the results
was performed. Such findings might simply reflect small sample variability [17].
Interestingly, no obvious changes in any HDAC, compared to other FTLD cases, were
seen in the hippocampus or PC of the cerebellum of FTLD-TDP cases bearing
expansions in C9ORF72. In such cases there are p62 immunoreactive neuronal Acc
epte
d A
rticl
e

20 This article is protected by copyright. All rights reserved.
cytoplasmic inclusions in granule cells of the DG and cerebellum, and also occasionally
in PC – changes which are characteristic of this form of FTLD [31,32]. Consequently, it
might have been anticipated that cells in DG or PC would show some changes HDAC
activity given that the expansion might interfere with transcriptional activity [7,8].
Significant variations in immunostaining for HDAC6 in the DG, also suggest
dysregulation in FTLD. As with HDAC4, the intensity of immunostaining of the
cytoplasm was stronger, but also staining was present in a greater proportion of cells, in
FTLD tau-Pi than in tau-MAPT, once more suggesting that dysregulation of HDAC6, like
HDAC4, may play a greater role in FTLD tau-Pi than tau-MAPT. Differences in
cytoplasmic levels of HDAC6 could be caused by changes in localisation, expression, or
both and it will be important to determine the mechanism behind the changes in order to
understand the pathogenesis of FTLD more fully. Dysregulation of HDAC6 localisation
could contribute to disease pathology by inducing abnormally high or abnormally low
acetylation levels of normal cellular substrates of HDAC6, or by allowing HDAC6 to act
on novel substrates. Since HDAC6 acts on histones to repress transcription, changes in
localisation or expression could alter the gene expression profile, which may contribute
to the pathology of FTLD.
However, a number of other roles for HDAC6 have also been described which may be
affected by dysregulation and thus contribute to FTLD pathogenesis. For example, actin
and microtubules (tau) are both substrates of HDAC6 and are involved in aggresome
formation and the delivery of autophagosomal substrates to the lysosome to be removed Acc
epte
d A
rticl
e

21 This article is protected by copyright. All rights reserved.
by macroautophagy [21,33]. Therefore, dysregulation of HDAC6 may promote inclusion
formation through abnormal acetylation levels of actin and tubulin proteins [21,33].
Additionally, HDAC6 is able to interact with tau, through its microtubule binding
domain, supporting the idea that dysregulation of HDAC6 may be involved in the
pathogenesis of FTLD-tau [19,20,21]. This interaction may promote tau inclusion (Pick)
body formation since HDAC6 has been shown to promote phosphorylation of tau at
residue Thr231, which promotes hyperphosphorylation of tau [19] and reduces binding
and stabilisation of microtubules [20,21]. In turn, tau also inhibits the activity of HDAC6,
leading to increased microtubule acetylation and reduced autophagy [34,35].
The potential involvement of increased HDAC6 levels in dementia, particularly those
forms with underlying tau pathology, is highlighted by research into other
neurodegenerative diseases, including Alzheimer’s disease and multiple system atrophy
(MSA), where HDAC6 levels have been shown to be increased relative to controls,
particularly in the cortex and hippocampus in Alzheimer’s disease, and the temporal
cortex in MSA [21,28,36].
However, present data conflicts with some previous studies. For example, Odagiri et al
[28] observed significantly increased expression of HDAC6, with increased cytoplasmic
staining, in cases of FTLD-TDP type B compared to controls, whereas no significant
difference in HDAC6 immunostaining was observed between FTLD-TDP and control
cases in this experiment in DG, ITG or cerebellum [28]. It has also been shown that
HDAC6 can form a multi-protein complex with Parkin and TDP-43 to mediate Acc
epte
d A
rticl
e

22 This article is protected by copyright. All rights reserved.
translocation of TDP-43 into the cytosol, so it might be expected that dysregulation of
HDAC6 might be involved in FLTD-TDP [27]. These differences in findings could be
due to small sample sizes used or maybe the subjective nature of immunostain analysis,
since Ogadiri et al used immunoblotting to quantify HDAC6 expression [28].
HDACs are able to act on numerous substrates within cells, and so dysregulation, through
changes in localisation or expression, may have a range of different effects. According to
present data, both HDAC4 and HDAC6 appear to be dysregulated in DG in FTLD-tau-
Picks, and changes in these might therefore be associated with Pick body formation.
However, none of the HDACs appeared to immunostain inclusion bodies in any of the
FTLD histological subtypes whether these be Pick bodies in FTLD tau-Pi, neurofibrillary
tangle-like structures and glial cell tangles in FTLD tau-MAPT, neuronal cytoplasmic
inclusions and/or neurites in FTLD-TDP, neuronal intranuclear inclusions in FTLD
associated with GRN mutations or p62 positive inclusions in hippocampus and
cerebellum in FTLD associated with C9ORF72 hexanucleotide expansions. This suggests
that (changes in) HDACs do not play a direct role in inclusion body formation, but
nonetheless could precipitate or promote changes that ultimately lead to the formation of
such structures.
A potential limitation of the present study lies with the fact that only a single antibody for
HDAC, HDAC5 and HDAC was employed. Nonetheless, these antibodies have been well
characterized by the manufacturer, and antibodies against HDACs have been used
successfully in other studies based on human post mortem tissues [12,16,22,28]. Acc
epte
d A
rticl
e

23 This article is protected by copyright. All rights reserved.
Nonetheless, it would clearly be important to validate present findings using other
antibodies in order to be able to make more definitive observations. Also, it might be
argued that the number of cases studied was too low to generate sufficient statistical
power, especially with some of the smaller histological or genetic subgroups, and again it
would be important in future to build on the principal findings of the study by recruitment
of further cases.
Acc
epte
d A
rticl
e

24 This article is protected by copyright. All rights reserved.
Acknowledgements
We acknowledge the support of Alzheimers Research UK and Alzheimer’s Society
through their funding of the Manchester Brain Bank under the Brains for Dementia
Research (BDR) initiative. DMAM also receives funding from MRC and Wellcome Trust
which supported this study in part.
Amy Whitehouse and Klara Doherty did the immunohistochemistry and microscopical
assessments, and helped with paper writing.
Hsin Yeh developed the immunohistochemical staining protocols.
Andrew Robinson prepared sections for staining and immunohistochemistry.
Jennifer Thompson did the data analysis.
Julie Snowden helped with statistical advice and clinical data.
Sara Rollinson and Stuart Pickering-Brown provided genetic data.
Yvonne Davidson provided technical support and training.
David Mann provided study design, supervision, helped with microscopical assessments
and wrote the paper.
Acc
epte
d A
rticl
e

25 This article is protected by copyright. All rights reserved.
References
1. Neary D, Snowden JS, Mann DMA. Frontotemporal lobar degeneration: clinical
and pathological relationships. Acta Neuropathologica 2007; 114: 31-8
2. Mackenzie IRA, Neumann M, Baborie A, Sampathu DM, Du Plessis D, Jaros E,
Perry RH, Trojanowski JQ, Mann DMA, Lee V M-Y. A harmonized
classification system for FTLD-TDP pathology. Acta Neuropathol 2011; 122:
111-3
3. Arai T, Hasegawa M, Akiyama H, Ikeda K, Nonaka T, Mori H, Mann D,
Tsuchiya K, Yoshida M, Hashizume Y, Oda T. TDP-43 is a component of
ubiquitin-positive tau-negative inclusions in frontotemporal lobar degeneration
and amyotrophic lateral sclerosis. Biochem Biophys Res Commun 2006; 351: 602-
11
4. Neumann M, Sampathu DM, Kwong LK, Truax AC, Micsenyi MC, Chou TT,
Bruce J, Schuck T, Grossman M, Clark CM, McCluskey LF, Miller BL, Masliah
E, Mackenzie IR, Feldman H, Feiden W, Kretzschmar H, Trojanowski JQ, Lee
VM. Ubiquitinated TDP-43 in frontotemporal lobar degeneration and
amyotrophic lateral sclerosis. Science 2006; 314: 130-3
5. Davidson Y, Kelley T, Mackenzie IR, Pickering-Brown SM, Du Plessis D, Neary
D, Snowden JS, Mann DMA. Ubiquitinated pathological lesions in
frontotemporal lobar degeneration contain the TAR DNA-binding protein, TDP-
43. Acta Neuropathologica 2007; 113: 521-33
6. Baker, M., Mackenzie, I.R., Pickering-Brown, S.M., Gass, J., Rademakers, R.,
Lindholm, C., Snowden, J., Adamson, J., Sadovnick, A.D., Rollinson, S., Cannon,
A., Dwosh, E., Neary, D., Melquist, S., Richardson, A., Dickson, D., Berger, Z.,
Eriksen, J., Robinson, T., Zehr, C., Dickey, C.A., Crook, R., McGowan, E.,
Mann, D., Boeve, B., Feldman, H., Hutton, M. Mutations in progranulin cause
tau-negative frontotemporal dementia linked to chromosome 17. Nature 2006;
442: 916-9
7. DeJesus-Hernandez M, Mackenzie IR, Boeve BF, Boxer AL, Baker M,
Rutherford NJ, Nicholson AM, Finch NA, Flynn H, Adamson J, Kouri N, Wojtas
A, Sengdy P, Hsiung GY, Karydas A, Seeley WW, Josephs KA, Coppola G,
Geschwind DH, Wszolek ZK, Feldman H, Knopman DS, Petersen RC, Miller BL,
Dickson DW, Boylan KB, Graff-Radford NR, Rademakers R. Expanded
GGGGCC Hexanucleotide repeat in noncoding region of C9ORF72 causes
chromosome 9p-linked FTD and ALS. Neuron 2011; 72: 245-56 Acc
epte
d A
rticl
e

26 This article is protected by copyright. All rights reserved.
8. Renton AE, Majounie E, Waite A, Simón-Sánchez J, Rollinson S, Gibbs JR,
Laaksovirta H, Schymick JC, van Swieten J, Myllykangas L, Kalimo H, Paetau A,
Abramzon Y, Remes AM, Kaganovich A, Scholz SW, Duckworth J, Ding J,
Harmer DW, Hernandez DG, Johnson JO, Mok K, Ryten M, Trabzuni D,
Guerreiro RJ, Orrell RW, Neal J, Murray A, Pearson J, Jansen IE, Sondervan D,
Seelaar H, Blake D, Young K, Halliwell N, Callister J, Toulson G, Richardson A,
Gerhard A, Snowden J, Mann D, Neary D, Nalls MA, Peuralinna T, Jansson L,
Isoviita V-M, Kaivorinne A-L, Holtta-Vuori M, Ikonen E, Sulkava R, Benatar M,
Wuu J, Chio A, Restagno G, Borghero G, Sabatelli M, The ITALSGEN
Consortium, Heckerman D, Rogaeva E, Zinman L, Rothstein J, Sendtner M,
Drepper C, Eichler EE, Alkan C, Abdullaev Z, Pack SD, Dutra A, Pak E, Hardy J,
Singleton A, Williams NM, Heutink P, Pickering-Brown S, Morris HR, Tienari
PJ, Traynor BJ. A hexanucleotide repeat expansion in C9ORF72 is the cause of
chromosome 9p21-linked amyotrophic lateral sclerosis-frontotemporal dementia.
Neuron 2011; 72: 257-68
9. Neumann M, Roeber S, Kretzchmar HA, Rademakers R, Baker M, Mackenzie
IRA. Abundant FUS-immunoreactive pathology in neuronal intermediate filament
inclusion disease. Acta Neuropathol 2009; 118: 605-16
10. Yang S, Warraich ST, Nicholson GA, Blair IP. Fused in sarcoma/translocated in
liposarcoma: a multifunctional DNA/RNA binding protein. Int J Biochem Cell
Biol 2010; 42: 1408-11
11. Brownell JE, Allis CD. Special HATs for special occasions: linking histone
acetylation to chromatin assembly and gene activation. Curr Opin Genet Dev
1996; 6: 176-84
12. Chawla S, Vanhoutte P, Arnold FJ, Huang CL, Bading H. Neuronal activity-
dependent nucleocytoplasmic shuttling of HDAC4 and HDAC5. J Neurochem
2003; 85: 151-9
13. Hoshino M, Tagawa K, Okuda T, Murata M, Oyanagi K, Arai N, Mizutani T,
Kanazawa I, Wanker EE, Okazawa H. Histone deacetylase activity is retained in
primary neurons expressing mutant huntingtin protein. J Neurochem 2003; 87:
257-67
Acc
epte
d A
rticl
e

27 This article is protected by copyright. All rights reserved.
14. Majdzadeh N, Wang L, Morrison BE, Bassel-Duby R, Olson EN, D'Mello SR.
HDAC4 inhibits cell cycle progression and protects neurons from cell death. Dev
Neurobiol 2008; 68: 1076-92
15. Bolger TA, Yao TP. Intracellular trafficking of histone deacetylase 4 regulates
neuronal cell death. J Neurosci 2005; 25: 9544-53
16. Quinti L, Chopra V, Rotili D, Valente S, Amore A, Franci G, Meade S, Valenza
M, Altucci L, Maxwell MM, Cattaneo E, Hersch S, Mai A, Kazantsev A.
Evaluation of histone deacetylases as drug targets in Huntington's disease models.
Study of HDACs in brain tissues from R6/2 and CAG140 knock-in HD mouse
models and human patients and in a neuronal HD cell model. PLoS Curr 2010; 2
17. Yeh HH, Young D, Gelovani J, Herholz K, Mann DMA. Histone deacetylase
class II and acetylated core histone immunohistochemistry in human brains with
Huntington's disease. Brain Res 2013; 1504: 16-24
18. Hubbert C, Guardiola A, Shao R, Kawaguchi Y, Ito A, Nixon A, Yoshida M,
Wang XF, Yao TP. HDAC6 is a microtubule-associated deacetylase. Nature
2002; 417: 455-8
19. Lin YT, Cheng JT, Liang LC, Ko CY, Lo YK, Lu PJ. The binding and
phosphorylation of Thr231 is critical for Tau's hyperphosphorylation and
functional regulation by glycogen synthase kinase 3 beta. J Neurochem 2007;
103:802-13
20. Cho JH, Johnson GVW. Primed phosphorylation of tau at Thr231 by glycogen
synthase kinase 3 beta (GSK3 beta) plays a critical role in regulating tau's ability
to bind and stabilize microtubules. J Neurochem 2004; 88: 349-58
21. Ding H, Dolan PJ, Johnson GVW. Histone deacetylase 6 interacts with the
microtubule-associated protein tau. J Neurochem 2008; 106: 2119-30
22. Iwata A, Riley BE, Johnston JA, Kopito RR. HDAC6 and microtubules are
required for autophagic degradation of aggregated huntingtin. J Biol Chem 2005;
280: 40282-92 Acc
epte
d A
rticl
e

28 This article is protected by copyright. All rights reserved.
23. Du G, Liu X, Chen X, Song M, Yan Y, Jiao R, Wang CC. Drosophila histone
deacetylase 6 protects dopaminergic neurones against α-synuclein toxicity by
promoting inclusion formation. Mol Cell Biol 2010; 21: 2128-37
24. Kim SH, Shanware NP, Bowler MJ, Tibbetts RS. Amyotrophic Lateral Sclerosis-
associated Proteins TDP-43 and FUS/TLS Function in a Common Biochemical
Complex to Co-regulate HDAC6 mRNA. J Biol Chem 2010; 285, 34097-34105
25. Fiesel FC, Kahle PJ. TDP-43 and FUS/TLS: cellular functions and implications
for neurodegeneration. FEBS J 2011; 278: 3550-68
26. Fiesel FC, Voigt A, Weber SS, Van den Haute C, Waldenmaier A, Görner K,
Walter M, Anderson ML, Kern JV, Rasse TM, Schmidt T, Springer W, Kirchner
R, Bonin M, Neumann M, Baekelandt V, Alunni-Fabbroni M, Schulz JB, Kahle
PJ. Knockdown of transactive response DNA-binding protein (TDP-43)
downregulates histone deacetylase 6. EMBO J 2010; 29: 209-21
27. Hebron ML, Lonskaya I, Sharpe K, Weerasinghe PP, Algarzae NK, Shekoyan
AR, Moussa CE. Parkin Ubiquitinates Tar-DNA Binding Protein-43 (TDP-43)
and Promotes Its Cytosolic Accumulation via Interaction with Histone
Deacetylase 6 (HDAC6). J Biol Chem 2013; 288: 4103-15
28. Odagiri S, Tanji K, Mori F, Miki Y, Kakita A, Takahashi H, Wakabayashi K.
Brain expression level and activity of HDAC6 protein in neurodegenerative
dementia. Biochem Biophys Res Commun 2013; 430: 394-9
29. Neary D, Snowden JS, Gustafson L, Passant U, Stuss D, Black S, Freedman M,
Kertesz A, Robert PH, Albert M, Boone K, Miller BL, Cummings J, Benson DF.
Frontotemporal lobar degeneration: a consensus on clinical diagnostic criteria.
Neurology 1998; 51: 1546-54
30. Rascovsky K, Hodges JR, Knopman D, Mendez MF, Kramer JH, Neuhaus J, van
Swieten JC, Seelaar H, Dopper EG, Onyike CU, Hillis AE, Josephs KA, Boeve
BF, Kertesz A, Seeley WW, Rankin KP, Johnson JK, Gorno-Tempini ML, Rosen
H, Prioleau-Latham CE, Lee A, Kipps CM, Lillo P, Piguet O, Rohrer JD, Rossor
MN, Warren JD, Fox NC, Galasko D, Salmon DP, Black SE, Mesulam M,
Weintraub S, Dickerson BC, Diehl-Schmid J, Pasquier F, Deramecourt V, Lebert Acc
epte
d A
rticl
e

29 This article is protected by copyright. All rights reserved.
F, Pijnenburg Y, Chow TW, Manes F, Grafman J, Cappa SF, Freedman M,
Grossman M, Miller BL. Sensitivity of revised diagnostic criteria for the
behavioural variant of frontotemporal dementia. Brain 2011; 134: 2456-77
31. Boxer AL, Mackenzie IR, Boeve BF, Baker M, Seeley WW, Crook R, Feldman
H, Hsiung G-Y, Rutherford N, Laluz V, Whitwell J, Fote D, McDade E, Molano
J, Karydas A, Wojtas A, Goldman J, Mirsky J, Sengdy P, DeArmond S, Miller
BL, Rademakers R. Clinical, neuroimaging and neuropathological features of a
new chromosome 9p-linked FTD-ALS family. J Neurol Neurosurg Psychiatry
2011; 82: 196-203
32. Al Sarraj Al-Sarraj S, King A, Troakes C, Smith B, Maekawa S, Bodi I, Rogelj B,
Al-Chalabi A, Hortobagyi T, Shaw CE. p62 positive, TDP-43 negative, neuronal
cytoplasmic and intranuclear inclusions in the cerebellum and hippocampus
define the pathology of C9orf72-linked FTLD and MNA/ALS. Acta Neuropathol
2011; 122: 691-702
33. Kawaguchi Y, Kovacs JJ, McLaurin A, Vance JM, Ito A, Yao TP. The
deacetylase HDAC6 regulates aggresome formation and cell viability in response
to misfolded protein stress. Cell 2003; 115: 727-38
34. Perez M, Santa-Maria I, Gomez de Barreda E, Zhu X, Cuadros R, Cabrero JR,
Sanchez-Madrid F, Dawson HN, Vitek MP, Perry G, Smith MA, Avila J. Tau - an
inhibitor of deacetylase HDAC6 function. J Neurochem 2009; 109: 1756-66
35. Cook C, Gendron TF, Scheffel K, Carlomagno Y, Dunmore J, DeTure M,
Petrucelli L. Loss of HDAC6, a novel CHIP substrate, alleviates abnormal tau
accumulation. Hum Molec Genet 2012; 21: 2936-45
36. Xu K, Dai XL, Huang HC, Jiang ZF. Targeting HDACs: a promising therapy for
Alzheimer's disease. Oxid Med Cell Longev 2011; 2011: 143269. doi:
10.1155/2011/143269
Acc
epte
d A
rticl
e

30 This article is protected by copyright. All rights reserved.
Case
number
Clinical
Diagnosis
Pathological
Diagnosis
M : F (%) Age at
onset
(years)
Age at
death
(years)
Duration
(years)
Family
history
Brain
weight (g)
1-7 6 FTD
1 PNFA
FTLD-tau Pi 4:3 (57:43) 57 ± 10 65 ± 8 8 ± 2 7 N 1019 ± 126
8-13 6 FTD FTLD-tau
(MAPT +16)
2:4 (33:67) 48 ± 2 58 ± 5 10 ± 4 6 Y 1132± 103
14-15 2 FTD FTLD-TDP A 1:1 (50:50) 60 ± 1 66 ± 3 6 ± 2 1Y
1 N
1175 ± 50
16-22 5 FTD
2 PNFA
FTLD-TDP A
(GRN)
2:5 (29:71) 59 ± 6 69 ± 4 10 ± 5 6 Y
1 N
1050 ± 168
23 1 FTD FTLD-TDP A
(C9ORF72)
1:0 (100:0) 49 58 9 1Y 1050
24-28 2 FTD
3 FTD+MND
FTLD-TDP B 3:2 (60:40) 57± 10 60 ± 12 4 ± 2 3Y
2 N
1251± 185
29-31 1 FTD
2 FTD+MND
FTLD-TDP B
(C9ORF72)
1:2 (33:67) 59± 8 67 ± 7 8 ± 9 2 Y
1 N
1287± 108
32-33 2 SD FTLD-TDP C 0:2 (0:100) 63 ± 11 69± 4 7 ± 6 2 N 1279± 344
34-60 24 Normal
3 MCI
10 normal
6 AD
7 ARC
3 CVD
1 CAA
11:16
(41:59)
NA 64± 22 na 27 N 1248± 34
Table 1: Selected case details. AD = Alzheimer’s disease, ARC = age-related changes,
CAA = cerebral amyloid angiopathy, CVD = cerebrovascular disease, FH = family
history, FTD = frontotemporal dementia, MCI = mild cognitive impairment, MND =
motor neurone disease, na = not available, PNFA = progressive non-fluent aphasia, SD =
semantic dementia, Y = yes, N = no, * = some data unavailable.
Acc
epte
d A
rticl
e

31 This article is protected by copyright. All rights reserved.
Legends to Figure
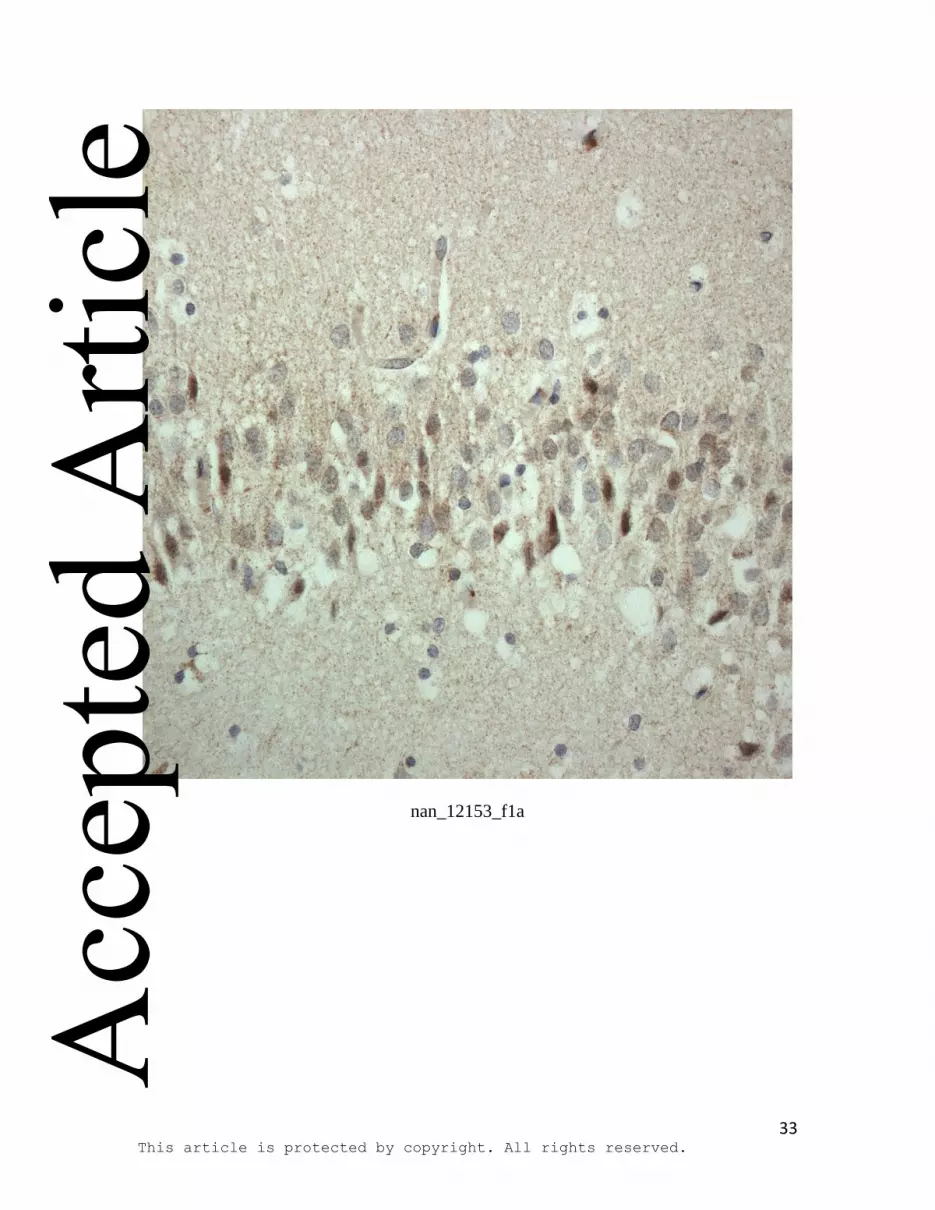
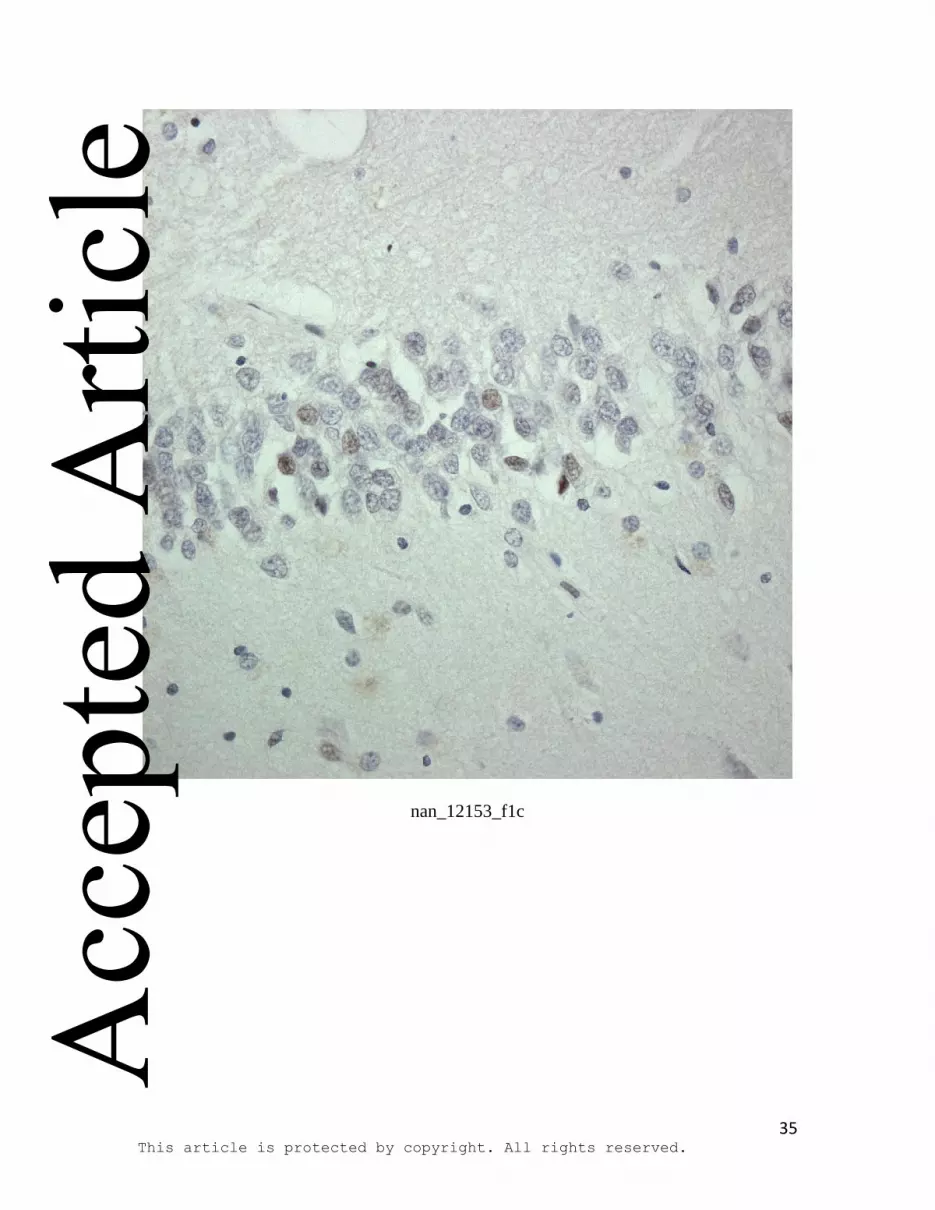
Figure 1: HDAC immunostaining in cells of the dentate gyrus of the hippocampus in
control (a,c,e) and FTLD-tau with Pick bodies (b,d,f) for: HDAC4 (a,b), HDAC5 (c,d)
and HDAC6 (e,f) employing Cell Signalling HDAC antibodies. In most control (a) and
FTLD (b) cases, a similarly moderate to strong, granular cytoplasmic staining for
HDAC4 was observed, and no clear group differences could be ascertained on visual
inspection alone. Nonetheless, statistical analysis showed a significantly higher
cytoplasmic staining score (p=0.013) in FTLD overall compared to controls, due to both
to an increase in the proportion of cells showing cytoplasmic staining (p=0.016), as well
as an increase in the intensity of staining (p=0.050). Cytoplasmic immunostaining for
HDAC5 was generally absent or weak, with only a small to moderate proportion of cells
showing slight nuclear staining in either control (c) or FTLD (d) cases. Again no clear
group differences could be seen between control and FTLD cases, and this was borne out
by statistical analysis. Generally, no cells showed any cytoplasmic immunostaining for
HDAC6 in control cases (e), whereas there was strong HDAC6 immunoreactivity in
perikarya and cell processes in FTLD-tau cases associated with Pick bodies (f). Statistical
analysis supported these visual observations inasmuch as the total cytoplasmic staining
score was significantly higher in cells of the DG (p=0.013) in FTLD overall compared to
controls, due to both to an increase in the proportion of cells showing cytoplasmic
staining (p=0.023), as well as an increase in the intensity of staining (p=0.039).
Immunoperoxidase-haematoxylin; all at x40 microscope objective magnification.
Acc
epte
d A
rticl
e

32 This article is protected by copyright. All rights reserved.
On-line supplementary Figure 1: HDAC immunostaining in cells of the dentate gyrus
of the hippocampus in control (a,c,e) and FTLD-tau with Pick bodies (b,d,f) for: HDAC4
(a,b), HDAC5 (c,d) and HDAC6 (e,f) employing Santa Cruz HDAC antibodies. In most
control (a) and FTLD (b) cases, a similarly moderate to strong, granular cytoplasmic
staining for HDAC4 was observed. Cytoplasmic immunostaining for HDAC5 was
generally absent or weak, with only a small to moderate proportion of cells showing
slight nuclear staining in either control (c) or FTLD (d) cases. Generally, cells showed
weak to moderate cytoplasmic immunostaining for HDAC6 in control cases (e), whereas
there was strong HDAC6 immunoreactivity in perikarya and cell processes in FTLD-tau
cases associated with Pick bodies (f).
Immunoperoxidase-haematoxylin; all at x40 microscope objective magnification.
Acc
epte
d A
rticl
e
33 This article is protected by copyright. All rights reserved.
nan_12153_f1a
Acc
epte
d A
rticl
e

34 This article is protected by copyright. All rights reserved.
nan_12153_f1b
Acc
epte
d A
rticl
e
35 This article is protected by copyright. All rights reserved.
nan_12153_f1c
Acc
epte
d A
rticl
e

36 This article is protected by copyright. All rights reserved.
nan_12153_f1d
Acc
epte
d A
rticl
e

37 This article is protected by copyright. All rights reserved.
nan_12153_f1e
Acc
epte
d A
rticl
e

38 This article is protected by copyright. All rights reserved.
nan_12153_f1f
Acc
epte
d A
rticl
e


