Embed Size (px)
Citation preview

Int. J. Electrochem. Sci., 8 (2013) 11877 - 11895
International Journal of
ELECTROCHEMICAL SCIENCE
www.electrochemsci.org
Hot Corrosion Behavior of FeAl Intermetallic Compound
Modified with Silver in Molten Salt Mixture
R. A. Rodríguez-Diaz1, 2*
, J. Uruchurtu-chavarín2, A. Molina-Ocampo
2, J. Porcayo-Calderon
2,
M. E. Mendoza3, S. Valdez
4, J. Juárez-Islas
5.
1 Facultad de Química-UNAM, Circuito Exterior S/N, Cd. Universitaria, C.P. 04510, México, D.F.,
MEXICO. 2
U.A.E.M.-C.I.I.C.A.P. Av. Universidad 1001, Col. Chamilpa, 62500 - Cuernavaca, Mor., México 3
Instituto de Física, Universidad Autónoma de Puebla, Apartado Postal J-48, Puebla 72570, México. 4
Instituto de Ciencias Físicas-UNAM, Av. Universidad S/N, Col. Chamilpa, Cuernavaca, C.P. 62210,
Morelos, México. 5 Instituto de Investigaciones en Materiales-UNAM, circuito exterior S/N, Ciudad Universitaria, C. P.
04510, México DF, México. *E-mail: [email protected]
Received: 30 May 2013 / Accepted: 27 August 2013 / Published: 10 September 2013
The hot corrosion behavior of Fe40Al intermetallic alloyed with 2.5 at. % Ag in KCl-ZnCl2 (1:1M) at
450 °C has been studied and assessed by means of electrochemical techniques. Techniques included
potentiodynamic polarization curves, linear polarization resistance (LPR) and electrochemical
impedance spectroscopy (EIS) measurements. Furthermore thermodynamic stability phase diagrams
were calculated and elaborated in order to improve the understanding of the corrosion mechanism.
Results have shown that addition of Ag increase the corrosion rate. Besides, corrosion potential of Fe-
Al-Ag alloy resulted nobler. Ternary Fe-Al-Ag alloy exhibited a more noble corrosion potential but a
bigger corrosion rate than the 304 SS specimen corroded under the same experimental conditions.
Corrosion behavior is explained in terms of the stability of the corrosion products formed film.
Keywords: FeAl aluminide, intermetallic compound, hot corrosion, electrochemical technique.
1. INTRODUCTION
Nowadays, accelerated urbanization and diversification of industrial sectors have led to the
production of enormous quantities of wastes; a considerable portion of which is made up of organic
matter. These wastes have been considered as detrimental to public health, ecosystem and the
environment, if not correctly managed. The economic and financial impacts of these wastes cannot be
ignored and their management has become a principal environmental concern. Incineration is a potent
technique for organic combustible waste treatment and disposal, mainly because of the substantial
Int. J. Electrochem. Sci., Vol. 8, 2013
11878
volume reduction, energy recovery, and the destruction of disease-causing microorganism and other
toxic organic compounds [1].
Waste incinerators both produce and consume energy. In a large majority of cases, the
energetic value of the waste exceeds the process demands and this result in the net export of energy.
There are three ways of recovering energy: all-electric, all-thermal and combined heat and power [2].
Alloys used for applications involving high-temperature processes, such as combustion and
high-power operations, sometimes undergo an aggressive mode of corrosion attack linked with
formation of salt deposits on their surfaces at elevated temperatures [3]. It has been reported that 5–
10% of operating costs in such plants are associated to corrosion failure at high temperature and
related maintenance costs [4, 5].
Numerous variables, including alloy composition and amount of deposit salt, gas composition,
temperature, temperature cycling, erosion, alloy composition, and alloy microstructure, have direct
effects on severity of hot corrosion [6].
Severity of corrosive environments at metal/molten salt interface is influenced by penetration
depth of corrosive species through scales. Protective oxide films, derived from alloying elements, play
an important role in preventing corrosion attack [7]. As a result of this corrosion phenomenon, a
porous and poorly adherent oxide scale is formed on surface of attacked alloy, which does not have an
acceptable capability to protect the alloy in harsh, corrosive conditions [8].
One possible strategy to enhance energy conversion efficiency by mitigating superheater
corrosion is via alloy modification. While accelerated corrosion is repeatedly observed for common,
iron-based, superheater alloys with 1–2% Cr, higher alloyed steels such as austenitic stainless steels or
nickel-base alloys have shown greater corrosion resistance [9,7] and are candidate materials for tubes
and/or coatings.
FeAl base intermetallic alloys are of great interest in the industry for structural and high
temperature applications mainly because of their low density and the low cost of the materials used for
their production [10]. Besides, Al concentration of these alloys induces the formation of a passive
aluminum oxide scale which is responsible of their high resistance to oxidation [11], sulphidation [12]
at high temperatures and hot corrosion in molten salts [13, 14].
In order to obtain more information about the mechanisms of corrosion that occurs in alloys
exposed to the aggressive environment involved in high-temperature and/or combustion processes,
electrochemical techniques are more appropriate than conventional gravimetric methods in which the
weight loss is measured.
Mohammadi and Alfantazi [15] studied the corrosion behavior of Inconel 625 alloy exposed to
molten salt consisting of 47PbSO4–23 ZnO–13 Pb3O4–10Fe2O3–7PbCl2 (wt.%) under air atmosphere
at 600, 700 and 800 °C, utilizing potentiodynamic polarization, EIS and weight-loss measurement
techniques. The authors observed a general surface corrosion, intergranular corrosion, formation of
voids and a network of distributed pores on surface and cross-section, plus internal oxidation and
sulfidation. Besides, in this study, the EIS data fitted to a porous and non-protective barrier layer
electrochemical model.
Otero et al. [16] studied the corrosion behavior of a 12CrMoV alloy in contact with a molten
mixture of (52-48) mol.% PbCl2-KCl, similar to that found in waste incineration plants. In this

Int. J. Electrochem. Sci., Vol. 8, 2013
11879
investigation, the corrosion kinetics was analyzed using continuous-current electrochemical techniques
and electrochemical impedance spectroscopy (EIS). According to EIS experiments, the authors
discovered in all cases tested, a diffusion-control mechanism. The Rp obtained from these experiments
are in a good agreement with the Rp obtained by (direct current) dc experiments.
Zeng and Li [17] studied the hot corrosion behavior of the Ni-based superalloy M38G covered
with a film of molten 0.9Na2SO4–0.1K2SO4 (mole fraction) by EIS at 900 °C in air. For comparison,
the corrosion of the alloy immersed in molten (Na,K)2SO4 was also examined. The authors discovered
that contrary to the corrosion in deep molten salt, the corrosion of the alloy in the presence of a film of
fused salt presented the characteristics of two capacitive loops for all the duration of the experimental
test. Equivalent circuits representing the corrosion of the alloy in both corrosion conditions are
proposed to fit the impedance spectra and electrochemical parameters in the equivalent circuits were
also calculated.
This work deals with an electrochemical study of the effect of adding 2.5 at.% Ag to a Fe40Al
intermetallic alloy exposed to a salt mixture composed of KCl-ZnCl2 (1:1M) at 450 °C on its corrosion
behavior. The aim of present investigation is to find out a potential improvement for incinerator heat
exchanger linings that will better tolerate the extreme conditions of heat and abrasion experienced by
these components.
2. EXPERIMENTAL PROCEDURE
2.1 Materials
Cast ingots of binary Fe-40Al (at. %) and ternary Fe40Al2.5Ag (at. %) alloys were elaborated
using a high-frequency induction furnace at approximately 1500°C in air. High purity (99.9 %) Fe, Al
and Ag were placed in a silicon carbide crucible for induction melting. The molten Fe-40Al and
Fe40Al2.5Ag alloys were poured into a rectangular copper mold and subsequently solidified during
cooling until room temperature was reached, obtaining in this way a coarse grain microstructure.
2.2 Sample preparation
The produced ingots were cut by a diamond wheel cutter into small rectangular parallelepiped
pieces of surface area ranging from 1.5 to 2.5cm2. The electrical contact was made by welding a
Ni20Cr wire to the specimen. Once welded to the specimen, the wire was put inside an alumina tube (2
mm inner diameter), so that the specimen remained at one end of the tube, where it was sealed with a
refractory cement. The experimental apparatus used in the present study is very similar to that
employed in a previous research [18].
2.3 Electrochemical techniques
Electrochemical techniques for characterizing the corrosion at high temperature included linear
polarization (LPR), potentiodynamic polarization curves and electrochemical impedance (EIS)
measurements. The body of the test cell was a 25 ml alumina crucible.

Int. J. Electrochem. Sci., Vol. 8, 2013
11880
The most important elements were a reference and auxiliary electrodes, made of a 0.5 mm
diameter (Pt) wire inside a mullite tube and filled with ceramic cement. The amount of salt in each run
was 0.5 g for an exposed area of 1.0 cm2 under static conditions, without stirring the molten salt. The
electrical contact was made by welding an 80 wt. % Cr–20 Ni wire to the specimen.
Polarization curves were obtained by polarizing the specimens from -500 to +1000 mVPt with
respect to the free corrosion potential value, Ecorr, at a scanning rate of 1.0 mV/s. Corrosion current
density values, Icorr, were calculated by using the Tafel extrapolation method taking an extrapolation
zone of ± 250 mV around the Ecorr value.
LPR measurements were carried out by polarizing the specimen from –10 to +10 mV with
respect to Ecorr, at a scanning rate of 1 mV/s, repeated every 20 minutes over a period of 24 hours. EIS
measurements were done in the frequency interval of 0.05 to 30000 Hz at the Ecorr value by using a
PC4-300 Gamry potentiostat. The amplitude of the input sine-wave voltage was 10 mV.
Three measurements were performed in each case. The working salt consisted of 500 mg/cm2
of an eutectic mixture of KCl-ZnCl2 (1:1 M analytical grade) for each test. The testing temperature was
450ºC in static air condition. Prior to the tests, the specimens surfaces were prepared by the standard
technique of grinding with SiC from 180 to 1200 grit emery paper and polished with 1 µm alumina
slurry, after, the sample was washed with distilled water in an ultrasound apparatus.
2.4 Microstructural analysis of as-cast and corroded specimens.
Both as-cast and corroded specimens (taken after the LPR measurements) were mounted in
bakelite. Metallographic preparation of encapsulated specimens was performed by grinding the
specimens from 180 to 2000 grit paper and polished with 1 μm alumina slurry.
In order to determine crystal structure and phases identification in as-cast specimens, a Siemens
5000 X-ray diffractometer was employed, using Cu tube (Kα line radiation: λ = 0.15406 nm), and a
diffracting beam graphite monochromator. The XRD patterns were recorded in the 2θ range from 20 to
80° (with step size 0.02, time per step 0.6 s).
The as-cast and corroded specimen surfaces were analyzed with a scanning electron
microscope (SEM) with an accelerating voltage of 25 keV. Chemical microanalysis was carried out
with an energy dispersive X-ray analyzer (EDX) attached to the SEM.
3. RESULTS AND DISCUSSION.
3.1 Microstructural characterization of un-corroded alloys.
3.1.1 Microstructure characterization by scanning electron microscopy.
The microstructure of the as-cast Fe40Al alloy is shown in Figure 1 a), exhibiting grains with a
predominantly columnar morphology. XRD, SEM and chemical analyses using the EDS technique did
not reveal the presence of precipitates on the surface of this alloy. This observation is consistent with
the wide interval of composition (35-50 at. % Al) which contains a FeAl phase with a B2-type crystal
structure according to the phase diagram for the Fe-Al system [19]. This alloy presented a chill-type

Int. J. Electrochem. Sci., Vol. 8, 2013
11881
microstructure with three typical grain morphologies: chill, equiaxed and columnar. The mean size of
chill morphology grains was 276 ± 88 μm, the dimensions of the columnar grains were 280 ± 94 μm in
width and 2200 ± 130 μm in length and the size of equiaxed morphology grains was 548 ± 91 μm.
Figure 1 b) displays the microstructure of ternary Fe40Al2.5Ag alloy at a higher magnification. This
illustration show light gray precipitates with round borders uniformly distributed inside a grain of FeAl
matrix alloy. According to XRD and point chemical analyses, these light gray precipitates correspond
to pure Ag phase.
Figure 1. Microstructures of the as-cast alloys a) Fe40Al and b) Fe40Al2.5Ag.
3.1.2. Microstructural characterization of un-corroded alloys by X-Ray Diffraction (XRD) technique.
Figure 2. X-Ray diffraction patterns of the as-cast alloys a) Fe40Al and b) Fe40Al2.5Ag.
Figure 2 shows the XRD profiles of as-cast Fe40Al and Fe40Al2.5Ag (at. %) alloys. XRD
patterns belonging to binary Fe40Al alloy exhibits only, the fundamental (f) and super lattice peaks (s)
corresponding to a cubic B2 (CsCl) type ordered crystal structure [20, 21] as shown in Figure 2 a).

Int. J. Electrochem. Sci., Vol. 8, 2013
11882
While the Fe40Al2.5Ag alloy displays the presence of peaks belonging both to the FeAl phase with a
B2 ordered crystalline structure and the Ag phase with Fcc-type crystal structure, as shown in Figure 1
b). This finding indicates that all the Ag content did not entered in solid solution in FeAl matrix; but
rather, this element precipitated uniformly distributed in this binary alloy. This behavior is due to the
immiscibility of Ag in both Fe and Al elements according to Fe-Ag and Fe-Al binary alloy phase
diagrams [22, 23].
Additional peaks pertaining to second phases or precipitates were not detected in Figure 1 a),
suggesting that a single monolithic FeAl binary alloy is formed without the presence of precipitates.
Figures 2 a), b) and c) do not exhibit all diffraction peaks, which is related to a large grain size and a
preferred surface crystallographic orientation on samples.
3.2. Potentiodynamic polarization curves.
Polarization curves for binary Fe40Al and ternary Fe40Al2.5Ag alloys are shown in Figure 3.
The polarization curves for Fe40Al2.5Ag alloy present a passive region with the possible formation of
two different passive oxide compounds at about 0 volts and 175 volts, respectively. Fe40Al
intermetallic alloy displays an active behavior only, with an Ecorr value close to −331 mV and a
corrosion rate, expressed in terms of the Icorr value near to 0.35 mA/cm2. For the Fe40Al alloy a
depolarizing region with fast dissolution in the anodic branch could be observed with the possible
formation of non-protective corrosion products, reaching a limit current region at high anodic over-
potentials at about 200mV. With the addition of Ag, the Ecorr shifted towards positive side values of the
vertical axis, reaching a value of −98 mV. In the same manner, the corrosion current density value
increased with the addition of 2.5Ag. Thus, the addition of Ag increases the corrosion current density
value, which means that this element induces a deleterious effect in the corrosion behavior of Fe40Al
alloy. A similar behavior was reported in a previous research. Salinas et al. [24] studied the effect of
adding silver to Fe40Al alloy on its corrosion behavior when the alloy was exposed to NaCl-KCl
molten salt mixture at 670 °C. The authors reported that addition of Ag turned the Ecorr value more
noble and the Icorr value was increased.
Porcayo et al., [25] reported a value of the corrosion potential Ecorr equal to -141 mV with an
Icorr value of 1.89 mA/cm2 in a 304 SS sample that was corroded in the same salt mixture (KCl-ZnCl2)
at 450 °C. Therefore, binary Fe40Al alloy studied in present work exhibit a more active corrosion
potential but a lower corrosion rate than 304 SS under these test conditions. By the other side, ternary
FeAlAg alloy exhibited a more noble corrosion potential but a bigger corrosion rate than the 304 SS
sample corroded under the same experimental conditions.
Porcayo et al., [25] reported a current density value Icorr of 3.6 mA/cm2 in a Ni20Cr wt %
coating deposited on 304 stainless steel that was corroded in the same salt mixture (KCl-ZnCl2) at 450
°C. Therefore, binary FeAl alloy presented a lower corrosion rate (expressed in terms of Icorr) than
Ni20Cr wt% coating deposited on 304 SS corroded under the same conditions. However, after Ag
addition the Icorr value shifted to 9 Ohm.cm2. Thus, Fe40Al2.5Ag alloy presented a bigger corrosion
rate than Ni20Cr wt% coating.

Int. J. Electrochem. Sci., Vol. 8, 2013
11883
Figure 3. Polarization curves for Fe40Al alloyed with 2.5% Cr, Ti, and Ag in the KCl + ZnCl2 mixture
at 670°C.
3.3 LPR measurements.
The Rp values as a function of immersion time for Fe40Al binary alloy display variability but
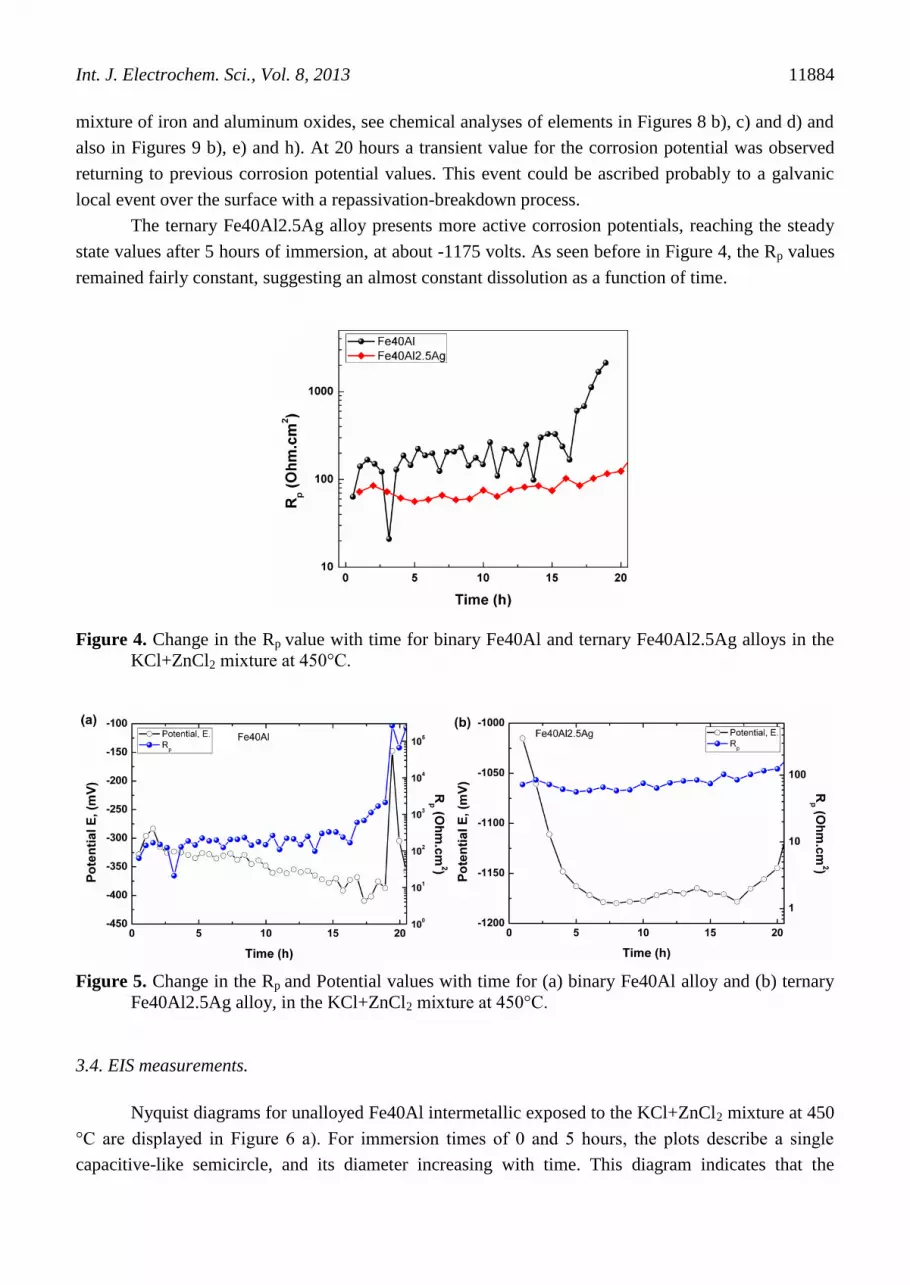
with a trend to increase as a function of time suggesting a decrease in its corrosion rate see Figure 4.
On the other hand the Fe40Al2.5Ag´ Rp values are lower than the former ones, and exhibit a steady
state condition with a slight increasing trend along the time of immersion, with average values around
80 ohms cm2, but below the Rp´ values displayed by the FeAl alloy. This behavior is in accordance
with the polarization curves shown in Figure 3, and can be due to the passive layer formed over the
surface of the Fe40Al2.5Ag alloy.
In a previous investigation, Rodriguez et al. [26] measured the change in the Rp value with time
for binary Fe40Al and ternary Fe40Al2.5Cr or Fe40Al2.5Ti alloys in the KCl+ZnCl2 mixture at
450°C. The authors reported that both additions of Cr and Ti to Fe40Al alloy induced an increment of
Rp values under the same experimental conditions of the tests. In contrast, addition of silver to Fe40Al
promoted a decrement of the mean Rp value over the whole exposure time.
The ternary Fe40Al2.5Ag alloy exhibited mean values of Rp near to 100 Ohm.cm2, while the
mean Rp values of Fe40Al alloy resulted near to 300 Ohm.cm2, see Figures 5 a) and b). This behavior
is associated to the higher corrosion rate of FeAlAg alloy as compared with binary alloy. A previous
research, reported a similar effect after the addition of Ag to a Fe-Al intermetallic alloy. Salinas et al.
[24] studied the effect of adding Li, Ni, Ag and Cu to Fe40Al alloy on its hot corrosion behavior when
the alloy was exposed to NaCl-KCl molten salt mixture at 670 °C. The authors reported that addition
of Ag, Ni and Cu increased the corrosion rate measured in terms of the Icorr.
Figure 5 a) and b) display the change in the Rp and Potential values with time for (a) Fe40Al
alloy and (b) Fe40Al2.5Ag alloy exposed to the KCl+ZnCl2 mixture at 450°C. In these illustrations is
clearly observed that the corrosion potential and the Rp values present an inverse correlation. The
corrosion potential becomes active due to the corrosion process, while the Rp increased due to the film
formation process. The film responsible for the increment of Rp values, is composed mainly by a
Int. J. Electrochem. Sci., Vol. 8, 2013
11884
mixture of iron and aluminum oxides, see chemical analyses of elements in Figures 8 b), c) and d) and
also in Figures 9 b), e) and h). At 20 hours a transient value for the corrosion potential was observed
returning to previous corrosion potential values. This event could be ascribed probably to a galvanic
local event over the surface with a repassivation-breakdown process.
The ternary Fe40Al2.5Ag alloy presents more active corrosion potentials, reaching the steady
state values after 5 hours of immersion, at about -1175 volts. As seen before in Figure 4, the Rp values
remained fairly constant, suggesting an almost constant dissolution as a function of time.
Figure 4. Change in the Rp value with time for binary Fe40Al and ternary Fe40Al2.5Ag alloys in the
KCl+ZnCl2 mixture at 450°C.
Figure 5. Change in the Rp and Potential values with time for (a) binary Fe40Al alloy and (b) ternary
Fe40Al2.5Ag alloy, in the KCl+ZnCl2 mixture at 450°C.
3.4. EIS measurements.
Nyquist diagrams for unalloyed Fe40Al intermetallic exposed to the KCl+ZnCl2 mixture at 450
°C are displayed in Figure 6 a). For immersion times of 0 and 5 hours, the plots describe a single
capacitive-like semicircle, and its diameter increasing with time. This diagram indicates that the

Int. J. Electrochem. Sci., Vol. 8, 2013
11885
corrosion process is under charge transfer from the metal to the electrolyte through the double
electrochemical layer [27]. For times greater than 5 hours, in addition to the high-frequency capacitive
semicircle there is an uncompleted low-frequency semicircle. The diameter of the low-frequency
semicircle is much bigger than that for the high-frequency semicircle and it has a trend to decrease as
time elapses. The appearance of a large capacitive loop at the low-frequency region may denote the
formation of a protective scale on the alloy surface which is in accordance with polarization curve of
Fe40Al alloy shown in Figure 3. This behavior can be due to the formation of a layer of corrosion
products composed mainly by a mixture of Al and Fe protective oxides and other compounds such as
metals chlorides, see the chemical mappings displayed in Figure 8 b), c), d), e) and f). The presence of
aluminum and iron oxides can be confirmed by looking at the thermodynamic stability phase diagram
Fe-Al-Ag-Cl-O displayed in Figure 11, where Al and Fe oxide are stable across a wide interval of
oxygen partial pressure (PO2).
Figure 6. (a) Nyquist, (b) Bode and (c) Bode phase diagrams for Fe40Al corroded in the KCl+ZnCl2
mixture at 450°C.
The bode impedance diagram shows two slopes and flat regions at high and low frequencies
corresponding to the solution resistance at high frequency and the charge transfer resistance at low
frequency, see Figure 6 c). The slope corresponds to the double layer capacitance and relates to a one
time constant RC.

Int. J. Electrochem. Sci., Vol. 8, 2013
11886
The Bode phase shift diagram, Figure 6(b), shows a single peak around 100 Hz, indicating the
absence of a protective layer before applying the stress, and related to the double layer capacitance.
However, as soon as the stress was applied, the presence of two overlapped peaks appeared, indicating
the presence of a protective corrosion products layer, therefore suggesting that the crack walls may be
covered by corrosion products. The aggressive ions have to diffuse through this layer and give rise to
the diffusion process shown by Nyquist data.
Figure 7. (a) Nyquist, (b) Bode and (c) Bode phase diagrams for Fe40Al2.5Ag alloy corroded in the
KCl+ZnCl2 mixture at 450°C.
Nyquist diagrams for ternary Fe40Al2.5Ag intermetallic alloy exposed to the KCl+ZnCl2
mixture at 450 °C are presented in Figure 7 a). A high frequency capacitive semicircle associated to
the charge transfer accompanied with a straight line diffusion process, starting to fold down at higher
times of immersion associated to a limited diffusion layer and adsorption process, are clearly seen. The
Bode impedance diagram (Figure 7c) shows a high frequency low impedance flat regions
corresponding to the solution and charge transfer resistance and a low frequency slope associated to
mass transport impedance (see Figure 7 b)).

Int. J. Electrochem. Sci., Vol. 8, 2013
11887
The phase shift diagrams shown in Figure 7 b), shows at least two peaks at high and low
frequencies related to the double layer and mass transport capacitance. Two overlapped peaks appeared
at higher frequencies after five hours of immersion, indicating the presence of a corrosion products
layer. The impedance behavior observed can be ascribed to the active conditions promoted by the Ag
precipitates that will induce galvanic corrosion effects due to its noble potential with respect to the Fe-
Al alloy components, promoting localized attack. Total impedance values remained almost the same
(2x10² ohm.cm
2) except for the ten hour immersion measurement, where a total impedance slight
increase was observed. All these is in accordance with the corrosion potential behavior and
polarization resistance values as a function of time, observed and presented in Figures 4 and 5.
3.5. Microstructural characterization of corroded alloys.
After the LPR tests, some areas of corroded alloys were analyzed by means of scanning
electron microscopy technique (SEM). Corrosion morphology of Fe40Al binary alloy together with the
corresponding X-ray mappings of Al, Fe, O, Cl and Zn is shown in Figure 8.
Figure 8. Photomicrographs of (a) Fe40Al corroded in the KCl+ZnCl2 mixture at 450°C together with
X-ray mappings of (b) Al, (c) Fe, (d) O, (e) Cl and (f) Zn.
Figures 8 b) and d), denote the existence of Al and O on the external layer, in these illustrations
can be observed a discontinuous character of the Al layer, these findings led us to infer that there was
some Al2O3 layer formed on top surface of the alloy. The presence of protective aluminum oxide film
is justified by observing the thermodynamic stability phase diagram that displays a wide region in
Int. J. Electrochem. Sci., Vol. 8, 2013
11888
which the aluminum oxide is stable, see Figure 11. Besides, previous investigations have reported
aluminum oxide scale formation on iron aluminides’s surface [28, 29]. In addition to this, Figure 10 e)
denotes the presence of Cl beneath the Al2O3 superficial layer, which indicates that the molten salt had
dissolved the oxide scale and permeated through it. This rapidly degraded the oxide´s protective
properties, leading to a continuous degradation of the ternary alloy. According to ZnCl2-KCl phase
stability diagram [30], the ZnCl2–KCl salt mixture was melted at experimental operation temperature,
making the creation of protective layers over these Fe-Al alloys more difficult.
Aluminum depletion shown in Figure 8 b) is caused by a displacement reaction in the initial
stages of the corrosion process in accordance with reaction 2 included in Table 2. As a direct
consequence, an iron-enriched subsurface zone below the protective aluminum oxide located at surface
of FeAl based alloy is formed in the ternary alloy matrix, see Figure 8 c). Iron produced in this way, is
easily attacked by the chloride melt. Furthermore, free chlorine ions liberated by reaction 3 included in
table 2, may penetrate easily inwards as a dissolved or gaseous species, trough pores of corrosion
products and oxide scales, and concentrate near the alloy/scale interface. Demetallification of Al under
scale alloy interface induces an increment of iron activity; besides, in this local region the chlorine
partial pressure is high, so iron reacts with chlorine to form FeCl2 according to reaction 10 included in
Table 2. Formation of FeCl2 produces significant scale disintegration due to the large growth of
stresses derived from the large volume expansion created when the bold centered cubic crystal
structure of Fe transforms to a monoclinic crystal structure corresponding to the FeCl2 phase. Scale
disruption leads to a deeper penetration of oxygen as evidenced in Figure 8 d). Once FeCl2 was
formed, after reacted with oxygen to form iron oxide according to reaction 9 included in Table 2. This
induced the formation of a microporous surface film on the ternary alloy, allowing additional
penetration by oxidants [31].
Figure 9. Photomicrographs of (a) Fe40Al2.5Ag corroded in the KCl+ZnCl2 mixture at 450°C
together with X-ray mappings of (b) Fe, (c) Al, (d) Ag, (e) Cl and (f) O.

Int. J. Electrochem. Sci., Vol. 8, 2013
11889
In addition, according to Figures 9 b) and 9 h), there are some Fe and O present in top surface
of alloy, indicating the presence of a layer composed by Fe2O3 or Fe3O4 which is in agreement with the
wide region of stability of these iron oxides as predicted by the phase-stability diagram shown in
Figure 11 a).
Corrosion morphology of Fe40Al2.5Ag ternary alloy together with the corresponding X-ray
mappings of Fe, Al, Ag, Cl, K, Zn and O is shown in Figure 9.
Dealloying of Al is shown in top surface of sample; see Figure 9 e). This behavior is due to the
fact that Al is the most reactive element of the ternary alloy system. Besides, the demetallification of
Al was due to the diffusion of chlorine ions through cracks and porosity of the scale down to the
matrix scale interface, where it reacted with the ternary alloy to form the volatile aluminum chloride,
in accordance to the reaction 2 included in Table 2.
Since the liquid to gas phase transition of AlCl3 occurs at approximately 178 °C [32, 33], the
metal chloride diffused out of the scale, resulting in a lack of Al under the protective aluminum oxide
layer.
Considering that the oxygen partial pressure at the matrix salt interface is low, iron from
Fe40Al2.5Ag alloy is dissolved in the molten salt as a soluble iron chloride compound, in accordance
to the reaction shown in Equation 1:
Fe+3Cl2 (diss) = 2FeCl3 (diss) (1)
The dissolved iron (III) chloride compound diffuses outward to the salt/gas interface, where
iron (III) oxide is precipitated again according to the reaction shown in Equation 2:
2FeCl3 (diss.) + 3/2 O2 = Fe2O3 + 3Cl2. (2)
The presence and location of Fe2O3 is corroborated by observing the x-ray mappings shown in
Figures 9 h) y 9 b). These illustrations exhibit Fe and O elements located inside of corroded film of
Fe40Al2.5Ag and above just within the corrosion products region. Since the iron oxide scale formed in
this manner is poorly adherent and porous, it won't provide an efficient protection. Previous
investigations have also reported iron oxide formation of ferrous alloys exposed to molten salts.
Spiegel [34] studied the hot corrosion behavior of low-alloy steels exposed to ZnCl2 at 500 and 600 °C
under (He-5%O2, H2O<10-4
bar) gas mixture. The authors discovered that the low-alloy steel exposed
to molten ZnCl2 resulted in a formation of oxide layer composed mainly by Fe3O4 and a ZnFe2O4
spinel. Thus, the presence of Zn detected in the chemical mapping illustrated in Figure 9 g), could be
attributed to a zinc oxide or zinc ferric-oxide spinel formation.
Based on the test results displayed in Figures 8 and 9, the corrosion of FeAl based alloys by the
chloride melt were assumed to be mainly due to the presence of salt mixture in liquid phase and the
fluxing (dissolving) of the protective oxide layer.
Pure silver precipitates are displayed uniformly distributed mainly in Fe-Al matrix and bellow
the zone where Al was depleted, see Figure 9 f). The same precipitation behavior of Ag is observed in
micrographs of un-corroded alloys, exhibited in Figure 1 b). A reduction of silver concentration
together with a decrement of its precipitate size, is observed in the region where Al content was
depleted, this behavior could be related to the formation of silver chloride according to reaction 12
included in Table 2. The formation of AgCl is consistent with phase predictions included in
thermodynamic stability diagram shown in Figure 11. In this illustration, can be observed that silver

Int. J. Electrochem. Sci., Vol. 8, 2013
11890
chloride exists throughout the biggest interval of oxygen partial pressure (Po2). Once silver chloride
was formed, could have been dissolved in the molten salt mixture and after was diffused out to
substrate/molten salt interface.
3.6 Phase-stability thermodynamic analysis.
Clearly, it is well known, that a determinate amount of molten salt together with alloy elements
and addition elements, available to interact by chemical reactions (with rich-oxygen environments) in
open chemical systems, tend to form products in chemical equilibrium. This constitutes basically, the
way to obtain the equilibrium constant of each chemical reaction in order to study the thermodynamic
stability of phases along with their respective phase transitions involved in this kind of reaction
systems. As a result of the oxidation reactions, we keep in mind that the thermodynamic studies may
assist to improve the understanding of the corrosion mechanism in environments containing chlorine or
oxygen [25, 26]. Indeed, there is a great probability that the thermodynamic of the oxidation reactions
are related with the phase-change of materials.
For the chemical system composed by the triad of elements (M-Cl-O) (where M corresponds to
Fe, Al or Ag taken at unit activity), it has been elaborated a thermodynamic stability diagram for a
temperature of 450 °C. According to the typical temperatures that have been measured in waste
incinerator systems, a temperature minor to 450°C was not very suited.
The thermodynamic analysis was performed in order to predict and also to confirm the
corrosion products revealed in the experimental chemical mappings. The chemical composition
distributed as atomic species can be observed in Figures 8 and 9. The chemical analysis for metallic
elements (Fe, Al, Ag) and chlorine or oxygen elements, indirectly reveals the principal chemical
products and metallurgical phases. Additionally, the phase stability diagrams were computed from
equilibrium constants of chemical reactions. This thermodynamic study justifies the need of prove the
formation of metallic oxides as a result of alloy degradation in an oxidation environment.
The thermodynamic equilibrium constants can be used, for instance, to know if the chemical
system will react nearly to completion. To understand the significance of establishing an equilibrium
constant for an oxidation reaction, the Table 2 shows the equilibrium constant of possible chemical
reactions that should occur in the experimental reaction system designed in present work. The
equilibrium constants were calculated assuming an ideal behavior for the gas phase. The chemical
transformations of actual oxidation reactions have a characteristic condition of equilibrium to react to
form products. Associated with the equilibrium state, the Figures 11 a) and 11 b) show the
thermodynamic stability diagrams for Fe-Al-Ag-Cl-O and Ag-Cl-O at 450 °C respectively.
Depending upon the magnitude of the equilibrium constants and the amount of concentration of
reactants and products the oxidation reaction will occur until equilibrium condition is attained. The
chemical analyses performed by the scanning electron microscope revealed the formation of metallic
oxides together with metallic chlorides in corroded specimens; it is worth noting, that these oxide and
chloride compounds are in agreement with the predicted ones. The metal oxides predicted by the
thermodynamic stability diagrams are expressed in terms of elemental mapping throughout the Figures

Int. J. Electrochem. Sci., Vol. 8, 2013
11891
8 and 9. A complete agreement of chemical oxides predicted and observed, is considered a potential
chemical system.
Thermodynamic computations show that ZnCl2 contained in the chloride melt will be oxidized
at 450 °C at the standar pressure of test (1 atm) and low partial pressure of chlorine Pcl (below 0.001
atm). Oxidation of ZnCl2 can be represented by reaction included in Equation 3, as follows:
ZnCl2 + 0.5O2 = ZnO + Cl2 (3)
Table 1. Equilibrium constants for chemical reactions for the system K-Zn-Cl-O at 450°C.
# Reaccion Log K
1 2 K2O(s) + 2 Cl2 = 4 KCl(s) + O2 68.4026
2 2 K(l) + Cl2 = 2 KCl(s) 53.0622
3 2 Zn(l) + O2 = 2 ZnO (l) 39.831
4 4 K(l) + O2 = 2 K2O(s) 37.7219
5 K2O2(s) + Cl2 = 2 KCl(s) + O2 28.9528
6 2 KO2(s) + Cl2 = 2 KCl(s) + 2 O2 27.0377
7 Zn(l) + Cl2 = ZnCl2 (s) 22.2035
8 2 K2O(s) + O2 = 2 K2O2(s) 10.497
9 2 ZnO (s) + 2 Cl2 = 2 ZnCl2 (s) + O2 4.5761
10 K2O2(s) + O2 = 2 KO2(s) 1.9151
Figure 10. Thermodynamic stability diagram for K-Zn-Cl-O at 450 °C.
The presence of zinc oxide formed by equation 3 can be corroborated by observing the
chemical mappings shown in Figures 9 g) and h). In these photomicrographs, Zn and O are present
from the corroded zone of alloy to the substrate/chloride melt interface. Besides, the presence of ZnO

Int. J. Electrochem. Sci., Vol. 8, 2013
11892
can be corroborated by the wide region in which this oxide exists in the phase stability diagram shown
in Figure 10. The reaction of oxidation of ZnCl2 will produce a chloride melt enriched with KCl which
may react with the Fe oxide present on FeAl-base alloy as indicated in reaction represented by
Equation 4.
4KCl (l) + 2Fe2O3(s) + O2(g) = 2K2Fe2O4(s) + 2Cl2(g) (4)
The formation of K2Fe2O4 compound can be justified by observing the chemical mappings
included in Figures 9 b), d) and h) where the elements Fe, K and O can be observed from corroded
zone of sample to oxide/chloride melt interface. Spiegel [34], reported also the formation of K2Fe2O4
compound from the reaction of potassium chloride with hematite in a study of the hot corrosion
behavior of steels and nickel-based alloys exposed to a ZnCl2- KCl mixture at 300–600 °C. The
formation of FeCl2 and FeCl3 can be inferred from the existence of Fe and Cl as revealed in the
chemical mappings displayed in Figures 8 and 9. The existence of iron chlorides can be confirmed by
looking at the phase stability diagram displayed in Figure 11, where is observed the wide interval of
Po2 in which these chlorides are stable in an interval delimited by normal and moderate values of PCl2
.When iron chloride diffuses outward to zones where the oxygen partial pressure predominates, the
iron chloride compound may be transformed to hematite according to reaction 9 included in Table.
Then, Cl2 may diffuse back again to substrate/salt melt interface serving as new chlorine source for a
subsequent iron chloride formation. In this manner, a catalytic cycle is achieved since no chlorine will
be consumed.
Figure 11. Thermodynamic stability diagrams for Fe-Al-Ag-Cl-O at 450 °C, at a) low and b) high
oxygen partial pressures (Po2).
Similarly, the Cl2 produced by Equation 4 dissolves into the molten salt and acts as an oxidant
for Fe in the FeAl-based materials; at the alloy/salt melt interface, the chlorine partial pressure PCl2
leads to the formation of iron chlorides (reaction 10 included in Table 2 and Equation 1) because the
PO2 is very low at the interior of the chloride melt. Ruh et al. [35] studied the kinetics of hot corrosion
Int. J. Electrochem. Sci., Vol. 8, 2013
11893
of Fe, Cr and Ni covered by a molten KCl-ZnCl2 mixture at 320 °C in an atmosphere consisting of
argon and oxygen. The authors also reported the formation of FeCl2 according to reaction 10 included
in table 2. Similarly, Li et al. [36] corroded pure Fe, Cr, Ni and Fe-based alloys with a 55ZnCl2-45KCl
(mol %) mixture at 400-450 °C in pure O2. In the same way, the authors stated the formation of FeCl3
according to Equation 1.
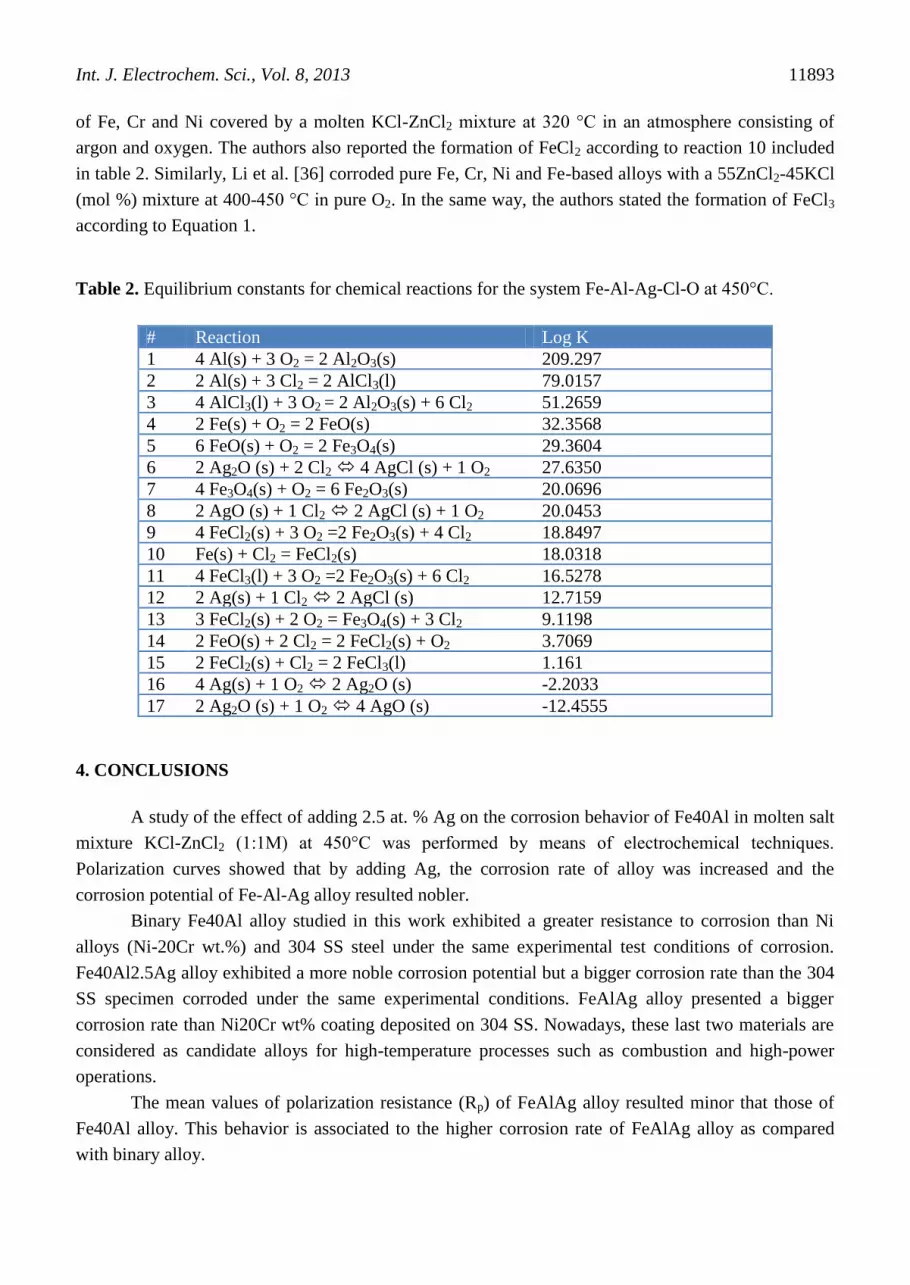
Table 2. Equilibrium constants for chemical reactions for the system Fe-Al-Ag-Cl-O at 450°C.
# Reaction Log K
1 4 Al(s) + 3 O2 = 2 Al2O3(s) 209.297
2 2 Al(s) + 3 Cl2 = 2 AlCl3(l) 79.0157
3 4 AlCl3(l) + 3 O2 = 2 Al2O3(s) + 6 Cl2 51.2659
4 2 Fe(s) + O2 = 2 FeO(s) 32.3568
5 6 FeO(s) + O2 = 2 Fe3O4(s) 29.3604
6 2 Ag2O (s) + 2 Cl2 4 AgCl (s) + 1 O2 27.6350
7 4 Fe3O4(s) + O2 = 6 Fe2O3(s) 20.0696
8 2 AgO (s) + 1 Cl2 2 AgCl (s) + 1 O2 20.0453
9 4 FeCl2(s) + 3 O2 =2 Fe2O3(s) + 4 Cl2 18.8497
10 Fe(s) + Cl2 = FeCl2(s) 18.0318
11 4 FeCl3(l) + 3 O2 =2 Fe2O3(s) + 6 Cl2 16.5278
12 2 Ag(s) + 1 Cl2 2 AgCl (s) 12.7159
13 3 FeCl2(s) + 2 O2 = Fe3O4(s) + 3 Cl2 9.1198
14 2 FeO(s) + 2 Cl2 = 2 FeCl2(s) + O2 3.7069
15 2 FeCl2(s) + Cl2 = 2 FeCl3(l) 1.161
16 4 Ag(s) + 1 O2 2 Ag2O (s) -2.2033
17 2 Ag2O (s) + 1 O2 4 AgO (s) -12.4555
4. CONCLUSIONS
A study of the effect of adding 2.5 at. % Ag on the corrosion behavior of Fe40Al in molten salt
mixture KCl-ZnCl2 (1:1M) at 450°C was performed by means of electrochemical techniques.
Polarization curves showed that by adding Ag, the corrosion rate of alloy was increased and the
corrosion potential of Fe-Al-Ag alloy resulted nobler.
Binary Fe40Al alloy studied in this work exhibited a greater resistance to corrosion than Ni
alloys (Ni-20Cr wt.%) and 304 SS steel under the same experimental test conditions of corrosion.
Fe40Al2.5Ag alloy exhibited a more noble corrosion potential but a bigger corrosion rate than the 304
SS specimen corroded under the same experimental conditions. FeAlAg alloy presented a bigger
corrosion rate than Ni20Cr wt% coating deposited on 304 SS. Nowadays, these last two materials are
considered as candidate alloys for high-temperature processes such as combustion and high-power
operations.
The mean values of polarization resistance (Rp) of FeAlAg alloy resulted minor that those of
Fe40Al alloy. This behavior is associated to the higher corrosion rate of FeAlAg alloy as compared
with binary alloy.

Int. J. Electrochem. Sci., Vol. 8, 2013
11894
EIS data indicated that the corrosion rate was controlled by the formation of an external
corrosion products film, which was dissolved by the Cl-containing molten salt.
In general terms addition to Ag to Fe40Al alloy induced a deleterious effect on its corrosion
resistance. This behavior is due to the galvanic corrosion effects induced by the formation of Ag
precipitates, since these precipitates possess a nobler corrosion potential with respect to the Fe-Al alloy
components, promoting in this way a localized corrosion attack.
We conclude that in particular Fe40Al alloy show great promise for applications involving
high-temperature processes like combustion and high-power operations with its high corrosion
resistance, which may provide a longer and more stable product life for incinerator heat exchanger
linings.
ACKNOWLEDGEMENT
The authors express their gratitude to CONACyT for the financial support granted for the development
of this research.
References
1. M. J. Quina, J. C. Bordado and R. M. Quinta-Ferreira, J. Hazard. Mater., 179 (2010) 382.
2. E. Autret, F. Berthier, A. Luszezanec and F. Nicolas, J. Hazard. Mater., B139 (2007) 569.
3. T.S. Sidhu, S. Prakash and R.D. Agarwal, Corros. Sci., 90 (2006) 41.
4. S. Lee, N.J. Themelis and M.J. Castaldi, J. Therm. Spray Technol., 16 (2007) 104.
5. H. Zwaher, 11th North America WTE conference, Florida, Tampa, 2003.
6. C.T. Sims, N.S. Stoloff, W.C. Hagel, Superalloys II, John Wiley & Sons, New York, NY (1987).
7. Y. Kawahara, Corros. Sci., 44 (2002) 223.
8. R.A. Rapp and Y.S. Zhang, JOM, 46 (1994) 47.
9. L. Nylöf and E. Häggblom, CORROSION 97, Paper No. 154 (1997).
10. V.K. Sikka, D. Wilkening, J. Liebetrau and B. Mackey, Mater. Sci. Eng., A258 (1998) 229.
11. J.H. DeVan and P.F. Tortorelli, Corros. Sci., 35 (1993) 1065.
12. N.S. Stoloff, C.T. Liu and S.C. Deevi, Intermetallics, 8 (2000) 1313.
13. Y.S. Li, M. Spiegel and S. Shimada, Mater. Chem. Phys., 93 (2005) 217.
14. Y.S. Li and M. Spiegel, Corros. Sci., 46 (2004) 2009.
15. E. M. Zahrani and A.M. Alfantazi, Corros. Sci. 65 (2012) 340.
16. E. Otero, A. Pardo, F. J. Perez, M. V. Utrilla, and T. Levi, Oxidation of Metals, 49 5-6 (1998) 467.
17. C.L. Zeng and J. Li, Electrochimica Acta, 50 28 (2005) 5533.
18. C. L. Zeng, W. Wang, and W. T. Wu, Corrosion Science, 43 4 (2001) 787–801.
19. T.B. Massalski, Binary alloy phase diagrams, 1 (1986) 112.
20. C. G. McKamey and N. S. Stoloff, Physical Metallurgy and Processing of Intermetallic
Compounds, Pergamon, Oxford (1967).
21. F. Lihl and H. Ebel, W. B. Pearson, a Handbook of lattice spacings and structures of metals and
alloys, Pergamon Press, New York (1967).
22. T.B. Massalski, Binary Alloy Phase Diagrams, 1 (1990) 35.
23. T.B. Massalski, Binary Alloy Phase Diagrams, 1 (1990) 8.
24. G. Salinas, J. G. Gonzalez-Rodriguez, J. Porcayo-Calderon, V. M. Salinas-Bravo, and M. A.
Espinoza-Medina, International Journal of Corrosion, vol. 2012, Article ID 185842, 7 pages,
2012. doi:10.1155/2012/185842

Int. J. Electrochem. Sci., Vol. 8, 2013
11895
25. J. Porcayo-Calderon, O. Sotelo-Mazón, V.M. Salinas-Bravo, C.D. Arrieta-Gonzalez, J.J. Ramos-
Hernandez and C. Cuevas-Arteaga, Int. J. Electrochem. Sci., 7 (2012) 1134.
26. R. A. Rodríguez-Diaz, J. Uruchurtu-chavarín, J. Porcayo-Calderon, J. M. López-Oglesby, M. E.
Mendoza, J. J. Ramos-Hernández, S. Valdez and A. Bedolla, Int. J. Electrochem. Sci., 8 (2013)
7257.
27. R. A. Cottis and S. Turgoose, Electrochemical Impedance and noise; Corrosion Testing Made
Easy Series, NACE International (1999).
28. R. H. Jones and R. E. Ricker, Environmental Effects on Advanced Materials, The Minerals, Metals
and Materials Society, Pennsylvania (1991).
29. P. F. Tortorelli and K. Natesan, Mater. Sci. Eng., A258 (1998) 115-125.
30. F. R. Duke and R. A. Fleming, J. Electrochem. Soc., 253 (1957) 104.
31. I. Kim and W. D. Cho, Mater. Sci. Eng. A 264 (1999) 269.
32. M. J. O'Neil, The Merck Index: An Encyclopedia of Chemicals, Drugs, and Biologicals, 14th
Edition, Merck, New Jersey (2006).
33. A. F. Wells, Structural Inorganic Chemistry, Oxford University Press, Oxford, UK (1984).
34. M. Spiegel, Mater. Corros., 50 (1999) 373.
35. A. Ruh and M. Spiegel, Corros. Sci., 48 (2006) 679.
36. Y. S. Li, Y. Niu and W. T. Wu, Mater. Sci. Eng. A 345 (2003) 64.
© 2013 by ESG (www.electrochemsci.org)


![Synthesis, 13C NMR-MAS, AC conductivity and structural characterization of [C 7H 12N 2]ZnCl 4](https://img.pdfslide.net/doc/110x75/6323415661d7e169b00cfef3/synthesis-13c-nmr-mas-ac-conductivity-and-structural-characterization-of-c-7h.jpg)


