Embed Size (px)
Citation preview
Housing PlanShaping Our FutureA Comprehensive Plan for Montgomery County
M O N T G O M E R Y C O U N T Y , P E N N S Y L V A N I A
Montgomery County CommissionersJames R. Matthews, Chairman
Thomas J. Ellis, Esq.Ruth S. Damsker
Montgomery County Planning Commission BoardP. Gregory Shelly, ChairScott Exley, Vice Chair
Dulcie F. FlahartyHenry P. Jacquelin
Pasquale N. MascaroMegan M. McDonough, Esq.
Roy Rodriguez, Jr.Charles J. Tornetta
V. Scott Zelov
Kenneth B. Hughes, Director
Housing PlanShaping Our FutureA Comprehensive Plan for Montgomery County
2005
M O N T G O M E R Y C O U N T Y P L A N N I N G C O M M I S S I O N
Housing Plan
ii
This plan was financed in partby a grant from the
Commonwealth of Pennsylvania,Department of Community
and Economic Development.
Shaping Our Future
iii
Tableof ContentsIntroduction . . . . . . . . . . . . . . . . . . . . . . . . . . . . . . . . . . . . . . . . . . . . . . . . . . . . . . . . . . . . . . . . . . ix
Chapter 1 Housing Goals and ActionsGoal 43. Provide Enough Homes to Meet Future Housing Demand . . . . . . . . . . . . 1Goal 44. Encourage a Variety of Housing to Meet the Needs of People
with Different Ages, Incomes, and Lifestyles . . . . . . . . . . . . . . . . . . . . . . 2Goal 45. Maintain and Conserve Existing Homes and Neighborhoods . . . . . . . . . 2Goal 46. Promote Walkable and Well-Designed Residential Developments . . . . . . 3Goal 47. Encourage More Units of Affordable Housing for County Residents . . . 4Goal 48. Support Housing for People with Special Needs . . . . . . . . . . . . . . . . . . . 4
Chapter 2 Housing SupplyExisting Conditions . . . . . . . . . . . . . . . . . . . . . . . . . . . . . . . . . . . . . . . . . . . . . . . . . . 7
Housing Totals . . . . . . . . . . . . . . . . . . . . . . . . . . . . . . . . . . . . . . . . . . . . . . 7Existing Housing Densities . . . . . . . . . . . . . . . . . . . . . . . . . . . . . . . . . . . . 8Trends in Housing Densities . . . . . . . . . . . . . . . . . . . . . . . . . . . . . . . . . . . 9
Housing Supply Plan . . . . . . . . . . . . . . . . . . . . . . . . . . . . . . . . . . . . . . . . . . . . . . . . 10Total Number of Additional Homes Needed by 2025 . . . . . . . . . . . . . . . 10Location of Additional Housing . . . . . . . . . . . . . . . . . . . . . . . . . . . . . . . 11Distribution of Additional Homes According to Region andCommunity Type . . . . . . . . . . . . . . . . . . . . . . . . . . . . . . . . . . . . . . . . . . . 13The Jobs-Housing Balance . . . . . . . . . . . . . . . . . . . . . . . . . . . . . . . . . . . 15
Conclusion . . . . . . . . . . . . . . . . . . . . . . . . . . . . . . . . . . . . . . . . . . . . . . . . . . . . . . . . 17
Chapter 3 Housing VarietyExisting Conditions . . . . . . . . . . . . . . . . . . . . . . . . . . . . . . . . . . . . . . . . . . . . . . . . . 19
Age Trends . . . . . . . . . . . . . . . . . . . . . . . . . . . . . . . . . . . . . . . . . . . . . . . . 19Income Trends . . . . . . . . . . . . . . . . . . . . . . . . . . . . . . . . . . . . . . . . . . . . . 21Household Trends . . . . . . . . . . . . . . . . . . . . . . . . . . . . . . . . . . . . . . . . . . 21Immigration Trends . . . . . . . . . . . . . . . . . . . . . . . . . . . . . . . . . . . . . . . . . 24Market Preferences . . . . . . . . . . . . . . . . . . . . . . . . . . . . . . . . . . . . . . . . . 25Trends in Housing Types . . . . . . . . . . . . . . . . . . . . . . . . . . . . . . . . . . . . . 25Housing Tenure Trends . . . . . . . . . . . . . . . . . . . . . . . . . . . . . . . . . . . . . . 27
Housing Variety Plan . . . . . . . . . . . . . . . . . . . . . . . . . . . . . . . . . . . . . . . . . . . . . . . . 29Housing Types . . . . . . . . . . . . . . . . . . . . . . . . . . . . . . . . . . . . . . . . . . . . . 29Distribution of Housing by Type . . . . . . . . . . . . . . . . . . . . . . . . . . . . . . . 31Housing Styles and Market Preferences . . . . . . . . . . . . . . . . . . . . . . . . . 32Ownership Preferences . . . . . . . . . . . . . . . . . . . . . . . . . . . . . . . . . . . . . . 34
Conclusion . . . . . . . . . . . . . . . . . . . . . . . . . . . . . . . . . . . . . . . . . . . . . . . . . . . . . . . . 34
Chapter 4 Neighborhood ConservationExisting Conditions . . . . . . . . . . . . . . . . . . . . . . . . . . . . . . . . . . . . . . . . . . . . . . . . . 35
Housing Factors . . . . . . . . . . . . . . . . . . . . . . . . . . . . . . . . . . . . . . . . . . . . 35Neighborhood Factors . . . . . . . . . . . . . . . . . . . . . . . . . . . . . . . . . . . . . . . 40
Incompatible Land Uses . . . . . . . . . . . . . . . . . . . . . . . . . . . . . 40Roads . . . . . . . . . . . . . . . . . . . . . . . . . . . . . . . . . . . . . . . . . . . . 41
Housing Plan
iv
Community Facilities . . . . . . . . . . . . . . . . . . . . . . . . . . . . . . . 41Walkability of Neighborhood . . . . . . . . . . . . . . . . . . . . . . . . . 41Safety and Perceptions of Crime . . . . . . . . . . . . . . . . . . . . . . . 41
Environmental Factors . . . . . . . . . . . . . . . . . . . . . . . . . . . . . . . . . . . . . . . 42Floodplains . . . . . . . . . . . . . . . . . . . . . . . . . . . . . . . . . . . . . . . 42Steep Slopes . . . . . . . . . . . . . . . . . . . . . . . . . . . . . . . . . . . . . . . 42Malfunctioning On-Site Sewage Disposal Systems . . . . . . . . 42Non-existent or Ineffective Surface Drainage Facilities . . . . . 42Noise and Air Pollution . . . . . . . . . . . . . . . . . . . . . . . . . . . . . . 43
Neighborhood Conservation Plan . . . . . . . . . . . . . . . . . . . . . . . . . . . . . . . . . . . . . . 43Housing Conservation and Rehabilitation . . . . . . . . . . . . . . . . . . . . . . . . 43
Appropriate Zoning . . . . . . . . . . . . . . . . . . . . . . . . . . . . . . . . . 44Compatible Infill Development . . . . . . . . . . . . . . . . . . . . . . . . 44Increased Homeownership . . . . . . . . . . . . . . . . . . . . . . . . . . . 45Effective Building Codes . . . . . . . . . . . . . . . . . . . . . . . . . . . . 45Effective Housing Codes . . . . . . . . . . . . . . . . . . . . . . . . . . . . . 46Increased Remodeling and Renovation of Homes . . . . . . . . . 46Rehabilitation of Dilapidated Housing Units . . . . . . . . . . . . . 47
Neighborhood Protection and Improvement . . . . . . . . . . . . . . . . . . . . . . 48Reduction of Incompatible Land Uses . . . . . . . . . . . . . . . . . . 48Redevelopment of Brownfields and Old Industrial Sites . . . . 48Revitalization of Main Streets . . . . . . . . . . . . . . . . . . . . . . . . . 49Redevelopment of Vacant Shopping Centers . . . . . . . . . . . . . 49Preservation of Open Space . . . . . . . . . . . . . . . . . . . . . . . . . . 49Installation of Traffic Calming Devices . . . . . . . . . . . . . . . . . 49Road and Transportation Improvements . . . . . . . . . . . . . . . . . 50Healthy Community Facilities . . . . . . . . . . . . . . . . . . . . . . . . . 50Elm Street Improvements . . . . . . . . . . . . . . . . . . . . . . . . . . . . 50
Reduction of Environmental Hazards . . . . . . . . . . . . . . . . . . . . . . . . . . . 50Conclusion . . . . . . . . . . . . . . . . . . . . . . . . . . . . . . . . . . . . . . . . . . . . . . . . . . . . . . . . 51
Chapter 5 The Design of Residential Neighborhood DevelopmentsExisting Conditions: Current Residential Design Trends . . . . . . . . . . . . . . . . . . . 55Residential Design Plan: . . . . . . . . . . . . . . . . . . . . . . . . . . . . . . . . . . . . . . . . . . . . . 57
Urban and Redeveloping Areas . . . . . . . . . . . . . . . . . . . . . . . . . . . . . . . . 57Established and Emerging Suburban Communities . . . . . . . . . . . . . . . . 60Growing & Rural Areas . . . . . . . . . . . . . . . . . . . . . . . . . . . . . . . . . . . . . . 64Design Features for Specific Housing Types . . . . . . . . . . . . . . . . . . . . . 65Additional Design Features . . . . . . . . . . . . . . . . . . . . . . . . . . . . . . . . . . . 69
Conclusion . . . . . . . . . . . . . . . . . . . . . . . . . . . . . . . . . . . . . . . . . . . . . . . . . . . . . . . . 72
Chapter 6 Housing AffordabilityExisting Conditions . . . . . . . . . . . . . . . . . . . . . . . . . . . . . . . . . . . . . . . . . . . . . . . . . 73
Background . . . . . . . . . . . . . . . . . . . . . . . . . . . . . . . . . . . . . . . . . . . . . . . 73Existing Subsidized Units . . . . . . . . . . . . . . . . . . . . . . . . . . . . . . . . . . . . 75Why is Affordable Housing Needed in Montgomery County? . . . . . . . . 76
High Housing Prices . . . . . . . . . . . . . . . . . . . . . . . . . . . . . . . . 76Case Study: Regional Housing Prices . . . . . . . . . . . . . . . . . . . 78Jobs-Housing Imbalance . . . . . . . . . . . . . . . . . . . . . . . . . . . . . 80High Rental Rates . . . . . . . . . . . . . . . . . . . . . . . . . . . . . . . . . . 81
Shaping Our Future
v
Affordable Housing Programs . . . . . . . . . . . . . . . . . . . . . . . . . . . . . . . . . 82Obstacles to Affordable Housing . . . . . . . . . . . . . . . . . . . . . . . . . . . . . . 82
Vacancy Rates . . . . . . . . . . . . . . . . . . . . . . . . . . . . . . . . . . . . . 84Regulatory Obstacles . . . . . . . . . . . . . . . . . . . . . . . . . . . . . . . 84Financial Obstacles . . . . . . . . . . . . . . . . . . . . . . . . . . . . . . . . . 85Social Obstacles . . . . . . . . . . . . . . . . . . . . . . . . . . . . . . . . . . . 85
Housing Affordability Plan . . . . . . . . . . . . . . . . . . . . . . . . . . . . . . . . . . . . . . . . . . . 85Affordable Housing in Employment Centers, Designated GrowthAreas, and Existing Developed Areas . . . . . . . . . . . . . . . . . . . . . . . . . . . 86Zoning Regulations That Will Lead to Private Sector Developmentof Affordable Housing . . . . . . . . . . . . . . . . . . . . . . . . . . . . . . . . . . . . . . . 86Subdivision and Land Development Ordinance Amendments . . . . . . . . 88Streamlining the Development Review Process . . . . . . . . . . . . . . . . . . . 88Developer Actions . . . . . . . . . . . . . . . . . . . . . . . . . . . . . . . . . . . . . . . . . . 89Expansion of Housing Programs . . . . . . . . . . . . . . . . . . . . . . . . . . . . . . . 89Employer-Assisted Housing Programs . . . . . . . . . . . . . . . . . . . . . . . . . . 90
Conclusion . . . . . . . . . . . . . . . . . . . . . . . . . . . . . . . . . . . . . . . . . . . . . . . . . . . . . . . . 90
Chapter 7 Special Needs HousingExisting Conditions . . . . . . . . . . . . . . . . . . . . . . . . . . . . . . . . . . . . . . . . . . . . . . . . . 91
Seniors . . . . . . . . . . . . . . . . . . . . . . . . . . . . . . . . . . . . . . . . . . . . . . . . . . . 91Private Housing . . . . . . . . . . . . . . . . . . . . . . . . . . . . . . . . . . . . 94Age-Restricted Independent Living . . . . . . . . . . . . . . . . . . . . 94Assisted Living . . . . . . . . . . . . . . . . . . . . . . . . . . . . . . . . . . . . 97Nursing Homes . . . . . . . . . . . . . . . . . . . . . . . . . . . . . . . . . . . 100Income . . . . . . . . . . . . . . . . . . . . . . . . . . . . . . . . . . . . . . . . . . 100
Homeless Persons . . . . . . . . . . . . . . . . . . . . . . . . . . . . . . . . . . . . . . . . . 102Persons With Disabilities . . . . . . . . . . . . . . . . . . . . . . . . . . . . . . . . . . . 104
Mental Health Disability . . . . . . . . . . . . . . . . . . . . . . . . . . . . 105Mentally Retarded Persons . . . . . . . . . . . . . . . . . . . . . . . . . . 106Physical Disability . . . . . . . . . . . . . . . . . . . . . . . . . . . . . . . . 107Drug and Alcohol Disability . . . . . . . . . . . . . . . . . . . . . . . . . 107HIV/AIDS . . . . . . . . . . . . . . . . . . . . . . . . . . . . . . . . . . . . . . . 107
Special Needs Housing Plan . . . . . . . . . . . . . . . . . . . . . . . . . . . . . . . . . . . . . . . . . 107Seniors . . . . . . . . . . . . . . . . . . . . . . . . . . . . . . . . . . . . . . . . . . . . . . . . . . 108
Private Housing . . . . . . . . . . . . . . . . . . . . . . . . . . . . . . . . . . . 109Age-Restricted Independent Housing . . . . . . . . . . . . . . . . . . 110Assisted Living . . . . . . . . . . . . . . . . . . . . . . . . . . . . . . . . . . . 110Nursing Homes . . . . . . . . . . . . . . . . . . . . . . . . . . . . . . . . . . . 111Income . . . . . . . . . . . . . . . . . . . . . . . . . . . . . . . . . . . . . . . . . . 111
Housing for the Homeless . . . . . . . . . . . . . . . . . . . . . . . . . . . . . . . . . . . 111Persons With Disabilities . . . . . . . . . . . . . . . . . . . . . . . . . . . . . . . . . . . 112
Conclusion . . . . . . . . . . . . . . . . . . . . . . . . . . . . . . . . . . . . . . . . . . . . . . . . . . . . . . . 113
Chapter 8 Pulling It All Together—The Housing MarketHousing As a Whole . . . . . . . . . . . . . . . . . . . . . . . . . . . . . . . . . . . . . . . . . . . . . . . 115Relationship of Housing to the Whole Comprehensive Plan . . . . . . . . . . . . . . . . 117Implementation . . . . . . . . . . . . . . . . . . . . . . . . . . . . . . . . . . . . . . . . . . . . . . . . . . . 119Conclusion . . . . . . . . . . . . . . . . . . . . . . . . . . . . . . . . . . . . . . . . . . . . . . . . . . . . . . . 122
Housing Plan
vi
Appendix Housing Organizations and Programs in Montgomery CountyPart I – The Housing Development Process . . . . . . . . . . . . . . . . . . . . . . . . . . . . . 123Part II – Housing Affordability, Rehabilitation, and Neighborhood ConservationPrograms and Funding Sources . . . . . . . . . . . . . . . . . . . . . . . . . . . . . . . . . . . . . . . 124
Housing Affordability Programs . . . . . . . . . . . . . . . . . . . . . . . . . . . . . . 124Federal Government Programs . . . . . . . . . . . . . . . . . . . . . . . 124State Government Programs . . . . . . . . . . . . . . . . . . . . . . . . . 124Regional Agency Programs . . . . . . . . . . . . . . . . . . . . . . . . . . 126County Government Programs . . . . . . . . . . . . . . . . . . . . . . . 126
Rehabilitation Programs . . . . . . . . . . . . . . . . . . . . . . . . . . . . . . . . . . . . 128Neighborhood Conservation Programs . . . . . . . . . . . . . . . . . . . . . . . . . 129
Federal Sources . . . . . . . . . . . . . . . . . . . . . . . . . . . . . . . . . . . 130Department of Conservation and Natural Resources . . . . . . 130Department of Community and Economic Development . . . 131Pennsylvania Infrastructure Investment Authority . . . . . . . . 132County Sources . . . . . . . . . . . . . . . . . . . . . . . . . . . . . . . . . . . 132Foundation Sources . . . . . . . . . . . . . . . . . . . . . . . . . . . . . . . . 132
Shaping Our Future
vii
Listof FiguresChapter 2
Figure 1 Total Housing Units: 1940 - 2000 . . . . . . . . . . . . . . . . . . . . . . . . . . . . . . . . . . . . . . . . . . . . . . . . . . . . . . 7Figure 2 Housing Units Added by Decade . . . . . . . . . . . . . . . . . . . . . . . . . . . . . . . . . . . . . . . . . . . . . . . . . . . . . . 8Figure 3 Average Housing Density of Residential Areas by Community Type . . . . . . . . . . . . . . . . . . . . . . . . . . 8Figure 4 Formula for Calculating Future Housing Units . . . . . . . . . . . . . . . . . . . . . . . . . . . . . . . . . . . . . . . . . . 10Figure 5 Growth Areas Map . . . . . . . . . . . . . . . . . . . . . . . . . . . . . . . . . . . . . . . . . . . . . . . . . . . . . . . . . . . . . . . . 13Figure 6 New Housing by Community Type . . . . . . . . . . . . . . . . . . . . . . . . . . . . . . . . . . . . . . . . . . . . . . . . . . . . 13Figure 7 Proposed Future Average Residential Densities for New
Development in Growth Areas by Community Type . . . . . . . . . . . . . . . . . . . . . . . . . . . . . . . . . . . . . . 14Figure 8 Regional Housing Distribution . . . . . . . . . . . . . . . . . . . . . . . . . . . . . . . . . . . . . . . . . . . . . . . . . . . . . . . 14Figure 9 Housing Units Needed by Region . . . . . . . . . . . . . . . . . . . . . . . . . . . . . . . . . . . . . . . . . . . . . . . . . . . . . 15
Figure 10 Regional Job-Housing Ratios: 2000 and 2025 . . . . . . . . . . . . . . . . . . . . . . . . . . . . . . . . . . . . . . . . . . . 16Figure 11 Jobs-Housing Balance . . . . . . . . . . . . . . . . . . . . . . . . . . . . . . . . . . . . . . . . . . . . . . . . . . . . . . . . . . . . . . 17
Chapter 3Figure 12 Median Age, 1970-2000 . . . . . . . . . . . . . . . . . . . . . . . . . . . . . . . . . . . . . . . . . . . . . . . . . . . . . . . . . . . . 19Figure 13 Population by Age, 1970 to 2025 . . . . . . . . . . . . . . . . . . . . . . . . . . . . . . . . . . . . . . . . . . . . . . . . . . . . . 20Figure 14 Median Household Income in Montgomery County: 1979-1999 . . . . . . . . . . . . . . . . . . . . . . . . . . . . 21Figure 15 Inflation-Adjusted Median Household Income in Montgomery County: 1979-1999 . . . . . . . . . . . . . 21Figure 16 Families Living Below Poverty Level in Montgomery County, Pennsylvania: 1969-1999 . . . . . . . . 21Figure 17 Average Household Size: 1970-2025 . . . . . . . . . . . . . . . . . . . . . . . . . . . . . . . . . . . . . . . . . . . . . . . . . . 22Figure 18 Household Composition: 1970-2025 . . . . . . . . . . . . . . . . . . . . . . . . . . . . . . . . . . . . . . . . . . . . . . . . . . 22Figure 19 Estimated Housing Choice by Household Type: New Homes Built, 1990-2000 . . . . . . . . . . . . . . . . . 23Figure 20 Change in Household Composition: 2000-2025 . . . . . . . . . . . . . . . . . . . . . . . . . . . . . . . . . . . . . . . . . 24Figure 21 Foreign-Born Residents in Montgomery County: 1970-2000 . . . . . . . . . . . . . . . . . . . . . . . . . . . . . . . 24Figure 22 Total Housing Units by Major Types in Montgomery County . . . . . . . . . . . . . . . . . . . . . . . . . . . . . . . 26Figure 23 Units Added by Housing Type in Montgomery County . . . . . . . . . . . . . . . . . . . . . . . . . . . . . . . . . . . . 26Figure 24 Change in Number of Housing Units by Housing Type in Montgomery County . . . . . . . . . . . . . . . . 26Figure 25 Housing Growth by Unit Type and Community Type: 1970-2000, Montgomery County, Pennsylvania . 27Figure 26 Median Lot Size and House Size for Single-Family Detached Homes . . . . . . . . . . . . . . . . . . . . . . . . 27Figure 27 Renter and Owner Occupied Housing Units: 1970-2000, Montgomery County, Pennsylvania . . . . . 28Figure 28 Renter and Owner Occupied Housing Units by Community Type: 1970-2000 . . . . . . . . . . . . . . . . . 29Figure 29 Projected Housing Need for Year 2025 . . . . . . . . . . . . . . . . . . . . . . . . . . . . . . . . . . . . . . . . . . . . . . . . . 30Figure 30 Potential Housing Type Demand by Region . . . . . . . . . . . . . . . . . . . . . . . . . . . . . . . . . . . . . . . . . . . . . 32
Chapter 4Figure 31 Age of Housing . . . . . . . . . . . . . . . . . . . . . . . . . . . . . . . . . . . . . . . . . . . . . . . . . . . . . . . . . . . . . . . . . . . 36Figure 32 Median Home Size . . . . . . . . . . . . . . . . . . . . . . . . . . . . . . . . . . . . . . . . . . . . . . . . . . . . . . . . . . . . . . . . 37Figure 33 Average Number of Bathrooms . . . . . . . . . . . . . . . . . . . . . . . . . . . . . . . . . . . . . . . . . . . . . . . . . . . . . . . 38Figure 34 Housing Units Lacking Complete Kitchen or Plumbing Facilities . . . . . . . . . . . . . . . . . . . . . . . . . . . . 39
Chapter 6Figure 35 2001 Government Subsidized Housing Income Limits for Montgomery County . . . . . . . . . . . . . . . . 74Figure 36 Household Income, 1999 . . . . . . . . . . . . . . . . . . . . . . . . . . . . . . . . . . . . . . . . . . . . . . . . . . . . . . . . . . . . 75Figure 37 Assisted Rental Housing in 2000 . . . . . . . . . . . . . . . . . . . . . . . . . . . . . . . . . . . . . . . . . . . . . . . . . . . . . 75Figure 38 Assisted Housing as Percent of Total Housing . . . . . . . . . . . . . . . . . . . . . . . . . . . . . . . . . . . . . . . . . . . 76Figure 39 Subsidized Housing Developments . . . . . . . . . . . . . . . . . . . . . . . . . . . . . . . . . . . . . . . . . . . . . . . . . . . . 76
Figure 40 Selected Monthly Owner Costs as a Percentage of Household Income in 1999in Montgomery County . . . . . . . . . . . . . . . . . . . . . . . . . . . . . . . . . . . . . . . . . . . . . . . . . . . . . . . . . . . . . 77
Figure 41 Median Home Value: 1980-2000, Chester, Montgomery, Bucks, and Delaware Counties . . . . . . . . . 77Figure 42 Countywide Sales Price of Units . . . . . . . . . . . . . . . . . . . . . . . . . . . . . . . . . . . . . . . . . . . . . . . . . . . . . . 78Figure 43 2000 Median Sales Prices for Housing . . . . . . . . . . . . . . . . . . . . . . . . . . . . . . . . . . . . . . . . . . . . . . . . . 79Figure 44 Gross Rent as a Percentage of Household Income in 1999: Montgomery County . . . . . . . . . . . . . . . 81Figure 45 Affordable Monthly Housing Costs . . . . . . . . . . . . . . . . . . . . . . . . . . . . . . . . . . . . . . . . . . . . . . . . . . . 81Figure 46 Available Vacancy Rate . . . . . . . . . . . . . . . . . . . . . . . . . . . . . . . . . . . . . . . . . . . . . . . . . . . . . . . . . . . . . 84Figure 47 Housing Needs Assessment . . . . . . . . . . . . . . . . . . . . . . . . . . . . . . . . . . . . . . . . . . . . . . . . . . . . . . . . . . 90
Chapter 7Figure 48 Over-55 Population 2000-2025: Montgomery County, Pennsylvania . . . . . . . . . . . . . . . . . . . . . . . . . 92Figure 49 Age 65+ Population1970-2025: Montgomery County, Pennsylvania . . . . . . . . . . . . . . . . . . . . . . . . . 92Figure 50 Estimated Living Arrangements of Seniors (Persons 65 and Older in 2000) . . . . . . . . . . . . . . . . . . . . 94Figure 51 Location of Age-Restricted Independent Living in 2000 . . . . . . . . . . . . . . . . . . . . . . . . . . . . . . . . . . . 95Figure 52 Age-Restricted - Independent Living (2000) . . . . . . . . . . . . . . . . . . . . . . . . . . . . . . . . . . . . . . . . . . . . 96Figure 53 Continuing Care Retirement Community (Life Care, 2000) . . . . . . . . . . . . . . . . . . . . . . . . . . . . . . . . 97Figure 54 Location of Assisted Living Facilities in Montgomery County in 2000 . . . . . . . . . . . . . . . . . . . . . . . 98Figure 55 Assisted Living in 2000 (Personal Care Homes) . . . . . . . . . . . . . . . . . . . . . . . . . . . . . . . . . . . . . . . . . 99Figure 56 Household Income by Age of Householder, 1999: Montgomery County, Pennsylvania . . . . . . . . . . 101Figure 57 Percent of Elderly in Poverty . . . . . . . . . . . . . . . . . . . . . . . . . . . . . . . . . . . . . . . . . . . . . . . . . . . . . . . 101Figure 58 Homeless Facilities . . . . . . . . . . . . . . . . . . . . . . . . . . . . . . . . . . . . . . . . . . . . . . . . . . . . . . . . . . . . . . . 104Figure 59 Disabled Population in 2000 . . . . . . . . . . . . . . . . . . . . . . . . . . . . . . . . . . . . . . . . . . . . . . . . . . . . . . . . 105Figure 60 Residential Mental Health Facilities . . . . . . . . . . . . . . . . . . . . . . . . . . . . . . . . . . . . . . . . . . . . . . . . . . 106Figure 61 Projected Living Arrangements of Seniors in 2025 . . . . . . . . . . . . . . . . . . . . . . . . . . . . . . . . . . . . . . 109Figure 62 Homeless Needs . . . . . . . . . . . . . . . . . . . . . . . . . . . . . . . . . . . . . . . . . . . . . . . . . . . . . . . . . . . . . . . . . 111
Chapter 8Figure 63 Housing Plan Implementation Matrix . . . . . . . . . . . . . . . . . . . . . . . . . . . . . . . . . . . . . . . . . . . . . . . . . 119
Housing Plan
IntroductionIntroductionHousing – it’s one of the basic necessities of life. County residents need well-designed,
attractive, affordable, and convenient housing. Although housing is often considered the soledomain of the private sector, government policies and programs can have a profound impact onhousing, especially on housing needs not easily met by the marketplace.
When a variety of affordable and appealinghousing is provided, the county is a better place tolive and work. And when residential neighborhoodsare protected and conserved, those who haveinvested their life savings and untold hours of workinto their homes know that their investment is safe.
This plan, Housing Plan – Shaping Our Future:A Comprehensive Plan for Montgomery County, isintended to guide housing decisions to the year2025. In particular, this plan lists specific housingpolicies that will help provide an adequate amountof new housing with a variety of types, densities,and prices while also protecting existing residentialareas.
This Housing Plan proposes, in a series ofchapters, to:
• Provide adequate amounts of new housing,
• Increase the variety of new housing built in thecounty,
• Conserve and protect existing residentialneighborhoods,
• Promote better design of new residential devel-opment,
• Expand the supply of affordable housing, and
• Meet the demand of those with special housingneeds.
Overall, this Housing Plan, if fully imple-mented, will give county residents more housingchoices while protecting the character of existingresidential neighborhoods.
Housing Vision
In 2025, the county will have:• Adequate amounts of housing
that meet demand• A variety of housing types, styles,
densities, and prices• More affordable housing choices

Housing Plan
x
1
Chapter 1Housing Goals and ActionsThis chapter lists specific goals that will help
meet demand for housing, provide a variety ofhousing, and offer more affordable housing choices.Each goal is followed by a list of actions that willhelp achieve the goal.
Housing is primarily provided by the privatesector in this country. However, local govern-ment actions on zoning, sewers, and road im-provements have a significant impact on housingat the local level. Federal and state policies, suchas interest rates and mortgage rules, affect thehousing industry as a whole. In addition, govern-ment helps provide housing for those not coveredby the private sector, particularly those withlower incomes or special needs.
The goals listed below are taken from VisionPlan – Shaping Our Future: A ComprehensivePlan for Montgomery County. The numbering ofthe six goals below corresponds to the numberingin this Vision Plan.
Goal 43.Provide Enough Homes to Meet FutureHousing Demand
The county will likely need over 49,000 addi-tional homes to accommodate the projected 2025population. This need will be met through thefollowing actions:
• Creating designated growth areas that canaccommodate the housing demand.
• Allowing higher density housing types to bebuilt in designated growth areas, such as apart-ments, townhouses, twins, and mobile homes inaddition to single-family detached homes.
• Matching residential growth to employmentgrowth occurring in communities.
• Distributing a range of housing types in desig-nated growth areas around the county.
Allowing housing
supply to meethousing demandmaintains stable
housing prices,reduces traffic
congestion created
by commuters intothe county, and
makes it easier for
county employers toattract workers.
Chapter One
2
Goal 44.Encourage a Variety of Housing to Meetthe Needs of People with DifferentAges, Incomes, and Lifestyles
This goal will be achieved through the follow-ing actions:
• Encouraging the construction of apartments,condominiums, townhouses, quadruplexes,twins, duplexes, mobile homes, small lotsingles, and other housing types, as well astraditional single-family detached homes.
• Creating a balance of housing types, sizes,densities, and designs in designated growthareas around the county.
• Creating mixed residential districts that incorpo-rate a variety of housing types and densities.
• Encouraging developments to have a variety ofhousing sizes and layouts.
• Encouraging an appropriate balance of renter-occupied and owner-occupied homes.
Goal 45.Maintain and Conserve Existing Homesand Neighborhoods
This goal will be achieved through the follow-ing actions:
• Encouraging uniform and up-to-date housingand building codes.
• Enforcing housing codes, particularly in com-munities with an older housing stock.
• Encouraging homeownership of singles, twins,and townhouses.
• Helping owners of rental properties rehabilitatetheir buildings and meet code requirements.
• Limiting the number of incompatible land usesintruding into residential neighborhoods. Whenthese uses do intrude into neighborhoods, theirpotential negative impact should be mitigated asmuch as possible.
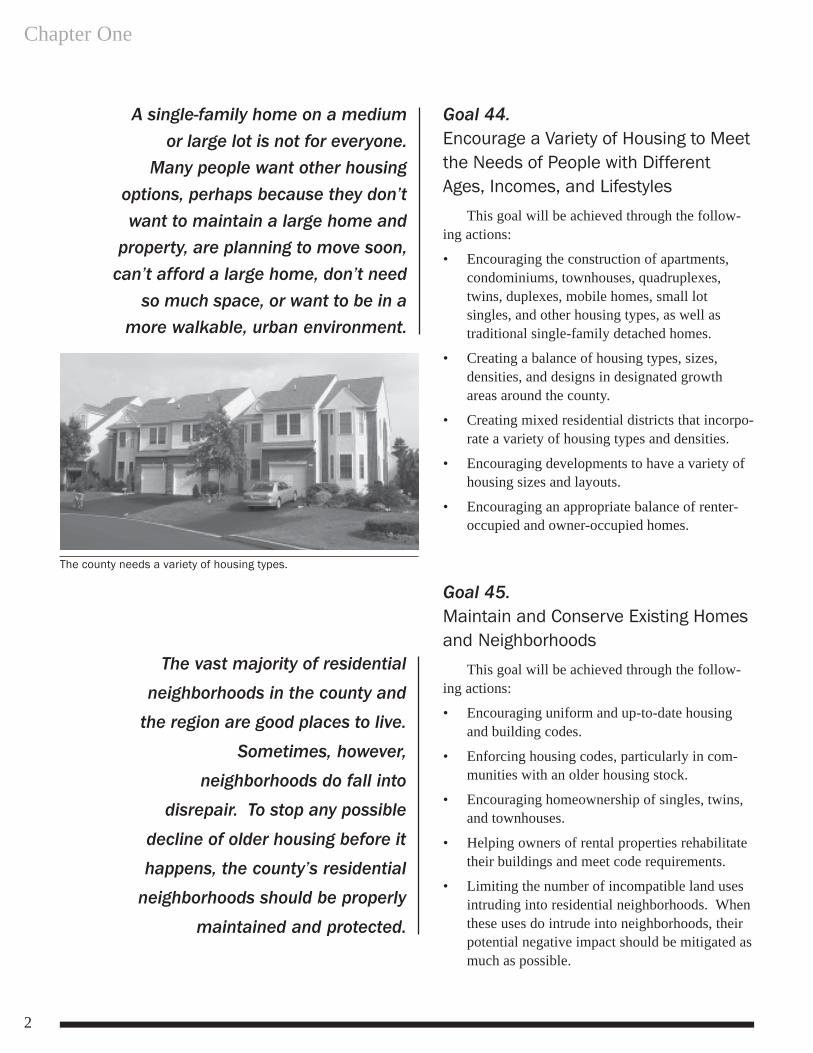
A single-family home on a mediumor large lot is not for everyone.
Many people want other housingoptions, perhaps because they don’twant to maintain a large home and
property, are planning to move soon,can’t afford a large home, don’t need
so much space, or want to be in amore walkable, urban environment.
The vast majority of residentialneighborhoods in the county and
the region are good places to live.
Sometimes, however,neighborhoods do fall into
disrepair. To stop any possible
decline of older housing before ithappens, the county’s residential
neighborhoods should be properly
maintained and protected.
The county needs a variety of housing types.
Housing Goals and Actions
3
• Encouraging proper maintenance and upgradingof older housing, where necessary.
• Rehabilitating substandard homes.
• Reducing potential hazards in homes, such aslead-based paint and radon.
• Prohibiting the construction of new homeswithin the 100-year floodplain, except for theconstruction of flood-proofed apartment build-ings on brownfield sites in redevelopment areasencouraging economic revitalization.
Goal 46.Promote Walkable and Well-DesignedResidential Developments
This goal will be achieved through the follow-ing actions:
• Promoting residential developments with a mixof housing types.
• Creating usable central open space.
• Connecting streets in residential neighborhoodswith streets in abutting neighborhoods and towncenters and providing sidewalks along thesestreets.
• Interconnecting the streets within a neighbor-hood and limiting the number of cul-de-sacs.
• Providing street trees.
• Installing sidewalks in residential developments.
• Designing residential developments in a mannerthat de-emphasizes garages and cars to encour-age walking and sociability.
• Requiring appropriate widths of streets, neithertoo narrow nor too wide.
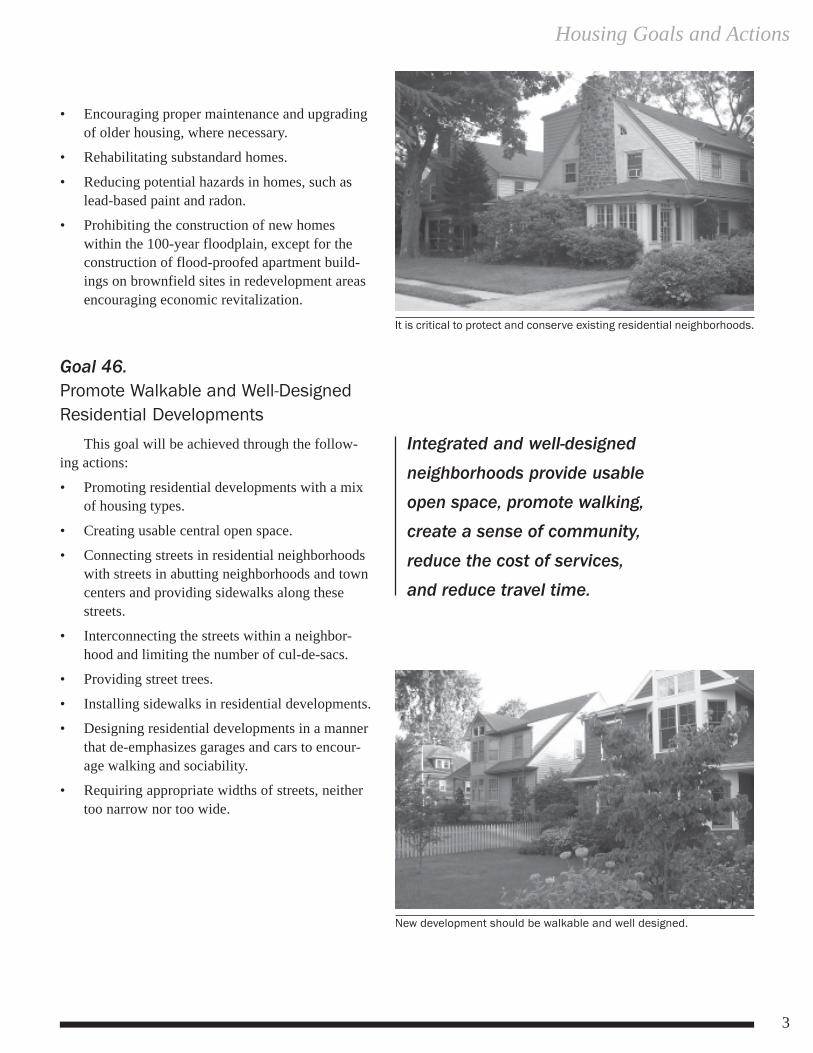
Integrated and well-designed
neighborhoods provide usableopen space, promote walking,create a sense of community,
reduce the cost of services,and reduce travel time.
It is critical to protect and conserve existing residential neighborhoods.
New development should be walkable and well designed.
Chapter One
4
Goal 47.Encourage More Units of AffordableHousing for County Residents
This goal will be achieved through the follow-ing actions:
• Allowing more affordable housing types, suchas apartments, townhouses, twins, mobilehomes, and smaller single-family detachedhomes.
• Creating mixed use developments with a varietyof housing types and sizes.
• Reducing residential lot sizes and increasingdensities of developments in designated growthareas.
• Providing additional rental housing, particularlyin and near employment centers.
• Encouraging the equitable distribution ofsubsidized housing throughout the county’sdesignated growth areas.
• Using bonuses to encourage developers toprovide affordable housing.
• Streamlining the development review process toremove unnecessary delays.
• Reducing the costs of infrastructure, such asoverly wide roads.
• Allowing adequate amounts of new housing tobe built in designated growth areas so that thesupply of housing can adequately meet thedemand.
• Continuing to take advantage of federal andstate money that can be used to provideaffordable housing.
Goal 48.Support Housing for People withSpecial Needs
This goal will be achieved through the follow-ing actions:
• Providing affordable and accessible permanenthousing for people with special needs, including
Making housing moreaffordable gives
homeowners and rentersmore housing space or
more disposable income.
It also allows people to livecloser to work, thereby
reducing congestion and
helping county employers.
AfAfAfAfAffffffordable Housingordable Housingordable Housingordable Housingordable Housing
Affordable housing is any housingthat costs less than 30%
of a renter’s gross incomeor 28% of an owner’s gross income.
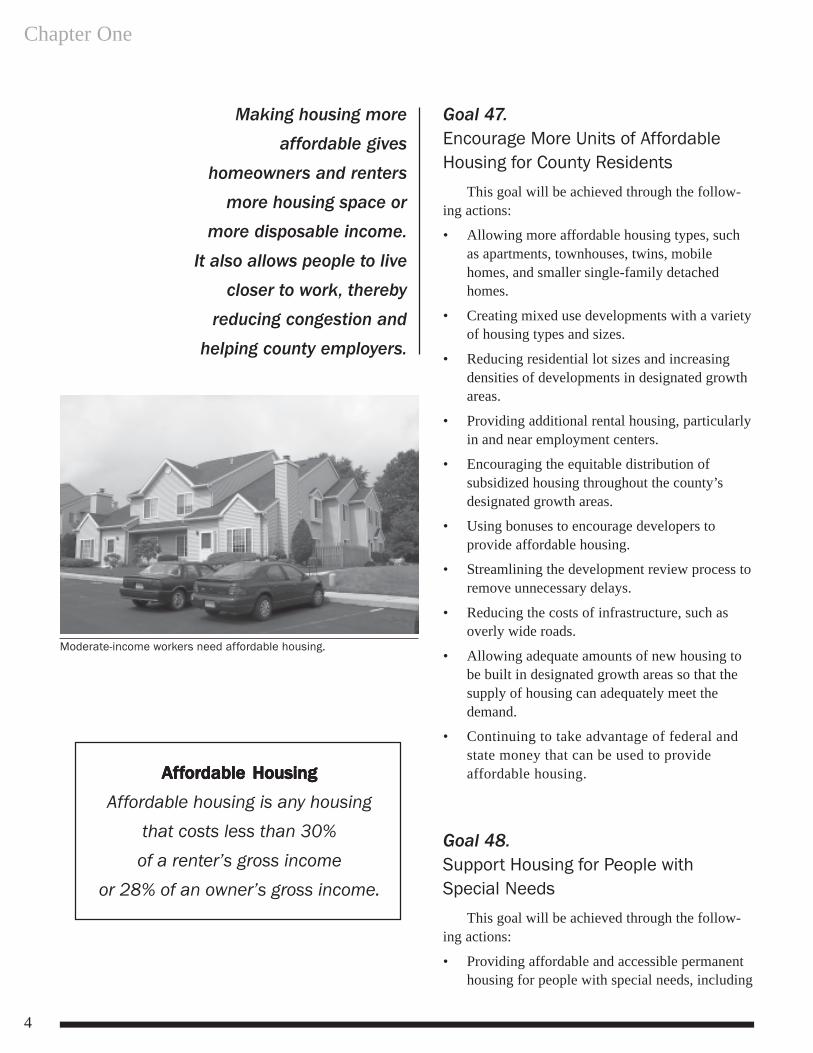
Moderate-income workers need affordable housing.
Housing Goals and Actions
5
alternative housing such as age-restricteddevelopments, units for physically disabledpeople, and group homes.
• Providing appropriate emergency, transitional,and continuing-care housing for the homeless.
• Integrating special needs housing into thecommunity.
• Encouraging the equitable distribution ofspecial needs housing throughout the county’sdesignated growth areas.
• Locating special needs housing within desig-nated growth areas, preferably near services likepublic transportation, medical facilities, andshopping centers.
• Supporting the enforcement of fair housing laws.
There are many county residents –the elderly, disabled, homeless,
and others – who have specialhousing needs that must be met.
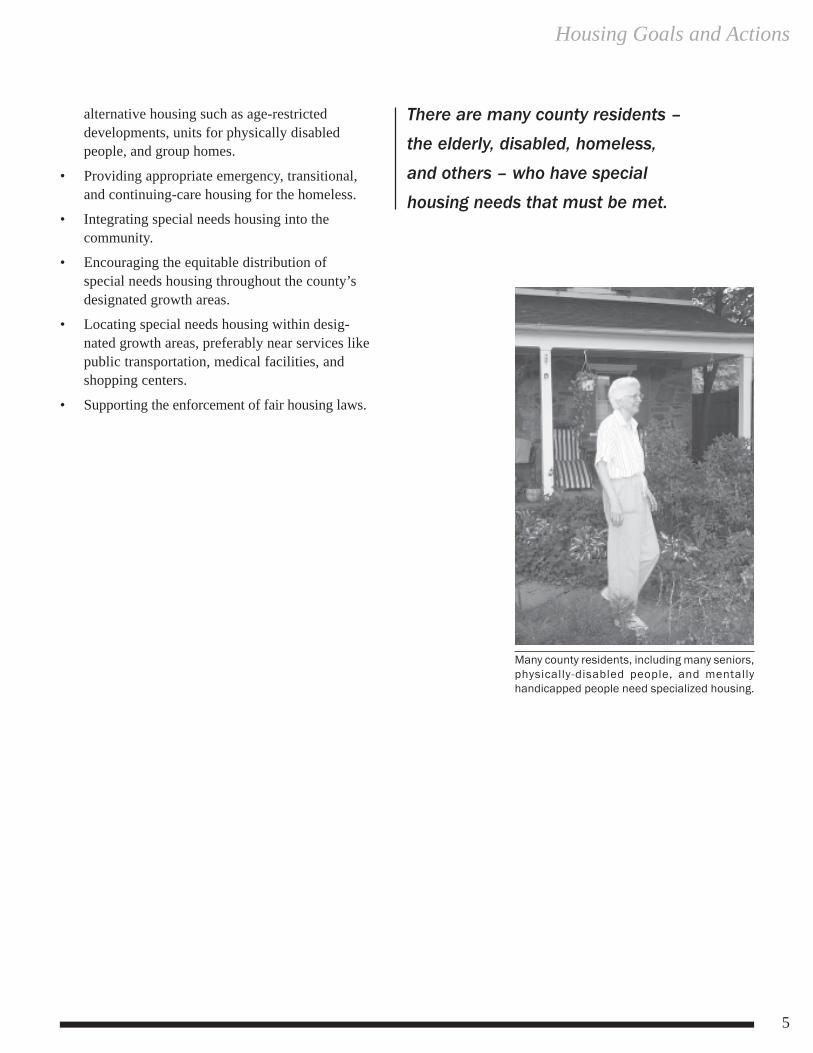
Many county residents, including many seniors,physically-disabled people, and mentallyhandicapped people need specialized housing.

Chapter One
6
7
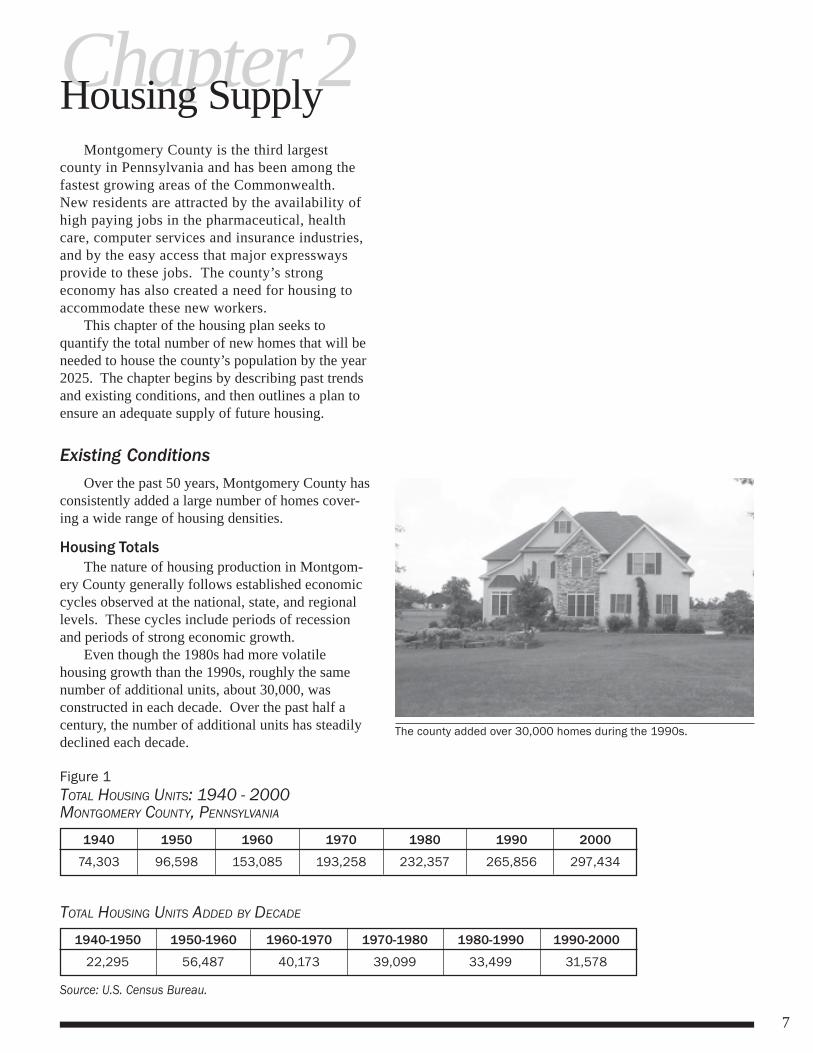
Figure 1TOTAL HOUSING UNITS: 1940 - 2000MONTGOMERY COUNTY, PENNSYLVANIA
1940 1950 1960 1970 1980 1990 2000
74,303 96,598 153,085 193,258 232,357 265,856 297,434
TOTAL HOUSING UNITS ADDED BY DECADE
1940-1950 1950-1960 1960-1970 1970-1980 1980-1990 1990-2000
22,295 56,487 40,173 39,099 33,499 31,578
Source: U.S. Census Bureau.
Chapter 2Housing SupplyMontgomery County is the third largest
county in Pennsylvania and has been among thefastest growing areas of the Commonwealth.New residents are attracted by the availability ofhigh paying jobs in the pharmaceutical, healthcare, computer services and insurance industries,and by the easy access that major expresswaysprovide to these jobs. The county’s strongeconomy has also created a need for housing toaccommodate these new workers.
This chapter of the housing plan seeks toquantify the total number of new homes that will beneeded to house the county’s population by the year2025. The chapter begins by describing past trendsand existing conditions, and then outlines a plan toensure an adequate supply of future housing.
Existing ConditionsOver the past 50 years, Montgomery County has
consistently added a large number of homes cover-ing a wide range of housing densities.
Housing TotalsThe nature of housing production in Montgom-
ery County generally follows established economiccycles observed at the national, state, and regionallevels. These cycles include periods of recessionand periods of strong economic growth.
Even though the 1980s had more volatilehousing growth than the 1990s, roughly the samenumber of additional units, about 30,000, wasconstructed in each decade. Over the past half acentury, the number of additional units has steadilydeclined each decade.
The county added over 30,000 homes during the 1990s.
Chapter Two
8
Annual sales of homes usually reflect nationaleconomic conditions. For example, the largestnumber of units produced in a single year for theperiod between 1980 and 2000 was 4,347 in 1987,a boom time in the economy, and the smallestnumber of units produced was 1,193 in 1982, arecession year.
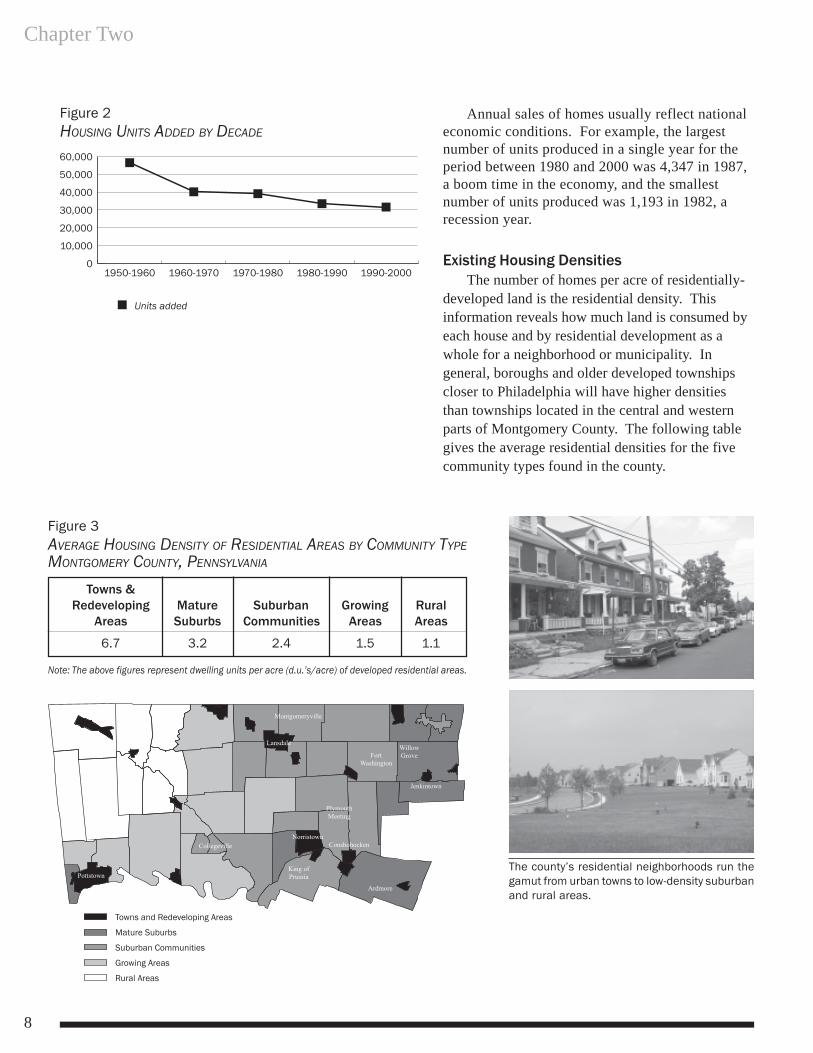
Existing Housing DensitiesThe number of homes per acre of residentially-
developed land is the residential density. Thisinformation reveals how much land is consumed byeach house and by residential development as awhole for a neighborhood or municipality. Ingeneral, boroughs and older developed townshipscloser to Philadelphia will have higher densitiesthan townships located in the central and westernparts of Montgomery County. The following tablegives the average residential densities for the fivecommunity types found in the county.
Figure 2HOUSING UNITS ADDED BY DECADE
Figure 3AVERAGE HOUSING DENSITY OF RESIDENTIAL AREAS BY COMMUNITY TYPEMONTGOMERY COUNTY, PENNSYLVANIA
Towns &Redeveloping Mature Suburban Growing Rural
Areas Suburbs Communities Areas Areas
6.7 3.2 2.4 1.5 1.1
Note: The above figures represent dwelling units per acre (d.u.’s/acre) of developed residential areas.
The county’s residential neighborhoods run thegamut from urban towns to low-density suburbanand rural areas.
Housing Supply
9
These density figures apply to the residentialportions of communities only and are for all types ofhousing units and all lot sizes. These figures do notreflect densities for nonresidential types of develop-ment such as commercial establishments, officeparks, schools, etc..
A single-family detached home built on a oneacre lot constitutes a density of 1 dwelling unit peracre of land, while at the same time, a 10-unitapartment building built on a one acre lot constitutesa density of 10 dwelling units per acre of land.
Trends in Housing DensitiesGenerally, new development in the county is
built at a lower density than existing developedareas. Since 1940, median lot sizes for single-family detached homes have doubled, a biggershare of development has consisted of large lots,and townhouses and twins have been built at alower density. These trends give people moreyard area but also contribute to sprawl. Between1970 and 2000, the county-wide density of allresidential areas dropped from 3.07 homes peracre to 2.54 homes.
Local residents, however, often notice thatdensities are increasing in their specific area as infilldevelopment occurs, farmfields are developed, andlarger lots are subdivided. In fact, residentialdensities often slowly increase at the local level. Insome communities the increase has been slow andgradual, in others density has increased sharply in ashort period of time. One of the communities thathas seen a sharp increase in a short period of time isMontgomery Township in the North Penn Area.Between 1986 and 1997, the township’s averagehousing density went from 1.49 dwelling units peracre to 2.85 dwelling units per acre. In comparison,East Norriton Township saw a much slower rate ofgrowth which took place over a much longer timeperiod. Between 1960 and 1989, East Norriton’sdensity increased from 2.01 dwelling units per acreto 2.96 dwelling units per acre. These densitiesinclude all housing types, ranging from 1-acre lotsto apartment buildings.
Despite local or municipal increases in density,the overall county housing density is decliningbecause the low-density residential developmentoccurring in rural areas overshadows the gradualincreases in density occurring in developed areas.
Smaller lots and denser developmentshave many benefits, including:
• Less open space is consumed,
• Developments are less sprawling,
• Housing costs are lower because
land costs are distributed overmore homes,
• It is cheaper and more efficient to
provide utilities, roads, and publicservices,
• Walking is easier, public
transportation is more feasible, anddriving distances are shorter, and
• A better sense of community canbe created.
Chapter Two
10
Housing Supply PlanEnsuring that there are enough homes of all
types for Montgomery County’s current andfuture residents is one of the challenges that mustbe faced. It is expected that the presence ofmajor regional employers and also some of thebest schools in the Philadelphia area will continueto attract people to Montgomery County over thenext 25 years. Making sure that there is an ampleand varied housing stock to accommodate thesenewcomers will be a priority.
This section describes the overall number ofadditional housing units needed by 2025, de-scribes the location of these homes in relation tothe Growth and Preservation Plan in the VisionPlan, outlines the distribution of these homesaccording to regions and community types, andthen describes the jobs-housing balance and itsimpact on housing needs.
Total Number of Additional Homes Neededby 2025
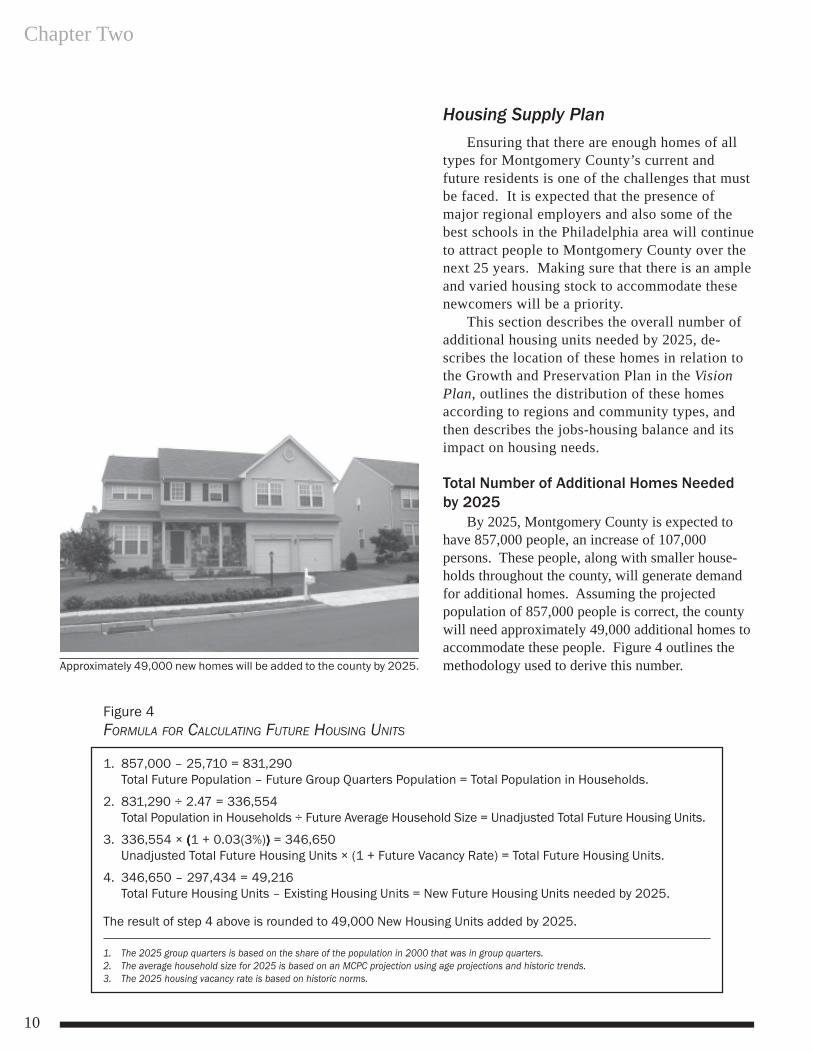
By 2025, Montgomery County is expected tohave 857,000 people, an increase of 107,000persons. These people, along with smaller house-holds throughout the county, will generate demandfor additional homes. Assuming the projectedpopulation of 857,000 people is correct, the countywill need approximately 49,000 additional homes toaccommodate these people. Figure 4 outlines themethodology used to derive this number.
Figure 4FORMULA FOR CALCULATING FUTURE HOUSING UNITS
1. 857,000 – 25,710 = 831,290Total Future Population – Future Group Quarters Population = Total Population in Households.
2. 831,290 ÷ 2.47 = 336,554Total Population in Households ÷ Future Average Household Size = Unadjusted Total Future Housing Units.
3. 336,554 × (((((1 + 0.03(3%)))))) = 346,650Unadjusted Total Future Housing Units × (1 + Future Vacancy Rate) = Total Future Housing Units.
4. 346,650 – 297,434 = 49,216Total Future Housing Units – Existing Housing Units = New Future Housing Units needed by 2025.
The result of step 4 above is rounded to 49,000 New Housing Units added by 2025.
1. The 2025 group quarters is based on the share of the population in 2000 that was in group quarters.2. The average household size for 2025 is based on an MCPC projection using age projections and historic trends.3. The 2025 housing vacancy rate is based on historic norms.
Approximately 49,000 new homes will be added to the county by 2025.
Housing Supply
11
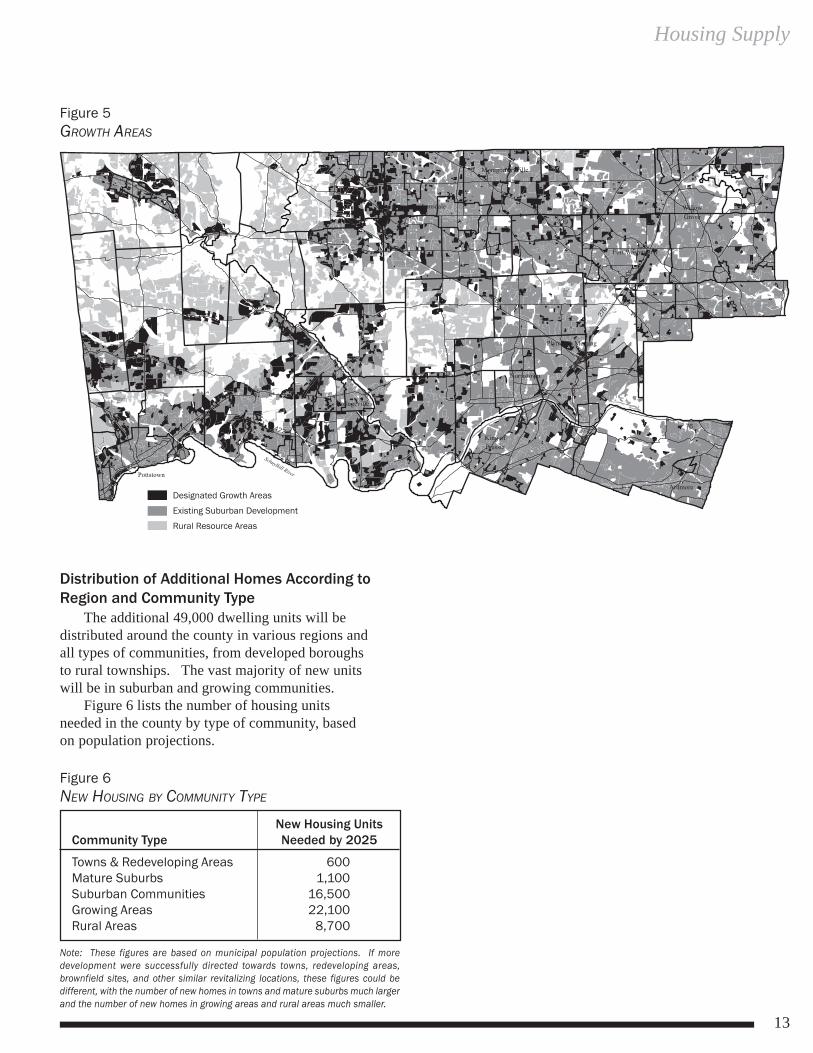
Location of Additional HousingThe proposed Growth and Preservation Plan for
Montgomery County identifies three areas wherefuture housing can be constructed - DesignatedGrowth Areas, Existing Developed Areas, and RuralResource Areas. These are shown in Figure 5.
The majority of the 49,000 additional housingunits in Montgomery County are expected to bebuilt in Designated Growth Areas; however, signifi-cant numbers of units will also be distributed to theExisting Developed Areas and Rural ResourceAreas. The estimated number of units in each areaare listed below:
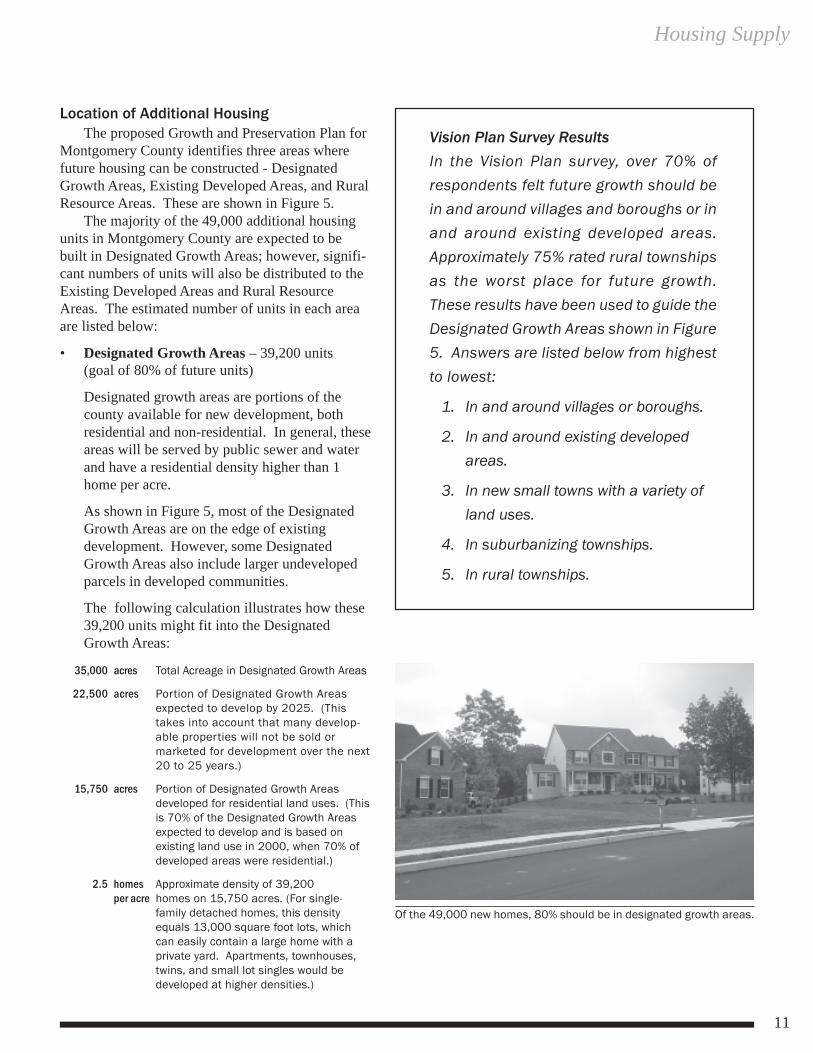
• Designated Growth Areas – 39,200 units(goal of 80% of future units)
Designated growth areas are portions of thecounty available for new development, bothresidential and non-residential. In general, theseareas will be served by public sewer and waterand have a residential density higher than 1home per acre.
As shown in Figure 5, most of the DesignatedGrowth Areas are on the edge of existingdevelopment. However, some DesignatedGrowth Areas also include larger undevelopedparcels in developed communities.
The following calculation illustrates how these39,200 units might fit into the DesignatedGrowth Areas:
35,000 acres Total Acreage in Designated Growth Areas
22,500 acres Portion of Designated Growth Areasexpected to develop by 2025. (Thistakes into account that many develop-able properties will not be sold ormarketed for development over the next20 to 25 years.)
15,750 acres Portion of Designated Growth Areasdeveloped for residential land uses. (Thisis 70% of the Designated Growth Areasexpected to develop and is based onexisting land use in 2000, when 70% ofdeveloped areas were residential.)
2.5 homes Approximate density of 39,200per acre homes on 15,750 acres. (For single-
family detached homes, this densityequals 13,000 square foot lots, whichcan easily contain a large home with aprivate yard. Apartments, townhouses,twins, and small lot singles would bedeveloped at higher densities.)
Vision Plan Survey ResultsIn the Vision Plan survey, over 70% ofrespondents felt future growth should bein and around villages and boroughs or inand around existing developed areas.Approximately 75% rated rural townshipsas the worst place for future growth.These results have been used to guide theDesignated Growth Areas shown in Figure5. Answers are listed below from highestto lowest:
1. In and around villages or boroughs.
2. In and around existing developedareas.
3. In new small towns with a variety ofland uses.
4. In suburbanizing townships.
5. In rural townships.
Of the 49,000 new homes, 80% should be in designated growth areas.
Chapter Two
12
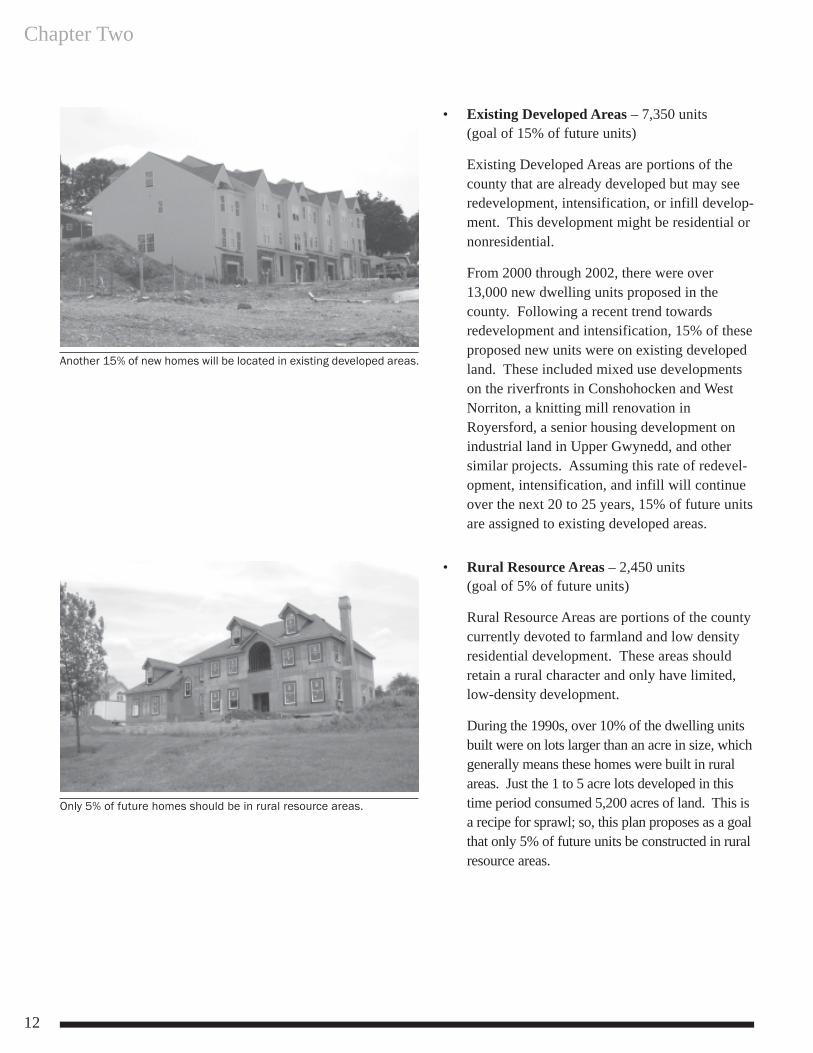
• Existing Developed Areas – 7,350 units(goal of 15% of future units)
Existing Developed Areas are portions of thecounty that are already developed but may seeredevelopment, intensification, or infill develop-ment. This development might be residential ornonresidential.
From 2000 through 2002, there were over13,000 new dwelling units proposed in thecounty. Following a recent trend towardsredevelopment and intensification, 15% of theseproposed new units were on existing developedland. These included mixed use developmentson the riverfronts in Conshohocken and WestNorriton, a knitting mill renovation inRoyersford, a senior housing development onindustrial land in Upper Gwynedd, and othersimilar projects. Assuming this rate of redevel-opment, intensification, and infill will continueover the next 20 to 25 years, 15% of future unitsare assigned to existing developed areas.
• Rural Resource Areas – 2,450 units(goal of 5% of future units)
Rural Resource Areas are portions of the countycurrently devoted to farmland and low densityresidential development. These areas shouldretain a rural character and only have limited,low-density development.
During the 1990s, over 10% of the dwelling unitsbuilt were on lots larger than an acre in size, whichgenerally means these homes were built in ruralareas. Just the 1 to 5 acre lots developed in thistime period consumed 5,200 acres of land. This isa recipe for sprawl; so, this plan proposes as a goalthat only 5% of future units be constructed in ruralresource areas.
Another 15% of new homes will be located in existing developed areas.
Only 5% of future homes should be in rural resource areas.
Housing Supply
13
Distribution of Additional Homes According toRegion and Community Type
The additional 49,000 dwelling units will bedistributed around the county in various regions andall types of communities, from developed boroughsto rural townships. The vast majority of new unitswill be in suburban and growing communities.
Figure 6 lists the number of housing unitsneeded in the county by type of community, basedon population projections.
Figure 5GROWTH AREAS
Figure 6NEW HOUSING BY COMMUNITY TYPE
New Housing UnitsCommunity Type Needed by 2025
Towns & Redeveloping Areas 600Mature Suburbs 1,100Suburban Communities 16,500Growing Areas 22,100Rural Areas 8,700
Note: These figures are based on municipal population projections. If moredevelopment were successfully directed towards towns, redeveloping areas,brownfield sites, and other similar revitalizing locations, these figures could bedifferent, with the number of new homes in towns and mature suburbs much largerand the number of new homes in growing areas and rural areas much smaller.
Chapter Two
14
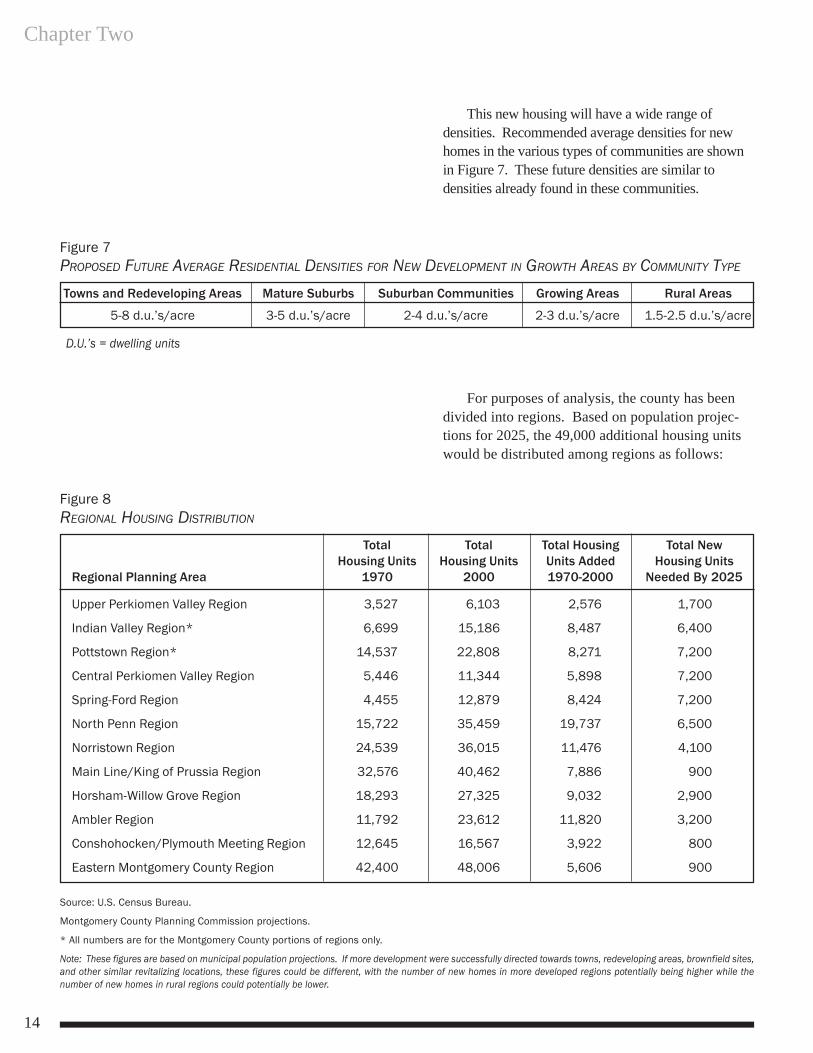
This new housing will have a wide range ofdensities. Recommended average densities for newhomes in the various types of communities are shownin Figure 7. These future densities are similar todensities already found in these communities.
Figure 7PROPOSED FUTURE AVERAGE RESIDENTIAL DENSITIES FOR NEW DEVELOPMENT IN GROWTH AREAS BY COMMUNITY TYPE
Towns and Redeveloping Areas Mature Suburbs Suburban Communities Growing Areas Rural Areas
5-8 d.u.’s/acre 3-5 d.u.’s/acre 2-4 d.u.’s/acre 2-3 d.u.’s/acre 1.5-2.5 d.u.’s/acre
D.U.’s = dwelling units
For purposes of analysis, the county has beendivided into regions. Based on population projec-tions for 2025, the 49,000 additional housing unitswould be distributed among regions as follows:
Figure 8REGIONAL HOUSING DISTRIBUTION
Total Total Total Housing Total NewHousing Units Housing Units Units Added Housing Units
Regional Planning Area 1970 2000 1970-2000 Needed By 2025
Upper Perkiomen Valley Region 3,527 6,103 2,576 1,700
Indian Valley Region* 6,699 15,186 8,487 6,400
Pottstown Region* 14,537 22,808 8,271 7,200
Central Perkiomen Valley Region 5,446 11,344 5,898 7,200
Spring-Ford Region 4,455 12,879 8,424 7,200
North Penn Region 15,722 35,459 19,737 6,500
Norristown Region 24,539 36,015 11,476 4,100
Main Line/King of Prussia Region 32,576 40,462 7,886 900
Horsham-Willow Grove Region 18,293 27,325 9,032 2,900
Ambler Region 11,792 23,612 11,820 3,200
Conshohocken/Plymouth Meeting Region 12,645 16,567 3,922 800
Eastern Montgomery County Region 42,400 48,006 5,606 900
Source: U.S. Census Bureau.
Montgomery County Planning Commission projections.
* All numbers are for the Montgomery County portions of regions only.
Note: These figures are based on municipal population projections. If more development were successfully directed towards towns, redeveloping areas, brownfield sites,and other similar revitalizing locations, these figures could be different, with the number of new homes in more developed regions potentially being higher while thenumber of new homes in rural regions could potentially be lower.
Housing Supply
15
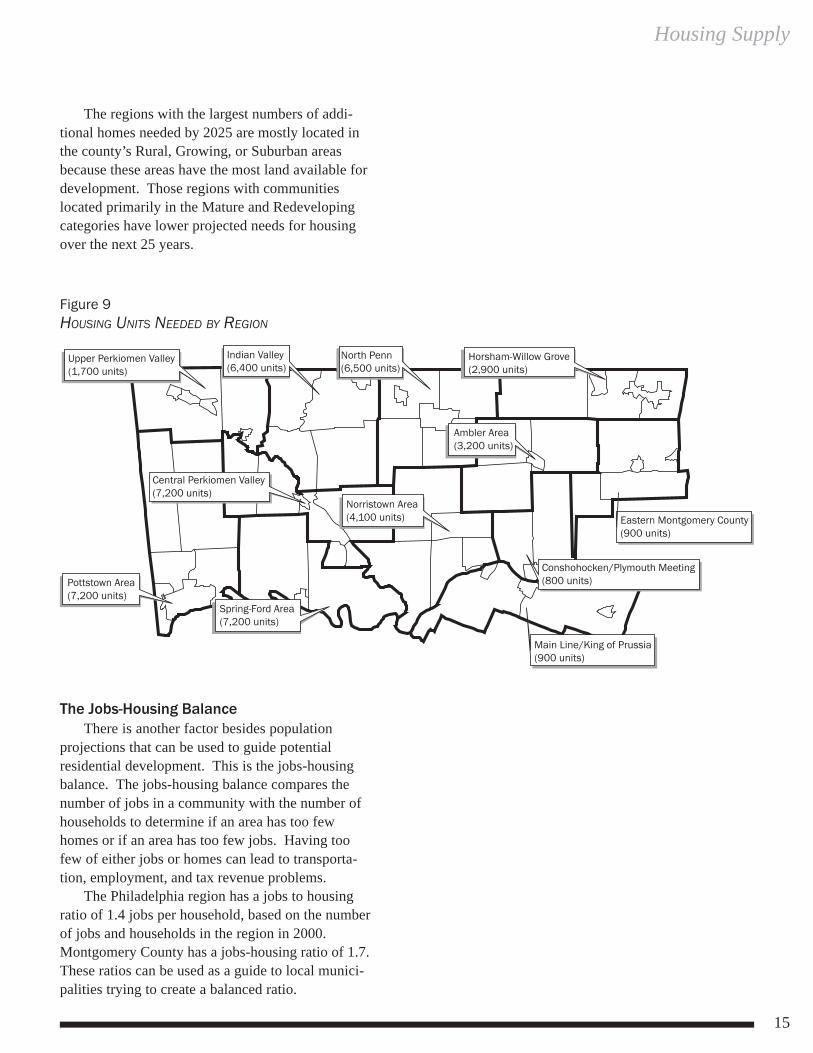
The regions with the largest numbers of addi-tional homes needed by 2025 are mostly located inthe county’s Rural, Growing, or Suburban areasbecause these areas have the most land available fordevelopment. Those regions with communitieslocated primarily in the Mature and Redevelopingcategories have lower projected needs for housingover the next 25 years.
Figure 9HOUSING UNITS NEEDED BY REGION
The Jobs-Housing BalanceThere is another factor besides population
projections that can be used to guide potentialresidential development. This is the jobs-housingbalance. The jobs-housing balance compares thenumber of jobs in a community with the number ofhouseholds to determine if an area has too fewhomes or if an area has too few jobs. Having toofew of either jobs or homes can lead to transporta-tion, employment, and tax revenue problems.
The Philadelphia region has a jobs to housingratio of 1.4 jobs per household, based on the numberof jobs and households in the region in 2000.Montgomery County has a jobs-housing ratio of 1.7.These ratios can be used as a guide to local munici-palities trying to create a balanced ratio.
Chapter Two
16
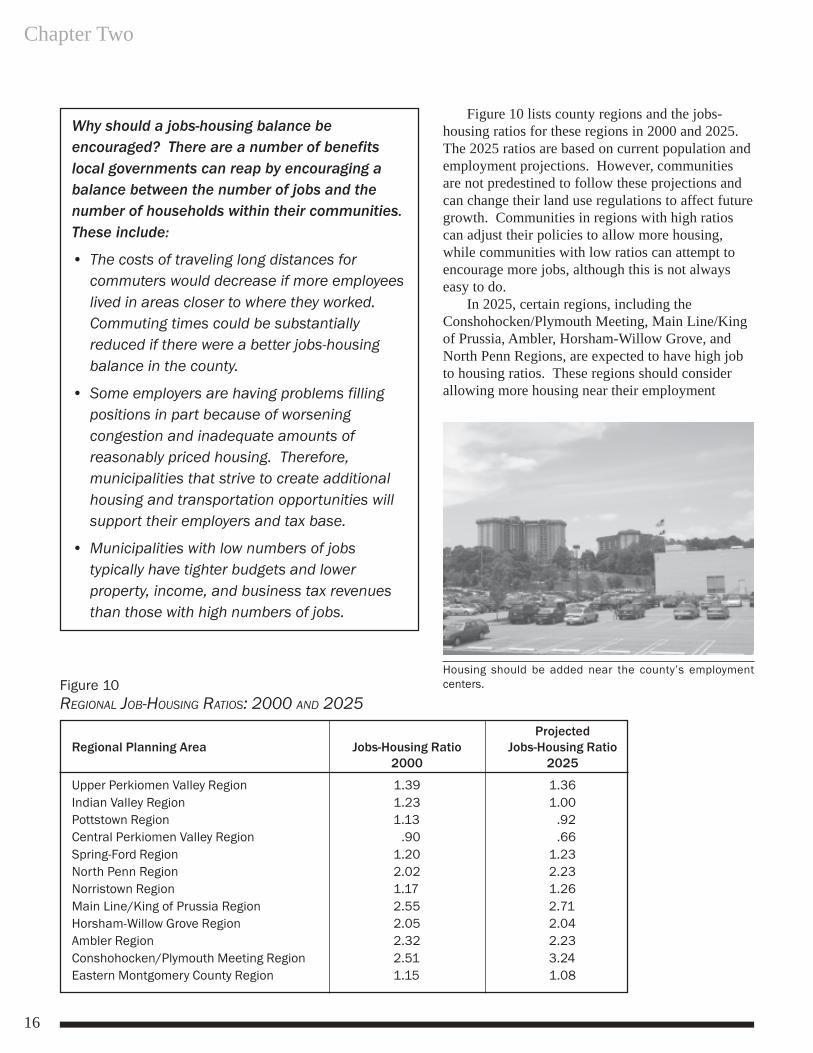
Figure 10 lists county regions and the jobs-housing ratios for these regions in 2000 and 2025.The 2025 ratios are based on current population andemployment projections. However, communitiesare not predestined to follow these projections andcan change their land use regulations to affect futuregrowth. Communities in regions with high ratioscan adjust their policies to allow more housing,while communities with low ratios can attempt toencourage more jobs, although this is not alwayseasy to do.
In 2025, certain regions, including theConshohocken/Plymouth Meeting, Main Line/Kingof Prussia, Ambler, Horsham-Willow Grove, andNorth Penn Regions, are expected to have high jobto housing ratios. These regions should considerallowing more housing near their employment
Why should a jobs-housing balance beencouraged? There are a number of benefitslocal governments can reap by encouraging abalance between the number of jobs and thenumber of households within their communities.These include:
• The costs of traveling long distances forcommuters would decrease if more employeeslived in areas closer to where they worked.Commuting times could be substantiallyreduced if there were a better jobs-housingbalance in the county.
• Some employers are having problems fillingpositions in part because of worseningcongestion and inadequate amounts ofreasonably priced housing. Therefore,municipalities that strive to create additionalhousing and transportation opportunities willsupport their employers and tax base.
• Municipalities with low numbers of jobstypically have tighter budgets and lowerproperty, income, and business tax revenuesthan those with high numbers of jobs.
Figure 10REGIONAL JOB-HOUSING RATIOS: 2000 AND 2025
ProjectedRegional Planning Area Jobs-Housing Ratio Jobs-Housing Ratio 2000 2025
Upper Perkiomen Valley Region 1.39 1.36Indian Valley Region 1.23 1.00Pottstown Region 1.13 .92Central Perkiomen Valley Region .90 .66Spring-Ford Region 1.20 1.23North Penn Region 2.02 2.23Norristown Region 1.17 1.26Main Line/King of Prussia Region 2.55 2.71Horsham-Willow Grove Region 2.05 2.04Ambler Region 2.32 2.23Conshohocken/Plymouth Meeting Region 2.51 3.24Eastern Montgomery County Region 1.15 1.08
Housing should be added near the county’s employmentcenters.
Housing Supply
17
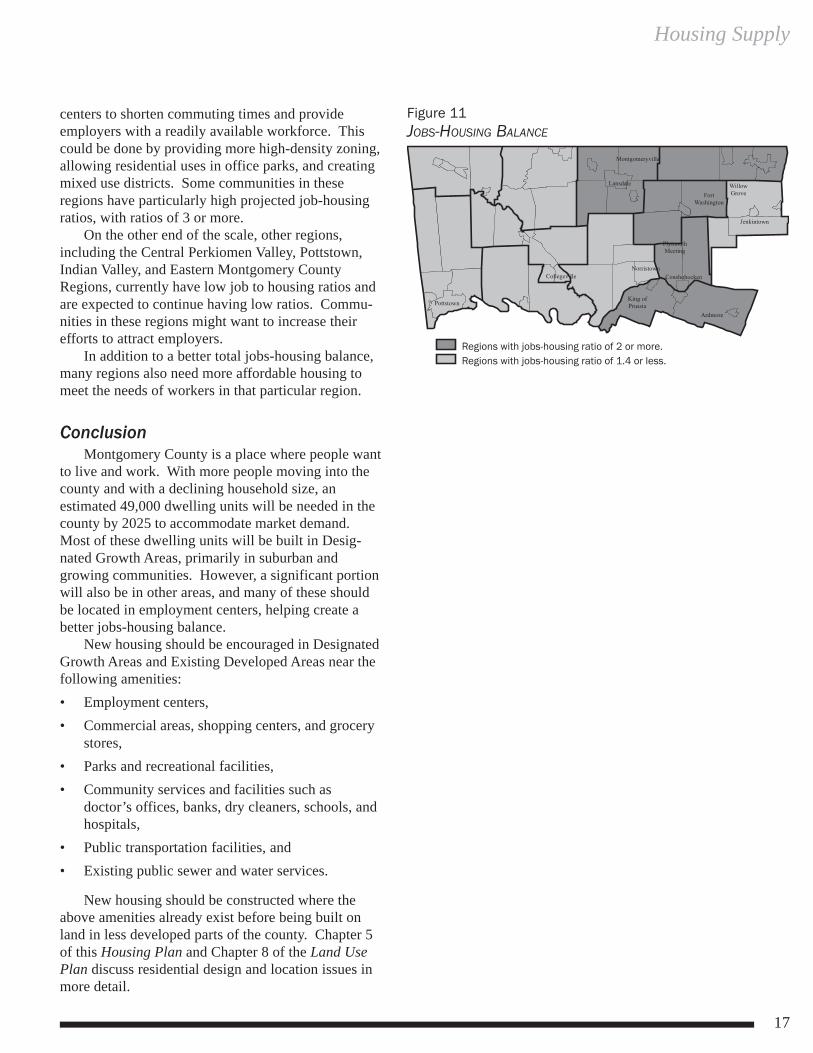
centers to shorten commuting times and provideemployers with a readily available workforce. Thiscould be done by providing more high-density zoning,allowing residential uses in office parks, and creatingmixed use districts. Some communities in theseregions have particularly high projected job-housingratios, with ratios of 3 or more.
On the other end of the scale, other regions,including the Central Perkiomen Valley, Pottstown,Indian Valley, and Eastern Montgomery CountyRegions, currently have low job to housing ratios andare expected to continue having low ratios. Commu-nities in these regions might want to increase theirefforts to attract employers.
In addition to a better total jobs-housing balance,many regions also need more affordable housing tomeet the needs of workers in that particular region.
ConclusionMontgomery County is a place where people want
to live and work. With more people moving into thecounty and with a declining household size, anestimated 49,000 dwelling units will be needed in thecounty by 2025 to accommodate market demand.Most of these dwelling units will be built in Desig-nated Growth Areas, primarily in suburban andgrowing communities. However, a significant portionwill also be in other areas, and many of these shouldbe located in employment centers, helping create abetter jobs-housing balance.
New housing should be encouraged in DesignatedGrowth Areas and Existing Developed Areas near thefollowing amenities:• Employment centers,• Commercial areas, shopping centers, and grocery
stores,• Parks and recreational facilities,• Community services and facilities such as
doctor’s offices, banks, dry cleaners, schools, andhospitals,
• Public transportation facilities, and• Existing public sewer and water services.
New housing should be constructed where theabove amenities already exist before being built onland in less developed parts of the county. Chapter 5of this Housing Plan and Chapter 8 of the Land UsePlan discuss residential design and location issues inmore detail.
Figure 11JOBS-HOUSING BALANCE

Chapter Two
18
19
Chapter 3Housing VarietyMontgomery County’s diverse population lives in
a variety of housing types, styles, and locations.Families with children, who comprise about a third ofall households, tend to prefer larger single-familydetached homes, while young families, first-timehomebuyers, single professionals, college students,and seniors might prefer smaller single-familyhomes, townhouses, or apartments.
This chapter of the Housing Plan describes thechanges in the county’s population that have oc-curred over the past 30 years and are expected tooccur over the next 25 years. The chapter thendescribes the affect these changes will have onhousing type demand and proposes a plan foraddressing these needs.
Existing ConditionsDemographic changes in age groups, household
incomes, household types, and immigration statusover the last 30 years have had an impact on thetypes of housing built and provide a base for predict-ing the future makeup of the population and itshousing preferences. This section first examinesthese demographic trends and then relates them tohousing trends in Montgomery County.
Age TrendsAge is one of the major demographic factors
affecting housing. Generally, families with chil-dren strongly prefer single-family detachedhomes, while older residents live in a wider rangeof housing types.
• Montgomery County is getting older and thistrend will continue with the aging of the babyboom generation. Figures 12 and 13 illustratethis trend.
Figure 12MEDIAN AGE, 1970-2000MONTGOMERY COUNTY, PENNSYLVANIA
1970 1980 1990 2000
30.8 33.3 35.8 38.2
Source: U.S. Census Bureau.
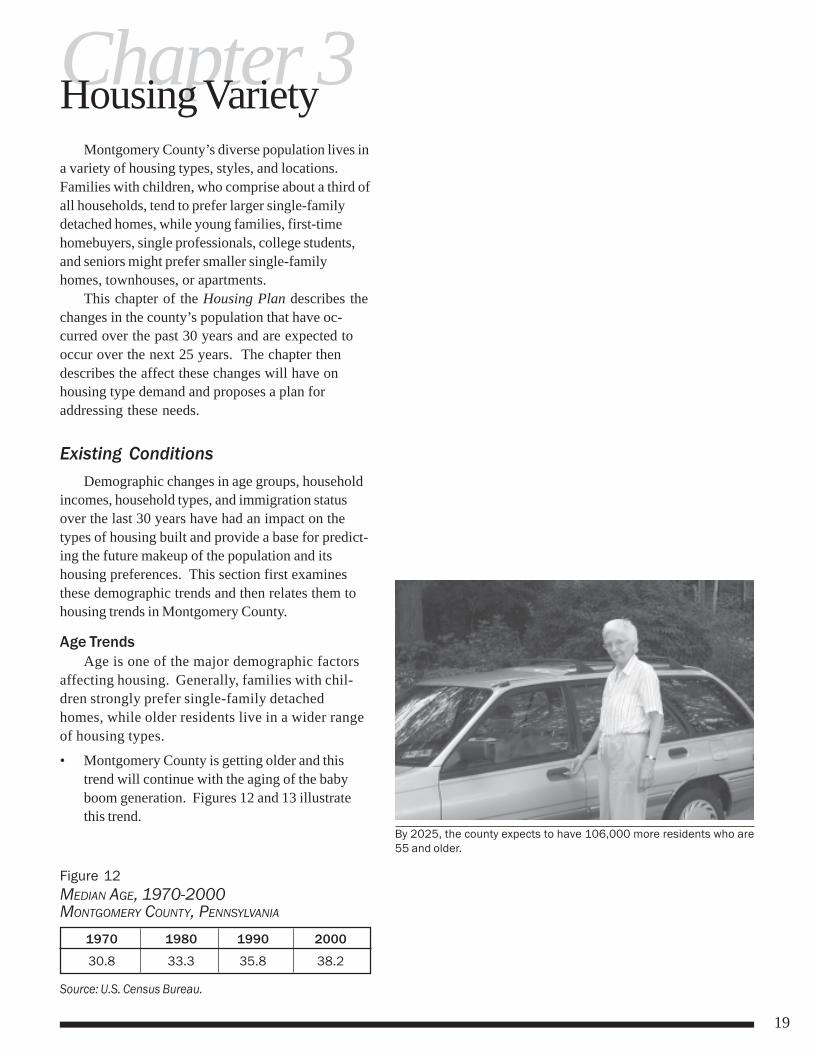
By 2025, the county expects to have 106,000 more residents who are55 and older.
Chapter Three
20
• Between 1970 and 2000, the school age popula-tion in the county actually declined, despitestrong population growth. If this age group andaccompanying families had increased in this timeperiod, there most likely would have been manymore single-family detached homes constructed.
The 1990s by themselves did see an actualincrease in school-age children, putting pressureon schools and supporting the construction ofmore single-family detached homes than in theprevious two decades.
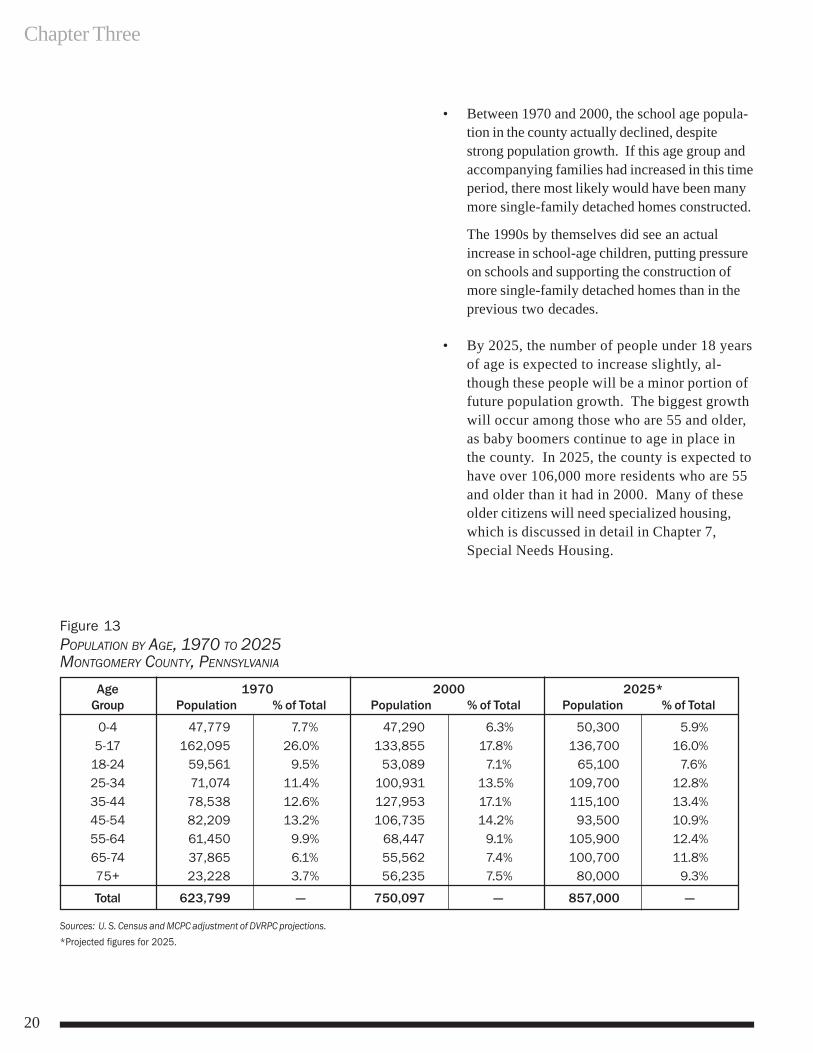
• By 2025, the number of people under 18 yearsof age is expected to increase slightly, al-though these people will be a minor portion offuture population growth. The biggest growthwill occur among those who are 55 and older,as baby boomers continue to age in place inthe county. In 2025, the county is expected tohave over 106,000 more residents who are 55and older than it had in 2000. Many of theseolder citizens will need specialized housing,which is discussed in detail in Chapter 7,Special Needs Housing.
Figure 13POPULATION BY AGE, 1970 TO 2025MONTGOMERY COUNTY, PENNSYLVANIA
Age 1970 2000 2025*Group Population % of Total Population % of Total Population % of Total
0-4 47,779 7.7% 47,290 6.3% 50,300 5.9%5-17 162,095 26.0% 133,855 17.8% 136,700 16.0%
18-24 59,561 9.5% 53,089 7.1% 65,100 7.6%25-34 71,074 11.4% 100,931 13.5% 109,700 12.8%35-44 78,538 12.6% 127,953 17.1% 115,100 13.4%45-54 82,209 13.2% 106,735 14.2% 93,500 10.9%55-64 61,450 9.9% 68,447 9.1% 105,900 12.4%65-74 37,865 6.1% 55,562 7.4% 100,700 11.8%75+ 23,228 3.7% 56,235 7.5% 80,000 9.3%
Total 623,799 — 750,097 — 857,000 —
Sources: U. S. Census and MCPC adjustment of DVRPC projections.*Projected figures for 2025.
Housing Variety
21
Income TrendsAnother lifestyle indicator, and perhaps as
equally important as age, is household income. Theincome that a household earns determines “howmuch house” they can afford, and also where theycan live. Two ways of measuring income are themedian household income and poverty level.
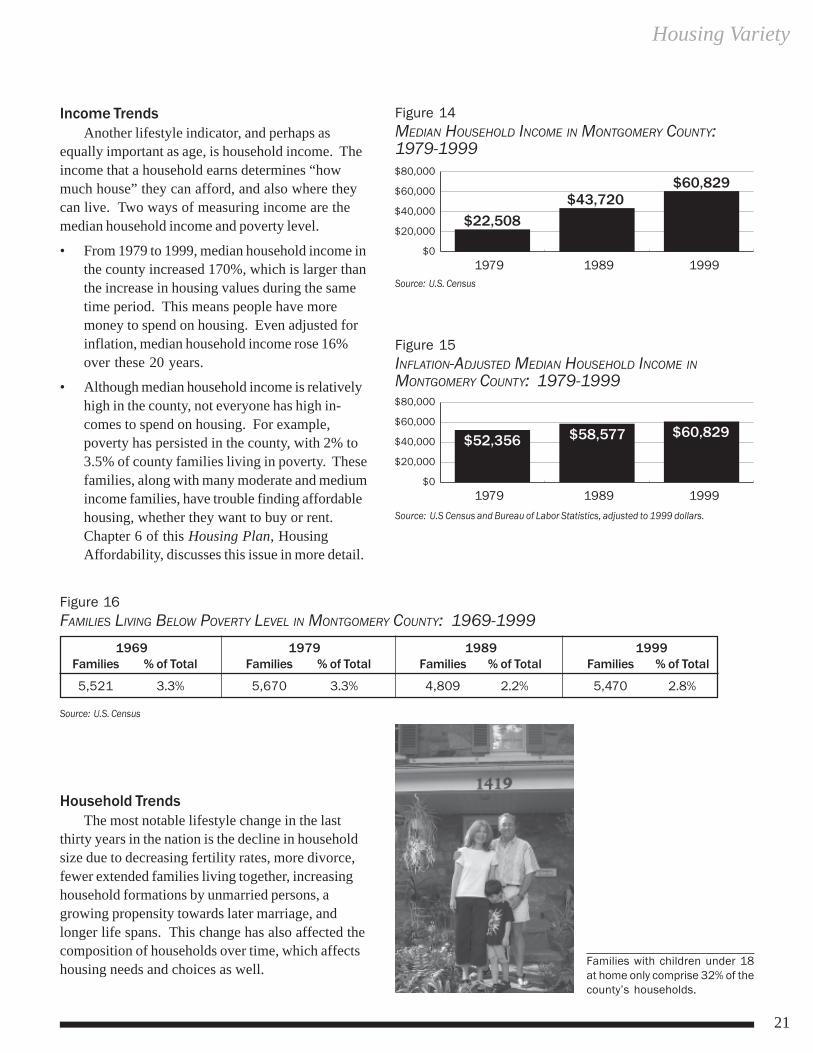
• From 1979 to 1999, median household income inthe county increased 170%, which is larger thanthe increase in housing values during the sametime period. This means people have moremoney to spend on housing. Even adjusted forinflation, median household income rose 16%over these 20 years.
• Although median household income is relativelyhigh in the county, not everyone has high in-comes to spend on housing. For example,poverty has persisted in the county, with 2% to3.5% of county families living in poverty. Thesefamilies, along with many moderate and mediumincome families, have trouble finding affordablehousing, whether they want to buy or rent.Chapter 6 of this Housing Plan, HousingAffordability, discusses this issue in more detail.
Figure 14MEDIAN HOUSEHOLD INCOME IN MONTGOMERY COUNTY:1979-1999
Source: U.S. Census
Figure 15INFLATION-ADJUSTED MEDIAN HOUSEHOLD INCOME INMONTGOMERY COUNTY: 1979-1999
Source: U.S Census and Bureau of Labor Statistics, adjusted to 1999 dollars.
Household TrendsThe most notable lifestyle change in the last
thirty years in the nation is the decline in householdsize due to decreasing fertility rates, more divorce,fewer extended families living together, increasinghousehold formations by unmarried persons, agrowing propensity towards later marriage, andlonger life spans. This change has also affected thecomposition of households over time, which affectshousing needs and choices as well.
Figure 16FAMILIES LIVING BELOW POVERTY LEVEL IN MONTGOMERY COUNTY: 1969-1999
1969 1979 1989 1999Families % of Total Families % of Total Families % of Total Families % of Total
5,521 3.3% 5,670 3.3% 4,809 2.2% 5,470 2.8%
Source: U.S. Census
Families with children under 18at home only comprise 32% of thecounty’s households.
Chapter Three
22
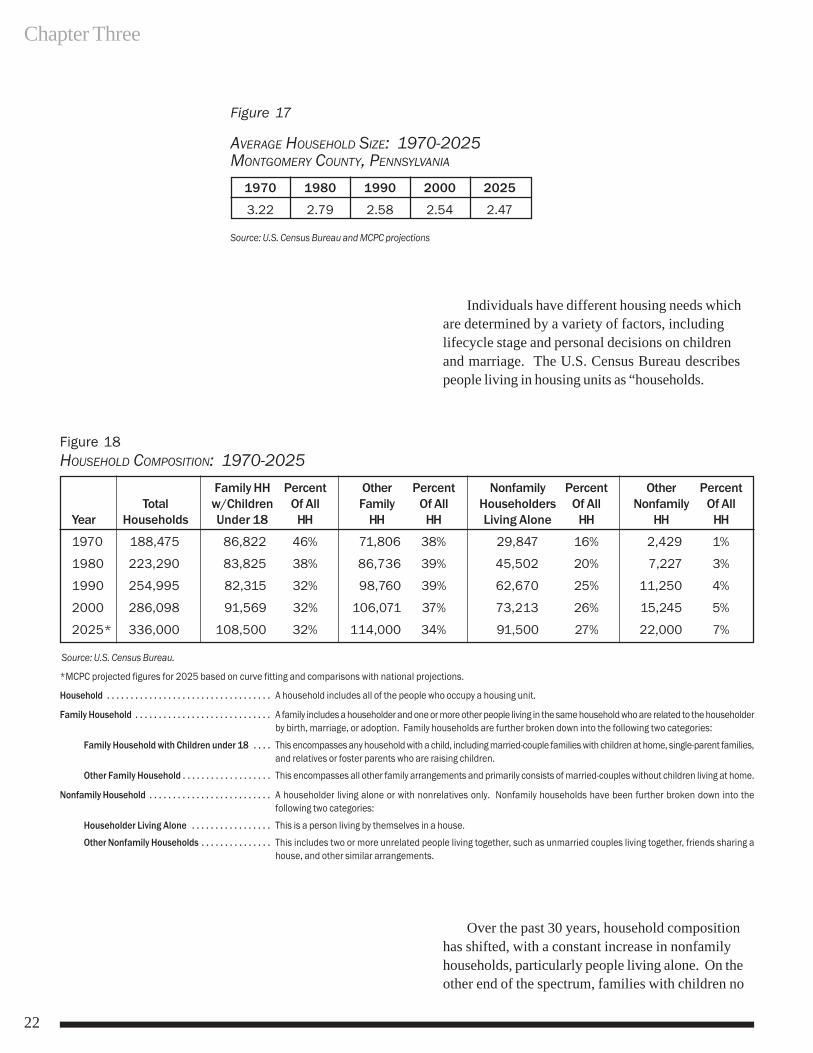
Individuals have different housing needs whichare determined by a variety of factors, includinglifecycle stage and personal decisions on childrenand marriage. The U.S. Census Bureau describespeople living in housing units as “households.
Figure 17
AVERAGE HOUSEHOLD SIZE: 1970-2025MONTGOMERY COUNTY, PENNSYLVANIA
1970 1980 1990 2000 2025
3.22 2.79 2.58 2.54 2.47
Source: U.S. Census Bureau and MCPC projections
Figure 18HOUSEHOLD COMPOSITION: 1970-2025
Family HH Percent Other Percent Nonfamily Percent Other PercentTotal w/Children Of All Family Of All Householders Of All Nonfamily Of All
Year Households Under 18 HH HH HH Living Alone HH HH HH
1970 188,475 86,822 46% 71,806 38% 29,847 16% 2,429 1%
1980 223,290 83,825 38% 86,736 39% 45,502 20% 7,227 3%
1990 254,995 82,315 32% 98,760 39% 62,670 25% 11,250 4%
2000 286,098 91,569 32% 106,071 37% 73,213 26% 15,245 5%
2025* 336,000 108,500 32% 114,000 34% 91,500 27% 22,000 7%
Source: U.S. Census Bureau.
*MCPC projected figures for 2025 based on curve fitting and comparisons with national projections.
Household . . . . . . . . . . . . . . . . . . . . . . . . . . . . . . . . . . . A household includes all of the people who occupy a housing unit.
Family Household . . . . . . . . . . . . . . . . . . . . . . . . . . . . . A family includes a householder and one or more other people living in the same household who are related to the householderby birth, marriage, or adoption. Family households are further broken down into the following two categories:
Family Household with Children under 18 . . . . This encompasses any household with a child, including married-couple families with children at home, single-parent families,and relatives or foster parents who are raising children.
Other Family Household . . . . . . . . . . . . . . . . . . . This encompasses all other family arrangements and primarily consists of married-couples without children living at home.
Nonfamily Household . . . . . . . . . . . . . . . . . . . . . . . . . . A householder living alone or with nonrelatives only. Nonfamily households have been further broken down into thefollowing two categories:
Householder Living Alone . . . . . . . . . . . . . . . . . This is a person living by themselves in a house.
Other Nonfamily Households . . . . . . . . . . . . . . . This includes two or more unrelated people living together, such as unmarried couples living together, friends sharing ahouse, and other similar arrangements.
Over the past 30 years, household compositionhas shifted, with a constant increase in nonfamilyhouseholds, particularly people living alone. On theother end of the spectrum, families with children no
Housing Variety
23
longer dominate household type, although they willremain a significant portion of households.
The changes in household composition over thelast 30 years have had an impact on the types ofhomes constructed in the county and will continue toinfluence decisions in the future.
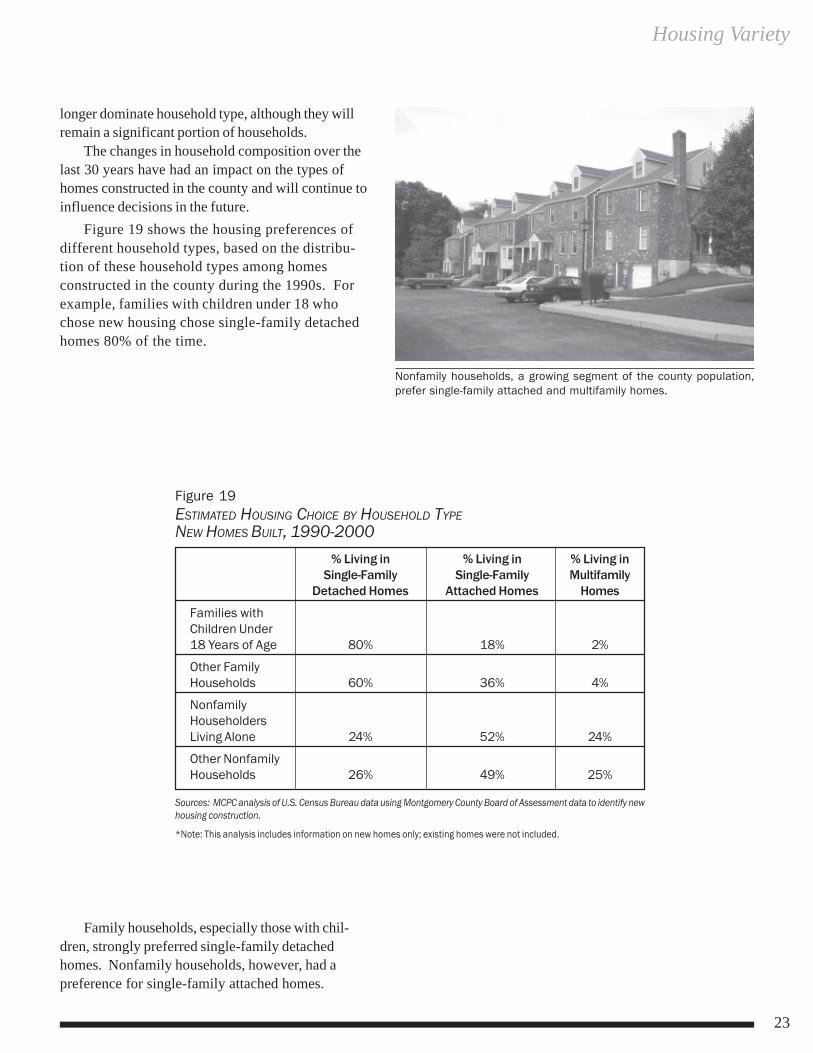
Figure 19 shows the housing preferences ofdifferent household types, based on the distribu-tion of these household types among homesconstructed in the county during the 1990s. Forexample, families with children under 18 whochose new housing chose single-family detachedhomes 80% of the time.
Family households, especially those with chil-dren, strongly preferred single-family detachedhomes. Nonfamily households, however, had apreference for single-family attached homes.
Figure 19ESTIMATED HOUSING CHOICE BY HOUSEHOLD TYPENEW HOMES BUILT, 1990-2000
% Living in % Living in % Living inSingle-Family Single-Family Multifamily
Detached Homes Attached Homes Homes
Families with Children Under 18 Years of Age 80% 18% 2%
Other Family Households 60% 36% 4%
Nonfamily Householders Living Alone 24% 52% 24%
Other Nonfamily Households 26% 49% 25%
Sources: MCPC analysis of U.S. Census Bureau data using Montgomery County Board of Assessment data to identify newhousing construction.
*Note: This analysis includes information on new homes only; existing homes were not included.
Nonfamily households, a growing segment of the county population,prefer single-family attached and multifamily homes.
Chapter Three
24
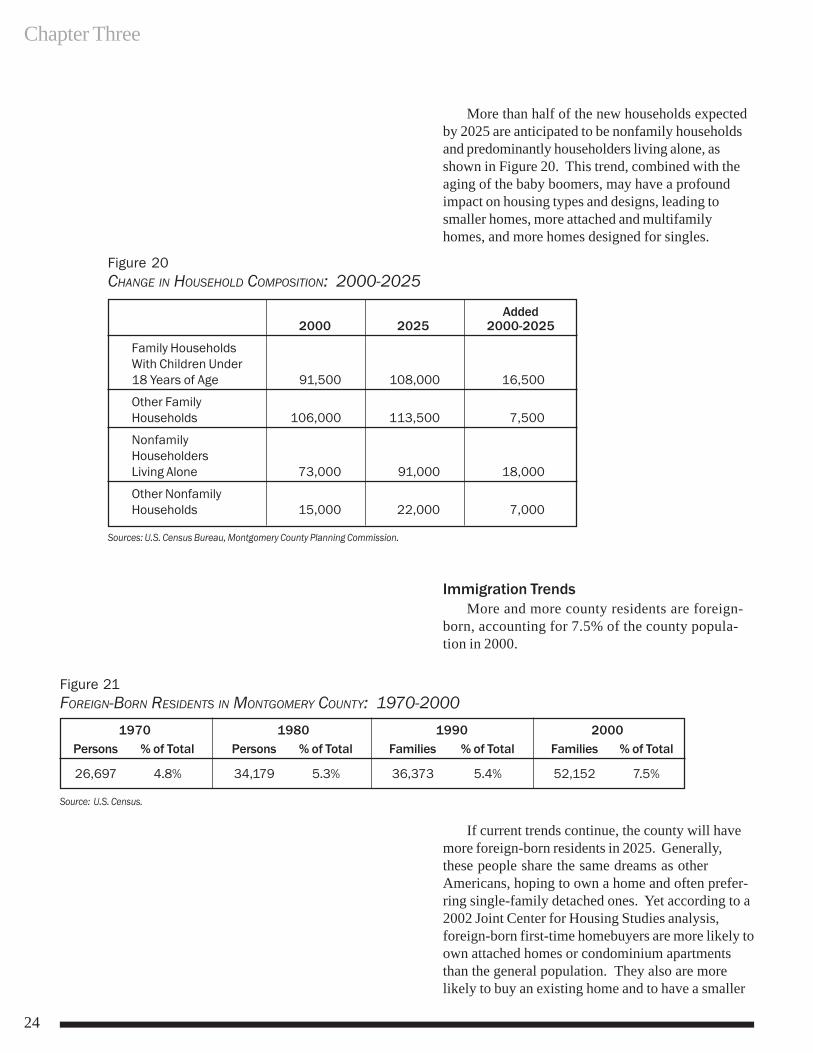
More than half of the new households expectedby 2025 are anticipated to be nonfamily householdsand predominantly householders living alone, asshown in Figure 20. This trend, combined with theaging of the baby boomers, may have a profoundimpact on housing types and designs, leading tosmaller homes, more attached and multifamilyhomes, and more homes designed for singles.
Figure 20CHANGE IN HOUSEHOLD COMPOSITION: 2000-2025
Added 2000 2025 2000-2025
Family Households With Children Under 18 Years of Age 91,500 108,000 16,500
Other Family Households 106,000 113,500 7,500
Nonfamily Householders Living Alone 73,000 91,000 18,000
Other Nonfamily Households 15,000 22,000 7,000
Sources: U.S. Census Bureau, Montgomery County Planning Commission.
Immigration TrendsMore and more county residents are foreign-
born, accounting for 7.5% of the county popula-tion in 2000.
Figure 21FOREIGN-BORN RESIDENTS IN MONTGOMERY COUNTY: 1970-2000
1970 1980 1990 2000Persons % of Total Persons % of Total Families % of Total Families % of Total
26,697 4.8% 34,179 5.3% 36,373 5.4% 52,152 7.5%
Source: U.S. Census.
If current trends continue, the county will havemore foreign-born residents in 2025. Generally,these people share the same dreams as otherAmericans, hoping to own a home and often prefer-ring single-family detached ones. Yet according to a2002 Joint Center for Housing Studies analysis,foreign-born first-time homebuyers are more likely toown attached homes or condominium apartmentsthan the general population. They also are morelikely to buy an existing home and to have a smaller
Housing Variety
25
home than native-born Americans.Since immigrants’ share of the future popula-
tion is expected to increase, there may be moredemand for smaller and more affordable single-family detached homes, as well as attached homesand condominiums.
Market PreferencesNationally, nearly three-quarters of Americans
prefer single-family detached homes at lowerdensities, according to a variety of surveys summa-rized in a 2001 article in the Fannie MaeFoundation’s Housing Policy Debate. For manyAmericans, this represents the preferred ideal,whether they choose to live in it or not because ofprice, location, or other factors.
Paradoxically, approximately half of Americansprefer smaller lots or clustered housing, and nearlyhalf prefer more walkable streets and neighbor-hoods. These preferences conflict directly with adesire for lower density housing.
One alternative to low-density auto-orientedconstruction is Traditional Neighborhood Develop-ment, which attempts to create old fashionedwalkable developments. Nationally, about 30% ofconsumers prefer this type of development, accord-ing to a number of surveys summarized in a 2002New Urban News article. Locally, a market studysponsored by the Pennsylvania EnvironmentalCouncil found that there is a strong market forcompact and sustainable development.
Currently, little new development is designed in aTraditional Neighborhood Development format,although a market clearly exists for this type ofdevelopment, as well as for smaller lots and morewalkable neighborhoods.
Trends in Housing TypesHow have these demographic and consumer
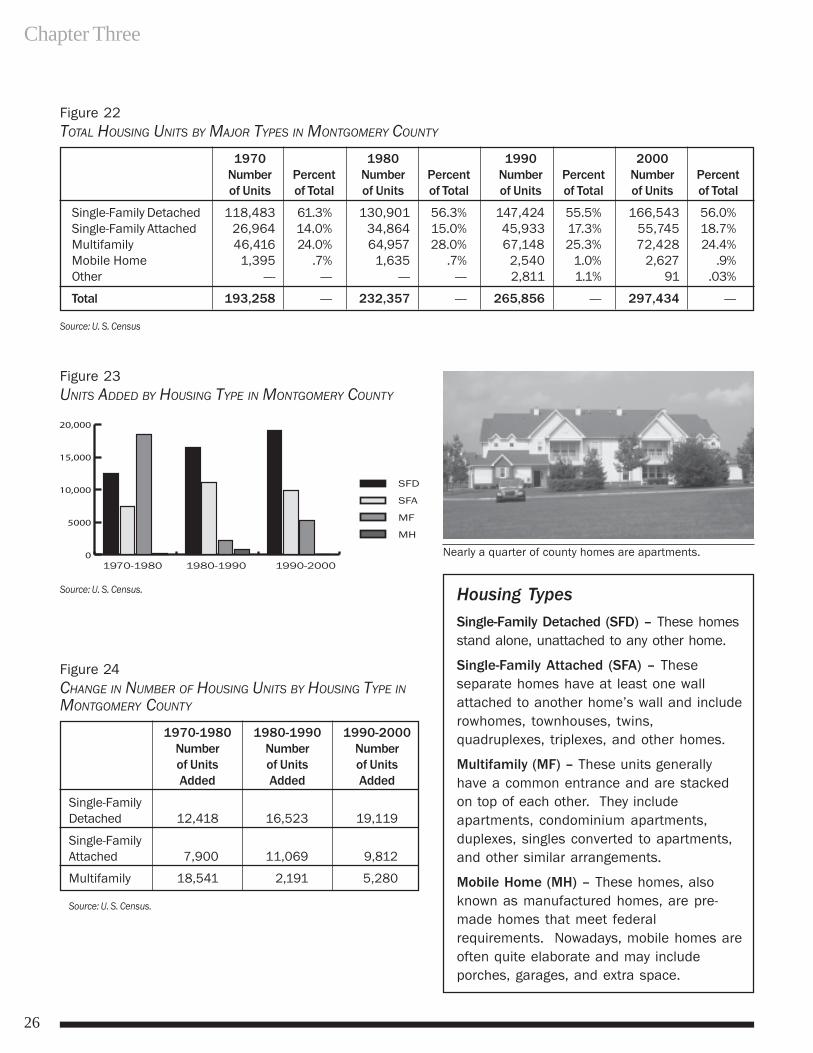
trends played out over the past 30 years? Gener-ally, single-family detached homes have been thepredominant type of home constructed, accountingfor approximately 56% of the units in the countyin 2000. In the 1980s and 1990s, single-familydetached homes accounted for 49% and 61% ofthe units added, respectively. The 1970s, how-ever, were a very different era, perhaps reflectinga rapid decline in families with children. Duringthis decade, apartments accounted for nearly halfof the units added.
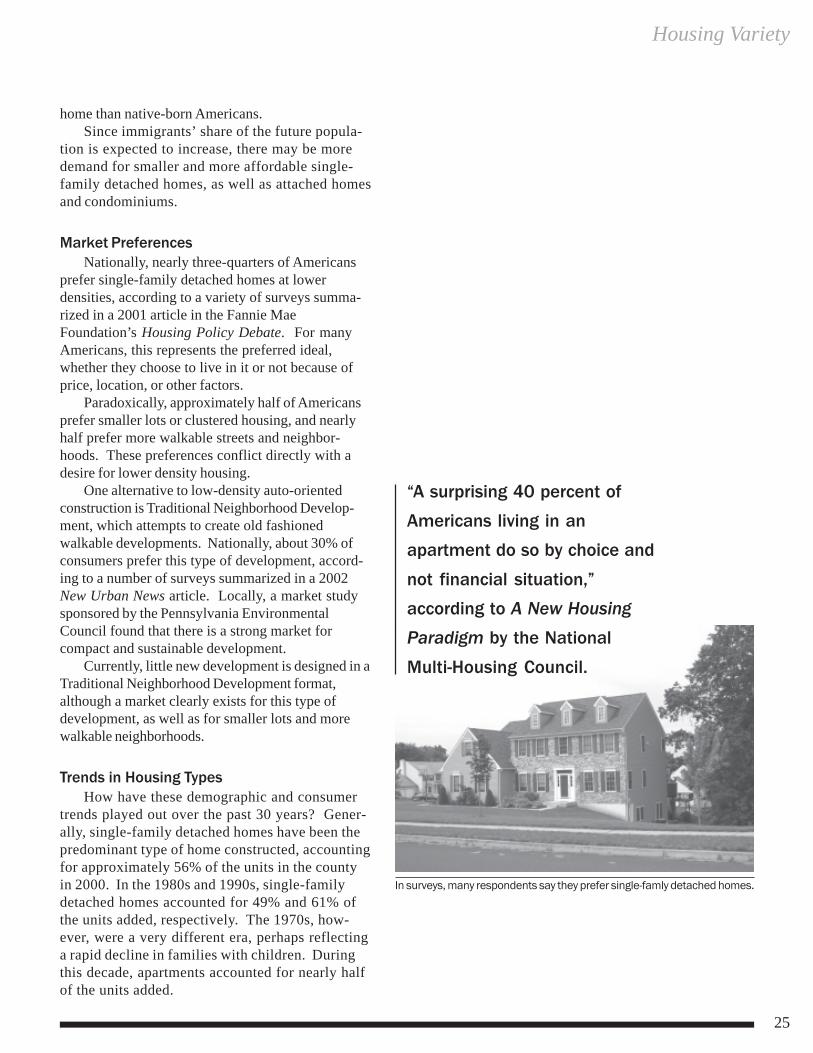
“A surprising 40 percent of
Americans living in an
apartment do so by choice and
not financial situation,”
according to A New HousingParadigm by the National
Multi-Housing Council.
In surveys, many respondents say they prefer single-famly detached homes.
Chapter Three
26
Figure 22TOTAL HOUSING UNITS BY MAJOR TYPES IN MONTGOMERY COUNTY
1970 1980 1990 2000Number Percent Number Percent Number Percent Number Percentof Units of Total of Units of Total of Units of Total of Units of Total
Single-Family Detached 118,483 61.3% 130,901 56.3% 147,424 55.5% 166,543 56.0%Single-Family Attached 26,964 14.0% 34,864 15.0% 45,933 17.3% 55,745 18.7%Multifamily 46,416 24.0% 64,957 28.0% 67,148 25.3% 72,428 24.4%Mobile Home 1,395 .7% 1,635 .7% 2,540 1.0% 2,627 .9%Other —- —- —- —- 2,811 1.1% 91 .03%
Total 193,258 —- 232,357 —- 265,856 —- 297,434 —-
Source: U. S. Census
Housing TypesSingle-Family Detached (SFD) – These homesstand alone, unattached to any other home.
Single-Family Attached (SFA) – Theseseparate homes have at least one wallattached to another home’s wall and includerowhomes, townhouses, twins,quadruplexes, triplexes, and other homes.
Multifamily (MF) – These units generallyhave a common entrance and are stackedon top of each other. They includeapartments, condominium apartments,duplexes, singles converted to apartments,and other similar arrangements.
Mobile Home (MH) – These homes, alsoknown as manufactured homes, are pre-made homes that meet federalrequirements. Nowadays, mobile homes areoften quite elaborate and may includeporches, garages, and extra space.
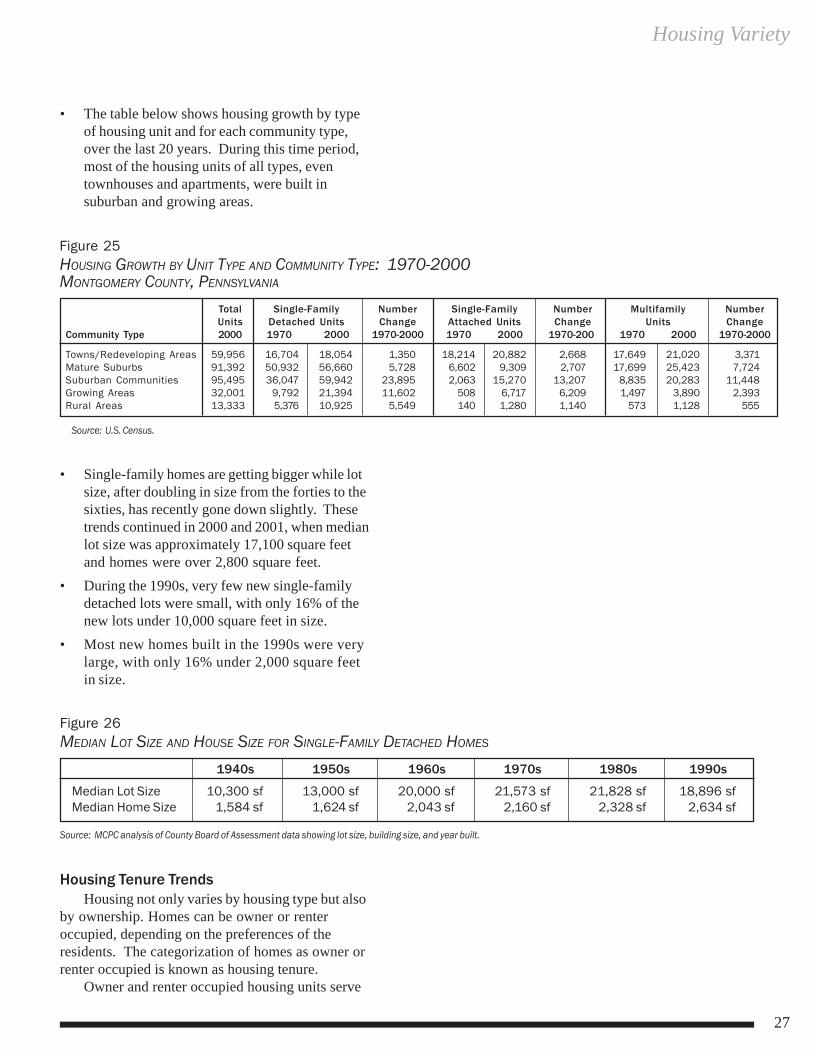
Figure 23UNITS ADDED BY HOUSING TYPE IN MONTGOMERY COUNTY
Source: U. S. Census.
Nearly a quarter of county homes are apartments.
Figure 24CHANGE IN NUMBER OF HOUSING UNITS BY HOUSING TYPE INMONTGOMERY COUNTY
1970-1980 1980-1990 1990-2000Number Number Numberof Units of Units of UnitsAdded Added Added
Single-FamilyDetached 12,418 16,523 19,119
Single-FamilyAttached 7,900 11,069 9,812
Multifamily 18,541 2,191 5,280
Source: U. S. Census.
Housing Variety
27
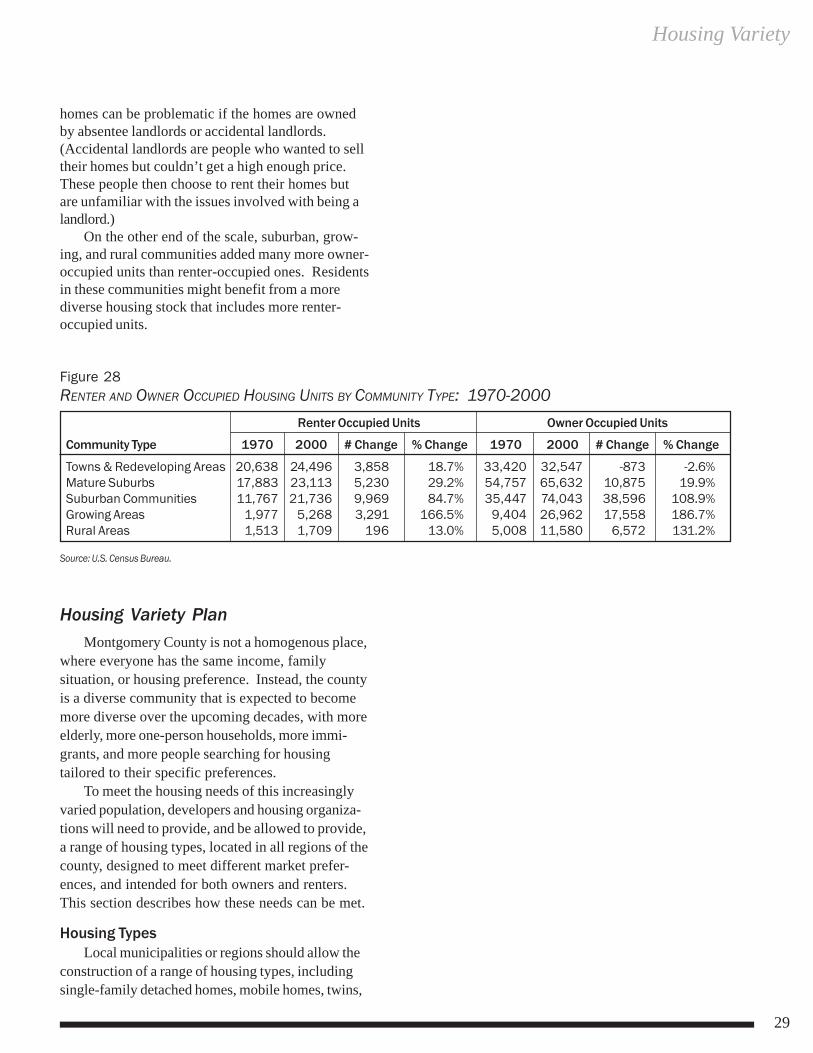
• The table below shows housing growth by typeof housing unit and for each community type,over the last 20 years. During this time period,most of the housing units of all types, eventownhouses and apartments, were built insuburban and growing areas.
• Single-family homes are getting bigger while lotsize, after doubling in size from the forties to thesixties, has recently gone down slightly. Thesetrends continued in 2000 and 2001, when medianlot size was approximately 17,100 square feetand homes were over 2,800 square feet.
• During the 1990s, very few new single-familydetached lots were small, with only 16% of thenew lots under 10,000 square feet in size.
• Most new homes built in the 1990s were verylarge, with only 16% under 2,000 square feetin size.
Figure 25HOUSING GROWTH BY UNIT TYPE AND COMMUNITY TYPE: 1970-2000MONTGOMERY COUNTY, PENNSYLVANIA
Total Single-Family Number Single-Family Number Multifamily NumberUnits Detached Units Change Attached Units Change Units Change
Community Type 2000 1970 2000 1970-2000 1970 2000 1970-200 1970 2000 1970-2000
Towns/Redeveloping Areas 59,956 16,704 18,054 1,350 18,214 20,882 2,668 17,649 21,020 3,371Mature Suburbs 91,392 50,932 56,660 5,728 6,602 9,309 2,707 17,699 25,423 7,724Suburban Communities 95,495 36,047 59,942 23,895 2,063 15,270 13,207 8,835 20,283 11,448Growing Areas 32,001 9,792 21,394 11,602 508 6,717 6,209 1,497 3,890 2,393Rural Areas 13,333 5,376 10,925 5,549 140 1,280 1,140 573 1,128 555
Source: U.S. Census.
Housing Tenure TrendsHousing not only varies by housing type but also
by ownership. Homes can be owner or renteroccupied, depending on the preferences of theresidents. The categorization of homes as owner orrenter occupied is known as housing tenure.
Owner and renter occupied housing units serve
Figure 26MEDIAN LOT SIZE AND HOUSE SIZE FOR SINGLE-FAMILY DETACHED HOMES
1940s 1950s 1960s 1970s 1980s 1990s
Median Lot Size 10,300 sf 13,000 sf 20,000 sf 21,573 sf 21,828 sf 18,896 sfMedian Home Size 1,584 sf 1,624 sf 2,043 sf 2,160 sf 2,328 sf 2,634 sf
Source: MCPC analysis of County Board of Assessment data showing lot size, building size, and year built.
Chapter Three
28
different segments of the housing market. Typically,owner occupied housing units serve the needs offamilies with children, other established families,medium to upper income singles who want to own ahome, and seniors who have aged in place. Renteroccupied housing units typically serve the needs ofcollege students, young singles just starting out intheir careers, young families, people who do notwant maintenance responsibilities, and low tomoderate income individuals and families.
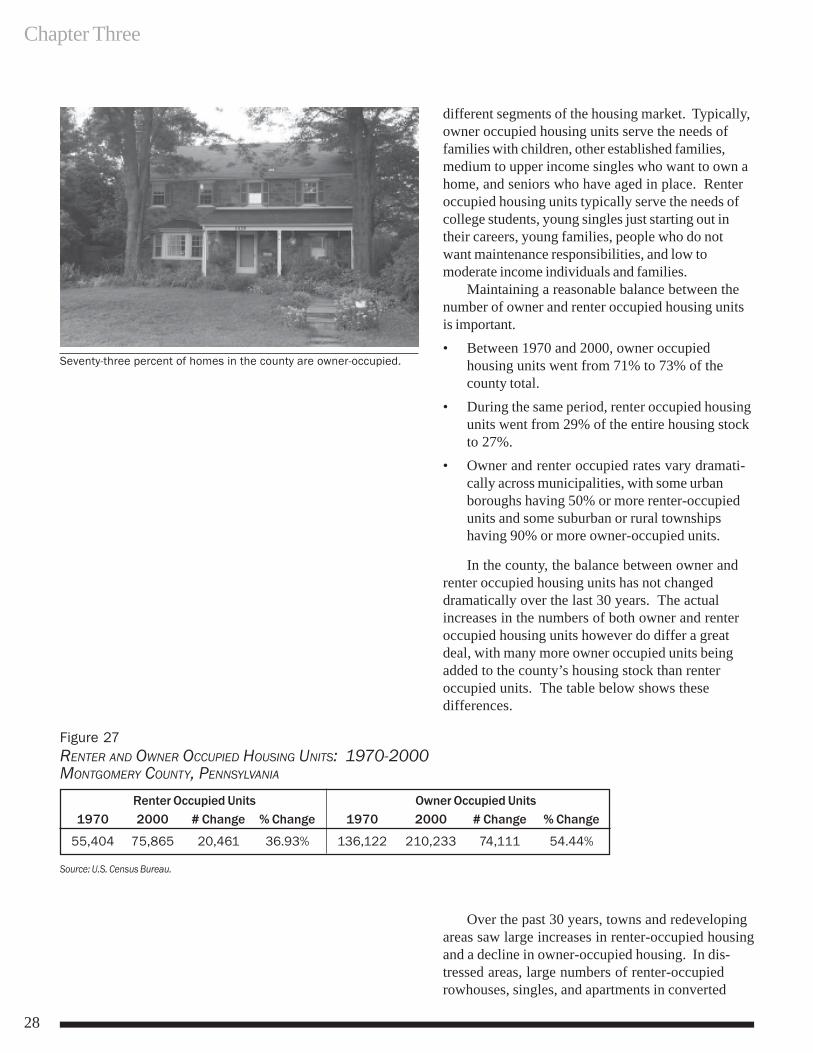
Maintaining a reasonable balance between thenumber of owner and renter occupied housing unitsis important.• Between 1970 and 2000, owner occupied
housing units went from 71% to 73% of thecounty total.
• During the same period, renter occupied housingunits went from 29% of the entire housing stockto 27%.
• Owner and renter occupied rates vary dramati-cally across municipalities, with some urbanboroughs having 50% or more renter-occupiedunits and some suburban or rural townshipshaving 90% or more owner-occupied units.
In the county, the balance between owner andrenter occupied housing units has not changeddramatically over the last 30 years. The actualincreases in the numbers of both owner and renteroccupied housing units however do differ a greatdeal, with many more owner occupied units beingadded to the county’s housing stock than renteroccupied units. The table below shows thesedifferences.
Seventy-three percent of homes in the county are owner-occupied.
Figure 27RENTER AND OWNER OCCUPIED HOUSING UNITS: 1970-2000MONTGOMERY COUNTY, PENNSYLVANIA
Renter Occupied Units Owner Occupied Units1970 2000 # Change % Change 1970 2000 # Change % Change
55,404 75,865 20,461 36.93% 136,122 210,233 74,111 54.44%
Source: U.S. Census Bureau.
Over the past 30 years, towns and redevelopingareas saw large increases in renter-occupied housingand a decline in owner-occupied housing. In dis-tressed areas, large numbers of renter-occupiedrowhouses, singles, and apartments in converted
Housing Variety
29
homes can be problematic if the homes are ownedby absentee landlords or accidental landlords.(Accidental landlords are people who wanted to selltheir homes but couldn’t get a high enough price.These people then choose to rent their homes butare unfamiliar with the issues involved with being alandlord.)
On the other end of the scale, suburban, grow-ing, and rural communities added many more owner-occupied units than renter-occupied ones. Residentsin these communities might benefit from a morediverse housing stock that includes more renter-occupied units.
Housing Variety PlanMontgomery County is not a homogenous place,
where everyone has the same income, familysituation, or housing preference. Instead, the countyis a diverse community that is expected to becomemore diverse over the upcoming decades, with moreelderly, more one-person households, more immi-grants, and more people searching for housingtailored to their specific preferences.
To meet the housing needs of this increasinglyvaried population, developers and housing organiza-tions will need to provide, and be allowed to provide,a range of housing types, located in all regions of thecounty, designed to meet different market prefer-ences, and intended for both owners and renters.This section describes how these needs can be met.
Housing TypesLocal municipalities or regions should allow the
construction of a range of housing types, includingsingle-family detached homes, mobile homes, twins,
Figure 28RENTER AND OWNER OCCUPIED HOUSING UNITS BY COMMUNITY TYPE: 1970-2000
Renter Occupied Units Owner Occupied Units
Community Type 1970 2000 # Change % Change 1970 2000 # Change % Change
Towns & Redeveloping Areas 20,638 24,496 3,858 18.7% 33,420 32,547 -873 -2.6%Mature Suburbs 17,883 23,113 5,230 29.2% 54,757 65,632 10,875 19.9%Suburban Communities 11,767 21,736 9,969 84.7% 35,447 74,043 38,596 108.9%Growing Areas 1,977 5,268 3,291 166.5% 9,404 26,962 17,558 186.7%Rural Areas 1,513 1,709 196 13.0% 5,008 11,580 6,572 131.2%
Source: U.S. Census Bureau.
Chapter Three
30
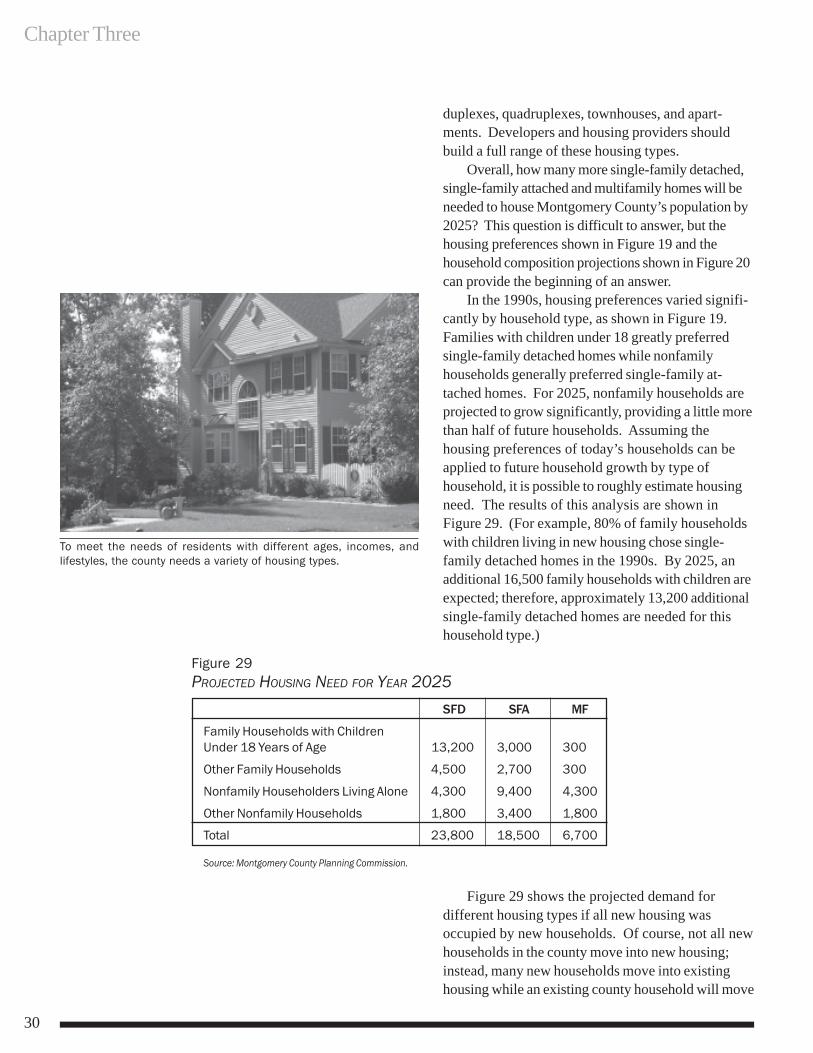
duplexes, quadruplexes, townhouses, and apart-ments. Developers and housing providers shouldbuild a full range of these housing types.
Overall, how many more single-family detached,single-family attached and multifamily homes will beneeded to house Montgomery County’s population by2025? This question is difficult to answer, but thehousing preferences shown in Figure 19 and thehousehold composition projections shown in Figure 20can provide the beginning of an answer.
In the 1990s, housing preferences varied signifi-cantly by household type, as shown in Figure 19.Families with children under 18 greatly preferredsingle-family detached homes while nonfamilyhouseholds generally preferred single-family at-tached homes. For 2025, nonfamily households areprojected to grow significantly, providing a little morethan half of future households. Assuming thehousing preferences of today’s households can beapplied to future household growth by type ofhousehold, it is possible to roughly estimate housingneed. The results of this analysis are shown inFigure 29. (For example, 80% of family householdswith children living in new housing chose single-family detached homes in the 1990s. By 2025, anadditional 16,500 family households with children areexpected; therefore, approximately 13,200 additionalsingle-family detached homes are needed for thishousehold type.)
To meet the needs of residents with different ages, incomes, andlifestyles, the county needs a variety of housing types.
Figure 29 shows the projected demand fordifferent housing types if all new housing wasoccupied by new households. Of course, not all newhouseholds in the county move into new housing;instead, many new households move into existinghousing while an existing county household will move
Figure 29PROJECTED HOUSING NEED FOR YEAR 2025
SFD SFA MF
Family Households with Children Under 18 Years of Age 13,200 3,000 300
Other Family Households 4,500 2,700 300
Nonfamily Householders Living Alone 4,300 9,400 4,300
Other Nonfamily Households 1,800 3,400 1,800
Total 23,800 18,500 6,700
Source: Montgomery County Planning Commission.
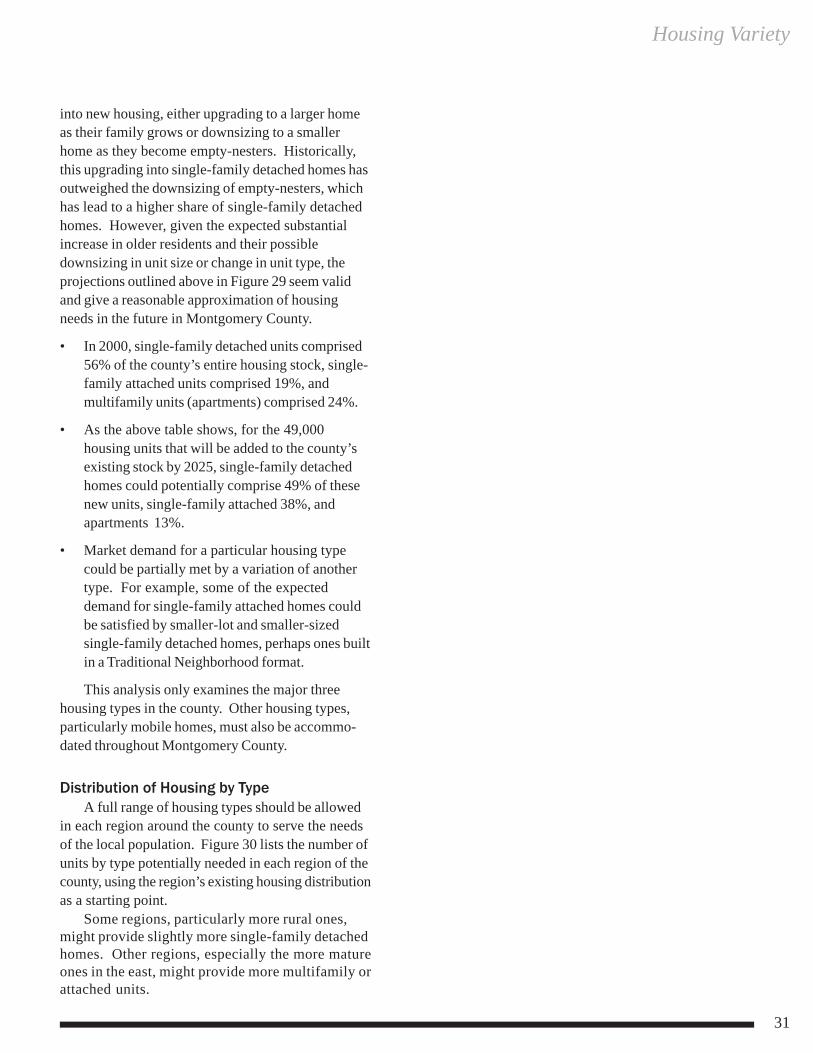
Housing Variety
31
into new housing, either upgrading to a larger homeas their family grows or downsizing to a smallerhome as they become empty-nesters. Historically,this upgrading into single-family detached homes hasoutweighed the downsizing of empty-nesters, whichhas lead to a higher share of single-family detachedhomes. However, given the expected substantialincrease in older residents and their possibledownsizing in unit size or change in unit type, theprojections outlined above in Figure 29 seem validand give a reasonable approximation of housingneeds in the future in Montgomery County.
• In 2000, single-family detached units comprised56% of the county’s entire housing stock, single-family attached units comprised 19%, andmultifamily units (apartments) comprised 24%.
• As the above table shows, for the 49,000housing units that will be added to the county’sexisting stock by 2025, single-family detachedhomes could potentially comprise 49% of thesenew units, single-family attached 38%, andapartments 13%.
• Market demand for a particular housing typecould be partially met by a variation of anothertype. For example, some of the expecteddemand for single-family attached homes couldbe satisfied by smaller-lot and smaller-sizedsingle-family detached homes, perhaps ones builtin a Traditional Neighborhood format.
This analysis only examines the major threehousing types in the county. Other housing types,particularly mobile homes, must also be accommo-dated throughout Montgomery County.
Distribution of Housing by TypeA full range of housing types should be allowed
in each region around the county to serve the needsof the local population. Figure 30 lists the number ofunits by type potentially needed in each region of thecounty, using the region’s existing housing distributionas a starting point.
Some regions, particularly more rural ones,might provide slightly more single-family detachedhomes. Other regions, especially the more matureones in the east, might provide more multifamily orattached units.
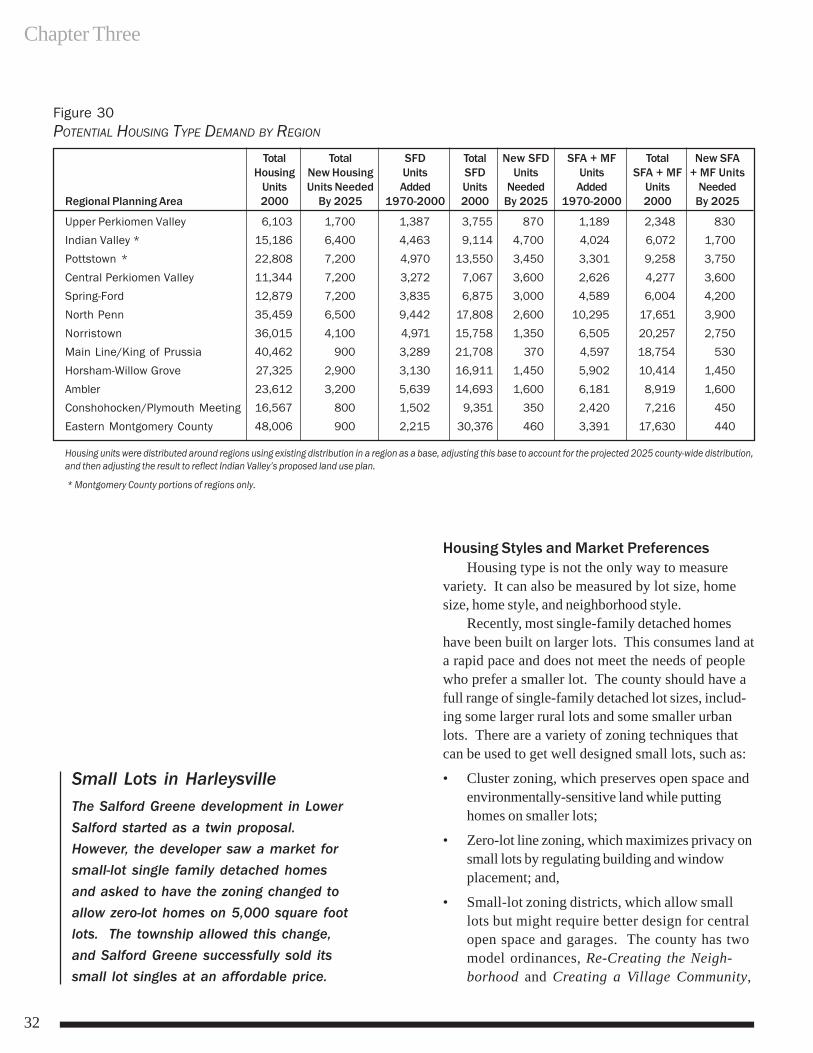
Chapter Three
32
Small Lots in HarleysvilleThe Salford Greene development in LowerSalford started as a twin proposal.However, the developer saw a market forsmall-lot single family detached homesand asked to have the zoning changed toallow zero-lot homes on 5,000 square footlots. The township allowed this change,and Salford Greene successfully sold itssmall lot singles at an affordable price.
Figure 30POTENTIAL HOUSING TYPE DEMAND BY REGION
Total Total SFD Total New SFD SFA + MF Total New SFA Housing New Housing Units SFD Units Units SFA + MF + MF Units
Units Units Needed Added Units Needed Added Units NeededRegional Planning Area 2000 By 2025 1970-2000 2000 By 2025 1970-2000 2000 By 2025
Upper Perkiomen Valley 6,103 1,700 1,387 3,755 870 1,189 2,348 830
Indian Valley * 15,186 6,400 4,463 9,114 4,700 4,024 6,072 1,700
Pottstown * 22,808 7,200 4,970 13,550 3,450 3,301 9,258 3,750
Central Perkiomen Valley 11,344 7,200 3,272 7,067 3,600 2,626 4,277 3,600
Spring-Ford 12,879 7,200 3,835 6,875 3,000 4,589 6,004 4,200
North Penn 35,459 6,500 9,442 17,808 2,600 10,295 17,651 3,900
Norristown 36,015 4,100 4,971 15,758 1,350 6,505 20,257 2,750
Main Line/King of Prussia 40,462 900 3,289 21,708 370 4,597 18,754 530
Horsham-Willow Grove 27,325 2,900 3,130 16,911 1,450 5,902 10,414 1,450
Ambler 23,612 3,200 5,639 14,693 1,600 6,181 8,919 1,600
Conshohocken/Plymouth Meeting 16,567 800 1,502 9,351 350 2,420 7,216 450
Eastern Montgomery County 48,006 900 2,215 30,376 460 3,391 17,630 440
Housing units were distributed around regions using existing distribution in a region as a base, adjusting this base to account for the projected 2025 county-wide distribution,and then adjusting the result to reflect Indian Valley’s proposed land use plan.
* Montgomery County portions of regions only.
Housing Styles and Market PreferencesHousing type is not the only way to measure
variety. It can also be measured by lot size, homesize, home style, and neighborhood style.
Recently, most single-family detached homeshave been built on larger lots. This consumes land ata rapid pace and does not meet the needs of peoplewho prefer a smaller lot. The county should have afull range of single-family detached lot sizes, includ-ing some larger rural lots and some smaller urbanlots. There are a variety of zoning techniques thatcan be used to get well designed small lots, such as:
• Cluster zoning, which preserves open space andenvironmentally-sensitive land while puttinghomes on smaller lots;
• Zero-lot line zoning, which maximizes privacy onsmall lots by regulating building and windowplacement; and,
• Small-lot zoning districts, which allow smalllots but might require better design for centralopen space and garages. The county has twomodel ordinances, Re-Creating the Neigh-borhood and Creating a Village Community,
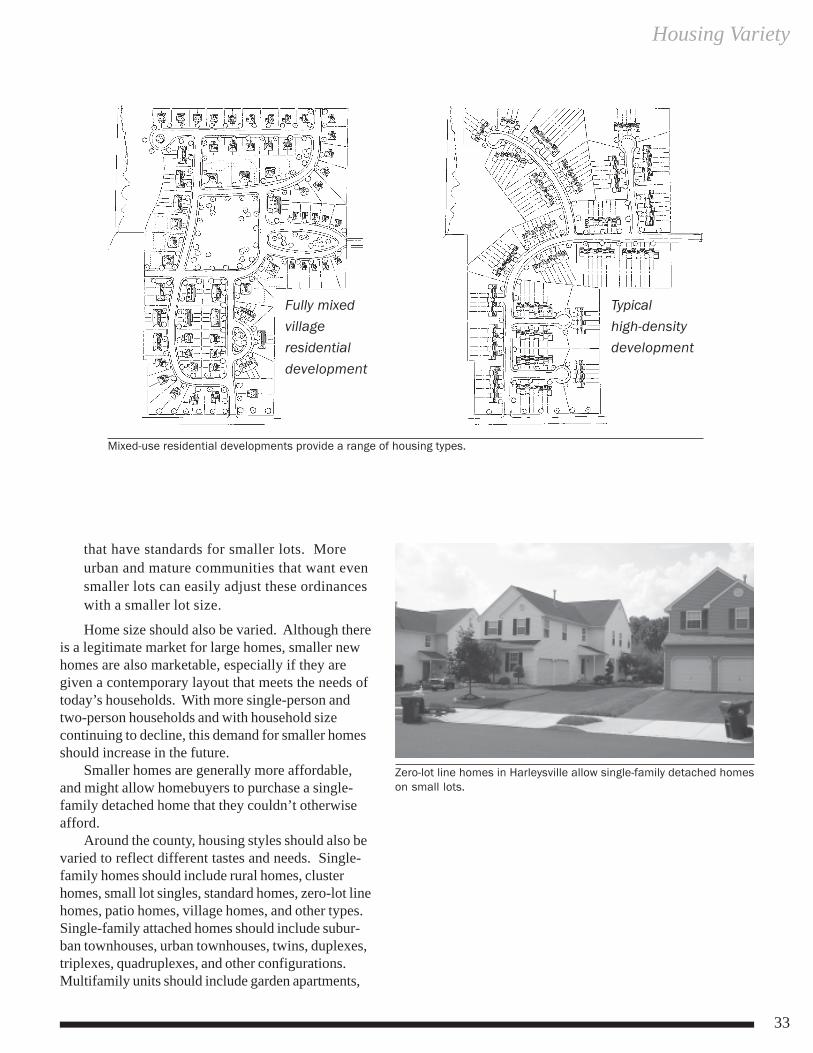
Housing Variety
33
that have standards for smaller lots. Moreurban and mature communities that want evensmaller lots can easily adjust these ordinanceswith a smaller lot size.
Home size should also be varied. Although thereis a legitimate market for large homes, smaller newhomes are also marketable, especially if they aregiven a contemporary layout that meets the needs oftoday’s households. With more single-person andtwo-person households and with household sizecontinuing to decline, this demand for smaller homesshould increase in the future.
Smaller homes are generally more affordable,and might allow homebuyers to purchase a single-family detached home that they couldn’t otherwiseafford.
Around the county, housing styles should also bevaried to reflect different tastes and needs. Single-family homes should include rural homes, clusterhomes, small lot singles, standard homes, zero-lot linehomes, patio homes, village homes, and other types.Single-family attached homes should include subur-ban townhouses, urban townhouses, twins, duplexes,triplexes, quadruplexes, and other configurations.Multifamily units should include garden apartments,
Zero-lot line homes in Harleysville allow single-family detached homeson small lots.
Mixed-use residential developments provide a range of housing types.
Fully mixedvillageresidentialdevelopment
Typicalhigh-densitydevelopment
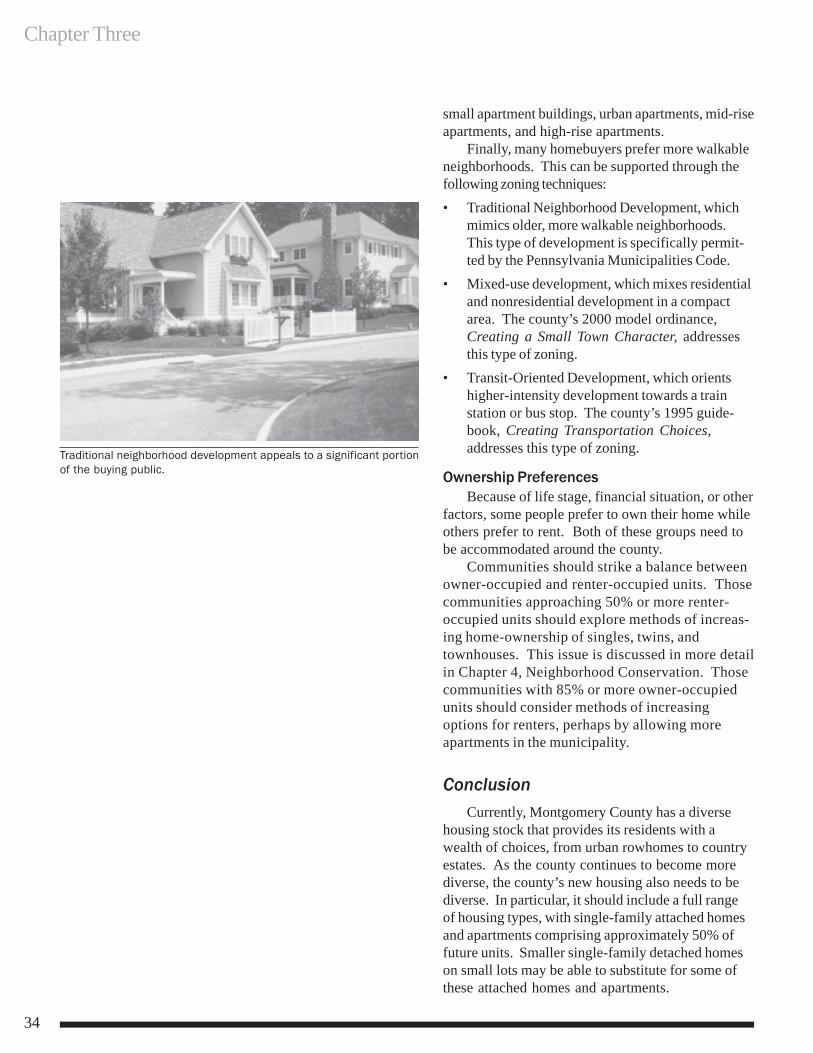
Chapter Three
34
small apartment buildings, urban apartments, mid-riseapartments, and high-rise apartments.
Finally, many homebuyers prefer more walkableneighborhoods. This can be supported through thefollowing zoning techniques:• Traditional Neighborhood Development, which
mimics older, more walkable neighborhoods.This type of development is specifically permit-ted by the Pennsylvania Municipalities Code.
• Mixed-use development, which mixes residentialand nonresidential development in a compactarea. The county’s 2000 model ordinance,Creating a Small Town Character, addressesthis type of zoning.
• Transit-Oriented Development, which orientshigher-intensity development towards a trainstation or bus stop. The county’s 1995 guide-book, Creating Transportation Choices,addresses this type of zoning.
Ownership PreferencesBecause of life stage, financial situation, or other
factors, some people prefer to own their home whileothers prefer to rent. Both of these groups need tobe accommodated around the county.
Communities should strike a balance betweenowner-occupied and renter-occupied units. Thosecommunities approaching 50% or more renter-occupied units should explore methods of increas-ing home-ownership of singles, twins, andtownhouses. This issue is discussed in more detailin Chapter 4, Neighborhood Conservation. Thosecommunities with 85% or more owner-occupiedunits should consider methods of increasingoptions for renters, perhaps by allowing moreapartments in the municipality.
ConclusionCurrently, Montgomery County has a diverse
housing stock that provides its residents with awealth of choices, from urban rowhomes to countryestates. As the county continues to become morediverse, the county’s new housing also needs to bediverse. In particular, it should include a full rangeof housing types, with single-family attached homesand apartments comprising approximately 50% offuture units. Smaller single-family detached homeson small lots may be able to substitute for some ofthese attached homes and apartments.
Traditional neighborhood development appeals to a significant portionof the buying public.
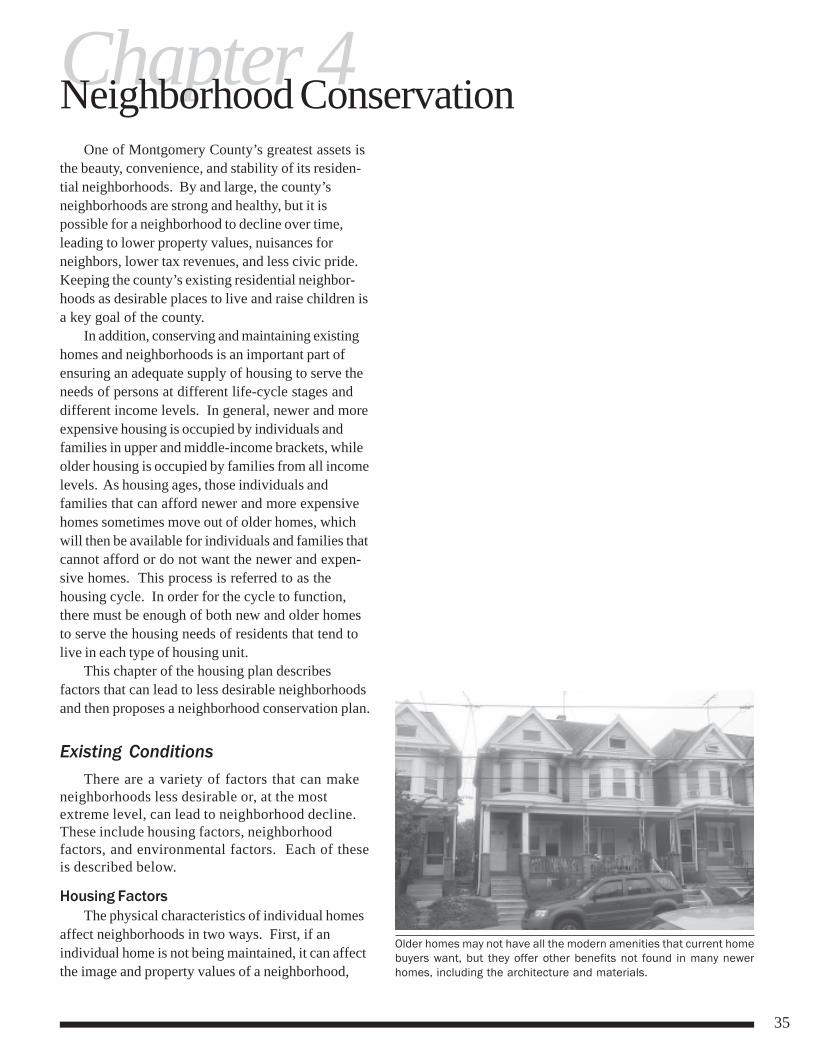
35
Chapter 4Neighborhood ConservationOne of Montgomery County’s greatest assets is
the beauty, convenience, and stability of its residen-tial neighborhoods. By and large, the county’sneighborhoods are strong and healthy, but it ispossible for a neighborhood to decline over time,leading to lower property values, nuisances forneighbors, lower tax revenues, and less civic pride.Keeping the county’s existing residential neighbor-hoods as desirable places to live and raise children isa key goal of the county.
In addition, conserving and maintaining existinghomes and neighborhoods is an important part ofensuring an adequate supply of housing to serve theneeds of persons at different life-cycle stages anddifferent income levels. In general, newer and moreexpensive housing is occupied by individuals andfamilies in upper and middle-income brackets, whileolder housing is occupied by families from all incomelevels. As housing ages, those individuals andfamilies that can afford newer and more expensivehomes sometimes move out of older homes, whichwill then be available for individuals and families thatcannot afford or do not want the newer and expen-sive homes. This process is referred to as thehousing cycle. In order for the cycle to function,there must be enough of both new and older homesto serve the housing needs of residents that tend tolive in each type of housing unit.
This chapter of the housing plan describesfactors that can lead to less desirable neighborhoodsand then proposes a neighborhood conservation plan.
Existing ConditionsThere are a variety of factors that can make
neighborhoods less desirable or, at the mostextreme level, can lead to neighborhood decline.These include housing factors, neighborhoodfactors, and environmental factors. Each of theseis described below.
Housing FactorsThe physical characteristics of individual homes
affect neighborhoods in two ways. First, if anindividual home is not being maintained, it can affectthe image and property values of a neighborhood,
Older homes may not have all the modern amenities that current homebuyers want, but they offer other benefits not found in many newerhomes, including the architecture and materials.
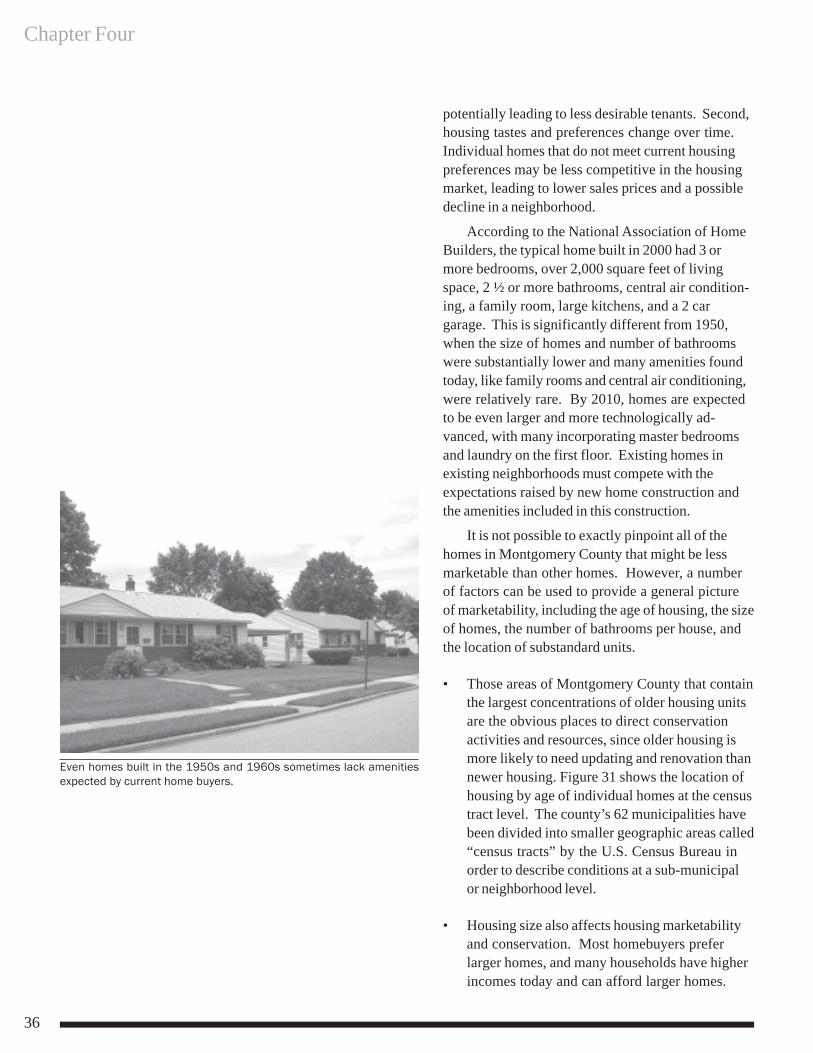
Chapter Four
36
potentially leading to less desirable tenants. Second,housing tastes and preferences change over time.Individual homes that do not meet current housingpreferences may be less competitive in the housingmarket, leading to lower sales prices and a possibledecline in a neighborhood.
According to the National Association of HomeBuilders, the typical home built in 2000 had 3 ormore bedrooms, over 2,000 square feet of livingspace, 2 ½ or more bathrooms, central air condition-ing, a family room, large kitchens, and a 2 cargarage. This is significantly different from 1950,when the size of homes and number of bathroomswere substantially lower and many amenities foundtoday, like family rooms and central air conditioning,were relatively rare. By 2010, homes are expectedto be even larger and more technologically ad-vanced, with many incorporating master bedroomsand laundry on the first floor. Existing homes inexisting neighborhoods must compete with theexpectations raised by new home construction andthe amenities included in this construction.
It is not possible to exactly pinpoint all of thehomes in Montgomery County that might be lessmarketable than other homes. However, a numberof factors can be used to provide a general pictureof marketability, including the age of housing, the sizeof homes, the number of bathrooms per house, andthe location of substandard units.
• Those areas of Montgomery County that containthe largest concentrations of older housing unitsare the obvious places to direct conservationactivities and resources, since older housing ismore likely to need updating and renovation thannewer housing. Figure 31 shows the location ofhousing by age of individual homes at the censustract level. The county’s 62 municipalities havebeen divided into smaller geographic areas called“census tracts” by the U.S. Census Bureau inorder to describe conditions at a sub-municipalor neighborhood level.
• Housing size also affects housing marketabilityand conservation. Most homebuyers preferlarger homes, and many households have higherincomes today and can afford larger homes.
Even homes built in the 1950s and 1960s sometimes lack amenitiesexpected by current home buyers.
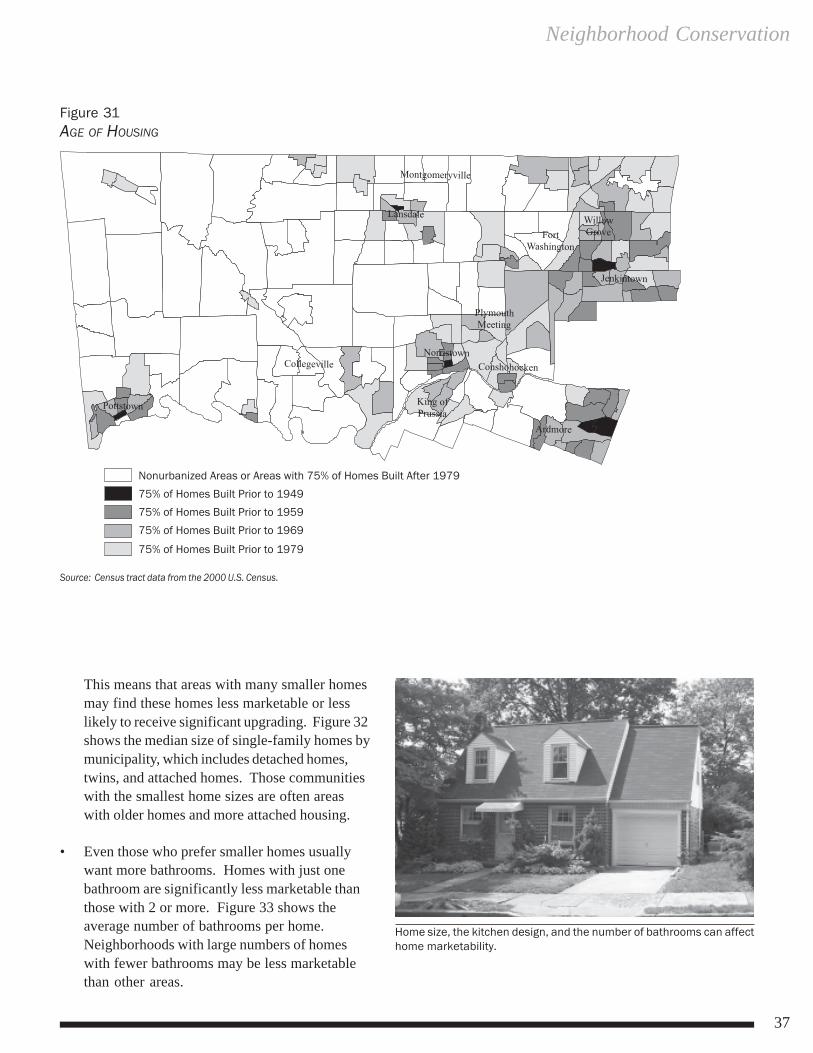
Neighborhood Conservation
37
Figure 31AGE OF HOUSING
Source: Census tract data from the 2000 U.S. Census.
This means that areas with many smaller homesmay find these homes less marketable or lesslikely to receive significant upgrading. Figure 32shows the median size of single-family homes bymunicipality, which includes detached homes,twins, and attached homes. Those communitieswith the smallest home sizes are often areaswith older homes and more attached housing.
• Even those who prefer smaller homes usuallywant more bathrooms. Homes with just onebathroom are significantly less marketable thanthose with 2 or more. Figure 33 shows theaverage number of bathrooms per home.Neighborhoods with large numbers of homeswith fewer bathrooms may be less marketablethan other areas.
Home size, the kitchen design, and the number of bathrooms can affecthome marketability.
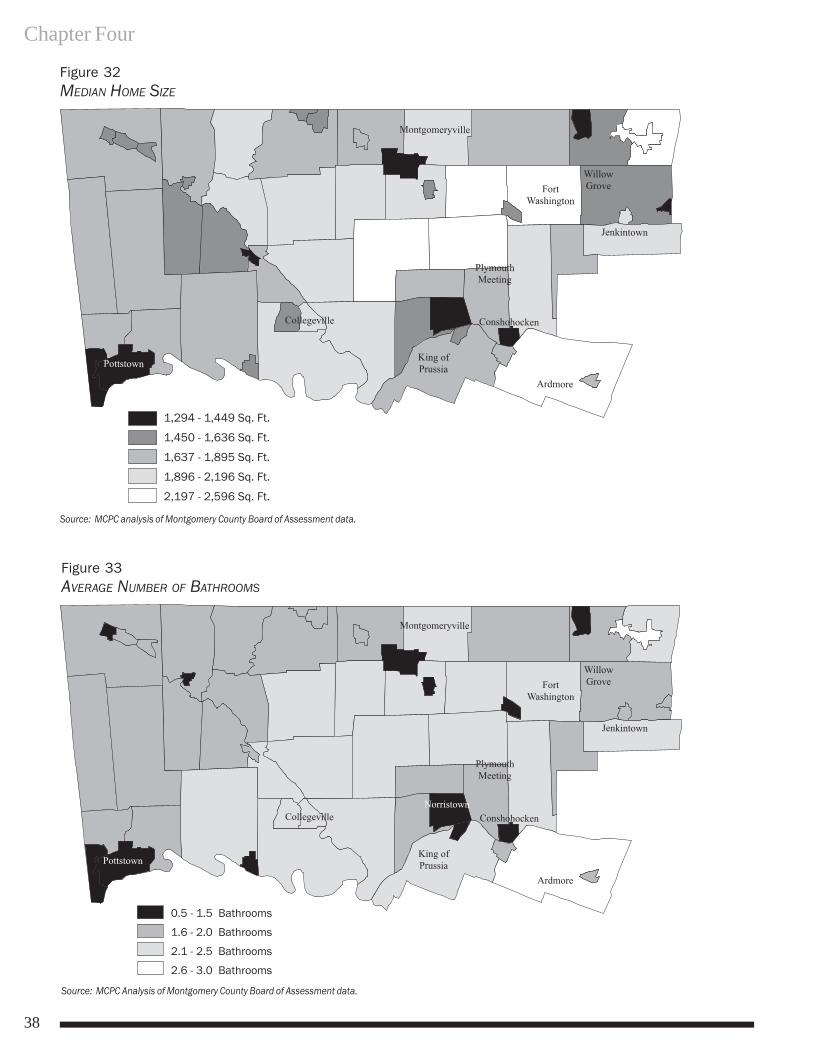
Chapter Four
38
Figure 33AVERAGE NUMBER OF BATHROOMS
Source: MCPC Analysis of Montgomery County Board of Assessment data.
Figure 32MEDIAN HOME SIZE
Source: MCPC analysis of Montgomery County Board of Assessment data.
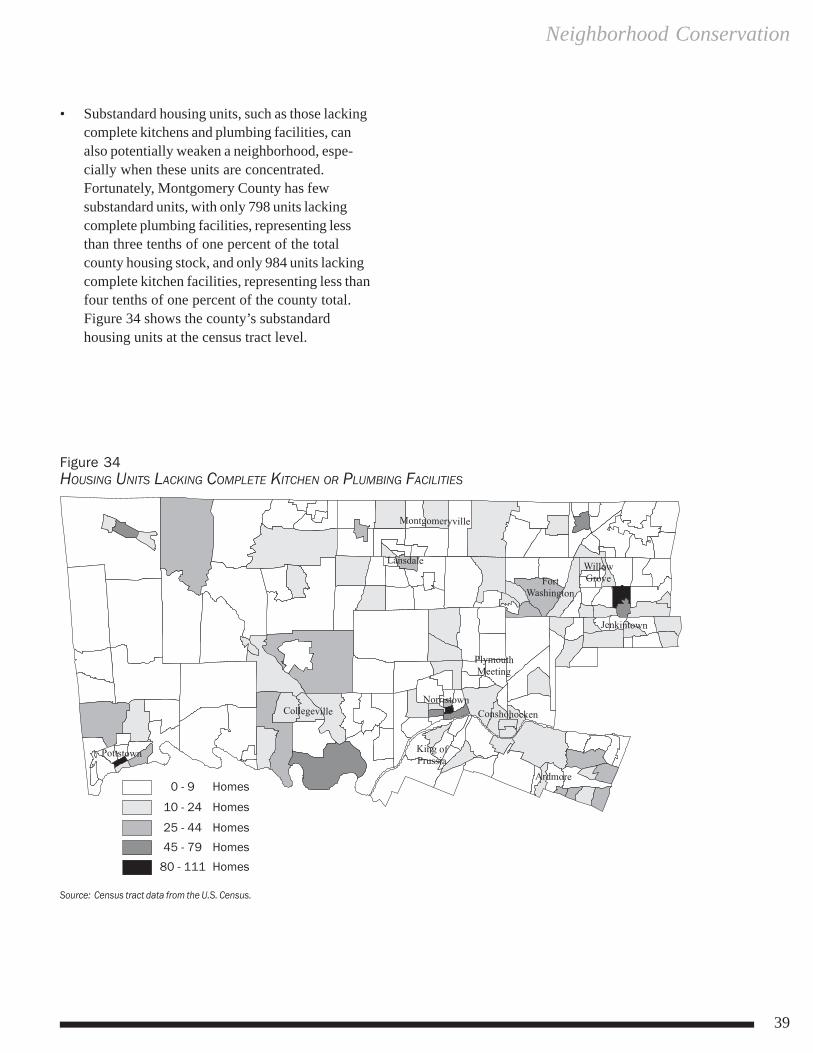
Neighborhood Conservation
39
• Substandard housing units, such as those lackingcomplete kitchens and plumbing facilities, canalso potentially weaken a neighborhood, espe-cially when these units are concentrated.Fortunately, Montgomery County has fewsubstandard units, with only 798 units lackingcomplete plumbing facilities, representing lessthan three tenths of one percent of the totalcounty housing stock, and only 984 units lackingcomplete kitchen facilities, representing less thanfour tenths of one percent of the county total.Figure 34 shows the county’s substandardhousing units at the census tract level.
Figure 34HOUSING UNITS LACKING COMPLETE KITCHEN OR PLUMBING FACILITIES
Source: Census tract data from the U.S. Census.
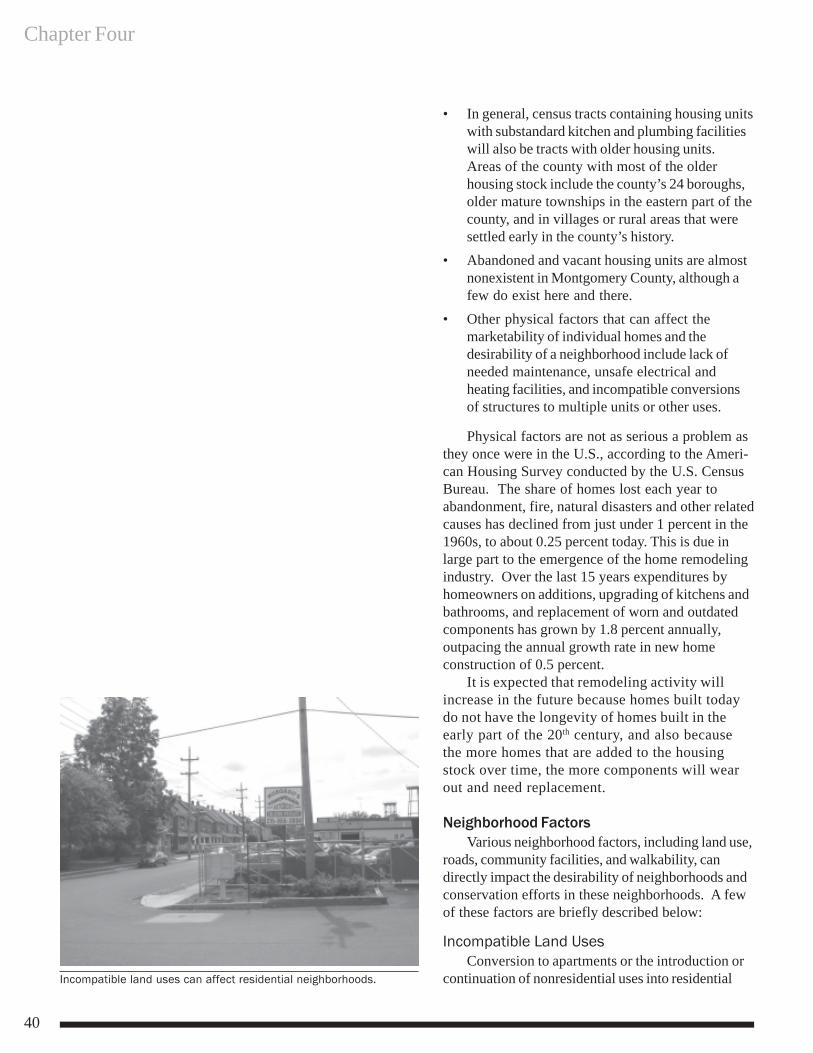
Chapter Four
40
• In general, census tracts containing housing unitswith substandard kitchen and plumbing facilitieswill also be tracts with older housing units.Areas of the county with most of the olderhousing stock include the county’s 24 boroughs,older mature townships in the eastern part of thecounty, and in villages or rural areas that weresettled early in the county’s history.
• Abandoned and vacant housing units are almostnonexistent in Montgomery County, although afew do exist here and there.
• Other physical factors that can affect themarketability of individual homes and thedesirability of a neighborhood include lack ofneeded maintenance, unsafe electrical andheating facilities, and incompatible conversionsof structures to multiple units or other uses.
Physical factors are not as serious a problem asthey once were in the U.S., according to the Ameri-can Housing Survey conducted by the U.S. CensusBureau. The share of homes lost each year toabandonment, fire, natural disasters and other relatedcauses has declined from just under 1 percent in the1960s, to about 0.25 percent today. This is due inlarge part to the emergence of the home remodelingindustry. Over the last 15 years expenditures byhomeowners on additions, upgrading of kitchens andbathrooms, and replacement of worn and outdatedcomponents has grown by 1.8 percent annually,outpacing the annual growth rate in new homeconstruction of 0.5 percent.
It is expected that remodeling activity willincrease in the future because homes built todaydo not have the longevity of homes built in theearly part of the 20th century, and also becausethe more homes that are added to the housingstock over time, the more components will wearout and need replacement.
Neighborhood FactorsVarious neighborhood factors, including land use,
roads, community facilities, and walkability, candirectly impact the desirability of neighborhoods andconservation efforts in these neighborhoods. A fewof these factors are briefly described below:
Incompatible Land UsesConversion to apartments or the introduction or
continuation of nonresidential uses into residentialIncompatible land uses can affect residential neighborhoods.
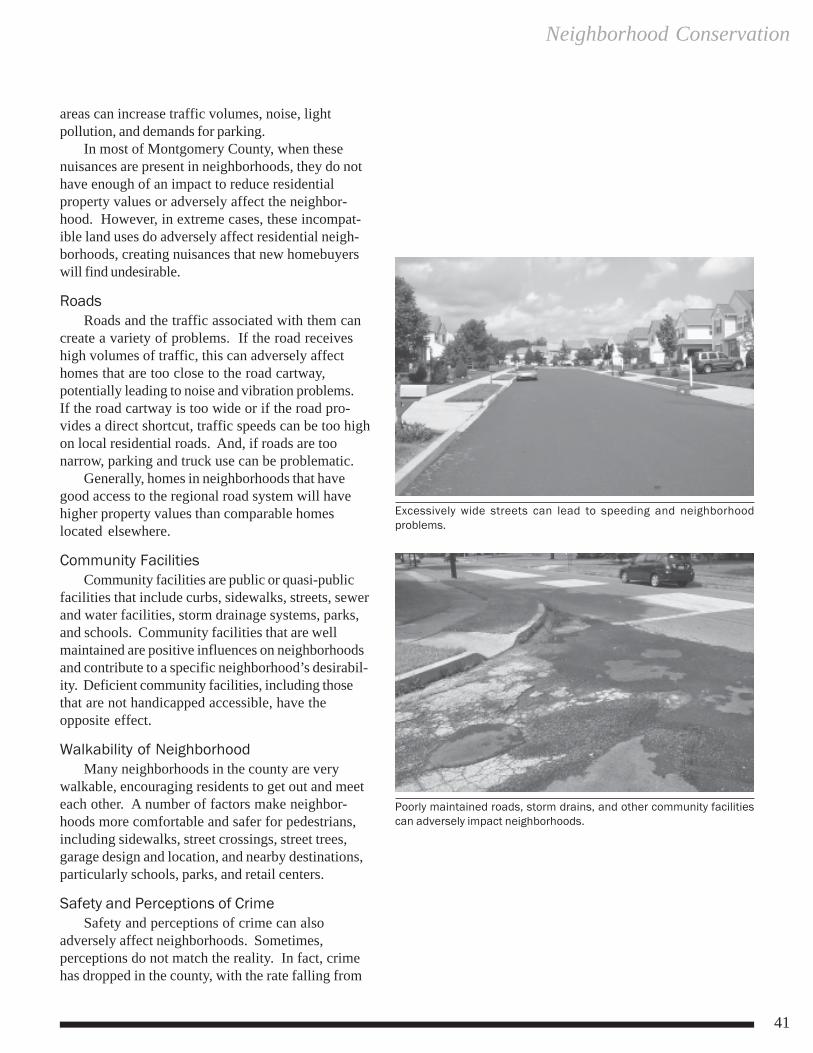
Neighborhood Conservation
41
areas can increase traffic volumes, noise, lightpollution, and demands for parking.
In most of Montgomery County, when thesenuisances are present in neighborhoods, they do nothave enough of an impact to reduce residentialproperty values or adversely affect the neighbor-hood. However, in extreme cases, these incompat-ible land uses do adversely affect residential neigh-borhoods, creating nuisances that new homebuyerswill find undesirable.
RoadsRoads and the traffic associated with them can
create a variety of problems. If the road receiveshigh volumes of traffic, this can adversely affecthomes that are too close to the road cartway,potentially leading to noise and vibration problems.If the road cartway is too wide or if the road pro-vides a direct shortcut, traffic speeds can be too highon local residential roads. And, if roads are toonarrow, parking and truck use can be problematic.
Generally, homes in neighborhoods that havegood access to the regional road system will havehigher property values than comparable homeslocated elsewhere.
Community FacilitiesCommunity facilities are public or quasi-public
facilities that include curbs, sidewalks, streets, sewerand water facilities, storm drainage systems, parks,and schools. Community facilities that are wellmaintained are positive influences on neighborhoodsand contribute to a specific neighborhood’s desirabil-ity. Deficient community facilities, including thosethat are not handicapped accessible, have theopposite effect.
Walkability of NeighborhoodMany neighborhoods in the county are very
walkable, encouraging residents to get out and meeteach other. A number of factors make neighbor-hoods more comfortable and safer for pedestrians,including sidewalks, street crossings, street trees,garage design and location, and nearby destinations,particularly schools, parks, and retail centers.
Safety and Perceptions of CrimeSafety and perceptions of crime can also
adversely affect neighborhoods. Sometimes,perceptions do not match the reality. In fact, crimehas dropped in the county, with the rate falling from
Excessively wide streets can lead to speeding and neighborhoodproblems.
Poorly maintained roads, storm drains, and other community facilitiescan adversely impact neighborhoods.
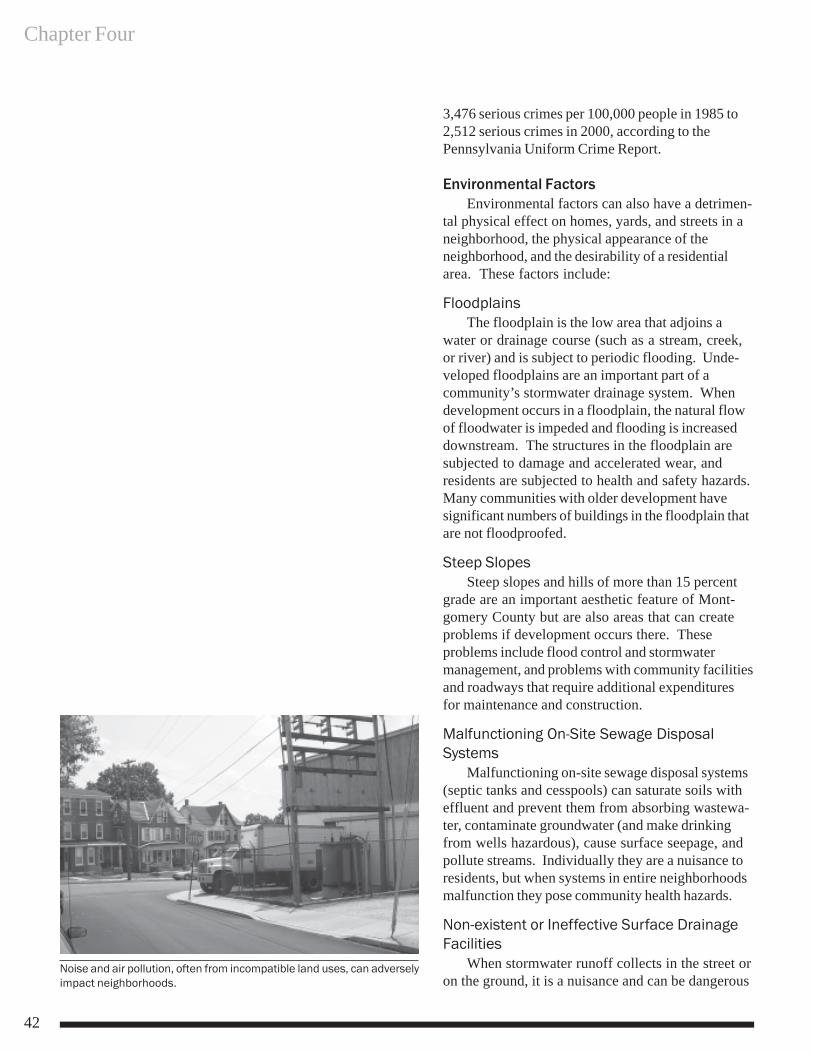
Chapter Four
42
3,476 serious crimes per 100,000 people in 1985 to2,512 serious crimes in 2000, according to thePennsylvania Uniform Crime Report.
Environmental FactorsEnvironmental factors can also have a detrimen-
tal physical effect on homes, yards, and streets in aneighborhood, the physical appearance of theneighborhood, and the desirability of a residentialarea. These factors include:
FloodplainsThe floodplain is the low area that adjoins a
water or drainage course (such as a stream, creek,or river) and is subject to periodic flooding. Unde-veloped floodplains are an important part of acommunity’s stormwater drainage system. Whendevelopment occurs in a floodplain, the natural flowof floodwater is impeded and flooding is increaseddownstream. The structures in the floodplain aresubjected to damage and accelerated wear, andresidents are subjected to health and safety hazards.Many communities with older development havesignificant numbers of buildings in the floodplain thatare not floodproofed.
Steep SlopesSteep slopes and hills of more than 15 percent
grade are an important aesthetic feature of Mont-gomery County but are also areas that can createproblems if development occurs there. Theseproblems include flood control and stormwatermanagement, and problems with community facilitiesand roadways that require additional expendituresfor maintenance and construction.
Malfunctioning On-Site Sewage DisposalSystems
Malfunctioning on-site sewage disposal systems(septic tanks and cesspools) can saturate soils witheffluent and prevent them from absorbing wastewa-ter, contaminate groundwater (and make drinkingfrom wells hazardous), cause surface seepage, andpollute streams. Individually they are a nuisance toresidents, but when systems in entire neighborhoodsmalfunction they pose community health hazards.
Non-existent or Ineffective Surface DrainageFacilities
When stormwater runoff collects in the street oron the ground, it is a nuisance and can be dangerous
Noise and air pollution, often from incompatible land uses, can adverselyimpact neighborhoods.
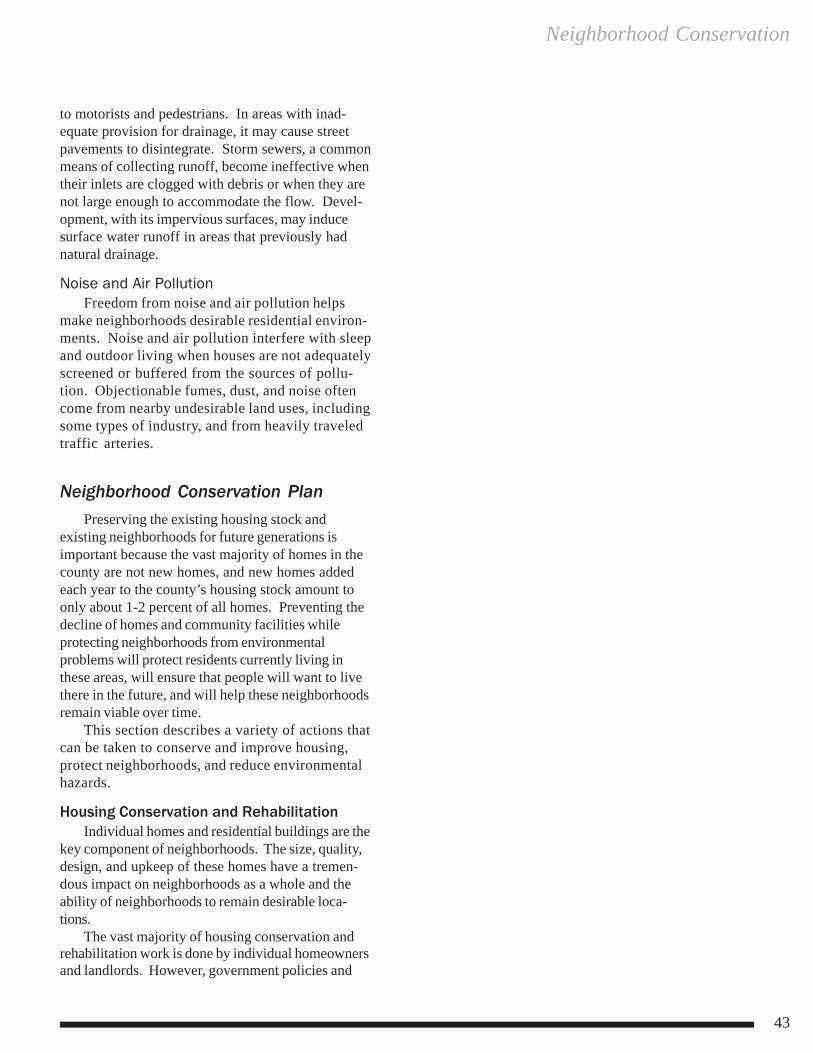
Neighborhood Conservation
43
to motorists and pedestrians. In areas with inad-equate provision for drainage, it may cause streetpavements to disintegrate. Storm sewers, a commonmeans of collecting runoff, become ineffective whentheir inlets are clogged with debris or when they arenot large enough to accommodate the flow. Devel-opment, with its impervious surfaces, may inducesurface water runoff in areas that previously hadnatural drainage.
Noise and Air PollutionFreedom from noise and air pollution helps
make neighborhoods desirable residential environ-ments. Noise and air pollution interfere with sleepand outdoor living when houses are not adequatelyscreened or buffered from the sources of pollu-tion. Objectionable fumes, dust, and noise oftencome from nearby undesirable land uses, includingsome types of industry, and from heavily traveledtraffic arteries.
Neighborhood Conservation PlanPreserving the existing housing stock and
existing neighborhoods for future generations isimportant because the vast majority of homes in thecounty are not new homes, and new homes addedeach year to the county’s housing stock amount toonly about 1-2 percent of all homes. Preventing thedecline of homes and community facilities whileprotecting neighborhoods from environmentalproblems will protect residents currently living inthese areas, will ensure that people will want to livethere in the future, and will help these neighborhoodsremain viable over time.
This section describes a variety of actions thatcan be taken to conserve and improve housing,protect neighborhoods, and reduce environmentalhazards.
Housing Conservation and RehabilitationIndividual homes and residential buildings are the
key component of neighborhoods. The size, quality,design, and upkeep of these homes have a tremen-dous impact on neighborhoods as a whole and theability of neighborhoods to remain desirable loca-tions.
The vast majority of housing conservation andrehabilitation work is done by individual homeownersand landlords. However, government policies and
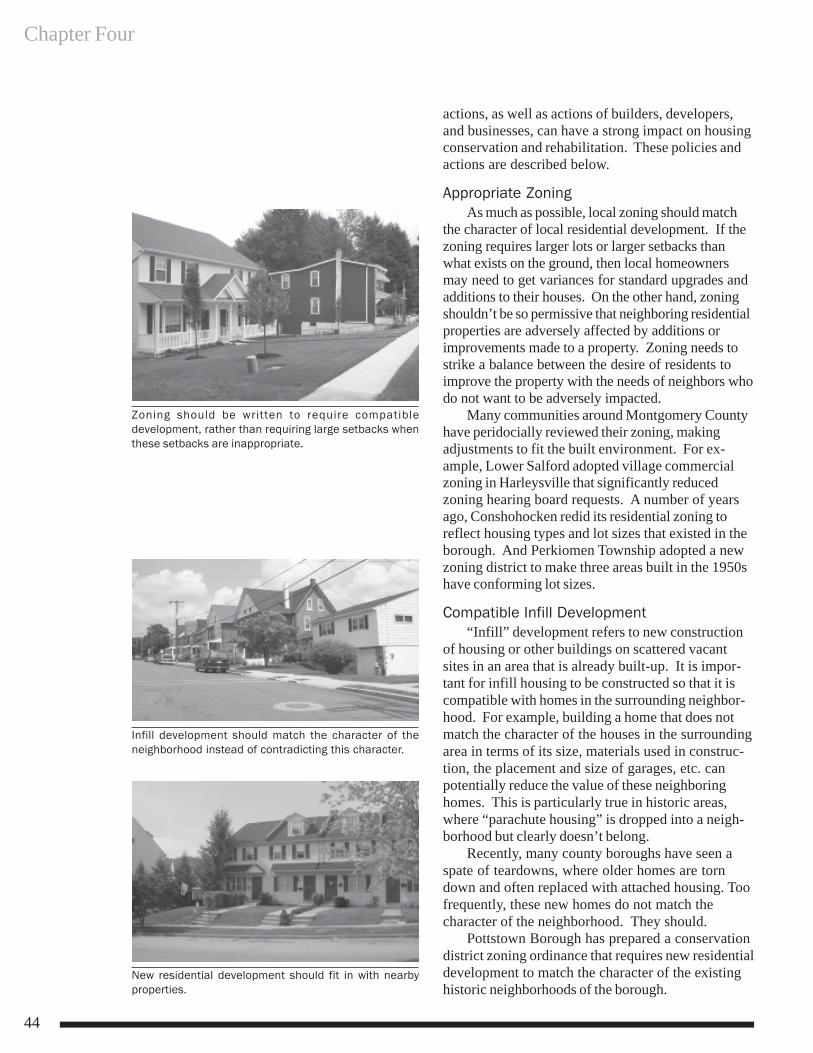
Chapter Four
44
actions, as well as actions of builders, developers,and businesses, can have a strong impact on housingconservation and rehabilitation. These policies andactions are described below.
Appropriate ZoningAs much as possible, local zoning should match
the character of local residential development. If thezoning requires larger lots or larger setbacks thanwhat exists on the ground, then local homeownersmay need to get variances for standard upgrades andadditions to their houses. On the other hand, zoningshouldn’t be so permissive that neighboring residentialproperties are adversely affected by additions orimprovements made to a property. Zoning needs tostrike a balance between the desire of residents toimprove the property with the needs of neighbors whodo not want to be adversely impacted.
Many communities around Montgomery Countyhave peridocially reviewed their zoning, makingadjustments to fit the built environment. For ex-ample, Lower Salford adopted village commercialzoning in Harleysville that significantly reducedzoning hearing board requests. A number of yearsago, Conshohocken redid its residential zoning toreflect housing types and lot sizes that existed in theborough. And Perkiomen Township adopted a newzoning district to make three areas built in the 1950shave conforming lot sizes.
Compatible Infill Development“Infill” development refers to new construction
of housing or other buildings on scattered vacantsites in an area that is already built-up. It is impor-tant for infill housing to be constructed so that it iscompatible with homes in the surrounding neighbor-hood. For example, building a home that does notmatch the character of the houses in the surroundingarea in terms of its size, materials used in construc-tion, the placement and size of garages, etc. canpotentially reduce the value of these neighboringhomes. This is particularly true in historic areas,where “parachute housing” is dropped into a neigh-borhood but clearly doesn’t belong.
Recently, many county boroughs have seen aspate of teardowns, where older homes are torndown and often replaced with attached housing. Toofrequently, these new homes do not match thecharacter of the neighborhood. They should.
Pottstown Borough has prepared a conservationdistrict zoning ordinance that requires new residentialdevelopment to match the character of the existinghistoric neighborhoods of the borough.
New residential development should fit in with nearbyproperties.
Infill development should match the character of theneighborhood instead of contradicting this character.
Zoning should be written to require compatibledevelopment, rather than requiring large setbacks whenthese setbacks are inappropriate.
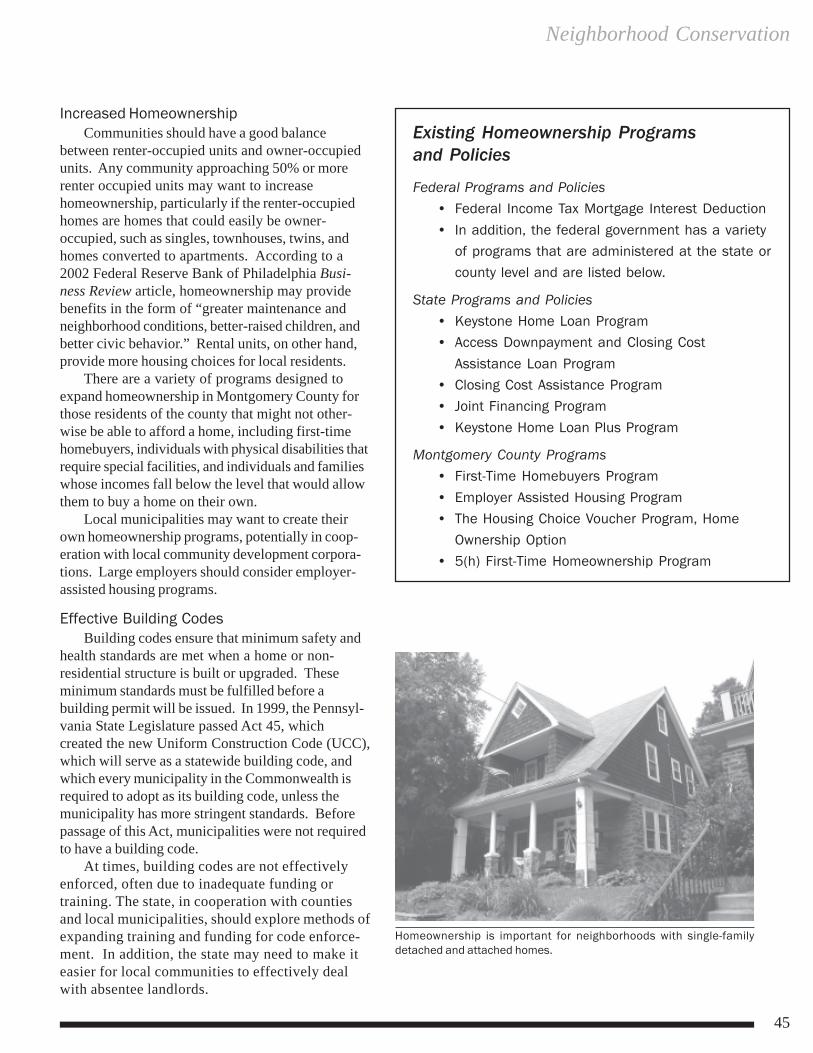
Neighborhood Conservation
45
Increased HomeownershipCommunities should have a good balance
between renter-occupied units and owner-occupiedunits. Any community approaching 50% or morerenter occupied units may want to increasehomeownership, particularly if the renter-occupiedhomes are homes that could easily be owner-occupied, such as singles, townhouses, twins, andhomes converted to apartments. According to a2002 Federal Reserve Bank of Philadelphia Busi-ness Review article, homeownership may providebenefits in the form of “greater maintenance andneighborhood conditions, better-raised children, andbetter civic behavior.” Rental units, on other hand,provide more housing choices for local residents.
There are a variety of programs designed toexpand homeownership in Montgomery County forthose residents of the county that might not other-wise be able to afford a home, including first-timehomebuyers, individuals with physical disabilities thatrequire special facilities, and individuals and familieswhose incomes fall below the level that would allowthem to buy a home on their own.
Local municipalities may want to create theirown homeownership programs, potentially in coop-eration with local community development corpora-tions. Large employers should consider employer-assisted housing programs.
Effective Building CodesBuilding codes ensure that minimum safety and
health standards are met when a home or non-residential structure is built or upgraded. Theseminimum standards must be fulfilled before abuilding permit will be issued. In 1999, the Pennsyl-vania State Legislature passed Act 45, whichcreated the new Uniform Construction Code (UCC),which will serve as a statewide building code, andwhich every municipality in the Commonwealth isrequired to adopt as its building code, unless themunicipality has more stringent standards. Beforepassage of this Act, municipalities were not requiredto have a building code.
At times, building codes are not effectivelyenforced, often due to inadequate funding ortraining. The state, in cooperation with countiesand local municipalities, should explore methods ofexpanding training and funding for code enforce-ment. In addition, the state may need to make iteasier for local communities to effectively dealwith absentee landlords.
Existing Homeownership Programsand Policies
Federal Programs and Policies• Federal Income Tax Mortgage Interest Deduction
• In addition, the federal government has a varietyof programs that are administered at the state orcounty level and are listed below.
State Programs and Policies• Keystone Home Loan Program• Access Downpayment and Closing Cost
Assistance Loan Program• Closing Cost Assistance Program• Joint Financing Program
• Keystone Home Loan Plus Program
Montgomery County Programs• First-Time Homebuyers Program
• Employer Assisted Housing Program• The Housing Choice Voucher Program, Home
Ownership Option• 5(h) First-Time Homeownership Program
Homeownership is important for neighborhoods with single-familydetached and attached homes.
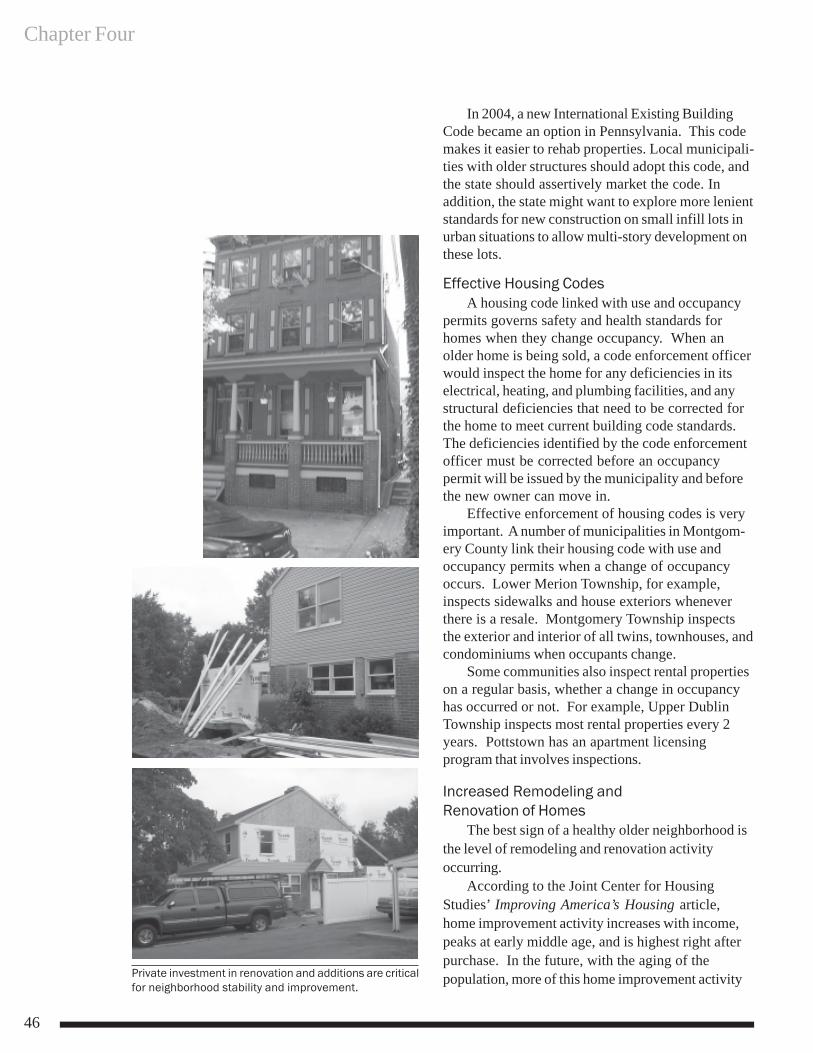
Chapter Four
46
In 2004, a new International Existing BuildingCode became an option in Pennsylvania. This codemakes it easier to rehab properties. Local municipali-ties with older structures should adopt this code, andthe state should assertively market the code. Inaddition, the state might want to explore more lenientstandards for new construction on small infill lots inurban situations to allow multi-story development onthese lots.
Effective Housing CodesA housing code linked with use and occupancy
permits governs safety and health standards forhomes when they change occupancy. When anolder home is being sold, a code enforcement officerwould inspect the home for any deficiencies in itselectrical, heating, and plumbing facilities, and anystructural deficiencies that need to be corrected forthe home to meet current building code standards.The deficiencies identified by the code enforcementofficer must be corrected before an occupancypermit will be issued by the municipality and beforethe new owner can move in.
Effective enforcement of housing codes is veryimportant. A number of municipalities in Montgom-ery County link their housing code with use andoccupancy permits when a change of occupancyoccurs. Lower Merion Township, for example,inspects sidewalks and house exteriors wheneverthere is a resale. Montgomery Township inspectsthe exterior and interior of all twins, townhouses, andcondominiums when occupants change.
Some communities also inspect rental propertieson a regular basis, whether a change in occupancyhas occurred or not. For example, Upper DublinTownship inspects most rental properties every 2years. Pottstown has an apartment licensingprogram that involves inspections.
Increased Remodeling andRenovation of Homes
The best sign of a healthy older neighborhood isthe level of remodeling and renovation activityoccurring.
According to the Joint Center for HousingStudies’ Improving America’s Housing article,home improvement activity increases with income,peaks at early middle age, and is highest right afterpurchase. In the future, with the aging of thepopulation, more of this home improvement activityPrivate investment in renovation and additions are critical
for neighborhood stability and improvement.
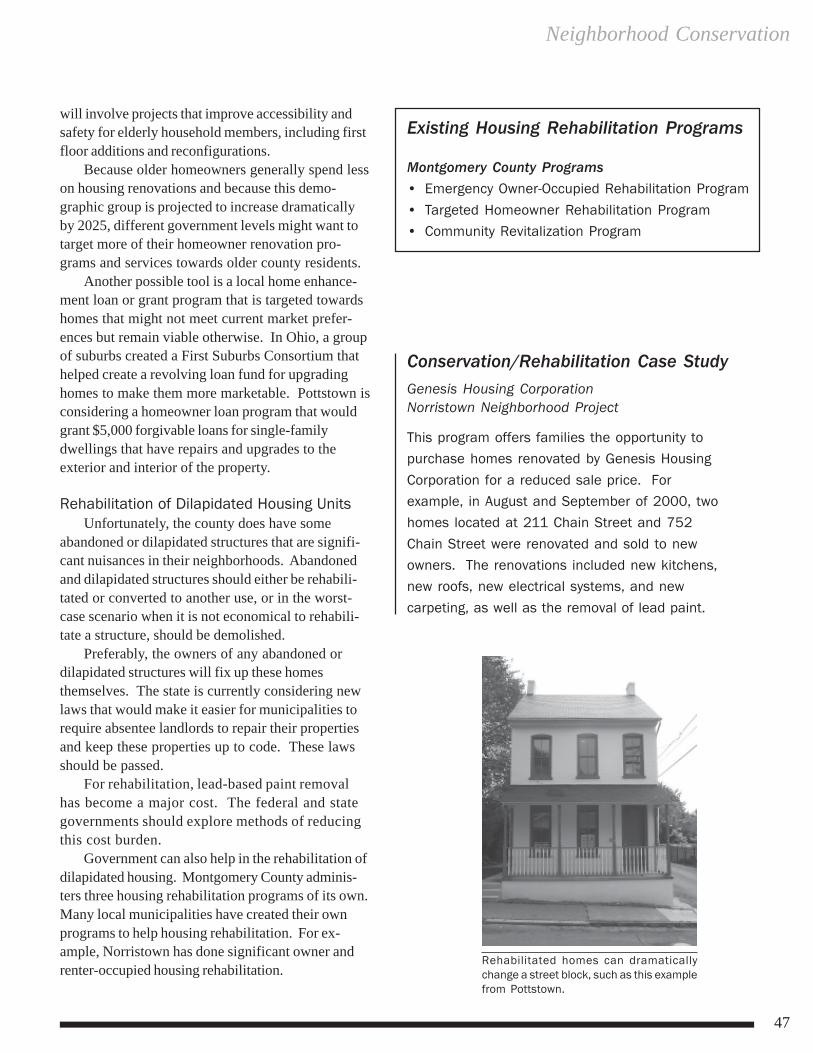
Neighborhood Conservation
47
will involve projects that improve accessibility andsafety for elderly household members, including firstfloor additions and reconfigurations.
Because older homeowners generally spend lesson housing renovations and because this demo-graphic group is projected to increase dramaticallyby 2025, different government levels might want totarget more of their homeowner renovation pro-grams and services towards older county residents.
Another possible tool is a local home enhance-ment loan or grant program that is targeted towardshomes that might not meet current market prefer-ences but remain viable otherwise. In Ohio, a groupof suburbs created a First Suburbs Consortium thathelped create a revolving loan fund for upgradinghomes to make them more marketable. Pottstown isconsidering a homeowner loan program that wouldgrant $5,000 forgivable loans for single-familydwellings that have repairs and upgrades to theexterior and interior of the property.
Rehabilitation of Dilapidated Housing UnitsUnfortunately, the county does have some
abandoned or dilapidated structures that are signifi-cant nuisances in their neighborhoods. Abandonedand dilapidated structures should either be rehabili-tated or converted to another use, or in the worst-case scenario when it is not economical to rehabili-tate a structure, should be demolished.
Preferably, the owners of any abandoned ordilapidated structures will fix up these homesthemselves. The state is currently considering newlaws that would make it easier for municipalities torequire absentee landlords to repair their propertiesand keep these properties up to code. These lawsshould be passed.
For rehabilitation, lead-based paint removalhas become a major cost. The federal and stategovernments should explore methods of reducingthis cost burden.
Government can also help in the rehabilitation ofdilapidated housing. Montgomery County adminis-ters three housing rehabilitation programs of its own.Many local municipalities have created their ownprograms to help housing rehabilitation. For ex-ample, Norristown has done significant owner andrenter-occupied housing rehabilitation.
Existing Housing Rehabilitation Programs
Montgomery County Programs• Emergency Owner-Occupied Rehabilitation Program
• Targeted Homeowner Rehabilitation Program• Community Revitalization Program
Conservation/Rehabilitation Case StudyGenesis Housing CorporationNorristown Neighborhood Project
This program offers families the opportunity topurchase homes renovated by Genesis Housing
Corporation for a reduced sale price. Forexample, in August and September of 2000, twohomes located at 211 Chain Street and 752
Chain Street were renovated and sold to newowners. The renovations included new kitchens,new roofs, new electrical systems, and new
carpeting, as well as the removal of lead paint.
Rehabilitated homes can dramaticallychange a street block, such as this examplefrom Pottstown.
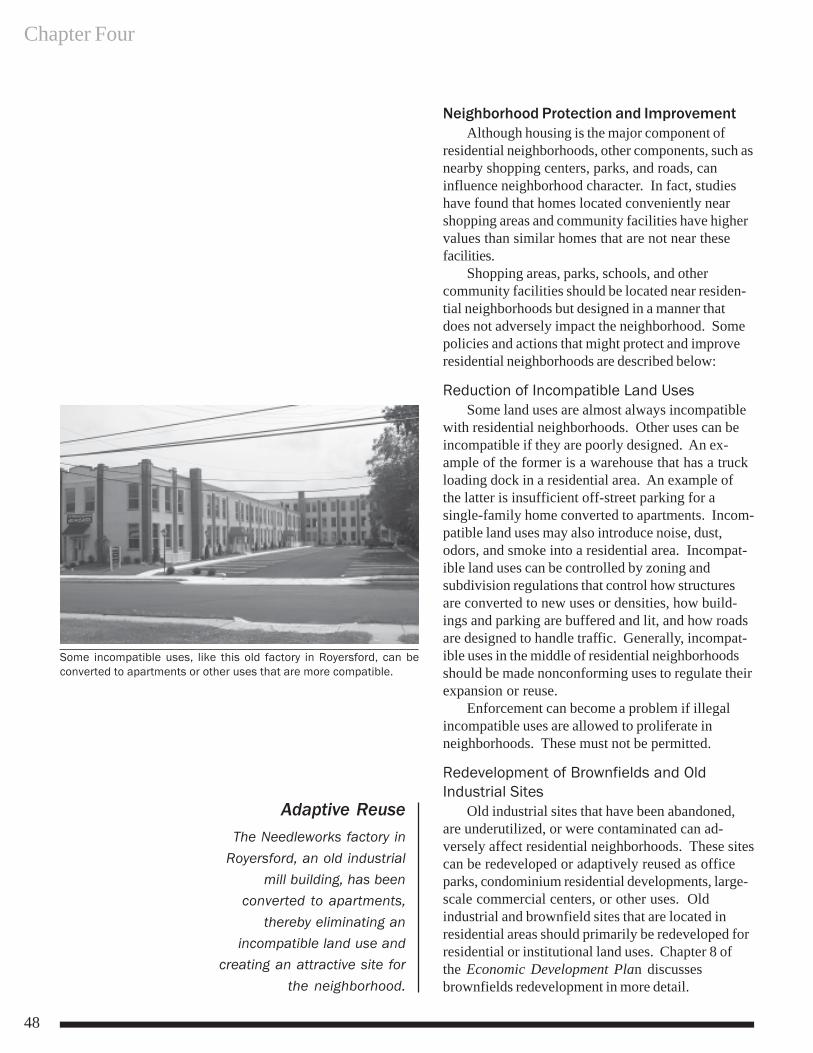
Chapter Four
48
Neighborhood Protection and ImprovementAlthough housing is the major component of
residential neighborhoods, other components, such asnearby shopping centers, parks, and roads, caninfluence neighborhood character. In fact, studieshave found that homes located conveniently nearshopping areas and community facilities have highervalues than similar homes that are not near thesefacilities.
Shopping areas, parks, schools, and othercommunity facilities should be located near residen-tial neighborhoods but designed in a manner thatdoes not adversely impact the neighborhood. Somepolicies and actions that might protect and improveresidential neighborhoods are described below:
Reduction of Incompatible Land UsesSome land uses are almost always incompatible
with residential neighborhoods. Other uses can beincompatible if they are poorly designed. An ex-ample of the former is a warehouse that has a truckloading dock in a residential area. An example ofthe latter is insufficient off-street parking for asingle-family home converted to apartments. Incom-patible land uses may also introduce noise, dust,odors, and smoke into a residential area. Incompat-ible land uses can be controlled by zoning andsubdivision regulations that control how structuresare converted to new uses or densities, how build-ings and parking are buffered and lit, and how roadsare designed to handle traffic. Generally, incompat-ible uses in the middle of residential neighborhoodsshould be made nonconforming uses to regulate theirexpansion or reuse.
Enforcement can become a problem if illegalincompatible uses are allowed to proliferate inneighborhoods. These must not be permitted.
Redevelopment of Brownfields and OldIndustrial Sites
Old industrial sites that have been abandoned,are underutilized, or were contaminated can ad-versely affect residential neighborhoods. These sitescan be redeveloped or adaptively reused as officeparks, condominium residential developments, large-scale commercial centers, or other uses. Oldindustrial and brownfield sites that are located inresidential areas should primarily be redeveloped forresidential or institutional land uses. Chapter 8 ofthe Economic Development Plan discussesbrownfields redevelopment in more detail.
Some incompatible uses, like this old factory in Royersford, can beconverted to apartments or other uses that are more compatible.
Adaptive ReuseThe Needleworks factory in
Royersford, an old industrialmill building, has been
converted to apartments,thereby eliminating an
incompatible land use andcreating an attractive site for
the neighborhood.
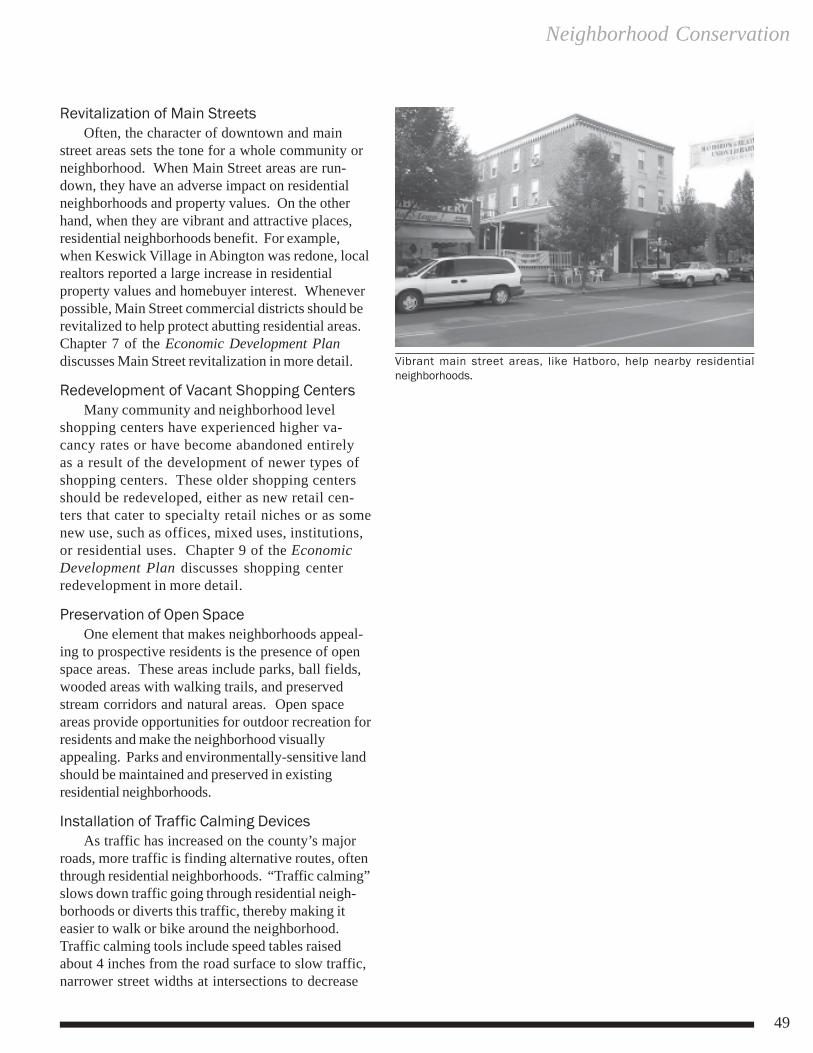
Neighborhood Conservation
49
Revitalization of Main StreetsOften, the character of downtown and main
street areas sets the tone for a whole community orneighborhood. When Main Street areas are run-down, they have an adverse impact on residentialneighborhoods and property values. On the otherhand, when they are vibrant and attractive places,residential neighborhoods benefit. For example,when Keswick Village in Abington was redone, localrealtors reported a large increase in residentialproperty values and homebuyer interest. Wheneverpossible, Main Street commercial districts should berevitalized to help protect abutting residential areas.Chapter 7 of the Economic Development Plandiscusses Main Street revitalization in more detail.
Redevelopment of Vacant Shopping CentersMany community and neighborhood level
shopping centers have experienced higher va-cancy rates or have become abandoned entirelyas a result of the development of newer types ofshopping centers. These older shopping centersshould be redeveloped, either as new retail cen-ters that cater to specialty retail niches or as somenew use, such as offices, mixed uses, institutions,or residential uses. Chapter 9 of the EconomicDevelopment Plan discusses shopping centerredevelopment in more detail.
Preservation of Open SpaceOne element that makes neighborhoods appeal-
ing to prospective residents is the presence of openspace areas. These areas include parks, ball fields,wooded areas with walking trails, and preservedstream corridors and natural areas. Open spaceareas provide opportunities for outdoor recreation forresidents and make the neighborhood visuallyappealing. Parks and environmentally-sensitive landshould be maintained and preserved in existingresidential neighborhoods.
Installation of Traffic Calming DevicesAs traffic has increased on the county’s major
roads, more traffic is finding alternative routes, oftenthrough residential neighborhoods. “Traffic calming”slows down traffic going through residential neigh-borhoods or diverts this traffic, thereby making iteasier to walk or bike around the neighborhood.Traffic calming tools include speed tables raisedabout 4 inches from the road surface to slow traffic,narrower street widths at intersections to decrease
Vibrant main street areas, like Hatboro, help nearby residentialneighborhoods.
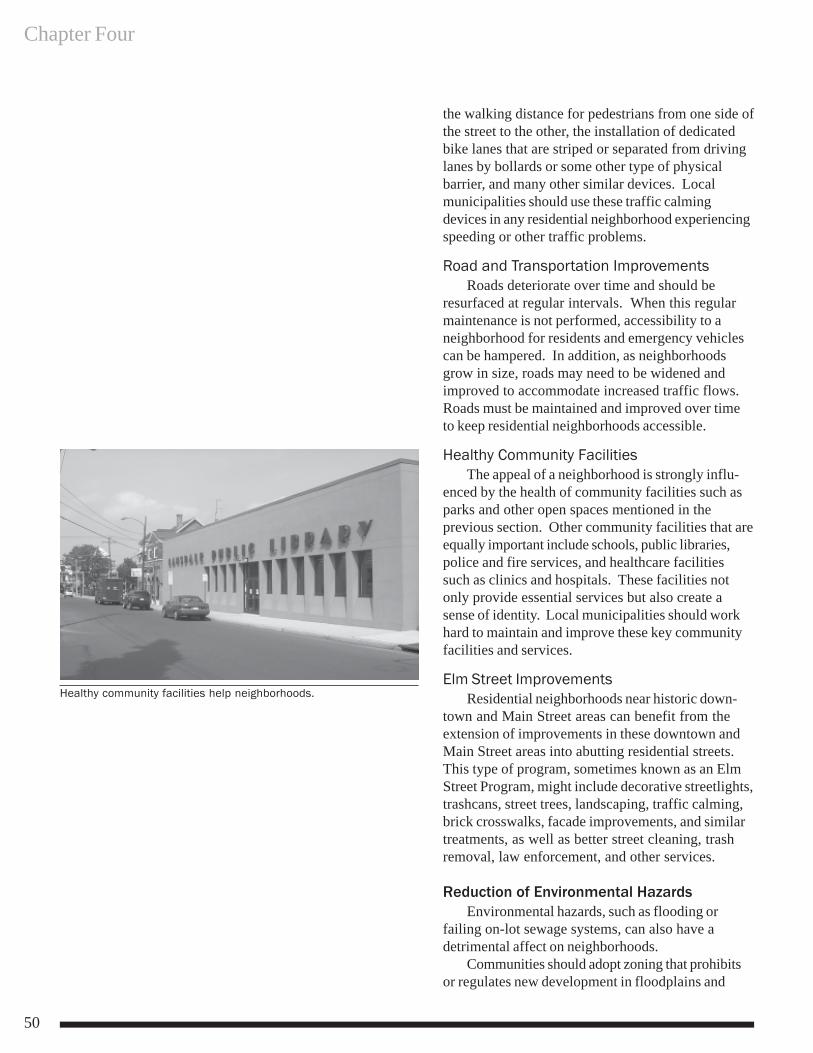
Chapter Four
50
the walking distance for pedestrians from one side ofthe street to the other, the installation of dedicatedbike lanes that are striped or separated from drivinglanes by bollards or some other type of physicalbarrier, and many other similar devices. Localmunicipalities should use these traffic calmingdevices in any residential neighborhood experiencingspeeding or other traffic problems.
Road and Transportation ImprovementsRoads deteriorate over time and should be
resurfaced at regular intervals. When this regularmaintenance is not performed, accessibility to aneighborhood for residents and emergency vehiclescan be hampered. In addition, as neighborhoodsgrow in size, roads may need to be widened andimproved to accommodate increased traffic flows.Roads must be maintained and improved over timeto keep residential neighborhoods accessible.
Healthy Community FacilitiesThe appeal of a neighborhood is strongly influ-
enced by the health of community facilities such asparks and other open spaces mentioned in theprevious section. Other community facilities that areequally important include schools, public libraries,police and fire services, and healthcare facilitiessuch as clinics and hospitals. These facilities notonly provide essential services but also create asense of identity. Local municipalities should workhard to maintain and improve these key communityfacilities and services.
Elm Street ImprovementsResidential neighborhoods near historic down-
town and Main Street areas can benefit from theextension of improvements in these downtown andMain Street areas into abutting residential streets.This type of program, sometimes known as an ElmStreet Program, might include decorative streetlights,trashcans, street trees, landscaping, traffic calming,brick crosswalks, facade improvements, and similartreatments, as well as better street cleaning, trashremoval, law enforcement, and other services.
Reduction of Environmental HazardsEnvironmental hazards, such as flooding or
failing on-lot sewage systems, can also have adetrimental affect on neighborhoods.
Communities should adopt zoning that prohibitsor regulates new development in floodplains and
Healthy community facilities help neighborhoods.
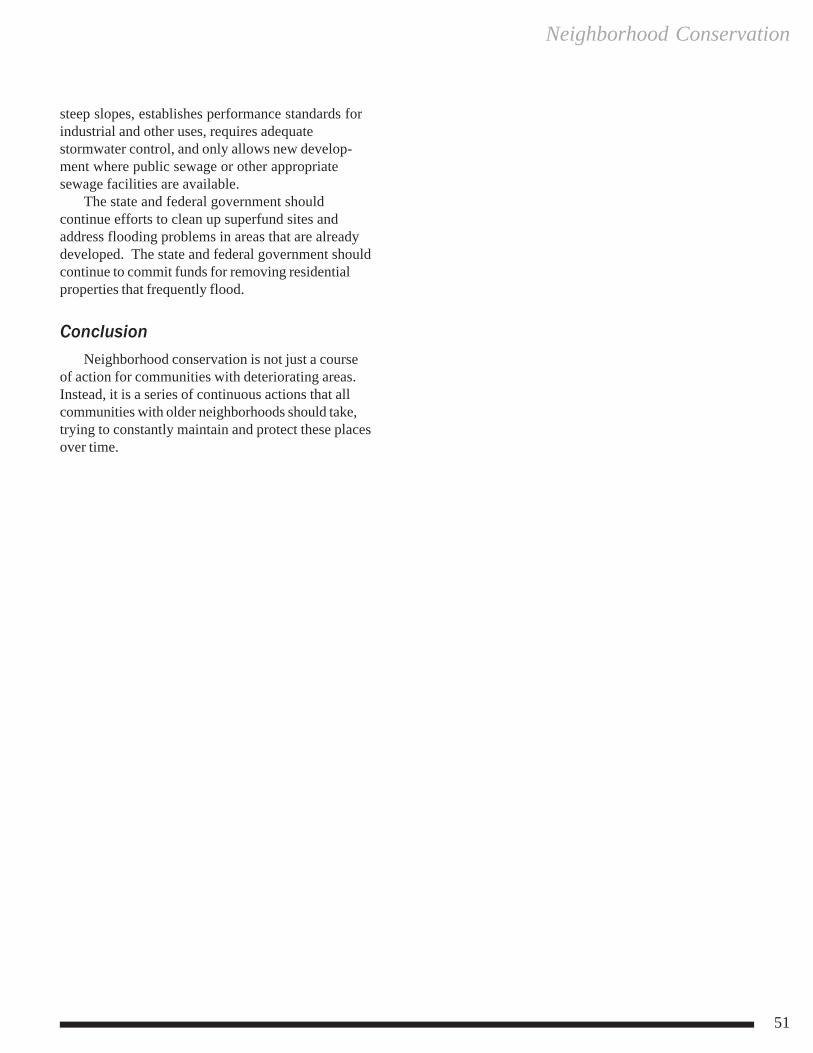
Neighborhood Conservation
51
steep slopes, establishes performance standards forindustrial and other uses, requires adequatestormwater control, and only allows new develop-ment where public sewage or other appropriatesewage facilities are available.
The state and federal government shouldcontinue efforts to clean up superfund sites andaddress flooding problems in areas that are alreadydeveloped. The state and federal government shouldcontinue to commit funds for removing residentialproperties that frequently flood.
ConclusionNeighborhood conservation is not just a course
of action for communities with deteriorating areas.Instead, it is a series of continuous actions that allcommunities with older neighborhoods should take,trying to constantly maintain and protect these placesover time.

Chapter Four
52
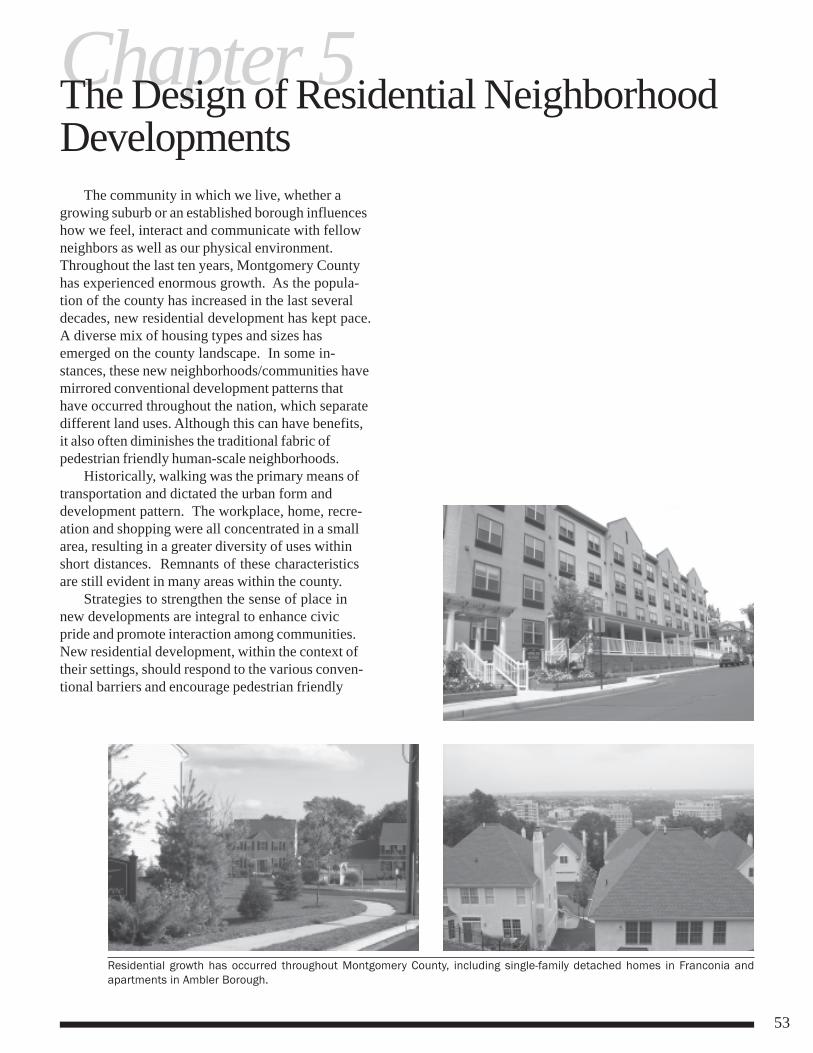
53
Chapter 5The Design of Residential NeighborhoodDevelopments
The community in which we live, whether agrowing suburb or an established borough influenceshow we feel, interact and communicate with fellowneighbors as well as our physical environment.Throughout the last ten years, Montgomery Countyhas experienced enormous growth. As the popula-tion of the county has increased in the last severaldecades, new residential development has kept pace.A diverse mix of housing types and sizes hasemerged on the county landscape. In some in-stances, these new neighborhoods/communities havemirrored conventional development patterns thathave occurred throughout the nation, which separatedifferent land uses. Although this can have benefits,it also often diminishes the traditional fabric ofpedestrian friendly human-scale neighborhoods.
Historically, walking was the primary means oftransportation and dictated the urban form anddevelopment pattern. The workplace, home, recre-ation and shopping were all concentrated in a smallarea, resulting in a greater diversity of uses withinshort distances. Remnants of these characteristicsare still evident in many areas within the county.
Strategies to strengthen the sense of place innew developments are integral to enhance civicpride and promote interaction among communities.New residential development, within the context oftheir settings, should respond to the various conven-tional barriers and encourage pedestrian friendly
Residential growth has occurred throughout Montgomery County, including single-family detached homes in Franconia andapartments in Ambler Borough.
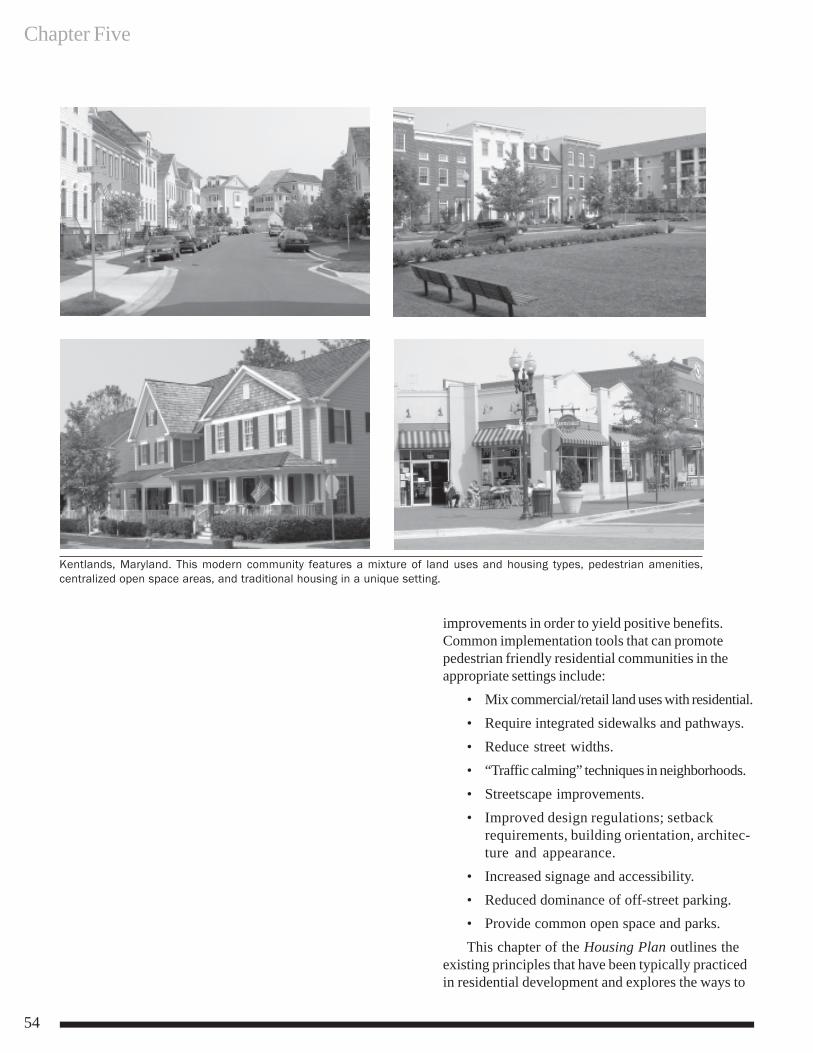
Chapter Five
54
improvements in order to yield positive benefits.Common implementation tools that can promotepedestrian friendly residential communities in theappropriate settings include:
• Mix commercial/retail land uses with residential.• Require integrated sidewalks and pathways.• Reduce street widths.• “Traffic calming” techniques in neighborhoods.• Streetscape improvements.• Improved design regulations; setback
requirements, building orientation, architec-ture and appearance.
• Increased signage and accessibility.• Reduced dominance of off-street parking.• Provide common open space and parks.This chapter of the Housing Plan outlines the
existing principles that have been typically practicedin residential development and explores the ways to
Kentlands, Maryland. This modern community features a mixture of land uses and housing types, pedestrian amenities,centralized open space areas, and traditional housing in a unique setting.
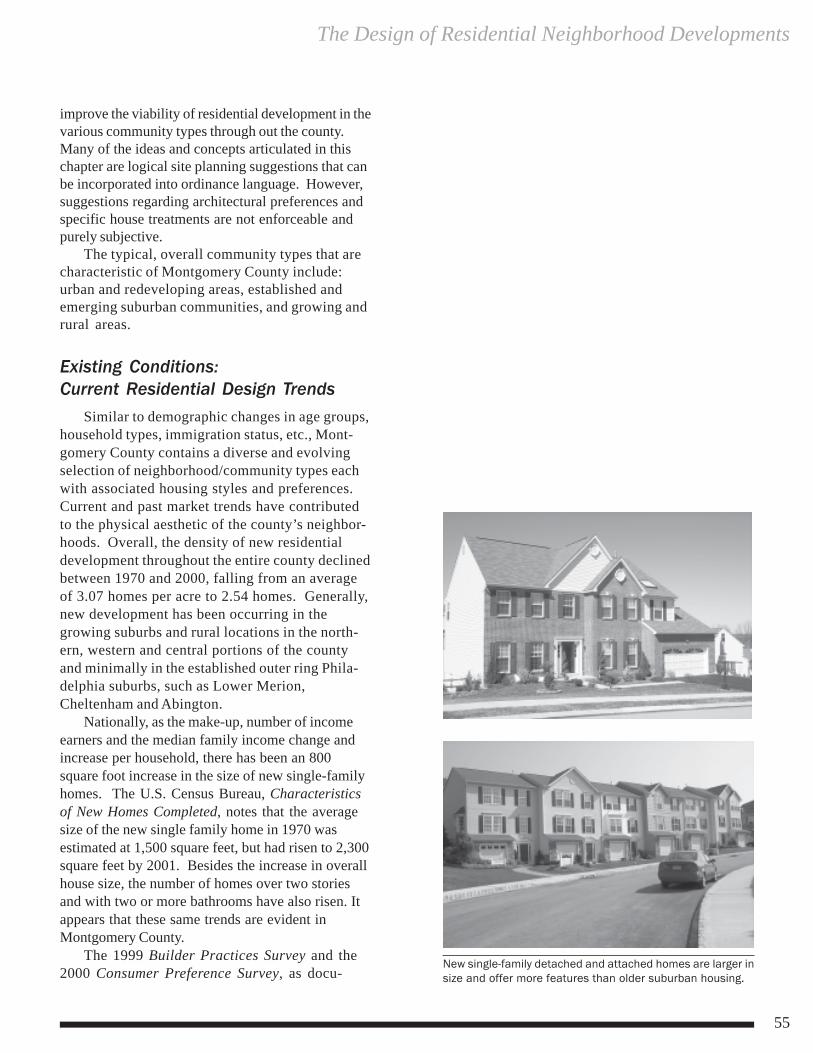
The Design of Residential Neighborhood Developments
55
improve the viability of residential development in thevarious community types through out the county.Many of the ideas and concepts articulated in thischapter are logical site planning suggestions that canbe incorporated into ordinance language. However,suggestions regarding architectural preferences andspecific house treatments are not enforceable andpurely subjective.
The typical, overall community types that arecharacteristic of Montgomery County include:urban and redeveloping areas, established andemerging suburban communities, and growing andrural areas.
Existing Conditions:Current Residential Design Trends
Similar to demographic changes in age groups,household types, immigration status, etc., Mont-gomery County contains a diverse and evolvingselection of neighborhood/community types eachwith associated housing styles and preferences.Current and past market trends have contributedto the physical aesthetic of the county’s neighbor-hoods. Overall, the density of new residentialdevelopment throughout the entire county declinedbetween 1970 and 2000, falling from an averageof 3.07 homes per acre to 2.54 homes. Generally,new development has been occurring in thegrowing suburbs and rural locations in the north-ern, western and central portions of the countyand minimally in the established outer ring Phila-delphia suburbs, such as Lower Merion,Cheltenham and Abington.
Nationally, as the make-up, number of incomeearners and the median family income change andincrease per household, there has been an 800square foot increase in the size of new single-familyhomes. The U.S. Census Bureau, Characteristicsof New Homes Completed, notes that the averagesize of the new single family home in 1970 wasestimated at 1,500 square feet, but had risen to 2,300square feet by 2001. Besides the increase in overallhouse size, the number of homes over two storiesand with two or more bathrooms have also risen. Itappears that these same trends are evident inMontgomery County.
The 1999 Builder Practices Survey and the2000 Consumer Preference Survey, as docu-
New single-family detached and attached homes are larger insize and offer more features than older suburban housing.
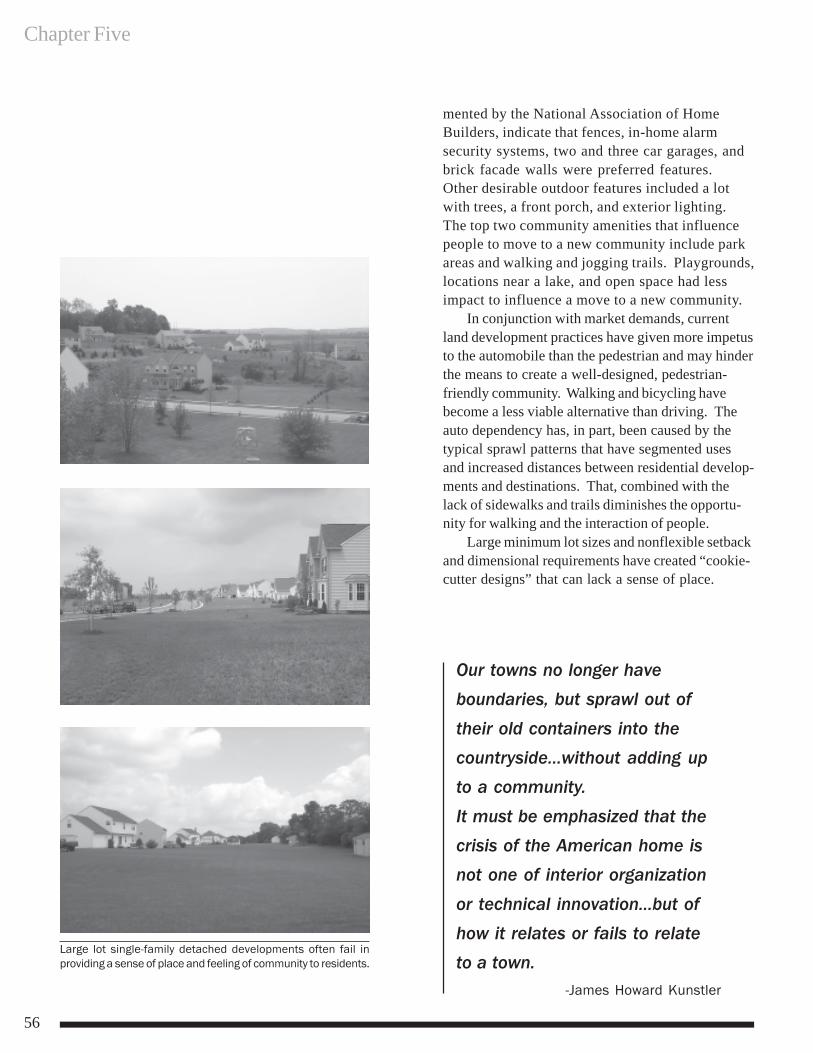
Chapter Five
56
mented by the National Association of HomeBuilders, indicate that fences, in-home alarmsecurity systems, two and three car garages, andbrick facade walls were preferred features.Other desirable outdoor features included a lotwith trees, a front porch, and exterior lighting.The top two community amenities that influencepeople to move to a new community include parkareas and walking and jogging trails. Playgrounds,locations near a lake, and open space had lessimpact to influence a move to a new community.
In conjunction with market demands, currentland development practices have given more impetusto the automobile than the pedestrian and may hinderthe means to create a well-designed, pedestrian-friendly community. Walking and bicycling havebecome a less viable alternative than driving. Theauto dependency has, in part, been caused by thetypical sprawl patterns that have segmented usesand increased distances between residential develop-ments and destinations. That, combined with thelack of sidewalks and trails diminishes the opportu-nity for walking and the interaction of people.
Large minimum lot sizes and nonflexible setbackand dimensional requirements have created “cookie-cutter designs” that can lack a sense of place.
Large lot single-family detached developments often fail inproviding a sense of place and feeling of community to residents.
Our towns no longer haveboundaries, but sprawl out of
their old containers into thecountryside…without adding upto a community.
It must be emphasized that thecrisis of the American home isnot one of interior organization
or technical innovation…but ofhow it relates or fails to relateto a town.
-James Howard Kunstler
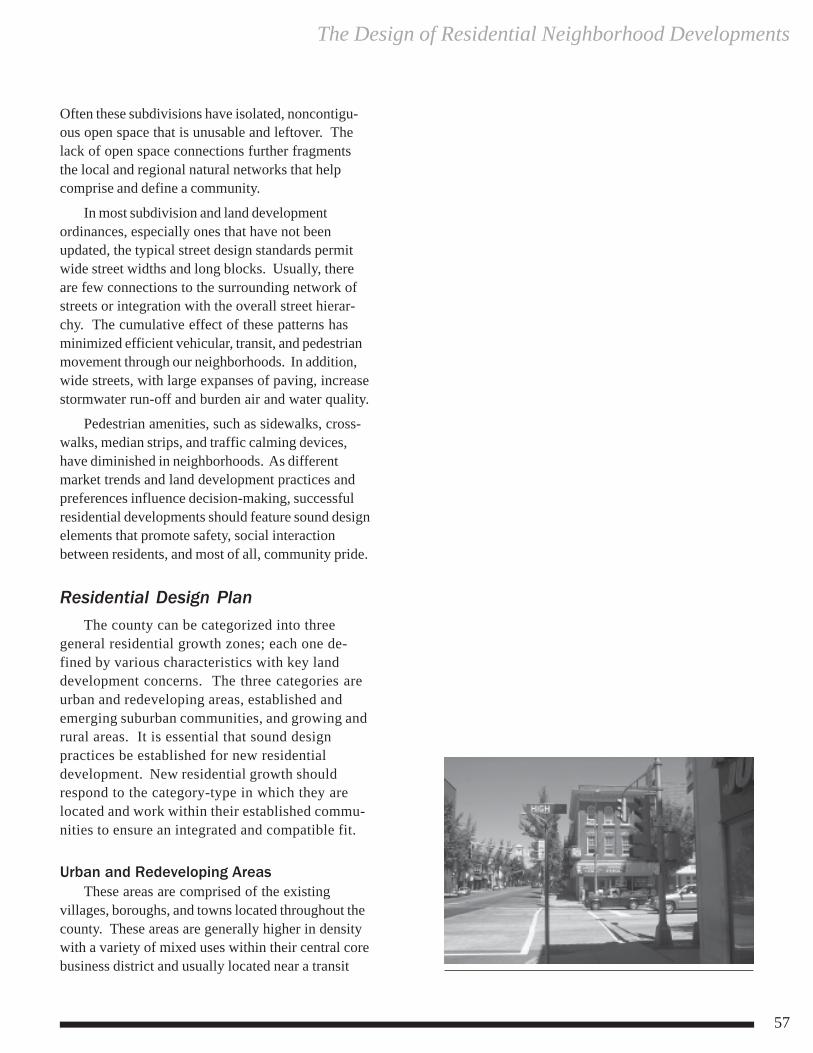
The Design of Residential Neighborhood Developments
57
Often these subdivisions have isolated, noncontigu-ous open space that is unusable and leftover. Thelack of open space connections further fragmentsthe local and regional natural networks that helpcomprise and define a community.
In most subdivision and land developmentordinances, especially ones that have not beenupdated, the typical street design standards permitwide street widths and long blocks. Usually, thereare few connections to the surrounding network ofstreets or integration with the overall street hierar-chy. The cumulative effect of these patterns hasminimized efficient vehicular, transit, and pedestrianmovement through our neighborhoods. In addition,wide streets, with large expanses of paving, increasestormwater run-off and burden air and water quality.
Pedestrian amenities, such as sidewalks, cross-walks, median strips, and traffic calming devices,have diminished in neighborhoods. As differentmarket trends and land development practices andpreferences influence decision-making, successfulresidential developments should feature sound designelements that promote safety, social interactionbetween residents, and most of all, community pride.
Residential Design PlanThe county can be categorized into three
general residential growth zones; each one de-fined by various characteristics with key landdevelopment concerns. The three categories areurban and redeveloping areas, established andemerging suburban communities, and growing andrural areas. It is essential that sound designpractices be established for new residentialdevelopment. New residential growth shouldrespond to the category-type in which they arelocated and work within their established commu-nities to ensure an integrated and compatible fit.
Urban and Redeveloping AreasThese areas are comprised of the existing
villages, boroughs, and towns located throughout thecounty. These areas are generally higher in densitywith a variety of mixed uses within their central corebusiness district and usually located near a transit
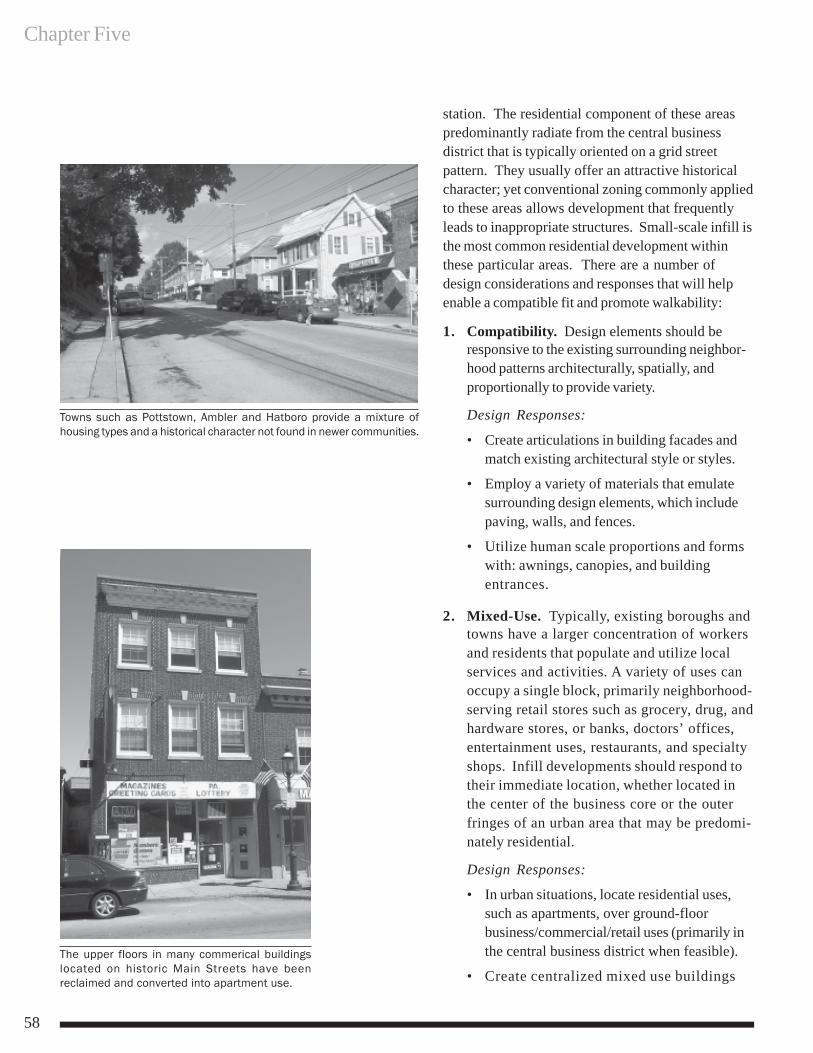
Chapter Five
58
station. The residential component of these areaspredominantly radiate from the central businessdistrict that is typically oriented on a grid streetpattern. They usually offer an attractive historicalcharacter; yet conventional zoning commonly appliedto these areas allows development that frequentlyleads to inappropriate structures. Small-scale infill isthe most common residential development withinthese particular areas. There are a number ofdesign considerations and responses that will helpenable a compatible fit and promote walkability:
1. Compatibility. Design elements should beresponsive to the existing surrounding neighbor-hood patterns architecturally, spatially, andproportionally to provide variety.
Design Responses:
• Create articulations in building facades andmatch existing architectural style or styles.
• Employ a variety of materials that emulatesurrounding design elements, which includepaving, walls, and fences.
• Utilize human scale proportions and formswith: awnings, canopies, and buildingentrances.
2. Mixed-Use. Typically, existing boroughs andtowns have a larger concentration of workersand residents that populate and utilize localservices and activities. A variety of uses canoccupy a single block, primarily neighborhood-serving retail stores such as grocery, drug, andhardware stores, or banks, doctors’ offices,entertainment uses, restaurants, and specialtyshops. Infill developments should respond totheir immediate location, whether located inthe center of the business core or the outerfringes of an urban area that may be predomi-nately residential.
Design Responses:
• In urban situations, locate residential uses,such as apartments, over ground-floorbusiness/commercial/retail uses (primarily inthe central business district when feasible).
• Create centralized mixed use buildingsThe upper floors in many commerical buildingslocated on historic Main Streets have beenreclaimed and converted into apartment use.
Towns such as Pottstown, Ambler and Hatboro provide a mixture ofhousing types and a historical character not found in newer communities.
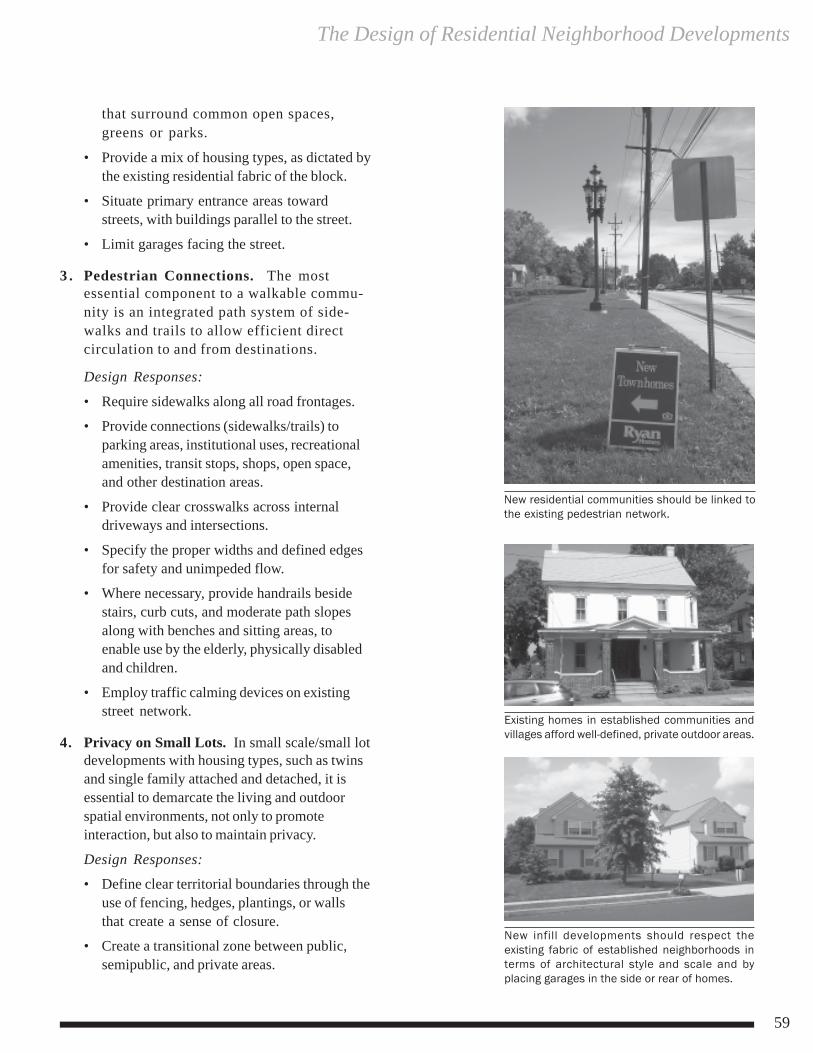
The Design of Residential Neighborhood Developments
59
that surround common open spaces,greens or parks.
• Provide a mix of housing types, as dictated bythe existing residential fabric of the block.
• Situate primary entrance areas towardstreets, with buildings parallel to the street.
• Limit garages facing the street.
3 . Pedestrian Connections. The mostessential component to a walkable commu-nity is an integrated path system of side-walks and trails to allow efficient directcirculation to and from destinations.
Design Responses:
• Require sidewalks along all road frontages.
• Provide connections (sidewalks/trails) toparking areas, institutional uses, recreationalamenities, transit stops, shops, open space,and other destination areas.
• Provide clear crosswalks across internaldriveways and intersections.
• Specify the proper widths and defined edgesfor safety and unimpeded flow.
• Where necessary, provide handrails besidestairs, curb cuts, and moderate path slopesalong with benches and sitting areas, toenable use by the elderly, physically disabledand children.
• Employ traffic calming devices on existingstreet network.
4. Privacy on Small Lots. In small scale/small lotdevelopments with housing types, such as twinsand single family attached and detached, it isessential to demarcate the living and outdoorspatial environments, not only to promoteinteraction, but also to maintain privacy.
Design Responses:
• Define clear territorial boundaries through theuse of fencing, hedges, plantings, or wallsthat create a sense of closure.
• Create a transitional zone between public,semipublic, and private areas.
Existing homes in established communities andvillages afford well-defined, private outdoor areas.
New residential communities should be linked tothe existing pedestrian network.
New infill developments should respect theexisting fabric of established neighborhoods interms of architectural style and scale and byplacing garages in the side or rear of homes.
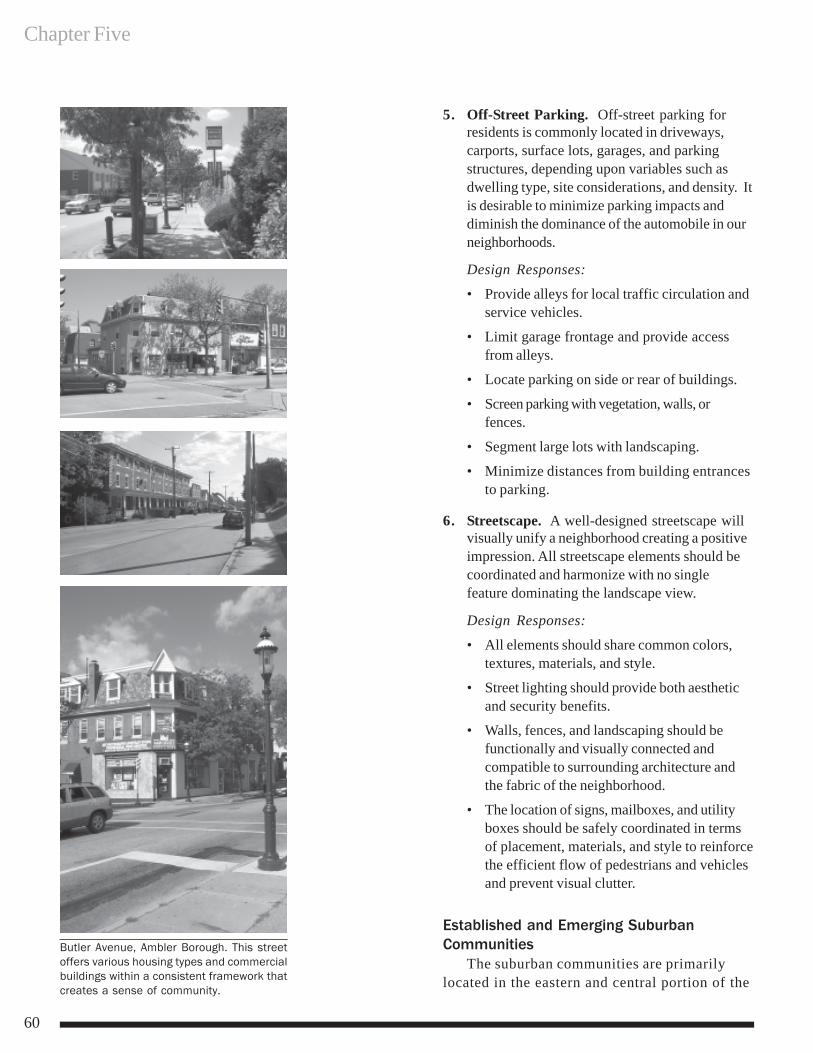
Chapter Five
60
5. Off-Street Parking. Off-street parking forresidents is commonly located in driveways,carports, surface lots, garages, and parkingstructures, depending upon variables such asdwelling type, site considerations, and density. Itis desirable to minimize parking impacts anddiminish the dominance of the automobile in ourneighborhoods.
Design Responses:
• Provide alleys for local traffic circulation andservice vehicles.
• Limit garage frontage and provide accessfrom alleys.
• Locate parking on side or rear of buildings.
• Screen parking with vegetation, walls, orfences.
• Segment large lots with landscaping.
• Minimize distances from building entrancesto parking.
6. Streetscape. A well-designed streetscape willvisually unify a neighborhood creating a positiveimpression. All streetscape elements should becoordinated and harmonize with no singlefeature dominating the landscape view.
Design Responses:
• All elements should share common colors,textures, materials, and style.
• Street lighting should provide both aestheticand security benefits.
• Walls, fences, and landscaping should befunctionally and visually connected andcompatible to surrounding architecture andthe fabric of the neighborhood.
• The location of signs, mailboxes, and utilityboxes should be safely coordinated in termsof placement, materials, and style to reinforcethe efficient flow of pedestrians and vehiclesand prevent visual clutter.
Established and Emerging SuburbanCommunities
The suburban communities are primarilylocated in the eastern and central portion of the
Butler Avenue, Ambler Borough. This streetoffers various housing types and commercialbuildings within a consistent framework thatcreates a sense of community.
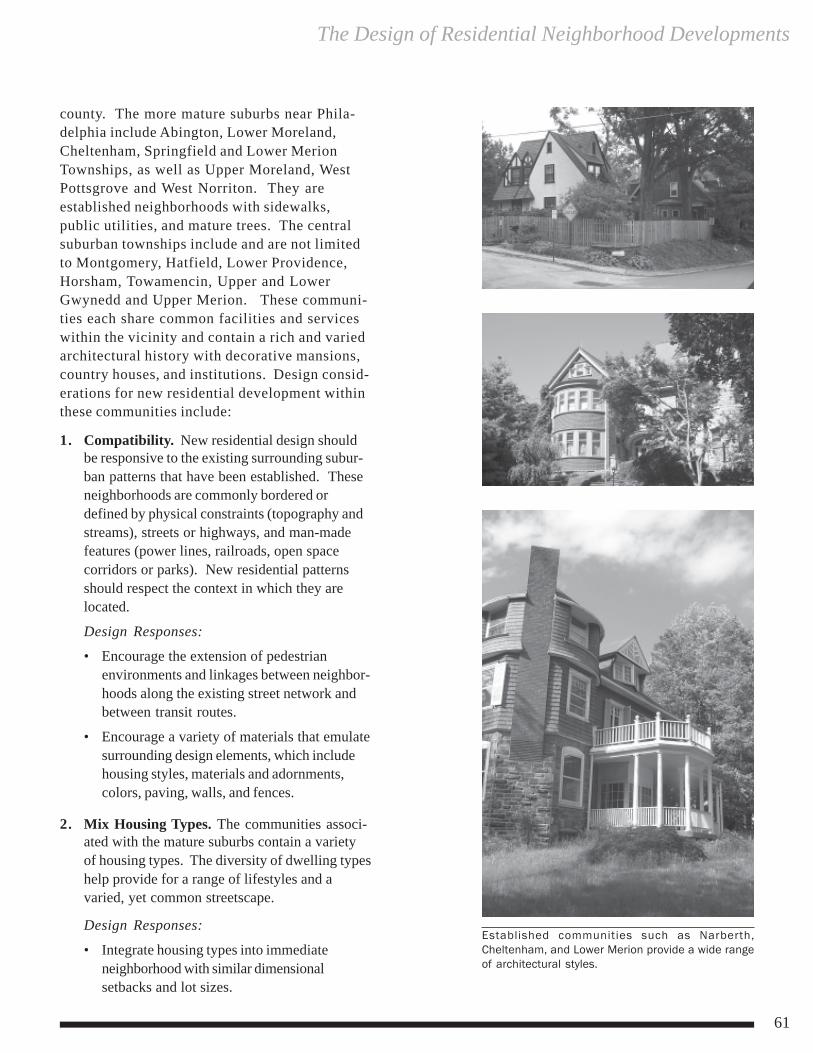
The Design of Residential Neighborhood Developments
61
county. The more mature suburbs near Phila-delphia include Abington, Lower Moreland,Cheltenham, Springfield and Lower MerionTownships, as well as Upper Moreland, WestPottsgrove and West Norriton. They areestablished neighborhoods with sidewalks,public utilities, and mature trees. The centralsuburban townships include and are not limitedto Montgomery, Hatfield, Lower Providence,Horsham, Towamencin, Upper and LowerGwynedd and Upper Merion. These communi-ties each share common facilities and serviceswithin the vicinity and contain a rich and variedarchitectural history with decorative mansions,country houses, and institutions. Design consid-erations for new residential development withinthese communities include:
1. Compatibility. New residential design shouldbe responsive to the existing surrounding subur-ban patterns that have been established. Theseneighborhoods are commonly bordered ordefined by physical constraints (topography andstreams), streets or highways, and man-madefeatures (power lines, railroads, open spacecorridors or parks). New residential patternsshould respect the context in which they arelocated.
Design Responses:
• Encourage the extension of pedestrianenvironments and linkages between neighbor-hoods along the existing street network andbetween transit routes.
• Encourage a variety of materials that emulatesurrounding design elements, which includehousing styles, materials and adornments,colors, paving, walls, and fences.
2. Mix Housing Types. The communities associ-ated with the mature suburbs contain a varietyof housing types. The diversity of dwelling typeshelp provide for a range of lifestyles and avaried, yet common streetscape.
Design Responses:
• Integrate housing types into immediateneighborhood with similar dimensionalsetbacks and lot sizes.
Established communities such as Narberth,Cheltenham, and Lower Merion provide a wide rangeof architectural styles.
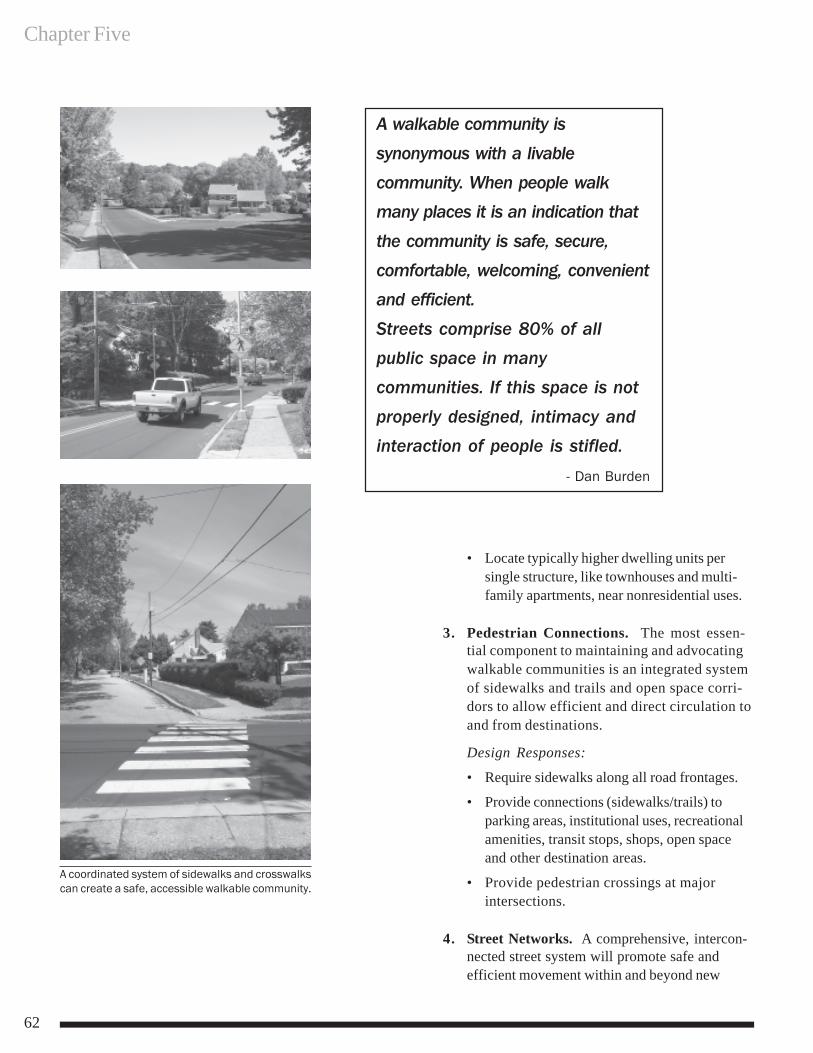
Chapter Five
62
A walkable community is
synonymous with a livablecommunity. When people walkmany places it is an indication that
the community is safe, secure,comfortable, welcoming, convenientand efficient.
Streets comprise 80% of allpublic space in manycommunities. If this space is not
properly designed, intimacy andinteraction of people is stifled.
- Dan Burden
• Locate typically higher dwelling units persingle structure, like townhouses and multi-family apartments, near nonresidential uses.
3. Pedestrian Connections. The most essen-tial component to maintaining and advocatingwalkable communities is an integrated systemof sidewalks and trails and open space corri-dors to allow efficient and direct circulation toand from destinations.
Design Responses:
• Require sidewalks along all road frontages.
• Provide connections (sidewalks/trails) toparking areas, institutional uses, recreationalamenities, transit stops, shops, open spaceand other destination areas.
• Provide pedestrian crossings at majorintersections.
4. Street Networks. A comprehensive, intercon-nected street system will promote safe andefficient movement within and beyond new
A coordinated system of sidewalks and crosswalkscan create a safe, accessible walkable community.
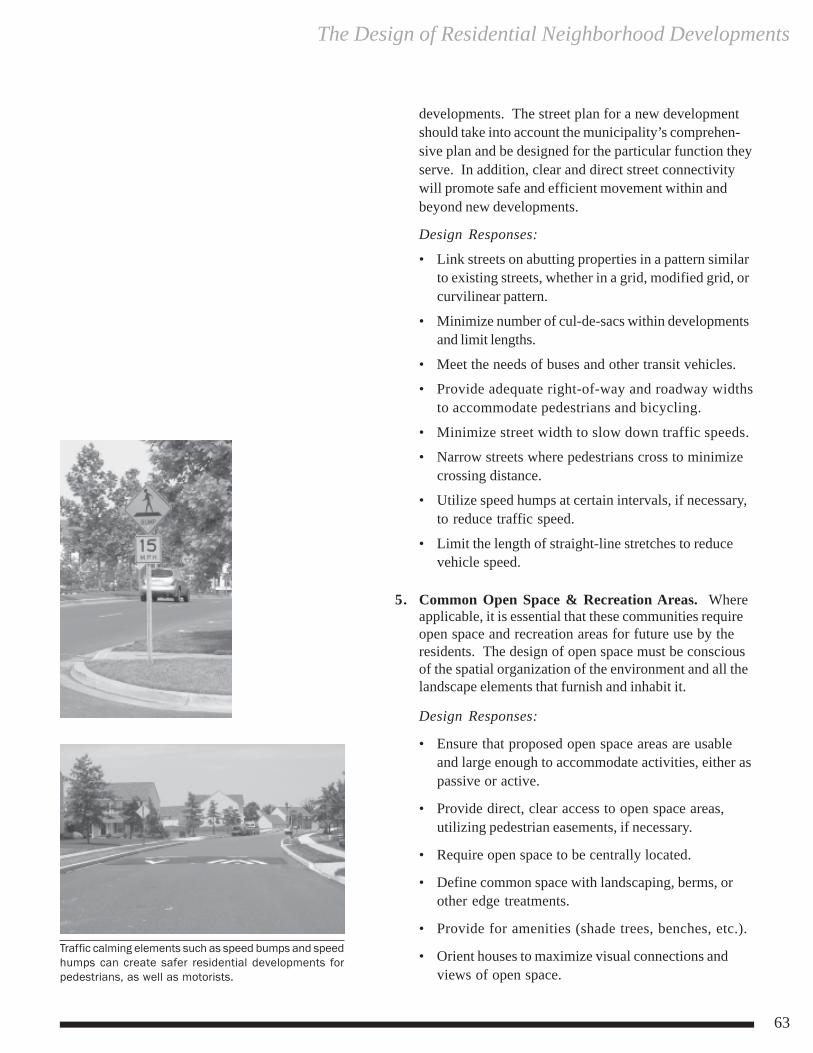
The Design of Residential Neighborhood Developments
63
developments. The street plan for a new developmentshould take into account the municipality’s comprehen-sive plan and be designed for the particular function theyserve. In addition, clear and direct street connectivitywill promote safe and efficient movement within andbeyond new developments.
Design Responses:
• Link streets on abutting properties in a pattern similarto existing streets, whether in a grid, modified grid, orcurvilinear pattern.
• Minimize number of cul-de-sacs within developmentsand limit lengths.
• Meet the needs of buses and other transit vehicles.
• Provide adequate right-of-way and roadway widthsto accommodate pedestrians and bicycling.
• Minimize street width to slow down traffic speeds.
• Narrow streets where pedestrians cross to minimizecrossing distance.
• Utilize speed humps at certain intervals, if necessary,to reduce traffic speed.
• Limit the length of straight-line stretches to reducevehicle speed.
5. Common Open Space & Recreation Areas. Whereapplicable, it is essential that these communities requireopen space and recreation areas for future use by theresidents. The design of open space must be consciousof the spatial organization of the environment and all thelandscape elements that furnish and inhabit it.
Design Responses:
• Ensure that proposed open space areas are usableand large enough to accommodate activities, either aspassive or active.
• Provide direct, clear access to open space areas,utilizing pedestrian easements, if necessary.
• Require open space to be centrally located.
• Define common space with landscaping, berms, orother edge treatments.
• Provide for amenities (shade trees, benches, etc.).
• Orient houses to maximize visual connections andviews of open space.
Traffic calming elements such as speed bumps and speedhumps can create safer residential developments forpedestrians, as well as motorists.
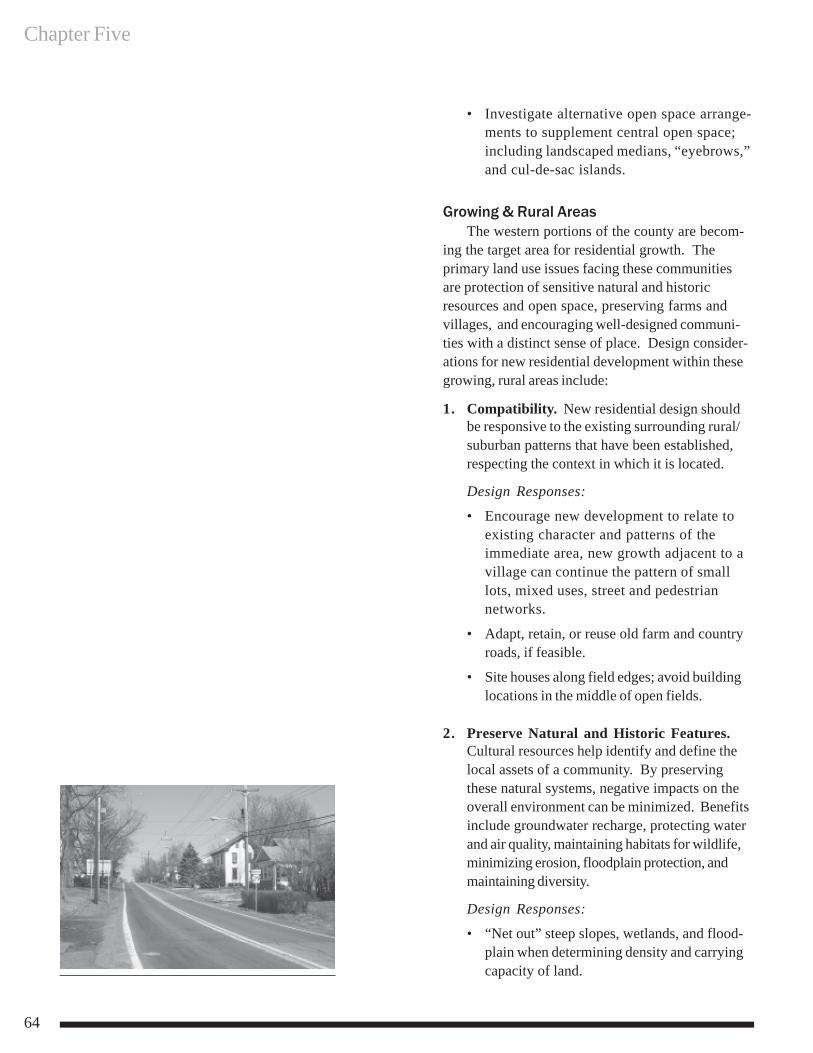
Chapter Five
64
• Investigate alternative open space arrange-ments to supplement central open space;including landscaped medians, “eyebrows,”and cul-de-sac islands.
Growing & Rural AreasThe western portions of the county are becom-
ing the target area for residential growth. Theprimary land use issues facing these communitiesare protection of sensitive natural and historicresources and open space, preserving farms andvillages, and encouraging well-designed communi-ties with a distinct sense of place. Design consider-ations for new residential development within thesegrowing, rural areas include:
1. Compatibility. New residential design shouldbe responsive to the existing surrounding rural/suburban patterns that have been established,respecting the context in which it is located.
Design Responses:
• Encourage new development to relate toexisting character and patterns of theimmediate area, new growth adjacent to avillage can continue the pattern of smalllots, mixed uses, street and pedestriannetworks.
• Adapt, retain, or reuse old farm and countryroads, if feasible.
• Site houses along field edges; avoid buildinglocations in the middle of open fields.
2. Preserve Natural and Historic Features.Cultural resources help identify and define thelocal assets of a community. By preservingthese natural systems, negative impacts on theoverall environment can be minimized. Benefitsinclude groundwater recharge, protecting waterand air quality, maintaining habitats for wildlife,minimizing erosion, floodplain protection, andmaintaining diversity.
Design Responses:
• “Net out” steep slopes, wetlands, and flood-plain when determining density and carryingcapacity of land.
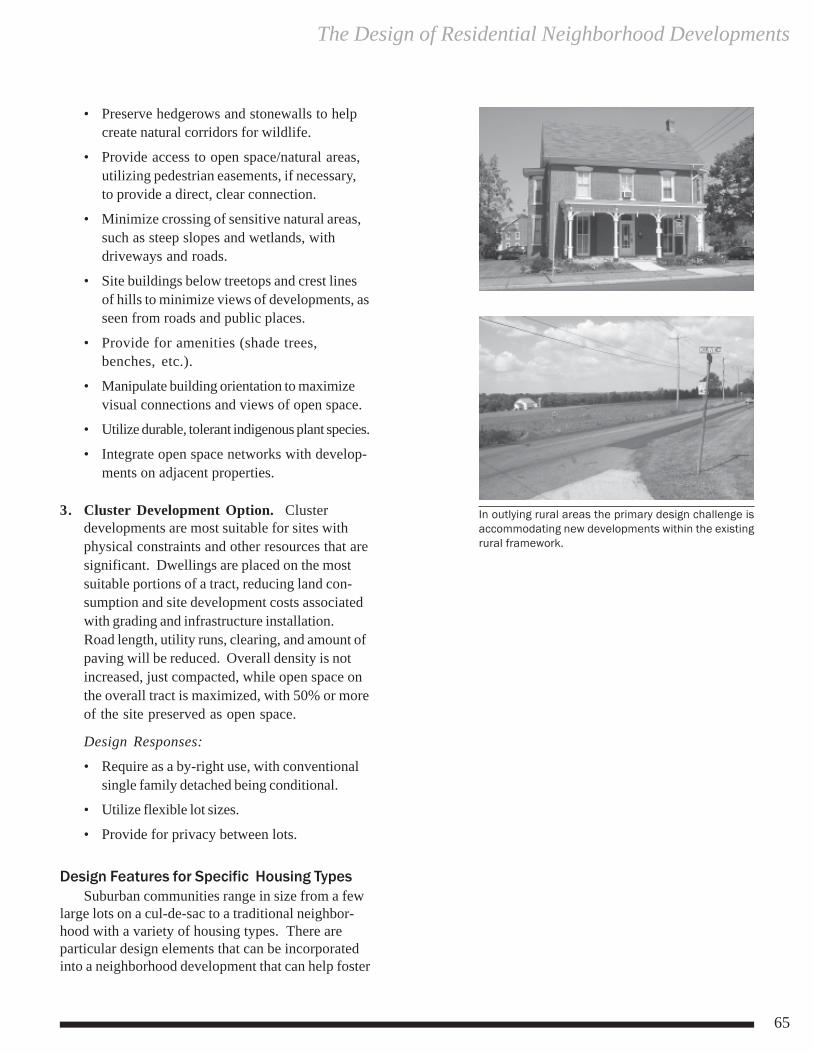
The Design of Residential Neighborhood Developments
65
• Preserve hedgerows and stonewalls to helpcreate natural corridors for wildlife.
• Provide access to open space/natural areas,utilizing pedestrian easements, if necessary,to provide a direct, clear connection.
• Minimize crossing of sensitive natural areas,such as steep slopes and wetlands, withdriveways and roads.
• Site buildings below treetops and crest linesof hills to minimize views of developments, asseen from roads and public places.
• Provide for amenities (shade trees,benches, etc.).
• Manipulate building orientation to maximizevisual connections and views of open space.
• Utilize durable, tolerant indigenous plant species.
• Integrate open space networks with develop-ments on adjacent properties.
3. Cluster Development Option. Clusterdevelopments are most suitable for sites withphysical constraints and other resources that aresignificant. Dwellings are placed on the mostsuitable portions of a tract, reducing land con-sumption and site development costs associatedwith grading and infrastructure installation.Road length, utility runs, clearing, and amount ofpaving will be reduced. Overall density is notincreased, just compacted, while open space onthe overall tract is maximized, with 50% or moreof the site preserved as open space.
Design Responses:
• Require as a by-right use, with conventionalsingle family detached being conditional.
• Utilize flexible lot sizes.
• Provide for privacy between lots.
Design Features for Specific Housing TypesSuburban communities range in size from a few
large lots on a cul-de-sac to a traditional neighbor-hood with a variety of housing types. There areparticular design elements that can be incorporatedinto a neighborhood development that can help foster
In outlying rural areas the primary design challenge isaccommodating new developments within the existingrural framework.
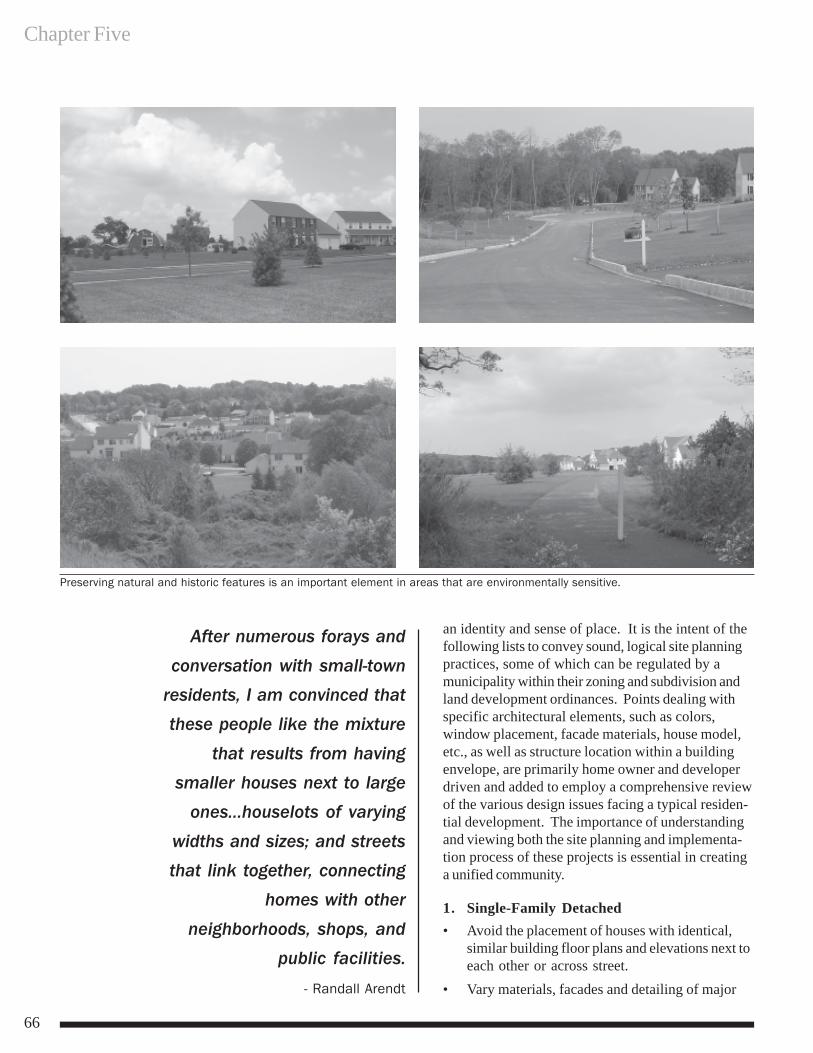
Chapter Five
66
an identity and sense of place. It is the intent of thefollowing lists to convey sound, logical site planningpractices, some of which can be regulated by amunicipality within their zoning and subdivision andland development ordinances. Points dealing withspecific architectural elements, such as colors,window placement, facade materials, house model,etc., as well as structure location within a buildingenvelope, are primarily home owner and developerdriven and added to employ a comprehensive reviewof the various design issues facing a typical residen-tial development. The importance of understandingand viewing both the site planning and implementa-tion process of these projects is essential in creatinga unified community.
1. Single-Family Detached• Avoid the placement of houses with identical,
similar building floor plans and elevations next toeach other or across street.
• Vary materials, facades and detailing of major
Preserving natural and historic features is an important element in areas that are environmentally sensitive.
After numerous forays and
conversation with small-townresidents, I am convinced thatthese people like the mixture
that results from havingsmaller houses next to large
ones…houselots of varying
widths and sizes; and streetsthat link together, connecting
homes with other
neighborhoods, shops, andpublic facilities.
- Randall Arendt
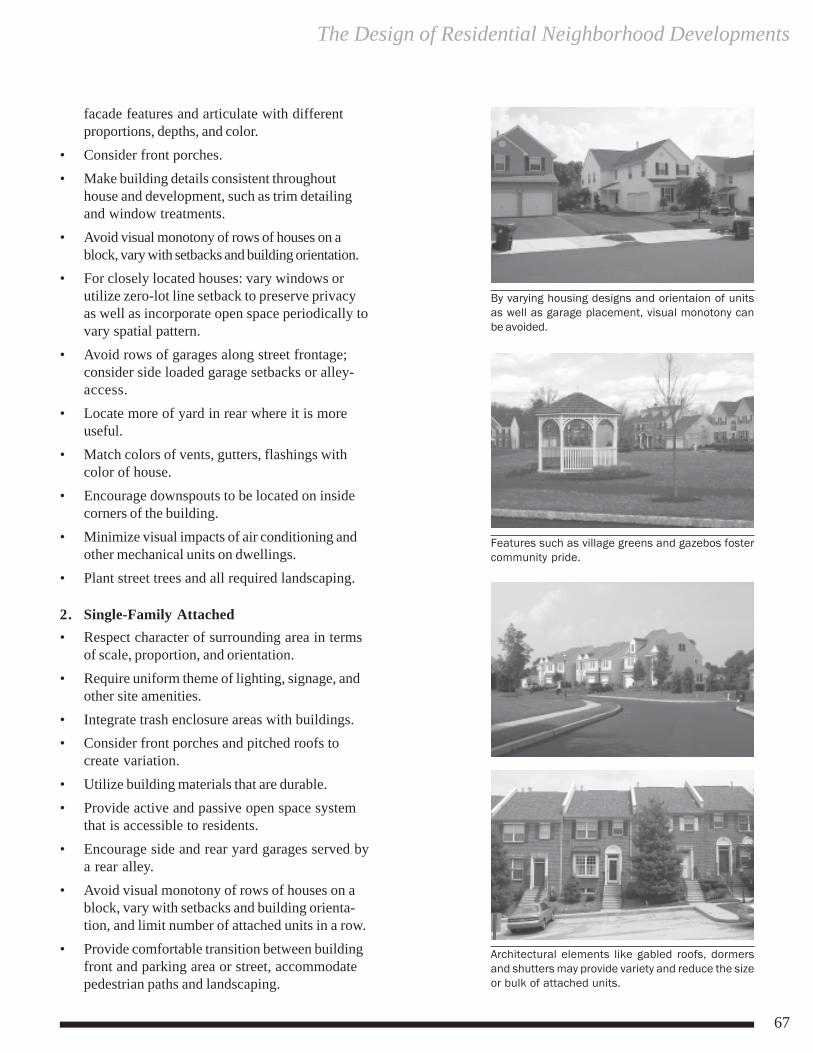
The Design of Residential Neighborhood Developments
67
facade features and articulate with differentproportions, depths, and color.
• Consider front porches.• Make building details consistent throughout
house and development, such as trim detailingand window treatments.
• Avoid visual monotony of rows of houses on ablock, vary with setbacks and building orientation.
• For closely located houses: vary windows orutilize zero-lot line setback to preserve privacyas well as incorporate open space periodically tovary spatial pattern.
• Avoid rows of garages along street frontage;consider side loaded garage setbacks or alley-access.
• Locate more of yard in rear where it is moreuseful.
• Match colors of vents, gutters, flashings withcolor of house.
• Encourage downspouts to be located on insidecorners of the building.
• Minimize visual impacts of air conditioning andother mechanical units on dwellings.
• Plant street trees and all required landscaping.
2. Single-Family Attached• Respect character of surrounding area in terms
of scale, proportion, and orientation.• Require uniform theme of lighting, signage, and
other site amenities.• Integrate trash enclosure areas with buildings.• Consider front porches and pitched roofs to
create variation.• Utilize building materials that are durable.• Provide active and passive open space system
that is accessible to residents.• Encourage side and rear yard garages served by
a rear alley.• Avoid visual monotony of rows of houses on a
block, vary with setbacks and building orienta-tion, and limit number of attached units in a row.
• Provide comfortable transition between buildingfront and parking area or street, accommodatepedestrian paths and landscaping.
By varying housing designs and orientaion of unitsas well as garage placement, visual monotony canbe avoided.
Architectural elements like gabled roofs, dormersand shutters may provide variety and reduce the sizeor bulk of attached units.
Features such as village greens and gazebos fostercommunity pride.
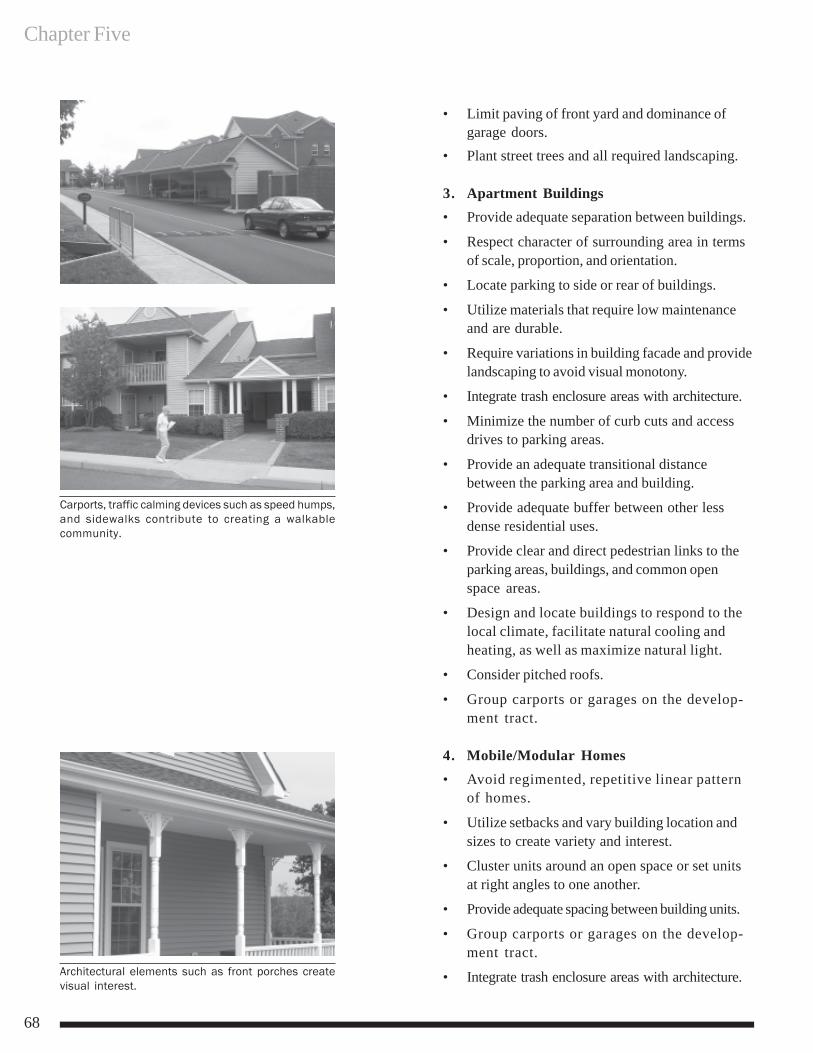
Chapter Five
68
• Limit paving of front yard and dominance ofgarage doors.
• Plant street trees and all required landscaping.
3. Apartment Buildings• Provide adequate separation between buildings.
• Respect character of surrounding area in termsof scale, proportion, and orientation.
• Locate parking to side or rear of buildings.
• Utilize materials that require low maintenanceand are durable.
• Require variations in building facade and providelandscaping to avoid visual monotony.
• Integrate trash enclosure areas with architecture.
• Minimize the number of curb cuts and accessdrives to parking areas.
• Provide an adequate transitional distancebetween the parking area and building.
• Provide adequate buffer between other lessdense residential uses.
• Provide clear and direct pedestrian links to theparking areas, buildings, and common openspace areas.
• Design and locate buildings to respond to thelocal climate, facilitate natural cooling andheating, as well as maximize natural light.
• Consider pitched roofs.
• Group carports or garages on the develop-ment tract.
4. Mobile/Modular Homes• Avoid regimented, repetitive linear pattern
of homes.
• Utilize setbacks and vary building location andsizes to create variety and interest.
• Cluster units around an open space or set unitsat right angles to one another.
• Provide adequate spacing between building units.
• Group carports or garages on the develop-ment tract.
• Integrate trash enclosure areas with architecture.
Carports, traffic calming devices such as speed humps,and sidewalks contribute to creating a walkablecommunity.
Architectural elements such as front porches createvisual interest.
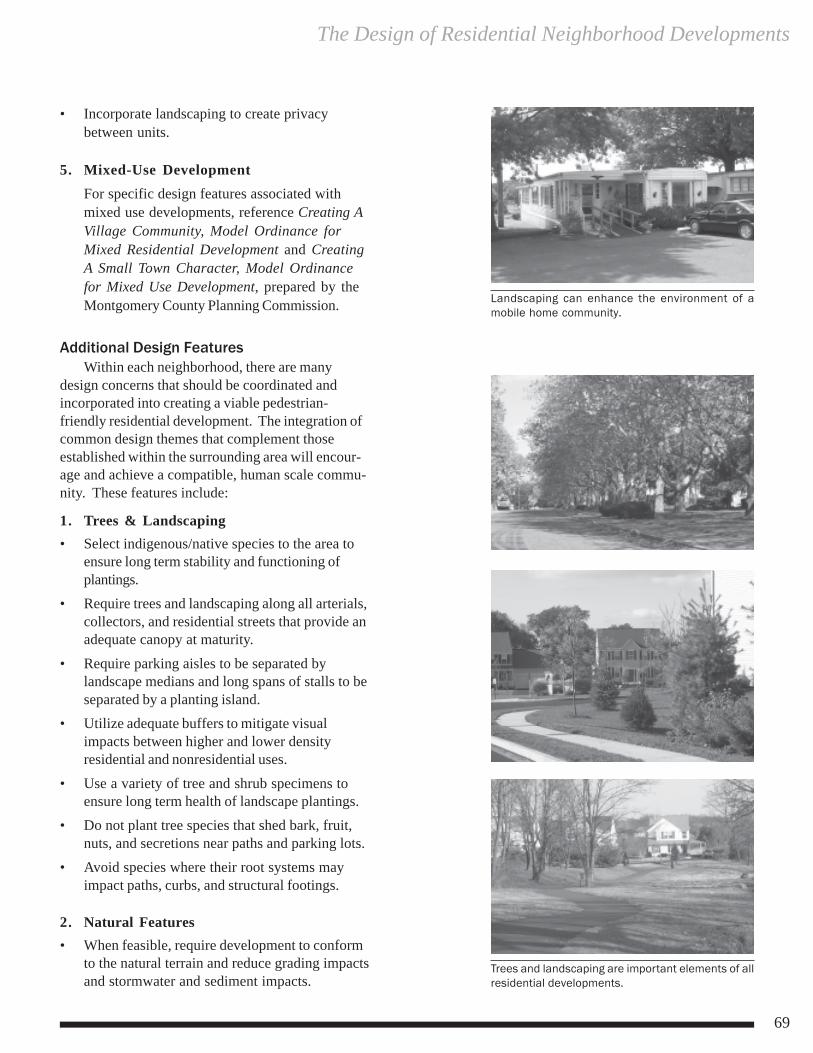
The Design of Residential Neighborhood Developments
69
• Incorporate landscaping to create privacybetween units.
5. Mixed-Use DevelopmentFor specific design features associated withmixed use developments, reference Creating AVillage Community, Model Ordinance forMixed Residential Development and CreatingA Small Town Character, Model Ordinancefor Mixed Use Development, prepared by theMontgomery County Planning Commission.
Additional Design FeaturesWithin each neighborhood, there are many
design concerns that should be coordinated andincorporated into creating a viable pedestrian-friendly residential development. The integration ofcommon design themes that complement thoseestablished within the surrounding area will encour-age and achieve a compatible, human scale commu-nity. These features include:
1. Trees & Landscaping• Select indigenous/native species to the area to
ensure long term stability and functioning ofplantings.
• Require trees and landscaping along all arterials,collectors, and residential streets that provide anadequate canopy at maturity.
• Require parking aisles to be separated bylandscape medians and long spans of stalls to beseparated by a planting island.
• Utilize adequate buffers to mitigate visualimpacts between higher and lower densityresidential and nonresidential uses.
• Use a variety of tree and shrub specimens toensure long term health of landscape plantings.
• Do not plant tree species that shed bark, fruit,nuts, and secretions near paths and parking lots.
• Avoid species where their root systems mayimpact paths, curbs, and structural footings.
2. Natural Features• When feasible, require development to conform
to the natural terrain and reduce grading impactsand stormwater and sediment impacts.
Landscaping can enhance the environment of amobile home community.
Trees and landscaping are important elements of allresidential developments.
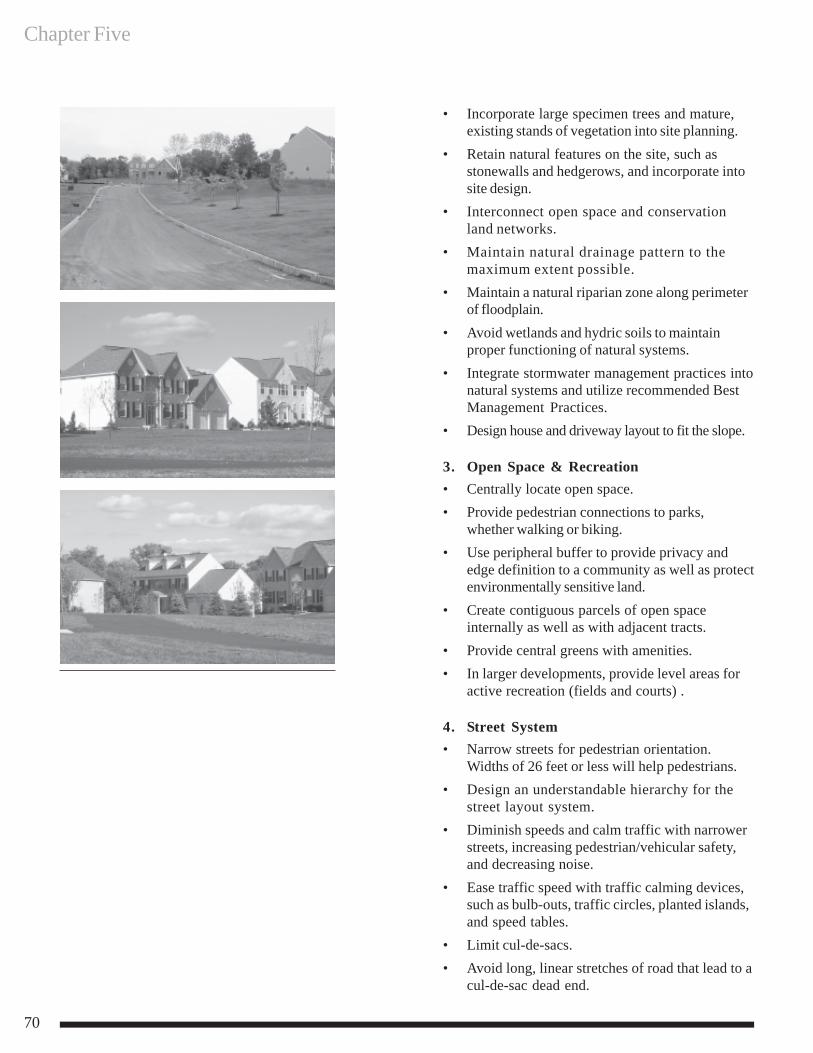
Chapter Five
70
• Incorporate large specimen trees and mature,existing stands of vegetation into site planning.
• Retain natural features on the site, such asstonewalls and hedgerows, and incorporate intosite design.
• Interconnect open space and conservationland networks.
• Maintain natural drainage pattern to themaximum extent possible.
• Maintain a natural riparian zone along perimeterof floodplain.
• Avoid wetlands and hydric soils to maintainproper functioning of natural systems.
• Integrate stormwater management practices intonatural systems and utilize recommended BestManagement Practices.
• Design house and driveway layout to fit the slope.
3. Open Space & Recreation• Centrally locate open space.• Provide pedestrian connections to parks,
whether walking or biking.• Use peripheral buffer to provide privacy and
edge definition to a community as well as protectenvironmentally sensitive land.
• Create contiguous parcels of open spaceinternally as well as with adjacent tracts.
• Provide central greens with amenities.• In larger developments, provide level areas for
active recreation (fields and courts) .
4. Street System• Narrow streets for pedestrian orientation.
Widths of 26 feet or less will help pedestrians.• Design an understandable hierarchy for the
street layout system.• Diminish speeds and calm traffic with narrower
streets, increasing pedestrian/vehicular safety,and decreasing noise.
• Ease traffic speed with traffic calming devices,such as bulb-outs, traffic circles, planted islands,and speed tables.
• Limit cul-de-sacs.• Avoid long, linear stretches of road that lead to a
cul-de-sac dead end.
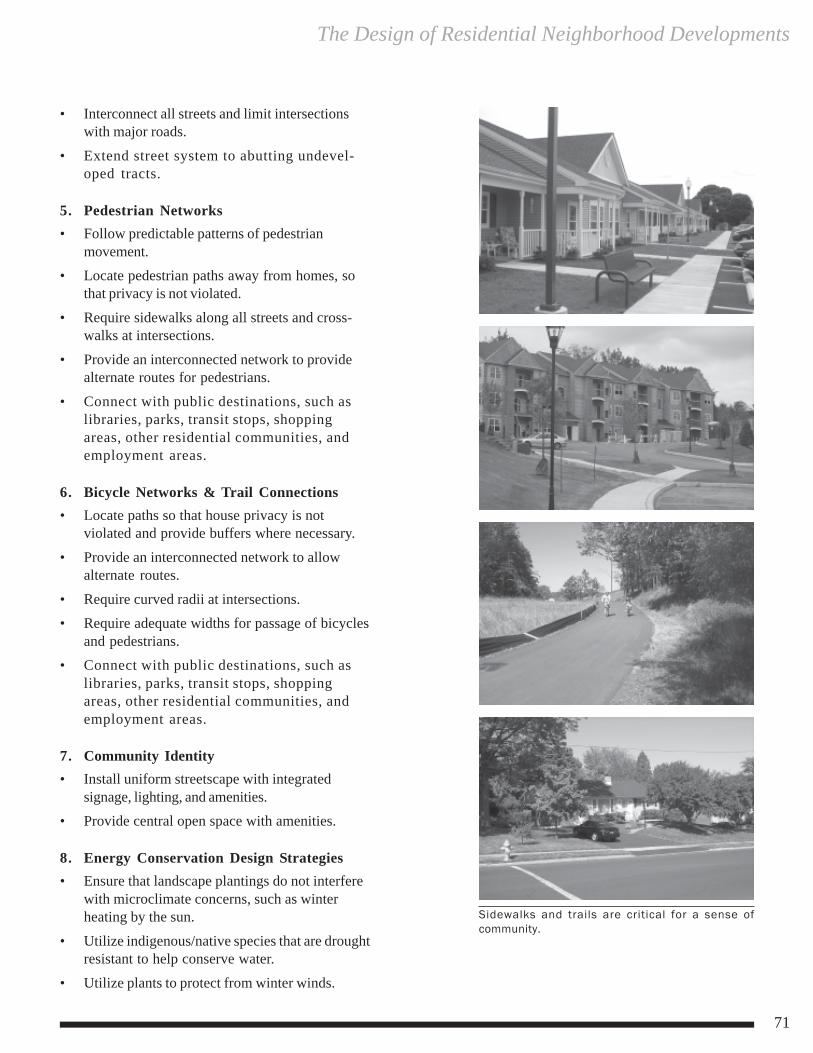
The Design of Residential Neighborhood Developments
71
• Interconnect all streets and limit intersectionswith major roads.
• Extend street system to abutting undevel-oped tracts.
5. Pedestrian Networks• Follow predictable patterns of pedestrian
movement.• Locate pedestrian paths away from homes, so
that privacy is not violated.
• Require sidewalks along all streets and cross-walks at intersections.
• Provide an interconnected network to providealternate routes for pedestrians.
• Connect with public destinations, such aslibraries, parks, transit stops, shoppingareas, other residential communities, andemployment areas.
6. Bicycle Networks & Trail Connections• Locate paths so that house privacy is not
violated and provide buffers where necessary.
• Provide an interconnected network to allowalternate routes.
• Require curved radii at intersections.• Require adequate widths for passage of bicycles
and pedestrians.• Connect with public destinations, such as
libraries, parks, transit stops, shoppingareas, other residential communities, andemployment areas.
7. Community Identity• Install uniform streetscape with integrated
signage, lighting, and amenities.• Provide central open space with amenities.
8. Energy Conservation Design Strategies• Ensure that landscape plantings do not interfere
with microclimate concerns, such as winterheating by the sun.
• Utilize indigenous/native species that are droughtresistant to help conserve water.
• Utilize plants to protect from winter winds.
Sidewalks and trails are critical for a sense ofcommunity.
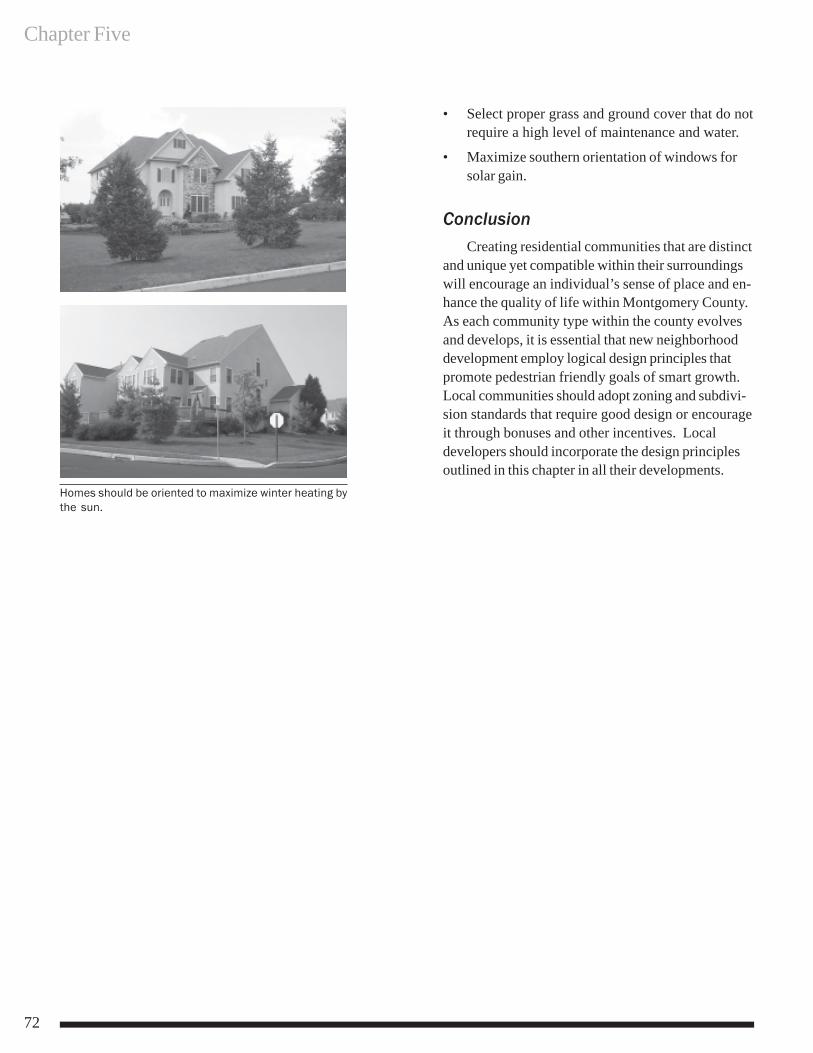
Chapter Five
72
• Select proper grass and ground cover that do notrequire a high level of maintenance and water.
• Maximize southern orientation of windows forsolar gain.
ConclusionCreating residential communities that are distinct
and unique yet compatible within their surroundingswill encourage an individual’s sense of place and en-hance the quality of life within Montgomery County.As each community type within the county evolvesand develops, it is essential that new neighborhooddevelopment employ logical design principles thatpromote pedestrian friendly goals of smart growth.Local communities should adopt zoning and subdivi-sion standards that require good design or encourageit through bonuses and other incentives. Localdevelopers should incorporate the design principlesoutlined in this chapter in all their developments.
Homes should be oriented to maximize winter heating bythe sun.
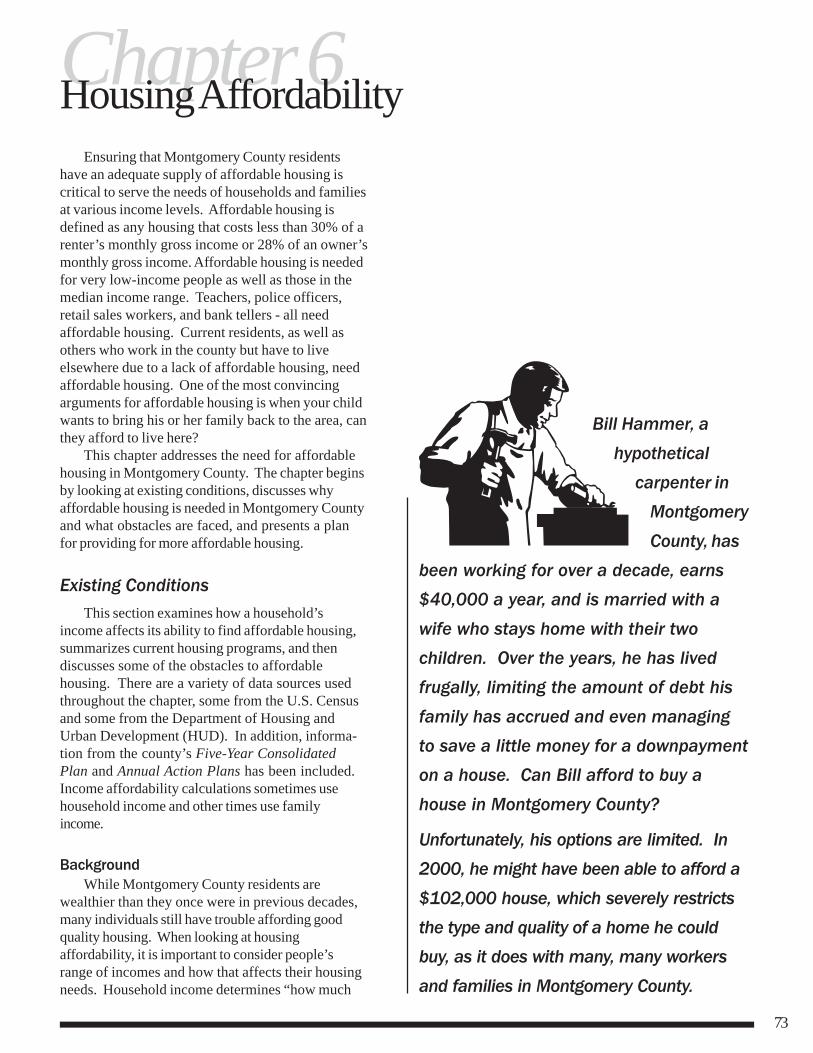
73
Chapter 6 Housing Affordability Ensuring that Montgomery County residents
have an adequate supply of affordable housing is critical to serve the needs of households and families at various income levels. Affordable housing is defined as any housing that costs less than 30% of a renter’s monthly gross income or 28% of an owner’s monthly gross income. Affordable housing is needed for very low-income people as well as those in the median income range. Teachers, police officers, retail sales workers, and bank tellers - all need affordable housing. Current residents, as well as others who work in the county but have to live elsewhere due to a lack of affordable housing, need affordable housing. One of the most convincing arguments for affordable housing is when your child wants to bring his or her family back to the area, can they afford to live here?
This chapter addresses the need for affordable housing in Montgomery County. The chapter begins by looking at existing conditions, discusses why affordable housing is needed in Montgomery County and what obstacles are faced, and presents a plan for providing for more affordable housing.
Existing Conditions This section examines how a household’s
income affects its ability to find affordable housing, summarizes current housing programs, and then discusses some of the obstacles to affordable housing. There are a variety of data sources used throughout the chapter, some from the U.S. Census and some from the Department of Housing and Urban Development (HUD). In addition, informa-tion from the county’s Five-Year Consolidated Plan and Annual Action Plans has been included. Income affordability calculations sometimes use household income and other times use family income.
Background While Montgomery County residents are
wealthier than they once were in previous decades, many individuals still have trouble affording good quality housing. When looking at housing affordability, it is important to consider people’s range of incomes and how that affects their housing needs. Household income determines “how much
Bill Hammer, a
hypothetical carpenter in
Montgomery
County, has
been working for over a decade, earns
$40,000 a year, and is married with a
wife who stays home with their two
children. Over the years, he has lived
frugally, limiting the amount of debt his
family has accrued and even managing
to save a little money for a downpayment on a house. Can Bill afford to buy a
house in Montgomery County?
Unfortunately, his options are limited. In
2000, he might have been able to afford a
$102,000 house, which severely restricts
the type and quality of a home he could
buy, as it does with many, many workers
and families in Montgomery County.
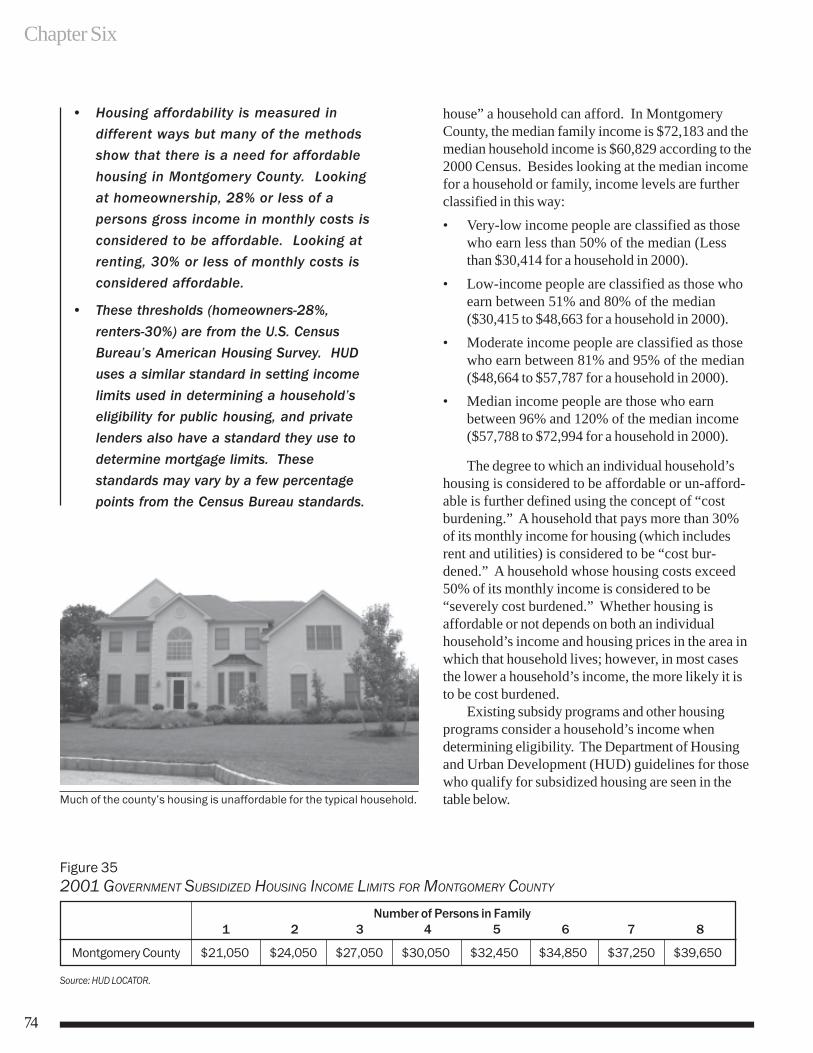
Chapter Six
74
house” a household can afford. In Montgomery County, the median family income is $72,183 and the median household income is $60,829 according to the 2000 Census. Besides looking at the median income for a household or family, income levels are further classified in this way: • Very-low income people are classified as those
who earn less than 50% of the median (Less than $30,414 for a household in 2000).
• Low-income people are classified as those who earn between 51% and 80% of the median ($30,415 to $48,663 for a household in 2000).
• Moderate income people are classified as those who earn between 81% and 95% of the median ($48,664 to $57,787 for a household in 2000).
• Median income people are those who earn between 96% and 120% of the median income ($57,788 to $72,994 for a household in 2000).
The degree to which an individual household’s housing is considered to be affordable or un-afford-able is further defined using the concept of “cost burdening.” A household that pays more than 30% of its monthly income for housing (which includes rent and utilities) is considered to be “cost bur-dened.” A household whose housing costs exceed 50% of its monthly income is considered to be “severely cost burdened.” Whether housing is affordable or not depends on both an individual household’s income and housing prices in the area in which that household lives; however, in most cases the lower a household’s income, the more likely it is to be cost burdened.
Existing subsidy programs and other housing programs consider a household’s income when determining eligibility. The Department of Housing and Urban Development (HUD) guidelines for those who qualify for subsidized housing are seen in the table below.
• Housing affordability is measured in
different ways but many of the methods
show that there is a need for affordable
housing in Montgomery County. Looking
at homeownership, 28% or less of a
persons gross income in monthly costs is
considered to be affordable. Looking at renting, 30% or less of monthly costs is
considered affordable.
• These thresholds (homeowners-28%, renters-30%) are from the U.S. Census
Bureau’s American Housing Survey. HUD
uses a similar standard in setting income
limits used in determining a household’s
eligibility for public housing, and private
lenders also have a standard they use to
determine mortgage limits. These
standards may vary by a few percentage
points from the Census Bureau standards.
Much of the county’s housing is unaffordable for the typical household.
Figure 35 2001 GOVERNMENT SUBSIDIZED HOUSING INCOME LIMITS FOR MONTGOMERY COUNTY
Number of Persons in Family 1 2 3 4 5 6 7 8
Montgomery County $21,050 $24,050 $27,050 $30,050 $32,450 $34,850 $37,250 $39,650
Source: HUD LOCATOR.
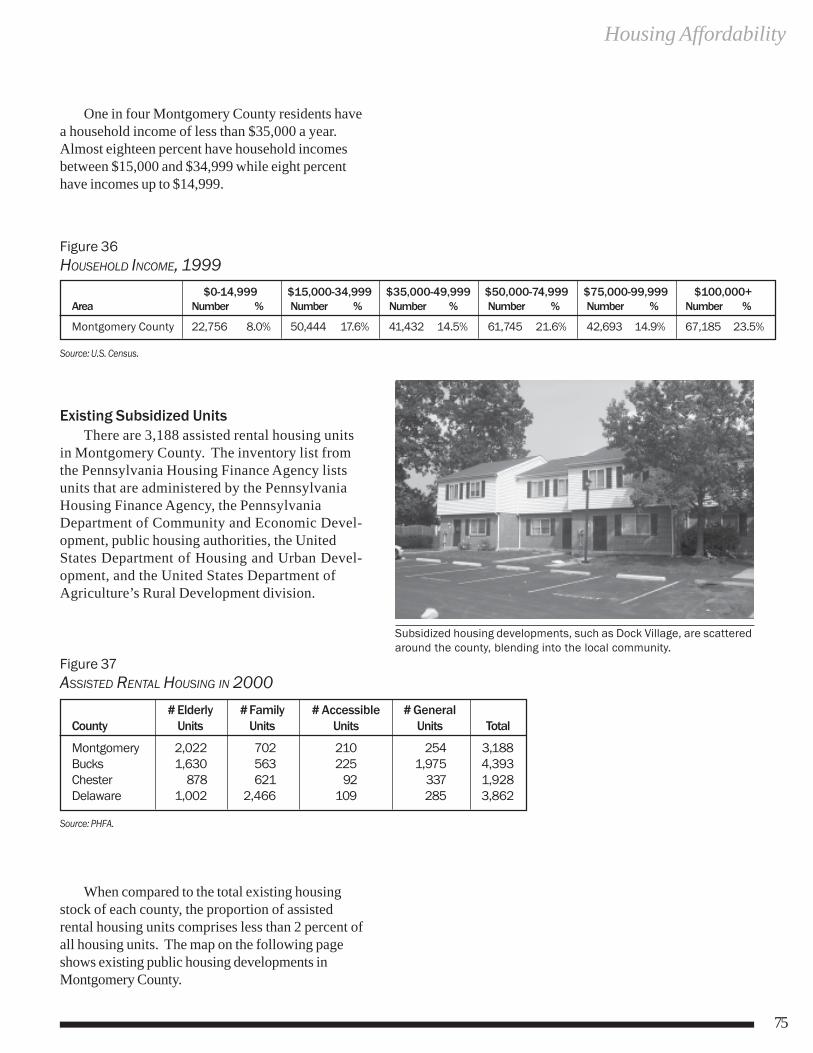
Housing Affordability
75
One in four Montgomery County residents have a household income of less than $35,000 a year. Almost eighteen percent have household incomes between $15,000 and $34,999 while eight percent have incomes up to $14,999.
Existing Subsidized Units There are 3,188 assisted rental housing units
in Montgomery County. The inventory list from the Pennsylvania Housing Finance Agency lists units that are administered by the Pennsylvania Housing Finance Agency, the Pennsylvania Department of Community and Economic Devel-opment, public housing authorities, the United States Department of Housing and Urban Devel-opment, and the United States Department of Agriculture’s Rural Development division.
Figure 36 HOUSEHOLD INCOME, 1999
$0-14,999 $15,000-34,999 $35,000-49,999 $50,000-74,999 $75,000-99,999 $100,000+ Area Number % Number % Number % Number % Number % Number %
Montgomery County 22,756 8.0% 50,444 17.6% 41,432 14.5% 61,745 21.6% 42,693 14.9% 67,185 23.5%
Source: U.S. Census.
When compared to the total existing housing stock of each county, the proportion of assisted rental housing units comprises less than 2 percent of all housing units. The map on the following page shows existing public housing developments in Montgomery County.
Figure 37 ASSISTED RENTAL HOUSING IN 2000
# Elderly # Family # Accessible # General County Units Units Units Units Total
Montgomery 2,022 702 210 254 3,188 Bucks 1,630 563 225 1,975 4,393 Chester 878 621 92 337 1,928 Delaware 1,002 2,466 109 285 3,862
Source: PHFA.
Subsidized housing developments, such as Dock Village, are scattered around the county, blending into the local community.
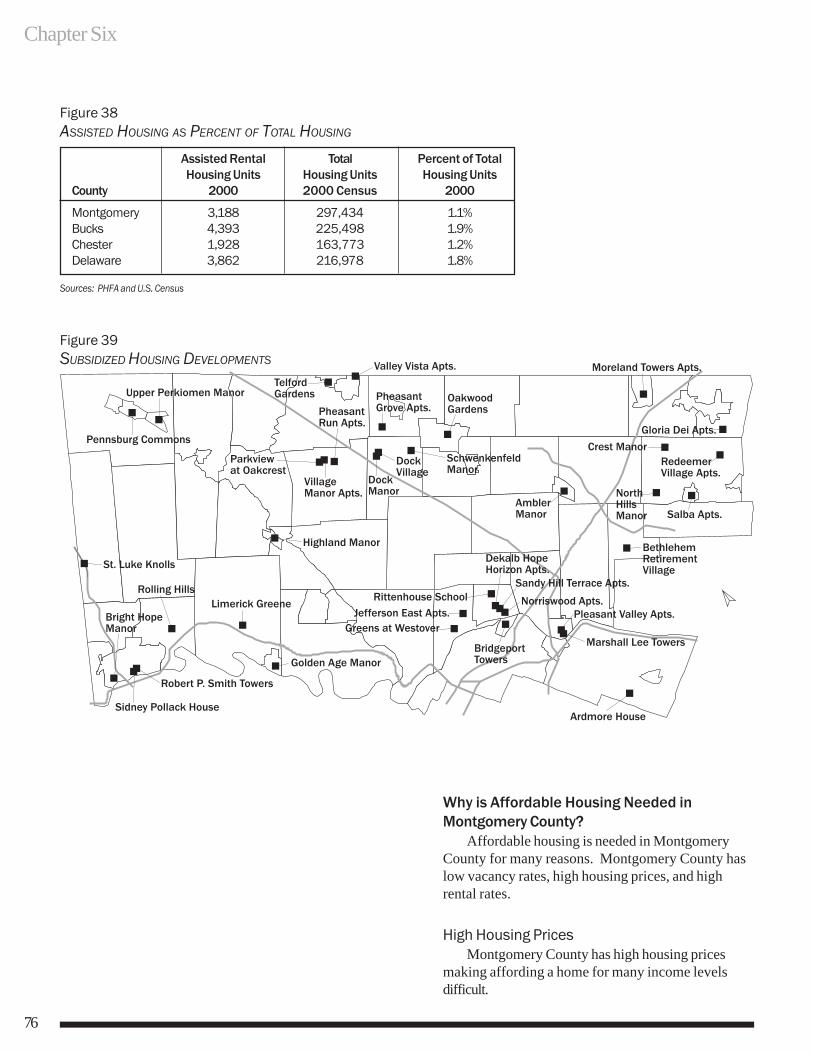
Chapter Six
76
Why is Affordable Housing Needed in Montgomery County?
Affordable housing is needed in Montgomery County for many reasons. Montgomery County has low vacancy rates, high housing prices, and high rental rates.
High Housing Prices Montgomery County has high housing prices
making affording a home for many income levels difficult.
Figure 38 ASSISTED HOUSING AS PERCENT OF TOTAL HOUSING
Assisted Rental Total Percent of Total Housing Units Housing Units Housing Units
County 2000 2000 Census 2000
Montgomery 3,188 297,434 1.1% Bucks 4,393 225,498 1.9% Chester 1,928 163,773 1.2% Delaware 3,862 216,978 1.8%
Sources: PHFA and U.S. Census
Figure 39 SUBSIDIZED HOUSING DEVELOPMENTS
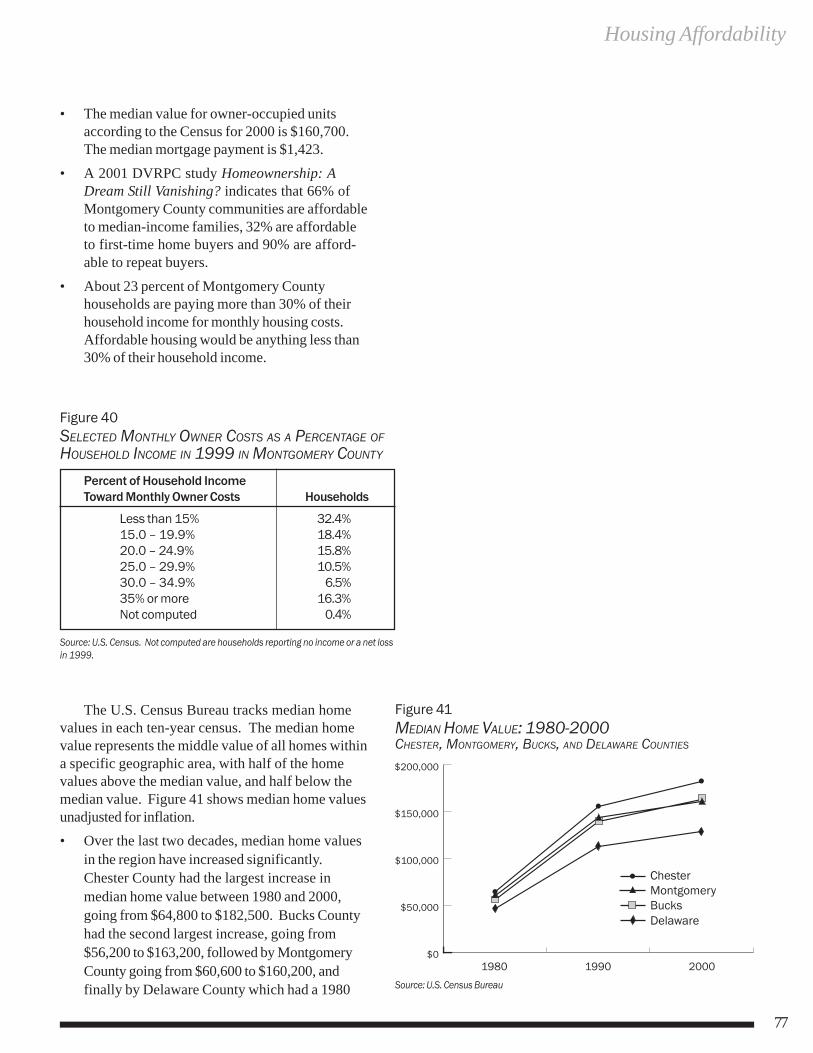
Housing Affordability
77
• The median value for owner-occupied units according to the Census for 2000 is $160,700. The median mortgage payment is $1,423.
• A 2001 DVRPC study Homeownership: A Dream Still Vanishing? indicates that 66% of Montgomery County communities are affordable to median-income families, 32% are affordable to first-time home buyers and 90% are afford-able to repeat buyers.
• About 23 percent of Montgomery County households are paying more than 30% of their household income for monthly housing costs. Affordable housing would be anything less than 30% of their household income.
Figure 40 SELECTED MONTHLY OWNER COSTS AS A PERCENTAGE OF HOUSEHOLD INCOME IN 1999 IN MONTGOMERY COUNTY
Percent of Household Income Toward Monthly Owner Costs Households
Less than 15% 32.4% 15.0 – 19.9% 18.4% 20.0 – 24.9% 15.8% 25.0 – 29.9% 10.5% 30.0 – 34.9% 6.5% 35% or more 16.3% Not computed 0.4%
Source: U.S. Census. Not computed are households reporting no income or a net loss in 1999.
Figure 41 MEDIAN HOME VALUE: 1980-2000 CHESTER, MONTGOMERY, BUCKS, AND DELAWARE COUNTIES
Source: U.S. Census Bureau
The U.S. Census Bureau tracks median home values in each ten-year census. The median home value represents the middle value of all homes within a specific geographic area, with half of the home values above the median value, and half below the median value. Figure 41 shows median home values unadjusted for inflation. • Over the last two decades, median home values
in the region have increased significantly. Chester County had the largest increase in median home value between 1980 and 2000, going from $64,800 to $182,500. Bucks County had the second largest increase, going from $56,200 to $163,200, followed by Montgomery County going from $60,600 to $160,200, and finally by Delaware County which had a 1980
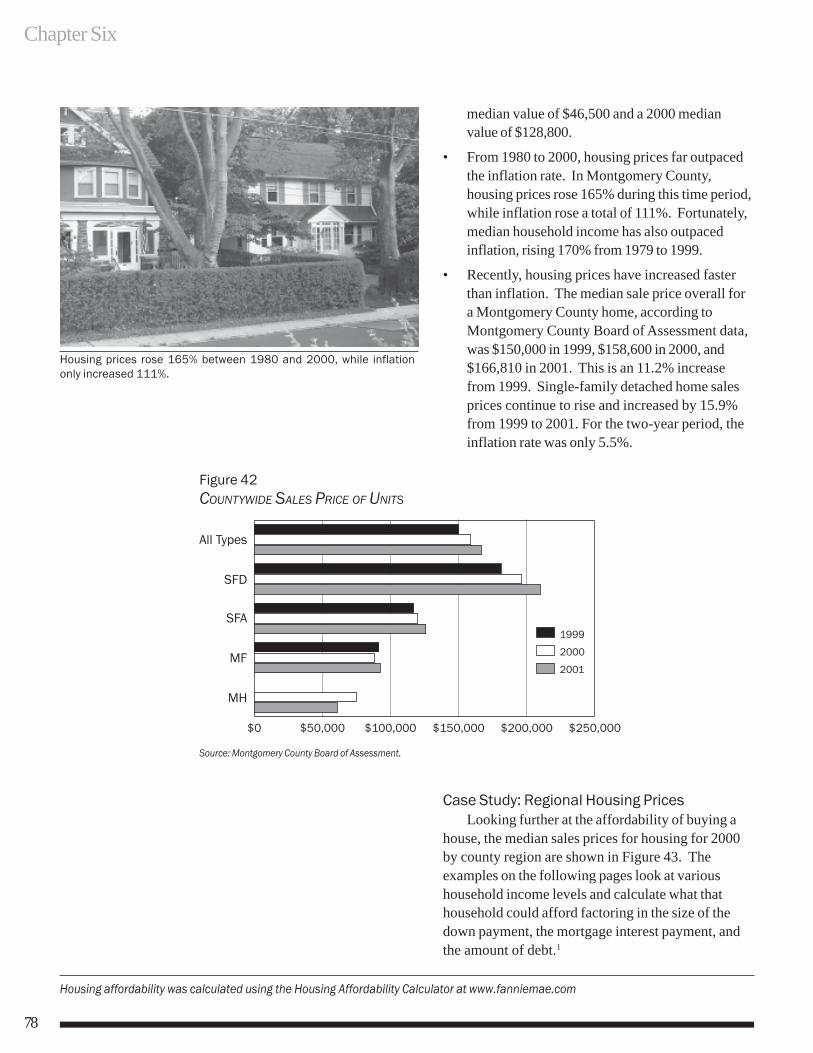
Chapter Six
78
median value of $46,500 and a 2000 median value of $128,800.
• From 1980 to 2000, housing prices far outpaced the inflation rate. In Montgomery County, housing prices rose 165% during this time period, while inflation rose a total of 111%. Fortunately, median household income has also outpaced inflation, rising 170% from 1979 to 1999.
• Recently, housing prices have increased faster than inflation. The median sale price overall for a Montgomery County home, according to Montgomery County Board of Assessment data, was $150,000 in 1999, $158,600 in 2000, and $166,810 in 2001. This is an 11.2% increase from 1999. Single-family detached home sales prices continue to rise and increased by 15.9% from 1999 to 2001. For the two-year period, the inflation rate was only 5.5%.
Housing prices rose 165% between 1980 and 2000, while inflation only increased 111%.
Case Study: Regional Housing Prices Looking further at the affordability of buying a
house, the median sales prices for housing for 2000 by county region are shown in Figure 43. The examples on the following pages look at various household income levels and calculate what that household could afford factoring in the size of the down payment, the mortgage interest payment, and the amount of debt.1
Figure 42 COUNTYWIDE SALES PRICE OF UNITS
Source: Montgomery County Board of Assessment.
Housing affordability was calculated using the Housing Affordability Calculator at www.fanniemae.com
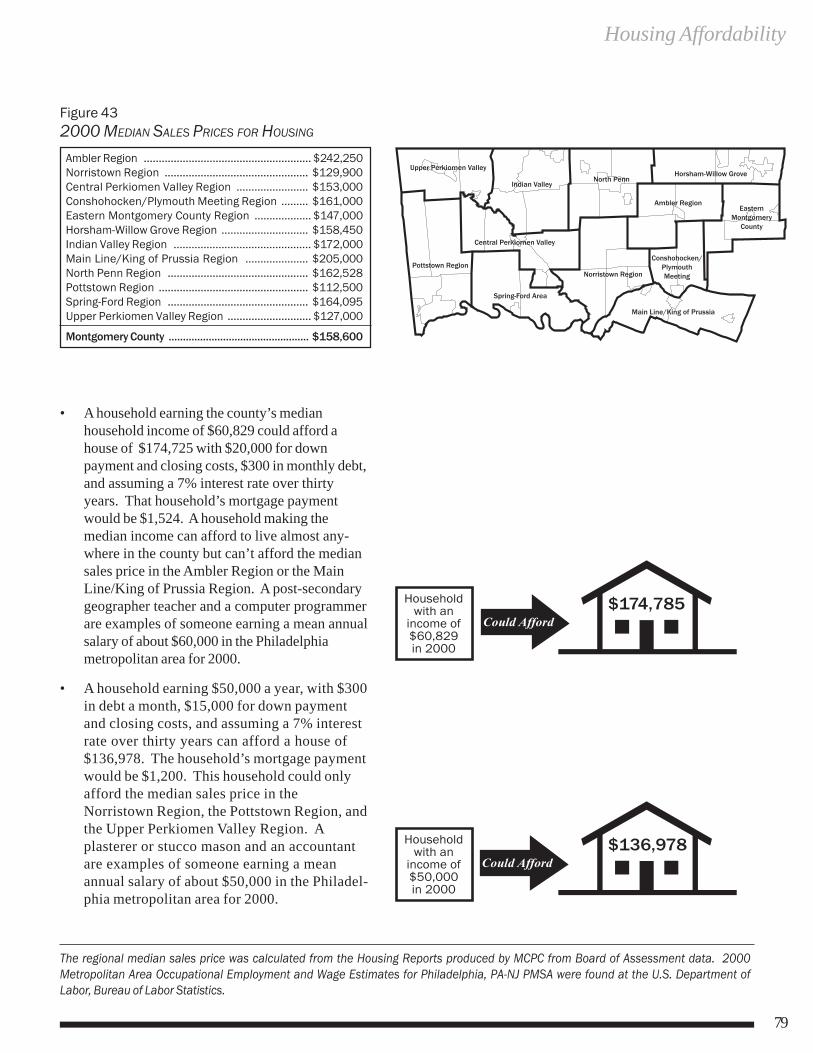
Housing Affordability
79
The regional median sales price was calculated from the Housing Reports produced by MCPC from Board of Assessment data. 2000 Metropolitan Area Occupational Employment and Wage Estimates for Philadelphia, PA-NJ PMSA were found at the U.S. Department of Labor, Bureau of Labor Statistics.
• A household earning the county’s median household income of $60,829 could afford a house of $174,725 with $20,000 for down payment and closing costs, $300 in monthly debt, and assuming a 7% interest rate over thirty years. That household’s mortgage payment would be $1,524. A household making the median income can afford to live almost any-where in the county but can’t afford the median sales price in the Ambler Region or the Main Line/King of Prussia Region. A post-secondary geographer teacher and a computer programmer are examples of someone earning a mean annual salary of about $60,000 in the Philadelphia metropolitan area for 2000.
• A household earning $50,000 a year, with $300 in debt a month, $15,000 for down payment and closing costs, and assuming a 7% interest rate over thirty years can afford a house of $136,978. The household’s mortgage payment would be $1,200. This household could only afford the median sales price in the Norristown Region, the Pottstown Region, and the Upper Perkiomen Valley Region. A plasterer or stucco mason and an accountant are examples of someone earning a mean annual salary of about $50,000 in the Philadel-phia metropolitan area for 2000.
Figure 43 2000 MEDIAN SALES PRICES FOR HOUSING
Ambler Region ........................................................ $242,250 Norristown Region ................................................ $129,900 Central Perkiomen Valley Region ........................ $153,000 Conshohocken/Plymouth Meeting Region ......... $161,000 Eastern Montgomery County Region ................... $147,000 Horsham-Willow Grove Region ............................. $158,450 Indian Valley Region .............................................. $172,000 Main Line/King of Prussia Region ..................... $205,000 North Penn Region ............................................... $162,528 Pottstown Region .................................................. $112,500 Spring-Ford Region ............................................... $164,095 Upper Perkiomen Valley Region ............................ $127,000
Montgomery County ................................................. $158,600
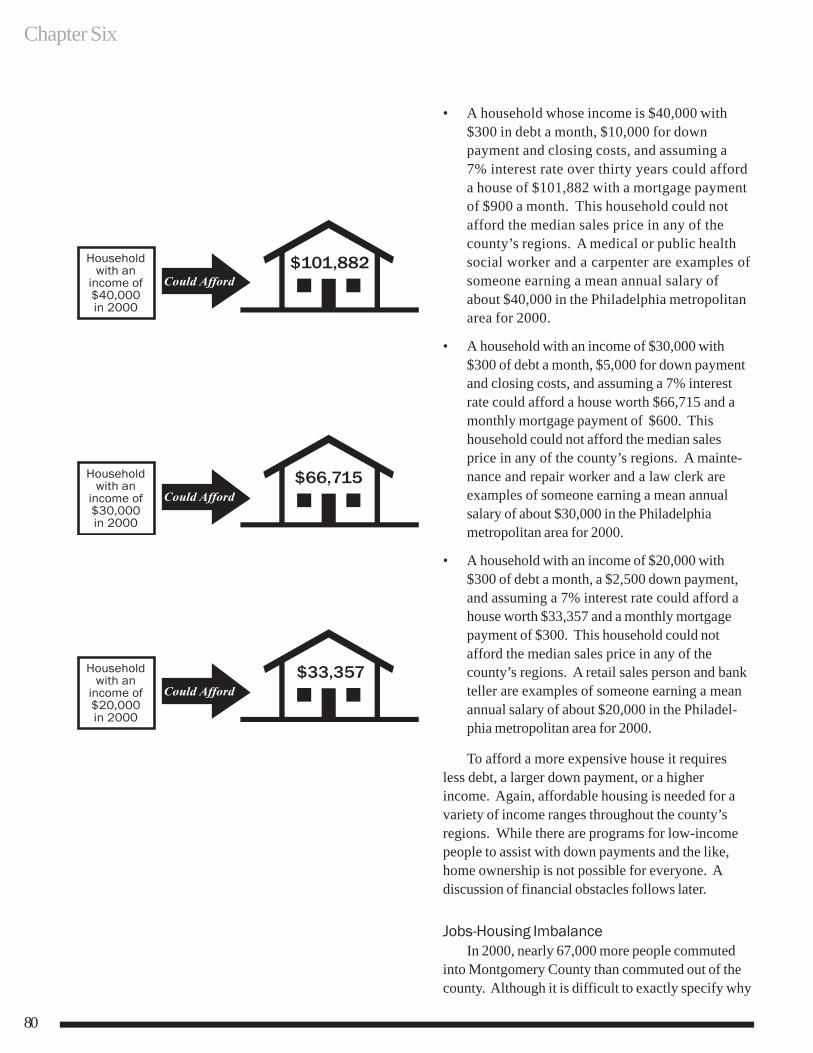
Chapter Six
80
• A household whose income is $40,000 with $300 in debt a month, $10,000 for down payment and closing costs, and assuming a 7% interest rate over thirty years could afford a house of $101,882 with a mortgage payment of $900 a month. This household could not afford the median sales price in any of the county’s regions. A medical or public health social worker and a carpenter are examples of someone earning a mean annual salary of about $40,000 in the Philadelphia metropolitan area for 2000.
• A household with an income of $30,000 with $300 of debt a month, $5,000 for down payment and closing costs, and assuming a 7% interest rate could afford a house worth $66,715 and a monthly mortgage payment of $600. This household could not afford the median sales price in any of the county’s regions. A mainte-nance and repair worker and a law clerk are examples of someone earning a mean annual salary of about $30,000 in the Philadelphia metropolitan area for 2000.
• A household with an income of $20,000 with $300 of debt a month, a $2,500 down payment, and assuming a 7% interest rate could afford a house worth $33,357 and a monthly mortgage payment of $300. This household could not afford the median sales price in any of the county’s regions. A retail sales person and bank teller are examples of someone earning a mean annual salary of about $20,000 in the Philadel-phia metropolitan area for 2000.
To afford a more expensive house it requires less debt, a larger down payment, or a higher income. Again, affordable housing is needed for a variety of income ranges throughout the county’s regions. While there are programs for low-income people to assist with down payments and the like, home ownership is not possible for everyone. A discussion of financial obstacles follows later.
Jobs-Housing Imbalance In 2000, nearly 67,000 more people commuted
into Montgomery County than commuted out of the county. Although it is difficult to exactly specify why
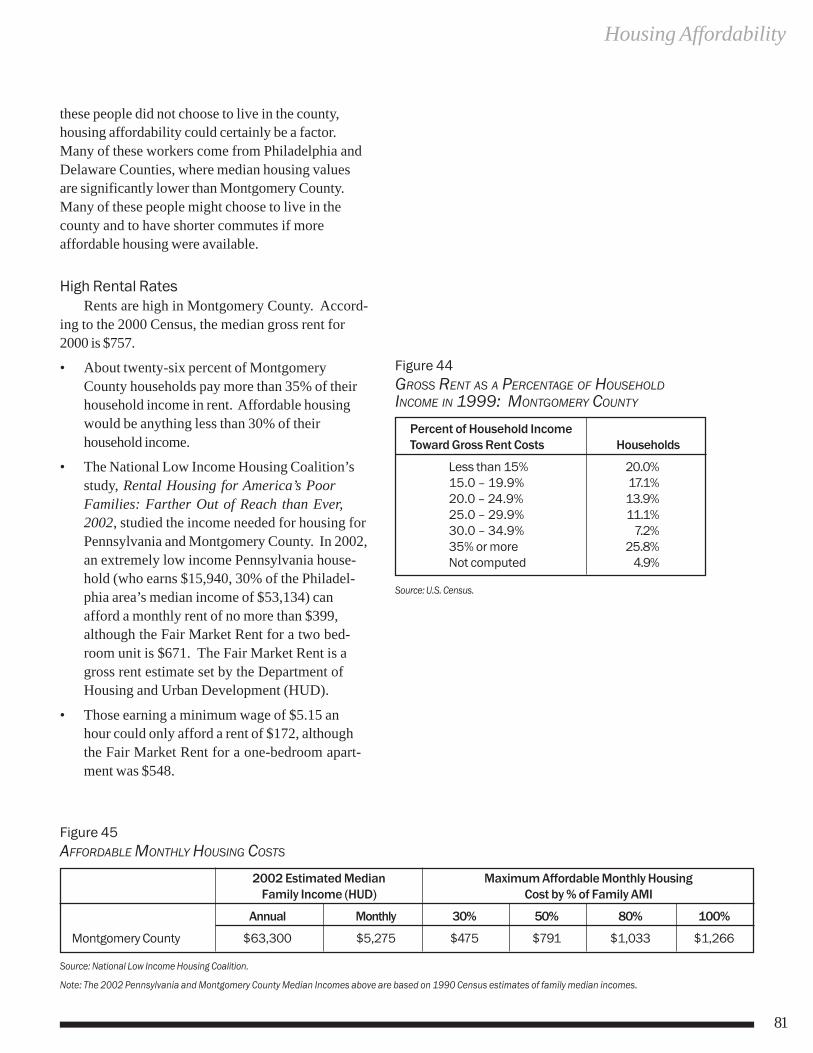
Housing Affordability
81
these people did not choose to live in the county, housing affordability could certainly be a factor. Many of these workers come from Philadelphia and Delaware Counties, where median housing values are significantly lower than Montgomery County. Many of these people might choose to live in the county and to have shorter commutes if more affordable housing were available.
High Rental Rates Rents are high in Montgomery County. Accord-
ing to the 2000 Census, the median gross rent for 2000 is $757.
• About twenty-six percent of Montgomery County households pay more than 35% of their household income in rent. Affordable housing would be anything less than 30% of their household income.
• The National Low Income Housing Coalition’s study, Rental Housing for America’s Poor Families: Farther Out of Reach than Ever, 2002, studied the income needed for housing for Pennsylvania and Montgomery County. In 2002, an extremely low income Pennsylvania house-hold (who earns $15,940, 30% of the Philadel-phia area’s median income of $53,134) can afford a monthly rent of no more than $399, although the Fair Market Rent for a two bed-room unit is $671. The Fair Market Rent is a gross rent estimate set by the Department of Housing and Urban Development (HUD).
• Those earning a minimum wage of $5.15 an hour could only afford a rent of $172, although the Fair Market Rent for a one-bedroom apart-ment was $548.
Figure 44 GROSS RENT AS A PERCENTAGE OF HOUSEHOLD INCOME IN 1999: MONTGOMERY COUNTY
Percent of Household Income Toward Gross Rent Costs Households
Less than 15% 20.0% 15.0 – 19.9% 17.1% 20.0 – 24.9% 13.9% 25.0 – 29.9% 11.1% 30.0 – 34.9% 7.2% 35% or more 25.8% Not computed 4.9%
Source: U.S. Census.
Figure 45 AFFORDABLE MONTHLY HOUSING COSTS
2002 Estimated Median Maximum Affordable Monthly Housing Family Income (HUD) Cost by % of Family AMI
Annual Monthly 30% 50% 80% 100%
Montgomery County $63,300 $5,275 $475 $791 $1,033 $1,266
Source: National Low Income Housing Coalition.
Note: The 2002 Pennsylvania and Montgomery County Median Incomes above are based on 1990 Census estimates of family median incomes.
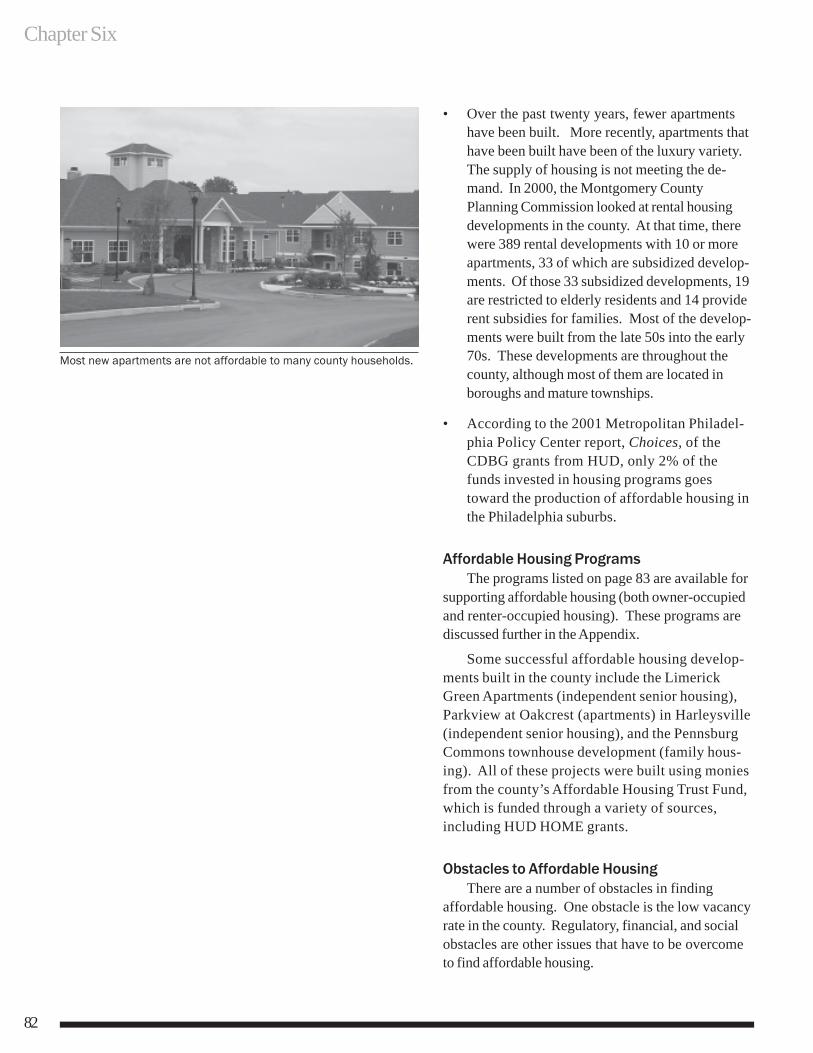
Chapter Six
82
• Over the past twenty years, fewer apartments have been built. More recently, apartments that have been built have been of the luxury variety. The supply of housing is not meeting the de-mand. In 2000, the Montgomery County Planning Commission looked at rental housing developments in the county. At that time, there were 389 rental developments with 10 or more apartments, 33 of which are subsidized develop-ments. Of those 33 subsidized developments, 19 are restricted to elderly residents and 14 provide rent subsidies for families. Most of the develop-ments were built from the late 50s into the early 70s. These developments are throughout the county, although most of them are located in boroughs and mature townships.
• According to the 2001 Metropolitan Philadel-phia Policy Center report, Choices, of the CDBG grants from HUD, only 2% of the funds invested in housing programs goes toward the production of affordable housing in the Philadelphia suburbs.
Affordable Housing Programs The programs listed on page 83 are available for
supporting affordable housing (both owner-occupied and renter-occupied housing). These programs are discussed further in the Appendix.
Some successful affordable housing develop-ments built in the county include the Limerick Green Apartments (independent senior housing), Parkview at Oakcrest (apartments) in Harleysville (independent senior housing), and the Pennsburg Commons townhouse development (family hous-ing). All of these projects were built using monies from the county’s Affordable Housing Trust Fund, which is funded through a variety of sources, including HUD HOME grants.
Obstacles to Affordable Housing There are a number of obstacles in finding
affordable housing. One obstacle is the low vacancy rate in the county. Regulatory, financial, and social obstacles are other issues that have to be overcome to find affordable housing.
Most new apartments are not affordable to many county households.
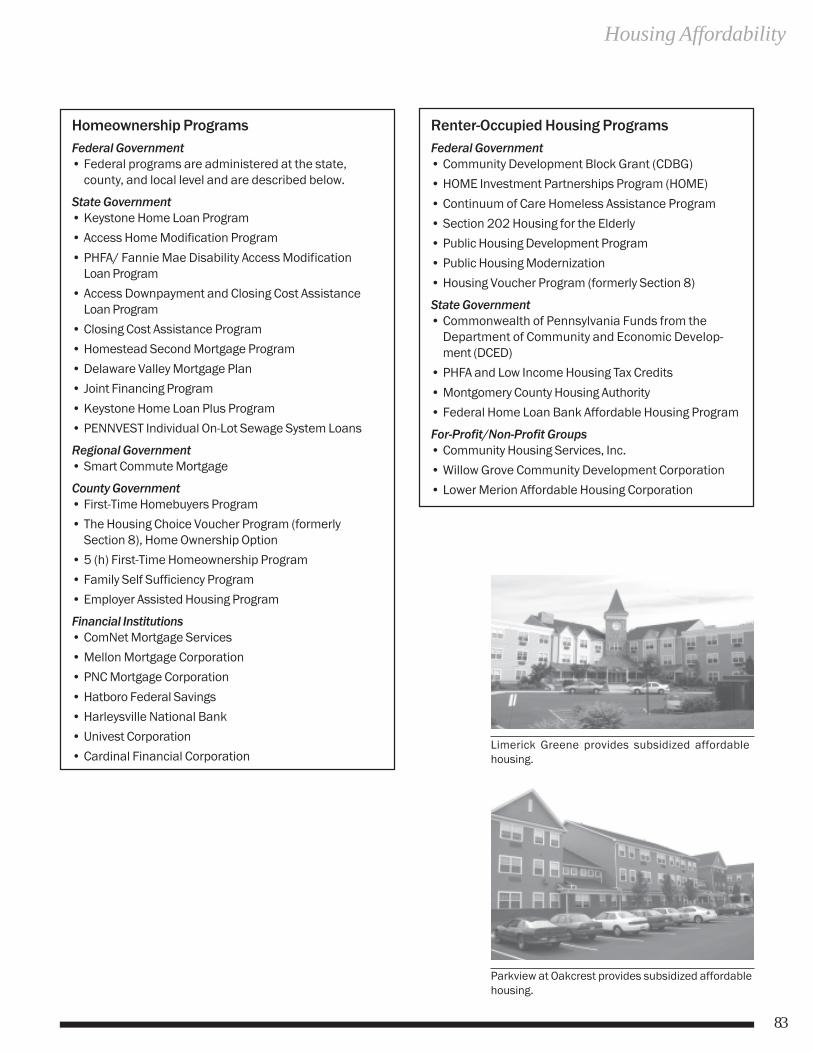
Housing Affordability
83
Homeownership Programs Federal Government • Federal programs are administered at the state,
county, and local level and are described below.
State Government • Keystone Home Loan Program
• Access Home Modification Program
• PHFA/ Fannie Mae Disability Access Modification Loan Program
• Access Downpayment and Closing Cost Assistance Loan Program
• Closing Cost Assistance Program
• Homestead Second Mortgage Program
• Delaware Valley Mortgage Plan
• Joint Financing Program
• Keystone Home Loan Plus Program
• PENNVEST Individual On-Lot Sewage System Loans
Regional Government • Smart Commute Mortgage
County Government • First-Time Homebuyers Program
• The Housing Choice Voucher Program (formerly Section 8), Home Ownership Option
• 5 (h) First-Time Homeownership Program
• Family Self Sufficiency Program
• Employer Assisted Housing Program
Financial Institutions • ComNet Mortgage Services
• Mellon Mortgage Corporation
• PNC Mortgage Corporation
• Hatboro Federal Savings
• Harleysville National Bank
• Univest Corporation
• Cardinal Financial Corporation
Renter-Occupied Housing Programs Federal Government • Community Development Block Grant (CDBG)
• HOME Investment Partnerships Program (HOME)
• Continuum of Care Homeless Assistance Program
• Section 202 Housing for the Elderly
• Public Housing Development Program
• Public Housing Modernization
• Housing Voucher Program (formerly Section 8)
State Government • Commonwealth of Pennsylvania Funds from the
Department of Community and Economic Develop-ment (DCED)
• PHFA and Low Income Housing Tax Credits
• Montgomery County Housing Authority
• Federal Home Loan Bank Affordable Housing Program
For-Profit/Non-Profit Groups • Community Housing Services, Inc.
• Willow Grove Community Development Corporation
• Lower Merion Affordable Housing Corporation
Parkview at Oakcrest provides subsidized affordable housing.
Limerick Greene provides subsidized affordable housing.
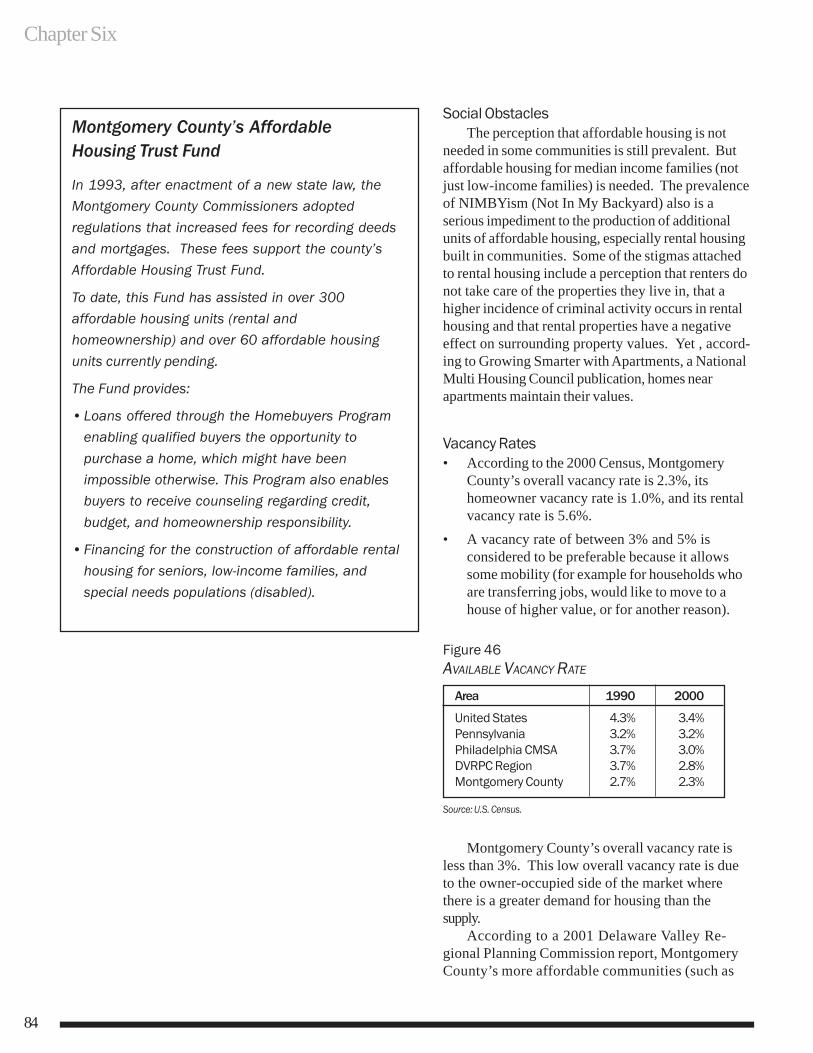
Chapter Six
84
Social Obstacles The perception that affordable housing is not
needed in some communities is still prevalent. But affordable housing for median income families (not just low-income families) is needed. The prevalence of NIMBYism (Not In My Backyard) also is a serious impediment to the production of additional units of affordable housing, especially rental housing built in communities. Some of the stigmas attached to rental housing include a perception that renters do not take care of the properties they live in, that a higher incidence of criminal activity occurs in rental housing and that rental properties have a negative effect on surrounding property values. Yet , accord-ing to Growing Smarter with Apartments, a National Multi Housing Council publication, homes near apartments maintain their values.
Vacancy Rates • According to the 2000 Census, Montgomery
County’s overall vacancy rate is 2.3%, its homeowner vacancy rate is 1.0%, and its rental vacancy rate is 5.6%.
• A vacancy rate of between 3% and 5% is considered to be preferable because it allows some mobility (for example for households who are transferring jobs, would like to move to a house of higher value, or for another reason).
Figure 46 AVAILABLE VACANCY RATE
Area 1990 2000
United States 4.3% 3.4% Pennsylvania 3.2% 3.2% Philadelphia CMSA 3.7% 3.0% DVRPC Region 3.7% 2.8% Montgomery County 2.7% 2.3%
Source: U.S. Census.
Montgomery County’s overall vacancy rate is less than 3%. This low overall vacancy rate is due to the owner-occupied side of the market where there is a greater demand for housing than the supply.
According to a 2001 Delaware Valley Re-gional Planning Commission report, Montgomery County’s more affordable communities (such as
Montgomery County’s Affordable Housing Trust Fund
In 1993, after enactment of a new state law, the Montgomery County Commissioners adopted
regulations that increased fees for recording deeds and mortgages. These fees support the county’s Affordable Housing Trust Fund.
To date, this Fund has assisted in over 300 affordable housing units (rental and homeownership) and over 60 affordable housing
units currently pending.
The Fund provides:
• Loans offered through the Homebuyers Program enabling qualified buyers the opportunity to
purchase a home, which might have been impossible otherwise. This Program also enables buyers to receive counseling regarding credit, budget, and homeownership responsibility.
• Financing for the construction of affordable rental housing for seniors, low-income families, and
special needs populations (disabled).
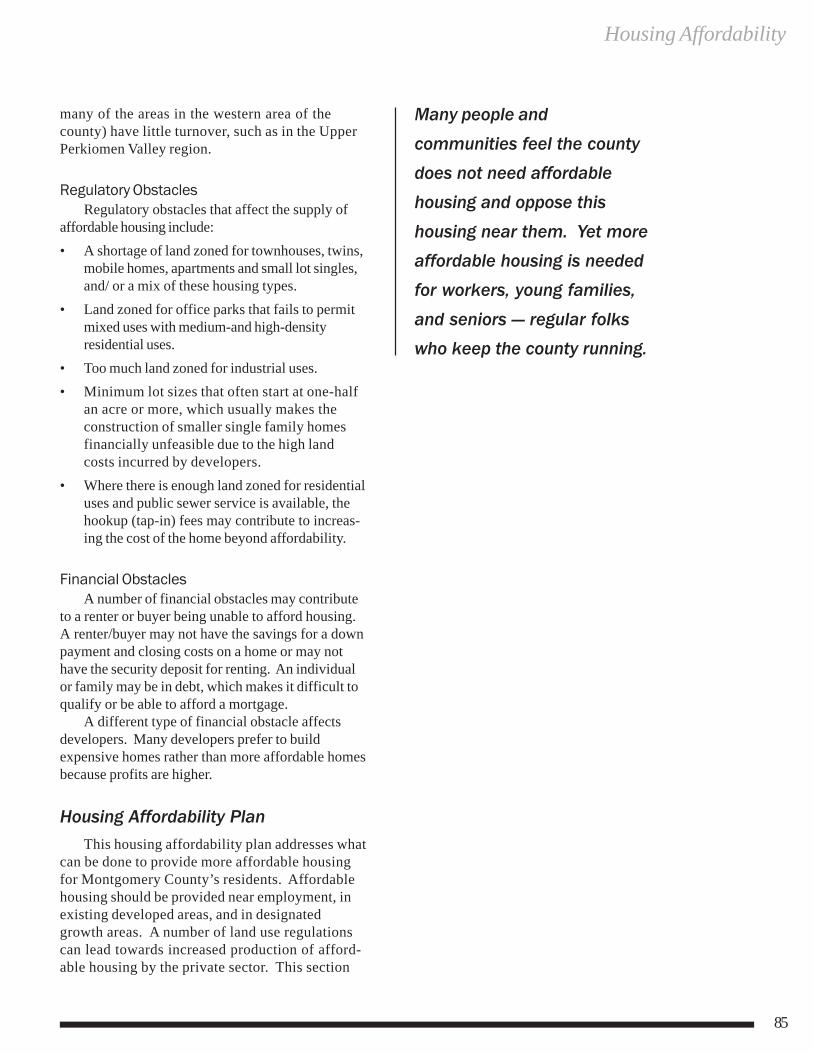
Housing Affordability
85
many of the areas in the western area of the county) have little turnover, such as in the Upper Perkiomen Valley region.
Regulatory Obstacles Regulatory obstacles that affect the supply of
affordable housing include: • A shortage of land zoned for townhouses, twins,
mobile homes, apartments and small lot singles, and/ or a mix of these housing types.
• Land zoned for office parks that fails to permit mixed uses with medium-and high-density residential uses.
• Too much land zoned for industrial uses. • Minimum lot sizes that often start at one-half
an acre or more, which usually makes the construction of smaller single family homes financially unfeasible due to the high land costs incurred by developers.
• Where there is enough land zoned for residential uses and public sewer service is available, the hookup (tap-in) fees may contribute to increas-ing the cost of the home beyond affordability.
Financial Obstacles A number of financial obstacles may contribute
to a renter or buyer being unable to afford housing. A renter/buyer may not have the savings for a down payment and closing costs on a home or may not have the security deposit for renting. An individual or family may be in debt, which makes it difficult to qualify or be able to afford a mortgage.
A different type of financial obstacle affects developers. Many developers prefer to build expensive homes rather than more affordable homes because profits are higher.
Housing Affordability Plan This housing affordability plan addresses what
can be done to provide more affordable housing for Montgomery County’s residents. Affordable housing should be provided near employment, in existing developed areas, and in designated growth areas. A number of land use regulations can lead towards increased production of afford-able housing by the private sector. This section
Many people and
communities feel the county
does not need affordable
housing and oppose this
housing near them. Yet more
affordable housing is needed
for workers, young families,
and seniors — regular folks
who keep the county running.
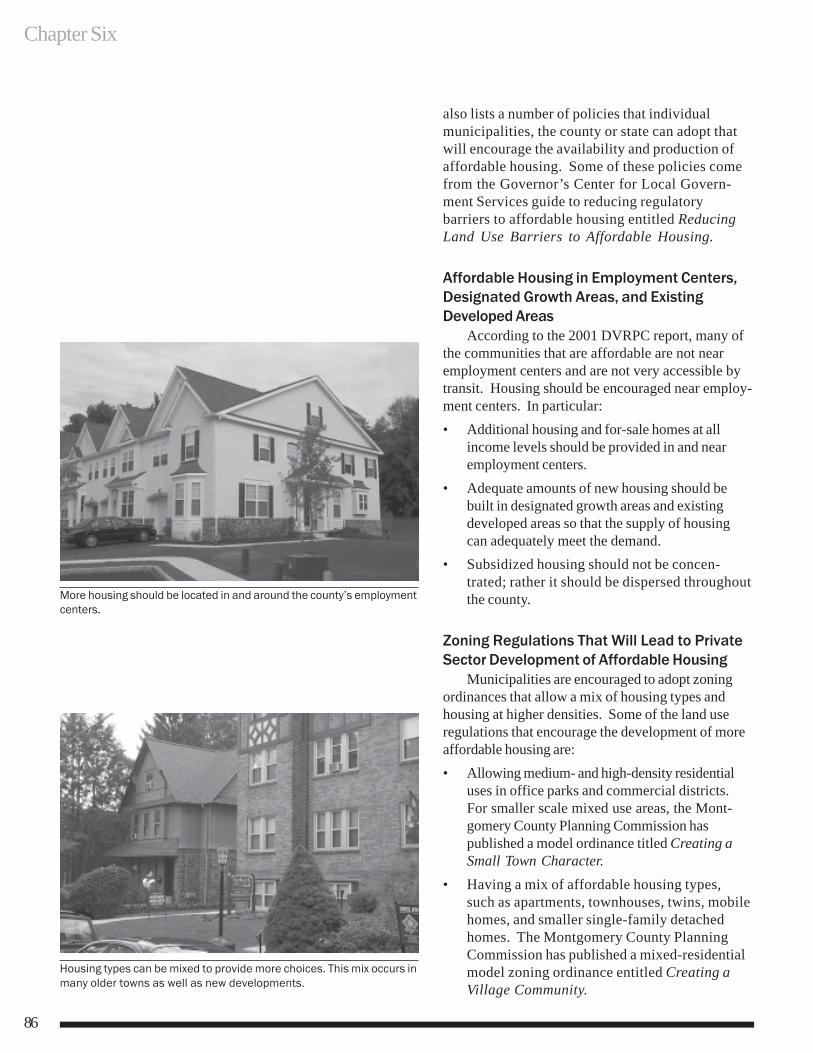
Chapter Six
86
also lists a number of policies that individual municipalities, the county or state can adopt that will encourage the availability and production of affordable housing. Some of these policies come from the Governor’s Center for Local Govern-ment Services guide to reducing regulatory barriers to affordable housing entitled Reducing Land Use Barriers to Affordable Housing.
Affordable Housing in Employment Centers, Designated Growth Areas, and Existing Developed Areas
According to the 2001 DVRPC report, many of the communities that are affordable are not near employment centers and are not very accessible by transit. Housing should be encouraged near employ-ment centers. In particular: • Additional housing and for-sale homes at all
income levels should be provided in and near employment centers.
• Adequate amounts of new housing should be built in designated growth areas and existing developed areas so that the supply of housing can adequately meet the demand.
• Subsidized housing should not be concen-trated; rather it should be dispersed throughout the county.
Zoning Regulations That Will Lead to Private Sector Development of Affordable Housing
Municipalities are encouraged to adopt zoning ordinances that allow a mix of housing types and housing at higher densities. Some of the land use regulations that encourage the development of more affordable housing are: • Allowing medium- and high-density residential
uses in office parks and commercial districts. For smaller scale mixed use areas, the Mont-gomery County Planning Commission has published a model ordinance titled Creating a Small Town Character.
• Having a mix of affordable housing types, such as apartments, townhouses, twins, mobile homes, and smaller single-family detached homes. The Montgomery County Planning Commission has published a mixed-residential model zoning ordinance entitled Creating a Village Community.
More housing should be located in and around the county’s employment centers.
Housing types can be mixed to provide more choices. This mix occurs in many older towns as well as new developments.
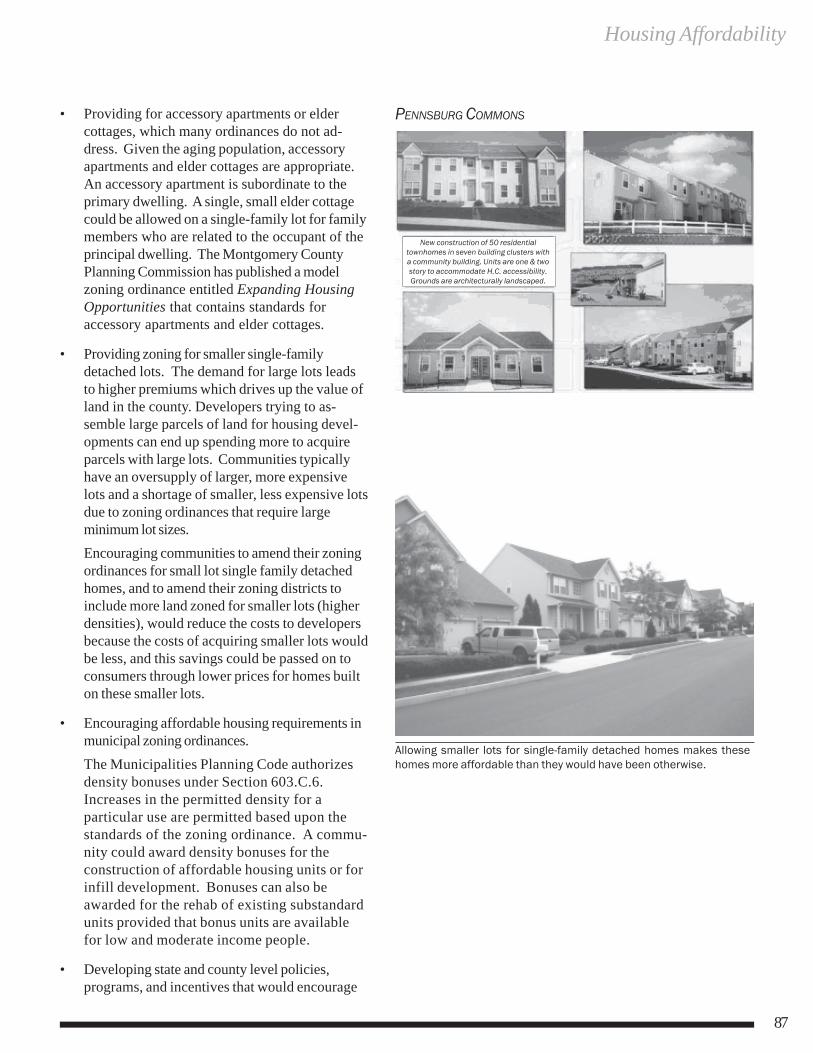
Housing Affordability
87
• Providing for accessory apartments or elder cottages, which many ordinances do not ad-dress. Given the aging population, accessory apartments and elder cottages are appropriate. An accessory apartment is subordinate to the primary dwelling. A single, small elder cottage could be allowed on a single-family lot for family members who are related to the occupant of the principal dwelling. The Montgomery County Planning Commission has published a model zoning ordinance entitled Expanding Housing Opportunities that contains standards for accessory apartments and elder cottages.
• Providing zoning for smaller single-family detached lots. The demand for large lots leads to higher premiums which drives up the value of land in the county. Developers trying to as-semble large parcels of land for housing devel-opments can end up spending more to acquire parcels with large lots. Communities typically have an oversupply of larger, more expensive lots and a shortage of smaller, less expensive lots due to zoning ordinances that require large minimum lot sizes. Encouraging communities to amend their zoning ordinances for small lot single family detached homes, and to amend their zoning districts to include more land zoned for smaller lots (higher densities), would reduce the costs to developers because the costs of acquiring smaller lots would be less, and this savings could be passed on to consumers through lower prices for homes built on these smaller lots.
• Encouraging affordable housing requirements in municipal zoning ordinances. The Municipalities Planning Code authorizes density bonuses under Section 603.C.6. Increases in the permitted density for a particular use are permitted based upon the standards of the zoning ordinance. A commu-nity could award density bonuses for the construction of affordable housing units or for infill development. Bonuses can also be awarded for the rehab of existing substandard units provided that bonus units are available for low and moderate income people.
• Developing state and county level policies, programs, and incentives that would encourage
PENNSBURG COMMONS
Allowing smaller lots for single-family detached homes makes these homes more affordable than they would have been otherwise.
New construction of 50 residential townhomes in seven building clusters with a community building. Units are one & two story to accommodate H.C. accessibility. Grounds are architecturally landscaped.
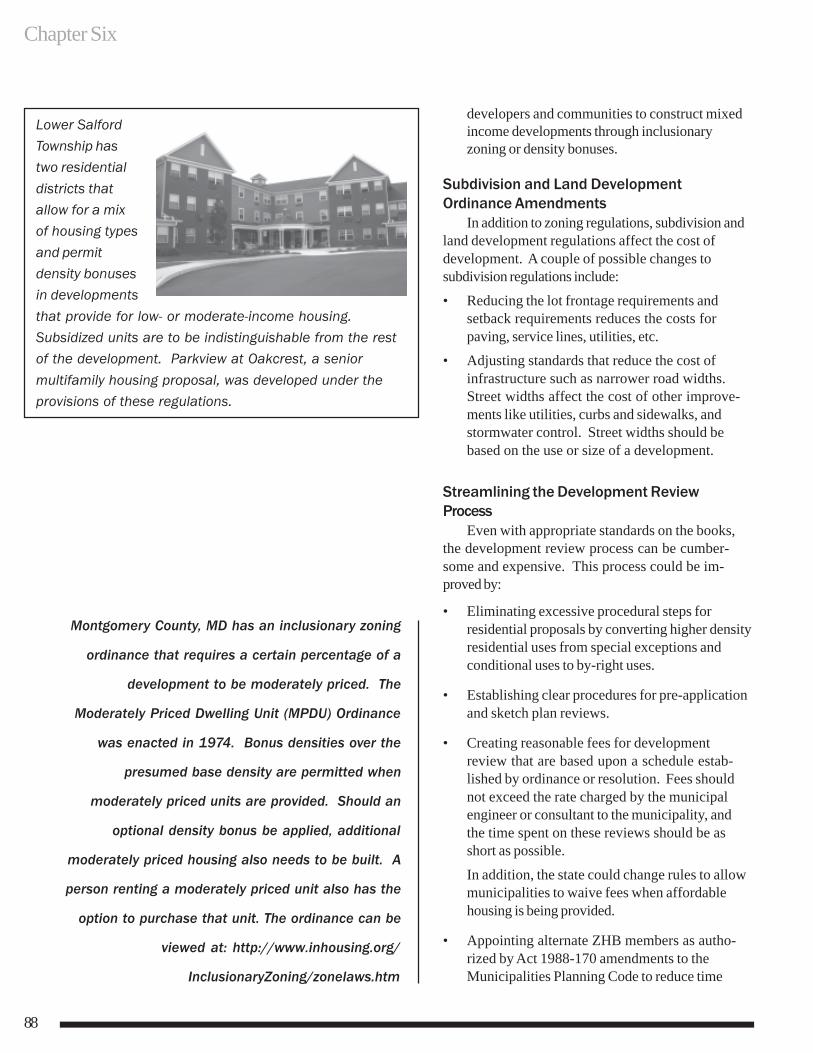
Chapter Six
88
developers and communities to construct mixed income developments through inclusionary zoning or density bonuses.
Subdivision and Land Development Ordinance Amendments
In addition to zoning regulations, subdivision and land development regulations affect the cost of development. A couple of possible changes to subdivision regulations include:
• Reducing the lot frontage requirements and setback requirements reduces the costs for paving, service lines, utilities, etc.
• Adjusting standards that reduce the cost of infrastructure such as narrower road widths. Street widths affect the cost of other improve-ments like utilities, curbs and sidewalks, and stormwater control. Street widths should be based on the use or size of a development.
Streamlining the Development Review Process
Even with appropriate standards on the books, the development review process can be cumber-some and expensive. This process could be im-proved by:
• Eliminating excessive procedural steps for residential proposals by converting higher density residential uses from special exceptions and conditional uses to by-right uses.
• Establishing clear procedures for pre-application and sketch plan reviews.
• Creating reasonable fees for development review that are based upon a schedule estab-lished by ordinance or resolution. Fees should not exceed the rate charged by the municipal engineer or consultant to the municipality, and the time spent on these reviews should be as short as possible.
In addition, the state could change rules to allow municipalities to waive fees when affordable housing is being provided.
• Appointing alternate ZHB members as autho-rized by Act 1988-170 amendments to the Municipalities Planning Code to reduce time
Lower Salford Township has two residential districts that allow for a mix of housing types
and permit density bonuses in developments
that provide for low- or moderate-income housing. Subsidized units are to be indistinguishable from the rest of the development. Parkview at Oakcrest, a senior multifamily housing proposal, was developed under the provisions of these regulations.
Montgomery County, MD has an inclusionary zoning
ordinance that requires a certain percentage of a
development to be moderately priced. The
Moderately Priced Dwelling Unit (MPDU) Ordinance
was enacted in 1974. Bonus densities over the
presumed base density are permitted when
moderately priced units are provided. Should an
optional density bonus be applied, additional
moderately priced housing also needs to be built. A
person renting a moderately priced unit also has the
option to purchase that unit. The ordinance can be
viewed at: http://www.inhousing.org/
InclusionaryZoning/zonelaws.htm
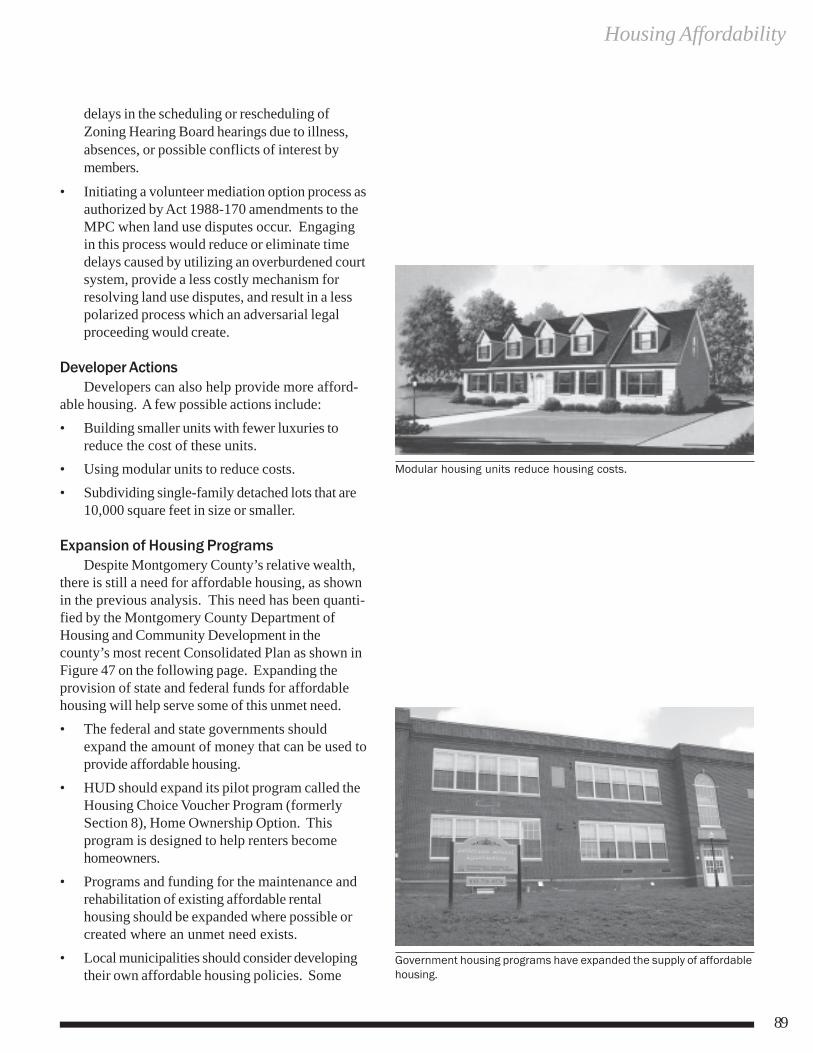
Housing Affordability
89
delays in the scheduling or rescheduling of Zoning Hearing Board hearings due to illness, absences, or possible conflicts of interest by members.
• Initiating a volunteer mediation option process as authorized by Act 1988-170 amendments to the MPC when land use disputes occur. Engaging in this process would reduce or eliminate time delays caused by utilizing an overburdened court system, provide a less costly mechanism for resolving land use disputes, and result in a less polarized process which an adversarial legal proceeding would create.
Developer Actions Developers can also help provide more afford-
able housing. A few possible actions include: • Building smaller units with fewer luxuries to
reduce the cost of these units. • Using modular units to reduce costs. • Subdividing single-family detached lots that are
10,000 square feet in size or smaller.
Expansion of Housing Programs Despite Montgomery County’s relative wealth,
there is still a need for affordable housing, as shown in the previous analysis. This need has been quanti-fied by the Montgomery County Department of Housing and Community Development in the county’s most recent Consolidated Plan as shown in Figure 47 on the following page. Expanding the provision of state and federal funds for affordable housing will help serve some of this unmet need. • The federal and state governments should
expand the amount of money that can be used to provide affordable housing.
• HUD should expand its pilot program called the Housing Choice Voucher Program (formerly Section 8), Home Ownership Option. This program is designed to help renters become homeowners.
• Programs and funding for the maintenance and rehabilitation of existing affordable rental housing should be expanded where possible or created where an unmet need exists.
• Local municipalities should consider developing their own affordable housing policies. Some
Modular housing units reduce housing costs.
Government housing programs have expanded the supply of affordable housing.
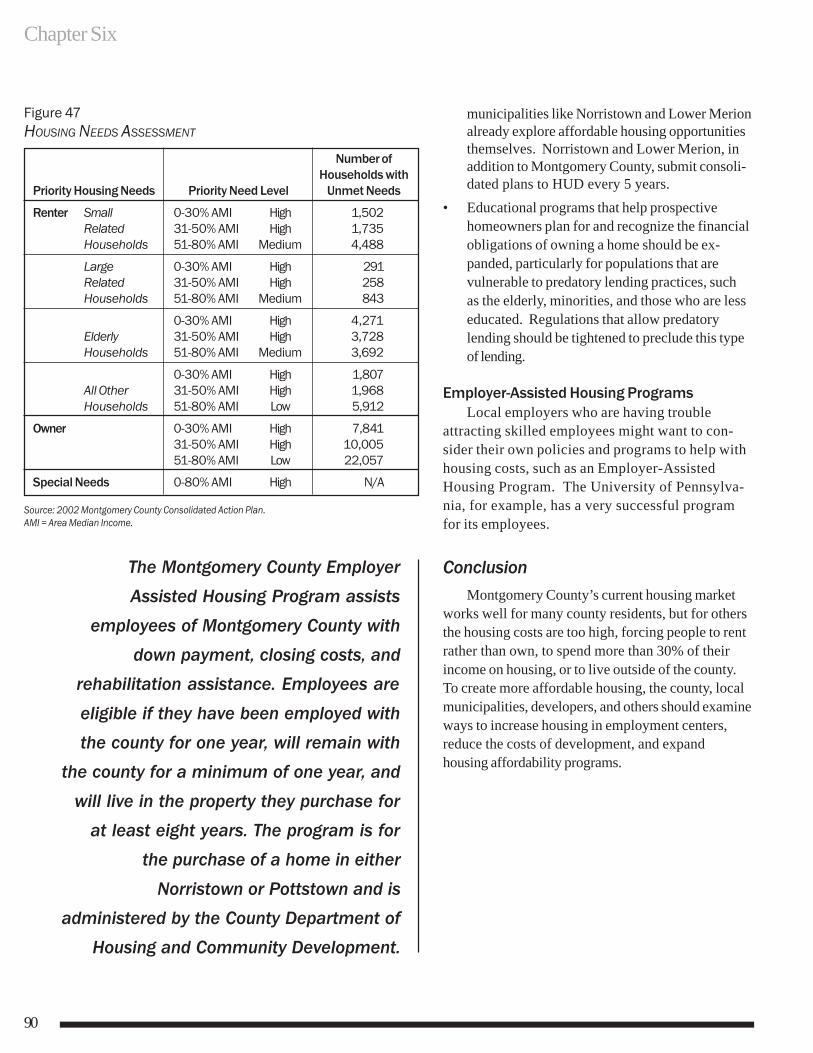
Chapter Six
90
municipalities like Norristown and Lower Merion already explore affordable housing opportunities themselves. Norristown and Lower Merion, in addition to Montgomery County, submit consoli-dated plans to HUD every 5 years.
• Educational programs that help prospective homeowners plan for and recognize the financial obligations of owning a home should be ex-panded, particularly for populations that are vulnerable to predatory lending practices, such as the elderly, minorities, and those who are less educated. Regulations that allow predatory lending should be tightened to preclude this type of lending.
Employer-Assisted Housing Programs Local employers who are having trouble
attracting skilled employees might want to con-sider their own policies and programs to help with housing costs, such as an Employer-Assisted Housing Program. The University of Pennsylva-nia, for example, has a very successful program for its employees.
Conclusion Montgomery County’s current housing market
works well for many county residents, but for others the housing costs are too high, forcing people to rent rather than own, to spend more than 30% of their income on housing, or to live outside of the county. To create more affordable housing, the county, local municipalities, developers, and others should examine ways to increase housing in employment centers, reduce the costs of development, and expand housing affordability programs.
The Montgomery County Employer Assisted Housing Program assists
employees of Montgomery County with
down payment, closing costs, and
rehabilitation assistance. Employees are
eligible if they have been employed with
the county for one year, will remain with
the county for a minimum of one year, and
will live in the property they purchase for at least eight years. The program is for
the purchase of a home in either
Norristown or Pottstown and is
administered by the County Department of Housing and Community Development.
Figure 47 HOUSING NEEDS ASSESSMENT
Number of Households with
Priority Housing Needs Priority Need Level Unmet Needs
Renter Small 0-30% AMI High 1,502 Related 31-50% AMI High 1,735 Households 51-80% AMI Medium 4,488
Large 0-30% AMI High 291 Related 31-50% AMI High 258 Households 51-80% AMI Medium 843
0-30% AMI High 4,271 Elderly 31-50% AMI High 3,728 Households 51-80% AMI Medium 3,692
0-30% AMI High 1,807 All Other 31-50% AMI High 1,968 Households 51-80% AMI Low 5,912
Owner 0-30% AMI High 7,841 31-50% AMI High 10,005 51-80% AMI Low 22,057
Special Needs 0-80% AMI High N/A
Source: 2002 Montgomery County Consolidated Action Plan. AMI = Area Median Income.
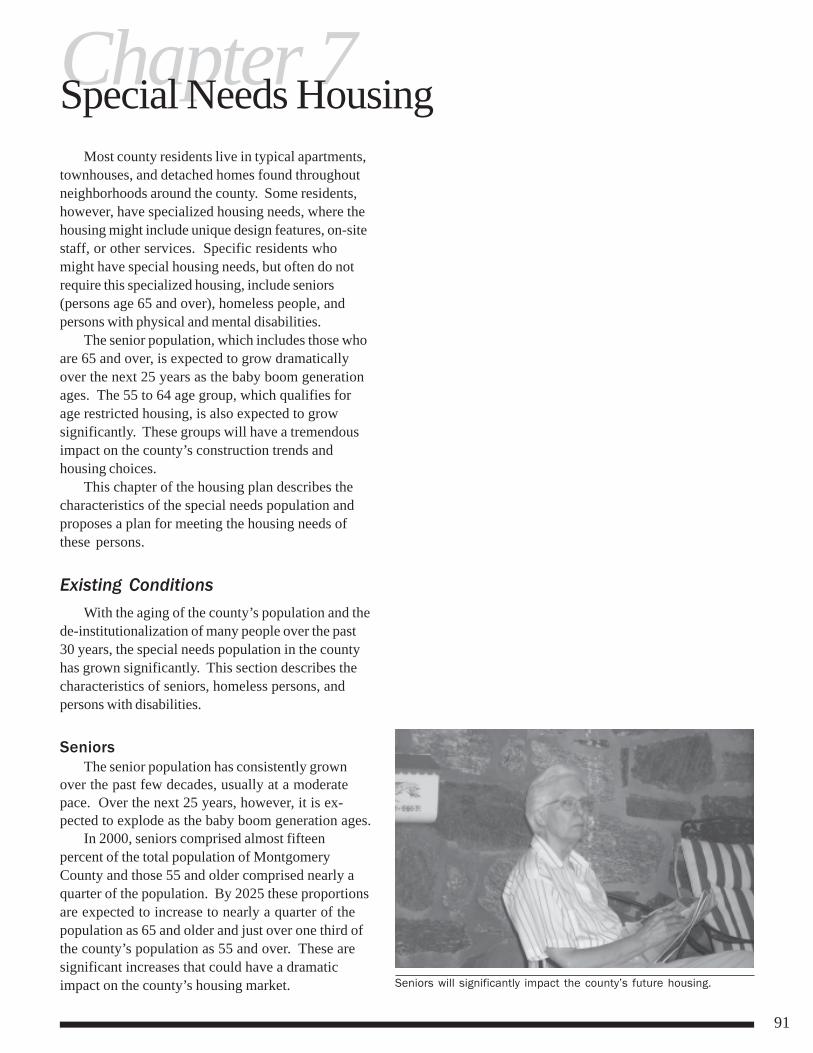
91
Chapter 7Special Needs HousingMost county residents live in typical apartments,
townhouses, and detached homes found throughoutneighborhoods around the county. Some residents,however, have specialized housing needs, where thehousing might include unique design features, on-sitestaff, or other services. Specific residents whomight have special housing needs, but often do notrequire this specialized housing, include seniors(persons age 65 and over), homeless people, andpersons with physical and mental disabilities.
The senior population, which includes those whoare 65 and over, is expected to grow dramaticallyover the next 25 years as the baby boom generationages. The 55 to 64 age group, which qualifies forage restricted housing, is also expected to growsignificantly. These groups will have a tremendousimpact on the county’s construction trends andhousing choices.
This chapter of the housing plan describes thecharacteristics of the special needs population andproposes a plan for meeting the housing needs ofthese persons.
Existing ConditionsWith the aging of the county’s population and the
de-institutionalization of many people over the past30 years, the special needs population in the countyhas grown significantly. This section describes thecharacteristics of seniors, homeless persons, andpersons with disabilities.
SeniorsThe senior population has consistently grown
over the past few decades, usually at a moderatepace. Over the next 25 years, however, it is ex-pected to explode as the baby boom generation ages.
In 2000, seniors comprised almost fifteenpercent of the total population of MontgomeryCounty and those 55 and older comprised nearly aquarter of the population. By 2025 these proportionsare expected to increase to nearly a quarter of thepopulation as 65 and older and just over one third ofthe county’s population as 55 and over. These aresignificant increases that could have a dramaticimpact on the county’s housing market. Seniors will significantly impact the county’s future housing.
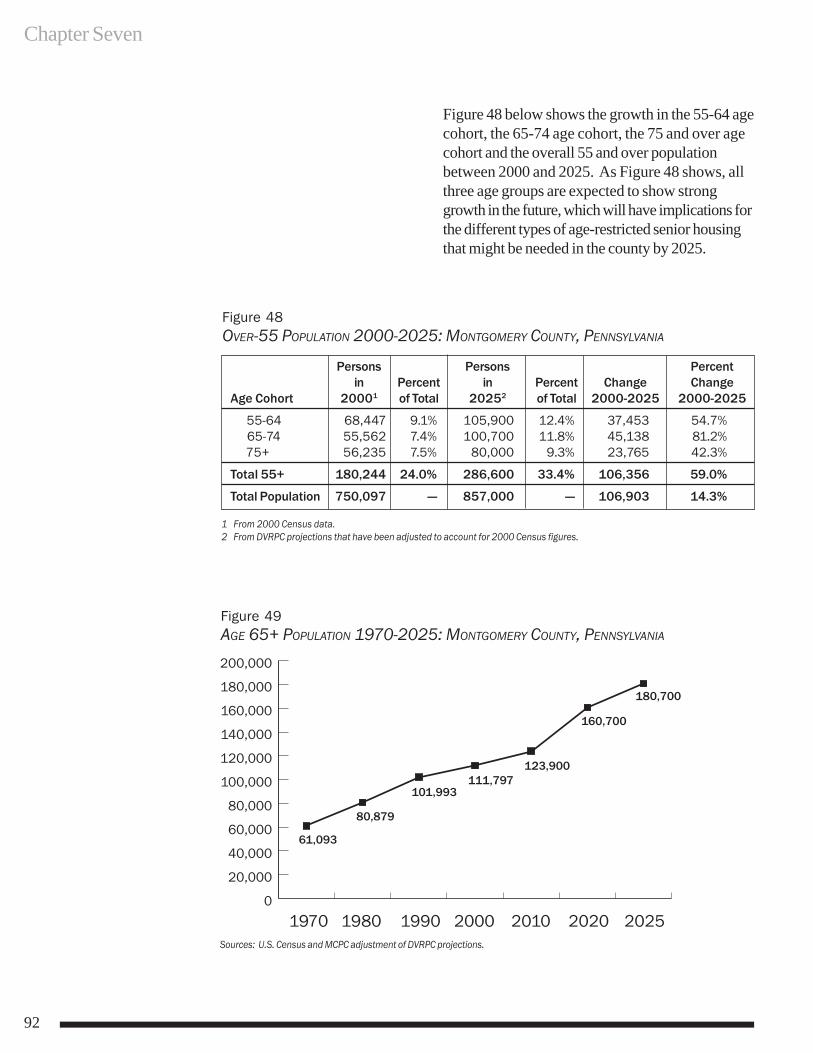
Chapter Seven
92
Figure 48 below shows the growth in the 55-64 agecohort, the 65-74 age cohort, the 75 and over agecohort and the overall 55 and over populationbetween 2000 and 2025. As Figure 48 shows, allthree age groups are expected to show stronggrowth in the future, which will have implications forthe different types of age-restricted senior housingthat might be needed in the county by 2025.
Persons Persons Percentin Percent in Percent Change Change
Age Cohort 20001 of Total 20252 of Total 2000-2025 2000-2025
55-64 68,447 9.1% 105,900 12.4% 37,453 54.7% 65-74 55,562 7.4% 100,700 11.8% 45,138 81.2% 75+ 56,235 7.5% 80,000 9.3% 23,765 42.3%
Total 55+ 180,244 24.0% 286,600 33.4% 106,356 59.0%
Total Population 750,097 — 857,000 — 106,903 14.3%
1 From 2000 Census data.2 From DVRPC projections that have been adjusted to account for 2000 Census figures.
Figure 48OVER-55 POPULATION 2000-2025: MONTGOMERY COUNTY, PENNSYLVANIA
Figure 49AGE 65+ POPULATION 1970-2025: MONTGOMERY COUNTY, PENNSYLVANIA
Sources: U.S. Census and MCPC adjustment of DVRPC projections.
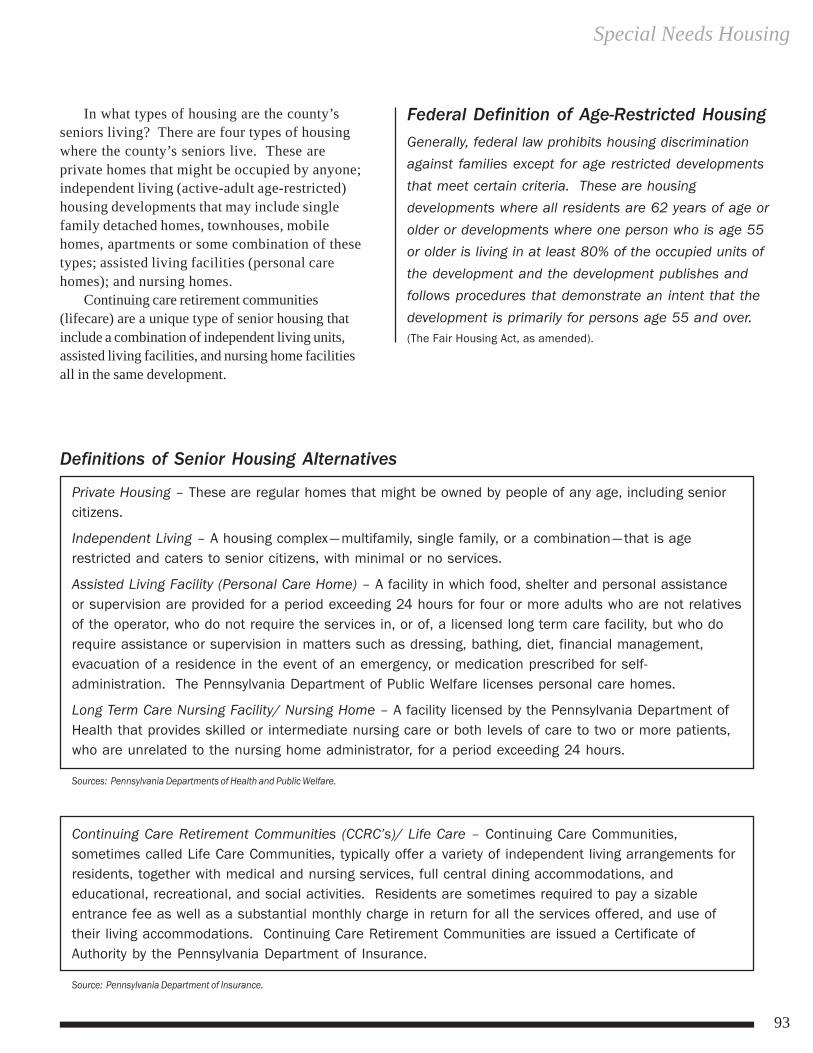
Special Needs Housing
93
In what types of housing are the county’sseniors living? There are four types of housingwhere the county’s seniors live. These areprivate homes that might be occupied by anyone;independent living (active-adult age-restricted)housing developments that may include singlefamily detached homes, townhouses, mobilehomes, apartments or some combination of thesetypes; assisted living facilities (personal carehomes); and nursing homes.
Continuing care retirement communities(lifecare) are a unique type of senior housing thatinclude a combination of independent living units,assisted living facilities, and nursing home facilitiesall in the same development.
Federal Definition of Age-Restricted HousingGenerally, federal law prohibits housing discriminationagainst families except for age restricted developmentsthat meet certain criteria. These are housingdevelopments where all residents are 62 years of age orolder or developments where one person who is age 55or older is living in at least 80% of the occupied units ofthe development and the development publishes andfollows procedures that demonstrate an intent that thedevelopment is primarily for persons age 55 and over.(The Fair Housing Act, as amended).
Definitions of Senior Housing Alternatives
Private Housing – These are regular homes that might be owned by people of any age, including seniorcitizens.
Independent Living – A housing complex— multifamily, single family, or a combination— that is agerestricted and caters to senior citizens, with minimal or no services.
Assisted Living Facility (Personal Care Home) – A facility in which food, shelter and personal assistanceor supervision are provided for a period exceeding 24 hours for four or more adults who are not relativesof the operator, who do not require the services in, or of, a licensed long term care facility, but who dorequire assistance or supervision in matters such as dressing, bathing, diet, financial management,evacuation of a residence in the event of an emergency, or medication prescribed for self-administration. The Pennsylvania Department of Public Welfare licenses personal care homes.
Long Term Care Nursing Facility/ Nursing Home – A facility licensed by the Pennsylvania Department ofHealth that provides skilled or intermediate nursing care or both levels of care to two or more patients,who are unrelated to the nursing home administrator, for a period exceeding 24 hours.
Sources: Pennsylvania Departments of Health and Public Welfare.
Continuing Care Retirement Communities (CCRC’s)/ Life Care – Continuing Care Communities,sometimes called Life Care Communities, typically offer a variety of independent living arrangements forresidents, together with medical and nursing services, full central dining accommodations, andeducational, recreational, and social activities. Residents are sometimes required to pay a sizableentrance fee as well as a substantial monthly charge in return for all the services offered, and use oftheir living accommodations. Continuing Care Retirement Communities are issued a Certificate ofAuthority by the Pennsylvania Department of Insurance.
Source: Pennsylvania Department of Insurance.
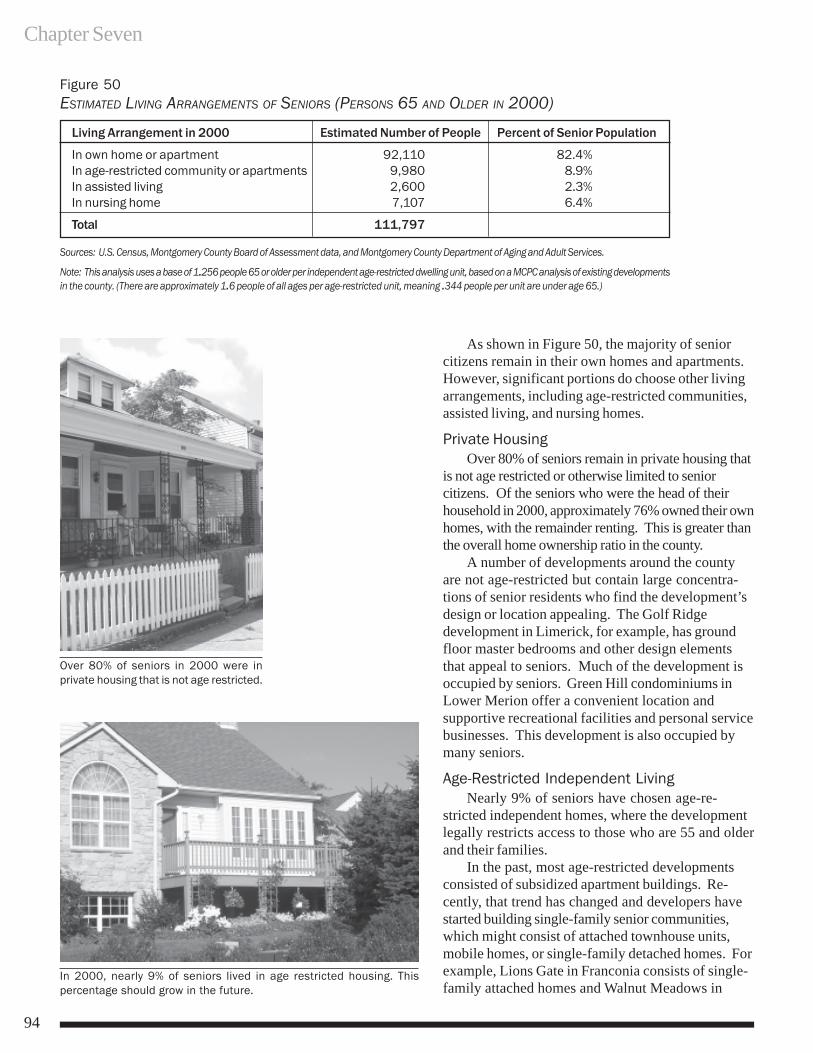
Chapter Seven
94
As shown in Figure 50, the majority of seniorcitizens remain in their own homes and apartments.However, significant portions do choose other livingarrangements, including age-restricted communities,assisted living, and nursing homes.
Private HousingOver 80% of seniors remain in private housing that
is not age restricted or otherwise limited to seniorcitizens. Of the seniors who were the head of theirhousehold in 2000, approximately 76% owned their ownhomes, with the remainder renting. This is greater thanthe overall home ownership ratio in the county.
A number of developments around the countyare not age-restricted but contain large concentra-tions of senior residents who find the development’sdesign or location appealing. The Golf Ridgedevelopment in Limerick, for example, has groundfloor master bedrooms and other design elementsthat appeal to seniors. Much of the development isoccupied by seniors. Green Hill condominiums inLower Merion offer a convenient location andsupportive recreational facilities and personal servicebusinesses. This development is also occupied bymany seniors.
Age-Restricted Independent LivingNearly 9% of seniors have chosen age-re-
stricted independent homes, where the developmentlegally restricts access to those who are 55 and olderand their families.
In the past, most age-restricted developmentsconsisted of subsidized apartment buildings. Re-cently, that trend has changed and developers havestarted building single-family senior communities,which might consist of attached townhouse units,mobile homes, or single-family detached homes. Forexample, Lions Gate in Franconia consists of single-family attached homes and Walnut Meadows in
Figure 50ESTIMATED LIVING ARRANGEMENTS OF SENIORS (PERSONS 65 AND OLDER IN 2000)
Living Arrangement in 2000 Estimated Number of People Percent of Senior Population
In own home or apartment 92,110 82.4%In age-restricted community or apartments 9,980 8.9%In assisted living 2,600 2.3%In nursing home 7,107 6.4%
Total 111,797
Sources: U.S. Census, Montgomery County Board of Assessment data, and Montgomery County Department of Aging and Adult Services.
Note: This analysis uses a base of 1.256 people 65 or older per independent age-restricted dwelling unit, based on a MCPC analysis of existing developmentsin the county. (There are approximately 1.6 people of all ages per age-restricted unit, meaning .344 people per unit are under age 65.)
In 2000, nearly 9% of seniors lived in age restricted housing. Thispercentage should grow in the future.
Over 80% of seniors in 2000 were inprivate housing that is not age restricted.
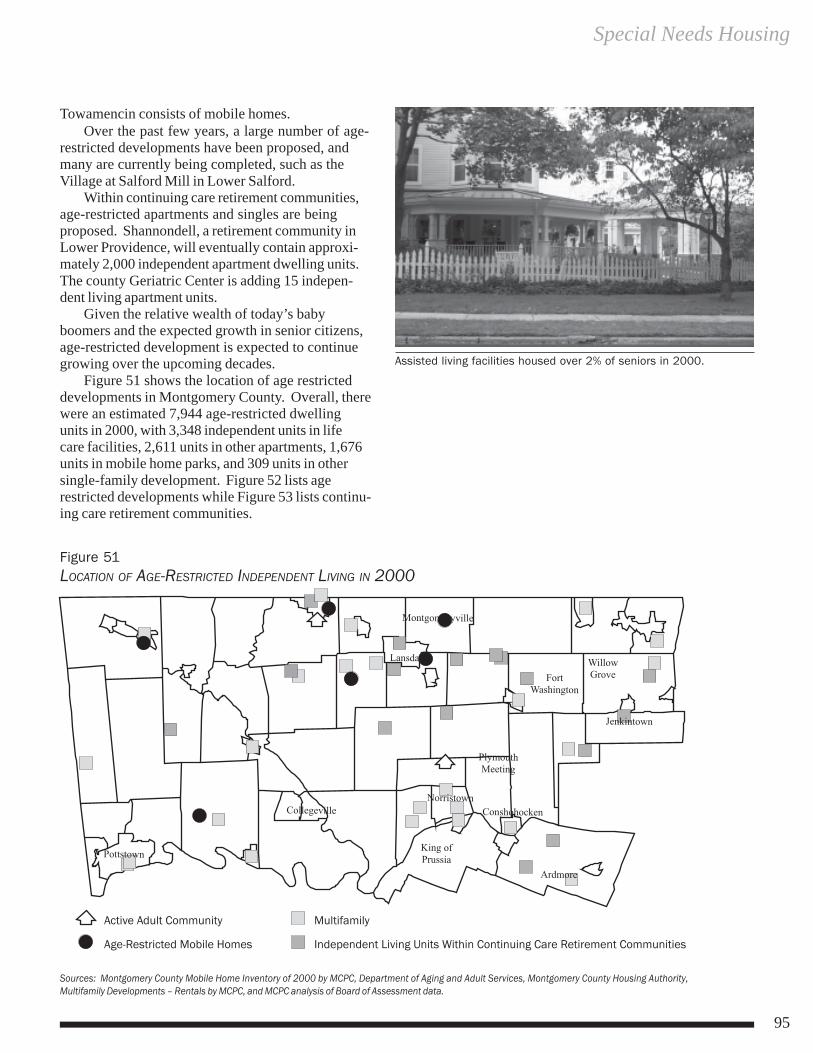
Special Needs Housing
95
Towamencin consists of mobile homes.Over the past few years, a large number of age-
restricted developments have been proposed, andmany are currently being completed, such as theVillage at Salford Mill in Lower Salford.
Within continuing care retirement communities,age-restricted apartments and singles are beingproposed. Shannondell, a retirement community inLower Providence, will eventually contain approxi-mately 2,000 independent apartment dwelling units.The county Geriatric Center is adding 15 indepen-dent living apartment units.
Given the relative wealth of today’s babyboomers and the expected growth in senior citizens,age-restricted development is expected to continuegrowing over the upcoming decades.
Figure 51 shows the location of age restricteddevelopments in Montgomery County. Overall, therewere an estimated 7,944 age-restricted dwellingunits in 2000, with 3,348 independent units in lifecare facilities, 2,611 units in other apartments, 1,676units in mobile home parks, and 309 units in othersingle-family development. Figure 52 lists agerestricted developments while Figure 53 lists continu-ing care retirement communities.
Figure 51LOCATION OF AGE-RESTRICTED INDEPENDENT LIVING IN 2000
Sources: Montgomery County Mobile Home Inventory of 2000 by MCPC, Department of Aging and Adult Services, Montgomery County Housing Authority,Multifamily Developments – Rentals by MCPC, and MCPC analysis of Board of Assessment data.
Assisted living facilities housed over 2% of seniors in 2000.
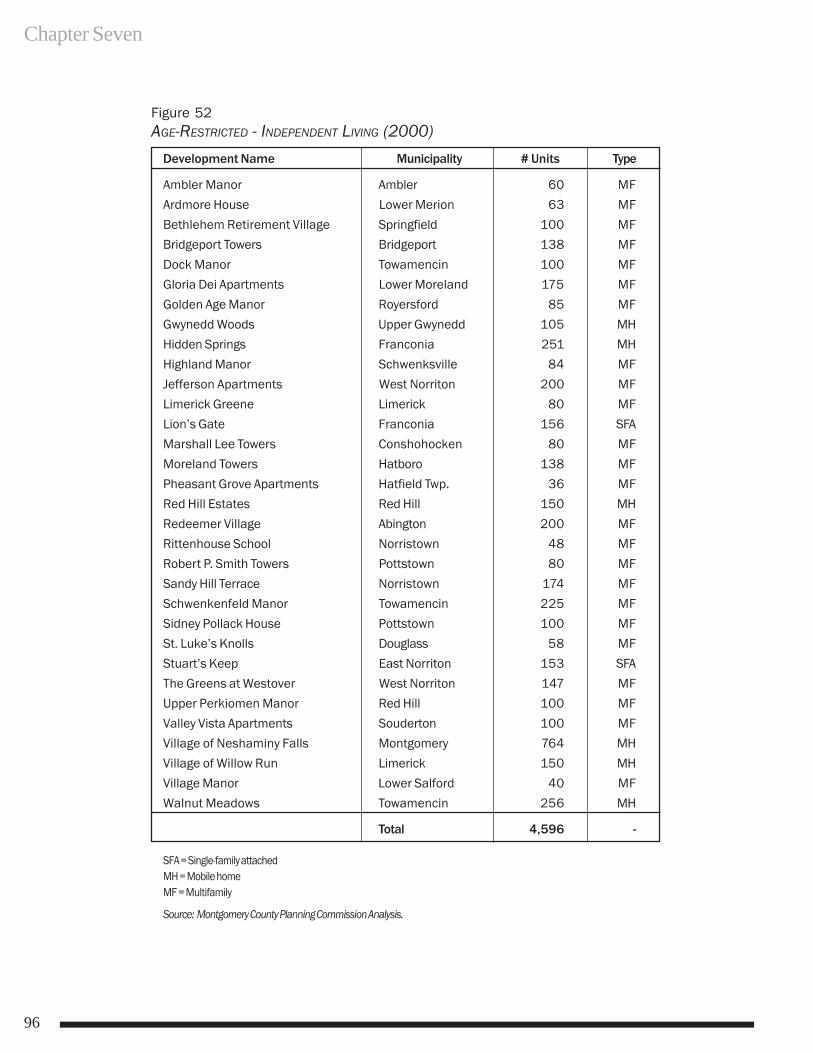
Chapter Seven
96
Figure 52AGE-RESTRICTED - INDEPENDENT LIVING (2000)
Development Name Municipality # Units Type
Ambler Manor Ambler 60 MF
Ardmore House Lower Merion 63 MF
Bethlehem Retirement Village Springfield 100 MF
Bridgeport Towers Bridgeport 138 MF
Dock Manor Towamencin 100 MF
Gloria Dei Apartments Lower Moreland 175 MF
Golden Age Manor Royersford 85 MF
Gwynedd Woods Upper Gwynedd 105 MH
Hidden Springs Franconia 251 MH
Highland Manor Schwenksville 84 MF
Jefferson Apartments West Norriton 200 MF
Limerick Greene Limerick 80 MF
Lion’s Gate Franconia 156 SFA
Marshall Lee Towers Conshohocken 80 MF
Moreland Towers Hatboro 138 MF
Pheasant Grove Apartments Hatfield Twp. 36 MF
Red Hill Estates Red Hill 150 MH
Redeemer Village Abington 200 MF
Rittenhouse School Norristown 48 MF
Robert P. Smith Towers Pottstown 80 MF
Sandy Hill Terrace Norristown 174 MF
Schwenkenfeld Manor Towamencin 225 MF
Sidney Pollack House Pottstown 100 MF
St. Luke’s Knolls Douglass 58 MF
Stuart’s Keep East Norriton 153 SFA
The Greens at Westover West Norriton 147 MF
Upper Perkiomen Manor Red Hill 100 MF
Valley Vista Apartments Souderton 100 MF
Village of Neshaminy Falls Montgomery 764 MH
Village of Willow Run Limerick 150 MH
Village Manor Lower Salford 40 MF
Walnut Meadows Towamencin 256 MH
Total 4,596 -
SFA = Single-family attachedMH = Mobile homeMF = Multifamily
Source: Montgomery County Planning Commission Analysis.
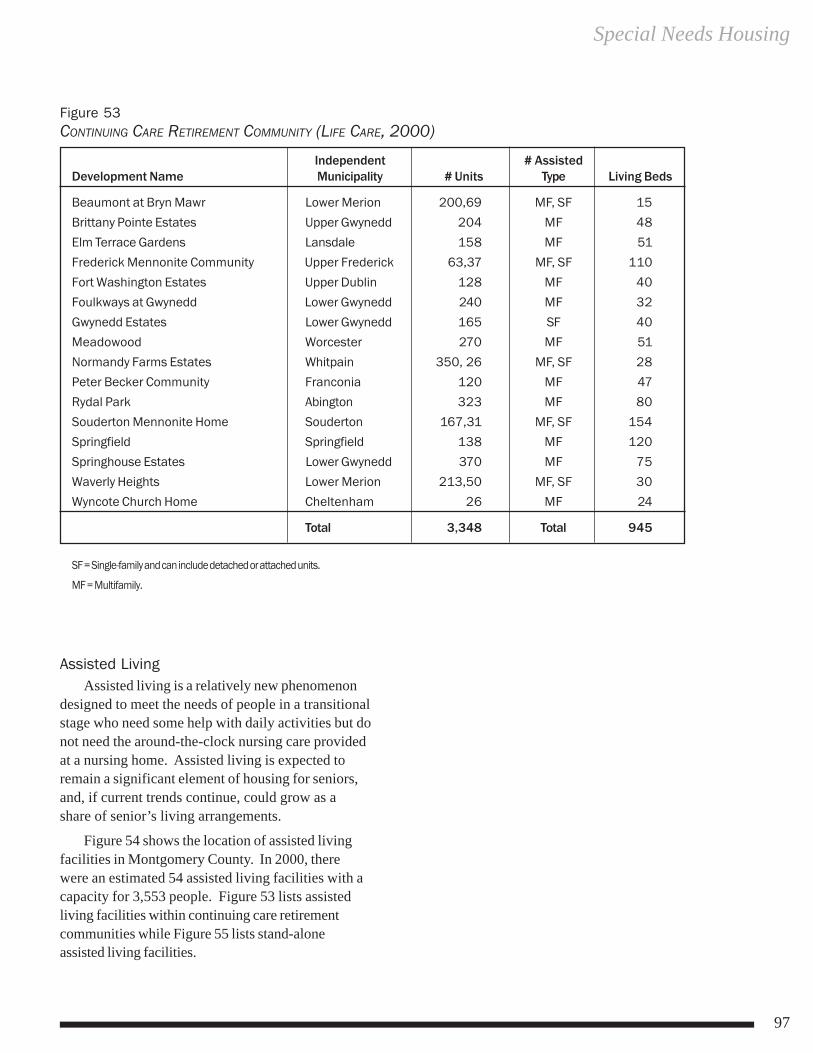
Special Needs Housing
97
Independent # AssistedDevelopment Name Municipality # Units Type Living Beds
Beaumont at Bryn Mawr Lower Merion 200,69 MF, SF 15
Brittany Pointe Estates Upper Gwynedd 204 MF 48
Elm Terrace Gardens Lansdale 158 MF 51
Frederick Mennonite Community Upper Frederick 63,37 MF, SF 110
Fort Washington Estates Upper Dublin 128 MF 40
Foulkways at Gwynedd Lower Gwynedd 240 MF 32
Gwynedd Estates Lower Gwynedd 165 SF 40
Meadowood Worcester 270 MF 51
Normandy Farms Estates Whitpain 350, 26 MF, SF 28
Peter Becker Community Franconia 120 MF 47
Rydal Park Abington 323 MF 80
Souderton Mennonite Home Souderton 167,31 MF, SF 154
Springfield Springfield 138 MF 120
Springhouse Estates Lower Gwynedd 370 MF 75
Waverly Heights Lower Merion 213,50 MF, SF 30
Wyncote Church Home Cheltenham 26 MF 24
Total 3,348 Total 945
SF = Single-family and can include detached or attached units.
MF = Multifamily.
Figure 53CONTINUING CARE RETIREMENT COMMUNITY (LIFE CARE, 2000)
Assisted LivingAssisted living is a relatively new phenomenon
designed to meet the needs of people in a transitionalstage who need some help with daily activities but donot need the around-the-clock nursing care providedat a nursing home. Assisted living is expected toremain a significant element of housing for seniors,and, if current trends continue, could grow as ashare of senior’s living arrangements.
Figure 54 shows the location of assisted livingfacilities in Montgomery County. In 2000, therewere an estimated 54 assisted living facilities with acapacity for 3,553 people. Figure 53 lists assistedliving facilities within continuing care retirementcommunities while Figure 55 lists stand-aloneassisted living facilities.
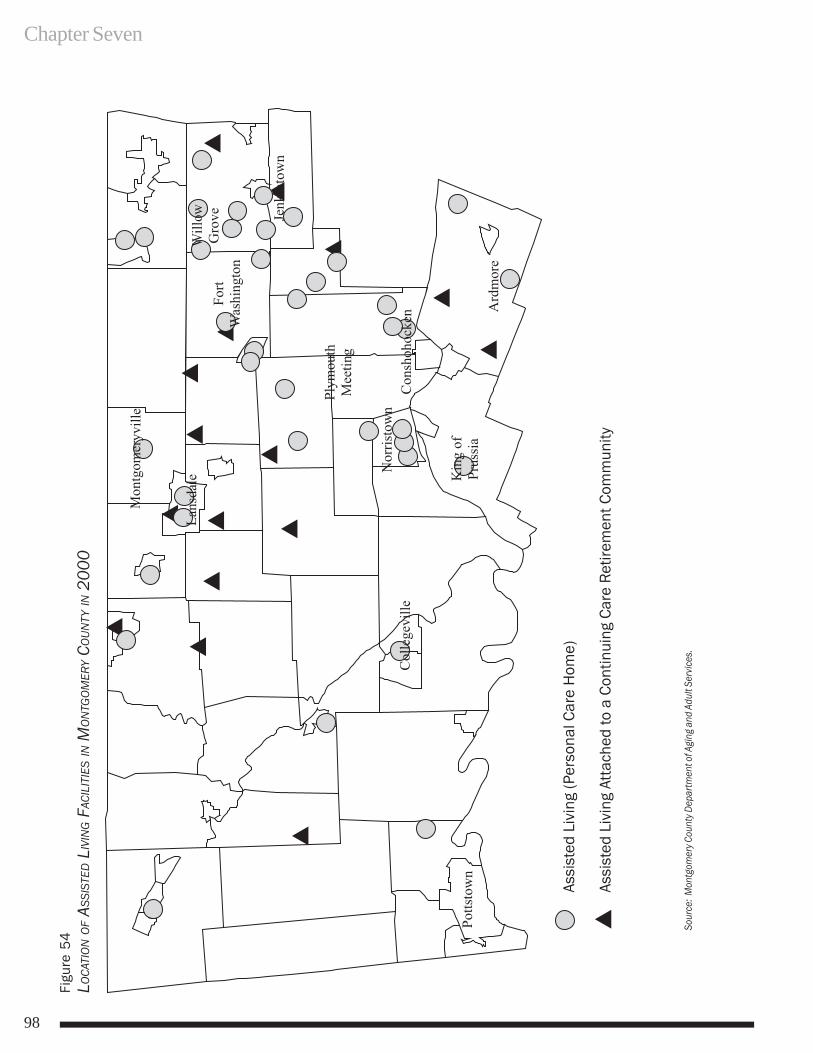
Chapter Seven
98
Figu
re 5
4LO
CATI
ON O
F ASS
ISTE
D L
IVIN
G F
ACIL
ITIE
S IN
MON
TGOM
ERY C
OUN
TY IN
200
0
Sour
ce: M
ontg
omer
y Cou
nty D
epar
tmen
t of A
ging
and
Adu
lt Se
rvice
s.
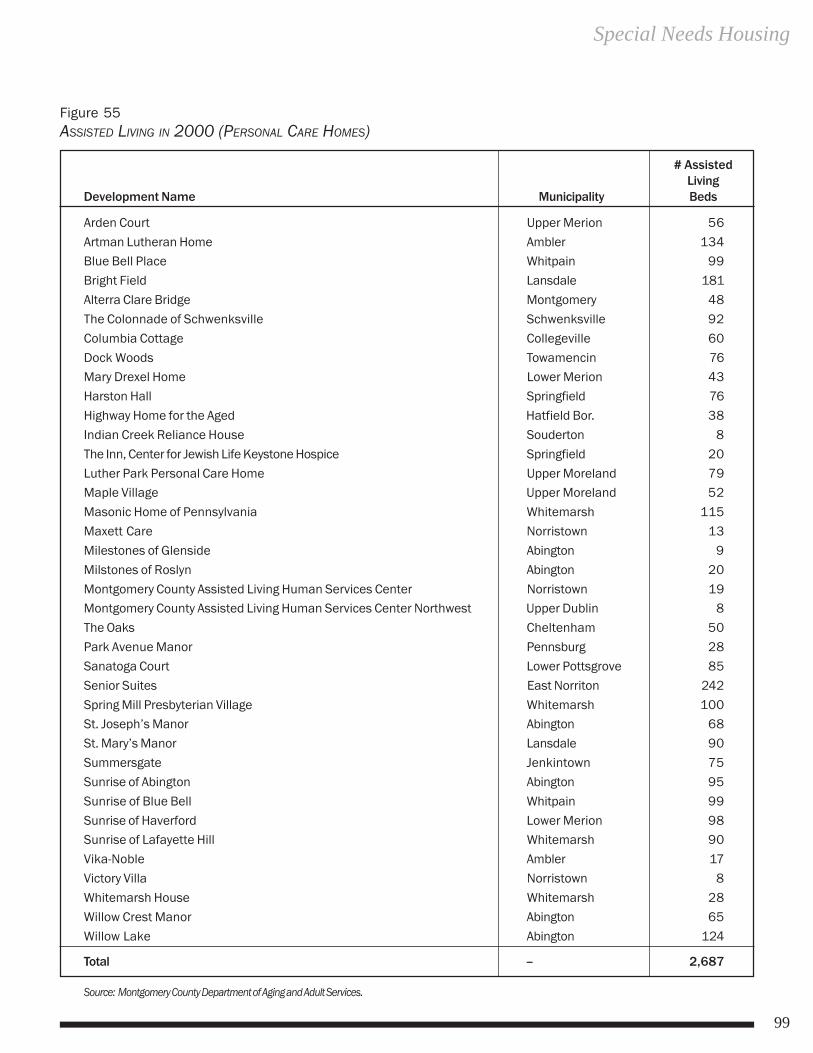
Special Needs Housing
99
Figure 55ASSISTED LIVING IN 2000 (PERSONAL CARE HOMES)
# AssistedLiving
Development Name Municipality Beds
Arden Court Upper Merion 56Artman Lutheran Home Ambler 134Blue Bell Place Whitpain 99Bright Field Lansdale 181Alterra Clare Bridge Montgomery 48The Colonnade of Schwenksville Schwenksville 92Columbia Cottage Collegeville 60Dock Woods Towamencin 76Mary Drexel Home Lower Merion 43Harston Hall Springfield 76Highway Home for the Aged Hatfield Bor. 38Indian Creek Reliance House Souderton 8The Inn, Center for Jewish Life Keystone Hospice Springfield 20Luther Park Personal Care Home Upper Moreland 79Maple Village Upper Moreland 52Masonic Home of Pennsylvania Whitemarsh 115Maxett Care Norristown 13Milestones of Glenside Abington 9Milstones of Roslyn Abington 20Montgomery County Assisted Living Human Services Center Norristown 19Montgomery County Assisted Living Human Services Center Northwest Upper Dublin 8The Oaks Cheltenham 50Park Avenue Manor Pennsburg 28Sanatoga Court Lower Pottsgrove 85Senior Suites East Norriton 242Spring Mill Presbyterian Village Whitemarsh 100St. Joseph’s Manor Abington 68St. Mary’s Manor Lansdale 90Summersgate Jenkintown 75Sunrise of Abington Abington 95Sunrise of Blue Bell Whitpain 99Sunrise of Haverford Lower Merion 98Sunrise of Lafayette Hill Whitemarsh 90Vika-Noble Ambler 17Victory Villa Norristown 8Whitemarsh House Whitemarsh 28Willow Crest Manor Abington 65Willow Lake Abington 124
Total -- 2,687
Source: Montgomery County Department of Aging and Adult Services.
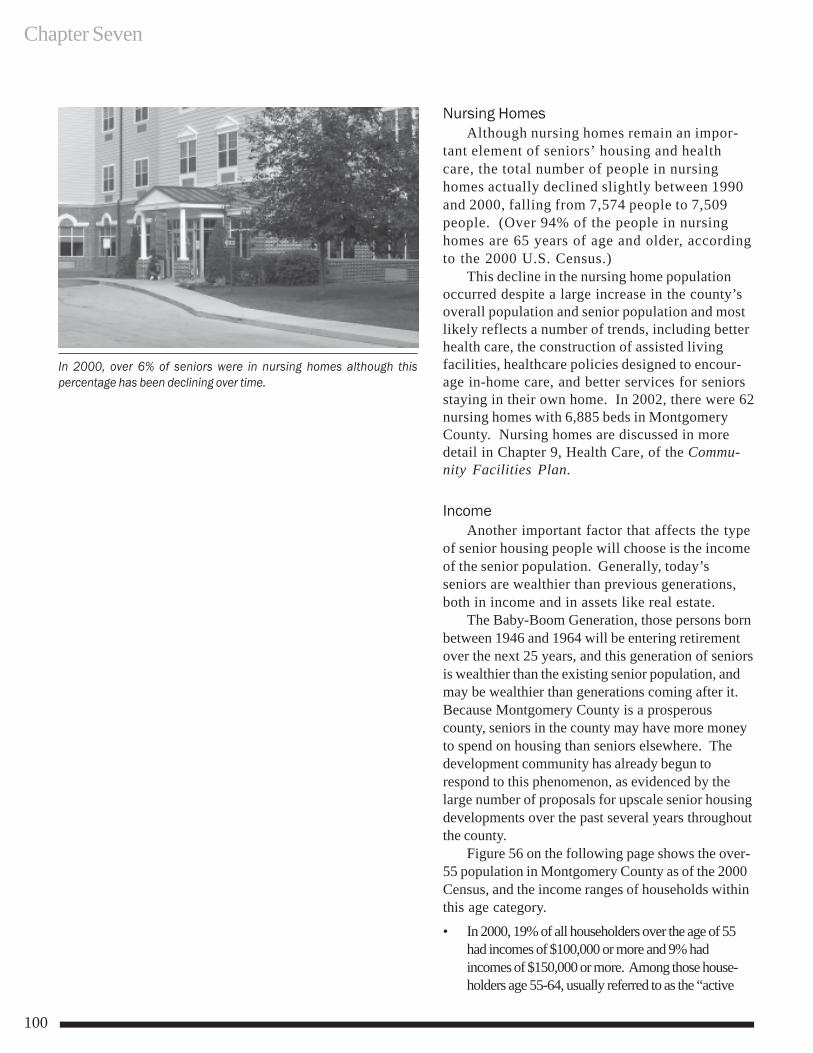
Chapter Seven
100
Nursing HomesAlthough nursing homes remain an impor-
tant element of seniors’ housing and healthcare, the total number of people in nursinghomes actually declined slightly between 1990and 2000, falling from 7,574 people to 7,509people. (Over 94% of the people in nursinghomes are 65 years of age and older, accordingto the 2000 U.S. Census.)
This decline in the nursing home populationoccurred despite a large increase in the county’soverall population and senior population and mostlikely reflects a number of trends, including betterhealth care, the construction of assisted livingfacilities, healthcare policies designed to encour-age in-home care, and better services for seniorsstaying in their own home. In 2002, there were 62nursing homes with 6,885 beds in MontgomeryCounty. Nursing homes are discussed in moredetail in Chapter 9, Health Care, of the Commu-nity Facilities Plan.
IncomeAnother important factor that affects the type
of senior housing people will choose is the incomeof the senior population. Generally, today’sseniors are wealthier than previous generations,both in income and in assets like real estate.
The Baby-Boom Generation, those persons bornbetween 1946 and 1964 will be entering retirementover the next 25 years, and this generation of seniorsis wealthier than the existing senior population, andmay be wealthier than generations coming after it.Because Montgomery County is a prosperouscounty, seniors in the county may have more moneyto spend on housing than seniors elsewhere. Thedevelopment community has already begun torespond to this phenomenon, as evidenced by thelarge number of proposals for upscale senior housingdevelopments over the past several years throughoutthe county.
Figure 56 on the following page shows the over-55 population in Montgomery County as of the 2000Census, and the income ranges of households withinthis age category.
• In 2000, 19% of all householders over the age of 55had incomes of $100,000 or more and 9% hadincomes of $150,000 or more. Among those house-holders age 55-64, usually referred to as the “active
In 2000, over 6% of seniors were in nursing homes although thispercentage has been declining over time.
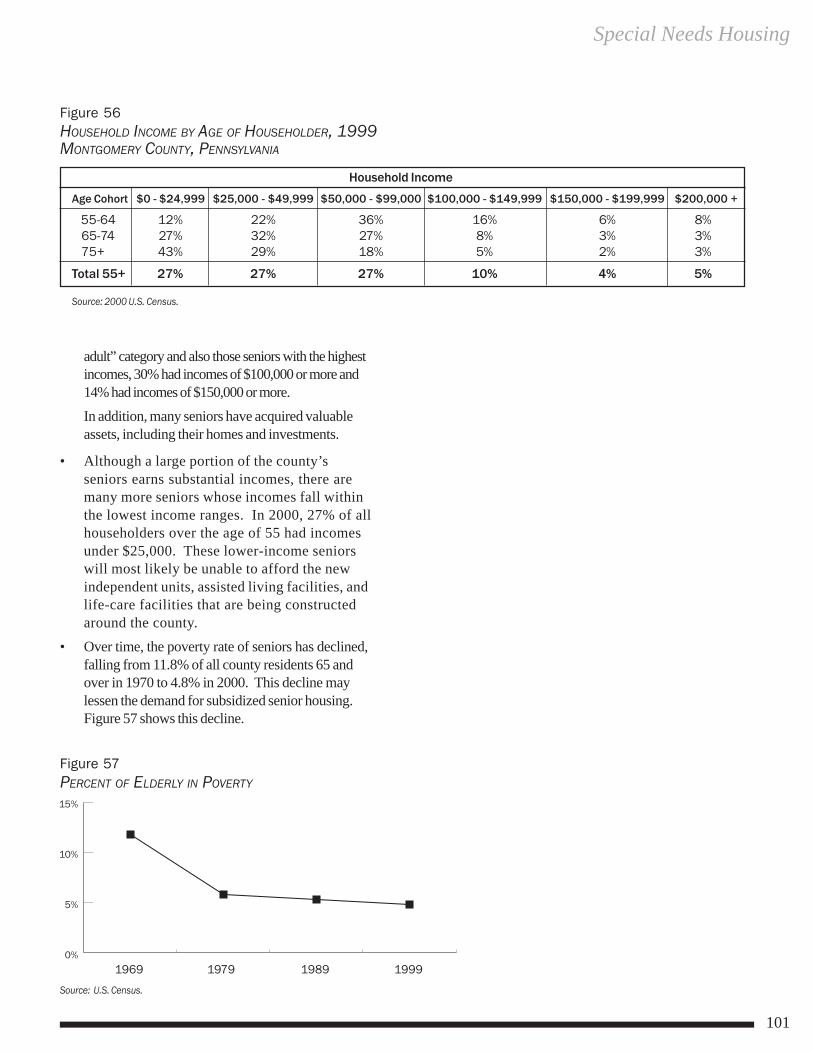
Special Needs Housing
101
adult” category and also those seniors with the highestincomes, 30% had incomes of $100,000 or more and14% had incomes of $150,000 or more.In addition, many seniors have acquired valuableassets, including their homes and investments.
• Although a large portion of the county’sseniors earns substantial incomes, there aremany more seniors whose incomes fall withinthe lowest income ranges. In 2000, 27% of allhouseholders over the age of 55 had incomesunder $25,000. These lower-income seniorswill most likely be unable to afford the newindependent units, assisted living facilities, andlife-care facilities that are being constructedaround the county.
• Over time, the poverty rate of seniors has declined,falling from 11.8% of all county residents 65 andover in 1970 to 4.8% in 2000. This decline maylessen the demand for subsidized senior housing.Figure 57 shows this decline.
Figure 56HOUSEHOLD INCOME BY AGE OF HOUSEHOLDER, 1999MONTGOMERY COUNTY, PENNSYLVANIA
Household Income
Age Cohort $0 - $24,999 $25,000 - $49,999 $50,000 - $99,000 $100,000 - $149,999 $150,000 - $199,999 $200,000 +
55-64 12% 22% 36% 16% 6% 8% 65-74 27% 32% 27% 8% 3% 3% 75+ 43% 29% 18% 5% 2% 3%
Total 55+ 27% 27% 27% 10% 4% 5%
Source: 2000 U.S. Census.
Figure 57PERCENT OF ELDERLY IN POVERTY
Source: U.S. Census.
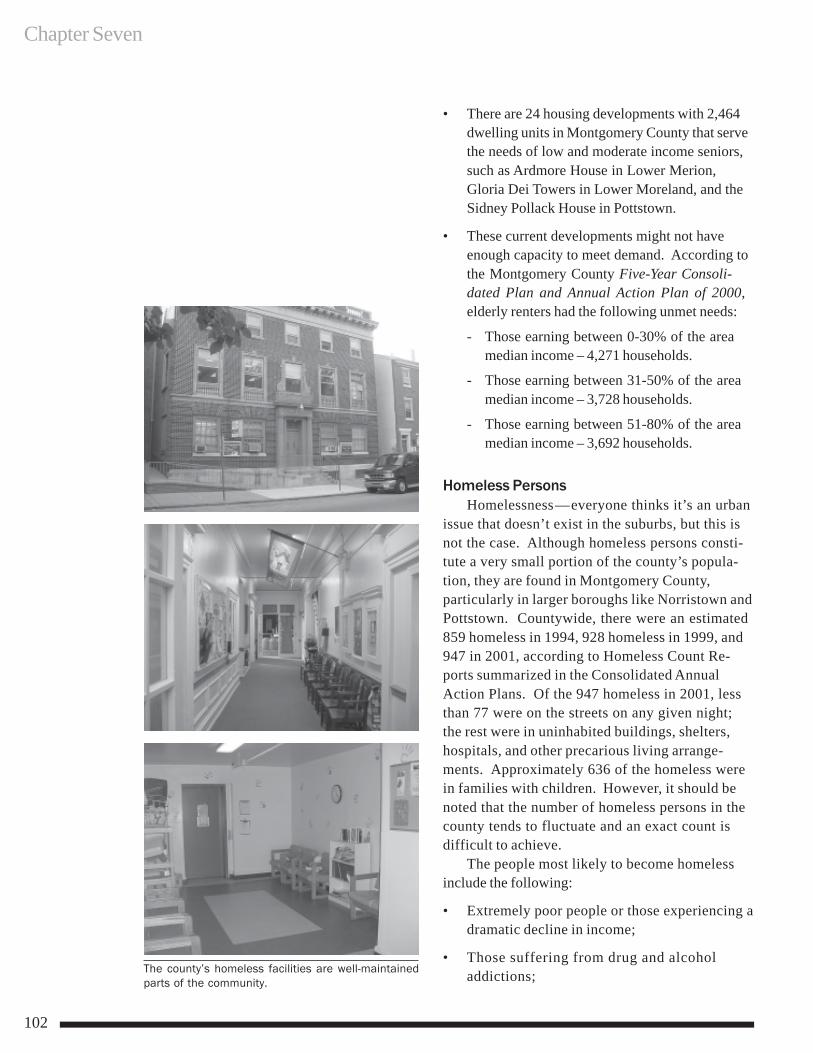
Chapter Seven
102
• There are 24 housing developments with 2,464dwelling units in Montgomery County that servethe needs of low and moderate income seniors,such as Ardmore House in Lower Merion,Gloria Dei Towers in Lower Moreland, and theSidney Pollack House in Pottstown.
• These current developments might not haveenough capacity to meet demand. According tothe Montgomery County Five-Year Consoli-dated Plan and Annual Action Plan of 2000,elderly renters had the following unmet needs:
- Those earning between 0-30% of the areamedian income – 4,271 households.
- Those earning between 31-50% of the areamedian income – 3,728 households.
- Those earning between 51-80% of the areamedian income – 3,692 households.
Homeless PersonsHomelessness—everyone thinks it’s an urban
issue that doesn’t exist in the suburbs, but this isnot the case. Although homeless persons consti-tute a very small portion of the county’s popula-tion, they are found in Montgomery County,particularly in larger boroughs like Norristown andPottstown. Countywide, there were an estimated859 homeless in 1994, 928 homeless in 1999, and947 in 2001, according to Homeless Count Re-ports summarized in the Consolidated AnnualAction Plans. Of the 947 homeless in 2001, lessthan 77 were on the streets on any given night;the rest were in uninhabited buildings, shelters,hospitals, and other precarious living arrange-ments. Approximately 636 of the homeless werein families with children. However, it should benoted that the number of homeless persons in thecounty tends to fluctuate and an exact count isdifficult to achieve.
The people most likely to become homelessinclude the following:
• Extremely poor people or those experiencing adramatic decline in income;
• Those suffering from drug and alcoholaddictions;The county’s homeless facilities are well-maintained
parts of the community.
Special Needs Housing
103
• The physically or mentally disabled;
• Victims of domestic violence;
• Forensic population (any type of contact withthe legal system);
• Households receiving public assistance whoseeligibility will run out; and,
• Long term tenants of public housing.
One worrisome statistic is the recent rise inpoverty in the county. In 2000, families in povertycomprised less than 3% of all county families;however, these poor families increased 34% be-tween 1990 and 2000, far outpacing the growth inpopulation. Female headed families in poverty withchildren under 5 increased 238% during the 1990s, astartling increase. If these poverty rates continue toincrease at this pace, homelessness could alsopotentially increase.
Montgomery County does have services andfacilities that address the needs of these home-less. The available services focus on outreachand prevention programs that identify at riskhouseholds and offer supportive services toprevent individuals and families from being home-less. Supportive services include job training,case management, mental health care, housingplacement, and life skill training.
To conduct these outreach efforts andprovide services to the homeless, the countyhas created a Continuum of Care system whichinvolves 33 agencies, including non-profits,government agencies, businesses, hospitals,schools, and foundations.
In addition, there are a number of facilities forthe homeless in the county, as shown in Figure 58.The three types of homeless housing shown in thetable are Emergency Homeless Shelters whichare designed to house individuals overnight;Transitional Housing which places people in agroup home type of atmosphere designed to helpresidents become self-sufficient and provide fortheir own housing needs; and Permanent Support-ive Housing which is designed for those individu-als who are not only homeless, but who may haveother problems that prevent them from being ableto live independently.
General Characteristics of theHomeless Population in June, 1999
• Of the 928 homeless, 475 were adults and 453were children.
• Only 246 reported sleeping in a shelter theprevious night.
• Of the 475 adults, 290 were female.
• The ethnicity was evenly divided between minorityand nonminority.
• 147 people were fleeing abuse.
• 67 people had mental health issues.
• 17 women and 4 girls were pregnant.
Source: Homeless Census Report summarized in the Montgomery County Five-YearConsolidated Plan and Annual Action Plan (2000-2001).
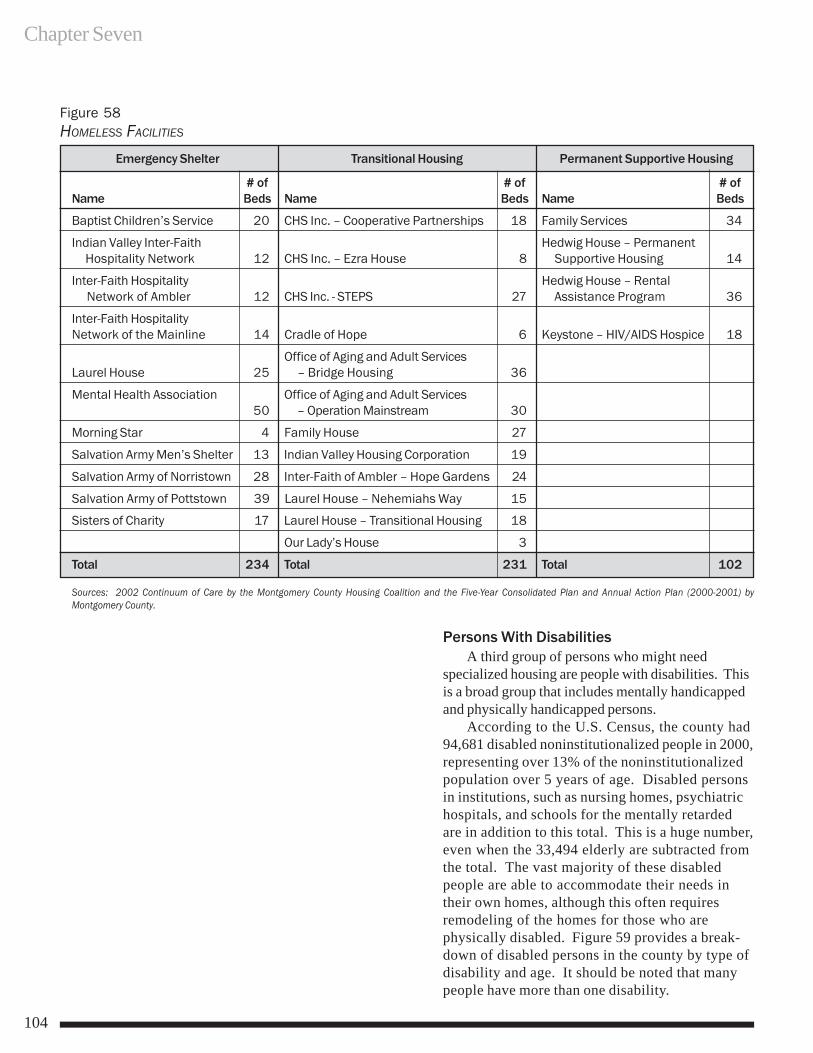
Chapter Seven
104
Persons With DisabilitiesA third group of persons who might need
specialized housing are people with disabilities. Thisis a broad group that includes mentally handicappedand physically handicapped persons.
According to the U.S. Census, the county had94,681 disabled noninstitutionalized people in 2000,representing over 13% of the noninstitutionalizedpopulation over 5 years of age. Disabled personsin institutions, such as nursing homes, psychiatrichospitals, and schools for the mentally retardedare in addition to this total. This is a huge number,even when the 33,494 elderly are subtracted fromthe total. The vast majority of these disabledpeople are able to accommodate their needs intheir own homes, although this often requiresremodeling of the homes for those who arephysically disabled. Figure 59 provides a break-down of disabled persons in the county by type ofdisability and age. It should be noted that manypeople have more than one disability.
Figure 58HOMELESS FACILITIES
Emergency Shelter Transitional Housing Permanent Supportive Housing
# of # of # ofName Beds Name Beds Name Beds
Baptist Children’s Service 20 CHS Inc. – Cooperative Partnerships 18 Family Services 34
Indian Valley Inter-Faith Hedwig House – Permanent Hospitality Network 12 CHS Inc. – Ezra House 8 Supportive Housing 14
Inter-Faith Hospitality Hedwig House – Rental Network of Ambler 12 CHS Inc. - STEPS 27 Assistance Program 36
Inter-Faith HospitalityNetwork of the Mainline 14 Cradle of Hope 6 Keystone – HIV/AIDS Hospice 18
Office of Aging and Adult ServicesLaurel House 25 – Bridge Housing 36
Mental Health Association Office of Aging and Adult Services50 – Operation Mainstream 30
Morning Star 4 Family House 27
Salvation Army Men’s Shelter 13 Indian Valley Housing Corporation 19
Salvation Army of Norristown 28 Inter-Faith of Ambler – Hope Gardens 24
Salvation Army of Pottstown 39 Laurel House – Nehemiahs Way 15
Sisters of Charity 17 Laurel House – Transitional Housing 18
Our Lady’s House 3
Total 234 Total 231 Total 102
Sources: 2002 Continuum of Care by the Montgomery County Housing Coalition and the Five-Year Consolidated Plan and Annual Action Plan (2000-2001) byMontgomery County.
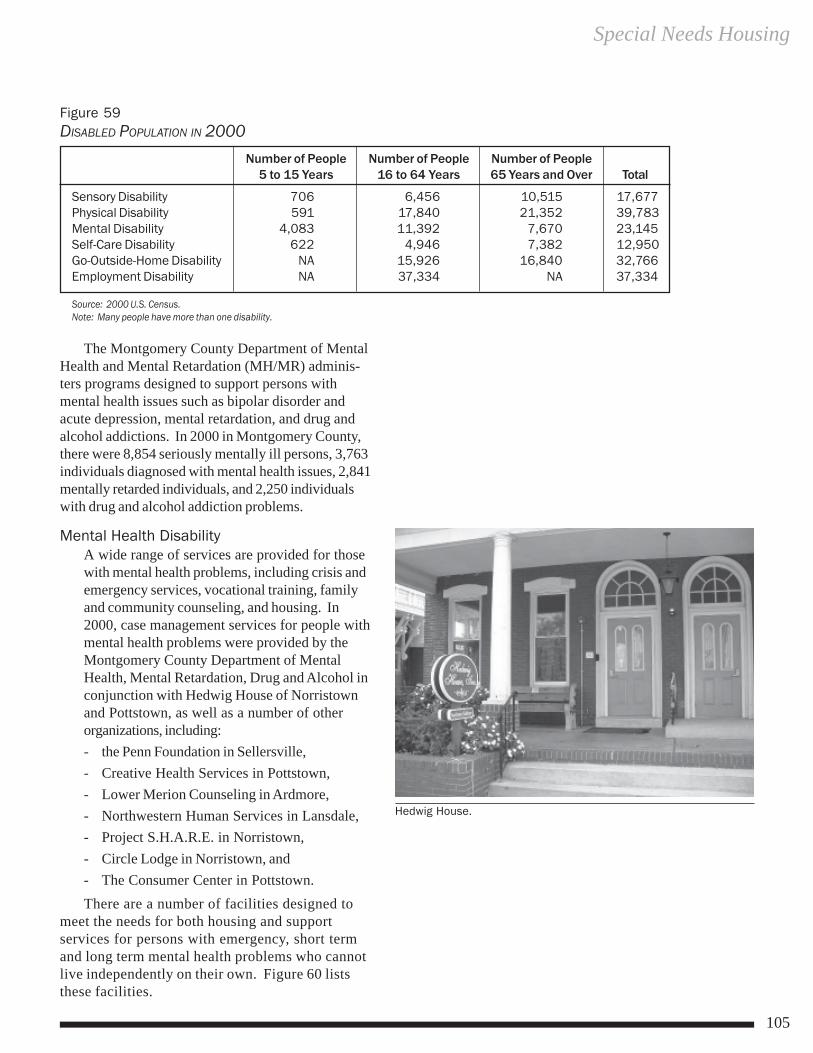
Special Needs Housing
105
The Montgomery County Department of MentalHealth and Mental Retardation (MH/MR) adminis-ters programs designed to support persons withmental health issues such as bipolar disorder andacute depression, mental retardation, and drug andalcohol addictions. In 2000 in Montgomery County,there were 8,854 seriously mentally ill persons, 3,763individuals diagnosed with mental health issues, 2,841mentally retarded individuals, and 2,250 individualswith drug and alcohol addiction problems.
Mental Health DisabilityA wide range of services are provided for thosewith mental health problems, including crisis andemergency services, vocational training, familyand community counseling, and housing. In2000, case management services for people withmental health problems were provided by theMontgomery County Department of MentalHealth, Mental Retardation, Drug and Alcohol inconjunction with Hedwig House of Norristownand Pottstown, as well as a number of otherorganizations, including:- the Penn Foundation in Sellersville,- Creative Health Services in Pottstown,- Lower Merion Counseling in Ardmore,- Northwestern Human Services in Lansdale,- Project S.H.A.R.E. in Norristown,- Circle Lodge in Norristown, and- The Consumer Center in Pottstown.There are a number of facilities designed to
meet the needs for both housing and supportservices for persons with emergency, short termand long term mental health problems who cannotlive independently on their own. Figure 60 liststhese facilities.
Figure 59DISABLED POPULATION IN 2000
Number of People Number of People Number of People5 to 15 Years 16 to 64 Years 65 Years and Over Total
Sensory Disability 706 6,456 10,515 17,677Physical Disability 591 17,840 21,352 39,783Mental Disability 4,083 11,392 7,670 23,145Self-Care Disability 622 4,946 7,382 12,950Go-Outside-Home Disability NA 15,926 16,840 32,766Employment Disability NA 37,334 NA 37,334
Source: 2000 U.S. Census.Note: Many people have more than one disability.
Hedwig House.
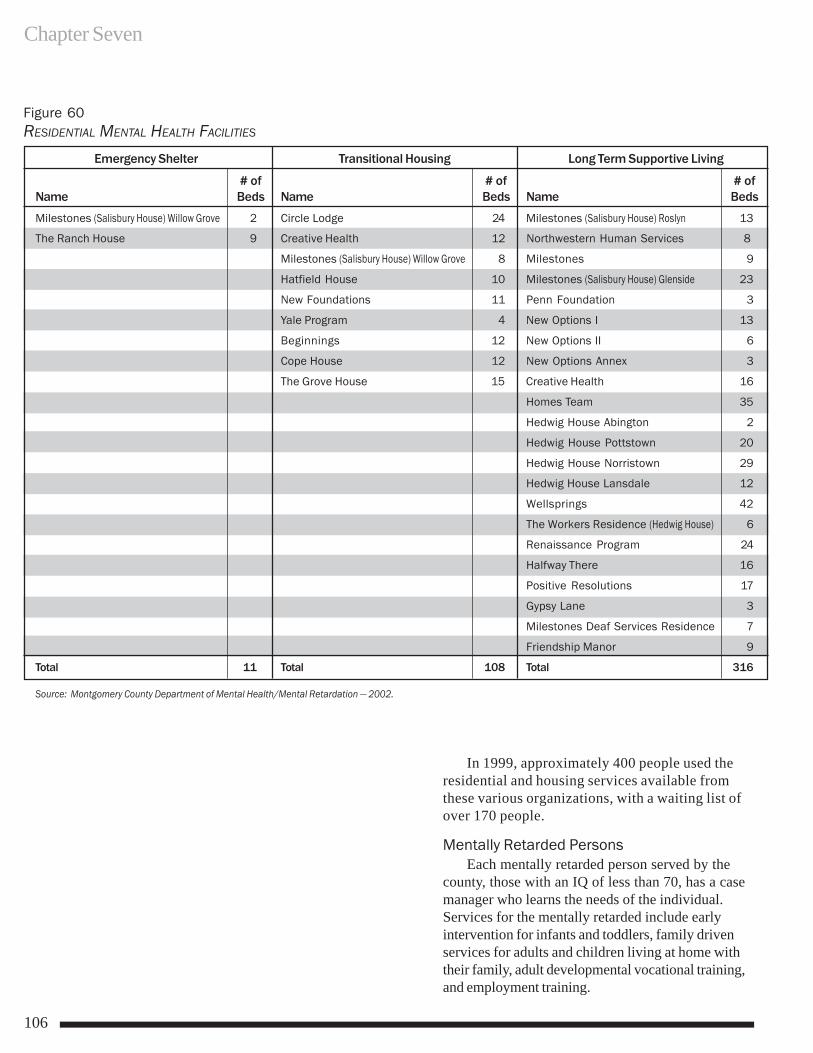
Chapter Seven
106
In 1999, approximately 400 people used theresidential and housing services available fromthese various organizations, with a waiting list ofover 170 people.
Mentally Retarded PersonsEach mentally retarded person served by the
county, those with an IQ of less than 70, has a casemanager who learns the needs of the individual.Services for the mentally retarded include earlyintervention for infants and toddlers, family drivenservices for adults and children living at home withtheir family, adult developmental vocational training,and employment training.
Figure 60RESIDENTIAL MENTAL HEALTH FACILITIES
Emergency Shelter Transitional Housing Long Term Supportive Living
# of # of # ofName Beds Name Beds Name Beds
Milestones (Salisbury House) Willow Grove 2 Circle Lodge 24 Milestones (Salisbury House) Roslyn 13
The Ranch House 9 Creative Health 12 Northwestern Human Services 8
Milestones (Salisbury House) Willow Grove 8 Milestones 9
Hatfield House 10 Milestones (Salisbury House) Glenside 23
New Foundations 11 Penn Foundation 3
Yale Program 4 New Options I 13
Beginnings 12 New Options II 6
Cope House 12 New Options Annex 3
The Grove House 15 Creative Health 16
Homes Team 35
Hedwig House Abington 2
Hedwig House Pottstown 20
Hedwig House Norristown 29
Hedwig House Lansdale 12
Wellsprings 42
The Workers Residence (Hedwig House) 6
Renaissance Program 24
Halfway There 16
Positive Resolutions 17
Gypsy Lane 3
Milestones Deaf Services Residence 7
Friendship Manor 9
Total 11 Total 108 Total 316
Source: Montgomery County Department of Mental Health/Mental Retardation — 2002.
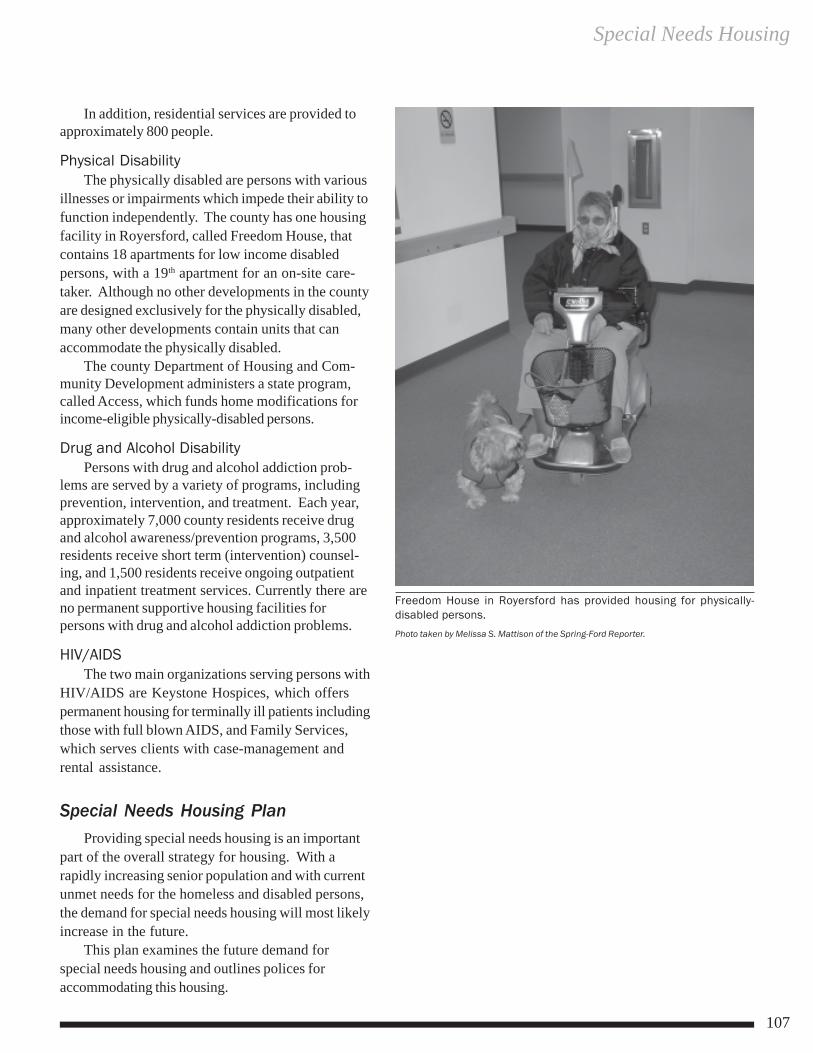
Special Needs Housing
107
In addition, residential services are provided toapproximately 800 people.
Physical DisabilityThe physically disabled are persons with various
illnesses or impairments which impede their ability tofunction independently. The county has one housingfacility in Royersford, called Freedom House, thatcontains 18 apartments for low income disabledpersons, with a 19th apartment for an on-site care-taker. Although no other developments in the countyare designed exclusively for the physically disabled,many other developments contain units that canaccommodate the physically disabled.
The county Department of Housing and Com-munity Development administers a state program,called Access, which funds home modifications forincome-eligible physically-disabled persons.
Drug and Alcohol DisabilityPersons with drug and alcohol addiction prob-
lems are served by a variety of programs, includingprevention, intervention, and treatment. Each year,approximately 7,000 county residents receive drugand alcohol awareness/prevention programs, 3,500residents receive short term (intervention) counsel-ing, and 1,500 residents receive ongoing outpatientand inpatient treatment services. Currently there areno permanent supportive housing facilities forpersons with drug and alcohol addiction problems.
HIV/AIDSThe two main organizations serving persons with
HIV/AIDS are Keystone Hospices, which offerspermanent housing for terminally ill patients includingthose with full blown AIDS, and Family Services,which serves clients with case-management andrental assistance.
Special Needs Housing PlanProviding special needs housing is an important
part of the overall strategy for housing. With arapidly increasing senior population and with currentunmet needs for the homeless and disabled persons,the demand for special needs housing will most likelyincrease in the future.
This plan examines the future demand forspecial needs housing and outlines polices foraccommodating this housing.
Freedom House in Royersford has provided housing for physically-disabled persons.
Photo taken by Melissa S. Mattison of the Spring-Ford Reporter.
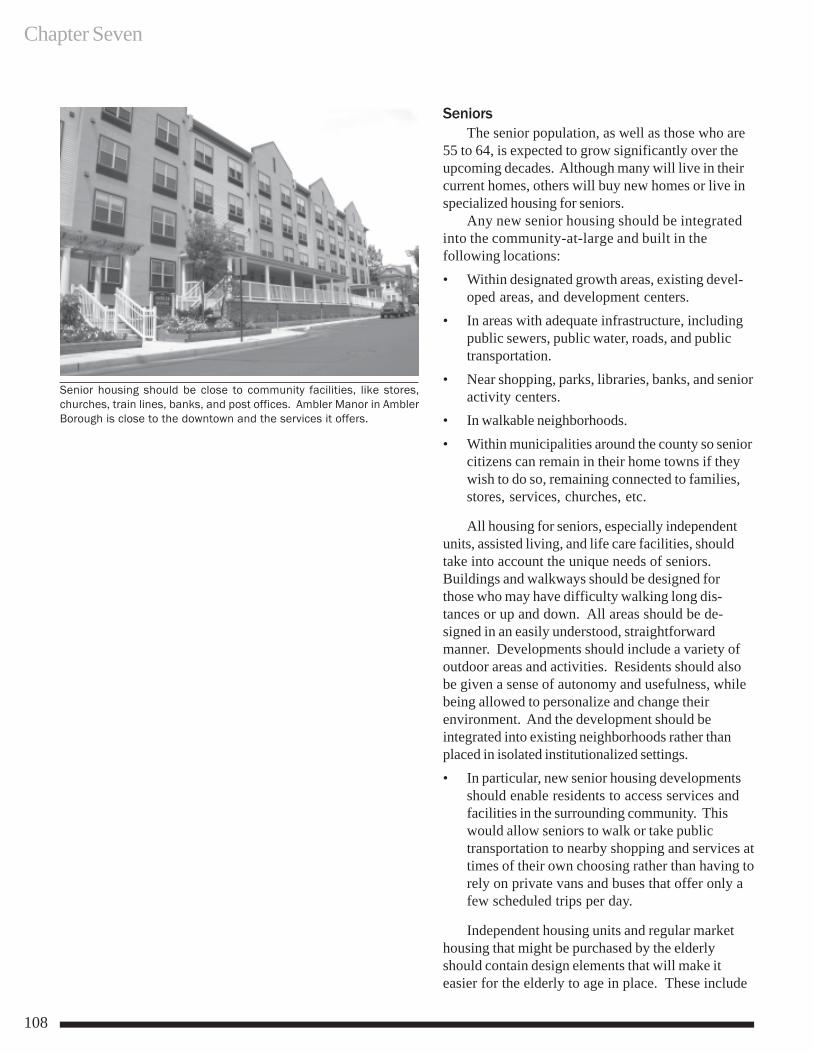
Chapter Seven
108
SeniorsThe senior population, as well as those who are
55 to 64, is expected to grow significantly over theupcoming decades. Although many will live in theircurrent homes, others will buy new homes or live inspecialized housing for seniors.
Any new senior housing should be integratedinto the community-at-large and built in thefollowing locations:• Within designated growth areas, existing devel-
oped areas, and development centers.• In areas with adequate infrastructure, including
public sewers, public water, roads, and publictransportation.
• Near shopping, parks, libraries, banks, and senioractivity centers.
• In walkable neighborhoods.• Within municipalities around the county so senior
citizens can remain in their home towns if theywish to do so, remaining connected to families,stores, services, churches, etc.
All housing for seniors, especially independentunits, assisted living, and life care facilities, shouldtake into account the unique needs of seniors.Buildings and walkways should be designed forthose who may have difficulty walking long dis-tances or up and down. All areas should be de-signed in an easily understood, straightforwardmanner. Developments should include a variety ofoutdoor areas and activities. Residents should alsobe given a sense of autonomy and usefulness, whilebeing allowed to personalize and change theirenvironment. And the development should beintegrated into existing neighborhoods rather thanplaced in isolated institutionalized settings.• In particular, new senior housing developments
should enable residents to access services andfacilities in the surrounding community. Thiswould allow seniors to walk or take publictransportation to nearby shopping and services attimes of their own choosing rather than having torely on private vans and buses that offer only afew scheduled trips per day.
Independent housing units and regular markethousing that might be purchased by the elderlyshould contain design elements that will make iteasier for the elderly to age in place. These include
Senior housing should be close to community facilities, like stores,churches, train lines, banks, and post offices. Ambler Manor in AmblerBorough is close to the downtown and the services it offers.
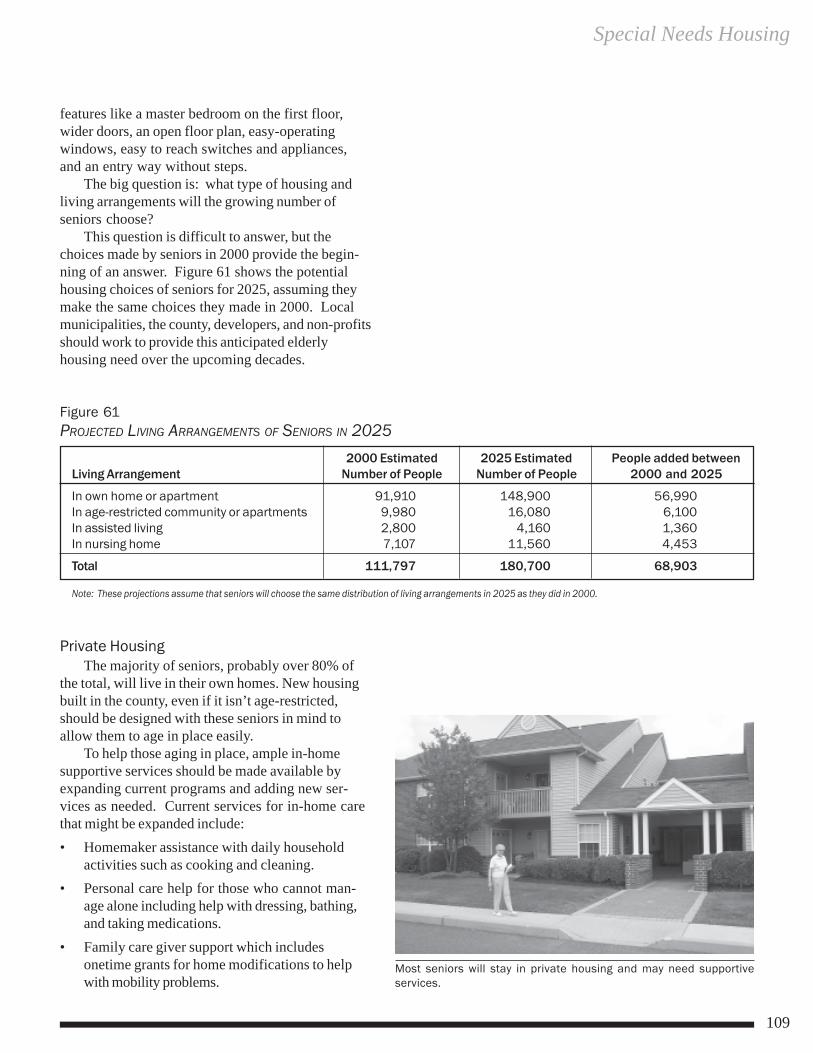
Special Needs Housing
109
features like a master bedroom on the first floor,wider doors, an open floor plan, easy-operatingwindows, easy to reach switches and appliances,and an entry way without steps.
The big question is: what type of housing andliving arrangements will the growing number ofseniors choose?
This question is difficult to answer, but thechoices made by seniors in 2000 provide the begin-ning of an answer. Figure 61 shows the potentialhousing choices of seniors for 2025, assuming theymake the same choices they made in 2000. Localmunicipalities, the county, developers, and non-profitsshould work to provide this anticipated elderlyhousing need over the upcoming decades.
Figure 61PROJECTED LIVING ARRANGEMENTS OF SENIORS IN 2025
2000 Estimated 2025 Estimated People added betweenLiving Arrangement Number of People Number of People 2000 and 2025
In own home or apartment 91,910 148,900 56,990In age-restricted community or apartments 9,980 16,080 6,100In assisted living 2,800 4,160 1,360In nursing home 7,107 11,560 4,453
Total 111,797 180,700 68,903
Note: These projections assume that seniors will choose the same distribution of living arrangements in 2025 as they did in 2000.
Private HousingThe majority of seniors, probably over 80% of
the total, will live in their own homes. New housingbuilt in the county, even if it isn’t age-restricted,should be designed with these seniors in mind toallow them to age in place easily.
To help those aging in place, ample in-homesupportive services should be made available byexpanding current programs and adding new ser-vices as needed. Current services for in-home carethat might be expanded include:• Homemaker assistance with daily household
activities such as cooking and cleaning.• Personal care help for those who cannot man-
age alone including help with dressing, bathing,and taking medications.
• Family care giver support which includesonetime grants for home modifications to helpwith mobility problems.
Most seniors will stay in private housing and may need supportiveservices.
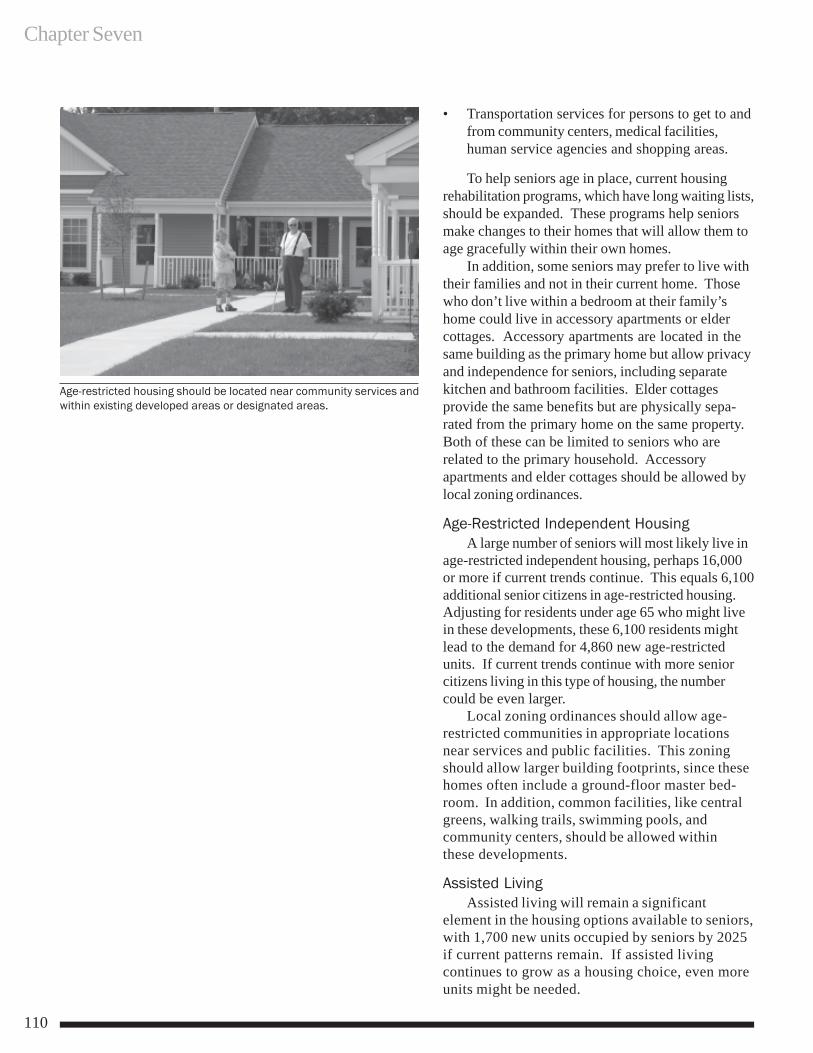
Chapter Seven
110
• Transportation services for persons to get to andfrom community centers, medical facilities,human service agencies and shopping areas.
To help seniors age in place, current housingrehabilitation programs, which have long waiting lists,should be expanded. These programs help seniorsmake changes to their homes that will allow them toage gracefully within their own homes.
In addition, some seniors may prefer to live withtheir families and not in their current home. Thosewho don’t live within a bedroom at their family’shome could live in accessory apartments or eldercottages. Accessory apartments are located in thesame building as the primary home but allow privacyand independence for seniors, including separatekitchen and bathroom facilities. Elder cottagesprovide the same benefits but are physically sepa-rated from the primary home on the same property.Both of these can be limited to seniors who arerelated to the primary household. Accessoryapartments and elder cottages should be allowed bylocal zoning ordinances.
Age-Restricted Independent HousingA large number of seniors will most likely live in
age-restricted independent housing, perhaps 16,000or more if current trends continue. This equals 6,100additional senior citizens in age-restricted housing.Adjusting for residents under age 65 who might livein these developments, these 6,100 residents mightlead to the demand for 4,860 new age-restrictedunits. If current trends continue with more seniorcitizens living in this type of housing, the numbercould be even larger.
Local zoning ordinances should allow age-restricted communities in appropriate locationsnear services and public facilities. This zoningshould allow larger building footprints, since thesehomes often include a ground-floor master bed-room. In addition, common facilities, like centralgreens, walking trails, swimming pools, andcommunity centers, should be allowed withinthese developments.
Assisted LivingAssisted living will remain a significant
element in the housing options available to seniors,with 1,700 new units occupied by seniors by 2025if current patterns remain. If assisted livingcontinues to grow as a housing choice, even moreunits might be needed.
Age-restricted housing should be located near community services andwithin existing developed areas or designated areas.
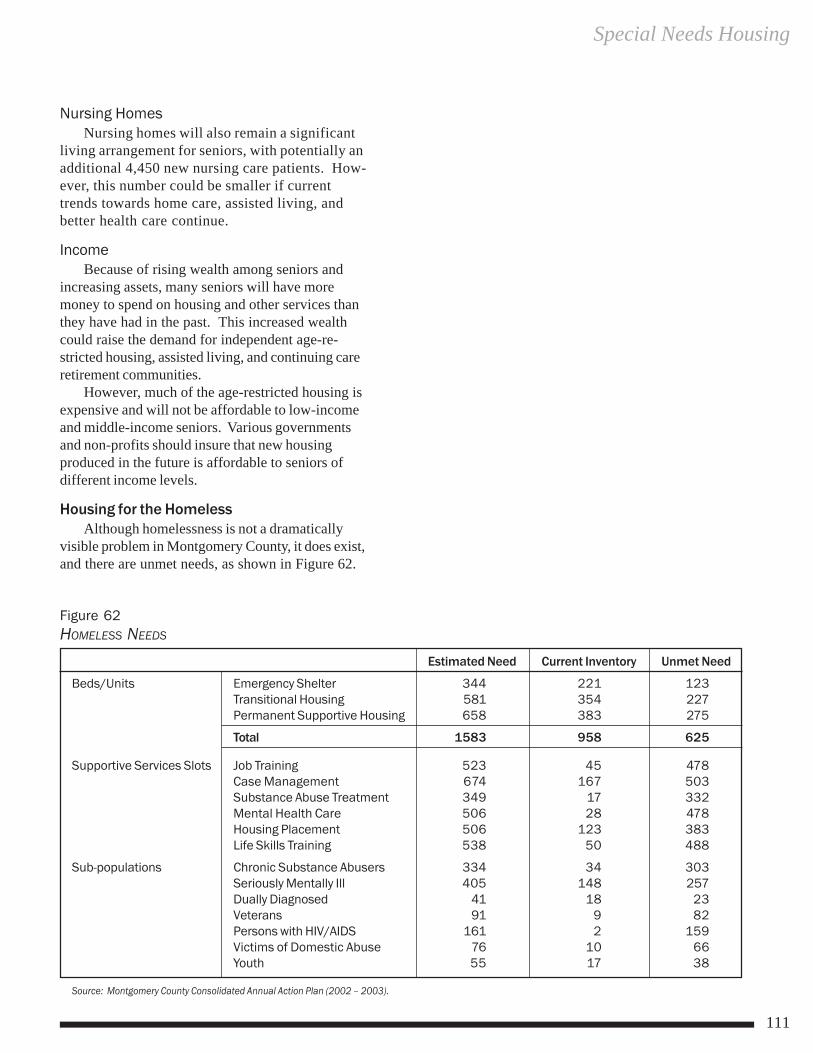
Special Needs Housing
111
Nursing HomesNursing homes will also remain a significant
living arrangement for seniors, with potentially anadditional 4,450 new nursing care patients. How-ever, this number could be smaller if currenttrends towards home care, assisted living, andbetter health care continue.
IncomeBecause of rising wealth among seniors and
increasing assets, many seniors will have moremoney to spend on housing and other services thanthey have had in the past. This increased wealthcould raise the demand for independent age-re-stricted housing, assisted living, and continuing careretirement communities.
However, much of the age-restricted housing isexpensive and will not be affordable to low-incomeand middle-income seniors. Various governmentsand non-profits should insure that new housingproduced in the future is affordable to seniors ofdifferent income levels.
Housing for the HomelessAlthough homelessness is not a dramatically
visible problem in Montgomery County, it does exist,and there are unmet needs, as shown in Figure 62.
Figure 62HOMELESS NEEDS
Estimated Need Current Inventory Unmet Need
Beds/Units Emergency Shelter 344 221 123Transitional Housing 581 354 227Permanent Supportive Housing 658 383 275
Total 1583 958 625
Supportive Services Slots Job Training 523 45 478Case Management 674 167 503Substance Abuse Treatment 349 17 332Mental Health Care 506 28 478Housing Placement 506 123 383Life Skills Training 538 50 488
Sub-populations Chronic Substance Abusers 334 34 303Seriously Mentally Ill 405 148 257Dually Diagnosed 41 18 23Veterans 91 9 82Persons with HIV/AIDS 161 2 159Victims of Domestic Abuse 76 10 66Youth 55 17 38
Source: Montgomery County Consolidated Annual Action Plan (2002 – 2003).
Chapter Seven
112
Over time, the gap between the estimated needand current inventory should be closed.
It is very difficult to estimate future needs of thispopulation, with needs so dependent on social,political, and economic trends; however, if homelessneeds increase substantially in the future, the county,non-profits, and other providers should assess wherethis need exists and how it can best be addressed.
To create a more efficient system for providinghomeless services, the county has a Continuum ofCare network that is coordinated by the Montgom-ery County Housing Coalition (MCHC). Thissystem is currently under development and, as it isfine tuned, changes should be made to furtherbroaden the process and to make improvements tothe creation and delivery of homeless housing andservices in Montgomery County. Also, the county isimplementing a homeless management informationsystem which will keep unduplicated counts ofhomeless persons and the services they use.
Providers in the county should continue exploringmethods of reducing chronic and episodichomelessness by improving linkages with main-stream homeless providers through the ChronicHomeless Action Team and by expanding outreachefforts for the homeless.
Any new facilities for the homeless should meetthe following criteria:• They should be located in designated growth
areas or existing developed areas, preferablynear services like public transportation, medicalfacilities, and shopping centers.
• Transitional housing and permanent supportivehousing should be integrated into the communityand distributed around the county where theneed exists.
Persons With DisabilitiesCurrently, some people with disabilities are on
waiting lists for housing. Over time, this need shouldbe met. As with the homeless, it is very difficult toestimate future housing needs of the disabled;however, as the county population grows and ages,the number of disabled residents will most likelyincrease. As currently occurs, the vast majority ofthese individuals will provide housing on their own.
Local developments should be designed with thedisabled in mind, particularly the physically-disabled.Developers should offer options on their homes thatwill make it easy for the physically-disabled to buy
Special Needs Housing
113
that home, such as ground-floor master bedrooms.Nonresidential development should include
convenient handicapped parking places, whileexisting and new sidewalks should incorporate curbcuts at street crossings.
Some disabled persons will need specializedhousing and services. This housing will most likelybe group homes, where the residents are integratedinto the community-at-large.
Unfortunately, group homes are often opposedby neighbors, who mistakenly believe that grouphomes will adversely impact property values,neighborhood safety, traffic, and noise. In fact, avariety of studies have shown that group homes donot have negative impacts on neighborhoods.
Group homes should be treated like any othersingle family dwelling and should be integrated intothe community as a whole. The family definition inlocal municipal ordinances should allow a reason-ably-sized group home to exist.
Generally, group homes should be built indesignated growth areas or existing developed areas,preferably near services like medical facilities,shopping centers, parks, libraries, personal serviceshops, and banks.
Nonprofit providers of housing for the disabledshould design group homes so they cannot bedifferentiated from any other single-family resi-dence. In addition, these homes should not beclustered together, which might create a defactosocial service district.
ConclusionSpecial needs housing, particularly housing for
the elderly, will be a growing aspect of the county’shousing stock over the upcoming decades. Localmunicipalities, the county, developers, and nonprofitswill need to address this upcoming demand byproviding this housing in appropriate locations withinthe county’s designated growth areas, existingdeveloped areas, and development centers.
It is Illegal to DiscriminateThe Federal Fair Housing Act prohibits
discrimination in the sale or rental ofhousing because of a mental or physical
disability, having children in the home,pregnancy, an individual’s race, color,
religion, gender, or age. Discrimination isdefined as a refusal to make reasonable
accommodation in rules, policies, practices,or services, when such accommodation
may be necessary to enjoy a dwelling.

Chapter Seven
114
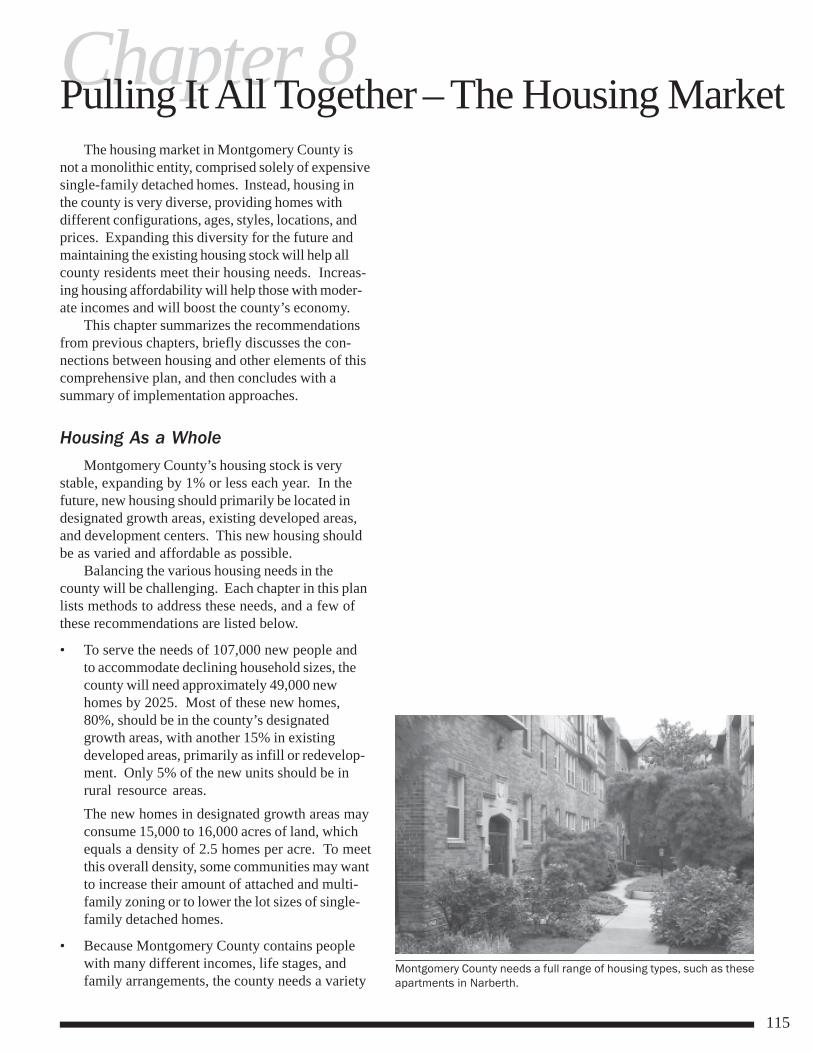
115
Chapter 8Pulling It All Together – The Housing MarketThe housing market in Montgomery County is
not a monolithic entity, comprised solely of expensivesingle-family detached homes. Instead, housing inthe county is very diverse, providing homes withdifferent configurations, ages, styles, locations, andprices. Expanding this diversity for the future andmaintaining the existing housing stock will help allcounty residents meet their housing needs. Increas-ing housing affordability will help those with moder-ate incomes and will boost the county’s economy.
This chapter summarizes the recommendationsfrom previous chapters, briefly discusses the con-nections between housing and other elements of thiscomprehensive plan, and then concludes with asummary of implementation approaches.
Housing As a WholeMontgomery County’s housing stock is very
stable, expanding by 1% or less each year. In thefuture, new housing should primarily be located indesignated growth areas, existing developed areas,and development centers. This new housing shouldbe as varied and affordable as possible.
Balancing the various housing needs in thecounty will be challenging. Each chapter in this planlists methods to address these needs, and a few ofthese recommendations are listed below.
• To serve the needs of 107,000 new people andto accommodate declining household sizes, thecounty will need approximately 49,000 newhomes by 2025. Most of these new homes,80%, should be in the county’s designatedgrowth areas, with another 15% in existingdeveloped areas, primarily as infill or redevelop-ment. Only 5% of the new units should be inrural resource areas.The new homes in designated growth areas mayconsume 15,000 to 16,000 acres of land, whichequals a density of 2.5 homes per acre. To meetthis overall density, some communities may wantto increase their amount of attached and multi-family zoning or to lower the lot sizes of single-family detached homes.
• Because Montgomery County contains peoplewith many different incomes, life stages, andfamily arrangements, the county needs a variety
Montgomery County needs a full range of housing types, such as theseapartments in Narberth.
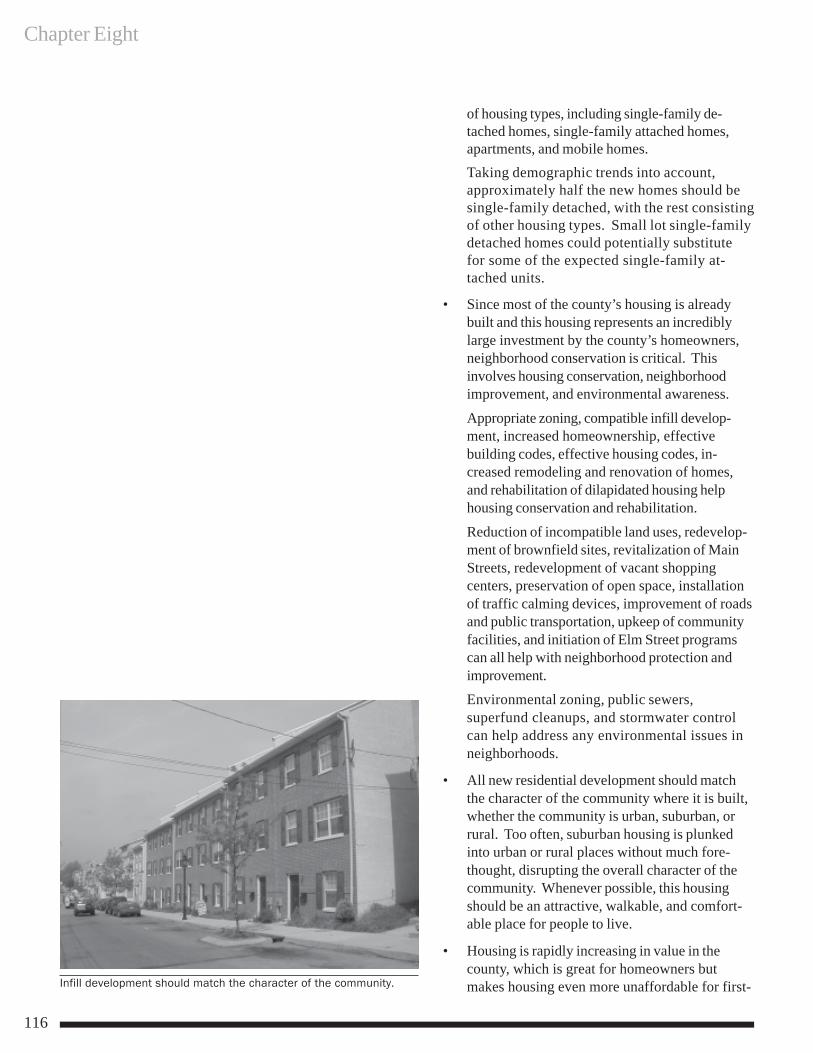
Chapter Eight
116
of housing types, including single-family de-tached homes, single-family attached homes,apartments, and mobile homes.Taking demographic trends into account,approximately half the new homes should besingle-family detached, with the rest consistingof other housing types. Small lot single-familydetached homes could potentially substitutefor some of the expected single-family at-tached units.
• Since most of the county’s housing is alreadybuilt and this housing represents an incrediblylarge investment by the county’s homeowners,neighborhood conservation is critical. Thisinvolves housing conservation, neighborhoodimprovement, and environmental awareness.
Appropriate zoning, compatible infill develop-ment, increased homeownership, effectivebuilding codes, effective housing codes, in-creased remodeling and renovation of homes,and rehabilitation of dilapidated housing helphousing conservation and rehabilitation.
Reduction of incompatible land uses, redevelop-ment of brownfield sites, revitalization of MainStreets, redevelopment of vacant shoppingcenters, preservation of open space, installationof traffic calming devices, improvement of roadsand public transportation, upkeep of communityfacilities, and initiation of Elm Street programscan all help with neighborhood protection andimprovement.Environmental zoning, public sewers,superfund cleanups, and stormwater controlcan help address any environmental issues inneighborhoods.
• All new residential development should matchthe character of the community where it is built,whether the community is urban, suburban, orrural. Too often, suburban housing is plunkedinto urban or rural places without much fore-thought, disrupting the overall character of thecommunity. Whenever possible, this housingshould be an attractive, walkable, and comfort-able place for people to live.
• Housing is rapidly increasing in value in thecounty, which is great for homeowners butmakes housing even more unaffordable for first-Infill development should match the character of the community.
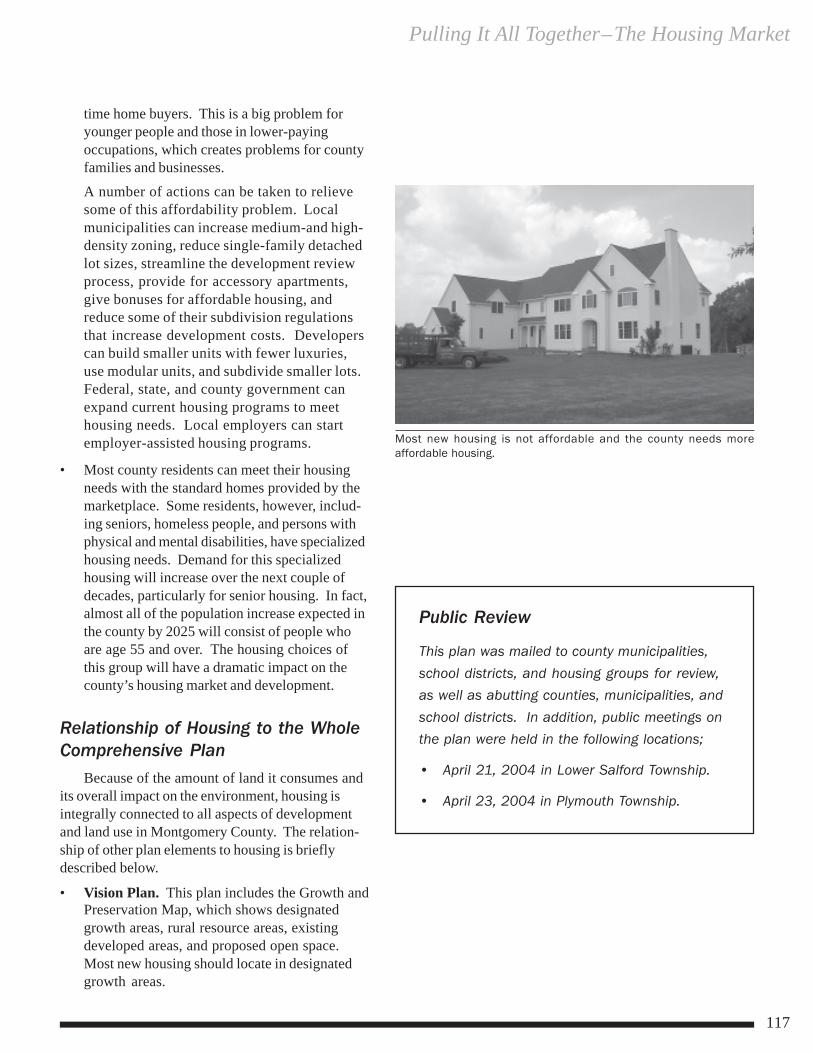
Pulling It All Together–The Housing Market
117
time home buyers. This is a big problem foryounger people and those in lower-payingoccupations, which creates problems for countyfamilies and businesses.
A number of actions can be taken to relievesome of this affordability problem. Localmunicipalities can increase medium-and high-density zoning, reduce single-family detachedlot sizes, streamline the development reviewprocess, provide for accessory apartments,give bonuses for affordable housing, andreduce some of their subdivision regulationsthat increase development costs. Developerscan build smaller units with fewer luxuries,use modular units, and subdivide smaller lots.Federal, state, and county government canexpand current housing programs to meethousing needs. Local employers can startemployer-assisted housing programs.
• Most county residents can meet their housingneeds with the standard homes provided by themarketplace. Some residents, however, includ-ing seniors, homeless people, and persons withphysical and mental disabilities, have specializedhousing needs. Demand for this specializedhousing will increase over the next couple ofdecades, particularly for senior housing. In fact,almost all of the population increase expected inthe county by 2025 will consist of people whoare age 55 and over. The housing choices ofthis group will have a dramatic impact on thecounty’s housing market and development.
Relationship of Housing to the WholeComprehensive Plan
Because of the amount of land it consumes andits overall impact on the environment, housing isintegrally connected to all aspects of developmentand land use in Montgomery County. The relation-ship of other plan elements to housing is brieflydescribed below.
• Vision Plan. This plan includes the Growth andPreservation Map, which shows designatedgrowth areas, rural resource areas, existingdeveloped areas, and proposed open space.Most new housing should locate in designatedgrowth areas.
Most new housing is not affordable and the county needs moreaffordable housing.
Public Review
This plan was mailed to county municipalities,school districts, and housing groups for review,as well as abutting counties, municipalities, andschool districts. In addition, public meetings onthe plan were held in the following locations;
• April 21, 2004 in Lower Salford Township.
• April 23, 2004 in Plymouth Township.
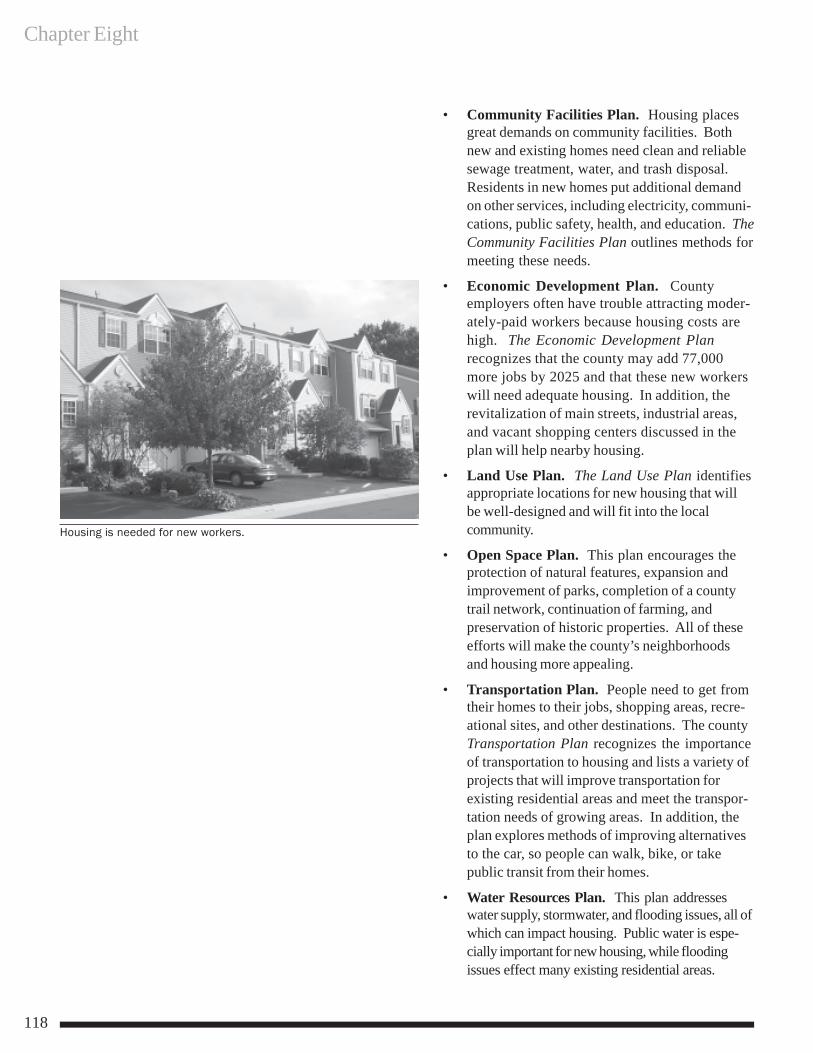
Chapter Eight
118
• Community Facilities Plan. Housing placesgreat demands on community facilities. Bothnew and existing homes need clean and reliablesewage treatment, water, and trash disposal.Residents in new homes put additional demandon other services, including electricity, communi-cations, public safety, health, and education. TheCommunity Facilities Plan outlines methods formeeting these needs.
• Economic Development Plan. Countyemployers often have trouble attracting moder-ately-paid workers because housing costs arehigh. The Economic Development Planrecognizes that the county may add 77,000more jobs by 2025 and that these new workerswill need adequate housing. In addition, therevitalization of main streets, industrial areas,and vacant shopping centers discussed in theplan will help nearby housing.
• Land Use Plan. The Land Use Plan identifiesappropriate locations for new housing that willbe well-designed and will fit into the localcommunity.
• Open Space Plan. This plan encourages theprotection of natural features, expansion andimprovement of parks, completion of a countytrail network, continuation of farming, andpreservation of historic properties. All of theseefforts will make the county’s neighborhoodsand housing more appealing.
• Transportation Plan. People need to get fromtheir homes to their jobs, shopping areas, recre-ational sites, and other destinations. The countyTransportation Plan recognizes the importanceof transportation to housing and lists a variety ofprojects that will improve transportation forexisting residential areas and meet the transpor-tation needs of growing areas. In addition, theplan explores methods of improving alternativesto the car, so people can walk, bike, or takepublic transit from their homes.
• Water Resources Plan. This plan addresseswater supply, stormwater, and flooding issues, all ofwhich can impact housing. Public water is espe-cially important for new housing, while floodingissues effect many existing residential areas.
Housing is needed for new workers.
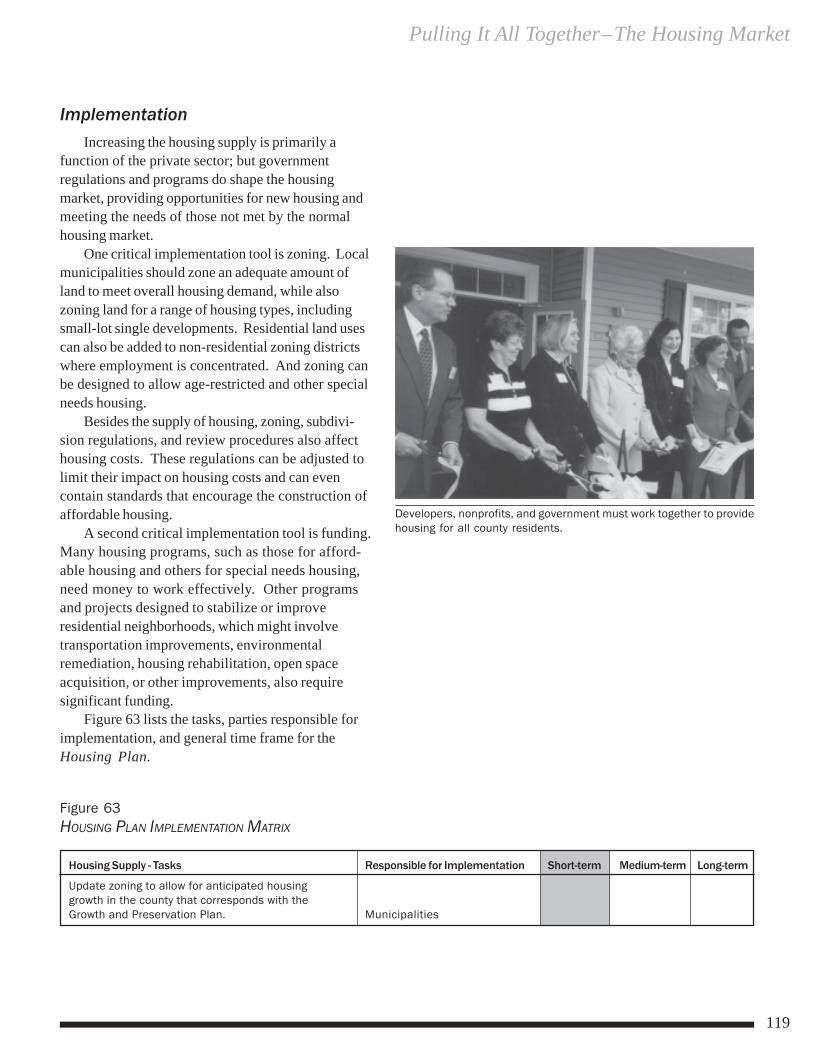
Pulling It All Together–The Housing Market
119
ImplementationIncreasing the housing supply is primarily a
function of the private sector; but governmentregulations and programs do shape the housingmarket, providing opportunities for new housing andmeeting the needs of those not met by the normalhousing market.
One critical implementation tool is zoning. Localmunicipalities should zone an adequate amount ofland to meet overall housing demand, while alsozoning land for a range of housing types, includingsmall-lot single developments. Residential land usescan also be added to non-residential zoning districtswhere employment is concentrated. And zoning canbe designed to allow age-restricted and other specialneeds housing.
Besides the supply of housing, zoning, subdivi-sion regulations, and review procedures also affecthousing costs. These regulations can be adjusted tolimit their impact on housing costs and can evencontain standards that encourage the construction ofaffordable housing.
A second critical implementation tool is funding.Many housing programs, such as those for afford-able housing and others for special needs housing,need money to work effectively. Other programsand projects designed to stabilize or improveresidential neighborhoods, which might involvetransportation improvements, environmentalremediation, housing rehabilitation, open spaceacquisition, or other improvements, also requiresignificant funding.
Figure 63 lists the tasks, parties responsible forimplementation, and general time frame for theHousing Plan.
Developers, nonprofits, and government must work together to providehousing for all county residents.
Figure 63HOUSING PLAN IMPLEMENTATION MATRIX
Housing Supply - Tasks Responsible for Implementation Short-term Medium-term Long-term
Update zoning to allow for anticipated housinggrowth in the county that corresponds with theGrowth and Preservation Plan. Municipalities
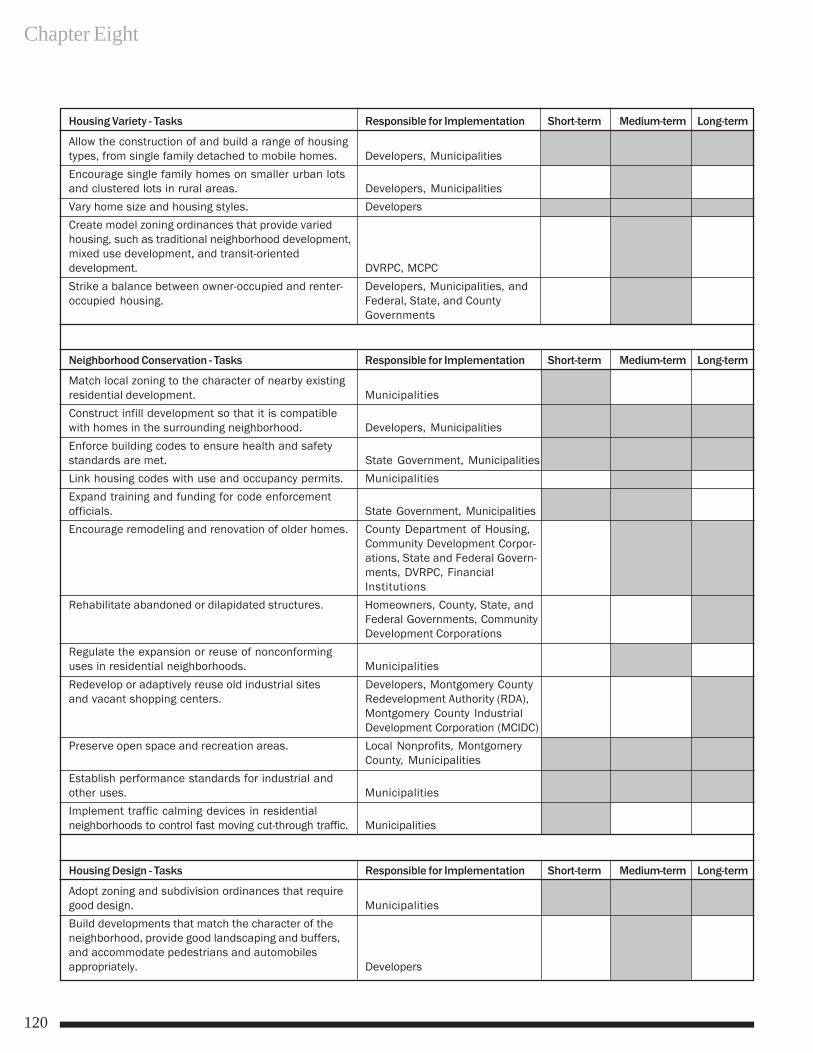
Chapter Eight
120
Housing Variety - Tasks Responsible for Implementation Short-term Medium-term Long-term
Allow the construction of and build a range of housingtypes, from single family detached to mobile homes. Developers, Municipalities
Encourage single family homes on smaller urban lotsand clustered lots in rural areas. Developers, Municipalities
Vary home size and housing styles. Developers
Create model zoning ordinances that provide variedhousing, such as traditional neighborhood development,mixed use development, and transit-orienteddevelopment. DVRPC, MCPC
Strike a balance between owner-occupied and renter- Developers, Municipalities, andoccupied housing. Federal, State, and County
Governments
Neighborhood Conservation - Tasks Responsible for Implementation Short-term Medium-term Long-term
Match local zoning to the character of nearby existingresidential development. Municipalities
Construct infill development so that it is compatiblewith homes in the surrounding neighborhood. Developers, Municipalities
Enforce building codes to ensure health and safetystandards are met. State Government, Municipalities
Link housing codes with use and occupancy permits. Municipalities
Expand training and funding for code enforcementofficials. State Government, Municipalities
Encourage remodeling and renovation of older homes. County Department of Housing,Community Development Corpor-ations, State and Federal Govern-ments, DVRPC, FinancialInstitutions
Rehabilitate abandoned or dilapidated structures. Homeowners, County, State, andFederal Governments, CommunityDevelopment Corporations
Regulate the expansion or reuse of nonconforminguses in residential neighborhoods. Municipalities
Redevelop or adaptively reuse old industrial sites Developers, Montgomery Countyand vacant shopping centers. Redevelopment Authority (RDA),
Montgomery County IndustrialDevelopment Corporation (MCIDC)
Preserve open space and recreation areas. Local Nonprofits, MontgomeryCounty, Municipalities
Establish performance standards for industrial andother uses. Municipalities
Implement traffic calming devices in residentialneighborhoods to control fast moving cut-through traffic. Municipalities
Housing Design - Tasks Responsible for Implementation Short-term Medium-term Long-term
Adopt zoning and subdivision ordinances that requiregood design. Municipalities
Build developments that match the character of theneighborhood, provide good landscaping and buffers,and accommodate pedestrians and automobilesappropriately. Developers
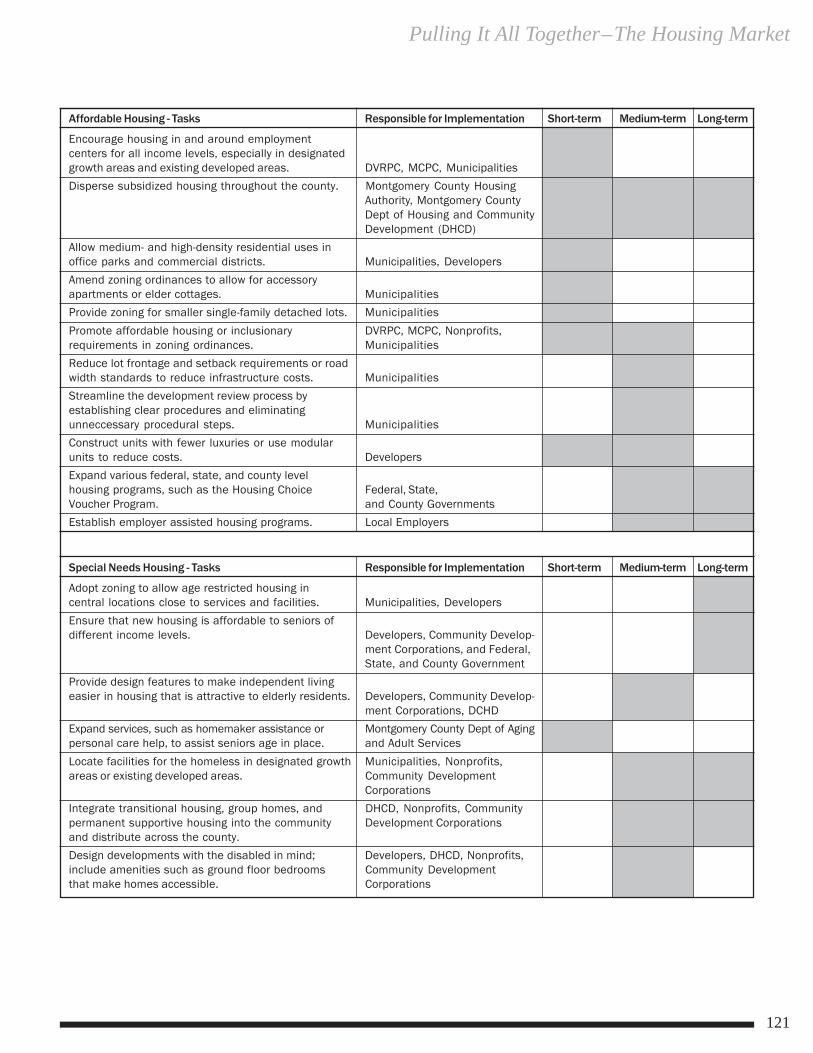
Pulling It All Together–The Housing Market
121
Affordable Housing - Tasks Responsible for Implementation Short-term Medium-term Long-term
Encourage housing in and around employmentcenters for all income levels, especially in designatedgrowth areas and existing developed areas. DVRPC, MCPC, Municipalities
Disperse subsidized housing throughout the county. Montgomery County HousingAuthority, Montgomery CountyDept of Housing and CommunityDevelopment (DHCD)
Allow medium- and high-density residential uses inoffice parks and commercial districts. Municipalities, Developers
Amend zoning ordinances to allow for accessoryapartments or elder cottages. Municipalities
Provide zoning for smaller single-family detached lots. Municipalities
Promote affordable housing or inclusionary DVRPC, MCPC, Nonprofits,requirements in zoning ordinances. Municipalities
Reduce lot frontage and setback requirements or roadwidth standards to reduce infrastructure costs. Municipalities
Streamline the development review process byestablishing clear procedures and eliminatingunneccessary procedural steps. Municipalities
Construct units with fewer luxuries or use modularunits to reduce costs. Developers
Expand various federal, state, and county levelhousing programs, such as the Housing Choice Federal, State,Voucher Program. and County Governments
Establish employer assisted housing programs. Local Employers
Special Needs Housing - Tasks Responsible for Implementation Short-term Medium-term Long-term
Adopt zoning to allow age restricted housing incentral locations close to services and facilities. Municipalities, Developers
Ensure that new housing is affordable to seniors ofdifferent income levels. Developers, Community Develop-
ment Corporations, and Federal,State, and County Government
Provide design features to make independent livingeasier in housing that is attractive to elderly residents. Developers, Community Develop-
ment Corporations, DCHD
Expand services, such as homemaker assistance or Montgomery County Dept of Agingpersonal care help, to assist seniors age in place. and Adult Services
Locate facilities for the homeless in designated growth Municipalities, Nonprofits,areas or existing developed areas. Community Development
Corporations
Integrate transitional housing, group homes, and DHCD, Nonprofits, Communitypermanent supportive housing into the community Development Corporationsand distribute across the county.
Design developments with the disabled in mind; Developers, DHCD, Nonprofits,include amenities such as ground floor bedrooms Community Developmentthat make homes accessible. Corporations
Chapter Eight
122
ConclusionMontgomery County has a diverse, attractive,
and convenient housing stock that is a major pillar ofthe county’s stability. Over the next couple ofdecades, this existing housing stock will becomeeven stronger while new housing will be varied,affordable, and well-designed.
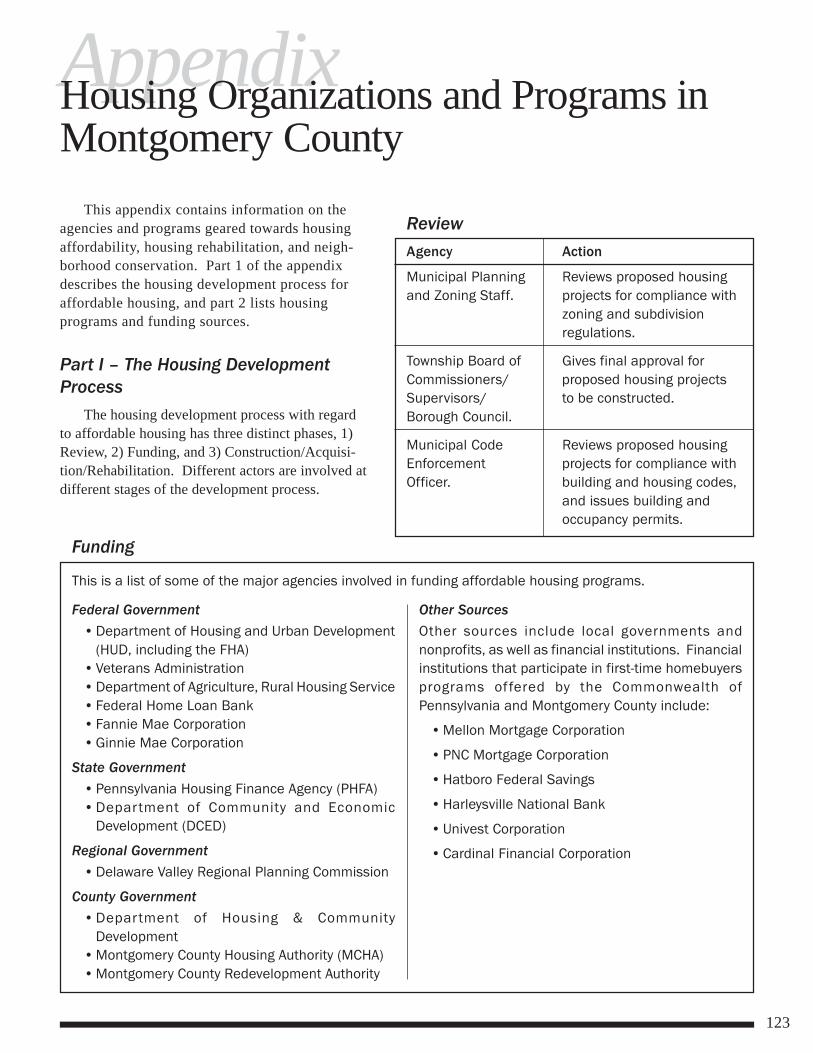
123
AppendixHousing Organizations and Programs inMontgomery County
This appendix contains information on theagencies and programs geared towards housingaffordability, housing rehabilitation, and neigh-borhood conservation. Part 1 of the appendixdescribes the housing development process foraffordable housing, and part 2 lists housingprograms and funding sources.
Part I – The Housing DevelopmentProcess
The housing development process with regardto affordable housing has three distinct phases, 1)Review, 2) Funding, and 3) Construction/Acquisi-tion/Rehabilitation. Different actors are involved atdifferent stages of the development process.
ReviewAgency Action
Municipal Planning Reviews proposed housingand Zoning Staff. projects for compliance with
zoning and subdivisionregulations.
Township Board of Gives final approval forCommissioners/ proposed housing projectsSupervisors/ to be constructed.Borough Council.
Municipal Code Reviews proposed housingEnforcement projects for compliance withOfficer. building and housing codes,
and issues building andoccupancy permits.
Funding
This is a list of some of the major agencies involved in funding affordable housing programs.
Federal Government• Department of Housing and Urban Development
(HUD, including the FHA)• Veterans Administration• Department of Agriculture, Rural Housing Service• Federal Home Loan Bank• Fannie Mae Corporation• Ginnie Mae Corporation
State Government• Pennsylvania Housing Finance Agency (PHFA)• Department of Community and Economic
Development (DCED)
Regional Government• Delaware Valley Regional Planning Commission
County Government• Department of Housing & Community
Development• Montgomery County Housing Authority (MCHA)• Montgomery County Redevelopment Authority
Other SourcesOther sources include local governments andnonprofits, as well as financial institutions. Financialinstitutions that participate in first-time homebuyersprograms offered by the Commonwealth ofPennsylvania and Montgomery County include:
• Mellon Mortgage Corporation
• PNC Mortgage Corporation
• Hatboro Federal Savings
• Harleysville National Bank
• Univest Corporation
• Cardinal Financial Corporation
Appendix
124
Part II – Housing Affordability,Rehabilitation, and NeighborhoodConservation Programs and FundingSourcesHousing Affordability Programs
There are a variety of federal, state, and countyprograms designed to make housing more affordableand to encourage homeownership.
Federal Government ProgramsMost federal government programs are adminis-
tered at the state, county, and local level. Theseprograms are described under the state or countycategories listed below, since any user of theseprograms would contact a state or county official toaccess the program.
State Government ProgramsThe Commonwealth of Pennsylvania has a
number of homeownership programs gearedtowards first-time homebuyers, low and moder-ate-income homebuyers, and prospectivehomebuyers with physical disabilities that wouldincur additional costs in the course of modifyinga home to accommodate those disabilities. ThePennsylvania Housing Finance Agency (PHFA)administers these programs.
• Keystone Home Loan Program. This is thelargest and most commonly used home-ownership program and provides 30-yearfixed rate home mortgage loans to first-timehome buyers at lower than market interestrates. In 2004, the purchase price limits forhomes in Montgomery County were$240,000 for new construction and $200,000for existing housing.
Applicants also had to meet the followinghousehold income limits: $68,000 per year fora 1-or 2-person household and $78,000 per yearfor 3-or-more person households.
• Access Home Modification Program. Thisprogram provides mortgage loans to assistpersons with disabilities or who have a familymember(s) living in the household with disabili-ties who are purchasing a home that needsaccessibility modifications. The mortgage loanamount must be no less than $1,000 and no
Construction/Acquisition/RehabilitationBelow is a list of some of the major for-profit andnonprofit agencies involved in the creation ofaffordable housing through either new construction,and/or acquisition and rehabilitation of existinghousing in Montgomery County.
• Habitat for Humanity
• Genesis Housing Corporation
• Community Housing Services, Inc.
• Willow Grove Community DevelopmentCorporation
• Lower Merion Affordable Housing Corporation
• Phoenixville Homes
• Penrose
• Salisbury Housing of Southeast Pennsylvania
• Homes for America/Shelter Development
• ACLAMO
• Ingerman Group
• Leon Weiner Associates
Housing Organizations and Programs in Montgomery County
125
more than $10,000. These loans are interestfree and have no fees.
• PHFA/ Fannie Mae Disability AccessModification Loan Program. This programis similar to the Access Home ModificationProgram in that it provides a second mortgageloan for financing accessibility modificationsin a home being purchased, but it differs fromthat program in that it also offers a fullyamortizing 30-year fixed rate conventionalfirst mortgage for the purchase of a home bypersons with disabilities or who have a familymember(s) with disabilities living with them.The qualifying annual household income forMontgomery County in 2004 was $83,400.The program is also a joint effort betweenPHFA and Fannie Mae.
• Access Downpayment and Closing CostAssistance Loan Program. This programprovides mortgage loans to assist persons withdisabilities or who have a family member(s)living in the household with disabilities who arepurchasing homes and need assistance withdown payment and closing costs. The qualify-ing annual household income limit for Mont-gomery County in 2004 was $38,000. Theseloans are interest free and have no fees. Themortgage loan amount must be no less than$1,000 and no more than $15,000.
• Closing Cost Assistance Program. Thisprogram helps lower-income, first-timehomebuyers with closing costs. The prospectivehomebuyer may borrow up to $2,000 as asecond mortgage. This loan does not requirerepayment until the first mortgage is paid in fullor the home is sold.
• Homestead Second Mortgage Program. Thisprogram provides a zero-interest second mort-gage to first-time home buying families withchildren, and individuals with disabilities. Theloan amount is between $1,000 - $15,000 anddoes not have to be repaid until the first mort-gage is paid in full or the home is sold.
• Joint Financing Program. This program is ajoint effort by PHFA and the Rural HousingService, an arm of the United States Departmentof Agriculture, and provides 100% financing tolow income families living in rural Pennsylva-nia. Prospective homebuyers must be first time
Appendix
126
homebuyers and residing in an area defined as“rural” by the RHS. Most of MontgomeryCounty west of Skippack Creek is eligible,including Pottstown and the Pottsgroves.
• Keystone Home Loan Plus Program. Thesefirst mortgage programs include Conventionaland Veterans Administration 30-year fixed ratemortgage loans with low or no down paymentcosts depending on the type of loan. Borrowersmust be a family or disabled, first-timehomebuyers and attend educational home-ownership counseling in order to receive a loan.In 2004, the purchase price limits for homes inMontgomery County were $180,000 for a newhome and $140,000 for an existing home.
Applicants also had to meet the followingincome limits: $51,000 per year for a 1-or 2-person household and $59,000 per year for 3 ormore person households.
• Pennvest. This program provides low-costassistance to homeowners in repairing andreplacing existing on-lot sewage systems. Onepercent loans of up to $25,000 were beingoffered in 2004 to applicants whose householdincome did not exceed 150% of the statewidemedian, which equaled $64,370 in 2004.
Regional Agency ProgramsThe Delaware Valley Regional Planning Commis-
sion is the agency responsible for funneling federaltransportation monies to the counties and municipali-ties in the Philadelphia metropolitan region. InSeptember of 2002, DVRPC partnered with theReinvestment Fund (TRF), a regional economicdevelopment fund, Fannie Mae corporation, andCitizens Bank to offer the Smart Commute Mortgageto home buyers considering the purchase of a homelocated in selected transit friendly areas of the region.The Smart Commute Mortgage would be available toany homebuyer regardless of income as long as theywished to buy a home near a public transit stop orfacility, and would act to increase their monthlyincome by $200 and allow them to get a larger mort-gage loan than they would otherwise be able to get.
County Government ProgramsThe county administers a number of its own
programs, as well as many federal programs.MONTGOMERY COUNTY DEPARTMENT OFHOUSING AND COMMUNITY DEVELOPMENT• First-Time Homebuyers Program. The
Montgomery County Department of Housing
Housing Organizations and Programs in Montgomery County
127
and Community Development offers a First-Time Homebuyers Program that assists low,moderate and median income householdsinterested in purchasing a home in MontgomeryCounty. The program offers assistance withclosing costs up to 10% of the purchase price ofthe home. Prospective homebuyers must beable to put down 3% of the purchase price of thehome as a down payment. These loans areoffered interest free, and must be repaid if thehome is sold or conveyed to another owner, or ifthe property is used as a rental property ratherthan a primary residence.
• Employer Assisted Housing Program. Thisprogram assists employees of MontgomeryCounty with up to $15,000 per employee fordownpayments, closing costs, and rehabilitationof homes they purchase in Norristown orPottstown Boroughs. Loans are zero interestand are required to be paid in full if property isresold within eight years.
• Affordable Housing Trust Fund. This countyprogram is funded with money raised from therecording fees of deeds and mortgages. Thismoney is used to support affordable housingprojects in the county, particularly the construc-tion of new affordable developments.
MONTGOMERY COUNTY HOUSING AUTHORITY• The Housing Choice Voucher Program
(formerly Section 8), Home OwnershipOption. Under this program, individuals andfamilies already participating in the rentalassistance side of the Housing Choice Voucherprogram can elect to buy their own home andhave part of their mortgage subsidized by HUD,just as part of their rent was. This program isdesigned to move people from being renters tohomeowners. The MCHA was one of the firsthousing authorities in the U.S. to offer this program.
• 5 (h) First-Time Homeownership Program.This program allows low to moderate-incomeindividuals and families to purchase homes thatare owned by the MCHA. Under the program thedifference between the appraised value of thehouse and the mortgage amount the family canafford is covered by a grant backing a secondmortgage requiring no payments. The grant isforgiven after 15 years of home ownership.
• Family Self Sufficiency Program. Thisprogram is designed to help families becomeeconomically self-sufficient through coordi-
Appendix
128
nated services in education, job training, jobplacement and adult basic skills development.Under the program a designated head ofhousehold meets with a caseworker to drawup an individualized training plan, and signs acontract to complete each step of the plan.After the head of household obtains a job andis earning a steady income, the MCHA estab-lishes an interest bearing escrow account anddeposits a cash sum of money in the accountbased on the head’s income level, each month.The money in the account can be used as adown payment for a home, for additionaleducation and training, to buy a car or for anyother purpose. The MCHA will make depos-its in the account for as long as it takes thehead of household to complete the require-ments of the training plan, or for 5 years,whichever comes first.
• The HOME Program. The HOME InvestmentPartnership Program (HOME) funds a variety oflocal housing activities, including the construc-tion of affordable housing.
• Emergency Shelter Grants. The EmergencyShelter Grants program is designed to helpimprove the quality of existing emergencyshelters for the homeless; make availableadditional shelters and transitional housing;meet the costs of operating shelters and provid-ing essential services to homeless individuals;and to help prevent homelessness.
• Continuum of Care Homeless AssistanceProgram. This program is designed to helphomeless people obtain and remain in perma-nent housing, increase their skills and income,and achieve greater self-determination. Theprogram’s three components are the supportivehousing program, the shelter plus care program,and the section 8 moderate rehabilitation singleroom occupancy program.
Rehabilitation ProgramsThe Montgomery County Department of
Housing and Community Development adminis-ters two housing rehabilitation programs of itsown, the Emergency Owner-Occupied Rehabilita-tion Grant Program and the Targeted HomeownerRehabilitation Program. The Department of
Housing Organizations and Programs in Montgomery County
129
Housing, along with the Planning Commission,also helps administer the Montgomery CountyCommunity Revitalization Program.
• Emergency Owner-Occupied RehabilitationProgramThis program addresses emergency repairsnecessary to safeguard against imminentdanger to human life, health, or safety. Emer-gency repairs include heating systems, defi-ciencies in roofs, floors, ceilings, stairs and/or framing, plumbing systems, electricalsystems, exterior doors and windows, lateralconnections to water, and sanitary sewerextensions. Grants are available up to amaximum amount of $25,000.
• Targeted Homeowner RehabilitationProgramThis program targets owner-occupied homeslocated within community revitalization areas,as designated by the County CommunityRevitalization Board. Extensive rehabilitationwork is performed to building code standards,and lead reduction or abatement activities arealso performed on pre-1978 properties wherenecessary. Exterior improvements to propertiesare also performed. Grants are available up to amaximum of $25,000, and may be increased tocover additional repairs on an individual basis.
• Community Revitalization ProgramThe county community revitalization programdistributes county funds to local municipalitiesfor a wide range of projects, including housingrehabilitation and other housing purposes, suchas affordable housing.
Neighborhood Conservation ProgramsThere are a variety of funding sources avail-
able for neighborhood conservation activitiesfrom different levels of government that localcommunities can tap. These programs are often,but not always, linked to housing, with someprograms dealing with other aspects of neighbor-hood conservation, such as brownfields redevel-opment or infrastructure upgrades. The followingis a list of the major programs available, but is byno means exhaustive.
Appendix
130
Federal Sources• Community Development Block Grants
(CDBG)These grants can be used by municipalities forthe widest variety of community developmentactivities including the demolition and rehabili-tation of housing, transportation improvements,the construction of public sewer and waterfacilities, and other similar activities.
• Brownfields Economic DevelopmentInitiativeThese funds can be used by municipalities topay for the pollution clean-up costs associatedwith a brownfield property, the acquisitioncosts of a brownfield property, and the cost ofconveying the site to a private sector party ata discounted price.
• Grants for Public Works and EconomicDevelopmentThese grants can be used by states, counties,municipalities, and private or public nonprofitorganizations representing a redevelopment areaand can be used for public works and facilitiessuch as public rights-of-way and related infra-structure projects, site preparation, or otherimprovements.
• Congestion Mitigation and Air QualityImprovement Program (CMAQ)Municipalities can use these funds for trafficflow improvement projects and bicycle andpedestrian projects.
• Transportation EnhancementsMunicipalities can use these funds for planningand construction of bicycle facilities, pedestrianwalkways, improvements that accommodateother modes of transportation than cars, andother transportation enhancements.
State SourcesDEPARTMENT OF CONSERVATION AND NATURALRESOURCES.• Community Conservation Partnership Program
The C2P2 contains the following grant compo-nents: Community Recreation, Land Trusts,Rails-to-Trails, Rivers Conservation, Snowmo-bile/ATV, Heritage Parks, Land and WaterConservation Fund and Recreational Trails.Except for the Heritage Parks grants, all othercomponents have been combined into oneannual application cycle (generally late summer/early fall). Generally, all components require a
Housing Organizations and Programs in Montgomery County
131
match, usually 50 percent of cash or in-kindcontributions. Visit http://www.dcnr.state.pa.us/brc/grants/.
DEPARTMENT OF COMMUNITY AND ECONOMICDEVELOPMENT.• Main Street Program
Is a five-year program designed to help acommunity’s downtown economic developmentefforts through the establishment of a localorganization dedicated to downtown revitalizationand the management of downtown revitalizationefforts by hiring a full-time professional manager.
• Elm Street ProgramDepartment of Conservation and NaturalResources.
• Enterprise Zone ProgramAn Enterprise Zone is an area designated byDCED as financially distressed and disadvan-taged. Technical assistance and tax incentivesare offered to businesses in the area to encour-age investment, job creation, and urban renewalthrough public/ private partnerships.
• Keystone Innovation ZonesKIZs are designated zones that may be establishedin communities that host institutions of highereducation—colleges, universities, junior colleges,and technical schools. KIZs are formed out of aconsortium of public, private and academicrepresentatives in a specific area. All with grantsfor a KIZ coordinator, areas are eligible for up to$25 million per year in tax credits.
• Business in Our Sites ProgramOver $300 million will be available statewide inthe form of loans and grants to acquire land,conduct environmental assessment andremediation, demolition, and installation ofnecessary infrastructure. In addition technicalassistance will be offered to smaller communi-ties that lack the resources or expertise toexecute site preparation projects.
• Industrial Sites Reuse Program (ISRP)These funds can be used by municipalities,public and nonprofit economic developmententities, and private companies for environmen-tal assessments and clean up of hazardoussubstances on former industrial properties.
• Infrastructure Development ProgramThese funds can be used by municipalities,industrial development agencies, redevelopment
Appendix
132
authorities and local development districts to payfor transportation facilities, environmental clean-up activities, water and sewer systems, parkingfacilities, and storm sewers. These monies canalso be used for land and building acquisition andrenovation at former industrial sites.
• Local Government Capital Projects LoanProgramThis program is designed for municipalitieswith a population of 12,000 or less, and pro-vides low-interest loans for the purchase ofequipment, and the construction or rehabilita-tion of municipal facilities.
Pennsylvania Infrastructure InvestmentAuthority• PENNVEST
Offers low-cost financial assistance to munici-palities, municipal authorities, and privateutilities seeking to upgrade water, sewer, andstormwater systems. Visit http://www.pennvest.state.pa.us/pennvest/site/default.asp.
County SourcesThe county administers the CDBG program for
most of the municipalities in Montgomery County,with the exception of Abington, Conshohocken,Limerick, Lower Merion, and Norristown.
The county also has its own program:• Community Revitalization Program
As described under housing rehabilitation,this program distributes money to localmunicipalities for a variety of projects,including many neighborhood conservationprojects, such as main street revitalization,streetscape improvements, park improve-ments, brownfields redevelopment, etc..
Foundation SourcesThere are also several private foundations that
fund community and economic development activi-ties related to housing, keeping neighborhoodshealthy, and maintaining community facilities.These include The Allstate Foundation, The ArcadiaFoundation, The Fannie Mae Foundation, The FirstUnion Foundation, The William Penn Foundation,The Pew Charitable Trusts, The PhiladelphiaFoundation, and The Sovereign Bank Foundation.
Plan Elements ofShaping Our Future: A Comprehensive Planfor Montgomery County
· Vision Plan
· Community Facilities Plan
· Economic Development Plan
· Housing Plan
· Land Use Plan
· Open Space, Natural Features, and Cultural Resources Plan
· Transportation Plan
· Water Resources Plan

PREPARED BY THE MONTGOMERY COUNTY PLANNING COMMISSION 4C-4/05