Embed Size (px)
Citation preview
Journal of Education Research ISSN: 1935-052XVolume 6, Number 1 © 2012 Nova Science Publishers, Inc.
How MUCH VARIATION IS ACCEPTABLEIN ADAPTING A CURRICULUM?
Abdus Sattar Molla and Yew-Jin LeeNatural Sciences and Science Education Academic Group,
National Institute of Education, Singapore.
ABSTRACT
Although intended curricula are usually not implemented with good fidelity, they areoften successful in achieving their goals. This is possible through adaptation by teachersto the changing social situation or by being responsive to the peculiar needs of theirlearners. However, this now raises the question whether these meso- and micro-transformations to the curriculum actually transform it to something different from whatits developers envisaged (Ruiz-Primo, 2006). A fidelity-adaptation-enactment continuumis recognized (Snyder et al., 1992) but we are uncertain regarding the acceptable limits ofadaptation that may subvert the deeper philosophies of the program. One possible way tomeasure program fidelity among participants is the Concerns-Based Adoption Model(Hord et al., 1987). It however is seen by some (e.g., Cheung et al., 2001) as problematicand aligned to measure only fidelity, whereas we feel CBAM theory has potential forcontinuing research and development (Anderson, 1997) and this can measure adaptationlevels (Dusenbury et al., 2003) as well. We thus studied a school-based lower secondaryscience program in a Singapore school for the last two years through document analysis,classroom observation, video-recording of classes and interviewing the developer-implementer teachers and the students. We analyzed the data using a fidelity ofimplementation (FOI) framework largely modified from Ruiz-Primo's (2006) one sincethe characteristics of each program determine what has to be measured duringimplementation. We sought the fidelity level of implementing the program to itsdimensions from the broadest philosophy to the finest lesson plan via the intermediarygoals, objectives, contents and pedagogy. We tallied the results against both the fidelity-adaptation-enactment continuum and CBAM Levels of Use (LoU) and found the programhad good fidelity to the stated goals, objectives and contents, and less to both philosophyand pedagogy dimensions at two ends. This depended on its flexible structure,developers' enthusiasm, in-built training for implementer teachers and the students'interest. Factors contributing to a rather low fidelity were prevailing high-stakeassessment measures, time-constraint, large teacher turnover and inadequate training. Ourstudy contributes to the longstanding problem of how much adaptation is consideredacceptable for a school program.
Keywords: School-based, fidelity-adaptation-enactment, CBAM, Levels of Use.
Abdus Sattar Molla and Yew-Jin Lee
INTRODUCTION
Research on curriculum implementation gathered moss about four decades ago with therealization that users across different sites and conditions will automatically implementprograms consistent with the original model (Emsoff, Blakely, Gottschalk, Mayer, Davidson,& Erickson, 1987) was no more tenable, rather researchers need to enter inside the "blackbox" to see closely the process of implementation which itself is a problem complex enoughto study.
Even then researchers were divided on which of the two ways: fidelity and adaptation theprocess of implementation should follow. Pro-fidelity advocates hold that innovativeprograms are consisted of well-specified components and the programs need to be adoptedwith close correspondence, i.e., fidelity to the original models faithfully (Boruch & Gomez,1977). Calsyn, Tornatzky, and Dittmar (1977) argued that ineffectiveness follows unfaithfulreplication, or dilution, of validated models. Pro-adaptation advocates, however, argue thatdiffering organizational contexts and practitioner needs necessitate changes in the programmodels while implemented by each adopter (e.g., Berman & McLaughlin, 1978). Thus thedebate continues and Hord and her colleagues after developing their Concerns-BasedAdoption Model (CBAM) to help facilitate the process of implementation of any innovatedprogram, chose to "sit on the fence" till the ideological combatants resolve their differences(Hord, 1987).
As Hord (1987) viewed, we also realize that both fidelity and adaptation can be effective,depending on a variety of factors, and neither one, by itself, necessarily guarantees success orfailure. Although the pro-adaptation position has continued to attract an increasing number ofadherents, the debate goes on and the "zone of drastic mutation" (Hall & Loucks, 1977) is yetto be defined well. That is, even if we prefer to posit ourselves in the adaptation camp, thequestion remains how much adaptation should be allowed keeping the "mutuality" amongdevelopers and implementers of a program alive.
There are a number of dimensions of the curriculum and asking a question "fidelity towhich dimension(s)?", we are attempting to find a way out to take into account both fidelityand adaptation and finding a zone of mutuality among the developers and implementers of aprogram.
We studied a school-based lower secondary (Grades 7-8) science program in Singaporefor the last two years. The program is called Science ALIVE ("ALIVE" being an acronym forActive Learning through Inquiry, inVolvement and Exploration) was developed byintegrating science content knowledge with Project Work (PW)-a compulsory aspect of thecentrally developed curriculum. Although the program was developed as a "bottom-upinitiative", it had the blessings of "top-down support" from the Teach Less, Learn More(TLLM) initiative of the Ministry of Education (MOE); the TLLM being an offshoot of theSingapore MOE's third phase education reform called Ability Driven Education (ADE) (Tan& Ng, 2007).
Science ALIVE came into being in 2006. The teacher-developers first prepared sixmodule outlines; two each in biology, chemistry and physics. They served these to theindividual students asking for choosing three of them each. After this opinion survey, theteachers decided on four most popular modules. The modules thus decided on were: AromaChemistry, Biodiversity, Life Science and Water Rockets. Next year in 2007, they changed
How Much Variation is Acceptable in Adapting a Curriculum? 3
the name of the last module (Water Rockets) to Projectile Science to remove girl students'rocket-phobia. Only the change of the name helped attract more girl students to this module in2008. Here we report the implementation data of Life Science module collected in 2008 usinga highly modified fidelity of implementation (FOI) framework from Ruiz-Primo (2006) andrelate the results to both fidelity-adaptation-enactment continuum and CBAM Levels of Use(LoU).
CONCEPTUAL FRAMEWORK
We position our study inside fidelity-adaptation-enactment continuum (Snyder, Bolin &Zumwalt, 1992) and CBAM Levels of Use (LoU). For measuring fidelity of implementation(FOI), we developed a framework largely modified from Ruiz-Primo's (2006) one. That iswhy we describe all the three concepts (fidelity-adaptation-enactment continuum, CBAM andFOI) before that of our own.
The Fidelity-Adaptation-Enactment Continuum
The fidelity perspective of the fidelity-adaptation-enactment continuum focuses onmeasuring the degree of implementation of a planned curriculum. This model assumes thatinnovations are like technologies and implementer teachers usually do not have enoughexpertise to make effective changes to a curriculum prepared by experts. Developing atechnology (here curriculum) obviously requires considerable expertise, money, time andenergy. That is why the hard-line proponents of this model logically question that if a bestplanned curriculum suffers dilution (that adaptation results in) during implementation, whythe resources, time and energy were wasted in planning that. Their notion is: since theteachers lack good knowledge of curriculum, they should better get explicit instruction andimplement a highly structured curriculum faithfully. However, research so far revealed thateven an excellently planned curriculum needs at least some changes during the adoptionprocess; the fidelity model does not consider the details of the adoption process. That is whythis model has only a "trickle-down" (Marsh & Willis, 2007) impact on education. Theexcellence in planning a curriculum can increase the fidelity level but that can never beabsolute.
In this backdrop, "mutual adaptation" model came into being at the hands of Dalin andMcLaughlin (1975) who coined this term to describe the process of implementation in whichadjustments are made to both the (innovative) curriculum and the institutional settings (Marsh& Willis, 2007). Later the model was expanded by Berman and McLaughlin (1976, 1978) inexplaining their Rand study results. The mutual adaptation model tries to understand changeas a process and realizes that modification of a curriculum by its users is inevitable.Implementation "requires a certain amount of negotiation and flexibility on the part of bothdesigners and practitioners" (Snyder et al., 1992, p. 410). In essence, mutual adaptation canbe seen as evolution where the curricular blue print is gradually perceived as "somethingmalleable" (Marsh & Willis, 2007). The model works in the social dimension negotiating andmediating between the developers on one end and the target students on the other. Spillane
Abdus Sattar Molla and Yew-Jin Lee
(1999) asserted that mutual adaptation can help extend the teachers' enactment zones beyondtheir individual classrooms to include rich ideas and deliberations of fellow teachers and otherexperts.
Enactment of curriculum at the other extreme of the continuum emphasizes "co-construction" (Datnow, 2006) by the teacher and students of a curriculum that is most suitedto their needs. The concept was developed by Snyder et al. (1992) to view curriculum as "theeducational experiences jointly created by student and teacher" (p. 418). Here the studentsand the teacher see the externally created curricular materials as only "tools" of use for"constructing" their own curriculum. The educational curriculum thus "enacted" can nolonger be taken as the planned one; instead it is an entirely new curriculum because evenchanging the goals of the intended curriculum is welcome in this model. As a result thisextreme mode of curriculum implementation is yet to grow popularity among implementationresearchers.
The CBAM Theory and the Levels of Use (LoU)
Concerns-Based Adoption Model (CBAM) is a conceptual framework that provides toolsand techniques for assessing and facilitating reform in an educational environment. Itsdevelopers-Hall and his associates noticed that new programs, new practices and newcurricula developed with the expectation that this change would lead to better students'outcomes often do not result in improvements. When that happens, schools often try a newprogram, then after seeing no results, move on to another. These authors thought that theschools rather need to understand the change process itself. First they propounded thefollowing assumptions:
1. Change is a process, not an event.2. Change is accomplished by individuals.3. Change is a highly personal experience.4. Change involves developmental growth.5. Change is best understood in operational terms.6. The focus on facilitation should be on individuals, innovations, and the context.
To understand the change process, first these authors tried to know the concerns ofimplementer teachers, contained assumption numbers 2-3 and developed sevendevelopmental stages of concerns that they leveled "0" to "6" as follows:
0. Awareness concerns: Very little concerned.1. Informational concerns: They would likely to know more about the innovation.2. Personal concerns: How the innovation will affect them or her.3. Management concerns: The user is concerned with the management process.4. Consequence concerns: Concern about how the innovation is impacting the students.5. Collaboration concerns: Users are concerned how their colleagues are using the
innovation.6. Refocusing concerns: Users are concerned in making the innovation work even better.
How Much Variation is Acceptable in Adapting a Curriculum? 5
To collect teachers' stages of concerns, they developed 35 concerns questions. In thisway, these authors accommodated all possible the concerns in stages that the teachers mighthave.
Then they developed another dimension of the CBAM-the Levels of Use (LoU). Basedon the concerns, again, the LoU signifies a developmental step-wise growth with time andexperience in use. These are as follows:
Level 0 - Non-use: State in which the individual has little or no knowledge of theinnovation.
Level I - Orientation: State in which the individual has acquired or is acquiringinformation about the innovation and/or has explored its value orientationand what it will require.
Level II - Preparation: State in which the individual is preparing for first use of theinnovation.
Level III - Mechanical use: State in which the user focuses most efforts on short-term, day-to-day use of the innovation with little time for reflection.
Level IVA - Routine: Use of innovation is stabilized. Few if any changes are beingmade in ongoing use.
Level IVB - Refinement: State in which the user varies the use of the innovation toincrease the impact on clients (students or others) within their immediatesphere of influence.
Level V - Integration: State in which the user is combing own efforts to use theinnovation with related activities of colleagues to achieve a collectiveimpact on clients within their common sphere of influence.
Level VI - Renewal: State in which the user réévaluâtes the quality of use of theinnovation, seeks major modifications of, or altematives to, presentinnovation to achieve increased impact on clients.
The above two dimensions of CBAM are aimed not only to know the teachers' concernsand the levels of use, but to facilitate the users to attain higher levels if they are interested todo so.
The authors then turned to a resultant innovation configuration (IC) each implementerteacher can reach based on his/her concerns and Levels of Use.
Many authors while studying the process of implementation of an innovation refer toCBAM, but we find that this very flexible and containing framework did not receive as muchimportance as it deserved, A few authors (e.g., Cheung et al., 2001) found this as problematicand aligned to measure only fidelity. To cope with problem of rigidity (if any) in the Stages ofConcem Questionnaire (SoCQ), Hord (1987) herself suggested "If the expectations are forgreat variety and ongoing adaptation in the innovation as it is implemented and as it 'lives' inclassrooms, then a more open-ended, categorical checklist can reflect that added openness"(p. 170). Therefore, we feel CBAM theory has potential for continuing research anddevelopment as Anderson (1997) noted. We would agree with Hord (1987) that "the principalideas herein espoused are both practical and flexible enough to the problems and interests ofany education-related group, whatever their particular viewpoint" (p. 173). The eight Levelsof Use (including three non-use levels) are so containing that even LoU III to VI may beenough to contain all the three modes of fidelity-adaptation-enactment continuum that we
Abdus Sattar Molla and Yew-Jin Lee
would explain later. However, the Routine level (LoU IVA) can be positioned after each ofthe Mechanical (LoU III), Refinement (LoU IVB), Integration (LoU V) and Renewal (LoUVI) because "stabilization" of each of these levels is obviously possible. And we propose thatMechanical level be renamed IIIA, the first Routine level as IIIB, then Refinement as IVA,the second Routine level as IVB, Integration as VA, the third Routine level as VB, Renewalas VIA and the fourth Routine level as VIB.
Ruiz-Primo's FOI Framework
Ruiz-Primo (2006) used a multi-method and multi-source strategy to track the enactedand achieved curricula considering four broad curriculum dimensions. The dimensions sherecognized were: theoretical stand, curriculum materials, instructional transactions andoutcomes. Under "theoretical stand" she considered site context, values and beliefs ofteachers and instructional models. In her own study with Foundational Approaches in ScienceTeaching (FAST), she did not find "site context" in any document of FAST. Besides, herconsideration of instructional model under theoretical stand seems not correct since there is adistinct dimension termed "instructional transactions". By "curriculum materials", she meant"content and activities, and their sequence". Thus this dimension actually mixed up twoknown dimensions (contents and pedagogy) together since "activities" are usually notdescribed with contents but pedagogy or instructional processes of a curriculum. Sheconsidered "developing & using scientific knowledge", "providing learning opportunities"and "supporting student learning" under instructional transactions. She elaborated "providinglearning opportunities" so much under "social and physical environment", "strategies"(instructional?) and "instructional activities" that seldom a curriculum prescribes so manythings in such a complex manner; thus, making the measurement of fidelity extremelydifficult. The last dimension "outcomes", she considered at both curriculum and unit level-thefirst one actually refers to the "objectives" of the curriculum and the second one wouldotherwise be termed "learning outcomes" in behavioral terms.
Since Ruiz-Primo (2006) herself observed that the characteristics of each programdetermine what has to be measured during implementation, we would better use the usualcurricular dimensions like philosophy, goals, objectives, contents, pedagogy (instructionalprocesses) that are prescribed in most curricula. We also keep open the provision of lessonplan containing "learning outcomes" in behavioral terms if the curriculum under evaluationactually has prescribed those.
For measuring fidelity, Ruiz-Primo (2006) realized that determining the criticalcomponents of the curriculum was crucial and that should be done first to use any FOIinstrument. Then she decided on the "aspects of FOI" like adherence, exposure (dose), qualityof delivery, responsiveness and differentiation following Dane and Schneider (1998) andDusenbury, Brannigan, Falco and Hansen (2003). However, she did not measure"differentiation" explaining that "curriculum differentiation is not linked to any of thecomponents described" (p. 19). She used a five-point scale: high, medium high, medium,medium low and low to measure the quality of her data collection instruments but the aspectsof FOI were kept ungraded, rough measures. We would better use this five-point scale tograde the quality or quantity of the aspects of FOL
How Much Variation is Acceptable in Adapting a Curriculum? 7
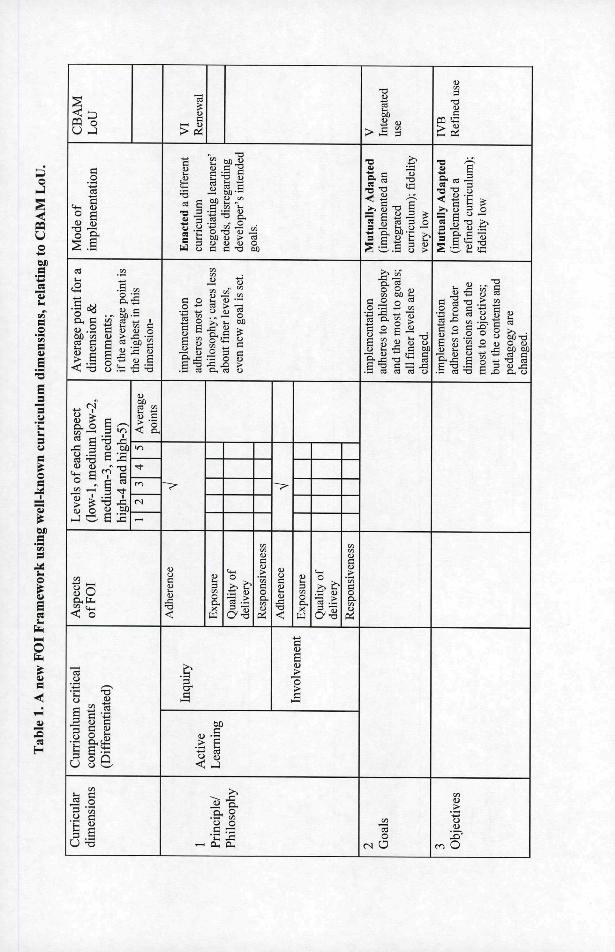
A New Framework Based on Known Curricular Dimensions
The literature reviewed above on fidelity-adaptation-enactment continuum reveals adebate on fidelity-adaptation area of the continuum. Reflecting on this literature, we wouldlike to include also "enactment" in the debate. We can tally the negotiation of specialistcurriculum developers and teacher implementers at various levels of curriculum dimensionsincluding philosophy, goals, objectives, content, pedagogy and lesson plans. Before we thusrelate, we need to measure the EOI of each component under every dimension of thecurriculum. However, first we need to define the dimensions a bit for clarity. Philosophy isthe sum of the main principles based on which a curriculum or program is developed. Goalsare broad objectives, the "intended destinations" (Omstein & Hunkins, 1998) that learnerswould reach. The objectives are "more specific outcomes" (Ornstein & Hunkins, 1998) of acurriculum. Content is the sum of learning activities going through which learners areexpected to meet objectives. Pedagogy is the combination of teaching-learning activities thathelp learning the prescribed content, while lesson plan is a daily plan of content coverage andpedagogy.
Most EOI studies were done in medical science and only a few on education andcurriculum matters. Of those few, Emshoff et al. (1987), Mills and Ragan (2000), Dusenburyet al. (2003), and Mowbray, Holter, Teague and Bybee (2003) are mentionable. However,Dane and Schneider's (1998) study, although not on education but medical science, firstdescribed the five aspects (adherence, exposure, quality of delivery, participantresponsiveness and program differentiation) of EOI and defined those. Later Dusenbury et al.(2003) also tried to provide a clear description of those aspects in their review. They actuallydefined the terms at their convenience adapting from earlier authors. But there is stillambiguity in defining some aspects. Besides, in both Dane and Schneider (1998) andDusenbury et al. (2003), "program differentiation" is listed at the last although other aspectscannot be measured or even considered before deciding on the (differentiated) criticalcomponents of a program.
We rearrange the aspects of measuring fidelity logically first considering programdifferentiation. Then, for clarity, we reinterpret the definitions of all the aspects because formeasuring the aspects of FOI, each of the aspects needs to be clearly deñned first.
Program differentiationDane and Schneider (1998) introduced this term as "a manipulation check" so that
experimental condition receives only "planned interventions". Thus the purpose is clear thatprogram differentiation must mean decision on what constitutes "planned interventions" in aprogram. Dusenbury et al. (2003) defined this aspect as "identifying unique features ofdifferent components or programs so that these components or programs can be reliablydifferentiated from one another". We redefine this simply as the critical components(differentiated) of a whole program or any dimension (principle, goal, objectives, content,pedagogy and lesson plan) thereof and we would consider this for every dimension.
AdherenceAdherence was defined by Dane and Schneider (1998) as "the extent to which specified
program components were delivered as prescribed in program manuals" (p. 45). Dusenbury et
8 Abdus Sattar Molla and Yew-Jin Lee
al. (2003) echoed that just changing words as "the extent to which implementation ofparticular activities and methods is consistent with the way the program is written" (p. 241).Such definitions, in essence, signify the totality of fidelity, i.e., adherence thus defined wouldbe synonymous with fidelity. To avoid this ambiguity, adherence to a differentiatedcomponent is defined here as only "being covered" (or "not covered"). Thus, we would useonly tick (V) mark for adherence while Ruiz-Primo (2006) used this rough measure for all thefour aspects (adherence, dose, quality of delivery and responsiveness) of the tapped criticalcomponents of Foundational Approaches in Science Teaching (FAST) she studied.
We would measure the quality/quantity of enactment of each of the rest three aspects(i.e., exposure, quality of delivery and responsiveness) of every component (where possible)adhered to, i.e., covered during implementation. We cannot measure any of these threeaspects if the (intended) component in question was not covered at all. Lastly thequality/quantity of dose/exposure, delivery and responsiveness is graded using a 5-point scale(low, medium low, medium, medium high and high) giving them 1, 2, 3, 4, and 5 pointsrespectively.
Exposure/doseMost studies that have measured exposure or dose have looked at the amount of the
program covered (e.g., Pentz, Trebow, Hansen, MacKinnon, Dwyer, Johnson et al., 1990).Dusenbury et al. (2003) also defined dose as the amount of program content received byparticipants. However, Allen, Philliber, and Hoggson (1990) collected information about doseby asking participants to report the number of hours of the program received. Dane andSchneider (1998) defined exposure as the number of sessions implemented, and the length ofeach session. Here we follow Dane and Schneider (1998) and define dose/exposure of acomponent as the number of sessions (out of the total) and duration inside the session devotedto this component. However, we compute the total time in each session and number ofsessions together for simplicity and convenience. We count only time (not amount asDusenbury et al., 2003 referred) because we have already considered program componentsmore finely at each dimension including objectives, contents and pedagogy.
Quality of deliveryDane and Schneider (1998) defined this aspect as "a measure of qualitative aspects of
program delivery that are not directly related to the implementation of prescribed content" (p.45). But the attributes (such as implementer enthusiasm, leader preparedness, global estimatesof session effectiveness, and leader attitudes toward program) they referred to neither express"delivery" nor are measurable. Dusenbury et al. (2003) defined quality of delivery as "theextent to which a provider approaches a theoretical ideal in terms of delivering programcontent" (p. 244). We find this definition also, unfortunately, overlapping with dose that hasalso been defined as the amount of program content. Quality of delivery should consider how(quality) the program content was delivered, not how much (quantity) of it because that wasmeasured under dose. That is why we had to look into volumes of literature on the matter todecide on what should the term "quality of delivery" mean and how we could measure thisreasonably.
"Quality of delivery" actually refers to "quality of teaching". Shulman (1999) spoke ofmanagement, presentations, interactions, group work, discipline, humor, questioning andother aspects of active teaching, discovery or inquiry instructions, and other observable forms
How Much Variation is Acceptable in Adapting a Curriculum? 9
of classroom teaching. But these all are common pedagogies. However, for quality teaching,Johann F. Herbart (cited in Pollock, 2007) prescribed a five-step instructional process thatincluded -1) Preparation (basing on prior knowledge), 2) Presentation (teacher presents newinformation to students), 3) Association (deliberate association with prior knowledge), 4)Systematization (teacher gives examples of generalizations) and 5) Application (Student trynew materials or new ideas to demonstrate their mastery). Later a number of authors (e.g..Gagne, 1965; Pollock, 2007) developed sets of common steps or events for good teaching. Itis found that Herbart's "preparation" is common in all having only change of words like"stimulate recall of previous learning" (Gagne, 1965), "review" (Rosenshine, 1997; cited inPollock, 2007) and "access prior knowledge" (Pollock, 2007) all of which mean relatinglearners' prior knowledge. Gagne (1965) also emphasized on "informing learner of the lessonobjectives" that was included also in Pollock's (2007) points; similarly "providing feedback"pointed by Gagne (1965) was stated by Rosenshine (1997) as "correction and feedback" andby Pollock (2007) as "floating step: feedback, feedback, feedback".
Samuelwicz and Bain (2001) studied academics' belief on teaching and identified"teaching-centered" and "learning-centered" pedagogies. They considered impartinginformation, transmitting structured knowledge and facilitating understanding under the first,and helping students develop expertise, preventing misunderstanding, negotiating meaningand encouraging knowledge creation under the second category. The same authors recognized"facilitating understanding" and "helping students develop expertise" under an intermediatecategory in 1992.
Stevenson and Stigler (1992) spoke of coherence, concrete representations (e.g., mathset), using errors effectively, giving time to think (as given in Japan), and handling diversity.
The purpose of teaching is no doubt students' learning and achieving objectives. That is,quality of teaching or quality of teacher's delivery means effective teaching aiming atstudents' achievement. Brophy and Good (1986) showed that teacher behavior in the class iscorrelated with students' achievement. They described from many earlier authors whatshould/could a teacher do in the class for better teaching to result in students' better learning.Referring to Canterbury study of 1970s, they spoke of starting lesson with reviews of theprevious lesson, teacher-pupil talk time, asking questions, teacher structuring comments andthe percentage of that immediately after questioning, praising or thanking students for theirresponses and concluding session with reviews. They especially appreciated Flanders' (1970;cited in Brophy & Good, 1986) study where Flanders and his associates identified "direct"and "indirect" teaching. Under indirect teaching, they included instructional processes likeaccepting feeling, praising or encouraging, and using pupil ideas. Under direct teaching, theyconsidered giving directions, criticizing or justifying authority. In between these two, theyspoke of asking questions and lectures. Flanders measured percentages of each of thesestrategies out of the total time spent. Appreciating these categories, Brophy and Good (1986)held that lower level of indirectness (and thus higher level of directness) could be associatedwith more factual or skill learning tasks, while the opposite could be good for tasks involvingabstract reasoning or creativity.
Quality teaching must also create opportunity to learn (OTL) for students. Wang (1998)while dwelling on "instructional quality" under OTL, spoke of teacher preparation,integration of concepts, material adequacy, equipment use and availability of textbook asmajor points. Quality of delivery is more concerned with how a teacher delivers the lesson,not on how much s/he was prepared having a written lesson plan (as he measured) or
10 Abdus Sattar Molla and Yew-Jin Lee
availability of textbook. So we can consider the other three points including integration ofconcepts, material adequacy, and equipment use. For integration of concepts, he citedexample of measuring content as "Ohm's Law was taught=l; Ohm's Law was not taught=O"(p. 143). We considered such coverage of content as adherence to a component; so need notbe repeated here. He measured "material adequacy" by concepts, format, depth, andobjectives of materials matched in textbooks. Thus this also refers mainly to contentcoverage. For "equipment use", Wang (1998) measured students' familiarity with theequipment used in the test, with "0" representing not familiar with any equipment and " 1 "representing familiar with all types of those. This point we can consider in case of "laboratoryinvestigation" only.
We realize that quality of delivery cannot be measured for all the dimensions of acurriculum because this aspect of FOI is associated with mainly the pedagogy dimension.Philosophy, goals or objectives are not "deliverable", instead only reachable through thedelivery of contents via pedagogy. Therefore quality of delivery can be measured for aprogram as a whole or at best for the components of contents and pedagogy dimensionsseparately that we are including.
We realize also that quality of delivery has many aspects and considering all of them inmeasuring FOI would prove impossible. We consider accessing learners' prior knowledgeand declaring objectives of the lesson very common and essential aspects of delivery. Askingquestion was referred by many authors (e.g., Stevenson & Stigler, 1992) and also welcomingquestions from leamers constitute "encouraging" leaming. Thus we consider both teacherquestioning and welcoming questions from students as important aspects to measure qualityof delivery. In question-answer sessions, students' responses in both answering the teacher'squestions and asking questions need to be praised for reinforcement. For "handling diversity"(Stevenson & Stigler, 1992), "using pupils' ideas" (Brophy & Good, 1986) in teaching needsto be taken into account.
Participant (leamers) responsivenessDane and Schneider (1998) defined this aspect as "a measure of participant response to
program sessions, which may include indicators such as levels of participation andenthusiasm" (p. 45). Later Dusenbury et al., (2003) defined participant responsiveness\ as"the extent to which participants are engaged by and involved in the activities and content ofthe program" (p. 244). The latter definition, though clearer, is partial because it considers onlythe "participation" aspect, not the "enthusiasm", nor does this consider participants' "reactionto a program" that Barry, Domitrovich and Lara (2005) referred to. That is why we considerboth the students' engagement in the curriculum component in question and also their likingor disliking (i.e., reaction) that.
After computing the FOI points for components of curricular dimensions, we would tallythe results against both fidelity-adaptation-enactment continuum and CBAM LoU. Weassume that when the process of implementation adheres most to the finest two levels (i.e.,pedagogy and lesson plan) of the intended curriculum, fidelity is at the most faithful level.Good adherence to the content dimension can also constitute fairly faithful level of fidelity.When the negotiation of implementers is in the middle level, i.e., objectives and goals, boththe developers and the implementers would happily exchange views, compromising on theiroriginal positions and there is good mutuality in the development-implementation process.
T3B
s 3I
> o
1° eo &
T3ca Ë
•a .2
S2 oû4i
IIIoo H .i"
•a
a.
_tu 2t II
3 1>
3u
ÎI- i a S . è+^ CL C '—'
P- ^S
aDûa
g f S '.S C u u
C O ^ 1> "- 'o -^ ca > .—.in . ^ cj u ca•tí c/3 -ii o u
ojj (« Q> .> jz:g C g « ,ojU U o
« 'S)'!> ^
< TO ," « .scj íti 'S -o
B-.H
2 °c ca
^ • — , - a ^ cag T3 c = J3.s ca 03 ca o
o -a .í £3
Ö o o 3
: S 3 o j3Î Ë XI a cj
„ fN
1) ? eO. o cO5 —^ _ 33 <u [S)
2Í rrTTS
ca
cao
IIIIIIü sa
iI
(u .a
>
II cao(N O
Ia
o
ge1
u .ase enca 112
Ï3 S §" SP C
8 O
< o
•g -S -a u« ta § ~
"5.^ •« 'S
il
c/1 O O fc-
.§ g^i3•a c CL Ci
oO
g 2
-? u u tsK !:: — M
iT3
(Ue
ca „2 güîi c" -i tí
: o
O
D.
How Much Variation is Acceptable in Adapting a Curriculum? 13
However, when the implementers do not bother to follow or negotiate even the goals of acurriculum, they are crossing the limit of mutuality and proceeding towards enacting a newcurriculum where fidelity would be unacceptably low.
METHODOLOGY
To meet the objectives of our research, both qualitative and quantitative methods wereused. The qualitative methods such as document analysis, classroom observation, video-recording of classes, and interviewing were the dominant ones during data collection.However, data analysis and measuring the various aspects of FOI were mostly quantitative.
The documents analyzed were the curriculum documents, specific syllabuses for thegrades and modules, some sample lesson plans, students' portfolios and their written reporton investigations done in groups. The school produced a sampler booklet on the first plannedmodules in 2006. This contains the contents of Life Science module implementation of whichwere described in this chapter. Later the Ministry of Fducation (MOE, 2007) prepared a bookon a new curricular framework termed PETALs (Pedagogy, Experience of learning, Tone ofenvironment. Assessment and Learning content). This framework described the program-Science ALIVE briefly, especially its planned instructional processes. Therefore, we regardparts of this as curriculum document of Science ALIVE. In 2006 and 2007, each modulestudent gathered all their learning activities in a folder along with their reflections- theteachers named this "portfolio". Every year since 2006, each of the student groups prepared awritten report containing the problem of investigation, hypotheses, experimental design,results and conclusion. Thus these reports constituted a good evidence of students'investigative work.
In 2008, there were 32 lessons in total during the 10 weeks time of running the LifeScience module. We video-recorded all the classes held under this module. For recording,usually we stationed two video cameras at two sides of the classroom from the front to coveractivities of all the students. Sometimes a camera also recorded the teacher's works; butusually the teachers felt shy of being the focus of video-recording. We used also one or twoaudio-recorders close to students to capture their talks. We watched the videos later,transcribed important parts to analyze the contents covered, pedagogy used and students'participation.
We interviewed all the program developer-teachers, and the teacher who taught themodule in 2008. We interviewed also a number of student groups. All these interviews wereaudio-recorded and later transcribed.
Through document analysis and interview with program developers, we decided on thecritical components of the program under each curriculum dimension. We coded theclassroom data, and information gathered from teachers' and students' interview to gradethose in the 5-point scale to measure the quantity and quality of the three aspects (exposure,quality of delivery and responsiveness) of FOI to decide on the level(s) of fidelity. Here wedescribe how we coded these three aspects of the components under various dimensions.
14 Abdus Sattar Molla and Yew-Jin Lee
Dose/Exposure
Beginning with the micro/finest dimension (here pedagogy, because there was no lessonplan for every lesson in implementing the program we studied), we proceed upward tomeasure the components of as many dimensions as possible.
Pedagogy dimensionFour types of pedagogy were intended in the program: "direct instruction", "group
discussion", "field trip" and "laboratory investigation". Although all the four instructionalstrategies are well-known, "direct instruction" can be interpreted at least in two ways. Inbroader sense, direct instruction (usually written in small letters and is abbreviated as d.i.) cancontain lecture, seatwork, teacher-led class discussion and a range of such processes (Ellis,2005) that are opposite to student-centered learning. On the other hand, when narrowlydefined. Direct Instruction (written in capitals and abbreviated as D.I.) means a specificinstructional approach consisting of instruction techniques and sequences that set standardsby documenting what students can achieve (Adams & Engelmann, 1996). We take thebroader sense of direct instruction for this study. The field trip component was not "adhered"to; so we cannot measure this, though we can register 0 (zero) as its average point for all thethree aspects: dose, quality of delivery and responsiveness.
We assume that ideally time should be distributed equally among the three instructionalstrategies. We do not count field trip because it was executed the previous year by the moduledeveloper teacher and was outside the in-school instruction time. If the new teacher couldexecute this, she would also use out of school time for field trip. That is, each instructionalstrategy out of the three should ideally have just one-third (33%) of the total instruction time.We divide this 33% roughly into five levels.
Thus we code the five levels (low=l, medium low=2, medium=3, medium high=4 andhigh=5) for each of direct instruction (DI), group discussion (GD) and laboratoryinvestigation (LI) as:
Time spent in DI/GD/LI was about 7% of the total =1,Time spent in DI/GD/LI was about 13% of the total =2,Time spent in DI/GD/LI was about 20% of the total =3,Time spent in DI/GD/LI was about 26% of the total =4 andTime spent in DI/GD/LI was about 33% (or more) of the total -5
Content dimensionThis dimension consists of two areas: "Contents for life science concepts" and "Contents
for process skills". Under Contents for life science concepts area, three components wereidentified in the curriculum. These are "Cell structure and function", "Mendelian Geneticsand DNA" and "Microbes and biotechnology". There are no set criteria to measure how muchtime should be devoted to which component of the life science content. We assume that thethree components are of equal length and each one deserves just one-third (33%) of the totaltime spent for the total of these contents. Thus the coding for each of the three components isas above since the expected ratio is the same.
Content for process skills area has four components to meet the four process skills. Theseare "Male pregnancy" and "Sore eyes" (for information research). Bloom's revised taxonomy
How Much Variation is Acceptable in Adapting a Curriculum? 15
(for questioning), rearing or killing bacteria (for lab investigation) and a step-wise template(for report writing). Here also there were no set criteria of how much time should be spent forwhich component. We assume that lab investigation would require double time than any ofthe other three components. Thus investigation with bacteria would require 40% of the totaltime spent in covering contents for all process skills, while each of the other three wouldideally cover 20% of total time.
Thus the coding for each of the three smaller components, viz,, information research (IR),questioning skill (QR) and writing report (WR) would be as follows:
About 4% of the total time spent in IR/QSAVR =1About 8% of the total time spent in IR/QSAVR =2About 12% of the total time spent in IR/QSAVR =3About 16% of the total time spent in IR/QSAVR =4About 20% of the total time spent in IR/QS/WR =5
The coding for investigation would be as below:
About 8% of the total time spent in investigation =1About 16% of the total time spent in investigation =2About 24% of the total time spent in investigation =3About 32% of the total time spent in investigation =4About 40% of the total time spent in investigation =5
Objectives dimensionThere are two broad areas under this dimension. These are understanding science
concepts and developing science process skills. There are two components under the firstarea, viz., concepts related to basic life science and concepts related to process skills. Weassume again that the two components are of equal weight. Thus the coding is as follows:
Concepts related to basic life science occupied about -10% of the total time spent in science concept=l20% of the total time spent in science concept=230% of the total time spent in science concept=340% of the total time spent in science concept=450% of the total time spent in science concept=5
The coding for concepts related to process skills would be the same.
There are four well-defined process skills under the second area, i.e., developing scienceprocess skills. These are information research, questioning skill, planning and doinginvestigation and writing report. Here we give double weightage to investigation because thisis the most important skill to be developed and this has actually two subcomponent-planningand doing. Thus we assume that ideally 20% of the total time spent for the four process skillswould be devoted to each of information research (IR), questioning skill (QS) and writingreport (WR), while the allocation for investigation should be 40%. So coding for each of theearlier three skills would be same as in content and as follows:
About 4% of the total time spent for all process skills was devoted to IR/QS/WR=1
16 Abdus Sattar Molla and Yew-Jin Lee
About 8% of the total time spent for all process skills was devoted to IR/QSAVR=:2About 12% of the total time spent for all process skills was devoted to IR/QSAVR=3About 16% of the total time spent for all process skills was devoted to IR/QSAVR=4About 20% of the total time spent for all process skills was devoted to IR/QSAVR=5
The coding for investigation would also be the same as in content, i.e., as follows:
About 8% of the total time spent for all process skills was spent in investigation =1About 16% of the total time spent for all process skills was spent in investigation =2About 24% of the total time spent for all process skills was spent in investigation =3About 32% of the total time spent for all process skills was spent in investigation =4About 40% of the total time spent for all process skills was spent in investigation =5
Goals dimensionThis dimension has two components: understanding science concepts (USC) and
developing science process skills (DSPS). We assume that the two components are equallyimportant and thus each deserves 50% of the total time. Thus coding for any one of themwould be as follows:
About 10% of the total instruction time was spent for USC/DSPS=1About 20% of the total instruction time was spent for USC/DSPS=2About 30% of the total instruction time was spent for USC/DSPS=3About 40% of the total instruction time was spent for USC/DSPS=4About 50% or more of the total instruction time was spent for USC/DSPS=5
Principles/Philosophy dimensionThe main principle/philosophy of Science ALIVE has been "Active learning" but it is not
measurable. However, there are three components under this dimension: inquiry, involvementand exploration. Again the meaning of inquiry and exploration are very similar. We assumethat the developers of this program had in mind to use a meaningful name that was ALIVE.They dragged in some words to reach this meaningful name. We see they reasonably coinedA, L and I from the first letter of Active, Learning and Inquiry; but to get "V" they capitalizeda middle letter V of InVolvement. Same way they used Exploration just to have its initialletter E to complete "ALIVE" and may be also to reinforce inquiry with a word of similarmeaning. Thus we would measure inquiry and involvement and keep exploration ornamental.
The actual inquiry practiced in this module (and the program as a whole) is in planningand doing investigation. So we use the exposure/dose counts found under pedagogy here.That is, no different coding is required. However, we would measure quality of delivery ofinquiry in proper place that is different from measuring quality in other dimensions.
The other component is involvement, meaning students' involvement. We can defineinvolvement as students' participation in talk (questioning and answering), individual worklike writing/filling-in worksheets, group discussion, and doing investigation. We do not countonly listening to teacher's instructions as involvement. Thus we can calculate total time spentin students' talk, individual work, group work, and investigation; then we compute that aspercentage against the total lesson time. There is an ambiguity here because we do notconsider only listening as "involvement". Thus, we can code the level of involvement asfollows:
How Much Variation is Acceptable in Adapting a Curriculum? 17
Students were involved in about 20% of the lesson time =1Students were involved in about 40% of the lesson time =2 -Students were involved in about 60% of the lesson time =3Students were involved in about 80% of the lesson time =4Students were involved in about 100% of the lesson time =5
Quality of Delivery
We measure accessing learners' prior knowledge and declaring objectives of the lesson ascommon for all the three instructional processes in this program. Ideally every lesson shouldbegin with accessing learners' prior knowledge and declaration of lesson objectives. Weassume also that ideally the teacher would ask for students' questioning in every lessonsaying like "do you have any questions?" or "any questions". Practically, the teacher of LifeScience module in 2008 frequently said "Any question so far?" The fourth aspect we considerto measure quality of delivery is appreciation of students' responses-both as answers andquestions.
We could measure also welcoming and considering learners' ideas as Stevenson andStigler (1992) suggested; but we found that the Grade-8 students could not contributeanything significant during the implementation of this module.
For laboratory investigation, familiarity of students' with the equipments could bemeasured but we did not ask such questions to students during lab investigations. Onlyobserving videos and deciding on how many students are familiar with how many requiredequipment would render difficult.
However, coding for the five levels in the four aspects decided to measure can be asfollows:
Learners' prior knowledge was accessed in about-20% of total lessons=l40% of total lessons=260% of total lessons=380% of total lessons=4100%ofthelessons=5
In the same way objectives of the lesson was declared in about-20% of total lessons=l40% of total lessons=260% of total lessons=380% of total lessons=4100%ofthelessons=5
Questions were welcomed in about -20% of the lessons = 140% of the lessons = 260% of the lessons = 380% of the lessons = 4100% of the lessons = 5
18 Abdus Sattar Molla and Yew-Jin Lee
For appreciating students' responses, we measured the percentage of students' responsesmeaning both answers and questions asked that were appreciated. We assume that ideally allthe responses must be appreciated. Thus the coding can be as follows:
Around 20% of the responses were appreciated =1Around 40% of the responses were appreciated =2Around 60% of the responses were appreciated =3Around 80% of the responses were appreciated =4Around 100% of the responses were appreciated =5
For computing the quality of delivery levels, we took average of the four measuresdescribed above.
Apart from the above measures of quality of delivery, we considered quality of inquiryunder philosophy dimension in a different way since this is a different attribute.
We measured inquiry using NRC's (2000) five essential features table (see Appendix A).In the table, there are four levels for each of the five essential features. That is, there are 5x4(=20) slots in the table. Knowing the relative role of students and teacher duringinvestigation, we would rank the students' investigation.
The maximum count for inquiry can be 20 since the maximum for each essential feature(EF) can be 4. Thus total 20 is 100%. The minimum count for any feature can be 1 and thetotal can be 5 for five features. If we calculate percentage of 5 to 20, it would be 25%. We cantake this roughly as 20%. Although this seems to be a manipulated percentage, the actualvalue would roughly be 40%, 60%, or 80% of the highest possible 20 (100%). Let us assume,students' level of questioning (EF-1) is 2, of using data (EF-2) is 3, of explaining (EF-3) is 2,of connecting (EF-4) 2 and of communication (EF-5) 2. The total would be 11, i.e., 55% of 20and very near to 60%. Later we would compute the dose (here level, not time as in all othercomponents) as follows:
Level of inquiry is around 20% of 20 = 1Level of inquiry is around 40% of 20 = 2Level of inquiry is around 60% of 20 = 3Level of inquiry is around 80% of 20 = 4Level of inquiry is around 100% of 20 = 5
Participant (Learners) Responsiveness
As described under "Conceptual framework", we consider both participation and reactionaspects of the participant students. For participation, we measured students' talk time(questioning in response to teacher's instruction and answering as response to the teacher'squestion). For the reaction aspect, we considered their views (from interview) on differentcurriculum components. The first one was measured only for pedagogy, the second one formost dimensions.
Student talk time can vary with different pedagogies. The talk time should be maximumor even total during group discussion. Thus during group discussion, student talk time can becoded as follows:
How Much Variation is Acceptable in Adapting a Curriculum? 19
Students were talking around 20% of group discussion time = 1Students were talking around 40% of group discussion time = 2Students were talking around 60% of group discussion time = 3Students were talking around 80% of group discussion time - 4Students were talking around 100% of group discussion time = 5
During investigation: We assume, students would work and talk, and Vi of the timetalking would be ideal as response to both teacher and group members.
Thus coding for responsiveness would be as follows:
Students were talking around 10% of investigation time = 1Students were talking around 20% of investigation time = 2Students were talking around 30% of investigation time = 3Students were talking around 40% of investigation time = 4 •Students were talking around 50% of investigation time = 5
During direct instruction, we assume the ideal student talk time as one-third (33%) oftotal time giving maximum point (5). More than 33% would also receive 5 points. Thencoding for responsiveness would be as follows:
Students were talking around 7% of investigation time = 1Students were talking around 13% of investigation time = 2Students were talking around 20% of investigation time = 3Students were talking around 26% of investigation time = 4Students were talking around 33% of investigation time = 5
For participant students' views, we assume that liking/disliking of two-third (or more) ofstudents is as good as of all. Thus the views on specific components under any dimension(where possible) were coded as follows:
At least 2/3' '' of students interviewed do not like the component =1About Vi of students interviewed do not like the component =2At least 2/3"* students interviewed like some amendments =3About V2 of the students interviewed like some amendments -AAt least 2/3' '* of the students interviewed like the component =5
RESULTS
In describing results, we first consider the quantitative measures in measuring FOI sincewe need to show how our new framework works. Later we include a qualitative descriptionbecause only quantity might reveal rather an artificial and narrow picture.
A. Quantitative Results iu FOI Tables
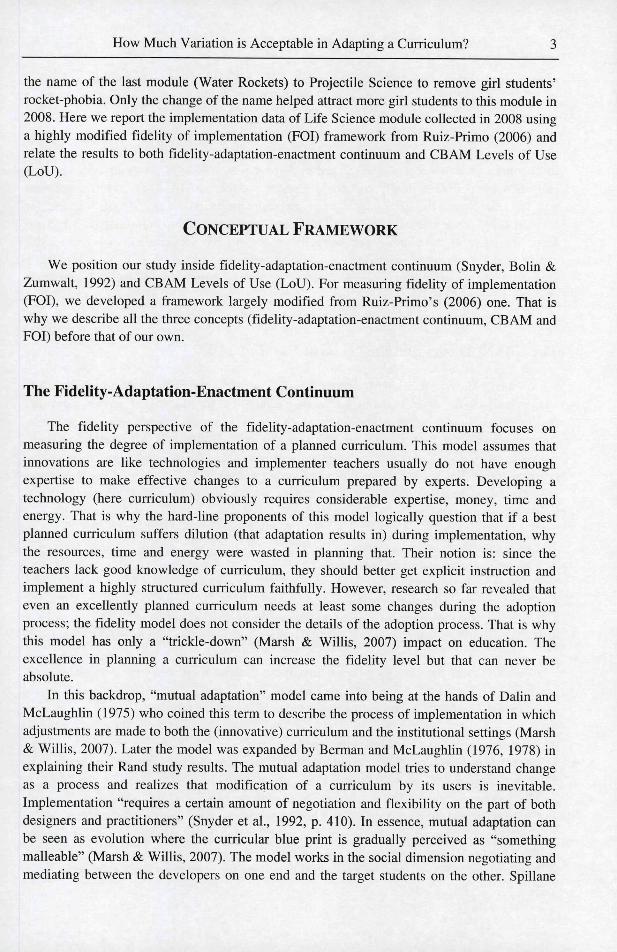
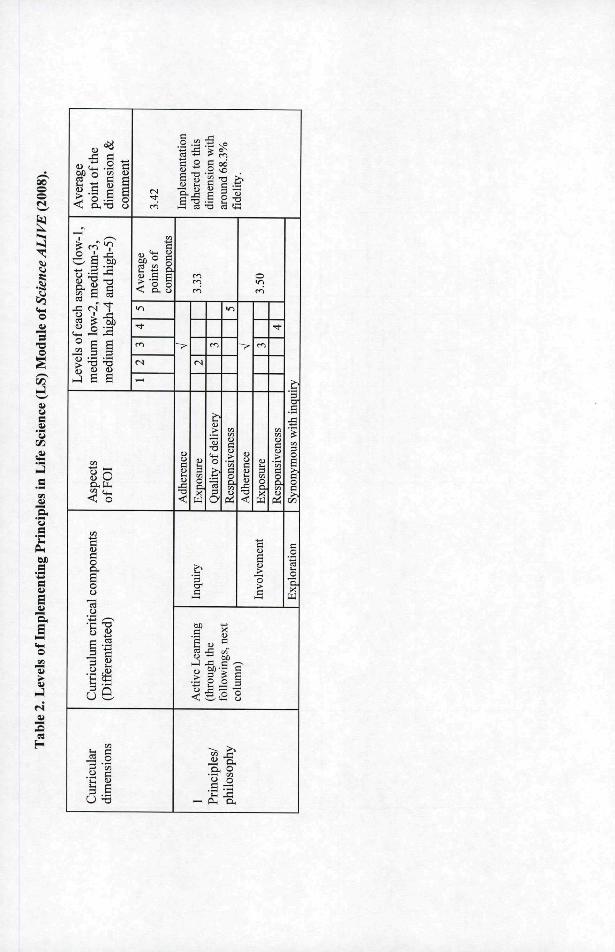
We begin with "Philosophy" dimension and it has two measurable components: inquiryand involvement. We measured exposure of both (since implementation adhered to both)
20 Abdus Sattar Molla and Yew-Jin Lee
using the methods described under Methodology. Exposure of inquiry is similar as oflaboratory investigation done under pedagogy; but that of involvement was measuredseparately as described before.
Quality of delivery of inquiry was measured using the NRC's (2000) five essentialfeatures table (Appendix A) as described under Methodology. There is no scope here todescribe how we decided on the levels of inquiry. However, we can just briefly mention thatwe considered all the five essential features (EF), viz, question, data, explanation, connectionand communication and decided on one of the four levels under each EF as the teacher andstudents executed inquiry.
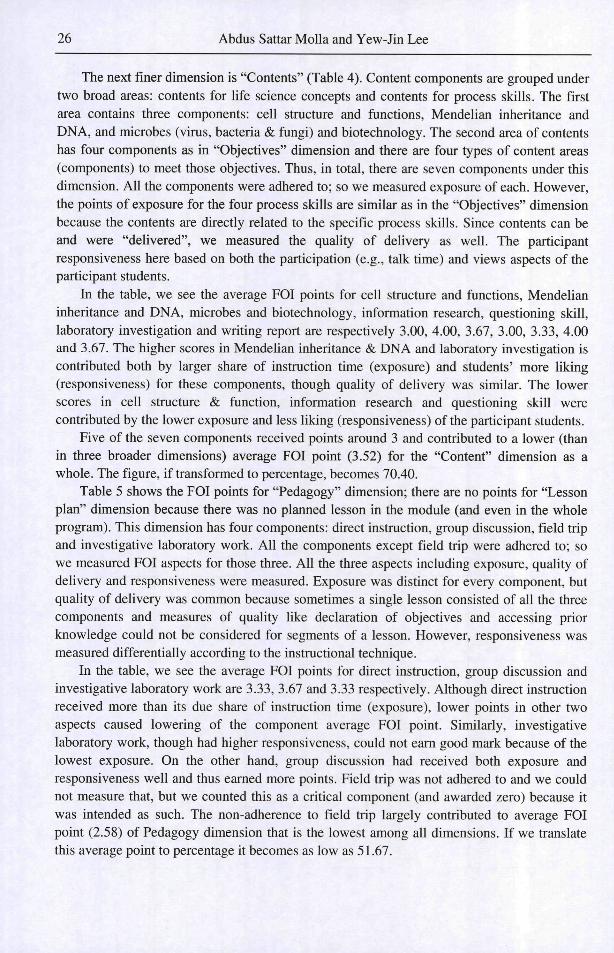
Involvement cannot be delivered, so we could not measure this. The average point of FOIfor inquiry component is 3.33 out of 5 and that of involvement is 3.50. Thus the average forthe dimension (philosophy) is about 3.42. If we translate to percentage (for fineness), thefigure becomes 68.3%. We are to see how this figure is in relation to that of other dimensionslater in the comprehensive table (Table 6).
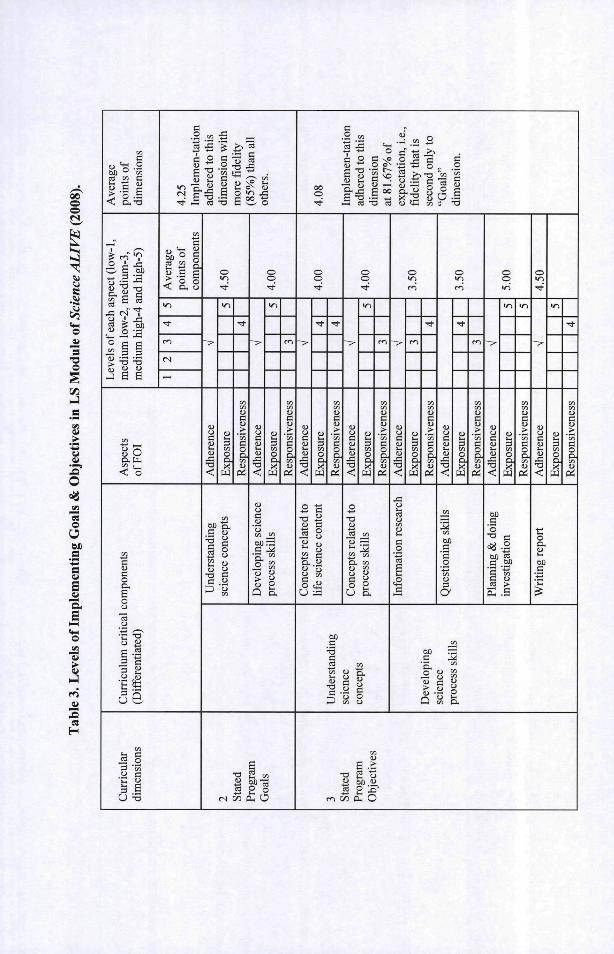
Now we turn to "Goals" dimension (Table 3). This dimension has two components:understanding science concepts and developing science process skills. Both the componentswere adhered to; so we measured both exposure of the components and participant students'responsiveness. However, the responsiveness here consists only of views because these arenot contents or pedagogy that students could participate in. Besides components of Goals arenot deliverable and thus we could not measure quality of delivery.
The exposure of each component was almost equal that was expected and thus eachreceived the highest point 5. Students' responsiveness to various content areas that constitutethe first component differed. The same way, reaction to the four process skills that constitutethe second component also differed. So using the codes we referred before, we found 4 pointsfor the first and 3 points for the second component. Thus the average point of understandingscience concept is 4.5 and that of developing process skills is 4. The average point of thedimension, thus, becomes 4.25 that refers to 85% fidelity, if calculated that way.
The "Objectives" dimension is shown in the same table (Table 3). Here the specificcomponents are: concepts related to life science content, concepts related to process skills,information research, questioning skill, planning and doing investigation, and writing report.All the components were adhered to and we measured exposure of each of them. Sinceobjectives are not deliverable, we could not measure this aspect of FOI. The responsivenessalso is based only on the students' views (liking/disliking) on the components.
The average points of the six components are: 4.00, 4.00, 3.50, 3.50, 5.00 and 4.50.Planning and doing investigation received just about its expected two-fifth share ofinstruction time and also all the students interviewed liked this component (responsiveness)the most. That is why this component scored the highest possible point (5), while each ofinformation research and question skill received less than its one-fifth share of instructiontime (exposure) and the students' liking for these skills also was somewhat less than for otherskills. So the scores of these went down. However, the average point of this dimension is4.08. If we transfer this to percentage, we find 81.67. This figure is slightly below that ofGoal dimension, but we need to find the averages of all dimensions for comparison.
Ave
rage
1
aspe
ct
j H
f ea
c
oenD
<U
poin
t of
the
dim
ensi
on &
com
men
t
Fi
med
iulo
w-
pT t0)
e
-a
and
hi
t
hig
h
tí
•o
s
.spe
cts
fFO
Ico
mpo
nent
s
U
O
tí
' 1
3o
U
lar
i'H
g
o
¿H
ffei
a
0
c;SB
• 0
u00
Avé
ra
(N
3.42
poin
ts
C
com
p(Im
plem
enta
tion
dher
ence
adhe
red
to t
his
3.33
<N
xpos
ure
W
Inqu
iry
C
fiCd
>
Act
dim
ensi
on w
ith
arou
nd 6
8.3%
fide
lity.
rn
ualit
y of
del
l
a
espo
nsiv
ene;
^
dher
ence
u ^
•^ 60X3 c ' - -00-Ç g3 ^ 1
(thr
folle
colu
ii a.a, 0
.—( en
C °
3.50
m
xpos
ure
W
Invo
lvem
ent
espo
nsiv
ene;
b3
• -
>
/non
ymou
s \
co
Exp
lora
tion
ao
§5
Io
1/Ï
h-l
.s
SI
H
en
c
Ave
rage
poin
ts o
ldi
men
sic
o È M
aspe
em
edan
d
eae
ow-
îigh
lsof
um 1
um \
^ ÍD u
J e e
< o
B
tical
com
pone
n)
Ö «
culu
mer
entia
rri
iff
lar
ions
rieu ens
3 BU '-B
co
n-ta
t en
toth
4.25
Impl
eme
adhe
red
e
> 'S o< a. 8«-1
—
-^
née
<uo
'^
tand
ing
Und
ers
ca
dim
ensi
cm
ore
fid
(85%
) th
othe
rs.
o
tu
3
DO
S
W
en
conc
epsc
ienc
e
(N
en
sive
ne
c
spo
flj
•a
ta
oo
ncc
here
• u
"A l
3
pos
y
w
;nee
)ing
sei
skil
lsD
evel
o]pr
oees
s
S en
o" i^ Ô; Ü
en
sive
ne
c
spo
(U
ncc
here
•a
oT)
ts r
elat
eC
once
p4.
08
oo•n-
Ü
3
pos
w
tent
nee
eon
life
seie
en
sive
ne
c
spo
c
rsta
ndi
• a
c2 en
n-ta
tto
thn /„
nf
Impl
eme
adhe
red
dim
ensi
cat
81
67"
oo'^
-^nc
che
r
•a"^
w-i
23
pos
tu
en
sive
ne
c
spo
.2-o
ts r
elat
esk
ills
Con
cep
proc
ess
« 1C o<D cÖ Oen o
£3 >
•a g 'o
-n ca O s>/5£ o
ü
on, i
'Sr-
expe
ctat
ifi
delit
y t
nee
her
•o'^
earc
tion
res
Info
rma
O»nm
23
O
n><'p-l
o
"c
seco
nd o
en
sive
necoo.
ai
lopi
ng
>
"Goa
ls"
née
her
Ils
ning
sk
Que
stio
ri
g
B
o
23
O
nW
en
ce ss s
kil
S <IOS
m
en
sive
ne
o
nce
g j
her
O
•a
Plan
nin
8
»ri
23en
Sw
atio
nin
vest
ig
enen
sive
ne
coo.
c¿
o
née
her
-a
repo
rtW
riti
ng
t n
23en
8x'
BJ
en
sive
ne
oo.
Ave
rage
poin
ts o
f th
edi
men
sion
_O ' .tí
ispe
ct 1
med
iui
and
hij
J= <N 'T
eac
ow-
lish
edil
edil
J E E
i5 -Í2 R.
Ave
poin
com
—
Asp
eeof
FO
Ion
ents
lcom
pn
cri
îate
d
5 'S
rric ffe
5at o
o
S
zo
nce
Adh
ere
ruct
ure
Cel
ls3.
00
t N
U
Exp
osu
ñine
tir
life
ten
Cor
-a-
m
of d
eliv
eQ
ualit
yce
pts
Nu
nce
scie
•a
Pre
scri
bí
sive
ness
Res
pon
Prog
ram
nce
Adh
ere
J
1
Con
tent
s4.
00
K
Exp
osu
n
ance
an
inhe
ri
t N
of d
eliv
esi
vene
ssR
espo
n nce
Adh
ere
Ks
and
Mic
ro
Impl
emen
tatio
n3.
67E
xpos
uhn
olog
ybi
otee
of d
eliv
eQ
ualit
y
dim
ensi
on a
tsi
vene
ssR
espo
n70
.40%
of
ice
Adh
ere
>^o
preg
n ar
"Mal
eex
pect
atio
n, i
.e.,
ñdel
ity.
3.00
t ^
! "
Exp
osu
n
e ey
es"
&"S
or
<S
ten
Con
of d
eliv
eQ
uali
tyin
to re
soa.
sive
ness
Res
pon
lice
Adh
ere
Blo
on'
3.33
Exp
osu
>-,h
1
3SIA
3J
!> •
of d
eliv
eQ
ualit
y
OÛ
estio
nir
lb joi)
sive
ness
coQ.
331
Adh
ere
0£)
g or
kill
Rea
rin
4.00
1 1 1
Exp
osu
a (f
orba
cter
t N
of d
eliv
e
i n
SS3U3A
IS
Res
pon
tory
gatio
n)la
bora
inve
sti
ice
Adh
erei
ate
-wis
e te
A s
tep
3.67
" '
1X
PJ
OJJ
%
i
(for
re
of d
eliv
eQ
ualit
y>i
vene
ss
coC l
•oo
'SI'S.5O
"3
vi
Ave
rage
poin
ts o
fdi
men
sion
w S 00
aspe
ctm
ediv
and
h
J= oí'î
s of
eac
am l
ow-
Lim
high
> -3 -3^ B B
Vi
pect
FO
I
<! o
Vi
•suoCL
com
ica
II
rric
iffe
aa
V3
M. §.§•§3 BU T3
B
Ave
rpo
int
com
p
rs
—
oc!
here
•o•<
irec
t
Q
3.33
u3tnO
n.XW
Bo
stru
ct!
a
'Squos
re
OH
tí
Impl
emen
tatio
adhe
red
to th
is
m
del
tt-io
ality
3
1S
(N
t n
U
a
siv
spon
ro
G.
dim
ensi
ons
_ ,
Ö
here
•u<C
roup
Ü
at 5
1.67
% o
f3.
6750
SU
W
ao
SC
US
SI
•o
expe
ctat
ion
m
very
del
<uo
ality
3
en
AÏS
Spon
Xhe
re
-o-<¡
t/D
n.
eld
tri
b
)tbe
U
u3tn
8Xw
0.00
red
me
very
del
o
ality
3
a
en
c
AÏS
Spon
(U
_ ^
o
here
vest
ig
B
3.33
U
3t/î
8Xw
bora
to
JS
m
very
del
O
ality
3
o
t n
sne
AÏSuods
tuN
ot
mea
sure
dbe
d
ttnBC8
BSS
O
uoB
ere
lere
w
H
son
1
^ HJ CL
I§
— o
.aua -S'u a
a
1aE
cul
•s
lan
o.ao
«MO
Ive
esH
1 C
B.
• t3
nmen
ts1
Cor
„^
2>
1 A
spec
t
1^o
U
ë
irri
culi
U
llar
o
u
C
.2.^
lem
e
O
(poi
nts)
of F
OI
e/î
S
mpo
ne
ou
ions
crt
dim
i
no CO
eo
impl
emof
dim
etia
teif
fere
n!
w
lum
icu
C
ffer
erA
di
o
here
d
a
ion
lem
enta
tIm
p>
nce
•m
ij
nact
'oE
was
It n
ot
tre
ll
O
phil
Rem
en
J-
ïver
af
(D
imum
.
Ë
3.42
-
en
C
S•s
noti
; ^
'3
Pri
nîn
sior
5
phy
oso
1 Ph
il
o
here
d
•a
ion
¡le
men
tat
Imp
>
•gD .
Ada
uall
yM
utm
ost,
(U
E
this
4.25
(N
en3
•a
1E
ccd
•a'S
)lem
ei(i
mp
o
wer
e r
en
goa
ning
the
mea
Goa
im);
3o
cur
2tuuE
'S
1J3
2
•S
atZ)
>
fidel
"enO
1 th
ei
IVB
:ed
-§
uall
yM
uto •§)
here
d1t
hroL
g c
lem
enta
t;di
men
sic
4.08
en
tive
•Si,
Om
en3
•S
Ref
iIn
edy
low
^ —CO 1 3
•a ''
ilem
eiic
ulur
(im
pcu
rri
î fi
ner
j ;
inem
ent"
însi
ons.
"ref
idi
mi
here
d'SEO
g
Impl
IVA
low
.
'S
ted-
lem
enIm
pl
o
than
t
CO
"Eth
is
en3
tine
Rou
ilit
y
%
able
Lcc
ept
1
IS
sion
s.
EQJ
.1T-l
broa
der(
two
3.52
1
Con
o
here
d
• o
ioni
lem
enta
tio.
g
low
ith
>
lem
enIm
pllu
ele
ast d
E
dim
ensi
c1
2.58
>n
uen3
ca
ham
Mec
>
this
ity a
tfi
del
iT3ÜCi
^E
uch
char
Eo
oÖD
Ped
í
III
'S
ted'
emen
(Den3
eaCJ
SI
Mec
t thi
s
cS
."^
T3tGB
O
D..5Ë B
» 3
ured
ÍS
mei
Id n
ot b
eC
oul
leve
l
o
Les
s1
plan
26 Abdus Sattar Molla and Yew-Jin Lee
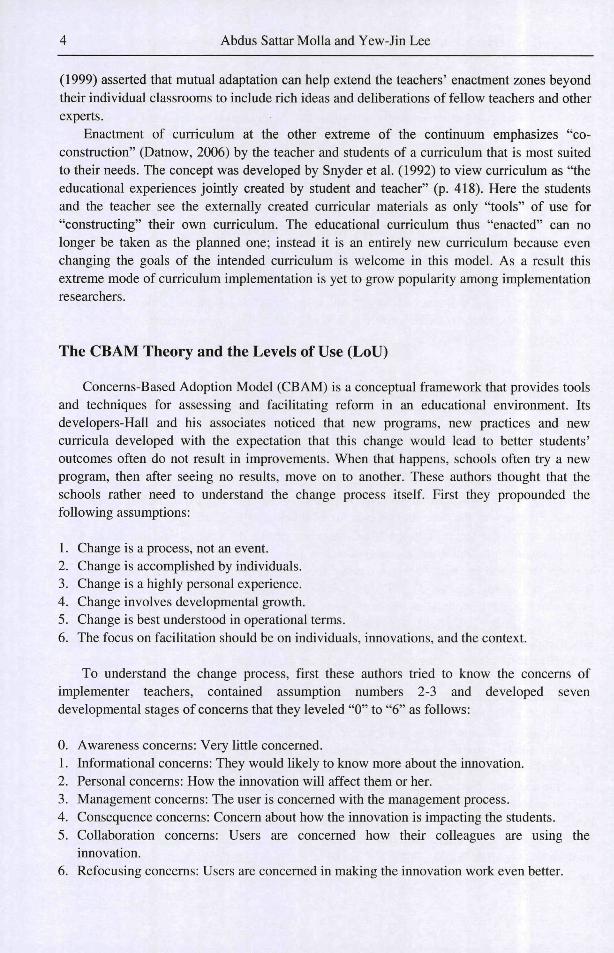
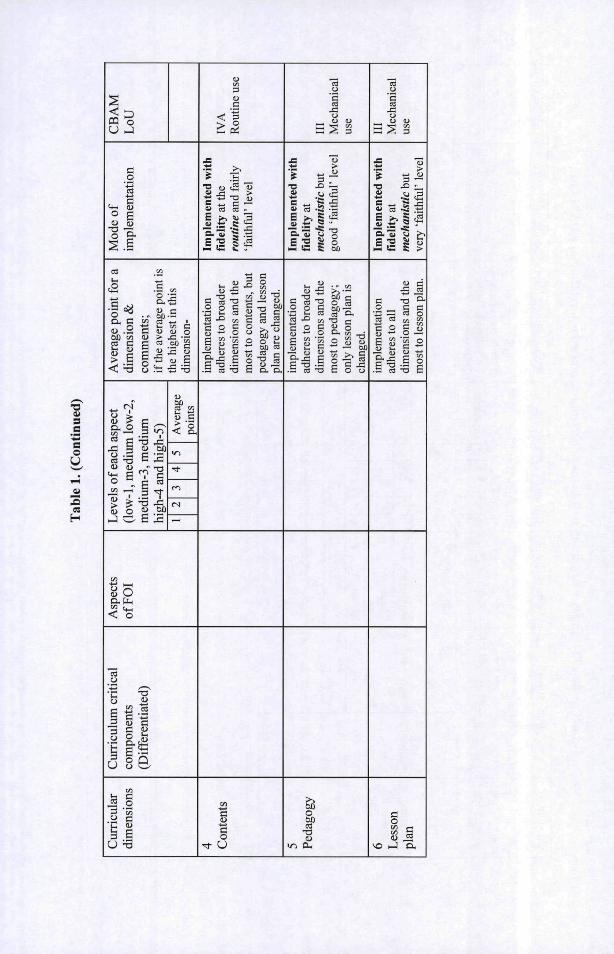
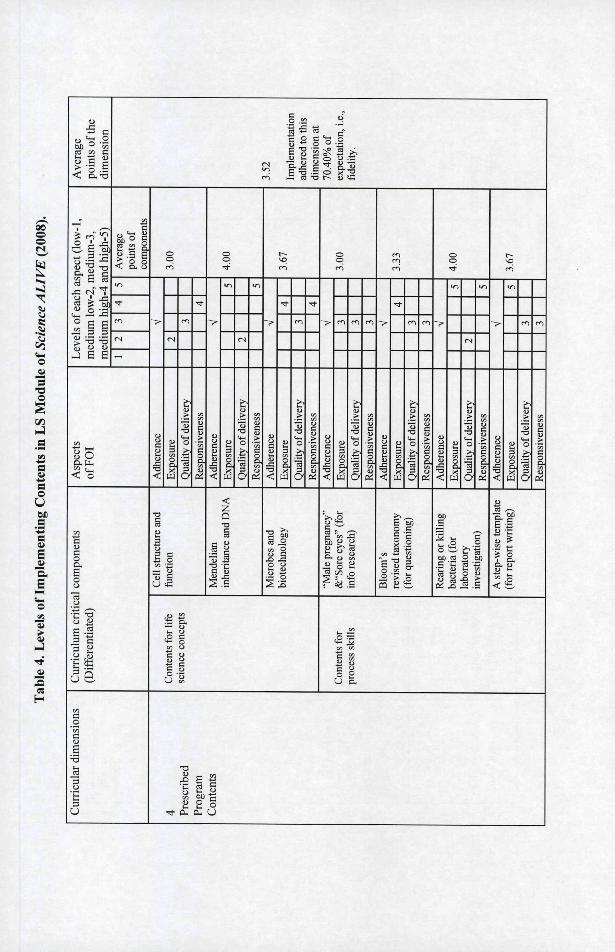
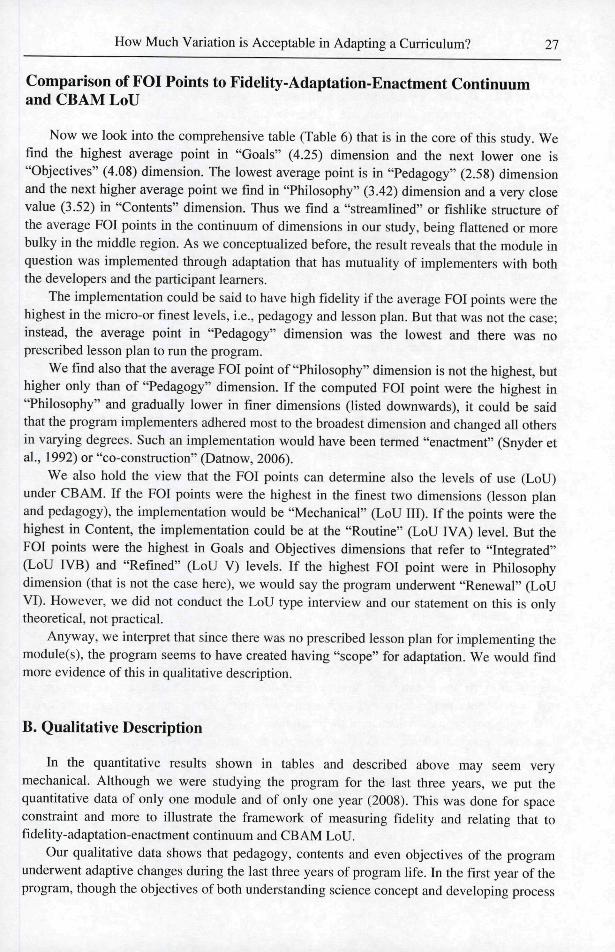
The next finer dimension is "Contents" (Table 4). Content components are grouped undertwo broad areas: contents for life science concepts and contents for process skills. The firstarea contains three components: cell structure and functions, Mendelian inheritance andDNA, and microbes (virus, bacteria & fungi) and biotechnology. The second area of contentshas four components as in "Objectives" dimension and there are four types of content areas(components) to meet those objectives. Thus, in total, there are seven components under thisdimension. All the components were adhered to; so we measured exposure of each. However,the points of exposure for the four process skills are similar as in the "Objectives" dimensionbecause the contents are directly related to the specific process skills. Since contents can beand were "delivered", we measured the quality of delivery as well. The participantresponsiveness here based on both the participation (e.g., talk time) and views aspects of theparticipant students.
In the table, we see the average FOI points for cell structure and functions, Mendelianinheritance and DNA, microbes and biotechnology, information research, questioning skill,laboratory investigation and writing report are respectively 3.00, 4.00, 3.67, 3.00, 3.33, 4.00and 3.67. The higher scores in Mendelian inheritance & DNA and laboratory investigation iscontributed both by larger share of instruction time (exposure) and students' more liking(responsiveness) for these components, though quality of delivery was similar. The lowerscores in cell structure & function, information research and questioning skill werecontributed by the lower exposure and less liking (responsiveness) of the participant students.
Five of the seven components received points around 3 and contributed to a lower (thanin three broader dimensions) average FOI point (3.52) for the "Content" dimension as awhole. The figure, if transformed to percentage, becomes 70.40.
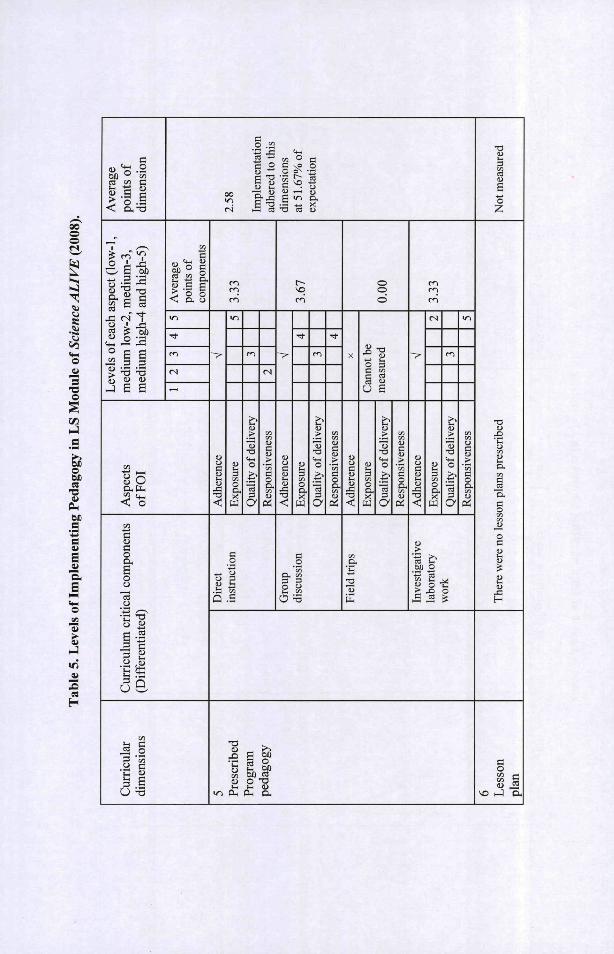
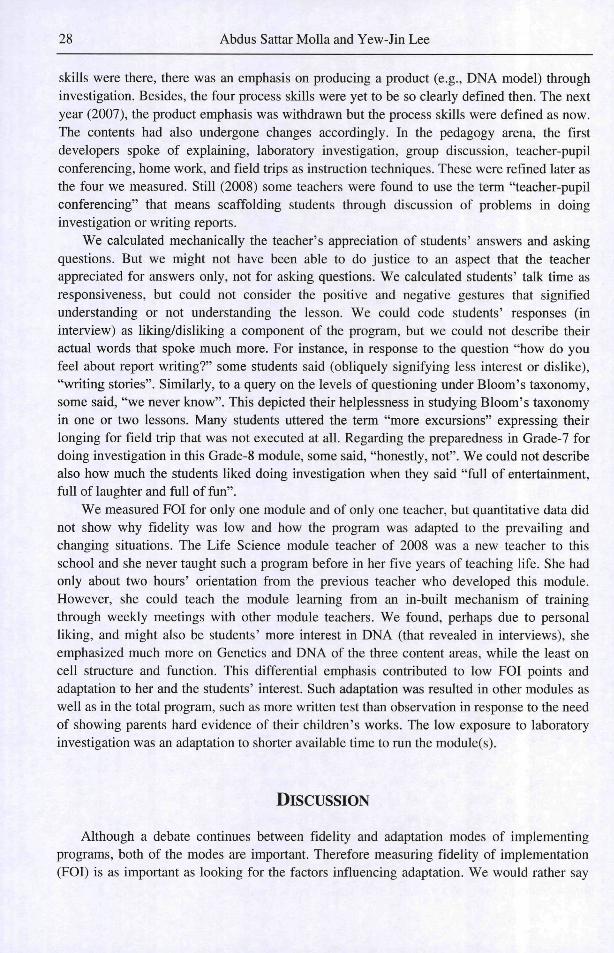
Table 5 shows the FOI points for "Pedagogy" dimension; there are no points for "Lessonplan" dimension because there was no planned lesson in the module (and even in the wholeprogram). This dimension has four components: direct instruction, group discussion, field tripand investigative laboratory work. All the components except field trip were adhered to; sowe measured FOI aspects for those three. All the three aspects including exposure, quality ofdelivery and responsiveness were measured. Exposure was distinct for every component, butquality of delivery was common because sometimes a single lesson consisted of all the threecomponents and measures of quality like declaration of objectives and accessing priorknowledge could not be considered for segments of a lesson. However, responsiveness wasmeasured differentially according to the instructional technique.
In the table, we see the average FOI points for direct instruction, group discussion andinvestigative laboratory work are 3.33, 3.67 and 3.33 respectively. Although direct instructionreceived more than its due share of instruction time (exposure), lower points in other twoaspects caused lowering of the component average FOI point. Similarly, investigativelaboratory work, though had higher responsiveness, could not earn good mark because of thelowest exposure. On the other hand, group discussion had received both exposure andresponsiveness well and thus earned more points. Field trip was not adhered to and we couldnot measure that, but we counted this as a critical component (and awarded zero) because itwas intended as such. The non-adherence to field trip largely contributed to average FOIpoint (2.58) of Pedagogy dimension that is the lowest among all dimensions. If we translatethis average point to percentage it becomes as low as 51.67.
How Much Variation is Acceptable in Adapting a Curriculum? 27
Comparison of FOI Points to Fidelity-Adaptation-Enactment Continuumand CBAM LoU
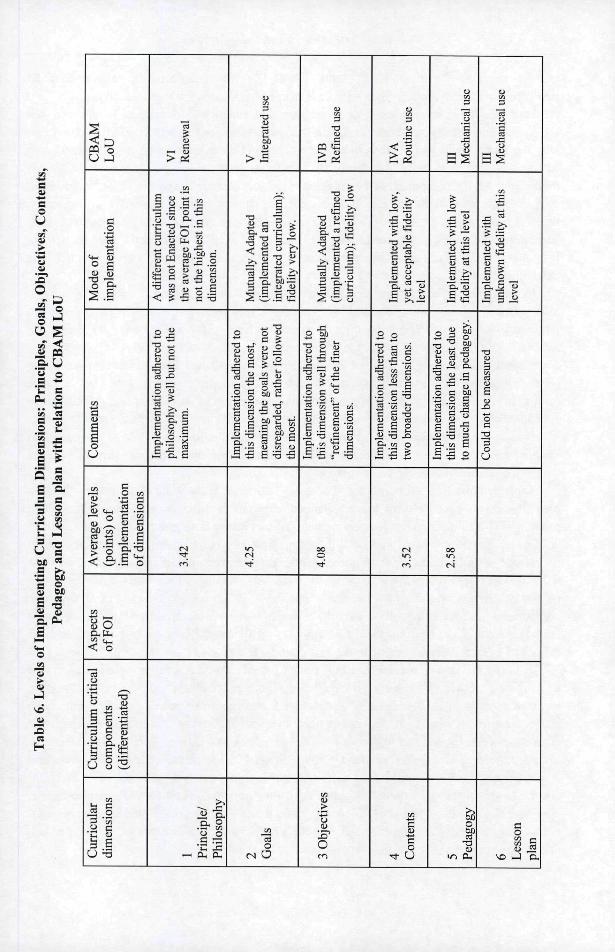
Now we look into the comprehensive table (Table 6) that is in the core of this study. Wefind the highest average point in "Goals" (4.25) dimension and the next lower one is"Objectives" (4.08) dimension. The lowest average point is in "Pedagogy" (2.58) dimensionand the next higher average point we fmd in "Philosophy" (3.42) dimension and a very closevalue (3.52) in "Contents" dimension. Thus we fmd a "streamlined" or fishlike structure ofthe average FOI points in the continuum of dimensions in our study, being flattened or morebulky in the middle region. As we conceptualized before, the result reveals that the module inquestion was implemented through adaptation that has mutuality of implementers with boththe developers and the participant learners.
The implementation could be said to have high fidelity if the average FOI points were thehighest in the micro-or finest levels, i.e., pedagogy and lesson plan. But that was not the case;instead, the average point in "Pedagogy" dimension was the lowest and there was noprescribed lesson plan to run the program.
We fmd also that the average FOI point of "Philosophy" dimension is not the highest, buthigher only than of "Pedagogy" dimension. If the computed FOI point were the highest in"Philosophy" and gradually lower in fmer dimensions (listed downwards), it could be saidthat the program implementers adhered most to the broadest dimension and changed all othersin varying degrees. Such an implementation would have been termed "enactment" (Snyder etal., 1992) or "co-construction" (Datnow, 2006).
We also hold the view that the FOI points can determine also the levels of use (LoU)under CBAM. If the FOI points were the highest in the finest two dimensions (lesson planand pedagogy), the implementation would be "Mechanical" (LoU III). If the points were thehighest in Content, the implementation could be at the "Routine" (LoU IVA) level. But theFOI points were the highest in Goals and Objectives dimensions that refer to "Integrated"(LoU IVB) and "Refmed" (LoU V) levels. If the highest FOI point were in Philosophydimension (that is not the case here), we would say the program underwent "Renewal" (LoUVI). However, we did not conduct the LoU type interview and our statement on this is onlytheoretical, not practical.
Anyway, we interpret that since there was no prescribed lesson plan for implementing themodule(s), the program seems to have created having "scope" for adaptation. We would findmore evidence of this in qualitative description.
B. Qualitative Description
In the quantitative results shown in tables and described above may seem verymechanical. Although we were studying the program for the last three years, we put thequantitative data of only one module and of only one year (2008). This was done for spaceconstraint and more to illustrate the framework of measuring fidelity and relating that tofidelity-adaptation-enactment continuum and CBAM LoU.
Our qualitative data shows that pedagogy, contents and even objectives of the programunderwent adaptive changes during the last three years of program life. In the first year of theprogram, though the objectives of both understanding science concept and developing process
28 Abdus Sattar Molla and Yew-Jin Lee
skills were there, there was an emphasis on producing a product (e.g., DNA model) throughinvestigation. Besides, the four process skills were yet to be so clearly defined then. The nextyear (2007), the product emphasis was withdrawn but the process skills were defined as now.The contents had also undergone changes accordingly. In the pedagogy arena, the firstdevelopers spoke of explaining, laboratory investigation, group discussion, teacher-pupilconferencing, home work, and field trips as instruction techniques. These were refined later asthe four we measured. Still (2008) some teachers were found to use the term "teacher-pupilconferencing" that means scaffolding students through discussion of problems in doinginvestigation or writing reports.
We calculated mechanically the teacher's appreciation of students' answers and askingquestions. But we might not have been able to do justice to an aspect that the teacherappreciated for answers only, not for asking questions. We calculated students' talk time asresponsiveness, but could not consider the positive and negative gestures that signifiedunderstanding or not understanding the lesson. We could code students' responses (ininterview) as liking/disliking a component of the program, but we could not describe theiractual words that spoke much more. For instance, in response to the question "how do youfeel about report writing?" some students said (obliquely signifying less interest or dislike),"writing stories". Similarly, to a query on the levels of questioning under Bloom's taxonomy,some said, "we never know". This depicted their helplessness in studying Bloom's taxonomyin one or two lessons. Many students uttered the term "more excursions" expressing theirlonging for field trip that was not executed at all. Regarding the preparedness in Grade-7 fordoing investigation in this Grade-8 module, some said, "honestly, not". We could not describealso how much the students liked doing investigation when they said "full of entertainment,full of laughter and full of fun".
We measured FOI for only one module and of only one teacher, but quantitative data didnot show why fidelity was low and how the program was adapted to the prevailing andchanging situations. The Life Science module teacher of 2008 was a new teacher to thisschool and she never taught such a program before in her five years of teaching life. She hadonly about two hours' orientation from the previous teacher who developed this module.However, she could teach the module learning from an in-built mechanism of trainingthrough weekly meetings with other module teachers. We found, perhaps due to personalliking, and might also be students' more interest in DNA (that revealed in interviews), sheemphasized much more on Genetics and DNA of the three content areas, while the least oncell structure and function. This differential emphasis contributed to low FOI points andadaptation to her and the students' interest. Such adaptation was resulted in other modules aswell as in the total program, such as more written test than observation in response to the needof showing parents hard evidence of their children's works. The low exposure to laboratoryinvestigation was an adaptation to shorter available time to run the module(s).
DISCUSSION
Although a debate continues between fidelity and adaptation modes of implementingprograms, both of the modes are important. Therefore measuring fidelity of implementation(FOI) is as important as looking for the factors infiuencing adaptation. We would rather say
How Much Variation is Acceptable in Adapting a Curriculum? 29
that FOI can be measured quantitatively with more precision, while adaptation cannot bemeasured that way though qualitative description is possible. Since fidelity and adaptationcan be placed in a continuum, FOI measures can aid also in measuring adaptation assumingthat more FOI means less adaptation and the vice versa. Thus measuring fidelity becomesmore important as a (negative) measure of adaptation as well. However, measuring FOI hasproved difficult and there are a number of ways to measure this.
One of the ways is using five aspects (adherence, exposure, quality of delivery,participant responsiveness and program differentiation) to measure FOI (Dane & Schneider,1998; Dusenbury et al., 2003; Barry et al., 2005). Even in using these aspects, authorsdiffered to a great extent mostly because of difference in conceptualizing and defining theseaspects. We realized that Dane and Schneider (1998) who propounded these aspects thoughfelt the need of "program differentiation", were not clear about what this aspect really meantand how to decide on this. That is why most authors only referred to this aspect but did notmeasure. We defined this aspect as the characteristic features or components that constitutethe program and differentiate a program from other such programs. That is why we suggestthat to measure other four aspects, the researcher(s) must look for and decide on, i.e.,differentiate the essential or critical components or features of the program under study. Thusprogram differentiation is a basic and the first measure of a program and measuring otheraspects of each one or most of differentiated components or features of a program shouldconstitute finer FOI study.
Looking at other aspects, we found another hazy area. Adherence has been defined as"extent to which implementation of particular activities and methods is consistent with theway the program is written" (Dusenbury et al., 2003, p. 241) that sounds very like totalfidelity. Barry et al. (2005) actually placed these two terms side by side saying "Programadherence or fidelity - the degree to which core program components were delivered" (p. 31).If defined this way, we need not use two terms; only fidelity or adherence could do. However,since two terms have already been in use, it is better to keep the both alive; the need is only todefine these two terms differently so that they can assume two different meanings. Fidelityhas long years of existence and its definition as "the extent to which the project wasimplemented as originally planned" (Berman & McLaughlin, 1976, p. 350) is well-established though other authors might have used different words or phrases. That is why wedefined adherence rather narrowly to mean the presence or absence in the implementation of adifferentiated component of the program as planned. If the component in question is present,we can measure the quantity (exposure) and quality (of delivery) of, and participantresponsiveness to that component.
After clearing the conceptual haze, we developed a simple but workable framework formeasuring FOI. The framework used the well-known dimensions: philosophy, goals,objectives, contents, pedagogy and lesson plan (Marsh & Willis, 2007; Omstein & Hunkins,1998) in place of the ill-defined (of course these also could be defined well, but not done thatway) ones like theoretical stand, curriculum materials, instructional transactions andoutcomes that Ruiz-Primo (2006) used. We suggested to decide on the components of aprogram under each dimension and thereafter to measure FOI of other aspects. Weconceptualize also that the FOI points can be related to the other two modes (adaptation andenactment) of the fidelity-adaptation-enactment continuum (Snyder et al., 1992) as well as toCBAM Levels of Use (LoU) (Hord et al., 1987). We empirically used this framework instudying fidelity and adaptation of implementation of the program we studied. Our
30 Abdus Sattar Molla and Yew-Jin Lee
quantitative results showed the highest FOI points at Goals and Objectives dimensions; thetotal points for both philosophy and pedagogy near two extremities are lower while there isno point for lesson plan dimension, since the program did not have prescribed lesson plans.We related these FOI points to fidelity-adaptation-enactment continuum and to CBAM LoU.
The significance of the first relation is that we can answer the longstanding question"how much variation is acceptable in adaptation?" There can be no single answer to thisquestion because this is not a true-false answer and people's views are subject to varyaccording to beliefs and contexts. However, we provide an answer assuming that for mutualadaptation, the curriculum developers and implementers must recognize and respect eachother's ideas. In the concept of "enactment", a new curriculum is constructed by the teachersand the students disregarding even the set goals of the intended curriculum by resetting thegoals. In such an extreme case, the developers' ideas are not respected; so there can be nomutuality and thus variation of such extent cannot be acceptable to the developers. On thecontrary, where only the pedagogy and lesson plan (if planned) is changed for adaptation, andthe implementers are asked to "obey" both objectives and even content fully to reach goals,the implementers are of course not provided with enough freedom for adapting the curriculumto meet the learners needs. However, in the case where the goals are kept intact, implementerscan change the pedagogy and lesson plan (following "teacher's method") and alter thecontents and even specific objectives negotiating the developers, both the developer's and theimplementer's ideas are respected. Thus we would like to place the demarcation line ofhighest acceptable variation in between objectives and goals. So far there is negotiation at thecontent and objectives dimensions, keeping the goals intact, the variation should beacceptable.
Using this concept, we found the Life Science module of Science ALIVE mutuallyadapted having low fidelity at the micro-level that is expected for fidelity at the good faithfullevels; but highest fidelity at "Goals" dimension, having mutuality in exchanging views andnegotiating how much variation could be done in "Objectives" and "Contents" dimensions.That the mode of implementation was adaptation was reinforced by our brief qualitativedescription.
Our second relationship is between the fidelity-adaptation-enactment continuum and theCBAM LoU. We have shown this relationship in Table 6. This signifies that CBAM theoryand especially its LoU is still valid and can be used for fidelity-adaptation (and evenenactment) studies. However, we think the Routine level (IVA) can be positioned after eachof the Mechanical (LoU III), Refinement (LoU IVB), Integration (LoU V) and Renewal (LoUVI) levels because "stabilization" of each of these levels is obviously possible. When animplementer refines a program and uses it with ease, s/he is no more refining this but using itas a routine program. The same way, after integrating a curriculum, the user can continueimplementing without further integration; so this is again a routine use. Thus even afterrenewal, the user may stop renewing and continue implementing as such; so this is anotherroutine level. Therefore, we propose that Mechanical level be renamed IIIA, the first Routinelevel as IIIB, then Refinement as IVA, the second Routine level as IVB, Integration as VA,the third Routine level as VB, Renewal as VIA and the fourth Routine level as VIB.
However, we have some remarkable limitations in applying our construct, coding and inusing the five-point scale to measure three aspects (exposure, quality of delivery andparticipant responsiveness). Since the module was a small 10-week one, its objectives andcontents were well defined and in some points overlapping. For this reason, our constructs for
How Much Variation is Acceptable in Adapting a Curriculum? 31
these two dimensions may seem finer than required for studying FOI. However, the constructwould work better for bigger programs that run for longer time. Such program would havemuch more contents to meet objectives that would be concise.
For coding we used percentages of time spent in implementing some components, instudents' talks and otherwise involvement. Later we transformed these finer figures into fivelevels or grades that are coarser measures than percentage; lastly we again calculated averagepoints for dimensions as percentage for fineness. So we realize that the percentagesthemselves could be used as grades or levels to measure aspects of FOI. Such a finer measure,however, may prove unsuitable in measuring responsiveness, especially the views aspect.
CONCLUSION AND IMPLICATIONS
Measuring fidelity is important because once we know that a curriculum or program hasbeen implemented with good fidelity, we can attribute its success or failure to the theory andcontent of the program (O^Donnell, 2008). However, it was proved that fidelity to a faithfullevel alone cannot ensure success of a program, rather adaptation and especially mutualadaptation is a better way of implementing innovated or new curricula. The results of thisstudy showed that this has also been an instance of adaptation.
However, the main implication of this study is not the results we obtained but theframework of FOI that is capable of relating fidelity to both the CBAM LoU and the threemodes/levels of program implementation according to the fidelity-adaptation-enactmentcontinuum. In doing so we redefined the five aspects of FOI and we claim that our definitionclarified the haze in defining these aspects. Although we did not use CBAM LoU interviewprotocol, our relating FOI with CBAM LoU showed that, as a construct, CBAM LoU is veryfiexible and containing that Hord (1987) claimed. Through the review of CBAM LoU, weproposed some changes in the LoU scale that seems reasonable and we place this beforeenthusiasts of this construct for discussion.
Lastly, to answer the longstanding problem of how much adaptation is consideredacceptable, i.e., the "zone of drastic mutation" (Hall & Loucks, 1977), we suggest, this lies inbetween curricular dimensions of goals and objectives. When adaptation crosses the limit ofregarding or disregarding the set goals of a program, the mutuality between the developer(s)and implementer(s) also crosses the threshold and the mode of implementation enters the areaof "enactment" meaning constructing a new curriculum on the spot.
REFERENCES
Adams, G. & Engelmann, S. (1996). Research on direct instruction: 25 years beyondDISTAR. Seattle, WA: Educational Achievement Systems.
Allen, J. P., Philliber, S. & Hoggson, N. (1990). School-based prevention of teen-agepregnancy and school dropout: process evaluation of the National Replication of theTeen Outreach Program. American Journal of Community Psychology, 18, 505-524.
Anderson, S. E. (1997). Understanding teacher change: Revisiting the Concerns BasedAdoption Model. Curriculum Inquiry, 27, 332-367.
32 Abdus Sattar Molla and Yew-Jin Lee
Barry, M. M., Domitrovich, C. & Lara, M. A. (2005). The implementation of mental healthpromotion programmes. Promotion and Education, Supplement, 2, 30-36.
Berman, P. & McLaughhn, M. W. (1976). Implementation of educational innovation.Educational Eorum, 40, 344-370.
Berman, P. & McLaughlin, M. W. (1978). Federal programs supporting educational change.Vol. VIII: Implementing and sustaining innovations. Santa Monica, CA: RandCorporation.
Boruch, R. R. & Gomez, H. (1977). Sensitivity, bias, and theory in impact evaluation.Professional Psychology, 8, 411-433
Brophy, J. & Good, T. L. (1986). Teacher behavior and student achievement. In M. C.Wittrock (Ed.), Handbook of research on teaching: A project of the AmericanEducational Research Association (328-375). New York: Macmillan PublishingCompany.
Calsyn, R., Tornatzky, L. G. & Dittmar, S. (1977). Incomplete adoption of an innovation: Thecase of goal attainment scaling. Evaluation, 4, 128-130.
Cheung, D., Hattie, J. & Ng, D. (2001). Reexamining the Stages of Concem Questionnaire: Atest of altemative models. The Joumal of Educational Research, 94, 226-236.
Dalin, P. & McLaughlin, M. W. (1975). Strategies for innovation in Higher Education.In N. Entwuistle (Ed.), Strategies for Research and Development in Higher Education.Amsterdam: Council of Europe.
Dane, A. V. & Schneider, B. H. (1998). Program integrity in primary and early secondaryprevention: are implementation effects out of control? Clinical Psychology Review, 18,23-24.
Datnow, A. (2006). Connections in the policy chain: The "co-construction" ofimplementation in comprehensive school reform. In M. I. Honig (Ed.), New directionsin education policy implementation: Confronting complexity (105-124). Albany: StateUniversity of New York Press.
Dusenbury, L., Brannigan, R., Falco, M. & Hansen, W. B. (2003). A review of research onfidelity of implementation: Implications for drug abuse prevention in school settings.Health Education Research: Theory and Practice, 18, l^l-lSè.
Ellis, A. K. (2005). Research on educational innovations. NY: Eye on Education.Emshoff, J. G., Blakely, C, Gottschalk, R., Mayer, J., Davidson, W. S. & Erickson, S.
(1987). Innovation in Education and Criminal Justice: Measuring Fidelity ofImplementation and Program Effectiveness. Educational Evaluation and PolicyAnalysis, 9,300-311.
Gagne, R. M. (1965). The conditions of learning. New York: Holt, Rinehart and Winston.Hall, G. E. & Loucks, S. F. (1977). A developmental model for determining whether the
treatment is actually implemented. American Educational Research Journal, 14, 263-276.
Hord, S. M. (1987). Evaluating educational innovation. London: Croom Helm.Hord, S. M., Rutherford, W. L., Huling-Austin, L. & Hall, G. E. (1987). Taking charge of
change. Alexandria, VA: South West Educational Development Laboratory/ASCD.Marsh, C. J., & Willis, G. (2007). Curriculum: Alternative approaches, ongoing issues. New
Jersey, CA: Pearson.
How Much Variation is Acceptable in Adapting a Curriculum? 33
Mills, S. C. & Ragan, T. J. (2000). A tool for analyzing implementation fidelity of anintegrated learning system. Educational Technology Research and Development, 48,21-41.
MOE [Ministry of Education] (2007). The PETALS Primer. Singapore: Ministry ofEducation.
NRC [National Research Council] (2000). Inquiry and thee national science educationstandards: A guide for teaching and learning. Washington, DC: National AcademyPress.
O'Donnell, C. L. (2008). Defining, conceptualizing, and measuring fidelity of implementationand its relationship to outcomes of K-12 curriculum intervention research. Review ofEducational Research, 7S,33-84.
Omstein, A. C. & Hunkins, F.P. (1998). Curriculum: Foundations, principles and issues.Needham Heights, MA: Allyn and Bacon.
Pentz, M. A., Trebow, E. A., Hansen, W. B., MacKinnon, D. P., Dwyer, J. H., Johnson, C. A.,et al. (1990). Effects of program implementation on adolescent drug use behavior: theMidwestern Prevention Project. Adolescent Drug Use Behavior, 14, 264—289.
Pollock, J. E. (2007). Improving student learning: One teacher at a time. Alexandria, VA:Association for Supervision and Curriculum Development (ASCD).
Ruiz-Primo, M. A. (2006). A multi-method and multi-source approach for studying fidelity ofimplementation. National Center for Research on Evaluation: The Regents of theUniversity of Califomia.
Samuelwicz, R. & Bain, J. D. (2001). Revisiting academic's beliefs about teaching andlearning. Higher Education, 41, 299-325.
Shulman, L. S. (1999). Knowledge and teaching: Foundations of the New Reform. In J.Leach, & B. Moon (Eds.), Learners and Pedagogy {6\-ll). London: Open University.
Snyder, J., Bolin, F. & Zumwalt, K. (1992). Curriculum implementation. In P. W. Jackson(Ed.), Handbook of research on curriculum (402-435). New York: Macmillan.
Spillane, J. P. (1999). External reform initiatives and teachers' efforts to reconstruct theirpr&cúce.. Journal of Curriculum Studies, 31, 143-176.
Stevension, H. W. & Stigler, J. W. (1992). The learning gap: Why our schools are failing andwhat we can learn from Japanese and Chinese education. New York: Touchstone(Simon & Schuster Inc.).
Tan, C. & Ng, P. T. (2007). Dynamics of change: Decentralised centralism of education inSingapore. Journal of Educational Change, 8, 155-168.
Wang, J. (1998). Opportunity to learn: The impacts and policy implications. EducationalEvaluation and Policy Analysis, 20, 137-156.
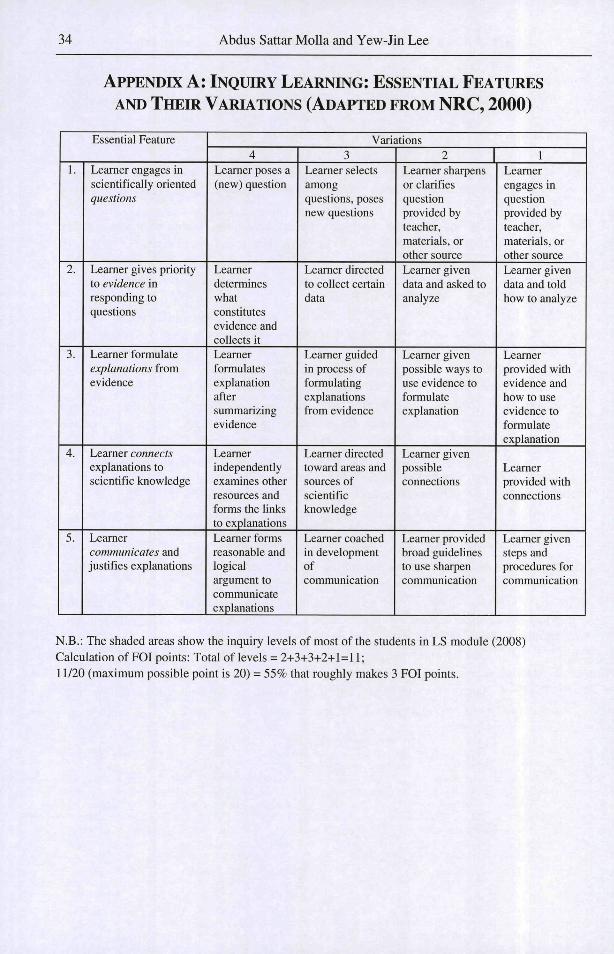
34 Abdus Sattar Molla and Yew-Jin Lee
APPENDIX A: INQUIRY LEARNING: ESSENTIAL FEATURESAND THEIR VARIATIONS (ADAPTED EROM N R C , 2000)
Essential Feature
1.
2.
3.
4.
5.
Learner engages inscientifically orientedquestions
Learner gives priorityto evidence inresponding toquestions
Learner formulateexplanations fromevidence
Learner connectsexplanations toscientific knowledge
Learnercommunicates andjustifies explanations
Variations4
Learner poses a(new) question
Learnerdetermineswhatconstitutesevidence andcollects itLearnerformulatesexplanationaftersummarizingevidence
Learnerindependentlyexamines otherresources andforms the linksto explanationsLearner formsreasonable andlogicalargument tocommunicateexplanations
3Learner selectsamongquestions, posesnew questions
Learner directedto collect certaindata
Learner guidedin process offormulatingexplanationsfrom evidence
Learner directedtoward areas andsources ofscientificknowledge
Learner coachedin developmentofcommunication
2Learner sharpensor clarifiesquestionprovided byteacher,materials, orother sourceLearner givendata and asked toanalyze
Learner givenpossible ways touse evidence toformulateexplanation
Learner givenpossibleconnections
Learner providedbroad guidelinesto use sharpencommunication
1Learnerengages inquestionprovided byteacher,materials, orother sourceLearner givendata and toldhow to analyze
Learnerprovided withevidence andhow to useevidence toformulateexplanation
Learnerprovided withconnections
Learner givensteps andprocedures forcommunication
N.B.: The shaded areas show the inquiry levels of most of the students in LS module (2008)Calculation of FOI points: Total of levels = 2+3+3+2+1=11 ;11/20 (maximum possible point is 20) = 55% that roughly makes 3 FOI points.

Copyright of Journal of Education Research is the property of Nova Science Publishers, Inc. and its content
may not be copied or emailed to multiple sites or posted to a listserv without the copyright holder's express
written permission. However, users may print, download, or email articles for individual use.