Embed Size (px)
Citation preview

LEARNING, PROTOTYPING AND ADAPTING Proceedings of the 23rd International Conference on Computer-Aided Architectural Design Research in Asia (CAADRIA 2018)
Volume 1
Edited by
Tomohiro Fukuda
Osaka University, Japan
Weixin Huang Tsinghua University, China
Patrick Janssen National University of Singapore, Singapore
Kristof Crolla Chinese University of Hong Kong, Hong Kong
and
Suleiman Alhadidi Harvard University, United States

Learning, Prototyping and Adapting 23rd International Conference on Computer-Aided Architectural Design
Research in Asia (CAADRIA 2018) 17 – 19 May 2018
School of Architecture Tsinghua University
©2018 All rights reserved and published by The Association for Computer-Aided Architectural Design Research in Asia
(CAADRIA), Hong Kong ISBN: 978-988-19026-0-3
Cover design by Pengyu Zhang
Cover images by Pengyu Zhang Printed by Beijing Jingcai Xueyun Printing House

i
About CAADRIA
The Association for Computer-Aided Architectural Design Research in Asia
(CAADRIA) promotes teaching and research in CAAD in Asia, and has members
on six continents.
CAADRIA was founded in 1996 with the following objectives:
To facilitate the dissemination of information about CAAD among Asian
schools of architecture, planning, engineering, and building sciences.
To encourage the exchange of staff, students, experience, courseware, and
software among schools.
To identify research and develop needs in CAAD education and to initiate
collaboration to satisfy them.
To promote research and teaching in CAAD that enhances creativity rather
than production.
CAADRIA organizes among others an annual conference, the first of which
was held in 1996 in Hong Kong. Since then, 22 conferences have been held in
Australia, China, Hong Kong, India, Japan, Korea, Malaysia, Singapore, Taiwan,
and Thailand. The 23rd conference, in 2018, will be held at Tsinghua University
in Beijing, China. The conferences provide an opportunity for teachers, students,
researchers, and practitioners to meet each other and learn about the latest
research in the field. The proceedings of the conferences are available both on
line and in research libraries around the world.
CAADRIA is one of the four founding organizations of the International
Journal of Architectural Computing (IJAC), and supervises one issue each year.
IJAC is published by Multi-Science in both paper and electronic versions.
Hyunsoo Lee
President, CAADRIA

ii
CAADRIA OFFICERS
President: Hyunsoo Lee,
Yonsei University, Republic of Korea
Secretary: Ning Gu,
University of South Australia, Australia
Treasurer: Patrick Janssen,
National University of Singapore, Singapore
Membership Officer: Suleiman Alhadidi,
Harvard University, United States
Outreach Officer: Walaiporn Nakapan,
Rangsit University, Thailand
Communication Officer: Ruwan Fernando,
Griffith University, Australia
Organization Officer: Weixin Huang,
Tsinghua University, China
Publication Officer: Jin Kook Lee,
Yonsei University, Republic of Korea
Web Master: June-Hao Hou,
National Chiao Tung University, Taiwan
Administrative Officer: Marc Aurel Schnabel,
Victoria University of Wellington, New Zealand
CAADRIA COMMITTEES
Award/Scholarship Committee:
Rudi Stouffs (Chair), Hyunsoo Lee, Tomohiro Fukuda, and Weiguo Xu
Paper Selection Committee:
Tomohiro Fukuda (Chair), Weixin Huang, Patrick Janssen, Kristof
Crolla, and Suleiman Alhadidi
PG Students Consortium:
Dagmar Reinhardt
Sasada Award Committee:
Tom Kvan, Yu-Tung Liu, Hyunsoo Lee, and Atsuko Kaga
Election Committee:
Teng-Wen Chang (Chair), Tomohiro Fukuda, Juhyun Lee, Philip F.
Yuan, Walaiporn Nakapan and Koh Immanuel Chee Beng
HONORARY ADVISORS
John Gero, George Mason University, United States
Ramesh Krishnamurti, Carnegie Mellon University, United States
Thomas Kvan, University of Melbourne, Australia
Mitsuo Morozumi, Kumamoto University, Japan

iii
Jin-Yeu Tsou, The Chinese University of Hong Kong, China
Aleppo Yu-Tung Liu, Asia University, Taiwan
Robert F. Woodbury, Simon Fraser University, Canada

iv
Conference Theme
Learning, Prototyping and Adapting
Rapidly evolving technologies are increasingly shaping our societies as well as
our understanding of the discipline of architecture. Computational developments
in fields such as machine learning and data mining enable the creation of learning
networks that involve architects alongside algorithms in developing new
understanding. Such networks are increasingly able to observe current social
conditions, plan, decide, act on changing scenarios, learn from the consequences
of their actions, and recognize patterns out of complex activity networks. While
digital technologies have already enabled architecture to transcend static physical
boxes, new challenges of the present and visions for the future continue to call for
both innovative responses integrating emerging technologies into experimental
architectural practice and their critical reflection. In this process, the capability of
adapting to complex social and environmental challenges through learning,
prototyping and verifying solution proposals in the context of rapidly shifting
realities has become a core challenge to the architecture discipline.
Supported by advancing technologies, architects and researchers are creating
new frameworks for digital workflows that engage with new challenges in a
variety of ways. Learning networks that recognize patterns from massive data,
rapid prototyping systems that flexibly iterate innovative physical solutions, and
adaptive design methods all contribute to a flexible and networked digital
architecture that is able to learn from both past and present to evolve towards a
promising vision of the future.
CAADRIA2018 features original high quality papers and posters presenting
current computer-aided architectural design research in a general sense,
accommodating a broad spectrum of approaches ranging from speculative,
informal investigations to conventional scientific research, including but not
limited to the following topics:
Computational design research and education
Computational design analysis
Generative, algorithmic and evolutionary design
Digital fabrication and construction
Collaborative, collective and participative design
Design cognition
Virtual/augmented reality and interactive environments
Virtual architecture and city modeling
v
Human-computer interaction
Ubiquitous and mobile computing
Practice-based and interdisciplinary computational design research
Theory, philosophy and methodology of computational design research
Simulation and visualization
Building Information Modelling
AI for design and built environments
IoT for built environments
Smart cities and smart buildings
CONFERENCE ORGANIZING COMMITTEE
Weiguo Xu, Tsinghua University, China
Weixin Huang, Tsinghua University, China
Yuguang Liu, Tsinghua University, China
Yufang Zhou, Tsinghua University, China
Feng Xu, Tsinghua University, China
Lei Yu, Tsinghua University, China

vi
Keynote Speakers
Reimagining Shell Structures - Strength through Geometry
Philippe Block
Déjà vu
Hernan Diaz Alonso
Architecture and Emotion
Yansong Ma
Design and Construction of Phoenix Center Based on Digital Technology
Weiping Shao

vii
Reimagining Shell Structures - Strength through Geometry
Philippe Block
Institute of Technology in Architecture at ETH Zurich
Throughout history, master builders have discovered expressive forms through
the constraints of economy, efficiency and elegance. There is much to learn from
the structural principles they developed. Novel structural design tools that extend
traditional graphical methods to three dimensions allow designers to discover a
vast range of possible shell forms. By better understanding the flow of forces in
three dimensions, excess material can be eliminated, natural resources conserved,
and humble materials like earth and stone reimagined.
Drawing from a revival of forgotten principles combined with the latest advances
in the design, engineering, fabrication and construction of doubly-curved shell
structures, this lecture reveals the foundations upon which the award-winning
“Beyond Bending” exhibition at the Venice Architecture Biennale in 2016 and
the thin, flexibly formed concrete shell of the NEST HiLo project were based.
SPEAKER BIOGRAPHY
Dr. Philippe Block, Professor at the Institute of Technology in Architecture at
ETH Zurich, studied architecture and structural engineering at the VUB in
Belgium and at MIT in USA. The Block Research Group focuses on equilibrium
design methods and computational form finding and fabrication of curved surface
structures. Prof. Block is also the director of the Swiss National Centre of
Competence in Research (NCCR) Digital Fabrication and partner of Ochsendorf
DeJong & Block (ODB Engineering).

viii
Déjà vu
Hernan Diaz Alonso
SCI-Arc Director/CEO
Architecture through the aesthetics of disorder should remind us of the game of
children, only for the sake of play and curiosity, but absolutely serious and
committed. This is a good thing in times of confusion. In the current state of
aesthetic discourse, it has been defined more or less in the last 20 years: 1: You
have to blindly believe in the tools. 2 Tools become techniques. 3 the evolution
of the genre begins to deepen, some choose to reinforce the cannon, others, as our
case, choose to contaminate it. 4 the field in general rejects evolution producing
a critical reactionary antidote. We choose to go deeper, useless, progress by
progress. Originality, should be an aspiration in aesthetics / ethics, now in the
aesthetics of disorder we can be more open. Pure state of architecture Without
obligation Proud of work and commitment to uselessness, in the sense that true
innovation and progress, often comes when the works focus on the nature of the
work without worrying about practical deployment. This idea of aesthetics will
modify the tradition of composition and order as an agent to study the shift
towards a paradigm of disordered aesthetics instead of the ubiquitous platform of
typologies. If the typologies are traditionally seen as categories of standardization
and symbolic expressions of form, in terms of aesthetics they are malleable
entities that are in constant metamorphosis; Adaptation and mutation are the main
characteristics of a formal project that produces genres or species. A species needs
a lineage to be recognized as such, in fact, a typology also needs a lineage to
become such. But a species has more freedom, because it can mutate. A typology
can change, but it can not change, it can be combined or renewed, but it will
always be a typology. Our Project proposes to make an extensive journey in the
new logics of pollution and construction of structural cultural instability.
Radicalize the agenda of the aesthetics of form and architecture, using the
possibilities of artificial and natural interaction.
If traditionally, the design was derived from an experience of form and proportion,
the formal project is an advanced position towards that tradition: it can not escape
and is, therefore, an evolution of that tradition. The ecology of dynamic topology
then becomes a tool that largely belongs to the greater control of the
manipulations of these formal strategies. If traditional architecture is needed to
determine the degree to which a particular project had reached its extension of
beauty, these topologies explore the emerging aesthetics as material methods of
the structure as an inverted mechanism of a more traditional beauty and the
specific material as a will of anguish Or a more frightful encounter with the work.
Rooting this paradigm of aesthetic design within the limits of the goal of
proportion and beauty of architecture, the ugly and horrendous of a new type of
structural organization based on excess are the necessary variations that allow us

ix
to escape towards a spatial model of surprising presence that It can produce lust
and amazement. We never leave the strangeness; We are just curious and we
channel different ways of seeing. It makes it vital and necessary and yes useless
in the best sense of the word. There is beauty in disorder, contaminations,
putrefactions, these need to be channel through passion. How can something be
advanced, if it is not confronted? We strive to achieve that balance and try to break
that perfect ideal of imagination, innovation and originality. We believe in the
integrity of persecution and obsessions. We believe that the sole purpose of
architecture is to imagine and challenge the culture of the discipline in all possible
angles.
SPEAKER BIOGRAPHY
Hernan Diaz Alonso assumed the role of SCI-Arc director beginning in the 2015
academic year. He has been a distinguished faculty member since 2001, serving
in several leadership roles, including coordinator of the graduate thesis program
from 2007–10, and graduate programs chair from 2010–15. He is widely credited
with spearheading SCI-Arc’s transition to digital technologies, and he played a
key role in shaping the school’s graduate curriculum over the last decade.
In parallel to his role at SCI-Arc, Diaz Alonso is principal of the Los Angeles–
based architecture office Xefirotarch. His multidisciplinary practice is praised for
its work at the intersection of design, animation, interactive environments, and
radical architectural explorations. Over the course of his career as an architect and
educator, Diaz Alonso has earned accolades for his leadership and innovation, as
well as his ability to build partnerships among varied constituencies. In 2005 he
was the winner of MoMA PS1’s Young Architects Program (YAP) competition,
and in 2012 he received the Educator of the Year award from the American
Institute of Architects (AIA). He won the 2013 AR+D Award for Emerging
Architecture and a 2013 Progressive Architecture Award for his design of the
Thyssen-Bornemisza Pavilion/Museum in Patagonia, Argentina.
Diaz Alonso’s architectural designs have been featured in exhibitions at the
Venice Architecture Biennale, the London Architecture Biennale, and ArchiLab
in Orleans, France, as well as included in exhibitions at such leading museums as
the Museum of Modern Art, New York; the San Francisco Museum of Modern
Art (SFMOMA); the Art Institute of Chicago; and MAK Centre, Vienna. The
work has been widely published in magazines, journals, and books, including the
Excessive monograph of Xefirotarch. The office is currently working on a new
monograph to be published by Thames and Hudson. Diaz Alonso’s work is in the
permanent collections of the FRAC Centre, Orleans, France; SFMOMA; the
Museum of Modern Art, New York; Thyssen-Bornemisza, the MAK Museum,
Vienna; and the Art Institute of Chicago.
A gifted educator, Diaz Alonso has been acknowledged throughout the years with
prestigious appointments; these include Yale University’s Louis I. Kahn Visiting

x
Assistant Professorship of Architectural Design (2010), Visiting Design Studio
Faculty at the GSAPP at Columbia University (2004–10), an ongoing
appointment as architectural design professor in the Urban Strategies
Postgraduate Program at the University of Applied Arts Vienna, and as a
Distinguished Faculty Member at SCI-Arc. In spring 2015 he served as Yale
University’s Eero Saarinen Professor of Architectural Design.

xi
Architecture and Emotion
Ma Yansong
Founding Principal, MAD Architects, China
The East Asian perception of the world is imbued with a special affinity for
nature: “I am part of you, and you are part of me.” Since the Industrial Revolution,
history has been marked by over a century of humankind subjugating and
transforming nature. Towering concrete skyscrapers serve as monuments to
power and capital in contempt of human nature. People simultaneously love and
despise the city, vacillating between the impulse to remain or to flee. The future
development of society demands that we reconsider the relationship between
humanity and nature. We must carefully reevaluate our experience of an industrial
civilization that forfeited our natural environment. We have to find a new path,
one that restores a sense of harmony and balance to our relationship with the
natural world.
SPEAKER BIOGRAPHY
Beijing Boran Architect Ma Yansong is the first Chinese architect to win an
overseas landmark-building project. As the founder and principal of MAD
Architects, Ma leads design across various scales. In recent years, many of Ma’s
designs follow his conception of the “Shanshui City”, which is his vision to create
a new balance among society, the city and the environment through architecture.
Since designing the “Floating Island” in 2002, Ma has been exploring this idea
through an international practice. At MAD, Ma has created a series of
imaginative works, including Lucas Museum of Narrative Art, Absolute Towers,
Harbin Opera House, Hutong Bubble 32, Ordos Museum, Chaoyang Park Plaza,
Huangshan Mountain Village, etc. In 2014, Ma was selected as the principal
designer for Lucas Museum of Narrative Art, which made him the first Chinese
architect to design overseas culture landmark. Parallel to his design practice, he
has also been exploring with the public the cultural values of cities and
architecture through domestic and international solo exhibitions, publications and
art works.

xii
Design and Construction of Phoenix Center Based on Digital Technology
Shao Weiping
Beijing Institute of Architectural Design (BIAD)
Phoenix Center draws inspiration from the site environment and cultural
traditions, creates the unique spiritual values of architecture using digital
technology. The concept of bounded but brimless Mobius strip eliminates the
orthogonal features of traditional architecture and enables the building to stay in
harmony with the city's corners with a 360-degree continuous building interface.
The building is perfectly integrated with the urban streets and park landscape.
Phoenix Center tries to explore a new approach to architectural design to interpret
contemporary architecture. The geometric control system is established to meet
the requirements of complex-shaped buildings for higher design control precision.
The system not only gives the building a clear geometric order, but also helps
architects consider such complex issues as functions, aesthetics and construction
as a whole and find effective solutions.
To better present the continuous twisting Mobius strip, a new structural system is
customized – two-way superimposed grid structure, thus making the shell steel
structure an artwork of structural aesthetics as well as an organic part of the
curtain wall system, and creating an opportunity to overcome the problems of free
curved surface bridging in the design of complex architectural surfaces.
The surface is composed of more than 3,000 scale units of different sizes in one-
way smooth curves, generates concave-convex forms and rich texture, and
presents the continuity, smoothness, and simplicity peculiar to Phoenix Center.
Phoenix Center boasts a number of distinctive innovative elements: a new
architectural language, a new sense of space, a new artistic experience, a new
design approach, and a new construction mode. Digital technology realizes the
free creation and precise construction of buildings.
SPEAKER BIOGRAPHY
Graduated from the Department of Architecture, Tongji University in 1984. Mr.
Shao is now National Engineering Survey and Design Master, executive architect
of Beijing Institute of Architectural Design (BIAD) and director of BIAD-UFo
Studio, executive director of Architecture Society of China, Chairman of the
Architects Association of Architectural Society of China, president of The Civil
Engineering & Architecture Society of Beijing, and director of Information
Architecture Design and Construction Engineering Technology Research Center
of Beijing. He is also master student supervisor in several prestigious universities’
architecture departments including Tsinghua University, Beijing University of
Civil Engineering and Architecture, and Central Academy of Fine Arts. Mr. Shao
have received many awards for his works: he won China Architecture Society

xiii
Creation Award and first place in Beijing's top ten buildings in the new century
award; China Architecture Society Creative Award, National Design Silver
Award 2012, Asian Institute of Architects 2011 Gold Award, and Beijing Design
Week Excellent Design Award for Olympic Center District Sunken Plaza design
and his most representative work, the Phoenix Center has been awarded the gold
prize of architectural creation of China Institute of Architecture in 2014, National
Excellent Engineering Survey Design Industry Award in 2015, and top award in
Autodesk Engineering Construction Industry Global Excellence Award in 2016.

xiv
Foreword
The annual CAADRIA (Association for Computer-Aided Architectural Design
Research in Asia) conference provides an international community of researchers
and practitioners with a venue to exchange, to discuss and to publish their latest
ideas and accomplishments. This volume contains the 113 research papers that
were accepted for presentation at the 23rd International CAADRIA Conference,
hosted and organised by the School of Architecture at Tsinghua University in
China. The contained papers can be obtained digitally from CUMINCAD.
This volume is the outcome of an extensive collaborative effort of a team of
volunteers, and it marks another year of growing quality and strength in the
history of CAADRIA. Calls for papers in July of 2017 resulted in the submission
of 254 abstracts. These were initially blind reviewed by the paper selection
committee, which invited 233 abstracts for further development. Of these, 161
full papers were submitted to the full paper review stage. A team of 128
international reviewers assist us in the full review stage. Three international
reviewers carried out a double-blind review of each submitted paper. Following
the reviewers’ recommendations, 117 papers were finally accepted for publication.
We congratulate the authors for their accomplishment. Next to the authors, the
reviewers, who volunteered valuable time and effort, deserve our sincere thanks
and acknowledgements. We sincerely thank the organising team at Tsinghua
University, in particular Dr. Weiguo Xu, conference chair. We would also like to
extend a special thanks the ProceeDings team – Gabriel Wurzer and Wolfgang
Lorenz – for their relentless support with customizing the system to the needs of
this CAADRIA Proceedings from the abstract submission stage.
On the following pages, we acknowledge and thank those who contributed to
the production of this volume. In closing, we sincerely thank the CAADRIA
community for offering us the honour to serve as members of the paper selection
committee for CAADRIA 2018.
PAPER SELECTION COMMITTEE
Tomohiro Fukuda (Chair), Osaka University, Japan
Weixin Huang, Tsinghua University, China
Patrick Janssen, National University of Singapore, Singapore
Kristof Crolla, Chinese University of Hong Kong, Hong Kong
Suleiman Alhadidi, Harvard University, United States
May 2018

xv

xvi
International Review Committee
Wael Abdelhameed, University of Bahrain, Bahrain
Henri Achten, Czech Technical University in Prague, Czech Republic
Suleiman Alhadidi, Harvard University, United States
Fernando García Amen, University of the Republic, Uruguay André L. Araujo, University of Campinas, Brazil
Matthew Austin, University of Technology Sydney, Australia
Phil Ayres, CITA, Royal Danish Academy of Fine Arts, Denmark
Daniel Baerlecken, Georgia Institute of Technology, United States José Nuno Beirão, Faculdade de Arquitetura Universidade de Lisboa, Portugal
Amar Bennadji , Robert Gordon University, United Kingdom
Chris Beorkrem, University of North Carolina Charlotte, United States
Johannes Braumann, Robots in Architecture / UfG Linz, Austria Michael Budig, Singapore University of Technology and Design, Singapore
Peter Buš, ETH Zurich, Switzerland
Inês Caetano, Technical University of Lisbon, Portugal
Tilanka Chandrasekera, Oklahoma State University, United States Teng-Wen Chang, National Yunlin University of Science and Technology, Taiwan
Yuan Chao, National University of Singapore, Singapore
Jia-Yih Chen, CS Cheng & JY Chen Architects & Partners, Taiwan
Sheng-Fen Chien, National Cheng Kung University, Taiwan Seungyeon Choo, Kyungpook National University, Republic of Korea
Birgul Çolakoglu, İstanbul Technical University, Turkey
Kristof Crolla, Chinese University of Hong Kong, Hong Kong
Stylianos Dritsas, Singapore University of Technology and Design, Singapore Halil Erhan, Simon Fraser University, Canada
Alberto T. Estévez, Universitat Internacional de Catalunya, Spain
Ruwan Fernando, Griffith University, Australia
Paolo Fiamma, Pisa University, Italy Takeshi Fujii, Ritsumeikan University, Japan
Tomohiro Fukuda, Osaka University, Japan
John Gero, University of North Carolina at Charlotte, United States
Ning Gu, University of South Australia, Australia M. Hank Haeusler, University of New South Wales, Australia
Jie He, Tianjin University, China
Oliver Heckmann, Singapore University of Technology and Design, Singapore
Carlos Barrios Hernandez, Clemson University, United States Christiane M. Herr, Xi'an Jiaotong-Liverpool University, China
Pablo C. Herrera, Universidad Peruana de Ciencias Aplicadas, Peru
Dominik Holzer, University of Melbourne, Australia
June-Hao Hou, National Chiao Tung University, Taiwan Weixin Huang, Tsinghua University, China
Yinghsiu Huang, National Kaohsiung Normal University, Taiwan
Jie-Eun Hwang, University of Seoul, Republic of Korea
Yasushi Ikeda, Keio University, Japan Aswin Indraprastha, Institut Teknologi Bandung, Indonesia
Alstan Jakubiec, Singapore University of Technology and Design, Singapore
Patrick Janssen, National University of Singapore, Singapore
Taysheng Jeng, National Cheng Kung University, Taiwan Guohua Ji, Nanjing University, China
Sam Joyce, Singapore University of Technology and Design, Singapore
Han-Jong Jun, Hanyang University, Republic of Korea

xvii Atsuko Kaga, Osaka University, Japan
Chin Koi Khoo, Deakin University, Australia
Joachim B. Kieferle, Hochschule RheinMain, Germany
Hyeong Ill Kim, National University of Singapore, Singapore Mi Jeong Kim, Kyung Hee University, Republic of Korea
Sung-Ah Kim, Sungkyunkwan University, United States
Christoph Klemmt, University of Cincinnati, United States
Yoshihiro Kobayashi, Arizona State University, United States Narito Kurata, Tsukuba University of Technology, Japan
Dennis Lagemann, ETH Zurich, Switzerland
Ih-Cheng Lai, Tamkang University, Taiwan
Ji-Hyun Lee, KAIST, Republic of Korea Hyunsoo Lee, Yonsei University, Republic of Korea
Jin Kook Lee, Yonsei University, Republic of Korea
Yuan-Rong Lee, Asia University, Taiwan
António Leitão, Technical University of Lisbon, Portugal Surapong Lertsithichai, Mahidol University, Thailand
Biao Li, Southeast University, China
Andrew Li, Kyoto Institute of Technology, Japan
Chieh-Jen Lin, Tainan University of Technology, Taiwan Yuezhong Liu, National University of Singapore, Singapore
Tian Tian Sky Lo, Victoria University of Wellington, New Zealand
Paul Loh, University of Melbourne, Australia
Thorsten Lomker, Zayed University, United Arab Emirates Bob Martens, Vienna University of Technology, Austria
Michio Matsubayashi, National Institute of Technology, Kushiro College, Japan
Yuji Matsumoto, Kyoto Institute of Technology, Japan
Naomi Matsunaga, Lemon Gasui, Japan Iain Maxwell, University of Technology Sydney, Australia
Tane Moleta, Victoria University of Wellington, New Zealand
Jules Moloney, Deakin University, Australia
Volker Mueller, Bentley Systems, United States Rizal Muslimin, University of Sydney, Australia
Walaiporn Nakapan, Rangsit University, Thailand
Kiminori Nakazawa, Nihon University, Japan
Jonathan Nelson, Bond University, Australia Pirouz Nourian, Delft University of Technology, The Netherlands
Yeonjoo Oh, Hyundai Engineering and Construction, Republic of Korea
Yasunobu Onishi, Kumamoto University, Japan
Mine Özkar, Istanbul Technical University, Turkey Hyoung-June Park, University of Hawaii, United States
Alberto Pugnale, University of Melbourne, Australia
Ahmad Rafi, Multimedia University, Malaysia
Dagmar Reinhardt, University of Sydney, Australia
João Magalhães Rocha, University of Evora, Portugal
Stanislav Roudavski, University of Melbourne, Australia
Jaeho Ryu, Seoul National University of Science and Technology, Republic of Korea
Yasushi Sakai, Massachusetts Institute of Technology, United States Marc Aurel Schnabel, Victoria University of Wellington, New Zealand
Gerhard Schubert, Technical University of Munich, Germany
José Pedro Sousa, University of Porto, Portugal
A. Benjamin Spaeth, Cardiff University, United Kingdom Rudi Stouffs, National University of Singapore, Singapore

xviii Abel Tablada, National University of Singapore, Singapore
Atsushi Takizawa, Osaka City University, Japan
Peng Tang, Southeast University, China
Kostas Terzidis, Tongi University, China Ziyu Tong, Nanjing University, China
Bianca Toth, Arup - Brisbane, Australia
Jin Yeu Tsou, Chinese University of Hong Kong, Hong Kong
Thomas Tucker, Virginia Polytechnic Institute and State University, United States Lukas Treyer, ETH Zurich, Switzerland
Cetin Tuker, Mimar Sinan Fine Arts University, Turkey
Bige Tuncer, Singapore University of Technology and Design, Singapore
Pedro de Azambuja Varela, University of Porto, Portugal Tsung-Hsien Wang, Sheffield School of Architecture, United Kingdom
Glen Wash, Xi'an Jiaotong-Liverpool University, China
Shun Watanabe, University of Tsukuba, Japan
Claudia Westermann, Xi'an Jiaotong-Liverpool University, China Nicholas Williams, Aurecon Group, Australia
Albert Wiltsche, Graz University of Technology, Austria
Andrew Wit, Temple University, United States
Thomas Wortmann, Singapore University of Technology and Design, Singapore Ding Wowo, Nanjing University, China
Yen-Liang AW Wu, Asia University, Taiwan
Satoshi Yamada, Ritsumeikan University, Japan
Rongrong Yu, Griffith University, Australia Philip F. Yuan, Tongji University, China
Yannis Zavoleas, University of Newcastle, Australia

xix

TABLE OF CONTENTS
About CAADRIA i
Conference Theme iv
Keynote Speakers vi
Foreword xiv
International Review Committee xvi
Robotic Fabrication and Automation 7
Inflatable Architecture Production with Cable-Driven Robots 9Kristof Crolla, Paul Hung Hon Cheng, Ding Yuen Shan Chan,Arthur Ngo Foon Chan, Darwin Lau
Mathematical Design and Challenges in the Materialisation of aFree-From Shell
19
Zubin Khabazi
Robotic Fabrication of Lightweight Surface Assemblies 29Priscilla Teh, Chi Kwan Leung, Cheryl Ng, Felix Amtsberg,Stylianos Dritsas
Robotic Automatic Generation of Performance Model forNon-Uniform Linear Material via Deep Learning
39
Dan Luo, Jinsong Wang, Weiguo Xu
Cloudmagnet, A CFRP Framework for Flexible Architectures 49Andrew John Wit
Onsite Robotic Fabrication for Flexible Workspaces 59Dagmar Reinhardt, Christhina Candido, Densil Cabrera, DylanWozniak-O’Connor, Rodney Watt, Chris Bickerton, NinotschkaTitchkosky, Maryam Houda

2
Computational Design Processes, Theory and Education 69
Cyborg Sessions 71Shelby Doyle, Leslie Forehand, Erin Hunt, Nick Loughrey, SarahSchneider, Nick Senske
Spaceship Architecture 81Pavlos Fereos, Marios Tsiliakos, Clara Jaschke
“Real Virtuality” in the Process of Digitally Embedded Perception 91Chao Yan
Choreographed Architecture 101Enrica Fung, Kristof Crolla
Case Studies on the Integration of Algorithmic Design Processes inTraditional Design Workflows
111
Inês Caetano, Guilherme Ilunga, Catarina Belém, Rita Aguiar,Sofia Feist, Francisco Bastos, António Leitão
Exploring the Intersection of Music and Architecture Through SpatialImprovisation
121
Jeremy J. Ham
Generative, Algorithmic and Evolutionary Design 131
Discrete Swarm Logics 133Connor Hymes, Christoph Klemmt
Quasicrystal Structure Inspired Spatial Tessellation in GenerativeDesign
143
Pengyu Zhang, Weiguo Xu
Control of Morphological Variation Through Population Based FitnessCriteria
153
Mohammed Makki, Milad Showkatbakhsh
Efficiency versus Effectiveness 163Likai Wang, Patrick Janssen, Guohua Ji

3
Data-Driven Urban Porosity 173Jeroen van Ameijde, Yutao Song
Architectonics of Crystal Space 183Poltak Pandjaitan
Additive Manufacturing and Optimization Processes 193
Locally Differentiated Concrete by Digitally Controlled Injection 195RyanWei Shen Chee, Wei Lin Tan, Wei Hern Goh, Felix Amtsberg,Stylianos Dritsas
TOPO-JOINT 205Junho Chun, Juhun Lee, Daekwon Park
3D Printing Architecture: Towards Functional Space Frames 215Felix Raspall, Carlos Banon
Form Finding for 3D Printed Pedestrian Bridges 225Philip F. Yuan, Zhewen Chen, Liming Zhang
Structural Optimisation for 3D Printing Bespoke Geometries 235Maryam Houda, Dagmar Reinhardt
Bamboo³ 245Felix Amtsberg, Felix Raspall
Adaptive Control System for Smart Dynamic Casting 255Fabio Scotto, Ena Lloret Fritschi, Fabio Gramazio, MatthiasKohler, Robert J. Flatt
Digital Fabrication and Construction 265
Digital Form-Finding and Fabrication of Strained Gridshells withComplex Geometries
267
Philip F. Yuan, Hua Chai, Jinxi Jin
GLUEHOUSE 277Jonathan Nelson, Chris Knapp

4
{In}Formed Panels 287Basem Eid Mohamed, Mohamed ElKaftangui, Rana Zureikat
Cellular Cavity Structure and its Application on a Long-SpanForm-Found Shell Design
297
Philip F. Yuan, Xiang Wang, Xiang Wang
3D Growth Morphology - Tectonics of Custom Shapes in ReciprocalSystems
307
Rebekah Araullo
Digital Fabrication for Retroreflective Ceiling Treatment 317Adam Hannouch, Hugo Caldwell, Densil Cabrera, DagmarReinhardt
Adaptable Design-Construction Method for Remote-Location 327Naoki Imanishi, Hisayuki Ogihara, Cheddadi Mohammed Aqil,Kensuke Hotta, Yasushi Ikeda
Augmented and Mixed Reality in Architecture 337
Tracking Robustness and Green View Index Estimation of Augmentedand Diminished Reality for Environmental Design
339
Kazuya Inoue, Tomohiro Fukuda, Rui Cao, Nobuyoshi Yabuki
An Assembly Guidance System of Tou Kung Based on AugmentedReality
349
Zi-Ru Chen, Chien-Jung Liao, Chih-Hsing Chu
Rethinking and Designing the Key Behaviours of ArchitecturalResponsiveness in the Digital Age
359
Ju Hyun Lee, Ning Gu, Mark Taylor, Michael Ostwald
Augmented Reality Technology based Wind EnvironmentVisualization
369
Jiawei Yao, Yuqiong Lin, Yao Zhao, Chao Yan, Changlin Li, PhilipF. Yuan

5
Take a Look Through My Eyes: An Augmented Reality PlanningCommunication System
379
Michael Mühlhaus, Sarah Louise Jenney, Frank Petzold
Mixed Reality and Interactive Environments 389
SLAM-Based MR with Animated CFD for Building Design Simulation 391Yuehan Zhu, Tomohiro Fukuda, Nobuyoshi Yabuki
HOLOSYNC 401Narissa Bungbrakearti, Ben Cooper-Wooley, Jorke Odolphi, BenDoherty, Alessandra Fabbri, Nicole Gardner, M. Hank Haeusler
Sight Depth Illusion with Perforated Plane 411Ikuya Hanaoka, Seigo Tanaka, Alric Lee, Kensuke Hotta
Remote Studio Site Experiences: Investigating the Potential toDevelop the Immersive Site Visit
421
Danielle Oprean, Debora Verniz, Jiayan Zhao, Jan OliverWallgrün, José P. Duarte, Alexander Klippel
Integration of Virtual Reality, 3-D Eye-Tracking, and ProtocolAnalysis for Re-Designing Street Space
431
Le-Min Zhang, Tay-Sheng Jeng, Ruo-Xi Zhang
Virtual Reality and Interactive Environments 441
Virtual & Augmented Studio Environment (VASE) 443Tian Tian Lo, Marc Aurel Schnabel
Interactive Virtual Reality Tool for BIM Based on IFC 453Anirudh Nandavar, Frank Petzold, Jimmy Nassif, GerhardSchubert
The “Nine-Square Grid” Revisited: 9-Cube VR - An ExploratoryVirtual Reality Instruction Tool for Foundation Studios
463
James Hopfenblatt, Bimal Balakrishnan
Design Globally, Immerse Locally 473Xiaoran Huang, Marcus White, Mark Burry

6
Shared Immersive Environments for Parametric Model Manipulation 483Dominic Hawton, Ben Cooper-Wooley, Jorke Odolphi, BenDoherty, Alessandra Fabbri, Nicole Gardner, M. Hank Haeusler
Digital Culture 493Jessie Rogers, Marc Aurel Schnabel, Tian Tian Lo
From Agent to Avatar 503Ming Tang
Human-Computer Interaction and Wearables 513
Ludi: A Concurrent Physical and Digital Modeling Environment 515Lu Han, Daniel Cardoso Llach
Prototyping a Human-Building Interface with Multiple Mobile Robots 525Chin Koi Khoo, Rui Wang, Anastasia Globa, Jules Moloney
No Keyboard, No Mouse 535Ebrahim Poustinchi, Shengmian Wang, Gregory Luhan
Body-Borne Assistive Robots for Human-Dependent PrecisionConstruction
545
Alric Lee, Hirokazu Tei, Kensuke Hotta
MR. SAP: An Assistant Co-working with Architects in aTangible-Model-Based Design Process
555
Chengyu Sun, Yuze Wang, Zhaohua Zheng, Tongyu Sun, LauraRuiz
Integrated IR Vision Sensor for Online Clothing InsulationMeasurement
565
Siliang Lu, Erica Cochran Hameen

Robotic Fabrication andAutomation

8
INFLATABLE ARCHITECTURE PRODUCTION WITHCABLE-DRIVEN ROBOTS
KRISTOF CROLLA1, PAUL HUNG HON CHENG2,DING YUEN SHAN CHAN3, ARTHUR NGO FOON CHAN4 andDARWIN LAU51,2,3,4,5Chinese University of Hong Kong1,5{kristof.crolla|darwinlau}@cuhk.edu.hk 2,3{hhcheng|yschan03}@mae.cuhk.edu.hk [email protected]
Abstract. This paper argues for alternative methods for the in-situintegration of robotics in architectural construction. Rather thanpromoting off-site pre-fabrication through industrial robot applications,it advocates for suspended, light-weight, cable-driven robots that allowflexible and safe onsite implementation. This paper uses the topic oflarge-scale inflatable architectural realisation as a study case to test theapplication of such a robot, here with a laser-cutter as end-effecter.This preliminary study covers the design, development, prototyping,and practical testing of an inherently scale-less cable-driven laser-cuttersetup. This setup allows for the non-size specific cutting of inflatablestructures’ components which can be designed with common physicssimulation engines. The developed robotic proof of concept forms thebasis for several further and future study possibilities that merge thefield of architectural design and implementation with mechanical andautomation engineering.
Keywords. Cable-driven robots; In-situ robotic fabrication;Large-scale fabrication; Inflatable architecture; Cross-disciplinarily.
1. IntroductionWithin the past fifteen years, robotic applications in architecture have becomea major research sub-topic within digital architectural design and fabrication(Gramazio and Kohler, 2015). Generally, the research focus lies on off-siteapplications that use adapted, off-the-shelf robotic arms in the prefabrication ofarchitectural components. This working method restricts the possible architecturaloutcomes, as architectural construction is largely reduced to the on-site assemblyof building components that can be produced with locally or regionally availableCNC prefabrication means. This study counters this trend by focussing on theapplication of large-scale, cable-driven robots that are fully custom-built foron-site application.
Cable-driven parallel robots (CDPRs) are parallel mechanisms where rigidlinks of conventional manipulators are replaced by cables. Using CDPRs, thisresearch project seeks ways to take the benefits of robotic manufacture, such as
T. Fukuda, W. Huang, P. Janssen, K. Crolla, S. Alhadidi (eds.), Learning, Adapting and Prototyping,Proceedings of the 23rd International Conference of the Association for Computer-Aided ArchitecturalDesign Research in Asia (CAADRIA) 2018, Volume 1, 9-18. © 2018 and published by the Associationfor Computer-Aided Architectural Design Research in Asia (CAADRIA) in Hong Kong.

10 K. CROLLA ET AL.
speed, accuracy, strength, and precision, from isolated manufacturing facilitiesand integrate them into the onsite human construction process. Within roboticfabrication, CDPRs have the advantage of being able to operate in a very largearea. By controlling the length of cables from several stabilising anchor points,their reach can be a full-scale building site.
This paper discusses a preliminary study that focusses on the production oflarge-scale nonstandard inflatable structures that requires accurate fabrication.Commonly available physics simulation engines are used for the digital designof an (in this case geometrically rather basic) inflated surface. This surface isprocedurally split into developable strips that are robotically laser-cut (see Fig.1), manually stitched together, and finally inflated. The flexibility of both thearchitectural design geometry as well as the overall implementation procedureillustrates the potential to incorporate far more elaborate spatial diversity whilemaintaining on-site manufacturing efficiency.
Figure 1. Cable-driven laser-cutting end effector, cutting inflatable components.
2. Background2.1. LASER-CUTTING AND CABLE-DRIVEN ROBOTS
Laser-cutting offers an accurate and affordable manufacturing technique. It hasbeen widely used to cut different materials like metal, plastic, wood, etc. However,the capacity of laser-cutting machine is limited to a small cutting area, which isnot scalable in practice. Thus, the scale of its products is usually small and under1m x 1m. Larger scale laser-cutters are usually expensive and not portable for use

INFLATABLE ARCHITECTURE PRODUCTION WITH CABLE-DRIVENROBOTS
11
in different environment.CDPRs are a novel type of parallel mechanisms where cables are used in place
of traditional rigid links. The advantages of cable-driven robots include: goodpayload to robot weight ratio, large maximum workspaces, and ease of systemreconfiguration. Although cable-driven robots are easier to transport comparedto similar sized serial and traditional parallel robots, existing cable-driven robotstend to employ large and heavy winch actuators to control the cable. For morelightweight but dynamic applications, such as carrying a laser source to performlaser-cutting, existing cable-driven robot systems may not be the most suitable.
This work uses the Portable Cable-Driven Robot System (PoCaBot),developed by the authors (see Fig. 2). Lightweight cable winches and palm-sizedservo motors are used to result in a simple yet portable cable-driven robot that hasthe sufficient payload, speed and force capabilities for the proposed application.
Figure 2. Laboratory-based PoCaBot setup, with the laser-cutter suspended from eight winchactuators.
2.2. PNEUMATIC STRUCTURES
Pneumatic structures are a special type of membrane constructions that usepressure differences between the enclosed space and the exterior to give buildingstheir stable shape. Compressed air pre-tensions the membrane and forms thestructure of which the overall geometry is defined by its membrane pattern. Theform of a pneumatic structure can always be derived from the internal pressureappearing on the inside of the construction. Pneumatic structures follow strictphysical rules which influence the form-finding of the design process.
The form-finding potential of inflatable membranes has already beenextensively investigated (Otto, 1979). Also, the digital design of inflatablestructures has been studied widely, with user-friendly software and computationalmethods available to design overall inflatable architecture (Piker, 2013), as wellas to derive from these the segments optimised for fabrication (Skouras et all,

12 K. CROLLA ET AL.
2014). This design-to-fabrication process typically post-rationalizes complexgeometry into smaller developable parts that are fabricated through methodswhich take cutting pattern strategies and material constraints into account. Thesemanufactured segments are then stitched or welded together and inflated into finalassemblies that, thanks to the accurate simulation tools, closely approximate theoriginally desired form.
Today’s commonly available design tools are fast enough to warrantuser-friendly and interactive exploration by designers without loss of control overproducibility. However, the premise of these studies centres on the assumption thatoff-site computer-controlled fabrication is the medium used for fabrication. Whileshipping networks in principle allow for tailor-made components to be fabricatedand transported around the globe, this sometimes comes with unaffordable costs orunpractical timelines that prevent application in common practice. Also, given thescale of architectural applications, the required size of the CNC cutting equipmentmaymake tool access prohibitively difficult. Having a comparatively low-cost andhyper-flexible CNC cutting setup available on-site would bypass these restrictionsand enable a more creative and flexible design exploration for architects. Like howdigital design tools are spread globally today at minimal cost, this setup wouldrespond by increasing the distribution of means for flexible digital manufacture-aprimary goal of this post-digital architectural era.
3. Research MethodologyThis collaborative interdisciplinary research project combines both the field ofmechanical and automated engineering with architectural design and construction.It uses a cyclical action research methodology that is both diagnostic and remedialin its setup. The overarching research in cable-driven robotic solutions for on-sitearchitectural production is initiated with this sub-study of inflatable architecturalproduction. Through this study, main components of the robotic setup aredeveloped, and encountered issues are iteratively identified and resolved ina continuous problem-solving cycle. Like the typical industrial robotic armscommonly used in architectural robotic research, here too an interface is createdthat allows for different end-effectors to be attached to the computer-controlledsetup. Hence, this research project will form the basis for various futurestudies targeting other possible applications in architecture requiring differentend-effectors. As robotic setups are developed, possibilities and restrictions tothe architectural design solution space are identified. Feedback from derivedcriteria then allows for future overall project advancement. Gradually, the currentlab-based prototyping environment will be expanded until common constructionsite conditions are reached.
4. Main Components4.1. CRITERIA
There are several criteria to consider in the overall design. The machine elementsshould be either standardly available or easily produced. Operation, assembly,and installation of the machine should not require advanced skill or special

INFLATABLE ARCHITECTURE PRODUCTION WITH CABLE-DRIVENROBOTS
13
training. After knowing the workspace dimensions and when the motors arepositioned in place, the machine should be ready to run. Also, the setup should beinherently scale-less and in principle be transportable to varying site conditions.The laser-cutter should be sufficiently powerful for the application and shouldbe able to melt the plastic film when passing at moderate speed (e.g. 1cm/s).Safety is a priority, and the cutter should only burn at the focus. Objects offfocus should not be ignited. Also, human parts should not be burnt with accidentalexposure. Therefore, the laser-cutter should be well controlled and only cut underthe designated environment.
4.2. ARCHITECTURAL DESIGN
The first selected architectural prototype design is a simple hemisphere (seeFig. 3). This doubly curved shape is procedurally discretised into twentydevelopable strips that are digitally unrolled for laser-cutting from light-weightplastic film. This is done in the Rhino 3D modelling software environment,with the added Grasshopper procedural modeller plugin, and Kangaroo real-timephysics simulation engines. Rather than focussing on spatial design complexity,this basic platonic shape is selected as a straightforward first prototype, since itencompasses most complexities found in the much wider design solution spacefor inflatable architecture while maintaining a simplicity that avoids distractionfrom the current research objective. Resolving issues arising from this shape firstwill enable the consequent architectural design and production of a vastly widerrange of geometries.
Figure 3. Hemispherical design and developed flat strips for CNC cutting.
4.3. AUTOMATED MECHANICAL ENGINEERING DESIGN
PoCaBot consists of two major components: eight winch actuators and alaser-cutter (see Fig. 2). The winch actuators are palm-sized and consist of a spoolthat can wind up to 4m of cables and a smart servo motor which supports degreeof precision up to 0.088° (see Fig. 4). They can control the angle of spool rotationand thus the length of the cable precisely, theoretically up to 0.046mm. Everymotor is connected to a computer with a motor driver and is sending the lengthcommand simultaneously for the position of the end-effector. The laser-cutter is ablue visible laser with maximum power of 5.5W. The strength of laser is controlled

14 K. CROLLA ET AL.
by Arduino and allows for different cutting quality and engraving under differentspeed (see Fig. 5 and 6). The current lab-based prototype is using an aluminiumframe of size 4m x 4m x 2.3m (see Fig. 2). It is important to note that PoCaBotcan be easily mounted on any rigid surface, such as floor, walls, or even tree trunk,and that the aluminium frame is for demo purpose. When the system is appliedoutdoor, it is expected to be installed onto any fixed surface available on-site.
Figure 4. Winch actuator unit.
Figure 5. Laser unit.

INFLATABLE ARCHITECTURE PRODUCTION WITH CABLE-DRIVENROBOTS
15
Figure 6. The end-effector with installed laser unit.
PoCaBot uses eight cables, capable of controlling the laser tool piece in 6Degrees of Freedom, both translational and rotational, in 3D space. A singlePoCaBot actuator unit has a maximum torque of 17 Nm and a spool of 6 cmin diameter (see Fig. 4), which is sufficient for supporting a 1.8kg end-effector.Polyethylene fibre cables are used since polyethylene can withstand high tension(up to 48kg). This makes them perfect for carrying loads while maintaining cablerigidity. Also, they are inelastic, meaning the length of the cable remains stablefor a set period. The output power of laser can be controlled from 1 to 5.5W.This can be adjusted anytime during operation through Bluetooth communications.Due to the high temperature under the energetic laser beam, the plastic film melts,detaching cut components from the overall surface. In the current prototype, therelationship between cutting speed, laser strength, and quality of the cut edges isstudied to produce components that can be easily stitched by hand afterward.
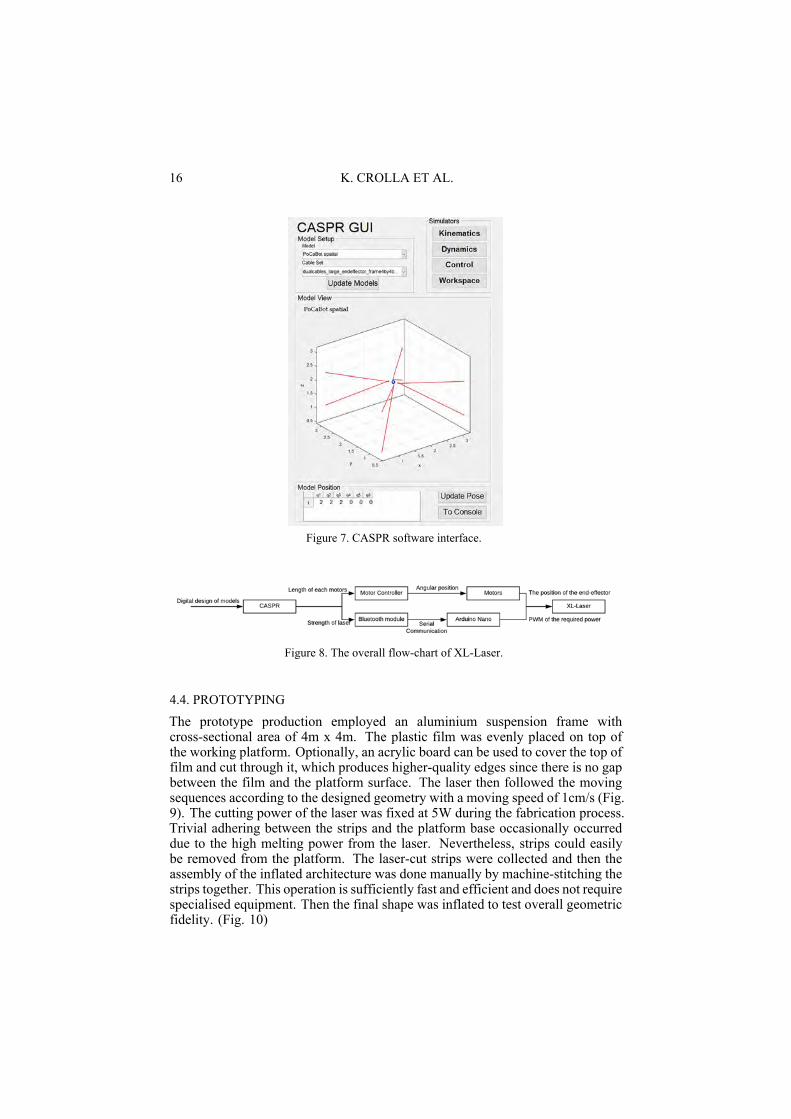
The control software takes the developed cut lines described in Section 4.2and translates them into coordinates for the edge cutting at different time instants.These are passed on to CASPR, an open source software platform that is used tocontrol CDPR, developed by the authors (see Fig. 7). The software will produce:1) the length, velocity, and acceleration information of each cable to the servomotors; and 2) the power of laser (see Fig. 8). The software carries kinematicscalculations, sending cable lengths and laser strength simultaneously. As a result,the end effector carries the laser emitter to the desire location of the cutting pathwith designated laser power.
16 K. CROLLA ET AL.
Figure 7. CASPR software interface.
Figure 8. The overall flow-chart of XL-Laser.
4.4. PROTOTYPING
The prototype production employed an aluminium suspension frame withcross-sectional area of 4m x 4m. The plastic film was evenly placed on top ofthe working platform. Optionally, an acrylic board can be used to cover the top offilm and cut through it, which produces higher-quality edges since there is no gapbetween the film and the platform surface. The laser then followed the movingsequences according to the designed geometry with a moving speed of 1cm/s (Fig.9). The cutting power of the laser was fixed at 5W during the fabrication process.Trivial adhering between the strips and the platform base occasionally occurreddue to the high melting power from the laser. Nevertheless, strips could easilybe removed from the platform. The laser-cut strips were collected and then theassembly of the inflated architecture was done manually by machine-stitching thestrips together. This operation is sufficiently fast and efficient and does not requirespecialised equipment. Then the final shape was inflated to test overall geometricfidelity. (Fig. 10)

INFLATABLE ARCHITECTURE PRODUCTION WITH CABLE-DRIVENROBOTS
17
Figure 9. Pictures of the laser-cutting in action.
Figure 10. Final inflated installation.
5. Assessment, discussion, and future researchThe final inflatable structure was successfully designed, manufactured, assembled,and inflated. Weaknesses in the final structure related more to material selectionand stitching techniques, rather than geometry design or component cutting.Additional incorporation of knowledge related to inflation mechanisms is neededto arrive at more sturdy solutions resilient to outdoor conditions. Regardless,the successful completion of the robotic setup and prototype illustrate howmaterialising geometrically complex inflatable structures locally is possible athigh speed and at low cost, thanks to the integrating of robotic fabrication intoonsite construction processes. With this basis, the study can now be expandedtowards broader architectural applications. This includes exporting the roboticsetup outside of the lab environment to test larger cutting patterns, expandingthe type of materials used to more lasting materials, and incorporating improvedstitching and inflation techniques.

18 K. CROLLA ET AL.
Beyond this, current developments of the cable-driven setup form a perfectplatform to further the overall research project through incorporation of alternativeend effectors. For this, funding acquisition is currently ongoing.
6. ConclusionThis research project demonstrates the potential of installing roboticmanufacturing into in-situ working environments and illustrates the increase oftypes of architecture that can hereby be locally produced. By combining humanstrengths with the benefits of robotics, and by distributing tasks appropriately, amore suitable and safe working environment can be created for the human labourforce. The onsite combination of human and robotic strengths allows for therethinking of a wide range of construction methods and systems, leading to adiversification of the possible architectural outcome.
Acknowledgements:
• Student helpers: Jason Kin Keung Lau, Sining Wang• The project research was supported by a Direct Grant for Research from the
Chinese University of Hong Kong’s Research Committee for project titled“Geometrically Complex Architectural Structures Produced by Large-ScaleCable Robots” (Project ID 4052109), as well as by the Chinese University ofHong Kong T-Stone Robotics Institute.
ReferencesBorgstrom, P.H., Borgstrom, N.P., Staeley, M.J., Sukhatme, G.S., Batalin, M.A. and Kaiser,
W.J.: 2009, Design and Implementation of NIMS3D, a 3-D Cabled Robot for ActuatedSensing Applications, IEEE Transactions on Robotics, 25(2), 325-339.
Bosscher, P., Williams, R. L. and Castro-Lacouture, D.: 2007, Cable-Suspended RoboticContour Crafting System, Automation in Construction, 17, 45-55.
Drüsedau, H., Dickson, M. and Hennicke, J.: 1983, Air Hall Handbook, Institut für leichteFlächentragwerke, Universität Stuttgart.
Gramazio, F. and Kohler, M.: 2014, Made by Robots: Challenging Architecture at the LargeScale – Architectural Design Vol. 229, John Wiley & Sons.
Gramazio, F. and Kohler, M.: 2015, The Robotic Touch: How Robots Change Architecture,Parks Book, Zurich.
Lau, D., Eden, J. and Oetomo, D.: 2016, CASPR: A Comprehensive Cable-Robot Analysisand Simulation Platform for the Research of Cable-Driven Parallel Robots, Proceedings ofIEEE/RSJ International Conference on Intelligent Robots and Systems, 3004-3011.
Lau, D., Oetomo, D. and Halgamuge, S. K.: 2013, Generalised Formulation and Analysis ofMultilink Parallel Cable-Driven Manipulators with Arbitrary Routing using Cable-RoutingMatrix, IEEE Transactions on Robotics, 29(5), 1102-1113.
Otto, F.: 1979, Growing and Dividing Pneus, Institut für leichte Flächentragwerke, UniversitätStuttgart.
Piker, D.P.: 2013, Kangaroo: Form finding with computational physics, Architectural Design,83, 136-137.
Skouras, M., Kaufmann, P., Garg, A., Bickel, B., Grinspun, E. and Gross, M.: 2014, DesigningInflatable Structures, Transactions on Graphics (TOG) - Proceedings of ACM SIGGRAPH2014, Volume 33 Issue 4, Article No. 63.

MATHEMATICAL DESIGN AND CHALLENGES IN THEMATERIALISATION OF A FREE-FROM SHELL
ZUBIN KHABAZI1PhD, Singapore University of Technology and [email protected]
Abstract. Mathematical design of free-form shells and theirmaterialisation is the main challenge of this paper that we tried toaddress through the realisation of two successive pavilion projects. Wediscuss how combination of explicit use of mathematical design of aminimal surfaces could be combined with the geometrical flexibilityof glass-fibre composites to result in a shell with efficient structuralperformance and material use. This has been tested here first usingfibre-composite panels and then sandwich-structured composite panels.We compared the result of both approaches based on their structural andgeometrical capacities.
Keywords. Mathematical Design; Material DistributionOptimisation; Robotic Hot-Wire Cutting; Free-Form Shell;Customised Sandwich-Structured Composites.
1. IntroductionAs Mark and Jane Burry pointed in their seminal publication “The NewMathematics of Architecture”, mathematical design is a contemporary nexusof design endeavour, which could result in new solutions for challenges thatbuilt environment faces (Burry, Burry, 2010). It is true that the use of explicitmath in computational design platforms has increased, and this resulted in a newlanguage of geometries with complex configuration of undrawable elements. Butmathematics is not just about the scenography of forms, and it expands towardsthe notion of materiality, either directly, or in an indirect fashion.
Through the realisation of two successive pavilion projects, we showcasehow combination of mathematical design of free-form surfaces with geometricalflexibility of composite material systems, helped to achieve “efficient” design, interms of structural performance and material use. This was the result of explicitformulation of minimal surfaces to achieve global optimum form, and implicitutilisation of mathematical-optimisation tools to have local control over materialdistribution.
A minimal surface (in its physical definition) represents a state in which allforces acting upon a surface are in equilibrium. Because of this property, theylead to less material use in the construction of thin shells, pioneered by Frei Ottoint he institute for Lightweight Structures in the University of Stuttgart (Otto,
T. Fukuda, W. Huang, P. Janssen, K. Crolla, S. Alhadidi (eds.), Learning, Adapting and Prototyping,Proceedings of the 23rd International Conference of the Association for Computer-Aided ArchitecturalDesign Research in Asia (CAADRIA) 2018, Volume 1, 19-28. © 2018 and published by the Association forComputer-Aided Architectural Design Research in Asia (CAADRIA) in Hong Kong.

20 Z. KHABAZI
Rasch, 1995). Our idea in this research is also to design a pavilion with anoptimum minimal surface, to fabricate it with thin composite materials. Thiseducational pavilion, designed with a Gyroid periodic minimal surface, and castover a digitally-fabricated fabric-formwork. The shell of this pavilion which is castwith three coats of fibreglass and resin, buckled at some areas and failed to performstructurally as expected. This has pushed our research to further investigatedesign-fabrication solutions for better structural intensity, through the realisationof the second pavilion with different design and materialisation approach.
2. Design and Fabrication of Mathematical Minimal Surfaces withFabric-FormworksWe initially started this project by focusing on periodic minimal surfaces andin particular a Gyroid minimal surface as a departure point. We targeted suchcomplex geometries with the idea that while their forms are optimum in termsof load transfer and equilibrium of tensile-compressive loads in theory, they willprovide us opportunities to face fabrication challenges in their realisation throughthin composite shells. It is possible to model a Gyroid geometrically (throughits boundary conditions) or mathematically (with math functions), here we usedthe math function, created the basic point cloud, upon which we build up a meshsurface. The function for a Gyroid minimal surface is:
f(x, y, z) = sin (x) · cos (y) + sin (y) · cos (z) + sin (z) · cos (x) (1)We used a non-symmetrical numerical domain for x,y and z and numericallyand also geometrically manipulated the form, to achieve a non-repetitive andnon-symmetric point-cloud to be converted into a mesh surface. Since suchmanipulations changed the initial geometry of the minimal surface, we appliedtension forces inside its fixed edges to get the state of equilibrium again, like atensile stretched fabric. We used Rhino, Grasshopper and Kangaroo platforms(a physics engine plug-in for Grasshopper developed by Daniel Piker) for thisoperations. The resultant mesh geometry has been subdivided with Catmull-Clarksubdivision to achieve smoother surface quality. The design product was boundedinto a cube of 4*4*4 m with fixed edges (Figure 1).
To be able to fabricate large-scale, generic, double-curved, smooth surfaces,we offered to use Fabric-Formwork technique to be cast with composites. A‘Fabric-Formwork’ (FFW) is a type of formwork for casting purposes, while astructural membrane represents the form that wanted to be built (Veenendaal, Westet al. 2011). In this case, a rigid formwork would hold the stretched fabric, whichcan take curve forms. Non-Elastic fabrics could be used for casting fix shapes,or elastic ones, to let the casting product get some random variations under thepressure of the cast. If the casting process needs pouring of material inside a hollowspace (like concrete), then the fabric should be double-layered. But in the case ofcomposites, one layer of fabric is enough, which remains attached to the composite,but does not play a noticeable role in its stiffness. While the fabric represents thedesigned geometry for the fabrication, the rigid formwork will be removed aftersolidification of the fabric (Figure 2). We used this method to fabricate our projectwith several panels and assembled it together with small metal plates (Figure 3).

MATHEMATICAL DESIGN AND CHALLENGES IN THEMATERIALISATION OF A FREE-FROM SHELL
21
Figure 1. Final design product out of the mathematical design process using a Gyroid minimalsurface, to be fabricated with fabric form-work and composite materials. .
Figure 2. A CNC cut formwork, and its Fabric-Formwork covered with composite materials tomake a piece.
Our initial motivation of the project was to design double-curved surfacesthrough mathematical definitions in order to fabricate them using FFW with theminimum thickness (material use) possible. After testing this strategy in ourpavilion, we faced two different issues for further investigations: The first oneis about inaccuracy in fabrication and the second one is reflecting its structuralissues. While we addressed the research on the method of fabrication, and how toimprove its accuracy in a different paper (Khabazi, 2015), this paper concentrateson the studies of structural performance in the design process.
22 Z. KHABAZI
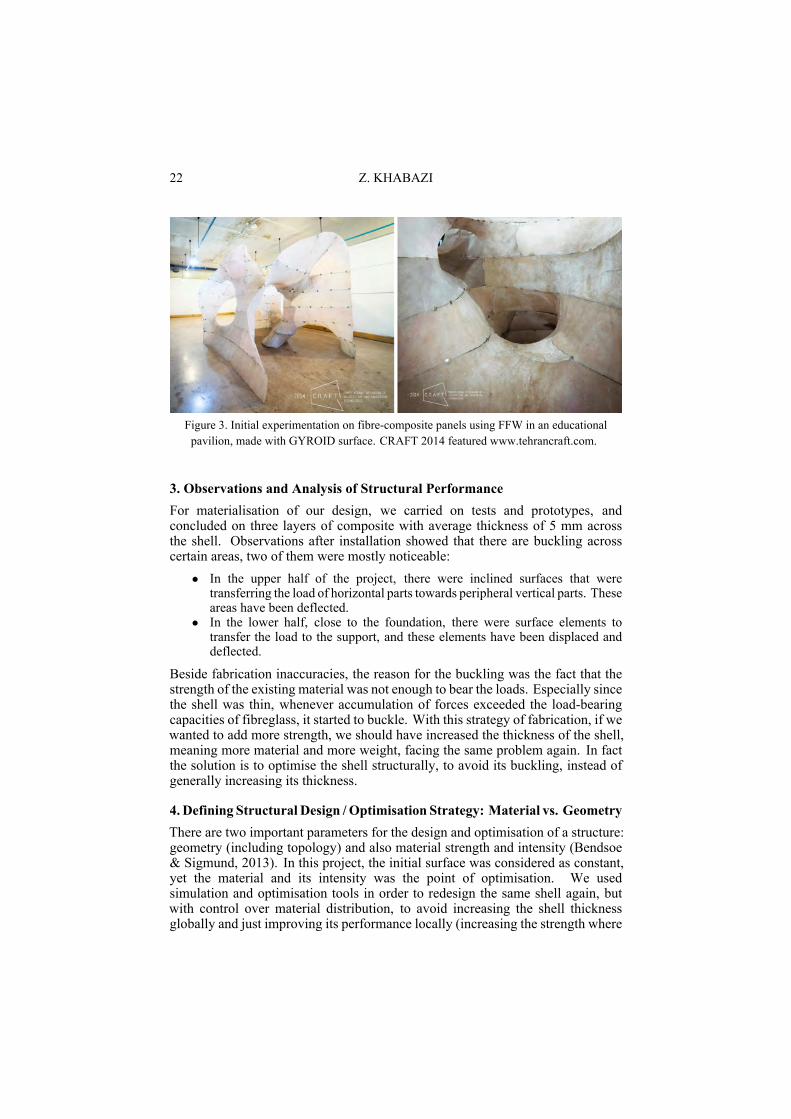
Figure 3. Initial experimentation on fibre-composite panels using FFW in an educationalpavilion, made with GYROID surface. CRAFT 2014 featured www.tehrancraft.com.
3. Observations and Analysis of Structural PerformanceFor materialisation of our design, we carried on tests and prototypes, andconcluded on three layers of composite with average thickness of 5 mm acrossthe shell. Observations after installation showed that there are buckling acrosscertain areas, two of them were mostly noticeable:
• In the upper half of the project, there were inclined surfaces that weretransferring the load of horizontal parts towards peripheral vertical parts. Theseareas have been deflected.
• In the lower half, close to the foundation, there were surface elements totransfer the load to the support, and these elements have been displaced anddeflected.
Beside fabrication inaccuracies, the reason for the buckling was the fact that thestrength of the existing material was not enough to bear the loads. Especially sincethe shell was thin, whenever accumulation of forces exceeded the load-bearingcapacities of fibreglass, it started to buckle. With this strategy of fabrication, if wewanted to add more strength, we should have increased the thickness of the shell,meaning more material and more weight, facing the same problem again. In factthe solution is to optimise the shell structurally, to avoid its buckling, instead ofgenerally increasing its thickness.
4. Defining Structural Design /Optimisation Strategy: Material vs. GeometryThere are two important parameters for the design and optimisation of a structure:geometry (including topology) and also material strength and intensity (Bendsoe& Sigmund, 2013). In this project, the initial surface was considered as constant,yet the material and its intensity was the point of optimisation. We usedsimulation and optimisation tools in order to redesign the same shell again, butwith control over material distribution, to avoid increasing the shell thicknessglobally and just improving its performance locally (increasing the strength where

MATHEMATICAL DESIGN AND CHALLENGES IN THEMATERIALISATION OF A FREE-FROM SHELL
23
needed). This resulted in the design of a variable thickness shell, where thisthickness corresponds to the local loading conditions. The strategy here is to use‘Shell Optimisation’ technique, in order to achieve the optimal solution for thematerial distribution, in the defined design condition. This tool works based ontopology optimisation and in essence removes excessive material from a designspace with defined loading and material properties in an iterative fashion. Ifthe design product is being informed with mechanical properties of materialand loading/supporting conditions, the shell optimisation tool will provide thethickness of material for different areas. However, fabrication precision becomescritical when making a curved shell with non-homogeneous depth.
A normal composite panel is usually thin and rigid, difficult with manual toolsand processes to control its thickness and to apply gradual changes in its materialdistribution. We addressed this by implementing sandwich structure composites toaccommodate the varying thickness in the system. Composite sandwich-structuresare panels, with two thin layers of high-strength composites covering a thicklow-strength core, were assembled together, adding strength and bending stiffnessto composites in an economical way (Campbell, 2010). While these panelsshow improvements in structural behaviour, their geometries are very restricted.Industrial made panels are flat with standardised sizes and thicknesses. It is almostimpossible to use them for the construction of non-standard and free-form designs,unless being customised.
Customised Sandwich-Structured Composites (CSSC) are non-standard panelswith customisable geometry and thickness. The idea is to digitally fabricatetheir low-strength core with polystyrene and use it as a formwork for applyingcomposites to their faces as the hi-strength part. In this way, the complex geometryof the shell could be projected to that core for digital fabrication processes,which could accommodate diversity and customisation, then being completed byapplying fibre and resin manually. This method fulfils the conditions of the projectboth in terms of fabrication/realisation and also structural performance/materialoptimisation.
5. Material Distribution and Optimisation Process5.1. IMPLEMENTATION OF MECHANICAL PROPERTIES OFFIBRE-COMPOSITE
We need to introduce material properties to our Gyroid minimal surfaceby implementing mechanical properties of fibre-composites in order to seehow it performs under real loading conditions. Here we used Millipede(a structural analysis and optimisation plug-in for Grasshopper, developed bySawako Kaijima and Panagiotis Michalatos, www.sawapan.eu) to apply materialproperties onto the mesh for its simulation. Glass fibre is a type of fibre that iscombined with polyester resin to make the composite. There are different types ofglass fibre where we used the mat type which encompasses a random distributionof discontinuous fibres. Fibres could be combined with resin in one layer, or couldbe laminated in different layers to provide more strength.
We studied mechanical properties of glass-fibre composites (Table 1) in

24 Z. KHABAZI
order to implement in the digital platform (AIMS-International) (Barbero 2010)(Nicolais, Meo et al. 2011). The most important point is that it is a brittle material,means that in its stress-strain diagram, there is not a plastic range, and after certainstress loading, it will break (Table 1 Right) and we should avoid a situation withthe accumulation of stresses in that range. Now the pure mesh surface has beeninformed with its physical material properties, anchor points and loads, we cananalyse its structural behaviour, and observe deflections, displacements, etc. Wecan use this set up to run shell optimisation, to optimise material distribution overthe shell.
Table 1. Left: Mechanical properties of glass-fibre composite with polyester resin and choppedstrand mat laminate 30% E-glass, Right: The Stress-Strain curve of glass-fibre composite.
5.2. SHELL OPTIMISATION
In order to optimise material distribution over the surface, we used shelloptimisation by giving a homogenous thickness of 10 cm to the initial surface inorder to remove the excessive material and provide the optimised thickness in aniterative way. The target optimisation factor has been set to 50% and incrementallyincreased by 10% up to 100% to see how far the material distribution could bechanged and how light the final output could be. It is important at each iteration tocheck the deflection and displacement, not to reach the material limits mentionedbefore.
Table 2 compares three different states of the project: the original model thatwe built, the initial model before optimisation and the optimised model. It impliesthat optimisation process has removed around 70% of the excessive material fromthe initial 10 cm thick shell. The result is heavier than the original model, henceit secures the structural performance of the project under loading conditions. Theresult of the shell optimisation is a voxelised mesh that encompasses thicknessthrough its discrete elements (Figure 4). Now having access to the thickness dataas representative of material distribution, it should be transferred into fabricationphase to be implemented in the physical output.

MATHEMATICAL DESIGN AND CHALLENGES IN THEMATERIALISATION OF A FREE-FROM SHELL
25
Table 2. Comparison of optimisation values for different design states.
Figure 4. The result of the shell optimisation tool, a voxelised mesh with thickness, andexample of a FFW part which does not accommodate thickness change.
6. Materialisation of a Variable-Thickness CSSC Panel using RoboticFabricationIn order to study fabrication potentials of the method, we initiated the secondpavilion project, designed with explicit math definition of a Plücker Conoid:
x = v · cos (u), y = v · sin (u), z = sin (2u) (2)Essentially we used Plücker Conoid because it is a ruled surface, making it easyat this stage of the research to fabricate the resulted form with a robotic hot-wirecutting. We manipulated the original form with some extra mathematical changesto U,V values and used different numerical domains to achieve a non-symmetric,non-standard design. We completed the process by applying tensile forcesagain and then running shell optimisation for material distribution, consideringthe mechanical properties of CSSC material system this time. The output is amesh with thickness which we subdivided into panels as representative of thepolystyrene core of the sandwich structures. These panels are curved pieces withnon-identical shapes. As mentioned, the method for fabrication of these cores wasrobotic hot-wire cutting. It is faster and more efficient than methods like CNCmilling foam. We subdivided the shell using a custom C-Sharp code, meeting thenecessities of bulk material size and machine access and limitations. We generated

26 Z. KHABAZI
the fabrication code and robot simulation using Kuka PRC (a parametric robotcontroller plug-in for Grasshopper, www.robotsinarchitecture.org). After cutting,we applied the fibre composite on both faces of each panel manually. The restof the process included drying, curing, assembling, patching and overlapping andfinal finishing of the work.
Because of the thick core of the sandwich panels (ranging between 4 - 17 cm),the assembly process was easy and more accurate. Since we applied only one layerof composite on each face of the panel, the overall weight of the panel was low,and the speed of applying and drying was relatively fast. The cost of the materialsalso drop down because of the use of low-cost polystyrene foam and reductionof the fibre-resin consumption in the project. We did not face any deflectionin the structure. All in all, removal of external formworks from the productionprocedure, having more accuracy control in comparison with fabric formworks,and less economical cost, in addition to the extra stiffness of the panels, made thispavilion more successful than the previous work (Figures 5-7).
Figure 5. Design and fabrication process: stage one: design, analysis and shell optimisation toget material distribution, stage two: subdivision of the shell into parts to be cut with a robotic
hot-wire cutter.
Figure 6. A sample polystyrene panel after robotic cut and manual application of composite.

MATHEMATICAL DESIGN AND CHALLENGES IN THEMATERIALISATION OF A FREE-FROM SHELL
27
Figure 7. Inside and outside of the pavilion after assembly.
7. Discussion and OutlookTo discuss the outcome, we need to summarise the process: We generate a surfacewith the explicit use of mathematical formulas (a minimal surface for instance),then we may, or may not, apply some mathematical or geometrical manipulationsonto the surface (like changing the numerical domain in which we generate thesurface, or modifying the geometry, i.e. trimming it to fit inside a bounding box).In this stage, we need to define the physical condition of the surface which isits support condition, fixed points/edges and loading. Based on the geometricalchanges if we applied, we may need to run some surface relaxation or applicationof tensile forces as in membrane structures to reach the state of equilibrium. Thenby defining the material condition (any parameter that the software needs (likeModulus of Elasticity, Poisson Ratio, Yield Strength, Density and so on) we cangive the surface an initial thickness, a homogenous thickness all around. Runningthe topology optimisation, we can start carving out the excess material up to thelimits of the structure, where for example its deflection is in the acceptable range ofthe material. Finished with the optimisation, the next stage is to prepare the outputfor fabrication, which in this case is robotic fabrication using hot-wire cutting to cutthe low-strength core of the composite panels out of foam blocks. In our scenario,application of fibre composite and assembly of the product is manual.
One of the main questions about this research project is about its first stage,the selection of any specific surface class and its formulation: How we chooseone and how it responds to our spatial needs. This question is not central to thisresearch, yet we see a noticeable number of projects these days using the samemethod of design. So we tried to push its fabrication and materialisation furtherby choosing some examples. Yet we can see the potentials of these surfaces to beoptimised with the single parameter of ‘material use’ and get more efficient results.There exist no particular relation between spatial quality and any math formula,but current design examples show that such surfaces have lots of potentials fordesigning contemporary spaces in the work of designers, and our research is tomaterialise such designs. A vast catalogue of such surfaces and possibility ofgeometrical manipulations would enable designers to adapt them to their designscenarios in the future.

28 Z. KHABAZI
Another area of further questions would be the method of fabrication andespecially the limitations of hot-wire cutting as a generic solution for this system.We purposefully used a Plücker Conoid to generate a ruled surface to suit ourfabrication technique of hot-wire cutting, but this is not the case for all othersurface types. We used FFW for double-curved surfaces, but we lost thicknessinformation, and we used CSSC but we changed double curvature into singlecurvature. We can embed thickness information into FFW but it will include alot of manual work and will take us back to the idea of fibre composite instead ofsandwich panels which is expensive. On the other hand, there are researches abouthot-wire cutting double-curved forms but still in early stages. There is always thepossibility to robotically mill the piece, but it is dramatically time-consuming forlarge-scale projects. While contemplating about all different solutions and theirinherent limitations, we are also searching for other possible techniques throughour future investigations.
Finally, we will continue our research on the embedding of multiple layersof information from design to materialisation and fabrication into one inclusiveplatform, and under the control of designer in order to go beyond the conventionalmethods of design, and include all active forces in the process, in order to achievemore efficient outputs.
AcknowledgementBoth pavilion projects are the result of CRAFT workshops, co-directedwith Mehran Davari, including the work of students listed in the websitewww.tehrancraft.com. Further studies and analysis are the work of the author inSingapore University of Technology and Design.
References“Fiberglass Structural Design Manual” : 2016. Available from AIMS-International<www.ecfi
breglasssupplies.co.uk/t-GlassReinforcedPlastics.aspx> (accessed 26 Sep 2016).Barbero, E. J.: 2010, Introduction to Composite Materials Design, CRC Press.Bendsoe, M. P. and Sigmund, O.: 2013, Topology optimization: Theory, methods and
applications, Springer.Burry, M. and Burry, J.: 2010, The New Mathematics of Architecture, Thames and Hudson.Campbell, F. C.: 2010, Structural Composite Materials, ASM International.Iwamoto, L.: 2009, Digital fabrications : architectural and material techniques, Princeton
Architectural Press.Khabazi, Z.: 2015, Customized Fabric-Formworks using Digital Fabrication for the construction
of Free-from Architecture, Proceedings of IASS 2015, Amsterdam.Nicolais, L. and Meo, M.: 2011, Composite Materials, A Vision for the Future, Springer.Otto, F. and Rasch, B.: 1995, finding form : towards an architecture of the Minimal, Axel
Menges.Veenendaal, D., West, M. and Block, P.: 2011, History and overview of fabric formwork: using
fabrics for concrete casting, Structural Concrete, 12(3), 164 - 177.

ROBOTIC FABRICATION OF LIGHTWEIGHT SURFACEASSEMBLIES
By Parametric Delamination of Polyurethane-Fabric Components
PRISCILLA TEH1, CHI KWAN LEUNG2, CHERYL NG3,FELIX AMTSBERG4 and STYLIANOS DRITSAS51,2,3,4,5Singapore University of Technology and Design1,2,3{priscilla_teh|chikwan_leung|cheryl_ng}@alumni.sutd.edu.sg4,5{felix_amtsberg|stylianosdritsas}@sutd.edu.sg
Abstract. This paper presents research work on digital fabrication andarchitectural robotics with the intent of creating lightweight compositematerial spatial assemblies comprised of parametrically differentiatedcomponents. Our process deploys one-part polyurethane (PU) foamto form units which after force-induced delamination can be stretchedto span space and aggregated into surface assemblies at extremelylow densities. The process developed and design artefacts produced,investigate creative opportunities in common construction material androbotic digital fabrication methods beyond conventional additive andsubtractive manufacturing.
Keywords. Material Studies; Digital Fabrication; ArchitecturalRobotics; Parametric Design; .
1. IntroductionThe popularization of industrial robotics within the field of architectural digitaldesign and fabrication (Kolarevic, 2003; Iwamoto, 2009; Dunn 2012; Glynnand Sheil, 2012) enabled the exploration of creative materialization processeswhich often transcend norms in current methods of architectural production(Brell-Cockcan and Braumann, 2012; McGee and Ponce de Leon, 2014;Reinhardt, Saunders and Burry, 2016). Such an ability to affect materiality withunprecedented precision and effortless experimentation, not only allows one tobroaden the realm of design possibilities but perhaps gain insight into everydaymaterials which are often approached from a narrow utilitarian perspective.Polyurethane foam, a material typically employed for thermal insulation, waterleakage control and as a construction adhesive, has unique properties such asits phase change, self-bonding and extremely low-density characteristics that canfoster such creative design experimentation.
Polymeric rigid foams, for instance polystyrene (PS) and polyurethane (PU),as well as elastomeric foams, such as Neoprene and ethylene-vinyl acetate (EVA),have been extensively used in digital fabrication mainly due to their low-density
T. Fukuda, W. Huang, P. Janssen, K. Crolla, S. Alhadidi (eds.), Learning, Adapting and Prototyping,Proceedings of the 23rd International Conference of the Association for Computer-Aided ArchitecturalDesign Research in Asia (CAADRIA) 2018, Volume 1, 29-38. © 2018 and published by the Association forComputer-Aided Architectural Design Research in Asia (CAADRIA) in Hong Kong.

30 P. TEH ET AL.
properties. Mounting or pick-and-placing foam blocks can be achieved evenwith ultra-lightweight robots such as aerial drones (Willman et al, 2012). Inaddition, foams are highly machinable, as the loads excreted on tooling arewithin the payload capabilities of most robotic systems. Exemplary applicationsand processes include CNC machining (Trummer et al, 2012), hot wire cutting(Søndergaard et al, 2016) as well as extrusion (Snooks and Jahn, 2016). Relevantto our work is research by REX|LAB (Colleti 2013, Tamre et al, 2014, Kinget al 2014) and ETH (Gramazio, 2007) where PU foam is stretched duringits phase-change state and in the work of Johns and Foley (2012) where PUis deployed for irregular tiling of 3D surfaces as a liquid foaming adhesive.The approach presented here, deploys PU foam as a lightweight compositematerial core, used for adhesion and suspension of heterogenous skin surfaces,namely woven fabrics and timber sheets. The concept is affine to laminatecomposites, however, unlike standardized panels of uniform thickness, we explorethe production of variable depth components with some kinematic capabilitiesresidual of the weak filaments suspending the top and bottom surfaces.
2. Process OverviewOur experimental setup is comprised of an industrial robotic system (ABBIRB1200) for which we designed and built a multipurpose end-effector. The robotdispenses a prescribed amount of one-part PU resin and activates it with a smallamount of water by depressing the dosing pumps (Figure 1). A motorized steeringimplement thoroughlymixes the resin for a few seconds to ensure even distribution.A few minutes later, and before the PU begins foaming, the robot disperses theresin on a base plate surface. The same end-effector features another equally sizedplate covered with a patch of fabric. For the next few minutes the robot depressesand stretches the foam repeatedly producing an array of fine filaments spanningbetween the two plates as the result of progressive delamination of the foam fromthe plates. Once the foam is about to set, the robot assumes its final postureallowing the plates to be spaced apart at specific distance and orientation. Thecured component is then removed from the jig and the process restarts resultinginto a sequence of surface elements that can be aggregated into a three-dimensionalassembly of variable thickness. The self-adhesive properties of PU are exploitedfor uniting individual elements into the whole rather than introducing mechanicaljoints. The infusion of PU into fabric reinforces the surface like engineeredlaminate woven mat composites.
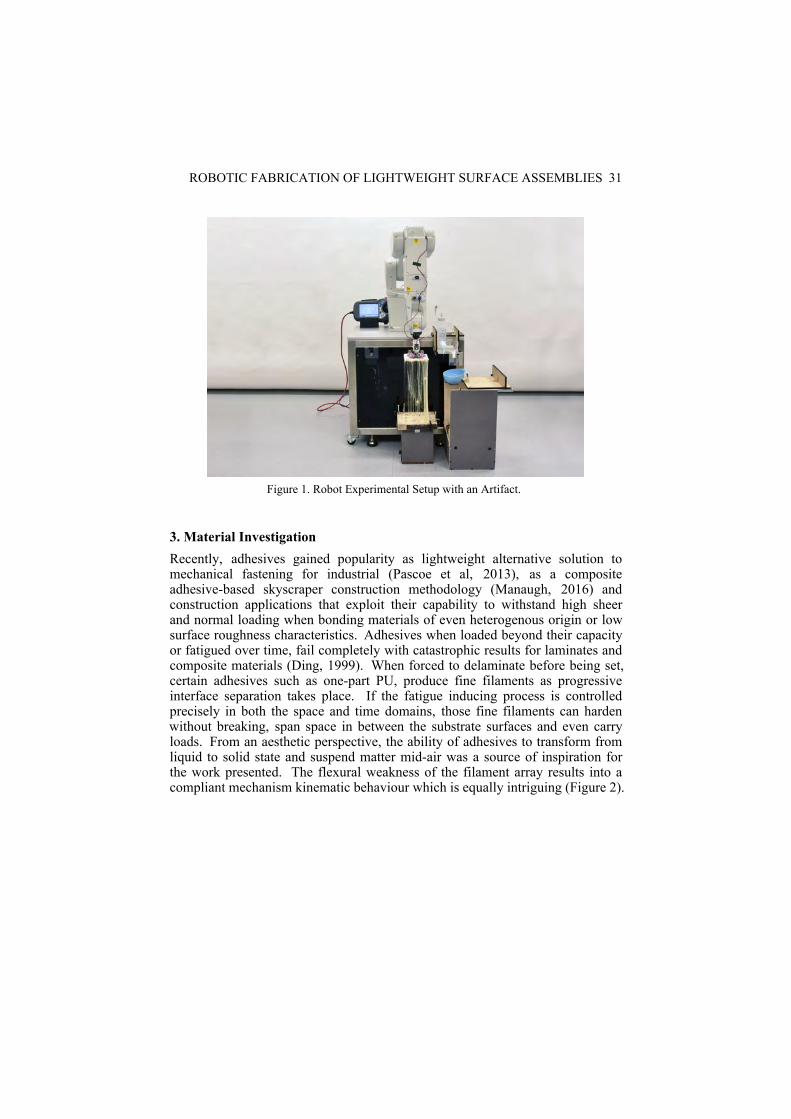
ROBOTIC FABRICATION OF LIGHTWEIGHT SURFACE ASSEMBLIES 31
Figure 1. Robot Experimental Setup with an Artifact.
3. Material InvestigationRecently, adhesives gained popularity as lightweight alternative solution tomechanical fastening for industrial (Pascoe et al, 2013), as a compositeadhesive-based skyscraper construction methodology (Manaugh, 2016) andconstruction applications that exploit their capability to withstand high sheerand normal loading when bonding materials of even heterogenous origin or lowsurface roughness characteristics. Adhesives when loaded beyond their capacityor fatigued over time, fail completely with catastrophic results for laminates andcomposite materials (Ding, 1999). When forced to delaminate before being set,certain adhesives such as one-part PU, produce fine filaments as progressiveinterface separation takes place. If the fatigue inducing process is controlledprecisely in both the space and time domains, those fine filaments can hardenwithout breaking, span space in between the substrate surfaces and even carryloads. From an aesthetic perspective, the ability of adhesives to transform fromliquid to solid state and suspend matter mid-air was a source of inspiration forthe work presented. The flexural weakness of the filament array results into acompliant mechanism kinematic behaviour which is equally intriguing (Figure 2).
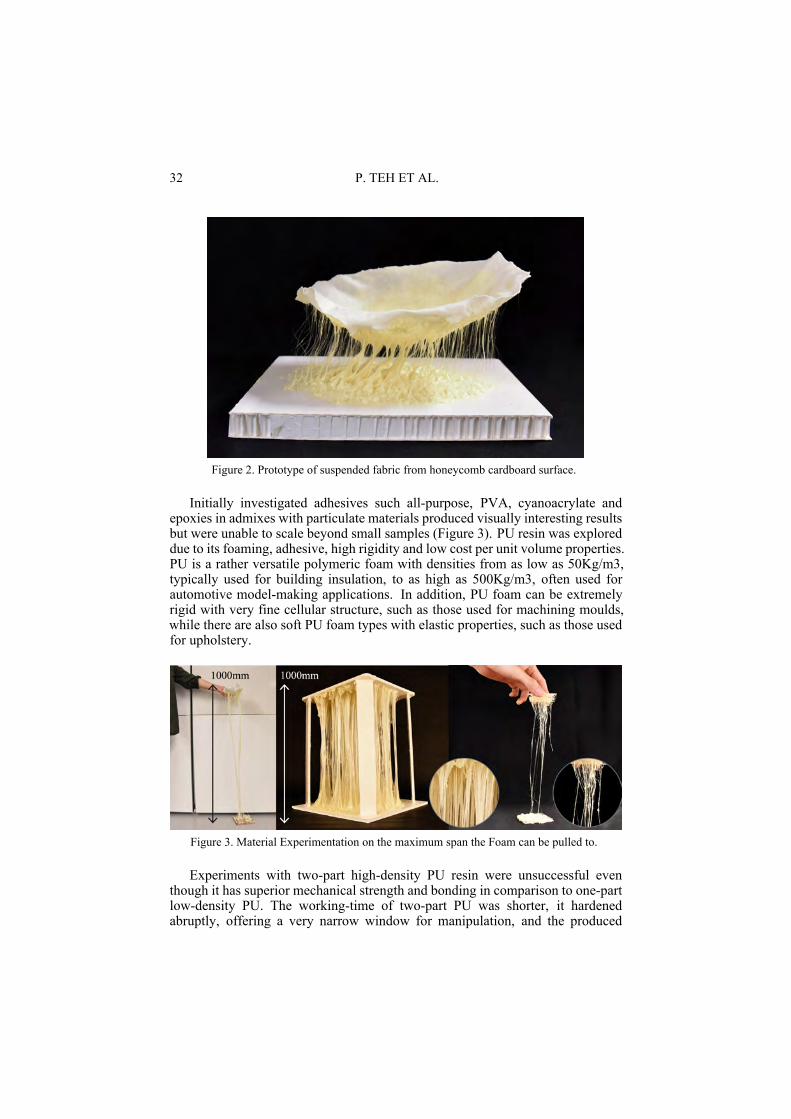
32 P. TEH ET AL.
Figure 2. Prototype of suspended fabric from honeycomb cardboard surface.
Initially investigated adhesives such all-purpose, PVA, cyanoacrylate andepoxies in admixes with particulate materials produced visually interesting resultsbut were unable to scale beyond small samples (Figure 3). PU resin was exploreddue to its foaming, adhesive, high rigidity and low cost per unit volume properties.PU is a rather versatile polymeric foam with densities from as low as 50Kg/m3,typically used for building insulation, to as high as 500Kg/m3, often used forautomotive model-making applications. In addition, PU foam can be extremelyrigid with very fine cellular structure, such as those used for machining moulds,while there are also soft PU foam types with elastic properties, such as those usedfor upholstery.
Figure 3. Material Experimentation on the maximum span the Foam can be pulled to.
Experiments with two-part high-density PU resin were unsuccessful eventhough it has superior mechanical strength and bonding in comparison to one-partlow-density PU. The working-time of two-part PU was shorter, it hardenedabruptly, offering a very narrow window for manipulation, and the produced

ROBOTIC FABRICATION OF LIGHTWEIGHT SURFACE ASSEMBLIES 33
filaments were brittle. One-part PU is used as construction sealant in cases ofleakage control and in wood working (Vick and Okkonen, 1998). The termone-part is a misnomer as it requires activation by water, instead of a catalyst.Water may already exist in context such as in the case of leakages and atmosphericmoisture or externally introduced. It has a working-time of approximately 20minbefore it hardens and retains some of its elasticity past curing. More importantly,it can be kneaded to force evacuation of carbon dioxide produced during thechemical transformation which is the source of the rather large cavities in pouredPU blocks. Beyond mechanical degassing, kneading produces filaments that canbe stretched as far as 1000mm without breaking (Figure 4), while retaining thesmooth finish found on the exterior of extruded PU blobs (Figure 3).
Figure 4. Material Experimentation of different Polyurethane Foam with Additivesand varyingamounts of Water.
4. Electromechanical SystemWhile the perspective for this work is oriented towards artwork production andaesthetic investigation of construction materials, the digital fabrication processdeveloped is inspired by industrial automation. Unlike common applications ofrobotics in digital fabrication, where one or more machines perform a singletask, for instance pick-and-place assembly, we approached our system froma multi-purpose or swiss army knife perspective. The robot along additional

34 P. TEH ET AL.
electromechanical components integrated, performs such tasks as: (a) Volumetricdosing of water, (b) Mixing two components for activation, (c) Dispensing theliquid material onto the pressure plates, (d) Kneading the foam for producingfilaments, and (e) Forming the expanded tiles by holding the material in predefinedspatial configurations (Figure 5).
To achievemulti-purpose functionality, we designed a series of stationary partsmounted on the mobile workbench hosting the robot, namely the resin and waterdispensers, using off-the-shelf domestic products such as a piston pump bottles andfunnels; fabricated a table/floor-mount apparatus serving as a stationary clamp ordie for the lower part of the PU tiles; and developed a robot end-effector comprisedof a passive pressure plate used for kneading and a hand-held mixer electricallyconnected to the controller. The sequence of motion tasks performed by therobot was carefully choreographed for avoidance of collisions, careful actuationof external mechanical parts, and repeatability to reduce variations of an arguablyalready complex process.
Figure 5. Sequence of robot motion tasks: (1) Volumetric dosing of water (2) Move to tray-inposition (3) Mixing two components for activation (4) Dispensing liquid material onto
pressure plates (5) Move to tray-out position (6) Kneading the foam for producing filamentsand forming the expanded tiles by holding the material in predefined spatial configurations.
5. Parametric Design IntegrationTo translate a design comprised of multiple suspended tiles (Figure 6) into aphysical artefact required the development of a parametric geometry model usingGrasshopper/Rhino and robotic programming using the Jeneratiff Digital Designand Fabrication library. A notional design surface was drawn and decomposedinto square tiles projected from a planar regular grid onto the surface. The planartiles represent the rigid timber panels used while the projected tiles represent the

ROBOTIC FABRICATION OF LIGHTWEIGHT SURFACE ASSEMBLIES 35
fabric surface. The projected tiles were fitted on the surface’s tangent plane bycomputing the closest point from the centroid of the originating tile and reorientingin-plane such that the inter-panel gaps, due to approximation, were consistent toassist bonding the floating fabric.
Figure 6. Parametric design to robotic fabrication: (1) digital model plan view W=900mmD=750mm. (2) digital model section view H1=780.50, H2 =164.30. (3) digital model
isometric view.
With the composition of oriented panels in space, the actual translation intorobotic instructions is a straight forward application of change of basis from designto robot space by conversion of coordinate systems into positions and quaternions.However, the use of multiple end-effectors, or tool centre point (TCP) coordinates,within the same process, for the depression plate, mixer and pumping action,proved highly complicated both in accurate calibration between the physical anddigital space as well as for planning the geometric transformations required in thecomputer model. We used the live training capability of Jeneratiff for calibrationpurposes and pre-transformed design model-space coordinates directly onto therobot’s flange-space to implement the multi-tool end-effector.
6. Design of Large-Scale AssemblyAs a design and a fabrication challenge, to gain insight into parameters onlyaccessible by increasing the multiplicity and scale of a repetitive process, we

36 P. TEH ET AL.
developed a larger assembly of PU tiles. After experimenting with a smaller scaleof the artefact (Figure 7), the design was scaled up as a self-supporting artefact.The premises underlying the design perspective of the artefact presented (Figure 8),with certain degree of post-rationalization, were to aggressively exploit materialcapability and arrive to an aesthetic as remote and alienating from conventionalexpectations as per materials and tectonics possible.
The large artefact is comprised of 30 square tiles in a 5 x 6 regular gridmeasuring 150 x 150mm each, thus the overall dimensions being 750 x 900mm.These dimensions were determined based on the loading capacity of the robotarm. Vertically the envelope spans between 164.30mm and 780.50mm at itslowest and highest points from the base, respectively. Vertical stretching is highlyexaggerated, to present the observer the funicular filament structure. Yet achievingsuch large depths meant that the success rate of producing self-load carrying tileswas approximately 40%. In fact, 20% the tiles, those at the perimeter and highspots of the artwork, can only stand upright due to the aggregate support from theentire assembly.
Figure 7. Views of the large assembly of stretched PU tiles: Perspective (Top), Left Elevation(Bottom Left), Front Elevation (Bottom Middle), Right Elevation (Bottom Right).
The production time was slow primarily due to the 20min time requiring forfull hardening of the PU and despite the automations developed, rather laborious.It took circa 30 min per element, including 3 min of setup, 7 min for the full robotsequence - 80smixing, 70s activation, 280s progressive compacting of thematerial(9 times) and a final pull to the assigned plane. To accelerate the process tiles wereremoved from the robot jig once the PU was relatively hard and inverse hung tillfully cured.
Upon assembly, the fabric surface was fully impregnated with additional PU in
ROBOTIC FABRICATION OF LIGHTWEIGHT SURFACE ASSEMBLIES 37
resin form and let set to form a rigid and continuous surface. The total approximatevolume of the artefact is 0.52m3 and weights 2.5 Kg, thus its bulk density is only4.81Kg/m3 which is affine to low molecular weight foams.
7. ConclusionsWe presented research work for developing a digital design and fabricationtechnique using industrial robotics for producing ultra-lightweight surfaceassemblies suspending thin layers of heterogenous materials via the filamentstructures of forcefully delaminated polyurethane foam. While the productscreated using the process are highly design-specific, invoking lightness andfragility whist exploring the extreme limits of the system, the technique ismore general. With less aggressive delamination, it is possible to improve themechanical characteristics of the assembly and with careful tile adhesion it isalso possible to achieve improved surface finish of the fabric surface. (Fig 8)The approach may be deployed for its ability to create three dimensional surfacesfor such applications as interior cladding, directly mounted on top of flat wallsurfaces, used for avant-garde type of furniture exploiting the compliantmechanicsof thousands of filaments or for building construction fabrication of insulatedpre-cast panels as a form of an integrated mould.
Materials and techniques used in conventional manufacturing and buildingconstruction for design-wise unexciting applications or rather for purely utilitarianpurposes, offer opportunities for playful, often eccentric and even potentiallypractical applications which may fuse function with aesthetics. It often onlyrequires investigation of the intrinsic material properties, beyond the best-useproduct descriptions, and experimentation with sophisticated digital fabricationequipment which ease the needs for performing complex tasks and controllingnumerous design parameters, exactly those for which such processes are currentlyabsent from conventional use.
AcknowledgementsThis research was supported by Singapore University of Technology and DesignOffice of Education and Digital Manufacturing and Design Center.
ReferencesBraumann, J.B. and Cokcan, S.B.C.: 2012, Digital and Physical Tools for Industrial Robots
in Architecture: Robotic Interaction and Interfaces, International Journal of ArchitecturalComputing, 10(4), 318-319.
Brell-Cockan, B.C.S. and Braumann, B.J.: 2012, Towards Robots in Architecture, Proceedingsof Rob|Arch: Robotic Fabrication in Architecture, Art, and Design, Proceedings ofRob|Arch: Robotic Fabrication in Architecture, Art, and Design 2012, Vienna, 6-15.
Colletti, C.M.: 2013, Protorobotic foaming, Archithese, 3, 54-57.Derikvand, M.D., Ebrahimi, G.E. and Tajvidi, M.T.: 2013, A feasibility study of using
two-component polyurethane adhesive in constructing wooden structures, Journal ofForestry Research, 25(2), 477-42.
Ding, D.W.: 1999, Delamination Analysis of Composite Laminates, Ph.D. Thesis, Departmentof Chemical Engineering and Applied Chemistry, University of Toronto.
Dunn, D.N.: 2012, Digital Fabrication in Architecture, Laurence King Publishing.

38 P. TEH ET AL.
G.R. Glynn and S.B. Sheil (eds.): 2012, Fabricate: Making Digital Architecture, RiversideArchitectural Press.
Sue Halliwell, S.M.H.: 2002, Polymers in Building and Construction, iSmithers RapraPublishing, Shrewsbury.
Iwamoto, I.L.: 2009, Digital Fabrications: Architectural and Material Techniques, PrincetonArchitectural Press, New York.
Johns, J.R.L. and Foley, F.N.: 2012, Irregular Substrate Tiling, The robotic poché, Proceedingsof Rob|Arch: Robotic Fabrication in Architecture, Art, and Design 2012, Vienna, 222-229.
Karol, R.H.K.: 2003, Chemical Grouting And Soil Stabilization, Revised And Expanded:Edition 3, CRC Press.
King, K.N., Tamre, T.K., Grasser, G.G. and Weiler, W.A.: 2014, Phase Change: ApproachingResearch Methodologies Through Design Robotics Opportunities for CustomizationThrough Robotic Manipulation of Materials During, Phase Change and Curing Processes,Proceedings of Rob|Arch: Robotic Fabrication in Architecture, Art, and Design 2014,Michigan, 347-356.
Kohler, G.K.: 2007, “The Foam Elective Course” . Available from Gramazio Kohler Research,ETH Zurich<http://www.gramaziokohler.arch.ethz.ch/web/e/lehre/137.html> (accessed 20Febuary 2018).
K.B. Kolarevic (ed.): 2003, Architecture in the Digital Age: 2003, Design and Manufacturing,Taylor and Francis Group, New York and London.
Manaugh, G.M.: 2016, “Skyscrapers of the future will be held together with glue” . Availablefrom New Scientist<https://www.newscientist.com/article/2079877-skyscrapers-of-the-future-will-be-held-together-with-glue/> (accessed 20 Febuary 2018).
McGee, M.G.W. and Ponce de Leon, P.D.L.M.: 2014, Preface, Proceedings of Rob|Arch:Robotic Fabrication in Architecture, Art, and Design 2014, Michigan, 8-11.
Pascoe, P.J.A., Alderliesten, A.R.C. and Benedictus, B.R.: 2012, Methods for the Predictionof Fatigue Delamination Growth in Composites and Adhesive Bonds - A Critical Review,Engineering Fracture Mechanics, Engineering Fracture Mechanics, 1, 112-113, 72-96.
Reinhardt, R.D., Saunders, S.R. and Burry, B.J.: 2016, From Robotic Fabrication to CreativeRobotics, Proceedings of Rob|Arch: Robotic Fabrication in Architecture, Art, and Design2016, Sydney, 6-15.
Snooks, S.R. and Jahn, J.G.: 2016, Closeness: On the Relationship of Multi-agent Algorithmsand Robotic Fabrication, Proceedings of Rob|Arch: Robotic Fabrication in Architecture,Art, and Design 2016, Sydney, 218-229.
Søndergaard, S.A., Feringa, F.J., Nørbjerg, N.T., Steenstrup, S.K., Brander, B.D., Graversen,G.J., Markvorsen, M.S., Bærentzen, B.A., Petkov, P.K., Hattel, H.J., Clausen, C.K., Jensen,J.K., Knudsen, K.L. and Kortbek, K.J.: 2016, Robotic Hot-Blade Cutting, An IndustrialApproach to Cost-Effective Production of Double Curved Concrete Structures, Proceedingsof Rob|Arch: Robotic Fabrication in Architecture, Art, and Design 2016, Sydney, 151-164.
Tamre, T.K., Colletti, C.M., Grasser, G.G. and Weiler, W.A.: 2014, (Fr)Agile Materiality,Proceedings of Fabricate 2014 Conference, Zurich, 216-223.
Trummer, T.A., Amtsberg, F.A. and Peters, P.S.: 2012, Mill to FIt, Proceedings of Rob|Arch:Robotic Fabrication in Architecture, Art, and Design 2012, Vienna, 110-117.
Vick, V.C. and Okkonen, O.E.: 1999, Strength and Durability of One-Part PolyurethaneAdhesive Bonds to Wood, Forest Products Journal, 48-11/12, 71-76.
Willmann, W.J., Augugliaro, A.F., Cadalbert, C.T., D’Andrea, D.A.R., Gramazio, G.F. andKohler, K.M.: 2012, Aerial Robotic Construction Towards a New Field of ArchitecturalResearch, International Journal of Architectural Computing, 3(10), 439-459.

ROBOTIC AUTOMATIC GENERATION OF PERFORMANCEMODEL FOR NON-UNIFORM LINEAR MATERIAL VIA DEEPLEARNING
DAN LUO1, JINSONG WANG2 and WEIGUO XU31,2,3School of Architecture, Tsinghua [email protected] [email protected] [email protected]
Abstract. In the following research, a systematic approach is developedto generate an experiment-based performance model that computes andcustomizes properties of non-uniform linear materials to accommodatethe form of designated curve under bending and natural force. In thiscase, the test subject is an elastomer strip of non-uniform sections. Anovel solution is provided to obtain sufficient training data required fordeep learning with an automatic material testing mechanism combiningrobotic arm automation and image recognition. The collected trainingdata are fed into a deep combination of neural networks to generatea material performance model. Unlike most traditional performancemodels that are only able to simulate the final form from the propertiesand initial conditions of the given materials, the trained neural networkoffers a two-way performance model that is also able to computeappropriate material properties of non-uniform materials from targetcurves. This network achieves complex forms with minimal andeffective programmed materials with complicated nonlinear propertiesand behaving under natural forces.
Keywords. Material performance model; Deep Learning; Roboticautomation; Material computation; Neural network.
1. Introduction“Good structure form” is traditionally considered to be composed with puretension or compression, minimizing bending and deformation in the system.This perspective partially results from the difficulty simulating or controllingthe quality of bending and deformation due to its highly complicated nonlinearmaterial performance mechanism rooted in the molecular level, as well as itsstrong dependency on individual material qualities. This phenomenon makesit impossible to generate an accurate mathematical performance model withadjustable variables. Additionally, as most typical construction materials, suchas masonry, concrete, wood, and steel, best perform under pure tension orcompression, to date, it has not been determined how to generate structure andform with the natural behaviour of bending and deformation, as well as howto programme the material to achieve the designed form with such force andbehaviour.
T. Fukuda, W. Huang, P. Janssen, K. Crolla, S. Alhadidi (eds.), Learning, Adapting and Prototyping,Proceedings of the 23rd International Conference of the Association for Computer-Aided ArchitecturalDesign Research in Asia (CAADRIA) 2018, Volume 1, 39-48. © 2018 and published by the Association forComputer-Aided Architectural Design Research in Asia (CAADRIA) in Hong Kong.

40 D. LUO, J. WANG AND W. XU
Elastomer, or synthetic rubber, used in the following study is a polymer withviscoelasticity, which enables a linear strip of such material to be bent and tonaturally settle into a curvature under interplay of internal and external force.Currently, most bending and deformation models only deal with the behaviour ofa uniform ideal material with given material properties, resulting in several limitedgeometrical curvatures due to the natural form finding process. However, duringearlier material experiments, different non-uniform materials with changingsectional properties are noticed to settle into a vast diversity of curves underbending with the potential to approximate most given convex curves and evenseveral concave curves under gravity with equilibrium in all forces. However,the simulation of such a natural form finding process requires a combinationof in-depth knowledge of classical definite deformation theorem, finite elementanalysis, and material properties. Due to the nature of such a geometricallynonlinear finite elastic deformation process, the mechanism simulation of suchmaterial and process is currently extremely difficult and restricted within idealand simplified models.
Figure 1. None-uniform elastomer material behaving under bending .
In the following research, a novel approach is developed to utilize thecomplexity of flexible materials with their bending and deformation features andgenerate a performance model that is capable of programming a non-uniformmaterial to be bent and naturally relax into the designated form with theequilibrium of internal constraints and external forces. Whilemost of the structuralform finding process focuses on finding the most efficient form based on theideal material model, in our research, the key to be able to “programme” thecharacteristic of the material according to formal intention is the use of deeplearning combining robotic automation and image recognition.

ROBOTIC AUTOMATIC GENERATION OF PERFORMANCE MODELFOR NON-UNIFORM LINEAR MATERIAL VIA DEEP LEARNING
41
Though most structure simulation software, such as Kangaroo and RhinoVaults, begins with known material properties and constraints to simulate the finalrational form, reversely computing customized material properties from givendesignated forms is highly difficult to achieve with current structure solutions. Theability towork backward from form tomaterial properties would be a key feature ofa performancemodel generated from a deep learning process compared to a typicalsimulation process. In our research, we used a combination of few different typesof neural networks to generate the performance model from training data.
Figure 2. Workflow of the generation process of the material performance model.
The process of the generating performance model begins with preparingfeatured testing material. Next, the material goes through an automatic testingprocess using robotic arms and image recognition. The massive amount ofwell-labelled training data containing information onmaterial behaviour generatedfrom previous processes is later fed into a combination of deep and recurrent neuralnetworks to generate a trained performancemodel. The performance model is thenvalidated before being baked and embedded into grasshopper and blended into thedesign workflow. A more specific explanation of each step is as follows:
2. Material preparationIn this experiment, 34 pieces of 1-m-long rubber are used to generate testingand validation sample pieces. The flat rubber sheet from which to fabricate thetesting samples is 1 metre wide and 50 millimetres thick. Unites are cut fromthe sheet with a water jet to avoid the accumulation of heat and deformation thatnormal CNC causes during the drilling process. The section of testing pieceshas a diversity of curvatures composed of different combinations of length andangles to ensure that the scope of training samples encompasses the main portionof variables. The material itself is matted black, while the front face is painted inwhite to add additional contrast for better image recognition for post-processingof the video clips.

42 D. LUO, J. WANG AND W. XU
Figure 3. Preparation and cropping of testing samples.
Each rubber has a serious of fixture holes with a diameter of 5 mm evenlyspaced at 31.4 mm. The rubber sample will be fixed to the end of the roboticarms using the holes. By fixing the linear rubber samples at different locations,the bending quality of rubber samples could be tested at different lengths withcombinations of different curvatures. As the bending of elastomer materials is ahighly non-linear process with multiple influencers, the process of testing a singlematerial at different lengths and curvatures to increase the range of training dataincreases the accuracy of the trained model. From one rubber strip, we manage togenerate video clips of 253 testing pieces under the best scenario.
3. Robotic automatic material testing
Figure 4. Set up of the material test.

ROBOTIC AUTOMATIC GENERATION OF PERFORMANCE MODELFOR NON-UNIFORM LINEAR MATERIAL VIA DEEP LEARNING
43
After the testing material samples are prepared, the robotic automatic testingenvironment is set up. Two synchronized robotic arms are located against a blackbackground. One arm is front facing and only rotates in the A6 axis, while theother is located on the side with the end plate facing front and moving horizontallyat the same level and plane as the other end plate while rotating along the A6 axis.
In this case, we used KUKA|prc in GhRhino to plan the path and movement ofthe robots and run simulations of the process. The movements and path are furtheradjusted according to the length of each piece. In this case, the parameters of themovements are a result of multiple manual experiments to avoid tearing and failureof the materials. This step could be improved with the addition of a mechanicalfeedback system. A high definition camera located at the front of the set up facingthe white front side of the testing material against the black background is used torecord in real-time. The video clips captured are then processed and engineeredfor the training of the neural network.
4. Feature engineering
Figure 5. Process of feature engineering.
To prepare the data for machine learning, a crucial step is feature engineering.Particularly, feature engineering in this research means to process thecamera-captured video and format it into usable data. This is a twelve-step processwith four main phases. The first phase is extracting usable images from video clipsincluding image extracting, greyscale, image crop, and binarization. The secondphase is image editing including image denoising, image completion, and smoothsideline. The third phase entails curve extraction including extracting bottom andmiddle curves as well as mid curve denoising. Last, data validation was employed,including data extraction and data validation.
The goal of feature engineering is to extract the bottom and middle lines ofeach testing piece. Evenly spaced points are selected on the bottom line. Thegradient and distance to the correspondingmiddle point are recorded and formatted.This distance is considered as the width of the material at each point. Later, the

44 D. LUO, J. WANG AND W. XU
coordinates of the bottom points and corresponding middle points, gradient of thebottom point, and distance data will be used to train the neural network. Due tothe length of the paper, we will not address the algorithm and logic of each step indetail.
5. Data formatting and feasibility studyThe purpose of this phase is to confirm the relationship between material propertyand the formal result exist and could be achieved with the deep learning neuralnetwork model that uses the training data that we acquired. The intention is tocreate amaterial performancemodel that could programme the sectional propertiesof elastomer based on a given curve. The relationship to establish is between theheight of the section at each selected point and final form of the curve after bending.This is a two-way model, which means we could not only infer the final form ofthe curved material from given sections of the material with the fixture conditionat both ends given but also programme the section of the linear materials based onthe final intended form under the force of nature.
Figure 6. Neural network model structure and data structure.
Before training of the final neural network, data are pre-processed withwhitening process, normalization, data wash, and data formatting to generate aready-to-use data set. After that step, two simple foundation models are developedbased on smaller data sets to ensure the existence of such a relationship. Oneneural network is to build a model that could create the non-linear mapping fromgiven material property and adjacent fixing condition to the spatial curve, provingthe capability of deep learning. The other is the inverse model that takes in allinformation around one point, including the coordinate and the gradient, to predictthe sectional height at that point. This model proves that our intended mappingrelationship exists. Even though those testing models are relatively simple, aseries of parameters of the neural network is adjusted, and the results offer strongreference in the development of the final model.
6. Training the LSTM neural network modelAfter confirming the feasibility of the model and approach, we decided to use amore complicated and expressive model for training. In this case, recurrent neuralnetwork (RNN) is selected because it exceeds at learning the connecting betweenthe horizontal connections in a sequence; for these testing materials, the conditionof one point is strongly related to the conditions of its neighbourhood points.

ROBOTIC AUTOMATIC GENERATION OF PERFORMANCE MODELFOR NON-UNIFORM LINEAR MATERIAL VIA DEEP LEARNING
45
The key feature of the RNN is that the connections between units form adirected cycle, which enabls it to store temporal information. The input of eachlayer comes from both current input and previous input, which would increasethe dependency of individual points to its neighbours. Long Short Term Memory(LSTM) is a special improved type of the RNN model. Even though the RNNmodel is intended to resolve the problem of data storage, in practice, the modeloften faces the problem of vanishing gradient. LSTMwith “forget gates” preventssuch back-propagated problems from vanishing or exploding and can learn fromevents that occurred many steps earlier. In our case, the forget gates are activatedwith sigmoid function.
Figure 7. Non-Linear Fields Theories of Mechanics, Handbuch der Physik, Bd.III.
The training data used in this phase is a sequence of vectors stored in an arrayinstead of a single vector. The exported result is a one-dimension array containingthe height at each individual position. For a full-length training sample, the inputis the gradient information at 80 evenly distributed points and the initial materialheight at both ends; the output information of the model is the material height ateach corresponding point.
7. Evaluation of the generated performance model
Figure 8. Validation of performance model.
Only 50% of all samples are used for training of the neural network; the other 50%is kept for the evaluation of the generated performance model and loss function.The overall loss is under 0.0015, which is approximately a 5% deviation in scale.

46 D. LUO, J. WANG AND W. XU
Additionally, we have visualized the prediction result of 54 randomly selectedsamples and compared it to the result collected from the experiment. In thevisualization, the red line is the middle line extracted from the physical experiment,while the green line is the calculated middle line using the generated materialmodel. The model successfully predicts all 54 randomly selected samples with anacceptable accuracy. The overall trend of the predicted outline effectively matchesthe real result. However, since the bottom line used for input is extracted frompixilated image recognition with some zigzag, the generated upper outline is alsoslightly zigzagged. The final green line is smoother than the original red lines.This difference is due to the large amount of noise during the extraction of linesfrom the image sampling and certain flaws on the material from the fabricationprocess. However, as the green line is the result of the deep learning model, itavoids flaw and problems during image processing and fabrication, resulting in asmoother output.
8. Model conversionThe trained neural network must be further converted to fit into the architecturalworkflow. In this case, we used Rhino’s plugin grasshopper to mediate betweenthe neural network model and the design process. The grasshopper definition iscomposed of three parts:
Figure 9. Structure of grasshopper definition.
• Curve mapping to transform the input rhino curve into the standard formatteddata that the neural network model can process. The key to this step is to checkthe scale of the curve exported from the model to ensure that it matches thescale of the testing sample and is a planar curve. Then, the curve went througha serious of operation including normalization to become formatted input datafor the neural network. In the end, we need to input the initial condition at bothend, which will strongly influence the outcome.

ROBOTIC AUTOMATIC GENERATION OF PERFORMANCE MODELFOR NON-UNIFORM LINEAR MATERIAL VIA DEEP LEARNING
47
• Model calculation is applied to use the trained neural network model to predictthe outcome. The current Python module in grasshopper does not support thedeep learning framework. Thus, the current solution is to re-write the trainedneural network model into GhPython. The neural network model is essentiallynon-linear mapping and calculation of matrix. After completing the trainingprocess by printing out all layer information in Keras, saving it into a file, andextracting the weights of each layer, the weights can be put into GhPythonlayers, making them ready for forward propagating.
• Curve decoding is used to convert the output data to a 3D model that thedesigner can work with. In this process, the normalized data must be re-scaledto the original. The original coordinates and gradient provide ground for thetranslation of the material height at each point with the input of the originalplane and coordinates.
9. Modelling testWith the tool developed from the previous phase, we are able to translate a curveinto the corresponding non-uniform linear piece. The final form is dependenton two factors: the target curve and the initial thickness at both ends. We usedsuch a tool in several other design studies. For example, the tool was used togenerate a sectional framework for soft cave forms. In this study, the fabricationof a 2D planar curve could be transferred into fabrication of linear materialswith limited thickness. This transfer could easily be accomplished with commonfabrication technology and far more material efficiency during fabrication than the2D planar curve. Additionally, the linear material also occupies less space duringtransportation and would self-assemble into the designed form by simply bendingand fixing both ends. Since we used a smooth curve directly generated from rhino,the output form is far smoother than the curve used for training, which is extractedfrom the pixilated image.
10. Review and conclusionReviewing the series of processes and experiments conducted, there are stilllimitations to the strategy employed and the performance model generated thatcould be further improved in the future. The primary emerging constraints are asfollows:
• There is a strict limitation in scale and material properties. As we know,material behaviour radically changes as the scale increases, especially since weare utilizing the highly non-linear elasticity of materials. The model trainedfrom smaller scale test samples is only valid for use at similar scales andcannot simply expand to the architecture scale, similar to most mathematicalmechanical models. Additionally, it could not be expanded for use of othertypes of rubber with input of material qualities.
• The model lacks a clearly defined valid region. As this model is trained froma neural network, it is very hard to say where the limit lies. As the complexity,scale, and typology of the target curve deviate from the test samples, theaccuracy of the model decreases. However, there is no way to determine thenew deviation rate or know at which point the model fails. The only thing we

48 D. LUO, J. WANG AND W. XU
know is that the more variation and amount of training, the larger the validregion of the model.
• It is difficult to combine with other material and physical models for compoundproblems. As neural network is a kind of black-box solution complexnon-linear problems. It is hard to extract any physical and mathematical rulesfor use in combination with other physic laws. For example, it is impossible topredict the behaviour of the linear elastomer material under point force with thecurrent model nor the behaviour of a network of such material. New trainingdata need to be added for each scenario. The amount of training data increaseexponentially as the complexity increased.
In conclusion, the method combining robotic automation, image recognition, anddeep learning neural networks offers an effective and novel approach to solvingthe behaviour of materials with nonlinear qualities and behaviour under complexforces. Such method and logic could be expanded for more scenarios with minoradjustments, such as replacing the normal camera with a depth camera to collect3D information. Moreover, the method is a two-way material model, especiallyeffective for material computation, achieving complex forms with minimum andeffective programmed materials. However, as this approach is founded on entirelydifferent logic than the typical material models, it has certain problems andrestrictions of its own that are worthy of further investigation in the near future.
AcknowledgmentsThe authors gratefully acknowledge the financial support provided by the NationalNatural Science Foundation of China (NSFC) (Project No. 51538006)
ReferencesFleischmann, M., Knippers, J. and Lienhard, J.: 2012, Material behaviour: embedding physical
properties in computational design processes, Architectural Design, 82, 271-274.Graves, A.: 2012, Supervised Sequence Labelling with Recurrent Neural Networks, Springer
Berlin Heidelberg.Li, H.: 2012, Tong ji xue xi fang fa, Tsinghua University Press, Beijing.Martins, P.A.L.S., Natal Jorge, R.M. and Ferreira, A.J.M.: 2006, A Comparative Study
of Several Material Models for Prediction of Hyperelastic Properties: Application toSilicone-Rubber and Soft Tissues, Strain, 42, 135-147.
Menges, A. and Reichert, S.: 2012, Material capacity: embedded responsiveness, ArchitecturalDesign, 82, 52-59.
Moritz, F., Knippers, J., Lienhard, J., Menges, A. and Schleicher, S.: 2012, Material Behaviour:Embedding Physical Properties in Computational Design Processes., Architectural Design,82, 44-51.
Oxman, N.: 2007, Material computation, International Journal of Architectural Computing, 1,21-44.
Parker, J.R.: 2011, Algorithms for image processing and computer vision, Wiley, Indianapolis,IN.
Russell, S.J. and Norvig, P.: 2002, Artificial Intelligence: A Modern Approach, Pearson.Truesdell, C. and Noll, W. 1965, The Non-linear Fields Theories of�Mechanics, in S.S. Antman
(ed.), Handbuch�der�Physik�Bd.�, Springer-Verlag,Berlin,Heidelberg, ,New York.

CLOUDMAGNET, A CFRP FRAMEWORK FOR FLEXIBLEARCHITECTURES
ANDREW JOHN WIT1Temple University, Tyler School of [email protected]
Abstract. To examine CFRP’s viability within architectural practice,this paper explores new possibilities andmethodologies for thematerialsintegration into the design and production processes. Through thelens of the /One Day House/ initiative and its recent subproject/cloudMAGNET/, this paper explores and evaluates new typologies offormwork and winding techniques for CFRP based structures derivedfrom tensile modeling and CFD analysis. Through examinationsin cored and sacrificial coreless winding, this paper outlines newformal, structural, adaptive and production possibilities afforded by theintegration of CFRP into the architectural workflow.
Keywords. Additive manufacturing; composites; carbon fiber; formfinding; analog / digital fabrication.
1. IntroductionRecently, we have witnessed the rapid development and integration ofcomputational design tools and digital/robotic production platforms intoarchitecture and surrounding disciplines. These tools have not only allowed forthe creation of more complex/efficient forms, fabrication methods and assemblyprocesses, but have also allowed for the use of new, non-standard material systemssuch as carbon fiber reinforced polymers (CFRP). By removing the formal andstructural constraints of traditional materials, CFRP and other composites inconjunction with computational modeling have given designers the ability to notonly reimagine form, but also the disciplines existing construction processes.
Although these tools and materials have given architects the ability to simplifyexisting fabrication systems, we have continued to see the embodied complexitywithin buildings and their assemblies explode, making the construction of eventhe simplest of forms overly cumbersome. While architects have leaned towardsthe complexification of enclosures, materials and assembly systems, we haveobserved an opposing shift in industries such as automotive, aviation, aerospaceand recreation, where complex multi-part assemblies have been replaced bysophisticated yet simplistic composite materials such as CFRP. In a world wheremechanical complexity is being quickly replaced by computational and materialcomplexity, CFRP’s initial formless/malleable nature allows for the creationof complex, multi-layered parts with specifically programmed characteristics
T. Fukuda, W. Huang, P. Janssen, K. Crolla, S. Alhadidi (eds.), Learning, Adapting and Prototyping,Proceedings of the 23rd International Conference of the Association for Computer-Aided ArchitecturalDesign Research in Asia (CAADRIA) 2018, Volume 1, 49-58. © 2018 and published by the Association forComputer-Aided Architectural Design Research in Asia (CAADRIA) in Hong Kong.

50 A.J. WIT
allowing for smarter materials, the minimization of parts, and the simplificationof fabrication/assembly systems.
Although CFRP has gained traction within industries centered around massproduction, we have yet to see its acceptance into the norms of architecturalconstruction. There are several reasons architecture lags behind: the materialcurrently remains expensive; there is a lack of knowledge around CFRP withindesign, architectural engineering and construction fields; the necessity forexpensive/material intensive formwork’s traditionally associated with CFRP goagainst architectures one-off, low-cost building culture; and it remains difficult toaccurately model and analyze composite structures in currently available designsoftware’s. To further examine CFRP’s viability within architecture, this paperexamines contemporary uses of CFRP within architecture, while simultaneouslyexploring new possibilities for CFRP’s integration into the design and productionprocesses through the lens of the One Day House initiative and its recentsubproject, cloudMAGNET . Through the investigation and evaluation of newtypologies of formwork for wound CFRP both cored and coreless, this paperoutlines new formal, structural, adaptive and production possibilities afforded bythe integration of CFRP into the architectural workflow.
1.1. CFRP IN ARCHITECTURE
Over the past decade, there have been growing numbers of projects testing themerits of composites, specifically CFRP within architectural research and practice.In practice, we see projects like Atelier Bow-Wow’s portable BMW GuggenheimLab completed in 2011, the first noted fully CFRP structure at an architectural scale(Frearson 2007). Recent works of Foster + Partners also push CFRP, with projectsranging from their large shading screens on the Dubai Apple Store, their roof onthe Chicago Apple Store, as well as the CFRP roof on the new Steve Jobs Theater.Spanning 155 feet, the structure currently stands as the world’s largest CFRP roof.These projects, although novel in their material and structural capabilities do notfully exploit CFRP’s potential as they focus solely on structure and efficiency,applying CFRP similarly to traditional architectural materials.
Atelier Bow-Wow’s project for example, creates a light-weight, modularstructure through the remaking of conventional material sections from CFRP andapplying them to conventional architectural/structural forms. Although creatinga minimal structure that maximizes openness and transportability, the visual andtactile qualities of the building remain similar as those created with a steel structure.Similarly, Foster + Partners Dubai Apple Store façade, utilizes layered, cylindricalCFRP tubes creating the appearance of a woven louver system, rather than utilizingthe materials malleable characteristics to weave an actual structure. AlthoughFoster + Partners CFRP roof structures take a different approach utilizing customdesigned and fabricated elements, the composites remain enclosed accentuatingthe thinness of the roof, but limiting the materials potential strictly to efficiency.
On the other hand, Kengo Kuma’s Komatsu Seiren project takes the use ofCFRP in a new direction. Rather than reinforcing the buildings existing structurethrough the addition of CFRP sleeves as typically done, Kuma wraps the entirebuilding in a vail of CABKOMA (CFRP) Strand Rods, moving the project beyond

CLOUDMAGNET, A CFRP FRAMEWORK FOR FLEXIBLEARCHITECTURES
51
material efficiency by developing a new building aesthetic.
1.2. CFRP IN CURRENT ARCHITECTURAL RESEARCH
Where in practice, CFRP tends to be utilized for conventional solutions, inarchitectural research, we have seen the emergence of novel CFRP applicationsbeyond efficiency, redefining the design process, aesthetics, simulation andproduction. Recent projects completed at the University of Michigan, theUniversity of Stuttgart and Temple University begin to exemplify new potentialsof composites in architecture.
Over the past five years, the ICD/ITKE Institutes within the University ofStuttgart have continually pushed the boundaries of what a composite architecturecould look and feel like. Through the development of novel methods for roboticcoreless CFRP winding, their projects have shown CFRP’s potential at variousscales. Coreless winding, implemented in their 2012, 2013-14 and Elytra Filamentpavilions have demonstrated that CFRP can be applied through various windingmethods, producing non-monocoque structures, while at the same time introducinga new, lightweight, fibrous aesthetic to architecture (La Magna, et.al 2016; Prado,et.al 2017; Reichert, et al 2014; Menges, Knippers 2018). In their more recent2014-15 research pavilion, they push the materials efficiency and visual propertieseven further, through the placement of CFRP rovings onto the interior of aninflated ETFE bubble creating the potential for a construction process nearly voidof waste and completely unique in aesthetics. Building upon this research andthe previously completed CFRP projects produced by the authors, cloudMAGNETaims to find new methods and uses for CFRP within the discourse of architecturaldesign and production.
2. The One Day House and background research in CFRPRecently at the Tyler School of Art, a series of CFRP projects (rolyPOLY,roboWINDER, Dinner4Six, etc.) have been designed, fabricated and tested underthe larger research umbrella of the One Day House initiative. Examining novelsystems for adaptive/robotic housing, the initiative aims to not only reinventthe relationship between environment, building and occupant, but also aims tosimplify the process of making, while simultaneously allowing for high levelsof formal, aesthetic and environmental adaptability. Through the integration ofwound CFRP tow as a flexible structural framework and a lightweight microPCM(micro-encapsulated phase change material) fabric enclosure system, the projectlooks at buildings not as a complex assemblage of thousands of unique partsand materials, but rather as a simplistic system, that through the integrationof embodied computational/material intelligence, can adapt to and self-mediateever-changing environmental conditions.
To realize the vast aspirations of the initiative, a series of short term projectswere initiated. Each project examines in depth a single aspect of the newlyproposed building process (Wit, Kim, et.al 2016; Wit, Ng, et.al 2016). Initialresearch was completed in roboWINDER. Focused around the relationship of bothcored and coreless robotic CFRP tow winding in relationship to building form and

52 A.J. WIT
resin application method (i.e. wet wound vs. pre-impregnated tow), this projectdefined a robust framework for CFRP modeling and application being utilizedin subsequent projects. Following the roboWINDER, research, a specific CFRPtow and resin system was chosen. A durable, pre-impregnated resin system waschosen specifically for its material consistency (±27.5% resin content), pre/postcure stability, low-temperature curing properties, structural attributes, low toxicityand long shelf life and has been implemented in all subsequent projects with strandcounts of either 12k (12,000), 24k or 50k.
The project rolyPOLY , a tumbling enclosure for a single occupant completedwith Simon Kim, began a deeper investigation into corelessly wound, modular,self-supporting monocoque structures with a specific emphasis in the visualand tactile qualities possible through CFRP. Pushing this research further inthe ongoing project also with Kim, Dinner4Six, a room-scaled enclosure forsix individuals adds a new dimension to the research through the rethinkingtraditional metal coreless formwork as an integrated, internal, tensile sacrificialCFRP structure. This integrated formwork allows for the minimization of wastethrough the utilization of CFRP tow as the formwork/form generator, overallbuilding structure as well as the enclosure system.
3. cloudMAGNETIn a world where climate change has become increasingly unpredictable andgrowing populations will continue to foster increased material shortages, it hasbecome necessary to reimagine our current design processes, material pallets andassembly methodologies. cloudMAGNET examines the co-dependencies betweenmaterial, form, energy and the environment. Through the design, prototyping andproduction of a series of environmentally performative, (i.e. cloud generatingenclosure systems) for the cloud forests of Monteverde, Costa Rica, this projectaims to not only bring attention to the shrinking of the cloud forests through thevisual condensing of air into clouds, but also aims to develop a viable, materialactive enclosure system for architectural applications. Through the utilization offlexible, wound CFRP structures, reinforced by an integral microPCM embeddedDyneema fabric skin and formally sculpted through tensile fabric modeling,and CFD analysis, cloudMAGNET aims to simplify large-scale constructionmethods while actively controlling internal spacial conditions such as temperature,humidity and lighting. The following focuses on the design, production, testingand results of the CFRP aspect of the project.
4. EARLY PROTOTYPES. MATERIAL FOLLOWS FORMBetween 2016-17 a series of nearly twenty CFRP prototypes were designed, builtand tested during the development process of the cloudMAGNET prototype. Initialprototypes focused purely on the formal flexibility of CFRP and how the materialcould create purely performative forms, rather than how material, application andcomputation could be utilized to create forms the material desired. Based onBernoulli’s principle of pressure, where reduced pressure is correlated to increasedspeeds of fluids such as air, two prototypical forms were derived in 3D modeling

CLOUDMAGNET, A CFRP FRAMEWORK FOR FLEXIBLEARCHITECTURES
53
software’s maximizing the effects pressure and temperature change on the PCMimpregnated skin. Derived from the aggregating of Venturi tubes, these initialforms created optimal conditions where air was forced from larger cross-sectionsto smaller. The forms were then simulated in CFD software to verify flows,pressures and the aerodynamics of the enclosure system. Data from CFD analysiswas utilized to create a back and forth dialog between the design and simulationprocess.
As the wind forces being applied to the prototypes in Monteverde were similarthose being applied to a building in severe weather conditions, a series of typicalstructural typologies were applied the forms, i.e. randomly wound monocoqueshells, diagrids, as well as a variably wound grid shell structure (Fig. 1). Asthe final formal characteristics of the initial prototypes was quite complex, aremovable cored system was created from laser cut cardboard to be utilized in¼ and ½ scale prototyping. Cardboard was chosen for its recyclability as well asfor its abilities to withstand kiln firing while still being easily separated from theCFRP by submerging the artifact in water post curing.
Figure 1. Initial Winding prototypes at 1/8 scale.
Utilizing a unique slicing algorithm, each prototypical form was sliced intoa series of fifteen unique sections, each with eight triangularly shaped CFRPgrippers added to its perimeter during slicing. Each gripper was uniquely labeledwith a corresponding letter and number allowing for its easy location during thewinding process. Depending on the structural typology, CFRP was wound aroundthe cores in different ways. Some creating consistently wound structures, othersasymmetrical structures or structures with varied material densities. For example,in the grid based systems, winding began at S1G1 (section 1 gripper 1) and rotatingclockwise, moved one gripper at a time until it met its corresponding gripper at S15before reversing direction and returning to S1G1. This type of systematic windingallowed for the easy buildup of necessary structural depth while also allowing foreasy variations in winding. The process was continued until the predeterminedstructural density was achieved.
Although successful at small-scale, allowing for extremely strong structures

54 A.J. WIT
and low-cost rapid prototyping, when brought up to full-scale of 15’ in length, thecored system introduced a series of problems ranging from material waste in theproduction of the core, form resolution in relation to the CFD model, complexmodule connections, undesirably high structural weight, an unwieldiness in thenavigating the core in the winding process and finally the rigid form made globalshipping to the site nearly impossible. For these reasons, a new approach wastaken, centered around a corelessly wound structure with high levels of structuralflexibility and compressibility.
5. CORELESS WINDING. FORM FOLLOWS MATERIALIn 2016, a series of coreless prototypes were initiated built off the frameworkdeveloped in rolyPOLY , culminating in the summer of 2017 with the testingof a series of four, uniquely wound and clad, 1/4th scale (approximately 5’by 4’ by 4’) CFRP prototypes in the cloud forests of Monteverde, CostaRica. The prototypes were tested under the rubric of CFRP frame flexibilityand durability; transportability; the compatibility of the CFRP frame to thePCM impregnated Dyneema fabric; the levels of change and control of internalpressures, temperatures and humidity in relationship to form, structure and PCMcontent and distribution; stability of the CFRP structure in severe, unpredictableweather conditions; as well as for the accuracy of the imbedded electronicsmonitoring systems. The following focuses solely on the aspects of thedevelopment of the prototypes related specifically to the CFRP framework. Otheraspects will be discussed in future papers.
Unlike the initial prototypes where the complex forms were predeterminedthrough Bernoulli’s principal and CFD analysis and necessitated the use of acore, similar to conventional systems previously discussed, these prototypesinvestigated the use of CFRP tow or cables treated as a series of intersecting cablenetworks in pure tension. As a network of cables acts similarly to a membrane intension, tensile modeling and simulation was used to generate the forms of the newstructure. Although this method of form finding can potentially minimize the typesof formal outcomes, it also maximizes the efficiency of the material, fabricationand assembly processes by utilizing the CFRP tow as its own formwork. A backand forth dialog between 3D modeling and CFD analysis allowed for the tuningof the formal outcomes.
5.1. FORM FINDING THROUGH TENSILE MODELING
Form finding for the second stage of prototypes was completed using the Kangarooand Meliar MPanel plug-ins for Rhino 3D. Kangaroo was utilized for initial formfinding where forms could be quickly developed, modified, extracted and testedin the CFD software, while MPanel was used for the generation of a more precisefinal form; estimating intersecting cable network deformation through the windingprocess by means of simulated surface deflation; and finally through FEA analysison tensile membranes as a guide for the CFRP network.
Initial form finding began by the simple parameterizing of five elements (A,B, C, D, E): A: Large circle representing where air enters the structure; B: Small
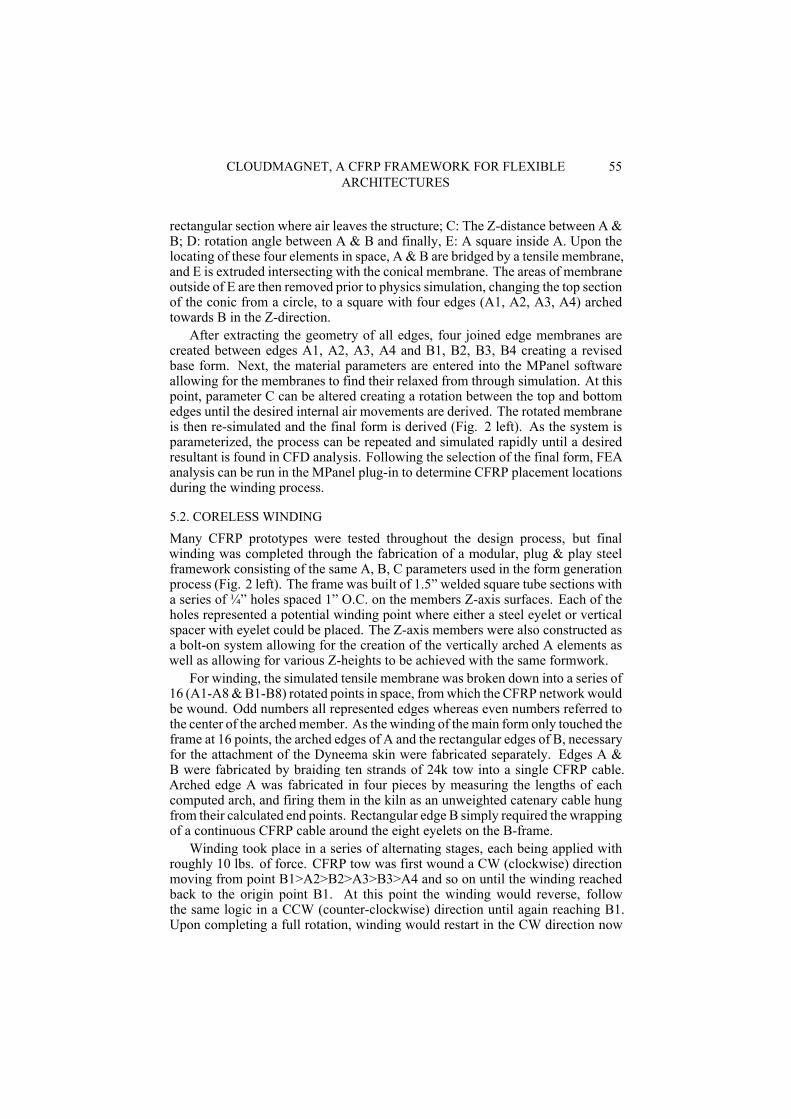
CLOUDMAGNET, A CFRP FRAMEWORK FOR FLEXIBLEARCHITECTURES
55
rectangular section where air leaves the structure; C: The Z-distance between A &B; D: rotation angle between A & B and finally, E: A square inside A. Upon thelocating of these four elements in space, A & B are bridged by a tensile membrane,and E is extruded intersecting with the conical membrane. The areas of membraneoutside of E are then removed prior to physics simulation, changing the top sectionof the conic from a circle, to a square with four edges (A1, A2, A3, A4) archedtowards B in the Z-direction.
After extracting the geometry of all edges, four joined edge membranes arecreated between edges A1, A2, A3, A4 and B1, B2, B3, B4 creating a revisedbase form. Next, the material parameters are entered into the MPanel softwareallowing for the membranes to find their relaxed from through simulation. At thispoint, parameter C can be altered creating a rotation between the top and bottomedges until the desired internal air movements are derived. The rotated membraneis then re-simulated and the final form is derived (Fig. 2 left). As the system isparameterized, the process can be repeated and simulated rapidly until a desiredresultant is found in CFD analysis. Following the selection of the final form, FEAanalysis can be run in the MPanel plug-in to determine CFRP placement locationsduring the winding process.
5.2. CORELESS WINDING
Many CFRP prototypes were tested throughout the design process, but finalwinding was completed through the fabrication of a modular, plug & play steelframework consisting of the same A, B, C parameters used in the form generationprocess (Fig. 2 left). The frame was built of 1.5” welded square tube sections witha series of ¼” holes spaced 1” O.C. on the members Z-axis surfaces. Each of theholes represented a potential winding point where either a steel eyelet or verticalspacer with eyelet could be placed. The Z-axis members were also constructed asa bolt-on system allowing for the creation of the vertically arched A elements aswell as allowing for various Z-heights to be achieved with the same formwork.
For winding, the simulated tensile membrane was broken down into a series of16 (A1-A8&B1-B8) rotated points in space, fromwhich the CFRP network wouldbe wound. Odd numbers all represented edges whereas even numbers referred tothe center of the archedmember. As the winding of themain form only touched theframe at 16 points, the arched edges of A and the rectangular edges of B, necessaryfor the attachment of the Dyneema skin were fabricated separately. Edges A &B were fabricated by braiding ten strands of 24k tow into a single CFRP cable.Arched edge A was fabricated in four pieces by measuring the lengths of eachcomputed arch, and firing them in the kiln as an unweighted catenary cable hungfrom their calculated end points. Rectangular edge B simply required the wrappingof a continuous CFRP cable around the eight eyelets on the B-frame.
Winding took place in a series of alternating stages, each being applied withroughly 10 lbs. of force. CFRP tow was first wound a CW (clockwise) directionmoving from point B1>A2>B2>A3>B3>A4 and so on until the winding reachedback to the origin point B1. At this point the winding would reverse, followthe same logic in a CCW (counter-clockwise) direction until again reaching B1.Upon completing a full rotation, winding would restart in the CW direction now

56 A.J. WIT
moving from B1>A3>B2>A4>B3 etc., again repeating in the CCW direction uponreaching B1. The shifting of each subsequent layer increases pressure within thetensile network moving the systems from a series of independent cables into amembrane like system. This process was continued, skipping one number farthereach pass for a total of eight passes (Fig. 2 right).
Figure 2. Left: winding frame w/membrane form. Right: winding pattern v.6.0.
Initial prototypes were created purely though the winding of CFRP tow inpure tension. Although successful, it was found in early prototypes that thismethodology used more material then desired and had higher levels of inherenterror. As each layer of tensioned CFRPwas added to the system, an uncontrollablelevel of loosening would appear in the initially wound layers, creating a conditionwhere the initial 2-3 layers had little to no structural integrity. To avoid thisloosening, and simultaneously reduce structural weight, a reusable, pretensionsystem was developed using small gauge steel cable and/or non-stretch string.
Rather than winding eight layers of CFRP to get the desired formal/structuralproperties, the first four layers were wound using a removable tensile substrate(Fig. 3 left & center). Following the previouswinding scenario, the first four layerswere wound using 1/16” steel cable secured to the frame through turnbuckles.Following the cable winding, the turnbuckles were tightened minimizing thechance of cable slippage during the CFRP winding process. Additionally, bywinding cables first, the desired form of the structure was predefined in a materialthat would not slide out of shape as tension was added to the system. Followingthe completing of the temporary cable network, the final four layers of CFRP werewound moving from B1>A4>B2>A5>B3 etc. while repeating the same processas previously described.
Following winding, each structure was fired in a large kiln at a temperatureof 260°F for four hours with two hours of temperature ramp up/down times. Postcuring, the members of the steel framework are simply unbolted and the CFRPframe can be easily removed from the eyelets and reset for the next prototype.The four prototypes, with their high levels of programmed flexibility at the wideends, were nested inside each other and bent inward into a single 18” diameter

CLOUDMAGNET, A CFRP FRAMEWORK FOR FLEXIBLEARCHITECTURES
57
box for shipping. Upon arriving in Costa Rica, the prototypes were taken outof the box where the immediately assumed their pre-bent shape. For the initial1/4th scale testing in Costa Rica, the CFRP structure, the A & B edges and theDyneema frame are simply attached via zip ties and industrial strength Dyneemafabric welding tape.
Figure 3. Left: early prototype with sacrificial formwork. Center: Wound prototype in kiln.Right: Complete structure 2 of 4.
5.3. RESULTS AND CONCLUSIONS
Unlike the initial cored prototypes, the coreless prototypes showed potential inseveral areas: Although less structurally ridged than their cored counterparts, theycreated no construction waste, were far more materially efficient, were extremelyeasy to fabricate consisting of only four elements (i.e. the coreless frame, thearched “A” edges, the rectangular “B” edges, and the Dyneema fabric skin), whilealso showing the ability to program flexibility in certain areas of the structurethat could be simply reinforced by the attached skin system (Fig. 4). Upontesting in the cloud forest, the structure showed good potential in dealing withthe high wind loads being applied, as the CFRP could flex and adapt based on theamount of flow passing though the structure (Fig. 3 left). A slight delaminationof layers was noticed in several areas after the week of intense testing and willneed to be reevaluated and tested in during the winding process. Inconsistenciesin the process could also be eliminated through the automation of the windingprocess. Additionally, more research is needed in the scaling up of the project tofull-scale and in the translating the knowledge learned in cloudMAGNET into thearchitectural scale project Dinner4Six.
Although more research is necessary in moving flexible coreless windingbefore it is feasible at the scale of architecture, the CFRP frames in conjunctionwith the PCM impregnated Dyneema frames in cloudMAGNET showed goodpotential in how architectural forms, fabrication and assembly processes can bereimagined and simplified.

58 A.J. WIT
Figure 4. Sampling of coreless wound prototypes.
AcknowledgementsThe author would like to acknowledge all of the founding research for thecloudMAGNET project initiated by Rashida Ng and Sneha Patel, as well as forall the assistance in the researches development and testing by Mary Seykot, SeanMoss, Cheng Zhang as well as the students and faculty who tested the kitesas part of the Temple University + James Madison University summer researchseminar in Costa Rica. This research was partially funded by a Temple UniversityPresidential Humanities and Arts Program Award.
ReferencesFrearson, A.: 2011, “BMW Guggenheim Lab” . Available from <https://www.dezeen.com/20
11/08/04/bmw-guggenheim-lab-by-atelier-bow-wow/> (accessed 15th December 2017).La Magna, R., Waimer, F. and Knippers, J.: 2016, Coreless winding and assembled core-Novel
fabrication approaches for FRP based components in building construction., Constructionand Building Materials, 127, 1009-1016.
Menges, A. and Knippers, J. 2018, Fibrous Tectonics, in M. Daas (ed.), Towards a RoboticArchitecture, Applied Research + Design, 64-75.
Prado, M., Doerstelmann, M., M, S.o.l.l.y., Menges, A. and Knippers, J.: 2017, ElytraFilament Pavilion: Robotic Filament Winding for Structural Composite Building Systems,Proceedings of Fabricate 2017, 224-233.
Reichert, S., Schwinn, T., Waimer, F., La Magna, R., Knippers, J. and Menges, A.:2014, Fibrous structures: An integrative approach to design computation, simulation andfabrication for lightweight, glass and carbon fibre composite structures in architecture basedon biomimetic design principles, Computer-Aided Design, 52, 27-39.
Wit, A.J., Kim, S., Ibanez, M. and Eisinger, D.: 2016, Craft Driven Robotic Composites, 3DPrinting and Additive Manufacturing, 3, 2-9.
Wit, A.J., Ng, R., Zhang, C. and Kim, S.: 2016, Composite Systems for LightweightArchitectures, ACADIA 2016, 326-331.

ONSITE ROBOTIC FABRICATION FOR FLEXIBLE WORKSPACES
Towards Design and Robotic Fabrication of an Integrated Responsive CeilingSystem for A Workspace Environment
DAGMAR REINHARDT1, CHRISTHINA CANDIDO2,DENSIL CABRERA3, DYLAN WOZNIAK-O’CONNOR4,RODNEY WATT5, CHRIS BICKERTON6,NINOTSCHKA TITCHKOSKY7 and MARYAM HOUDA81,2,3,8University of Sydney1,2,3{dagmar.reinhardt|christhina.candido|densil.canbrera}@sydney.edu.au [email protected],5DMaF University of Sydney4,5{dylan.wozniak-oconnor|rod.watt}@sydney.edu.au6,7BVN6,7{Chris_Bickerton|Ninotschka_Titchkosky}@bvn.com.au
Abstract. Open, flexible workspaces were introduced decades ago, butarchitectural design approaches to ceiling systems have not changedsubstantially. This paper discusses the development of strategiesand prototypes for a lightweight, integrated ceiling structure that isrobotically woven. Through geometrically complex, fibre-reinforcedbuilding elements that are produced onsite, a new distribution system fordata and light can be provided and support individual and multi-groupcollaborations in an contemporary open-plan office for maximumflexibility. The paper introduces applied design research with casestudies that test robotic weaving on an architectural ceiling. Thesecond part contextualises the presented work by linking it to workspacescenarios and an on-site robotic process with a resulting data distributionthat is designed to produce degrees of freedom for high flexibility inuse, allowing occupants to organise the workspace layout autonomouslyso that workflow constellations in different teams can be adequatelyexpressed through space. The paper concludes with a discussion of aframework for robotic methods developed for the carbon-fibre overheadweaving processes, followed by conclusions and outlook towards futurepotentials.
Keywords. Open collaborative workspace; robotic onsite weaving;carbon fiber; integrated ceiling systems.
1. IntroductionOur daily workspaces provide the physical, digital and social contexts withinwhich people create, collaborate, share knowledge and solve problems (Groves
T. Fukuda, W. Huang, P. Janssen, K. Crolla, S. Alhadidi (eds.), Learning, Adapting and Prototyping,Proceedings of the 23rd International Conference of the Association for Computer-Aided ArchitecturalDesign Research in Asia (CAADRIA) 2018, Volume 1, 59-68. © 2018 and published by the Association forComputer-Aided Architectural Design Research in Asia (CAADRIA) in Hong Kong.

60 D. REINHARDT ET AL.
and Marlow, 2016). Over the last decade, the design of contemporary workspaceshas dramatically changed in Australia towards flexible and reconfigurable workingenvironments. Particularly in highly collaborative organisations, the physicalconfigurations of workspaces and specifically workplace infrastructure need to beadequate for a mobile workforce. Changing work and team constellations requirea different organisational approach to general fit-out, table arrangements, dataprovision, and lighting integration.
This research investigates the potential for an integrated ceiling structure asorganiser of open and flexible workspace environments; focusing on infrastructuresystems such as data, power, lighting, and air-conditioning distribution. Thepaper presents ongoing research into design and fabrication of an integrated,responsive ceiling system produced onsite as a series of robotically woven carbonfibre structures. The paper discusses the development of digital workflow a forthe 1) rethinking occupational uses and linked service requirements for flexibleoffice workspace and data distribution; the 2) application of fibrous compositematerials and weaving deposition technology (in analogue and digital studies);the 3) computational design of a weaving syntax for shape variations relativeto obstacles and boundaries; the 4) robotic fabrication production of producedifferentiated parts of constant quality; and 5) transfer to on-site context with 1:1overhead robotic weaving in operating office environment. The paper concludeswith a discussion of results and adaptations, and an outline of future work.
2. Background and AimsMain drivers for workplaces can be identified as organisational strategies,workforce attitudes and expectations, and technological advancements forworkplaces (Brill et al., 2001). Unfortunately, while research is being undertakento change the operation of workspaces, the physical reality is that 90 percent of alloffices today sit in a building stock that has not changed since the 1960s. Standardceiling grid systems continue to limit physical and thus also organisationalchanges.
2.1. INTEGRATED CEILING SYSTEMS AND FLEXIBLE WORKSPACES
The research aligns with a strategic workplace retrofit that dictated several points,including to maintain the currently already exposed ceiling services (HVAC,light). Two occupancy surveys were produced to understand the general capacityand performance of the existing open-plan workspace, using an evidence-basedframework (BOSSA/Building Occupant Survey System, Candido et al., 2016, a,b), with results averaging below expected levels for overall performance, healthand productivity.In response, the research aims at rearranging work scenarios atany time to collaborative interaction, teamwork or individual multi-screen desking.It proposes a ceiling system of multiple soffit-hung, rotational and retractablepower/data ‘booms’ 1800 mm in diameter, and capacity to feed eight desks withpower and fibre optic cable. To this extent, a generic script (kernel/circle packing,GH) was deployed to reference a data tree structure with organisational centres(booms) to minimise distances, while accounting for existing obstacles (such as
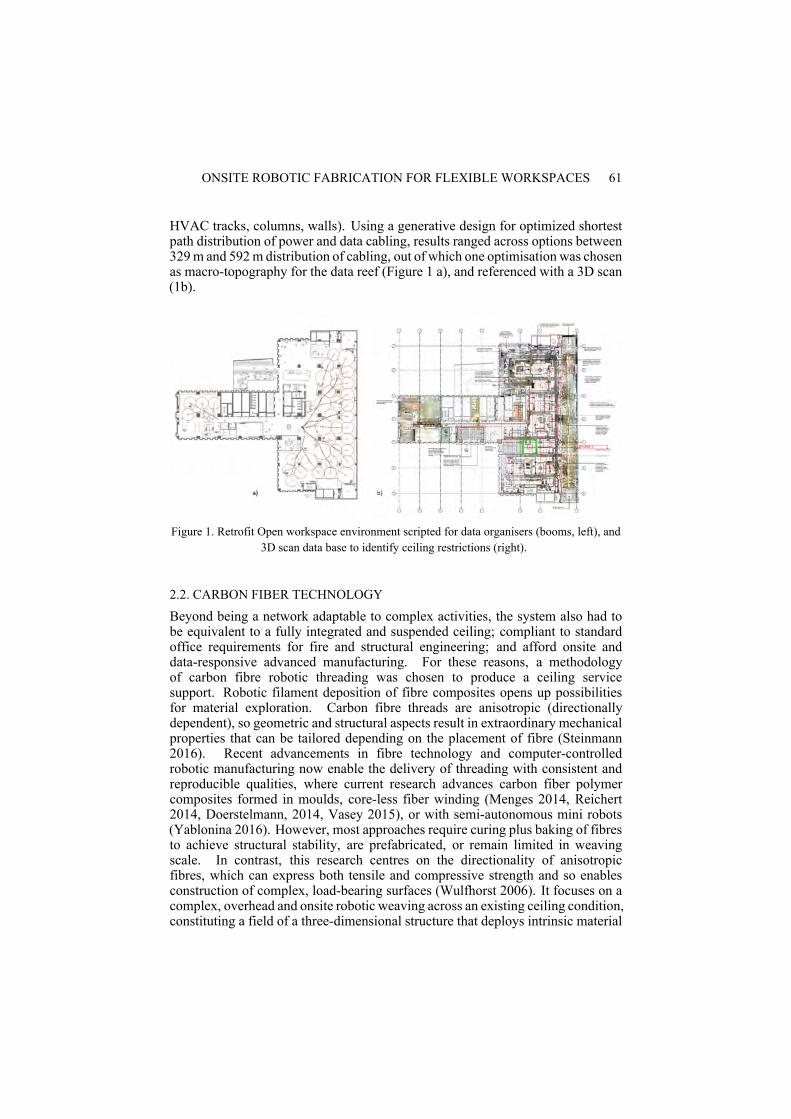
ONSITE ROBOTIC FABRICATION FOR FLEXIBLE WORKSPACES 61
HVAC tracks, columns, walls). Using a generative design for optimized shortestpath distribution of power and data cabling, results ranged across options between329m and 592m distribution of cabling, out of which one optimisation was chosenas macro-topography for the data reef (Figure 1 a), and referenced with a 3D scan(1b).
Figure 1. Retrofit Open workspace environment scripted for data organisers (booms, left), and3D scan data base to identify ceiling restrictions (right).
2.2. CARBON FIBER TECHNOLOGY
Beyond being a network adaptable to complex activities, the system also had tobe equivalent to a fully integrated and suspended ceiling; compliant to standardoffice requirements for fire and structural engineering; and afford onsite anddata-responsive advanced manufacturing. For these reasons, a methodologyof carbon fibre robotic threading was chosen to produce a ceiling servicesupport. Robotic filament deposition of fibre composites opens up possibilitiesfor material exploration. Carbon fibre threads are anisotropic (directionallydependent), so geometric and structural aspects result in extraordinary mechanicalproperties that can be tailored depending on the placement of fibre (Steinmann2016). Recent advancements in fibre technology and computer-controlledrobotic manufacturing now enable the delivery of threading with consistent andreproducible qualities, where current research advances carbon fiber polymercomposites formed in moulds, core-less fiber winding (Menges 2014, Reichert2014, Doerstelmann, 2014, Vasey 2015), or with semi-autonomous mini robots(Yablonina 2016). However, most approaches require curing plus baking of fibresto achieve structural stability, are prefabricated, or remain limited in weavingscale. In contrast, this research centres on the directionality of anisotropicfibres, which can express both tensile and compressive strength and so enablesconstruction of complex, load-bearing surfaces (Wulfhorst 2006). It focuses on acomplex, overhead and onsite robotic weaving across an existing ceiling condition,constituting a field of a three-dimensional structure that deploys intrinsic material

62 D. REINHARDT ET AL.
properties and structural performance inherent in the fibre to negotiate forcesinherent in the system, and a travelling point load presented by temporary towingof the data cable.
3. Robotic WeavingThe robotic weaving explored in the research project is geared towards identifyinga base geometry that combines the morphogenetic shape and robot workspace witha weaving syntax.
3.1. MORPHOGENETIC SHAPE AND MORPHOSPACE
Physical scaled weaving studies in builders’ rope and carbon fibre on customisedlooms were conducted as a comprehensive description of morphogenetic weavingpatterns, where the differentiated fibre layout weaving becomes a gradientvariation of material properties and geometry (not displayed). As a precursor torobotic weaving, a catalogue of potential shape variations was developed relativeto boom diameter as a constant (1800 mm), with variables including step countpattern in weaving density, partial or full weaving, diameter and segmentation ofsoffit ring hook, robot position to circle (Figure 2, a-e).
Figure 2. Diagramming potential robotic prototypes (a-e), robotic workspace and reach (f),confirmation of primary weaving access (g), and robotic work volume intersections (h).
3.2. INITIAL WEAVING SYNTAX
The research developed a weaving syntax that describes the order of positioningfor fibre threads. Initial weaving tested a continuous skip count of eight in aconstant direction (between upper and lower target hooks, independent of overallnumber) with five returns over a shifting starting point. As illustrated in Figure3 (a-b), by then varying the skip count (number of layers deposited), differentthread patterns result in varying densities (20 subdivisions versus denser 80).

ONSITE ROBOTIC FABRICATION FOR FLEXIBLE WORKSPACES 63
Furthermore, by decreasing skip counts successively (10-8-6), a ruled surface withgreater curvature is compressed by fibres with a smaller count. This is importantsince the weaving syntax then allows one to specifically address multiple passesof weaving that strengthen defined directions of tensile stress. It also impacts onthe adhesive performance of the fibres which, when overlaid, are pulled togetherand form a stable hyperbolic surface, so that compressive rigidity is added.
Figure 3. Prototype 1 with full circle weaving (a), variability in thread count (b), blind spot inreach (c), close-up matching hook distances and end-effector angle (d).
4. Three Robotic PrototypesDue to a defined short development period for the project (4.5 months), theresearch moved directly into a feasibility study for testing potential robotmanufacturing for on-site implementation. The robotic work cell with a KUKAKR 10 was set up within a 17.5 m2 plywood ceiling area that physicallysimulates site constraints regarding sufficient ceiling height (proto1) and potentialinterruptions to the robotic workflow by existing services (proto 2). Foreach, initial studies in fast and soft material prototyping (rope) tested technicalchallenges involved in calibrating, positioning and repositioning the robot, andvalidated workflow and methods before real-time threading. For materialevaluation and performance, a factory-wound bobbin of carbon fibre tow (12k,2 kg standard industrial, T300, tensile strength 3530 MPa) was deployed utilisinga hacked carbon fibre x-winder typically used for winding fibrous threads ontomandrels to produce low-cost tubes or other parts. This provided a versatilesystem for impregnating the carbon fibre tow with a specific resin quantity, andminimized fraying through fiction as fibers are unwound from the spool; runthrough a pre-mixed resin bath (WEST 105 resin, 209 extra slow hardener); aredrawn through a tension plate couple to unload excess resin; and pass across aseries of chemically resistant rollers to bring the tow to the top of the ‘unwinding’mechanism. From this point, a pulley-based tension system ensures continuoustension on the tow as it passes up to the end of the third axis of the robot. A dualdirectional roller ring keeps friction minimal as the tow unspools to the tip of therobot, which utilizes modified angling componentry on a rigid rod as a robotic endeffector. The drying period was 20-24 hrs at 22 C, with 4-9 days curing time for

64 D. REINHARDT ET AL.
maximum strength.
4.1. PROTOTYPE 1: FULL SOFFIT CIRCLE THREADING
RoProto1 uses two large-scale circle segments to test sequencing for weaving, testdensity patterns, overcome blind spots in robotic reach, and to achieve correctturnround at hook positions (Figure 4a). The robot is placed centrally and weavesinside across 350 degrees. By transferring weaving patterns first into a sequencein a string (builders rope, first stepover), and then retracing in industrial carbonfibre (4c), strength and stiffness for the carbon fibre laminate could be evaluated.Results indicated that sufficient structural capacity could be derived for materialproperties for a multi-directional layer with five stepovers.
Figure 4. Prototype 1 in simulated office ceiling, phase1 (ideal complete weave, a), multiplestepovers overcoming blind spot (b), and carbon fiber final (c) .
It is important to note here that the robot motion script is from the startconstructed to privilege variability and allow a maximum of updates relative tosome criteria adaptations. At this stage, the script orchestrates weaving density,access angle of end effector reach towards hook heads, and exact position offixings as the primary starting point of a weave. This enabled the research tomove seamlessly into further development of the script for prototype 2, wherethe two complimentary rings and closed weaving was exchanged for multiplehooking points. At a later stage (RoProto 3), the same adaptability in the scriptprovides an inbuilt tolerance that also caters for misplacements of soffit fixingsdue to human error, or previously unregistered site constraints. By re-referencing afixing point once it is placed, the script maintains a capacity to semi-autonomouslyupdate robotic threading patterns, in response to system positioning, location, andavailable fixings points.
4.2. PROTOTYPE 2: MULTI-SEGMENT SOFFIT CIRCLE THREADING
RoProto2 extends the initial, inside robotic positioning and singular centric weavefor a boom with 82 teeth fabricated from 3D printed professionally graded ABS

ONSITE ROBOTIC FABRICATION FOR FLEXIBLE WORKSPACES 65
components. Relative dependencies were developed for three interior placedsoffit hooks (phase 1), and four robot positions that add six external and resultingpotential weave through options (phase 2, Figure 5).
Figure 5. Prototype 2 in simulated office ceiling, phase1 (inside 3 hooks, a) and fibre version(b). Phase 3 onsite results carbon fiber threading inside and soft fabrication outside (c). .
Figure 6. Prototype 2 negotiates between inside and outside soffit points (plan, a).Combinations of outside single hook (b), or doubles with varying distance and density (c).
The physical robotic prototypes were paralleled with script updates and roboticsimulation to develop strategies. In instance a), the soffit hooking is placedbetween robot centre and lower ring with 500 mm distance, which allowedsufficient fibre spread onto lower ring (16 hooks, 180 m fibre) with resultingexcellent compression between layers, based on limited horizontal reach due tothe constrained reach angle of end effector, which served as generic base modulefor later adaptations. In b), two soffit hooks are placed offset from the centrelinebetween robot centre and lower ring (600 mm distance), allowing a larger amountof fibre placement, and resulting in denser surface across all areas, but with

66 D. REINHARDT ET AL.
constraints in the work envelope. In c), the two soffit hooks are further positionedfrom the centreline between robot centre and lower ring (1000 mm distance),which greatly increased robotic reach and thus flexibility of deposition on hookingelements. This resulted in longer fibre deposition, expected fewer intersectionsand compression of fibres, with additional robot movements required to completethe weave.
4.3. PROTOTYPE 3: ONSITE, IN-CONTEXT ROBOTIC THREADING
RoProto3 transferred these updated scripts and workflow for integration with theadded challenge of weaving inside a ceiling void (Figure 7). In-between standardobstacles and non-go zones set by different existing service elements includingmajor beams, HVAC, cabling, fire outlets, and core areas were embedded into thescript, so suitable data solutions for manufacturing could be generated.
Figure 7. Densely layered multiple deposition of carbon fibre threads (local detail, left);overall boom (inside weave, ready for secondary weave, right).
For all prototypes, the robot is located on a platform to account for thehigher ceiling (3.175 m), and calibrated by locating the project origin, referencingMcNeel Rhino data modelled on original 3D data scan against an actual site.A dry run is simulated in GH and KUKA| prc to check robot positions andhook positions, and potentially shift the overall system due to discrepancies thatimpede robot reach or tooling path. Hooks to be bolted to ceiling are physicallymeasured as coordinates out of rhino (site survey), acrow-prop clamps and boompositioned from the project origin and checked against collision and accessibilitywith weaving pattern and order of deposition. The robot is then calibrated bymanually direct the end effector to hooks to confirm data positions (embedded GHscripts take calibration points with base splines referencing ideal vs actual), andinner three threading produced (phase 1, with 180 m per hook position). For allconsecutive phases and remaining four external robot positions, calibration andthreading are repeated on each root position (200 m per outside hook position).While threading proceeded efficiently as proof of concept, the cost of manual
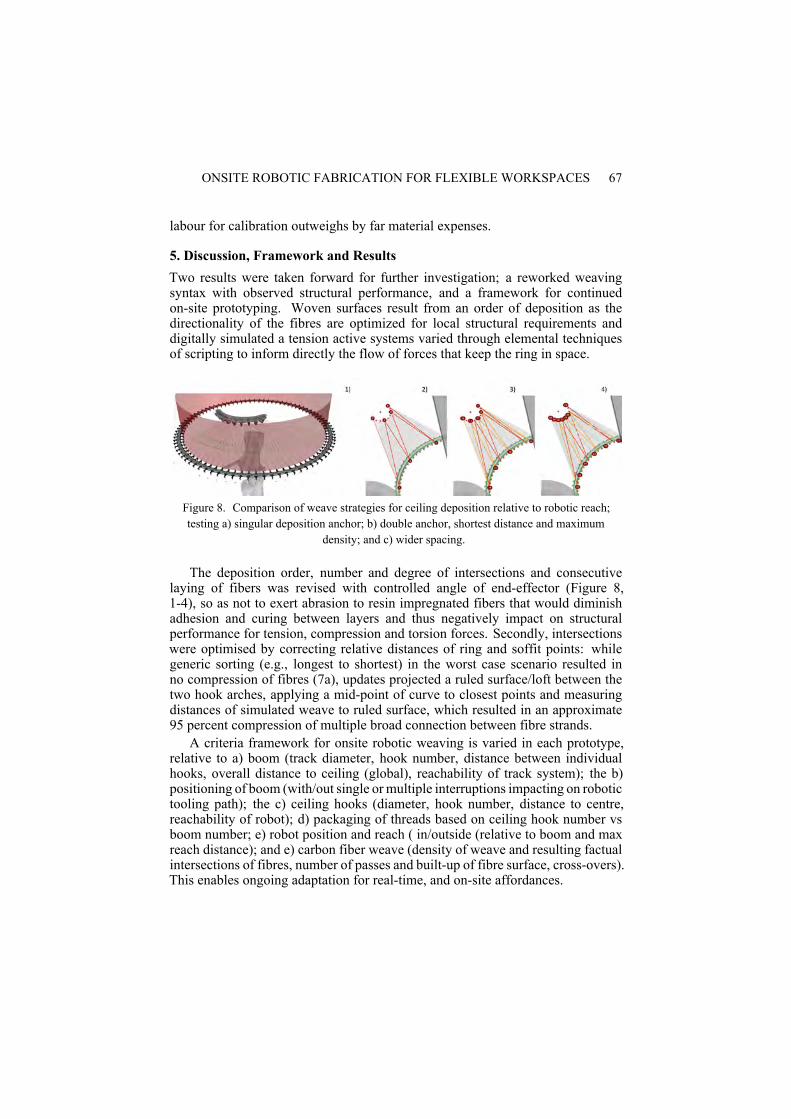
ONSITE ROBOTIC FABRICATION FOR FLEXIBLE WORKSPACES 67
labour for calibration outweighs by far material expenses.
5. Discussion, Framework and ResultsTwo results were taken forward for further investigation; a reworked weavingsyntax with observed structural performance, and a framework for continuedon-site prototyping. Woven surfaces result from an order of deposition as thedirectionality of the fibres are optimized for local structural requirements anddigitally simulated a tension active systems varied through elemental techniquesof scripting to inform directly the flow of forces that keep the ring in space.
Figure 8. Comparison of weave strategies for ceiling deposition relative to robotic reach;testing a) singular deposition anchor; b) double anchor, shortest distance and maximum
density; and c) wider spacing.
The deposition order, number and degree of intersections and consecutivelaying of fibers was revised with controlled angle of end-effector (Figure 8,1-4), so as not to exert abrasion to resin impregnated fibers that would diminishadhesion and curing between layers and thus negatively impact on structuralperformance for tension, compression and torsion forces. Secondly, intersectionswere optimised by correcting relative distances of ring and soffit points: whilegeneric sorting (e.g., longest to shortest) in the worst case scenario resulted inno compression of fibres (7a), updates projected a ruled surface/loft between thetwo hook arches, applying a mid-point of curve to closest points and measuringdistances of simulated weave to ruled surface, which resulted in an approximate95 percent compression of multiple broad connection between fibre strands.
A criteria framework for onsite robotic weaving is varied in each prototype,relative to a) boom (track diameter, hook number, distance between individualhooks, overall distance to ceiling (global), reachability of track system); the b)positioning of boom (with/out single ormultiple interruptions impacting on robotictooling path); the c) ceiling hooks (diameter, hook number, distance to centre,reachability of robot); d) packaging of threads based on ceiling hook number vsboom number; e) robot position and reach ( in/outside (relative to boom and maxreach distance); and e) carbon fiber weave (density of weave and resulting factualintersections of fibres, number of passes and built-up of fibre surface, cross-overs).This enables ongoing adaptation for real-time, and on-site affordances.

68 D. REINHARDT ET AL.
6. ConclusionThe research discussed the potential for carbon fibre threading to form complexgeometries and programmable material behaviour by testing relationships betweenweaving patterns of different deposition and density, to derive morphologicarticulations in integrated ceiling construction. Based on 3D scanning,development of a multi-criteria responsive script, and consecutive adaptablerobotic onsite fabrication, a comprehensive workflow was established thatenables continued manufacturing of prototype series; responds to contextualrestraints and desired workspace scenarios; and provides an alternative to standardceiling service distribution, thus potentially altering environmental conditions andworkplace performance. Further studies will explore a collaborative and furthercontinued learning workflow where the robot scans environmental conditionsagainst the script matrix, checks allowable tolerances, and indicates via laserprojection accurate positions in space for robot placement and hooks, which willallow the research to expand beyond this specific environment towards genericadaptability for other workspaces.
Acknowledgements. Research collaboration of the Robotics Lab, SydneySchool of Architecture, Design and Planning, The University of Sydney(USyd), with industry partner BVN, supported by a major research grant (GrantIDG196262). With team contributions by BVN: Mathew Blair, Paul Wintour,Suleiman Alhadidi, Farbod Fathalipouri, Nazgol Asadi, Sam Sweeney, RossSeymour; USyd: Matt Hunter, Michell Page; DMaF Robotic team: Lynn Masuda,Susana Alarcon Licona, Kin Ly.
ReferencesBrill, M.: 2001,Workplace Design, Kimball International.Candido, C.M., Kim, J., De Dear, R. and Thomas, L.: 2016, BOSSA: A multidimensional
Post-Occupancy Evaluation tool, Building Research and Information (Print), v.44(2),214-228.
Groves, K. and Marlow, O.: 2016, Spaces for Innovation – The Design and Science of InspiringEnvironments, Frame Publishers, Amsterdam.
Laing, A., Duffy, F., Jaunzens, D. and Willis, S.: 1998, New Environments for Working:The Redesign of Offices and the Environmental Systems for New Ways of Working, Spon,London.
Menges, A. 2014, Core-Less Filament Winding Robotically Fabricated Fiber CompositeBuilding Components, in W. McGee and M. Ponce De Leon (eds.), Robotic Fabricationin Architecture, Art and Design 2014, Springer International Publishing Switzerland.
Reichert, S., Schwinn, T., Menges, A. and Knippers, J.: 2015, Fibrous structures: An integrativeapproach, Elsevier, 1, 200.
Schieber, G., Koslowski, C., Knippers, J., Doerstelmann, M., Prado, M., Vasey, L. and Menges,A.: 2015, Integrated Design and Fabrication Strategies for Fibrous Structures in, SpringerInternational Publishing Switzerland 2015, x, 237-245.
Steinmann,W. and Sealhoff, K. 2016, Essential Properties of Fibres for Composite Applications,in S. Rana and R. Fanguero (eds.), Fibrous and Textile Materials for CompositeApplications, Textile Science and Clothing Technology, Elsevier.

Computational Design Processes,Theory and Education

70

CYBORG SESSIONS
A Case Study for Gender Equity in Technology
SHELBY DOYLE1, LESLIE FOREHAND2, ERIN HUNT3,NICK LOUGHREY4, SARAH SCHNEIDER5 and NICK SENSKE61,2,3,4,5,6Iowa State University1,2,3,4,5,6{doyle|forehand|elhunt|loughrey|schnei|nsenske}@iastate.edu
Abstract. This paper discusses the ongoing lack of gender equity inarchitecture - specifically the shortfall of women in design technology- and presents a robotics workshop in the United States as a case studyand method to challenge this inequality. The goals of this paper are to1.) define a research agenda for documenting and understanding genderequity in design technology and 2.) to offer evidence-based strategiesfrom STEM education and this architecture case study for improving therepresentation of women in this field.
Keywords. Gender; Equality; Women; Feminism; Robotics.
1. Context and DataIt is well documented that women are underrepresented in academic andprofessional positions that specialize in technology (Corbett and Hill, 2015).As technology becomes increasingly essential to the practice and discipline ofarchitecture, underrepresentation threatens to reduce opportunities for women andthe diversity of the workforce. This may have consequences for the quality ofdesign in the built environment. Participation in technology and its reflection of(and possible role in promoting) gender inequality within the profession must becritically examined and countermeasures proposed, tested, and disseminated.
The gender gap in technology is harmful not only to women, but to everyone.According to technology entrepreneur and activist Judith Owigar, women todayoften see themselves as consumers of technology, rather than its creators.(Newnham, 2016) This has consequences in architecture, when being left behindin technology can limit one’s participation in the design process and access toleadership roles. Within the building profession, design technology is an emerginglocus of architectural power: those who control technology have a strong influenceupon architectural practice. (Loukissas, 2012)
T. Fukuda, W. Huang, P. Janssen, K. Crolla, S. Alhadidi (eds.), Learning, Adapting and Prototyping,Proceedings of the 23rd International Conference of the Association for Computer-Aided ArchitecturalDesign Research in Asia (CAADRIA) 2018, Volume 1, 71-80. © 2018 and published by the Association forComputer-Aided Architectural Design Research in Asia (CAADRIA) in Hong Kong.

72 S. DOYLE ET AL.
Figure 1. Cyborg Sessions participants explore the Turtle as a drawing tool. Photo by authors.
Acknowledging the scope of the imbalance is difficult because, presently,specific data are not being collected about women’s participation in designtechnology in architecture, either in practice or in academia. At the moment, thebest indications of the gender gap come from other sources of data. For example, in2014, statistics released by the Association of Collegiate Schools of Architecturefound that women comprised slightly more than 40 percent of North Americanarchitectural graduates in 2013; 25 percent of designers in the profession; and 18percent of major design awardees in the 2010s. (ACSA, 2014) However, whilethe number of women in the profession of architecture has increased, the numberof women in the field of design technology appears to be disproportionatelysmall. According to ZweigWhite’s 2013 information technology survey, only 5percent of technology directors at North American architecture firms are women.(Davis, 2014) An examination by the authors of recent papers from the Associationfor Computer Aided Design in Architecture (ACADIA) found that, in the years2010-16, twenty-six percent of all co-authors were women and only eight percentof papers had women as the first or sole author. (Doyle and Senske, 2016)This is well below the representation of women in architecture, but comparableto the gender gap found in other technological fields. (Corbett and Hill, 2015)Unfortunately, there are few other studies focused on this imbalance at themoment.The current understanding of gender in architecture remains limited, as does ourunderstanding of how women access and influence technology.
While there is a lack of data collected about this gender gap in architecture,there is significant STEM (Science, Technology, Engineering, and Math) researchon the issue which reveals of the overall state of women in technology as acomparison. STEM data indicates that women are significantly underrepresentedin fields similar to technology in architecture, such as computing majors andprofessions. Women currently earn only 18% of all Computer Science degreesand it is the only STEM major to report a decline in women participation overthe last decade. (NCES, 2016) A 2013 report found that just 26% of computingprofessionals were women – a percentage which is about the same as it was in1960. (Corbett and Hill, 2015) Collection of this data has been an important step

CYBORG SESSIONS 73
in helping to highlight and address this issue, though it has not led to gender parityin STEM. To successfully argue for gender equality, detailed and accurate statisticsare needed to move beyond anecdotal evidence.
2. CausesWhy does a technology gender gap exist? Research in STEM fields has identifiedseveral possible causes which may parallel those in design. These causes mayhave been inherited by architecture in the transfer of knowledge and technique.In a speech given at the Grace Hopper Celebration of Women in ComputingConference, Susan Wojcicki (CEO of YouTube), proposed two possible reasonswomen choose not to study computing: they think it is boring and they do not thinkthey would perform well at it. (Wojcicki, 2016) From the outside, working withtechnology can seem unexciting. Because they lack access to mentoring, clubs,courses, etc. many young women have not had the opportunity to learn firsthandhow technology can be creative and empowering. Due to socialization and genderroles, many men begin working with technology from a younger age, which leadsto better performance in technology fields in college. Women who are exposedto technology in primary school education are much more likely to participate inSTEM majors. (Rogers, 2013) The second reason, concern about performance,manifests as a lack of confidence in one’s abilities and less willingness to attemptnew or challenging activities. This may be caused by ‘stereotype threat,’ which iswhen individuals fear they will confirm a stereotype about a group to which theybelong. This has been shown to affect performance and to impact decisions. Inthis manner, negative stereotypes about women’s performance in math and scienceare thought to be a factor in the inequality found in computing fields. (Corbett andHill, 2015)
There is no evidence that women are less capable users or creators oftechnology. To the contrary, data shows that women have the qualificationsand test scores to join STEM-related subjects and perform well when they do.(Fisher and Margolis, 2002) Furthermore, history is filled with great pioneersof computing such as Ada Lovelace, Joan Clark, and Margaret Hamilton whodemonstrate women’s capabilities in the field. Ability is not the deciding factor.Many women choose not to study technology because they find its values to beinsular and antisocial. They do not feel that a career in technology will allow themto collaborate with other people or make things which create social good. Anotheraspect of this is the male-centered gamer culture of today that emerged out ofearly personal computing, which can appear inaccessible to women ‘outsiders.’As Wojcicki explains, when it comes to technology, many women today feel thatthey do not belong, and because of this, they do not want to belong. (Wojcicki,2016) The problems discouraging women from participating in technology arecultural and institutional. Education, which has traditionally held the power toshape culture and produce equality, is part of the solution and redistribution oftechnology access and authorship.

74 S. DOYLE ET AL.
3. Precedent WorkshopsOne of the ways that STEM fields address their gender gaps is through the creationof technology workshops. The idea is to create opportunities specifically forwomen, who may not feel comfortable or encouraged in more traditional settings.For example, Girls Garage is a high school program in Berkley, California wherestudents learn about design and construction through hands-on activities. Thefounders acknowledged that ‘as female instructors, we recognized that our younggirls were not reaching their full potential in the co-ed classroom’. After creatinga female-only workshop, 85% of enrolled female participants said they weremore interested in STEM fields. (Pilloton, 2017) Girls Who Code is anotherorganization that teaches computer science to 6-12th grade girls. By 2014, 95% ofthe 3,000 students who completed an intensive Girls Who Code course went on tomajor in computer science. (Dockterman, 2014) Other STEM workshops, such asthe NSF-funded TechBridge camps, led to increased interest in engineering andawareness of green- and electrical-engineering concepts. Compared to controlgroups, twice as many girls who attended TechBridge camps said they wouldlike to become engineers. (Sammet and Kekelis, 2016) Improving women’sconfidence in their abilities and increasing their interest are two ways thatworkshops can improve the participation of women in technology.
4. Case StudyTo begin to address the inequality of women in technology at their institution,the authors developed and taught a workshop in the fall of 2017, entitled CyborgSessions: Women in Robotics. The term cyborg was used to specifically drawconnections between architectural technology scholarship and feminist discourse,specifically the work of scholar Donna Haraway who popularized the term. Thecyborg is a hybrid creature, machine and organism, a being of social reality as wellas science fiction. As a popular trope of feminist scholarship, the cyborg allows athing to be “both/and”-a condition that resists the binary nature of computationalones and zeros. Additionally, the cyborg is the integration of human and machine,or a name for what occurs when a robot and human collaborate to produce acreative outcome.
Robots were selected as the primary technology because they represent a formof literal empowerment - allowingwomen to overcome real and perceived physicallimitations that may create, or perpetuate, gender bias. In this context, robots wereconsidered co-authors rather thanmere tools or ‘servants’. Through this workshop,the participants identified and pursued methods for investigating the potentials ofcreative expression via robotics.
The authors looked to a broad range of 21st century feminist discourses abouttechnology to situate the workshop: from techno-feminism to cyber feminismto fourth wave feminism. An important conclusion of the research was anunderstanding of feminism which does not mean only ‘of and by women’ butlooks to a full gradient of potential across a diverse and intersectional set ofauthors. Additionally, feminist work - that which generates a more just and equalenvironment - can be produced by authors which do not identify as female. Perhaps

CYBORG SESSIONS 75
it is a limitation of current language but in the future the term feminism might beused interchangeably with inclusion.
Specifically, the authors drew inspiration from a term they introducedat the 2017 ACADIA conference: Computational Feminism, which is anevolution of feminism and a reaction to the gender biases present in mosttechnologically-focused work found in architecture today. (Doyle et al, 2017)The objectives of Computational Feminism are 1) exploring the full gradient ofpossibilities technologies offers 2.) enhancing the subjective and intuitive as acounterpoint to methods and devices that have control as a mechanism or goal and3.) the exploration and production of joy and pleasure as opposed to economiesof optimization and bravado expressions of virtuosity. A key provocation of thisworkshop - which elevated it above merely learning to code for its own sake - wasthe question of how making with robots can represent a perspective and processthat is female. The vehicle for the students’ investigations were the traditionsof drawing and painting - with their histories, conventions, and agendas - whichserved as the interface between the roboticist and robot.
4.1. OVERVIEW
The Cyborg Sessions workshop met once per week over six weeks in the fallof 2017. It was taught by three faculty and three student workers from theIowa State University Computation and Construction Lab (CCL). There weretwenty-one student participants (undergraduates and graduates) from six differentmajors: Architecture, Graphic Design, Electrical Engineering, Industrial Design,Integrated Studio Arts, and Chemical Engineering. Although, the workshop wasadvertised for women and women received first priority for attendance, it wasnot exclusively offered to women. Five men attended the workshop. However,women remained the majority participants (76%).
Figure 2. Left - Turtle robots drawing patterns with loops and variables. Right a Turtle robotand Braccio Arm. Photo by authors.
The workshop consisted of two three-week projects followed by a publiclecture and exhibition. Each week, the students met in the CCL to hear lecturesabout women in technology, computer programming, and robotics. Then they

76 S. DOYLE ET AL.
worked with partners to operate their robots andmake their drawings and paintings.At the end of each session, the students met to discuss their work and prepare forthe following week. Students did not work on their projects outside of the weeklysessions.
4.2. PROJECT 1: “PLAYING TURTLE”
The authors were concerned that gender stereotypes would continue to play arole in the workshop. Thus, the first project began with a discussion about thechallenges of gender inequality as experienced by women in technology. Thiswas important because it framed the workshop as not just learning to make thingswith robots but doing so as a method for building a culture of engaging with thesetechnologies through design. The students’ concerns were different. While theywere excited for the opportunity to learn about programming and robotics, in apre-class survey 75% of them reported some form of apprehension or anxietyabout their potential performance in the workshop. Understanding and addressingstudent expectations is a critical to helping students get the most from these events.
For their first project, students learned the basic syntax and logics of computerprogramming while becoming comfortable with the rhythms of making throughcycles of writing, compiling, and testing their code. The vehicle for theirexperimentation is a class of robot called a “Turtle.” These low-cost robots wereassembled by the CCL staff from in-house 3D printed parts, electronics purchasedonline, and open source Arduino code. (Olsen, 2015) The focus of the first projectwas to gain confidence with the technology while interrogating the potentials ofdrawing. This blend of the unfamiliar and familiar allowed the designers to reflectupon how drawing with a robot is different from drawing with the hand and howtheir pre-judgements about code affected their strategies.
Turtles appeared to be an ideal first robot for this group. A classic pedagogicaltool created by Seymour Papert at MIT, they were designed to teach childrenhow to think computationally. Turtles have a “head” and “tail” and use simpleinstructions to move around a surface on two wheels while leaving a trail behindthem with a marker. Students learn to program a Turtle by pretending to “be” theTurtle, connecting their sense of their own body in space with that of the robot’s.Thus, “playing turtle” is a profound way to bridge human and machine in thefundamental design act of drawing. (Papert, 1986)
The students quickly engaged with the Turtle robots and their code. One of thefirst things they discovered was that each Turtle had its own “personality” with itsunique mechanical calibration, such as moving faster or turning more accurately.This led to students giving them names and talkingwith their robots as theyworked.Another interesting finding was that the relatively slow speed of the Turtles forcedstudents to be more disciplined and thoughtful in their approaches. The immediatefeedback loops found in design software - which students are used to experiencing- were not there. Students would often express surprise at the slowly emergingdesigns from their code. Oftentimes, if there were bugs in the code, they weremore likely to allow the robot to finish and to observe the process rather thanimmediately starting over. As time went on, they began to incorporate ideas frombuggy code into their compositions.

CYBORG SESSIONS 77
Figure 3. Braccio arms were set in a plywood apparatus to create a limited reach for thepainting arm. Photo by authors.
The first code students started with involved letters, shapes, and otherforms that students tried to translate into Turtle drawings. Translation wasa useful beginning exercise because it allowed the instructors and students todebug initial problems and misunderstandings with hardware and syntax. Thesemisunderstandings proved to be teaching opportunities as well. Once studentscould reliably create forms, they were free to move on to more complex algorithmswith randomness, looping, and recursion. They began to create more sophisticatedcompositions with code as well as different physical interventions with the Turtles:different markers, taped areas, borders, etc. Each student group created three finaldrawings for exhibition.
4.3. PROJECT 2: “DANCES WITH ROBOTS”
The objectives of the second project were to further develop confidence withrobotics and to move away from the precision of drawing to the indeterminacyand expressiveness of painting. For this project, students used Tinkerkit Bracciorobotic arms. These are low-cost kits that feature a 4-axis arm with a gripperattachment. CCL instructors and staff pre-assembled the arms, attached foambrushes to the grippers, and constructed a base for each robot that held a canvasand locations for acrylic paint. The code for the Braccio robots was written inArduino and allowed for individual movements of each axis.
The experience with the Braccio arms was markedly different from the Turtlerobots. First, the arms could be intimidating as theymoved quickly and close to theparticipants bodies - sometimes flinging paint in their direction. Second, the armsdid not have an inverse kinematics (IK) library, so fine control and initiating loopsand other algorithms was more difficult than with the Turtles. A research assistantprogrammed a macro script that allowed students to record a series of steps, andthis helped. However, without the IK library, applying continuous strokes to theflat canvas was difficult because the robot was configured to move in a circle.

78 S. DOYLE ET AL.
Students found that the brushes would not stay on the canvas and sometimes woulddetach from the gripper. While the cycle of coding, compiling, and running theircode remained the same, the number of variables with the equipment increased.The students came to expect a degree of precision with the Turtle robots and thisexperience challenged their perception.
Fortunately, the students persevered and taught themselves different methodsof working with the robots to achieve their ideas. Some of them changed theirpainting styles, limiting them to smaller areas of the canvas or moving the canvasafter each series of strokes. Mixing the paint colors on the canvas and loading thebrush with multiple colors were other ways that the students took advantage ofthe medium to create different, indeterminate effects. Learning to negotiate withthe robots was an unexpected challenge, but resulted in work that was spontaneousand expressive; closer to the attributes of Computational Feminism than the Turtleexperiments. Rather than merely using the robots to execute instructions, the”play” in the system and differences in their approaches made each students’ workunique.
5. MethodologyIn addition to teaching students about computing and robotics, the authors wereinterested in understanding the impact of the workshop upon the attendees’self-perception and their overall perceptions of women in technology inarchitecture. To study this, the authors created two rounds of surveys, which wereadministered online and anonymously, to measure the changes in student attitudesand beliefs in response to their workshop experience. The pre-class surveyrecorded data from sixteen students (12 female). Thirteen students completed thepost-class survey (9 female).
6. AnalysisThe authors found that students‘ confidence in their technological abilities grewfollowing the workshop. Of the initial surveyed students, 94% of students initiallysaid they were a little confident, not confident, or unsure about programming. 82%said they were a little confident, not confident, or unsure in their ability to workwith robots. Following the workshop, nearly 50% of students surveyed reportedtheywere confident or very confident in their abilities with computer programmingand robotics. Only one student reported they were not confident or unsure. Thesurvey instrument did not determine the source of the students’ lack of confidence- whether it was from a perceived stigma about performance (such inherited biasfrom computing or ‘stereotype threat’ (Corbett and Hill, 2015)) or from otherpersonal anxieties. In future workshops, we hope to study this further.
Amajority of the students, regardless of gender, changed some of their attitudesabout women’s relationship to technology. Before the workshop, about half of ourstudents (46%) surveyed felt there were no gender differences in people’s abilityto learn and use technology; one-third were unsure. Following the workshop, nostudents were unsure and 82% of those survey felt there were no differences.
All the students attending the workshop reported that theywould bemore likely

CYBORG SESSIONS 79
to take advanced technology courses (robotics, programming, digital fabrication,etc.) in the future. 73% of students said they would work again with the robots ontheir own. All the students who responded to the question “Do you feel that eventslike our workshop are an effective way of improving gender parity in your field?”agreed workshops were effective.
A potential issue with the survey methodology is that the anonymous formatmakes it difficult to determine how the gender of the participant affected theiranswers. In light of the STEM reports from all-women workshops, it would beuseful see if a single-gendered demographics would result in different data for anarchitecture workshop. However, the overall trends for the workshop in the casestudy - which are statistically significant - are positive. These findings comparefavorably with the results of other STEM workshops and suggest that events likeCyborg Sessions can serve as means of facilitating gender equity in technology.
7. DiscussionFrom the case study, it appears that workshops likeCyborg Sessions are one way toaddress gender equity in design technology by providing a supportive environmentand opportunities for women. This paper proposes a research agenda aimed atdescribing and correcting the gender gap, but there are many remaining questionsto be answered.
One issue is that specific data are not being collected about technology andgender in architectural practice or in academia. Determining the meaning ofparticipation with respect to technology is a challenge which prevents accuratemeasurement. Participation is a nuanced and ill-defined measure, even inarchitecture, but must be addressed if we are to understand and convey the truescope of the issue. Data collection efforts from STEM fields could serve as amodel.
Another important strategy for addressing the gender gap is to highlightsuccessful women in technology. Many of our students cited their time withMadeline Gannon as their favorite part of the event and the moment when theideas of the workshop most connected with them. A lack of women role modelsis a known issue in STEM. Studies have shown that when students are exposed tohistories of women in technology, it reduces stereotyping and bias and encourageswomen to enter the field. (Corbett and Hill, 2015)
8. ConclusionWithin the discipline, digital technology is an emerging site of architecturalinfluence. This topic matters because architecture is imbued with values and ideasthat both reflect and exert tremendous influence over the patterns and quality of ourlives. This paper described some initial data on gender inequalities and introducedSTEM research on the scope and causes of the problem. The authors’ case study ofaWomen in Robotics workshop applied the model of a STEMwomen’s workshopto a group of undergraduate and graduate designers. Surveys of the twenty-onemulti-disciplinary participants indicated that the workshop improved confidencein their abilities, encouraged them to pursue more technology, and reduced their

80 S. DOYLE ET AL.
stereotypes about women in technology.STEM workshop models were not directly replicated but rather adapted to
the design-specific contexts through the use of creative design outcomes viatechnology: drawing and painting. By presenting robotic technology as a creativemedium, rather than a tool of efficiency its application to design potentials becamemore legible to the students. What remains to be seen is whether these strategiescan be scaled and applied to curricula and practice.
The authors hope that other institutions and individuals will find our examplesuseful and take up the charge to develop this work further. Improving genderequity in technology access and authorship will improve education and design byembracing the full gradient of possibilities for design technology.
ReferencesCorbett, C. and Hill, C.: 2015, Solving the Equation: the variables for women’s success in
engineering and computing., The American Association of University Women.Davis, D.: 2014, “Where Gender Inequity Persists in Architecture: the Technology Sector” .
Available from <http://www.architectmagazine.com/practice/where-gender-inequity-persists-in-architecture-the-technology-sector_o> (accessed 8 February 2017).
Dockterman, E.: 2014, “Cracking the Girl Code: How to End the Tech Gender Gap” . Availablefrom <http://time.com/3062885/girls-who-code-google-facebook/> (accessed 15 February2017).
Doyle, S., Forehand, L. and Senske, N.: 2017, Computational Feminism: Searching for Cyborgs,Disciplines and Disruptions: Proceedings of the 2017 Association for Computer AidedDesign in Architecture (ACADIA) Conference, 2041 Duff Ave., 232-237.
Doyle, S. and Senske, N.: 2016, Identifying Inequalities: Gender, Technology, Architecture,Proceedings of the 2017 Architectural Research Centers Consortium National Conference,Salt Lake City, UT. USA, 56-62.
Fisher, A. and Margolis, J.: 2002, Unlocking the Clubhouse: the Carnegie Mellon experience,ACM SIGCSE Bulletin, 34(2), 79-83.
Newnham, D.: 2016, Female Innovators at Work: Women on Top of Tech, Apress, New York.Olsen, K.: 2015, “Low-Cost, Arduino-Compatible Drawing Robot” . Available from <http:
//www.instructables.com/id/Low-Cost-Arduino-Compatible-Drawing-Robot/> (accessed 8August 2017).
Papert, S.: 1986, Beyond the Cognitive: The other face of mathematics, Epistemology &Learning Group, Media Lab, Massachusetts Inst. of Technology..
Pilloton, E.: 2017, “Girls Garage – History: Our Impact” . Available from <http://girlsgarage.org/about/history/> (accessed 14 September 2017).
Rogers, M.: 2013, “Why Students Study STEM.” . Available from <https://www.insidehighered.com/news/2013/10/01/study-finds-math-and-science-exposure-has-significant-impact-intent-study-stem> (accessed 4 February 2017).
Sammet, K. and Kekelis, L.: 2016, Changing the Game for Girls in STEM: Findings on HighImpact Programs and System-Building Strategies., TechBridge.
National Center for Education Statistics, initials missing: 2016, “Table 322.50. “Bachelor” .Available from <https://nces.ed.gov/programs/digest/d16/tables/dt16_322.50.asp?current=yes> (accessed 20 March 2017).
Wojcicki, S.: 2016, “Closing the Tech Industry Gender Gap” . Available from <http://www.huffingtonpost.com/susan-wojcicki/tech-industry-gender-gap_b_9089472.html> (accessed 5February 2017).

SPACESHIP ARCHITECTURE
A Sci-Fi Pedagogical Approach to Design Computation
PAVLOS FEREOS1, MARIOS TSILIAKOS2 andCLARA JASCHKE31,2,3Universität Innsbruck - Institut für experimentelle architekturHochbau1,2,3{Pavlos.Fereos|Marios.Tsiliakos|Clara.Jaschke}@uibk.ac.at
Abstract. The analysis of make-belief drawings and models of Sci-Fispaceships and architecture, leaves architects usually in absence ofinterior, material or program information. The spatial depth of sci-fidigital or physical models is virtually non-existent and unresolved.This discrepancy within sci-fi scenarios inspired the developmentof an integrated teaching methodology within design studios, withthe academic objective to utilize computational methods for analysis,reproduction and eventually composition, while assessing its capacityto achieve a successful assimilation of design computation in thecurriculum. The Spaceship Architecture Design Studio at Universityof Innsbruck’s Institute for Experimental Architecture.hochbau followsa procedural approach in which the design objective is not predefined.Yet, it aims to be ‘outside of this world’ as a sci-fi architecturalquality-enriched result of our reality, via a design oriented course withimmersive computational strategies.
Keywords. Pedagogy; computation; sci-fi; academia; teaching.
1. Introduction1.1. DESIGN COMPUTATION AND THE ARCHITECTURAL DISCOURSE
Design Computation has unquestionably established strong foundations in thecon- temporary architectural profession. The main reason for this transitionto a Computer Integrated Design from a Computer Aided one, is that manydesigners are now conscious of coding capabilities, but also the fact that CADsoftware advancement has enabled the extension of complex modelling capacity,the parametrization of the design space, offering flexible adaptive processes andmore control over variation and design optioneering. How can design computationbe taught in a way that puts it at the center of a methodology, rather than in acatalog of tools? The author’s hypothesis is, that by introducing a design topicderived from science fiction, video games, comics and animation, a variety ofcomputational design elements can be covered and explored, potentially resultingin an intrinsically computationally oriented methodology rather than a merelycomputationally aided one.
T. Fukuda, W. Huang, P. Janssen, K. Crolla, S. Alhadidi (eds.), Learning, Adapting and Prototyping,Proceedings of the 23rd International Conference of the Association for Computer-Aided ArchitecturalDesign Research in Asia (CAADRIA) 2018, Volume 1, 81-90. © 2018 and published by the Association forComputer-Aided Architectural Design Research in Asia (CAADRIA) in Hong Kong.
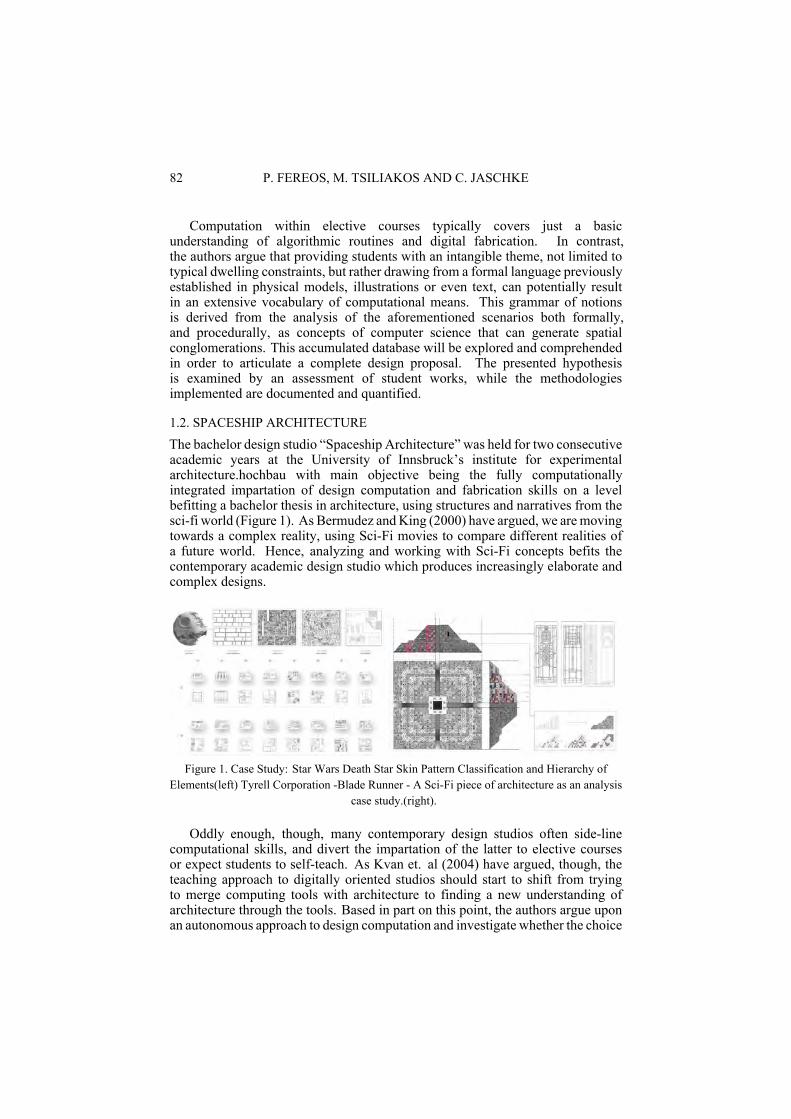
82 P. FEREOS, M. TSILIAKOS AND C. JASCHKE
Computation within elective courses typically covers just a basicunderstanding of algorithmic routines and digital fabrication. In contrast,the authors argue that providing students with an intangible theme, not limited totypical dwelling constraints, but rather drawing from a formal language previouslyestablished in physical models, illustrations or even text, can potentially resultin an extensive vocabulary of computational means. This grammar of notionsis derived from the analysis of the aforementioned scenarios both formally,and procedurally, as concepts of computer science that can generate spatialconglomerations. This accumulated database will be explored and comprehendedin order to articulate a complete design proposal. The presented hypothesisis examined by an assessment of student works, while the methodologiesimplemented are documented and quantified.
1.2. SPACESHIP ARCHITECTURE
The bachelor design studio “Spaceship Architecture” was held for two consecutiveacademic years at the University of Innsbruck’s institute for experimentalarchitecture.hochbau with main objective being the fully computationallyintegrated impartation of design computation and fabrication skills on a levelbefitting a bachelor thesis in architecture, using structures and narratives from thesci-fi world (Figure 1). As Bermudez andKing (2000) have argued, we aremovingtowards a complex reality, using Sci-Fi movies to compare different realities ofa future world. Hence, analyzing and working with Sci-Fi concepts befits thecontemporary academic design studio which produces increasingly elaborate andcomplex designs.
Figure 1. Case Study: Star Wars Death Star Skin Pattern Classification and Hierarchy ofElements(left) Tyrell Corporation -Blade Runner - A Sci-Fi piece of architecture as an analysis
case study.(right).
Oddly enough, though, many contemporary design studios often side-linecomputational skills, and divert the impartation of the latter to elective coursesor expect students to self-teach. As Kvan et. al (2004) have argued, though, theteaching approach to digitally oriented studios should start to shift from tryingto merge computing tools with architecture to finding a new understanding ofarchitecture through the tools. Based in part on this point, the authors argue uponan autonomous approach to design computation and investigate whether the choice

SPACESHIP ARCHITECTURE 83
of theme, as in the architectural design end goal, can lead to a paradigm shift inthe way computation is being approached by schools and academics.
The most common question in complex geometrically contemporary designsis: ”how was this made?”. W.J. Mitchell explored early strategies of embeddingCAD in the curriculum and noted that ”[t]he more intricate and sophisticated thesolution-generation procedure, the more likely it is that we shall ask in surpriseof a computer system, ’How did it ’think’ of that?”’ (1975). The SpaceshipArchitecture studio aims to offer a holistic introduction to complex computationalmethods rendering this question obsolete. The procedural thinking required formost algorithmic processes is reduced to the design context. Iteration is no morea laborious manual process, but an automated one built up from a set of initialparameters and rules associating them with each other. The studio hence dealswith the question of finding the most efficient way to programmatically combiningdata, utilizing available tools and generating design concepts.
Figure 2. Physical models of the Battlestar Galactica Spaceship and Rearranged Deathstar SkinModules as a means of understanding the complex rules behind the geometry of imaginary
pieces of architecture.
To respond to the argument by Madrazo (1998), that discourses withinthe context of architectural design education with computers which concentrateexclusively on the tool might be misleading, the Studio provides students withan intangible theme drawing upon a formal language previously established inphysical analysis models (Figure 2), in order to impart an extensive vocabulary ofcomputational means. Preceding the original design proposal, the first semesterstructure of imposing a new set of restraints on a well-known sci-fi structureand asking the students to redesign or alter it, introduces them to a differentdesign philosophy and encourages the understanding of an analysis model as goingbeyond an iconic generative system (Mitchell, 1975).
2. BackgroundThe idea of a fully computationally integrated design studio is not a new one.Indeed, it goes back to the early days of adopting computers and digital designfor architectural education. Haglund and Sumption argued on the significanceof a computer integrated learning. “We believe that it is important that therole of the computer be integral to the experience of learning to design, rather

84 P. FEREOS, M. TSILIAKOS AND C. JASCHKE
than acting as a catalyst to the creation of another faction. It is not desirableto have students thinking of design as one thing, technology as another, andcomputers as yet another.” (1988). The intention of the authors for an iterativemodel of design through computation, is formatted around the concept wherethe “algorithmic” thinking is supported by traditional design methods such asmodel-making (Novakova et al,2010) implementing a seamless flow of datatowards the digital fabrication of the model parts. The examined pedagogicalparadigm can be parallelized with the learning-by-design approach of (Jabi et al.2008) but drawing ubiquitous data not from the social or built environment, butfrom the hidden, though pervasive, design computation concepts within sciencefiction. The variety of computational concepts explored and the proceduralthinking behind the designs can effectively lead to a bottom-up approach onthe synthesis of form or the analysis of existing designs, with digital strategiesconstituting the framework from within which students elaborate their ideas,consistently pushing the boundaries of their skills.
Furthermore, the concept that CAD can and should be used to teacharchitectural design alongside traditional design methods is well documented inexisting literature. Steinfeld argued that in order to successfully introduce CAD,it is necessary to take advantage of its potentials without imposing on the positionof the traditional paper based process in designing (1988). In elaborating thestructure of his experimental CAD studio he goes on to emphasize the importanceof building each phase of the studio on the core idea of transferable knowledge tothe next. Hence, the two-phase structure of the Spaceship Architecture studio isrooted in an array of preceding methodologies. The Spaceship Architecture studiointroduces novelty to these concepts insofar that at its departure point, it detachesstudents from their pre-formed ideas on the conception of architectural designs byintroducing sci-fi assemblies to which these notions often do not apply. Therefore,the students are forced to circumvent conceptual patterns they are already familiarwith and encouraged to push their boundaries as designers. This reinforces theapproach of computation as an integrated strategy rather than as one with whichto enrich traditional design methods.
3. Integrated TeachingAt University of Innsbruck’s faculty of architecture, digital modelling andrepresentation skills are compulsive components of the curriculum thereforestudents generally are expected to be familiar with basic CAD software knowledgeby the time they join a bachelor design studio. Nevertheless, it was observedover the course of the two years, that the brief and structure naturally attractedstudents with an above-average interest in computational design. 90% of studentsstated that they had used an associative modeling, or visual programming platformat least a couple of times throughout their academic path. The Studio work isstructured in two distinct parts: 1) Analysis - Skill Building: digitally modeling,analysing and further elaborating a spaceship from a well-known sci-fi examplein the first semester, and the formulation of a narrative. 2) Synthesis - ThesisProject: development of the same into an original architectural proposal in thesecond semester as displayed in Table 1.

SPACESHIP ARCHITECTURE 85
Table 1. Timeline of the studio structure in relation to the design computation concepts taught.
At thesis level, the teaching methodology of the studio is fundamentally aimedat the production of actual architecture, therefore physical prototyping is stillutilized and promoted alongside the elaboration of digital skills. There is asuggested user interface for the main implementation of computation-nevertheless,other software may be used as well as pertinent to the project in question.The workshops and tutorials throughout the year included: Nurbs modellingin Rhinoceros3D, Visual Programming with Grasshopper 3D, Visualization,Polygon Modelling, Theme-Oriented Visual Programming, Scripting with Pythonand CSharp within GH, Digital Fabrication and Model Making workshops.Furthermore, and as expected in a design studio environment, students participatein weekly critiques, as well as multiple pin ups, in which they are asked to presentboth the design narrative but equally importantly the procedural thinking behindthe computational processes followed in their proposals.
4. Studio Structure4.1. ANALYSIS
During the first semester of the course, the analysis and building skills phase,students are assigned a spaceship or sci-fi piece of spatial configuration from apool of well-known science fiction examples, i.e. Mother1, Battlestar Galactica,Tyrell Corporation Headquarters. After understanding the brief and identifyingthe key elements making up the formal language of its tectonics, they begin thetask of recreating the spaceship digitally, but breaking it down into simple ruledefined operations. This is facilitated by a kick-off workshop at the beginning ofthe semester focused on building a solid base of skills and knowledge of associativemodelling (Figure 3) using Grasshopper3d for Rhinoceros.
Further tutorials tailored to specific needs for the task at hand are providedthroughout the semester in order to enable a toolset that allows for a seamlessprocedure between the visual programming platform and the CAM methods tofacilitate the physical reproduction of a large-scale model. By studying the texture,structure, color, materiality of the sci-fi vessel in depth, whilst reproducing itdigitally/physically, students are familiarizedwith a broad spectrum of approaches,tools, methods and knowledge, such as parametric and iterative modelling, shapegrammars, scalar fields modelling as well as fabrication optimization, amongothers.

86 P. FEREOS, M. TSILIAKOS AND C. JASCHKE
Figure 3. Parametric space representations of the cladding panel patterns of the Star WarsMillennium Falcon.
Figure 4. Translation of exterior patterns into dynamic space subdivision strategies for theinterior of one of the Nebulon pods.
Building upon the findings of this sci-fi analysis serves a two-fold purpose:on one hand, it allows the students to develop a kit of computational methodsand skills to draw from for the formulation of their proposal. On the otherhand, it renders necessary to translate and fully comprehend their findings tothen successfully synthesize them in a project. As a general rule, sciencefiction tectonics are mostly detailed on the outside, without a morphologicallycorresponding interior. Students are given the task to recognize and analysepatterns and structural logic on the outside of their chosen spaceship, andconsequently to design a possible interior based on these findings (Figure 4).This “outside-inside projection” design task familiarizes them with the concept offaçade-interior relations and gives them an opportunity to apply their own ideas.
At the end of this first term, the new spaceship iterations should be realizedas large-scale physical models. Students learn about digital fabrication andgain confidence to actualize their digital designs. As a result, the introductorysemester was organised to equip students with transferable knowledge and a soundcomputational foundation for their original thesis project, which is the focus of thesecond semester.

SPACESHIP ARCHITECTURE 87
4.2. SYNTHESIS
4.2.1. TRANSITIONS 2.5D TECHNICAL WORKSHOPThe transition from the analysis semester to project conceptualization at thebeginning of the second semester is facilitated by a second kick-off workshop.This is centered on transformational strategies, which are intended to serve asstandalone design generators, while exploring the inherent generative propertiesof time over transcending and superimposed patterns using dynamic routines(recursion, iteration, agent based modelling). Students are expected to designand fabricate patterned 2.5D tiles using these strategies to further elaborate theirskills. The workshop curriculum again utilizes Grasshopper3d as the main meansof teaching computation and focuses on recursive protocols to accommodate therealization of more intricate design intentions. By exploiting coding as a designtool, students can get familiar with basic notions of computer science, such ascellular automata, L-systems, flocking boids, bin packing etc.
4.2.2. THESIS PROJECTThe thesis project brief targets a design that is rooted in a science-fiction narrative,but elaborated as actual architecture on a building scale. In the first year of thestudio, the theme expanded on the development of a spaceport and on the followingyear, of a floating tower. The second semester reverses the “outside-inside”logic of the first. Students now build their work from ideas about interiorspaces that host their story and actors, generating the outside of their designfrom within the framework of this structure. Both group and individual tutorialsdispersed throughout the semester give equal importance to technical and design(sound narrative, architectural logic) skills. Students are expected to provide awell-structured procedural thinking, that is tightly connected to all the designcomputation knowledge acquired previously, but also in the way that sci-fiauthors structure their stories. The design narrative is equally import to thecomputational/procedural logic supporting it.
Unsurprisingly, many of the projects utilized computation only to developspecific parts of the respective proposal. As is customary in the AEC industryfor the most part, façade and building skin design was the main area of applicationfor many of the proposals (Figure 5). The façade systems developed incorporatedas series of methodologies ranging from simple subdivision techniques, to scalarfield gradients and more dynamic arrangements employing multi-agent systemsto conglomerate patterns and discrete elements within the articulation. Inaddition, some of the projects established a catholic computational approach fortheir development. In these instances, the form-finding derived purely fromcomputational methods and characterized the whole system, including both theinterior, structure and exterior. In occasions, computer graphic algorithms such asthe Polygonal Scalar Fields of Paul Bourke (1994) were adapted to fit a specificshape grammar logic and form complex articulations of spatial elements (Figure6).
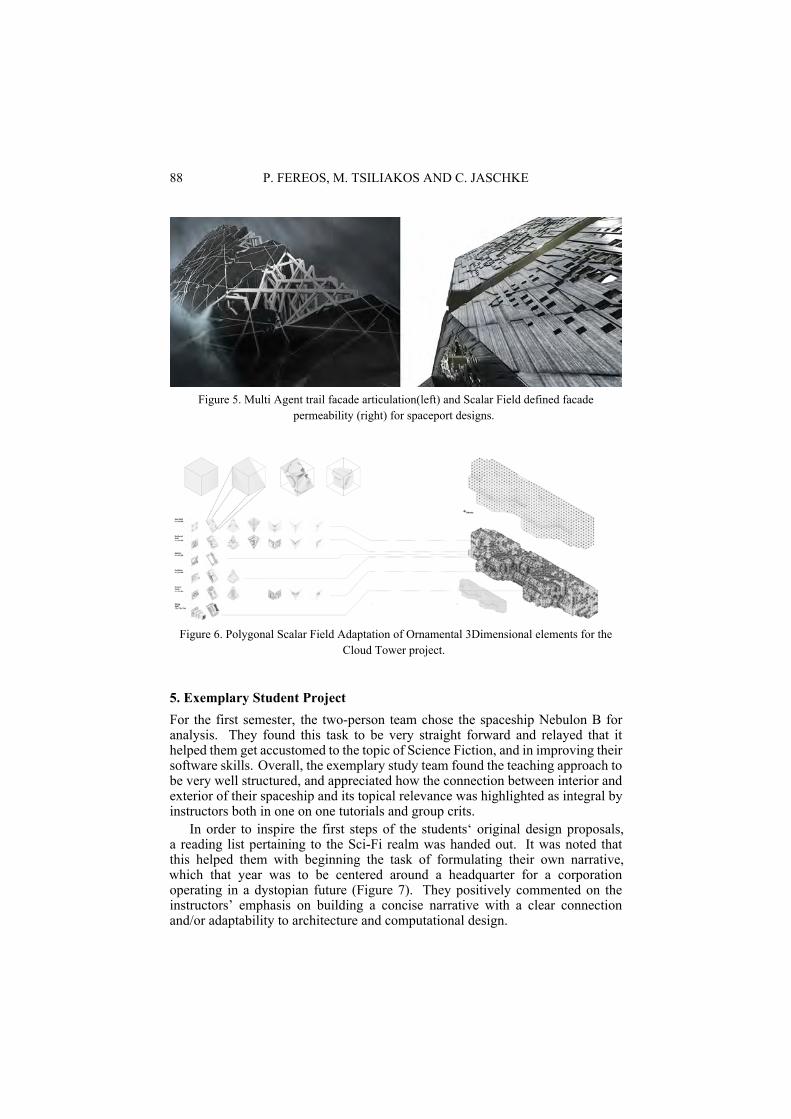
88 P. FEREOS, M. TSILIAKOS AND C. JASCHKE
Figure 5. Multi Agent trail facade articulation(left) and Scalar Field defined facadepermeability (right) for spaceport designs.
Figure 6. Polygonal Scalar Field Adaptation of Ornamental 3Dimensional elements for theCloud Tower project.
5. Exemplary Student ProjectFor the first semester, the two-person team chose the spaceship Nebulon B foranalysis. They found this task to be very straight forward and relayed that ithelped them get accustomed to the topic of Science Fiction, and in improving theirsoftware skills. Overall, the exemplary study team found the teaching approach tobe very well structured, and appreciated how the connection between interior andexterior of their spaceship and its topical relevance was highlighted as integral byinstructors both in one on one tutorials and group crits.
In order to inspire the first steps of the students‘ original design proposals,a reading list pertaining to the Sci-Fi realm was handed out. It was noted thatthis helped them with beginning the task of formulating their own narrative,which that year was to be centered around a headquarter for a corporationoperating in a dystopian future (Figure 7). They positively commented on theinstructors’ emphasis on building a concise narrative with a clear connectionand/or adaptability to architecture and computational design.

SPACESHIP ARCHITECTURE 89
Figure 7. Perspective Visualisation(left) and Section(right) indicating the generative systemscoming in play within the Nebulon team’s proposal.
6. Data and AssessmentData yielding and tracking of performance was collected through weekly crits. Inaddition, students were asked to answer a small survey to evaluate the timelineof the studio, and to enumerate and classify the digital tool-set that they hadbeen provided with. In Table 2 all different modelling and design computationtechniques are measured for their effectiveness and implementation as pertainingto both teaching semesters, analysis and synthesis.
Table 2. Modelling and Design Computation Techniques used in Analysis vs Synthesis.
As expected, during the second semester students managed to embrace moretechniques, in contrast to the first one where Nurbs and parametric modelling werethe prevailing tools. All teaching instances, such as workshops and individualtutorials, are measured for their impact on the project development for bothsemesters as well as both years the studio was running.Whereas the first semestershows a comparatively low amount of distribution among the projects, the secondsemester sees the projects diversifying in approaches and reception of tutorials.This is the result of the students gaining computational knowledge and hencethemselves developing ideas and strategies regarding what software or methodcould benefit their proposal the most.

90 P. FEREOS, M. TSILIAKOS AND C. JASCHKE
7. ConclusionsThe main bottleneck encountered by the students was not computationallyoriented; it was the translation of a shell used in movies to an actual pieceof architecture accommodating a dwelling narrative. Defining clearer goalsenabled the students to focus more on the explored design computation conceptsand their procedural setting into a rule generated design. The increase, bothin software knowledge, but also in the plethora of design computation themesexplored, display a bottom-up conceptual and procedural design process which incombination with an intangible theme, results in a fully digitally integrated studiowork. The learning development from simple parametric modelling notions, toiterative routines and even small scripting attempts to overcome issues arisen in abespoke manner, displays a confident rate of success toward the achievement of acomputationally amalgamated studio. Enough data has been gathered to informfurther developmental steps. This data set will be used to weigh the depth towhich the respective computational design strategies will be taught, dependingon their evaluated project contribution rate. Regarding drawbacks encounteredso far, it can be argued that while the students leave the studio with a soundknowledge of design computation, a wider range of computational approachesand specifically simulation techniques, which are most of the time undermined,could lead to further specialization and more hands-on AEC experience withina given set of students in the second semester. Future iterations of the studiomay include assessments of skills in the early phases to further tailor softwareand teaching-level to individual students and student groups.
ReferencesBermudez, J. and King, K.: 2000, Media Interaction and Design Process: Establishing a
Knowledge Base, Automation in Construction 9, 1, 37-56.Bourke, P.: 1994, “Polygonising a Scalar Field” . Available from <http://paulbourke.net/geom
etry/polygonise/>.Haglund, B. and Sumption, B.: 1988, Toward a Computer Integrated Design Studio, Computing
in Design Education: ACADIA Conference Proceedings, Gainesville, Florida, 291-299.Kvan, T., Mark, E., Oxman, R. and Martens, B.: 2004, Ditching the Dinosaur: Redefining the
role of digital media in Education, International Journal of Design Computing, 7, -.Madrazo, L.: 1998, Computers and Architectural Design: Going Beyond the Tool, Digital
Design Studios: Do Computers Make a Difference? ACADIA Conference Proceedings,Cincinnati, Ohio, 44-57.
Mitchell, W.J.: 1975, The Theoretical Foundation of Computer-Aided Architectural Design,Environment and Planning B: Urban Analytics and City Science, II, 127-150.
Novakova, K., Achten, H. and Matejovska, D.: 2010, A Design Studio Pedagogy forExperiments in Collaborative Design., FUTURE CITIES [28th eCAADe ConferenceProceedings / ISBN 978-0-9541183-9-6], Zurich, 73-79.
Steinfeld, E.: 1988, Using CAD to TeachArchitectural Design,Computing in Design Education:ACADIA Conference Proceedings, Gainesville, Florida, 75-86.
Wasim, J., Hall, T., Passerini, K., Borcea, C. and Quentin, J.: 2008, 008. “Exporting the StudioModel of Learning.” In Architecture in Computro [26th eCAADe Conference Proceedings/ ISBN 978-0-9541183-7-2], edited by M. Myulle. Antwerpen: The Higher Institute ofArchitectural Sciences, Henry van de Velde. 509–516., Architecture in Computro [26theCAADe Conference Proceedings / ISBN 978-0-9541183-7-2], Antwerpen: The HigherInstitute of Architectural Sciences, 509-516.

“REAL VIRTUALITY” IN THE PROCESS OF DIGITALLYEMBEDDED PERCEPTION
CHAO YAN1Tongji University, College of Architecture and Urban [email protected]
Abstract. The “digital turn” in architecture is ontologically drawnfromDeleuzian philosophy, particularly the thinking defined byManuelDelanda as real virtuality. This philosophical thinking reflects theessential paradigm of digital design-a generative process driven byintensive difference to approach the singularity of form in a space ofpossibilities. However, no matter how dynamic the design process isin digital software, the construction result of a building is unavoidablystatic and permanent. Thus, the essence of digital design will alwaysbe misaligned with the material reality of its production. Addressingon this confliction, the research is trying to rethink the philosophicalterm “real virtuality” in the process of human perception. By examiningdifferent theories about the anti-static condition of perception, it forms anovel perspective to address the dynamic relationship between buildingform, virtual “information” and human perception, and extends theproductivity of “becoming” from digital design process to the processof building colonization.
Keywords. Digital Design Theory; Real Virtuality; NewMaterialism; Perception; Visual Uncertainty.
1. Introduction: Digital Design and the Concept of VirtualityIn terms of a literal interpretation, digital design is usually associated with theutilization of digital tools. Nevertheless, when we consider digital design as apure design paradigm, as Mario Carpo argues in his book “The Alphabet andthe Algorithm”, “the direct cause-effect relationship between digital tool andcurvilinear form cannot be established, because even today computers are stillbeing used by architects to produce rectangle buildings” (Carpo 2011). Indeed,the “digital turn” in architecture - the shift towards continuous differentiationand curvilinear geometry - is ontologically drawn from Deleuzian philosophy,particularly the thinking defined by Manuel De Landa as Real Virtuality. Thispaper argues that the existence of this immanent correlation between the “digitalturn” and Real Virtuality is due to the fact that both of them reflect a certain degreeof virtuality within our actual world. To be specific, the digital design environmentis apparently virtual, and this virtuality enables the simulation of morphogeneticprocess and the visualization of its “real virtuality”. So, according to De Landa,digital softwares are “not only machines in which virtual realities are deployed as
T. Fukuda, W. Huang, P. Janssen, K. Crolla, S. Alhadidi (eds.), Learning, Adapting and Prototyping,Proceedings of the 23rd International Conference of the Association for Computer-Aided ArchitecturalDesign Research in Asia (CAADRIA) 2018, Volume 1, 91-100. © 2018 and published by the Associationfor Computer-Aided Architectural Design Research in Asia (CAADRIA) in Hong Kong.

92 C. YAN
tools, such as 3D modeling and rendering tools, but also a privileged place for thescientific and philosophical exploration of real virtuality” (Delanda 2011).
Today, the concept of real virtuality becomes confused with the abstractnessof digital media, to the point that is even called “virtual reality”. In this situation,the fundamental properties and the key potentials of digital design paradigm willbe completely eliminated. Actually many key thinkers, who address the issue ofvirtuality in contemporary philosophy, have highly criticized the tendency towardsthis confusion. For example, Brian Massumi argues that in its degradation intosimulation, real virtuality has “became a creature of the press, a deathwarrant on itsusefulness as a conceptual tool” (Massumi 1998). Slavoj Zizek calls virtual realitya miserable idea, the idea simply meaning, “let us reproduce, in an artificial digitalmedium, our experience of reality” (Zizek 2004). And according to Delanda,from a computational perspective, virtual reality refers to the simplified world offunctions and algorithms in contrast to the concept of real virtuality as immanentpatterns of becoming (Delanda 2011).
From virtual reality to real virtuality, the process of digital design influenced byDeleuzian philosophy can be considered as being constituted by force and motionwithout ending. However, no matter how dynamic the architecture form generatedby the simulation of forces and motion in digital software, the construction resultsof a building are always unavoidably static and permanent. Thus, the essence ofdigital design will always be misaligned with the material reality of its production.There will always be an ontological conflict between the dynamic design processand the inert material result that the process produces. The distinction between thebecoming process of design and the static condition in the colonization of buildingchallenges the ontological foundation of architectural digital design paradigmtoward the condition of perpetual “becoming”. Without treating a building beyonditsmateriality, the significance of virtuality in designwill be completely eliminatedafter the building is built. Real virtuality as a conceptual tool would be reduced toonly reveal the novel possibility of design, which will produce a self-contradictionin the whole process of building life. Therefore, in order to solve this researchproblem, the built environment has to be treated in both its virtual and materialform.
2. Real Virtuality and Delanda’s New MaterialismManuel Delanda, based on his own perspective, further developed the concept ofvirtuality in Deleuzian philosophy to New Materialism. The thinking not onlyproduced great imparts on the development of digital design, but also revealed the“becoming” essence of our actual world (Delanda 1998), including human mind.Therefore, by elaborating the relationship between the concept of virtuality, NewMaterialism and digital design. We could establish a new perspective to interpretthe possible virtuality of building, and its relationship to human being.
2.1. NEW MATERIALISM AND DIGITAL DESIGN
Contradictory to both the traditional materialism (essentialism, “ideal materialism”and creationism) and the idealist inclination in the 20th century philosophy, which

“REAL VIRTUALITY” IN THE PROCESS OF DIGITALLY EMBEDDEDPERCEPTION
93
treated our world as language, text and interpretation, New Materialism could bedefined as the theory of the morphogenesis of actual matter, in that it celebratesprocess and performance over representation and symbolism. According toDelanda, New Materialism, as it emerges from Deleuze’s philosophy, is builtupon ontological thinking from three different sciences: population thinking frombiology, intensive thinking from thermodynamics and topological thinking frommathematics (Delanda 2002). And the relation between digital design and NewMaterialism from the perspective of these three theoretical outlooks defines theconcept of real virtuality in architectural design.
• Population thinking is usually addressed by the theorization of generativedesign. It is usually contained in the operation of genetic algorithms. Andgenetic algorithms are established by the interaction (the double event) betweeneach element and its surroundings, as the capacity of the element as realvirtuality is actualized.
• Intensive thinking is usually associated with the theory of the field condition.Real virtuality in intensive thinking refers to the abstract form of the invisiblefield that is generated by intensive differences. The force in the field will drivethe elements tomove, and the shape presented by their movement will infinitelyapproach the abstract form of the field. So the abstract form is real but neverexisted in itself. It is therefore real but virtual.
• Topological thinking, which refers to a space of possibilities and singularity,is strongly correlated with the process of optimization process in design. Thereal virtuality of design optimization in a mathematical sense can be consideredas a mechanism independent state. According to Delanda, it is related to theconcept of the “degree of freedom”, by which the trajectory of possibilities isdefined. So with the trajectory, singularity becomes something really existingbut never actually reached, as something real and always virtual.
In summary, the philosophical thinking of New Materialism is reflected in designas a particular paradigm-a generative process driven by intensive difference tosearch in a space of possibilities. In this way, the form of a building, whichis correlated with time and duration, would be interpreted as something that isalways being approached. Therefore, the static materiality of building nevermatches the real virtuality in the design process or the immanent properties ofour actual world. And this situation reveals the necessity of introducing thereality of human perception in the after-design-life of a building. In that sense,contrary to the original paradigm of digital design, in which the abstract form of abuilding is conceived in a digital environment and its material shape is perceivedas pure material presence, the research will reinstitute the role of human mindinto the architectural perception process, and to establish a theory of architecturalform, which has the capability to produce the perception of the real virtuality ofbecoming.
2.2. REAL VIRTUALITY AND HUMAN PERCEPTION
From Bergson’s vitalism to Deleuze’s “machinic Phylum”, the key differenceis that the distinction of human consciousness is completely eliminated and istreated as “merely material” operating with others in a whole system (Deleuze

94 C. YAN
and Guattari 1987). In this way, the novelty in perceiving, thinking and actingis no longer limited by the mechanism of linear causality and could produce anon-linear causality within the material of human consciousness. There will be nodistinction between the “true” image and the image perceived, because everythingproduced by human consciousness will reinform activities, and then should becounted as part of the system in morphogenesis. Also according to Delanda’sdiscussion on realism, our world should be independent from the content of ourminds, not from their existence (Delanda 2011). In architecture, design dealsdirectly with the visuality of matter. So designing architectural form to have thecapability to be perceived as virtual images would make a direct bridge betweenthe concrete building, human brain and human body. And in this context, thepaper addresses form’s capacity/tendency to produce intended perception ratherthan its affordance to multiple interpretations. In the 90s, Bernard Tschumitheorized a dynamic relationship between user and space, in which a building isactivated and transformed virtually by the movement of users (Tschumi 1994).However, if a building can only be activated by the multiplicity of humanmovement, which usually cannot be predicted and controlled by the designer, thecorrelation between the design and the subsequent occupation of a building willbe eliminated. However, treating building as an active stimulator rather than as apassive platform, its form could be designed so as to ‘invite’ potential perceptionas well as movement of the users. And a novel correspondence between buildingand the occupant as perceiver could be established.
In history of architectural digital design, this issue addressed above was alwayscontroversial, and approached by theorists and architects in various ways. Sincethe 80s of the twentieth century, following the introduction of digital media intoour physical world, “virtuality” has become a significant topic in culture. Thecertain degree of “virtuality” contained in digital media allows us to interpret theworld beyond its actualized presence. Then the new way of interpretation couldautomatically form a new perception on static building form, and challenge thecore discipline of architecture. From seeking the actual motion of building to thevague perception producing virtual movement, through to the cognitive sciencesapproach of correlating the environment to human motion, the tension betweenthese approaches highly challenges the traditional subject-object relation betweenhuman and building, and forms an on-going debate regarding the perception andcognition of building form, through to architectural design itself.
3. Animated PerceptionFrom the last decade of the twentieth century, following the introduction of digitalmedia and cyber space into our world, “virtuality” has becomes a significant topicin our culture. In general, although the perpetual becoming of “real virtuality” hasusually been addressed to pursue novelty in the phase of architecture design, italso gives rise to an academic intention to transform the traditional understandingof architectural perception.
The certain degree of “abstraction” and “freedom” contained in digital mediaallows us to interpret the world beyond its actualized or materialized presence, andthen the new way of interpretation could automatically form a new perception of

“REAL VIRTUALITY” IN THE PROCESS OF DIGITALLY EMBEDDEDPERCEPTION
95
concrete architectural form and challenge the basis of the discipline of architecture.In 2003, French architecture theorist and historian, Antoine Picon, published anarticle entitled “Architecture and the Virtual: Towards a NewMateriality”. In thisresearch, by making an analogy with how the invention of automobile changedthe appearance of modern city, Picon explored how digital media and, under itsinfluence, the transformation of our contemporary life as cultural devices changeour perception of the world, and then took the argument further to explain how thisnew way of perception leads architecture towards a new materiality (Picon 2004).
The concept of “real virtuality” contains the properties of “abstraction” and“freedom”, but what lies behind these properties are the realities of time andduration. By conceiving time as something real and something drawing matterinto a state of perpetual becoming, we come to challenge the traditional staticrelationship between subject and object in architecture perception, which isderived from a static method of architectural representation like foreshorteningperspective, while a dynamic process of spatial experience is produced. In 2001,Sanford Kwinter published his book “Architectures of Time: Toward a Theory ofthe Event inModernist Culture”. In this book, he directly addresses the question oftime as being something real, and describes how the idea of real time, which wasconceived during the process of modernity, fundamentally changed the traditionalway of understanding architecture as immobile form (Kwinter 2001).
The new understanding on time and duration influenced by the concept of“real virtuality” promoted a dynamic interpretation of building as well as raisingan academic debate within the theory of architecture form. In 1999, Greg Lynnpublished the book “Animate Form”. In this work, Greg Lynn critically examinedthe relations between motion and animation, which he refers to as the evolutionof form and its shaping forces, by exposing the difference between the traditionalstatic notion of space in architectural discourse and the more dynamic approachtowards force and motion in other disciplines (Lynn 1999). Tracing back toSigfried Giedion’s research on cubism and futurism (Giedion 2008), Lynn soughtto show that architecture should be conceived as being immersed within thevirtuality of time, force and motion to open it up to different possibilities inthe future. He then went on to argue that, through the theory of animate form,architecture could be reinterpreted as a series of formal experiences rather thanan ideal formal composition. The most significant contribution to the discourseof architectural “real virtuality” in Lynn’s argument is that he examined thefundamental distinction between actual and virtual motion in the dynamic statusof architecture. At that time, Lynn was still insisting a virtual capacity of form tobe occupied by different possibilities rather than for a building to change its actualshape over time. As he argued, “actual movement often involves a mechanicalparadigm of multiple discrete positions, whereas virtual movement allows formto occupy a multiplicity of possible positions continuously with the same form”(Lynn 1999).
The investigation into the distinction between the actual and virtualtransformation of a building can also be extended to the difference betweenthe possible and the virtual, which not only addresses the issue of emergenceand novelty (as has been argued above), but also the ontological relationship

96 C. YAN
between time and architecture. In the actual transformation of a building, thepreprogrammed possible layouts of a building are treated according to a seriesof time frames, in each of which the building form is still considered as beingstatic. In contrast, the virtual transformation of a building responds to the durationof time itself, and time becomes part of the evolution of the building form (Lynn1999). Also, the actual movement of a building is preprogrammed, and nothingnovel can be achieved in the realization of these preprogrammed possibilities. Incontrast, the virtuality of a building’s motion should be considered as a singularity,which is real but never achieved. In the process of approaching the singularity,the trajectory is associated with human perception and action, so the perceivedtransformation will be continuous and open up to enormous novel possibilities.
4. Adaptive PerceptionThe virtual transformation of a building and its influence on architecturalperception led to a series insightful inquiries within the discipline of architectureon the subject of dynamic processes in the subsequent colonization of a building.In 2006, Neil Leach published a book entitled “Camouflage”. In the chapterentitled “belonging”, Leach explains the concept of “belonging”, which couldbe interpreted as an extension of “becoming”, and relates it to the potential forthe transformation of human habits within a local environment. The theory of“belonging” abandons the fixed subject-object relation in traditional architectureperception, and establishes a theory of adaptive processes in human dwelling(Leach 2006).
No doubt, there is a mutual relationship between human beings and buildingsin the processes of adaptation. However, from whichever side the process isactivated, there should be an essential difference between the different approachesto this subject. While the adaptive process investigated in the theory of “belonging”was created mostly by the nature of human consciousness, there is also a branchof exploration into the dynamic processes of looking and dwelling driven by therelationship between human body (actions) and architectural form.
5. Embodied Perception: Building Form and Human ActionIn 1995, unpublished manuscript (written in 1983 under the title “Terre meuble”)by the French architect and furniture designer Bernard Cache was translated intoEnglish and published in the title of “Earth Moves: The Furnishing of Territories”.In this book, Cache proposed a new way to interpret the concept of the image, inwhich the new role of architecture as a frame should create a dynamic movementwithin its condition as a stable object (Cache 1995). In 2001, Elizabeth Groszpublished the book “Architecture from the Outside: Essays on Virtual and RealSpace”, which is a collection of her essays from 1994 to 2000. In this book, herapproach was to abandon the traditional way of treating architecture as an idealof space arrangement in a frozen time frame, and to experiment, in philosophicalterms, with the way to render space more mobile and active. She proposed tointerpret time, duration and flow not as the outside or counterpart of architecture,but as an embodiment of space (Crosz 2001).

“REAL VIRTUALITY” IN THE PROCESS OF DIGITALLY EMBEDDEDPERCEPTION
97
In 1998, Canadian philosopher Brian Massumi published an article entitled“Sensing the Virtual, Building the Insensible”, and followed in 2002 by a book“Parables for the Virtual: Movement, Affect, Sensation”. Massumi’s workaddresses not only the real virtuality in the perception of built form throughthe lens of embodied experience, but also its relationship with the perpetualbecoming process in the design phase through digital tools (Massumi 1998). So thecapacity of architecture to be perceived as intended images and how these imagesconnecting the conception and perception of building becomes the fundamentalissue in his theory. Derived from Bergson’s thinking, the reality of virtualin Deleuze’s view implicates the potential of emergence or, in another word,the change to produce novelty (Bergson 2002). However, architectural form isconcrete, and due to the concreteness its materialized reality is usually static. Sothere’s an essential contradiction between real virtuality in digital design and itsfixed and static built form. As Massumi asks, “How can the run of the unform beintegrated into a process whose end is still-standing form?” (Massumi 1998)
The answer for Massumi is topology. For Massumi, the topological turn ofarchitecture turned the meaning of form into the sign of the past and future of aprocess (Massumi 1998). So all the deformational variation in a process is definedas the real virtuality of architecture. And the concept of virtuality has significantconsequences in the interpretation of both the design process and built form,according to Massumi. In the design phase, the process becomes a morphologicalstrategy addressing the deformation of a field, which serves as an environmentto cultivate the newness to emerge from the interplay of constraints, rather thanindividual fixed form. In this process, the role of architect is to program, to select,and to extract the standing form from the processed continuity based on functionalconstraints. Massumi describes the architect’s decision as relying on an “intuition”about the virtuality of the process (Massumi 1998).
The most important contribution of Massumi’s theory to the exploration ofreal virtuality in architectural perception is that he reveals the problem of the“actual relation between the built forms that emerge from its process and theprocess as it happened.” According toMassumi, the problem is a semiotic one thatconnects the design process with the after-process of the looking and dwelling inthe resultant building(Massumi 1998). To define the virtuality, the topologicalpossibilities, in the resultant architectural design, (unlike high modernism andphenomenology), Massumi addresses the issue of the relationship between image,experience and consciousness in the “after-life” of architecture. According toMassumi, in order to sense the insensible form of virtuality, the perception ofa building has to be vague and blurred. He defines these anomalies of habitualperception as fogs and dopplerings, in which the newness in already-built formis revealed. As architectural perception is primarily visual, and thus based onlight, the concept of fog, blurs the boundary between concrete form and perceptiveeffect. According to the concept of dopplerings, since seeing is synesthetic withother senses, the visual perception of form is always related to the habits of thebody’s movement. Alongside the relationship between light and form, Massumiproposes an inversion between form and movement. It’s not that we experience aconcrete form through movement, but rather the form is the result of a stoppage

98 C. YAN
in the streaming emergence of our experience in motion (Massumi 1998). In thisway, experience becomes our real virtuality to exceed our concrete being. Buildingbecomes the intersection between the process of designmorphology and subjectiveexperience.
To interpret a building in this way is to design a building producing intendedvague and blurred perceptions. “Forms can be composed to operate as catalystsfor perceptual events returning experience to its confound” (Massumi 1998).In other words, processual perception of a building should catalyze potentialhuman experiences. In general, it is a correspondence between the process ofthe after-life of a building and the design process generating it. Neverthelessthe correspondence is not an analogical one, but a continuity of the relationshipbetween constraints and freedoms of human body. What Massumi is arguing foris a semiotic of material emergence derived from the experience of movement.
Based on the theory of “embodied cognition”, and what Deleuze argues aboutthe encounter between the world and an act of thought, Erin Manning and BrianMassumi explore empirically how thought works through movement to build arelationship between thinking and acting, through the “Technologies of LivedAbstraction” event series hosted by Sense Lab. As Manning concludes, “Everyperception is already a thinking in action. Every act is a thought in germ. Thepremise of all Sense Lab events in the Technologies of Lived Abstraction seriesis that there is a generative nexus between action, perception, and conception thatcan be modulated from the environmental side” (Manning 2009). Therefore, therelationship between form, perception and cognition not only brings the issueof sensing real virtuality into the domain of human mind, but also systemicallyextends mere architectural perception to embrace human action. An intricatenetwork - and not merely a continuous loop - is established between the abstracttransformation of designing form, the virtual perception of built form and theactual motion of human body under the theory of “perpetual becoming”.
6. Ambiguous Perception: Predictive Process in Human BrainIn order to explain the real virtuality of “becoming” in this intricate network,the correlation between philosophy and neuroscience might be a starting point.The development in contemporary neuroscience has formed a systematic way toaddress the subject of human perception, and it becomes an important researchcontext to explore the novel relationship between form, perception and action(Pallasmaa 2013). From the perspective of neuroscience, the challenge ofinvestigating real virtuality and the perception on building form would no longerbe considered as a mere question of representational images, but an active factoraffecting and being affected by the motion of human activities.
But to be clarified, introducing neuroscience is not seeking a scientificresearch on human perception. According to Harry Francis Mallgrave, what theneurosciences are revealing is not the simplicity of human nature (an unstatedtenet of earlier behaviorist models) but rather the great complexity and mutabilityof the human organism (Mallgrave 2013). In “Surfing Uncertainty”, AndyClark proposed a theory on human perception named “Predictive Processing”.

“REAL VIRTUALITY” IN THE PROCESS OF DIGITALLY EMBEDDEDPERCEPTION
99
According to this theory, when we perceive the world, our brain wouldcontinuously predict the incoming stimulus before they arriving by using ourstored knowledge about how to interact with it. When we are “learning” a space,our brain would continuously guess the incoming stimulus in a generative way.So the operating mechanism of our brain would consist of both a bottom-up (howwe receive the signal) and a top-down (how we guess what we are facing) flow ofinformation, compared to the one-way flow in feed forward process. In Clark’smodel of human perception, when our guessing doesn’t match the incomingstimulus, there will be a prediction error being produced. During the continuousprediction, the prediction errors would constantly refine both the “guessing” resultof our brain and the incoming stimulus through body action, until equilibrium isachieved. But, in the prediction process, the estimation of prediction errors hascertain flexibility. When the stimulus comes and being paired with the prediction,our brain will estimate precision of errors. Only high precision errors will cause therefinements on our guessing and action. If the error is uncertain (the environment isuncertain), our brain’s prediction would become the real perception, even it mightbe wrong eventually (Clark 2016). And this situation might be the moments ourillusion arises. In order to produce the dynamic condition of human perceptionon building form, we as architect could create an uncertain environment. By then,our prediction, which is affected by our intention and our memory, will eventuallybecome our real perception. And further, the perception would determine ouraction in the next step to generate new perception in a rolling cycle. In the end, bothour intention and our historical encounter to the space (memory) would becomethe initial driver (real virtuality ) to this circular causation loop, which would forma constantly changing perception on the static building form through our currentbody action.
7. Conclusion and AssumptionThe research is a theoretical exploration on the subject of the real virtuality inthe human perception of architectural form. By examining the theories of visualprocessing in contemporary architecture, philosophy, and neuroscience, it forms anovel perspective to address the relation between form, perception and action, andextends the becoming-difference from design process to the process of buildingcolonization.
The relationship between the multi-layers of predictive processing in thehuman brain and the ambiguous properties of architectural form could produceparticular human perceptions on static building form. The influence of theseproperties on human brain is primarily based on the conscious or subconsciousintention andmemory as universally intensive field. Then the intensive field as realvirtuality could be followed or countered by the intersection between builing formand human motion in order to regenerate a new one. Eventually, form, perceptionand action could be correlated and manipulated together as an integrated networkto establish the perpetual “becoming” process in the visual situation of humanbeing.

100 C. YAN
AcknowledgementThis research is funded by National Natural Science Foundation of China(Grant No.51578378), National Key R&D Program of China(GrantNo.2016YFC0702104), Sino-German Center (Grant No.GZ1162), andShanghai Science and Technology Committee (Grant No.16dz1206502, GrantNo.16dz2250500, Grant No.17dz1203405).
References“Salvoj Zizek, The Reality of the Virtual, documentary film by Ben Wright” : 2004. Available
from <https://en.wikipedia.org/wiki/The_Reality_of_the_Virtual>.Bergson, H.B. 2002, The Idea of Duration, in K.A.P. Pearson (ed.), Henri Bergson: Key
Writings, Athlone Press.Cache, B.C.: 1995, Earth Moves: The Furnishing of Territories, The MIT Press.Carpo, M.C.: 2011, The Alphabet and the Algorithm, The MIT Press.Clark, A.C.: 2016, Surfing Uncertainty: Prediction, Action, and the Embodied Mind, Oxford
University Press.Delanda, M.D.: 2011, Philosophy and Simulation: The Emergence of Synthetic Reason,
Continuum.Delanda, M.D. 1998, Deleuze, Diagrams, and the Genesis of Form, in C.D. Davidson, B.V.B.
Berkel and C.B. Bos (eds.), ANY 23: Diagram Work, Anyone Corporation.Delanda, M.D. 2002, Deleuze and the Use of Genetic Algorithms in Architecture, inN.L. Leach
(ed.), Architectural Design: Designing for a Digital World, Wiley-Academy Press.Delanda, M.D. 2011, Real Virtuality, in A.M. Menges and S.A. Ahlquist (eds.), Architectural
Design: Computational Design Thinking, Wiley-Academy Press.Deleuze, G.D. and Guattari, F.G.: 1987, A Thousand Plateaus, Capitalism and Schizophrenia,
University of Minnesota Press.Giedion, S.G.: 2008, Space, Time and Architecture: the Growth of a New Tradition, Harvard
University Press.Grosz, E.G.: 2001, Architecture from the Outside: Essays on Virtual and Real Space, The MIT
Press.Kwinter, S.K.: 2001, Architecture of Time: Toward a Theory of the Event in Modernist Culture,
The MIT Press.Leach, N.L.: 2006, Camouflage, The MIT Press.Lynn, G.L.: 1999, Animated Form, Princeton Architectural Press.Mallgrave, H.F.M. 2013, Should Architects Care about Neuroscience?, in P.T. Tidwell (ed.),
Architecture and Neuroscience, Tapio Wirkkala-Rut Bryk Foundation.Manning, E.M.: 2009, Relationscapes: Movement, Art, Philosophy, The MIT Press.Massumi, B.M. 1998, Sensing the Virtual, Building the Insensible, in S.P. Perrella (ed.),
Architectural Design: Hypersurface Architecture, Wiley-Academy Press.Pallasmaa, J.P. 2013, Towards a Neuroscience of Architecture, in P.T. Tidwell (ed.),
Architecture and Neuroscience, Tapio Wirkkala-Rut Bryk Foundation.Picon, A.P.: 2004, Architecture and the Virtual: Towards a NewMateriality, Praxis, 6, 114-121.Tschumi, B.T.: 1994, Architecture and Disjunction, The MIT Press.

CHOREOGRAPHED ARCHITECTURE
Body-Spatial Exploration
ENRICA FUNG1 and KRISTOF CROLLA21,2The Chinese University of Hong [email protected] [email protected]
Abstract. This paper presents a design-methodological case studythat looks into the practical expansion of conventional conceptualarchitectural design media by incorporating contemporary technologyof motion capture. It discusses challenges of integrating dancemovement as a real-time input parameter for architectural designthat aims at translating body motion into space. The paper consistsof four parts, beginning with a historic background overview ofscientists, physiologists, artists, choreographers, and architects whohave attempted capturing body motion and turning the motion intospace. The second part of the paper discusses the iterative developmentof the ‘Dance Machine’ as a methodological tool for the integrationof motion capture into conceptual architectural design. Thirdly, thepaper discusses tested design applications of the ‘Dance Machine’ bylooking at two sited applications. Finally, the overall methodology iscritically assessed and discussed in the light of continuous developmentof creative applications of motion capturing technology. The paperconcludes by highlighting the architectural potential found in specificqualities of dance and by advocating for a broader palette of tools,techniques, and input methods for the conceptual design of architecture.
Keywords. Choreographed architecture; Motion capture;Conceptual design media; Space design; Human body.
1. IntroductionThis design research project introduces “Choreographed Architecture” as a fieldthat emphasises experience in-motion, generated by distinctive design actionsfrom dance routines, as input for architectural spatial design. The design outcomegives specific sensations and impressions to the people moving within. Danceoperates as a dynamic catalyst for this sensation and becomes the informationsource for the communication between designer and user through spatial definitionand configuration.
The paper 1) studies whether the typically available architectural designsolution space can be practically and productively expanded in ways thatincorporate unique qualities proprietary to choreography in space, and 2) criticallyexplores how body movement can define spatial form.
T. Fukuda, W. Huang, P. Janssen, K. Crolla, S. Alhadidi (eds.), Learning, Adapting and Prototyping,Proceedings of the 23rd International Conference of the Association for Computer-Aided ArchitecturalDesign Research in Asia (CAADRIA) 2018, Volume 1, 101-110. © 2018 and published by the Associationfor Computer-Aided Architectural Design Research in Asia (CAADRIA) in Hong Kong.

102 E. FUNG AND K. CROLLA
Relatively recent technological advancements have dramatically changed thetools and techniques used during the conceptual design phases of architecture.Appliances such as the computer mouse or drawing tablets have been incorporatedto track, register, and store architects’ motion as design input for additionaldigital processing. Via the gaming industry, further technology democratisationexpanded these means to include 3D scanners capable of capturing full bodymotion. User-friendly data management interfaces allow the harnessing of thisdata for use in architectural design, opening a fascinating new chapter in a seriesof historic attempts to capture body motion in visual arts and architecture.
Asmeans of creative expression affected by space, dance has always positioneditself opposite of architecture due to its ephemeral and temporary nature. Yet,overlapping qualities can be found in structural build-up and composition,especially the reciprocal dialogue between the human being and space in time.This case-study paper studies how qualities in dance, such as fluidity, variety,rhythm, transition, and repetition can provide further input to architectural spacedesign.
2. Motion Capture PrecedentsMotion research originates with Etienne-Jules Marey (1830-1904), whosechronophotography studies (1882-1883) for the first time considered the bodyas an animated machine, decomposing and capturing the invisible sequence ofmotion in space over time. The principle of chronophotography influenced the artworld greatly, as found in work by Marcel Duchamp. His abstract painting ‘NudeDescending a Staircase No.2’ (1912), inspired by Marey’s technique, presenteda body in motion with a subject from one view at multiple moments. Thetechnique is expanded several decades later by Harold Eugene Edgerton (1954),who investigated alternative techniques for capturing motion using high-speedprocedures with less than half a second per photograph. Half a century later,digital technology continued to provide further improvements in revealing theactual state of motion. Its direct impact on architecture can be seen in projects likeDECOI’s installation ‘Ether/I’ (1995). This structure presented a frozen trace of adisappearing dance and literally translated motion into space. Further, the ‘DuneFormations’ by Zaha Hadid Design and David Gill Galleries (2007) suggest amultiplicity of use of design in motion, presenting a unique design in organic formfor furniture. Today, we start to see the formal complexity of such designs appearin built form at architectural scale. The ‘Heydar Aliyev Centre’ by Zaha HadidArchitects (2013) presents a design with an unconventional structural system thatarticulates fluid form and space. Also, ‘Arnhem Central Station’ by UNstudio(2015) successfully translates people motion into dynamic space that determineshow people move around and use it.
3. Theory of DanceRudolf Laban (1879-1958) is one of the pioneers of early twentieth-centurymovement theory. He developed a system to record the possibilities of humanmovement and stated that dance and architecture are the two basic arts of man

CHOREOGRAPHED ARCHITECTURE 103
from which others are derived (Spier, 2011). Laban’s Theory of Space articulateshow we inhabit, harmonise, and explode our personal space to expand knowledgeof the human body into space. He introduces the concept of the ‘Kinesphere’and ‘Space Harmony’, and considers the Kinesphere to be an invisible sphere,containing 27 main directions, around the body which periphery can be reachedby extended limbs without stepping away from the point of support. The invisiblespace around our body is changing once we shift our weight (Newlove, 1993).Consequently, the Kinesphere is moving while the human body is moving. It staysinvisible until the moment we move within it and make it tangible by leaving thespatial consequences of our movements. Space harmony is the further extension ofKinesphere. It deals with the form of movement based on 12 inclinations in a totalof 24 directions (Newlove, 1993). Analysing the harmony in space is essential togenerate a choreography with a good spatial quality.
As Laban stated, harmony gives structure and meaning to movement in achoreography. He defined three spatial laws that affect and characterise thisharmony: (a) law of equilibrium: how directions within the Kinesphere link tostability (3D in dimensional scale) and lability (diagonal directions, linked toharmony as allowing a flow of movement); (b) law of flowing-from-the-centre:each movement initiated by any part of the body starts from the centre oraffects it (responsible for sequentiality and connectivity in the body); (c) law ofcountermovement: each movement happening in one or more directions containsits stabilizing counterpart (Moore, 2009).
To imagine an alternation in gravity, the human body contains multiple centresinstead of single centre point, meaning the rule of verticality in the human body hasdisappeared. The loss of verticality generates the dynamic effect which enhancesthe spatial possibility between body and space. This introduces the question whathappens if the body is off-balance and themovement no longer contains a boundaryof equilibrium.
4. MethodologyBased on the concept of Kinesephere, the ‘Dance Machine’ has been createdas a new design tool to expand and incorporate its corporal possibilities intoarchitecture. This tool generates and captures dynamic spaces derived from bodymovements with a changing point of support. The Dance Machine is iterativelydeveloped as a methodological tool for the integration of motion capture intoconceptual architectural design. It follows an Action Research Methodology(Groat and Wang, 2013; Herr, 2015), based on a ‘Plan-Act-Assess-Reflect’ cyclein which problem definition, as well as iterative improvements, allow for aworkable solution to emerge.
The Dance Machine is a flexible device that consists of several components.A Microsoft Kinect motion sensing input device is used to capture the architects‘dance performance skeletal data and bring this into a customised Rhinoceros’Grasshopper interface. Here, procedural modelling is used to extract andmanipulate data, and feed it back to the performer in a real-time spatial experiencefor architectural design (see Fig. 1 & 2). Twenty points of the human body can be

104 E. FUNG AND K. CROLLA
detected by the sensor in three dimensions over time. These positions are translatedinto dynamic space by using them as control points for curves in-between whichsurface geometry is lofted. Thus, the Dance Machine translates body part motionby tracking selected points of the human body.
Figure 1. The principle of Dance Machine.
Figure 2. The Dance Machine’s decision-making process.
The methodological approach is used to analyse the viability of translatingpersonal space to permanent space by exploring transitional elements on bothdance and architecture. Assuming the machine does not possess control ofcaptured movement, what is the influence of translating the motion into space?This can be seen during early trials of data generation and the consequentproduction of abstract form with it. Gradual refinement and selection of captured

CHOREOGRAPHED ARCHITECTURE 105
data are needed to advance the project. Levels of data post-processing are neededto allow the motion data to become a usable element in the design process.
Several approaches exist to create a choreography. All are composed withcommon basic qualities: unity, continuity, and variety. Early attempts to createan appropriate choreography for the dance machine had as single intention to testmachine continuity and variety to ensure the unity of flow. The results indicatedthat the type and length of choreography required skeletal action amplification toincrease the dance movements’ significance in the architectural space generation.Architectural considerations like control over site, program, spatial layering,and circulation must be considered and integrated into the composition of thechoreography.
The Dance Machine is a recording machine that turns a subjective danceexperience into an objective architectural reality. Its output forms a basis forfurther design operations at different scales. Focusing on architecture, theconstruction technical part becomes a major concern in addition to the overallaesthetic appearance. This challenges the use of the Dance Machine as a mediumto operate at various scales beyond conceptual stage.
Currently, the design outcome from the machine is limited by the fluid qualityof movement, and only dynamic space can be generated. A future improvementpossibility is to enable a wider range of spatial typologies generated by a widerange of dance types and choreography.
5. Application of Dance MachineThe Dance Machine application was first tested by abstract form generation andlater by looking at two sited applications. For the primary test, the machine isconsidered as an abstract and scale-less form generator. Without any furthermanipulation, movement is captured over time and turned into a dynamicallydesigned form. Results revealed that the body movements are easily lacking thecareful control needed for spatial design and frequently overlap themselves (seeFig. 3).
Following initial test result evaluations, manipulators of skeletal points areincorporated in a second version of the machine that allows more clear definitionof specifically used body segment.
To avoid overlapping of movement, a third machine iteration was designedto include a guide path along which the centre of the Kinesphere is moved (seeFig. 4). A timer is added to control the positioning between the start and the endpoint, as well as to track the length of the choreography. This iteration tested thetheory of the extended Kinesephere by observing the body’s change in weight andposition, meaning the centre point of the body is moving through space while thespace around it remained in a fixed relation to the body.

106 E. FUNG AND K. CROLLA
Figure 3. Abstract form generation.
Figure 4. Gradual refinement of the captured data.
To allow for spatial arrangements to be affected by the rhythm in choreography,a scale manipulator is incorporated that allows expanding the created space.Through this function, the machine operator can amplify parts of the choreography.The outcomes of the original studies can thus be refined and enhanced through theinput parameter values of the machine. Site, context and program that inform themovement in the final project can be incorporated into the design by linking themto the level of manipulation, or by informing the guided path. These manipulatorsand guides allow for the transition from the abstract space generator to a concretedesign.
The setup was assessed on a site in Wan Chai, Hong Kong, through aniterative process that counted over fifty cycles. This preliminary study involvedthe design of a conceptual event space and was intended to identify both challengesand opportunities provided the Dance Machine. Each iteration started with achoreographed intention and ended with the observation and evaluation of the

CHOREOGRAPHED ARCHITECTURE 107
end results which fed back into the further refinement of both choreography andmanipulators (see Fig. 5). Following numerous tests to ‘tame’ the machine, themedium became more familiar, manageable, and controllable. Particularly thedesign sequence was frequently changed, as this component resulted in the variouslayers of architectural design elements. The overall design sequence started withthe choreography of outer surfaces to the main space creation, wall/slab insertions,and structure, and ended with the development of the enclosure.
Figure 5. A demo of iterative process.
A second iterative project design cycle involved the conceptual designdevelopment of a performance event space in Shek Kip Mei, Hong Kong (seeFig. 6). The site is located at the junction area of Shek Kip Mei Street and WohChai Street, adjacent to the Woh Chai Hill in Shek Kip Mei. This district is thefirst public housing estate in Hong Kong. The site preserved some of its historyand sense of community as the area is known today for its arts and crafts. As it is adensely-populated area lacking community services, a cultural centre is proposedto be built. The total building floor area is approximately 3550 sq.m., including themain theatre, small theatre, library, exhibition area, roof garden and lots of openspaces.
Figure 6. A second iterative cycle: process of outer surface creation.

108 E. FUNG AND K. CROLLA
Following several iterations, eventually two choreographies were captured andrecorded by the Dance Machine as the main architectural input. These generatedtwo main layers of the architectural space, the outer surface and the main theatrespace. Each choreography contained six steps of modification. These were basedon evaluations and observation of the previous iterations that used plans, sections,and perspectives to assess the quality and movement of created space. The finalchoreography of the outer surface presents eight continuity actions, whereas themain theatre’s presented four since these included a repetition due to the symmetryin spatial arrangement. The continuity actions at the foundation of the spaceform design are dance movements recorded in real-time, highlighting the closerelationship between the performer and the architecture. (see Fig. 7-10)
Figure 7. Space form design based on dance movements recorded in real-time.
Figure 8. Performance event space in Shek Kip Mei, Hong Kong: floorplans.

CHOREOGRAPHED ARCHITECTURE 109
Figure 9. Performance event space in Shek Kip Mei, Hong Kong: section.
Figure 10. Performance event space in Shek Kip Mei, Hong Kong: physical model.

110 E. FUNG AND K. CROLLA
6. ConclusionThe Dance Machine is a case-study for research that seeks to combine elementsof dance and architecture and incorporates these into a common digital designsoftware environment throughwidely available technology ofmotion capture. Thefindings illustrate a practical approach to expanding how architectural design canbe done through dance. The Dance Machine becomes a highly personal andautobiographical design tool which enables dancers to capture their individualdance signature and express and translate this into architectural space. Themethodology has potential to be employed in design of dynamic form and spaceat different scales, including sculpture, furniture, and architecture. The designprocess shows how the machine’s efficiency, speed and power, once familiar andunder control, allows designers to generate dynamic, fluid, and continuous spacefor a specific building program and site in a relatively short time.
ReferencesDouard, J.W.D.: 1995, E.-J. Marey’s visual rhetoric and the graphic decomposition of the body,
Elsevier Science Limited .Edgerton, H.E.E.: 1964, Motion Picture Photomicrography with Electronic Flash, Applied
Optics.Gómez, A.P.G.: 1983, Architecture and the crisis of modern science, MIT Press.L.G. Groat and D.W. Wang (eds.): 2013, Architectural Research Methods, John Wiley & Sons.Herr, C.M.H.: 2015, Action Research as a ResearchMethod in Architecture andDesign, Journal
of the International Society for the Systems Sciences.Menache, A.M.: 2010,Understanding motion capture for computer animation and video games,
Morgan Kaufmann.Moore, C.L.M.: 2009, The harmonic structure of movement, music, and dance according to
Rudolf Laban: An examination of his unpublished writings and drawing, Edwin MellenPress.
Newlove, J.N.: 1993, Laban for actors and dancers, Routledge, New York.S.S. Spier (ed.): 2011, William Forsythe and the practice of choreography: It starts from any
point, Routledge Taylor & Francis group.L.U. Ullmann (ed.): 1980, The mastery of movement, MacDonald and Evans.

CASE STUDIES ON THE INTEGRATION OF ALGORITHMICDESIGN PROCESSES IN TRADITIONAL DESIGN WORKFLOWS
INÊS CAETANO1, GUILHERME ILUNGA2, CATARINA BELÉM3,RITA AGUIAR4, SOFIA FEIST5, FRANCISCO BASTOS6 andANTÓNIO LEITÃO71,2,3,4,5,7INESC-ID/ Instituto Superior Técnico, Universidade de Lisboa1,2,3,4,5,7{ines.caetano|guilherme.ilunga|catarina.belem|rita.aguiar|sofia.feist|antonio.menezes.leitao}@tecnico.ulisboa.pt6CiTUA/ Instituto Superior Técnico, Universidade de [email protected]
Abstract. Algorithmic design processes have enormous potentialfor architecture. Even though some large design offices have alreadyincorporated such processes in their workflow, so far, these have notbeen seriously considered by the largemajority of traditional small-scalestudios. Nevertheless, as the integration of algorithmic techniquesinside architectural studios does not require mastering programmingskills, but rather taking advantage of a collaborative design process,small design studios are therefore able of using such strategies withintheir workflow. This paper discusses a series of challenges presentedby one of these studios, where we had to integrate algorithmic designprocesses with the studio’s traditional workflow.
Keywords. Collaborative design; Algorithmic design; Designstrategies; Design workflow processes.
1. IntroductionThe algorithmic revolution is changing the way architecture is practiced (Imbertet al. 2013; Heijden et al. 2015). This revolution was quickly adopted by severallarge-scale design studios, promoting a collaborative environment composed bymultidisciplinary teams with different know-how. However, it has not yet spreadto the majority of small-scale studios. Fortunately, this does not mean that theycannot benefit from the advantages of algorithmic approaches in productivity,cost/time reduction, and experimental freedom, among others benefits (Santoset al. 2012). To that end, it is important to combine traditional architecturaldesign processes with modern, algorithmic-based ones. In this paper, we describea series of practical case studies where this combination was followed, and wediscuss the results, obstacles, advantages, disadvantages, and lessons learned froma collaborative design process involving a small-scale studio.
2. Algorithmic Design Integration and Collaborative WorkCollaboration in design is a practice introduced in the eighteen century, resultingfrom the divorce between the field of architecture and engineering (Giedion 1941),
T. Fukuda, W. Huang, P. Janssen, K. Crolla, S. Alhadidi (eds.), Learning, Adapting and Prototyping,Proceedings of the 23rd International Conference of the Association for Computer-Aided ArchitecturalDesign Research in Asia (CAADRIA) 2018, Volume 1, 111-120. © 2018 and published by the Associationfor Computer-Aided Architectural Design Research in Asia (CAADRIA) in Hong Kong.

112 I. CAETANO ET AL.
prompting architects to work collaboratively with other experts. Nowadays, toface the emerging paradigms, such as algorithmic design, it became necessary toalso collaborate with specialists with advanced programming skills.
A new reality of collaborative architectural-engineering-mathematics practice- which combines experts from different fields, including mathematics, robotics,and software engineering, among others - is present in some recent design teams,namely the Advanced Geometry Unit (AGU) of Arup, the Advanced ModellingGroup (AMG) and the Computational Design & Research (CDR) of Aedas, theSpecialist Modelling Group (SMG) of Foster and Partners, among others. Thesedesign studios demonstrate how, within the complex reality of parametric designand algorithmic techniques nowadays, collaborative work can promote a better andmore efficient design process, in which the support of programming specialists isbecoming increasingly important.
Our goal is to explore a collaborative design approach that allows small-scaledesign studios to take advantage of algorithmic processes. Previously, Caetanoand Leitão (2017) explored the collaboration between two small-scale designstudios and two algorithmic design specialists in the development of analgorithmic-based BIM façade for a residential building. In this paper, we followa similar perspective, but we go much further: the collaboration also includesthe algorithmic analysis and optimization of the algorithmically-generated designsolutions.
In the next sections, we present three different examples developedcollaboratively between a small-scale design studio and a small external team ofalgorithmic design specialists. The team’s intervention was manifolded, focusingon geometrical, aesthetical, thermal, lighting, and structural issues. In the end,the case studies demonstrated that, even for small-scale studios and projects, thecollaboration with algorithmic design experts can bring several advantages to thestudio’s design process.
3. Case Study 1 - Lighting OptimizationThe first case study faced a complex situation of sun incidence control on a façadeof an isolated private house facing the Atlantic sea. The aim of using algorithmicdesign was to generate a set of façade shading panels based on the conceptof randomness that, at the same time, achieved a good daylight illuminationperformance.
The panels’ geometrical pattern evolved considerably throughout the designprocess, resulting from the inherent capabilities of the algorithmic design approach,particularly, the quick visualization of the impact of changes, and the abilityto simultaneously explore different conceptual directions. In the final designiteration, the architects decided on a geometrical pattern based on horizontal woodbars of different sizes, alternating between one full-length bar and a set of smallerbars (Figure 1.A). The size of the latter should be random, as also their positionalong the panel’s width. To increase the architects’ control over the panels’ pattern,some restrictions on this random behaviour were set, namely the maximum andminimum sizes of the bars (L-min and L-max), the number of different possible

CASE STUDIES ON THE INTEGRATION OF ALGORITHMIC DESIGNPROCESSES IN TRADITIONAL DESIGN WORKFLOWS
113
sizes (Δl), and the maximum distance between bars (D-max) (Figure 1.B-C).Initially, several design variations were produced by assigning different
values to the design variables, allowing the architects to visualize and analysea collection of results, and to then suggest improvements to be appliedon the following iterations. As a result, this collaborative process ofgeneration-visualization-regeneration helped the architects with the selection ofthe best values, from an aesthetic point of view, to be assigned to the designparameters.
Figure 1. A conceptual representation of the shading panels’ geometric pattern: A. alternationbetween bigger and smaller bars, which size and placement varies randomly. B. the pattern’s
geometric restrictions: bars’ size (maximum and minimum length) and bars’ maximumdistance variables; C. size increment variable (the range of possible length sizes).
Since the architects’ intent was to achieve a solution for the shading panelsthat was also optimized in terms of its lighting performance, in a second stage, weoptimised the design regarding the Spatial Useful Daylight Illumination (sUDI)metric (Nabil and Mardaljevic 2006). To this end, we considered not only the setof design instances resulting from the architects’ suggestions for the parameters,but also a larger design space that resulted from the assignment of values thatdeviated from those premises. Traditionally, this optimization would requiremanually changing the model and executing the corresponding analysis, repeatingthis time-consuming process until an acceptable solution was achieved. By usingalgorithmic processes, we can automate and speed-up this task.
We started by identifying the key rooms to be considered in the optimizationprocess - i.e., the rooms where natural lighting was directly affected by the shadingpanels to be optimized - which helped significantly to reduce the time takenby each analysis. Then, different sampling techniques were used to generatedifferent designs. Initially, Monte Carlo Sampling (MCS) (Shapiro 2003) wasused, allowing us to test the optimization workflow. However, MCS requiresa large number of samples to produce valuable results and, due to the costlyevaluations required by lighting analysis, this is not time-efficient. To overcomethis problem, Latin Hypercube Sampling (LHS) was then used to reduce thenumber of candidates, while improving the coverage and variance of the designspace (McKay et al. 1979). In a first stage, it allowed us to obtain a designsolution with 100% of sUDI , but with a high daylight glare probability (DGP),thus reducing the inside spaces’ comfort.

114 I. CAETANO ET AL.
The optimization process was then repeated, but this time considering theconstraint set by the architects of using stripes of 5, 10, 15, 20, or 25 cm length.Only the distance between each stripe (the variable D-max) was dictating the lightentering the room. We started by setting the D-max value as 20 cm, like thearchitects had suggested, and we generated 50 samples, obtaining a maximumsUDI value of around 45%, which was far from being optimum. Consequently,the optimization process was redone using, this time, a D-max value of 100 cm,generating 200 samples. The scatter plot in Figure 2 organizes the obtained sample,demonstrating that, until reaching a maximum distance of 50cm, the sUDI rapidlyincreases to 80%, whereas after that it slowly converges to 100%. Nevertheless,most of the solutions corresponding to higher sUDI values resulted from inputvalues that deviated from the ones proposed by the architects.
Figure 2. The scatter plot with the samples obtained during the optimization process. Themodels a. to g. correspond to the set of the examples presented to the architects.
The challenge at this stage was selecting a solution that not only had goodlighting performance, but also matched the architects’ design intent. To addressthis, we decided to evaluate howmuch an architect’s initial suggestion restricts hisfinal choice, i.e., the ease with which he accepts other design options that deviatefrom his initial idea. Therefore, we presented seven samples to the architectswithout informing them about the values of the variables and the correspondingsUDI levels. The samples were carefully selected in order to be heterogeneous(see Figure 2): option a fits all the constraints proposed by the architects; optionsb-f match all the constraints except the distance between bars (D-max), whichincreases from solution b to f ; on the contrary, option g does not consider most ofthe constraints. After analysing the samples, the architects chose option c as thebest option, option d as the second best option, and option a as the worst option.
In general, the options with a more balanced set of characteristics, i.e., withan acceptable sUDI value (higher than 80%) and, simultaneously, not deviating

CASE STUDIES ON THE INTEGRATION OF ALGORITHMIC DESIGNPROCESSES IN TRADITIONAL DESIGN WORKFLOWS
115
too much from the architects’ original intent, were the ones that most pleasedthe architects. In contrast, none of the options with the highest sUDI values(options e, f , and g) were selected, which means that, regarding the architects’visual intent, these were not considered as good as the other options (options band c). Nevertheless, neither were the former considered as the worst options,demonstrating that, even when the design deviates from the initial concept (optiong), it may still be considered by the architect as a possible solution.
Regarding the worst option, even though it corresponded to the worst sUDIvalue, surprisingly, it was also the solution fitting all the constraints proposed bythe design studio. The architects justified this choice as a result of the panels’pattern being excessively dense, suggesting that an additional design constraintshould be added - the percentage of opening area should be at least 50%. Thisconstraint can be easily implemented, and the whole analysis and optimizationprocess can be automatically repeated, thus further illustrating the advantagesof (1) the use of algorithmic design, analysis, and optimization, and (2) thecollaboration between the members of the team and the design studio.
4. Case Study 2 - Structural OptimizationThe second example considered is a two floor service building, located in an urbancontext, to work as a museum. The architects wanted to create an articulated trussstructure to support the entire span of the building’s roof slab. It was desiredto minimize the depth of the truss solution adopted. To solve this problem, thestructure had to be first designed to then be evaluated regarding the structuralrequirements of a service building. Using an algorithmic approach, the task ofcreating a model with the complexity of a truss structure is facilitated. Moreover,it allows us to easily produce different truss solutions, a fundamental step in thesearch for a truss design that meets the structural requirements. In this case,we selected the maximum vertical displacement as the metric to be studied andevaluated by using a structural analysis tool, in this case, Robot (Marsh 2014). Wecreated an algorithm that generates different types of trusses to be tested, namelyWarren, Howe, Warren with verticals, and Pratt, and, in this paper, we discussthe last two. We opted for spatial truss solutions where we can vary the numberof the modular truss typology between supports, obtaining truss solutions with 6,8, and 10 modules. Figure 3 shows a side and a plan view of a spatial Warrenwith verticals with 8 modules between supports, as well as a rendered image ofthe solution.
The different truss types were evaluated according to the regulationEN1993-1-1, adopted by European countries (CEN 2005). The national annex forthe vertical deflections defines that, in the case of a multi-story service building,a limit of L/250 can be adopted, in which L is the smallest horizontal span of thebuilding at the floor level of about 6,4 m. This is translated into a limit of 2,56 cm.

116 I. CAETANO ET AL.
Figure 3. (A) shows a side and plan views of the spatial Warren with verticals truss typesolution with 8 modules between supports, and (B) shows a rendered image of the truss type
solution.
To automate the generation and evaluation of trusses, we used an iterativeoptimization process aiming at finding trusses with the minimum possible depthand themaximum displacement below the acceptable limit. Initially, the algorithmproduced a set of samples covering a large design space of several depth values.Then, the algorithm narrowed the design space by focusing on a fraction of thatspace, which yielded the best results. It then produced the same number of samples,but, this time, on the sub-space. The algorithm continued searching until it reacheda value close enough to the acceptable limit of maximum displacement. Similarlyto Case Study 1, the algorithmic design team used MCS to test the optimizationprocess’ workflow at a first stage, later switching to LHS to better explore thedesign space. Figure 4 shows the maximum displacement results obtained.
Figure 4. The displacements of the evaluated truss designs considering different depths andnumber of truss modules.
Observing the results, we can quickly conclude that the solutions with moretruss modules have better performance in terms of deflection. The Warren withverticals solution with 10 modules achieves the smallest depth of 1.03 m with anacceptable maximum displacement of 2.51 cm.
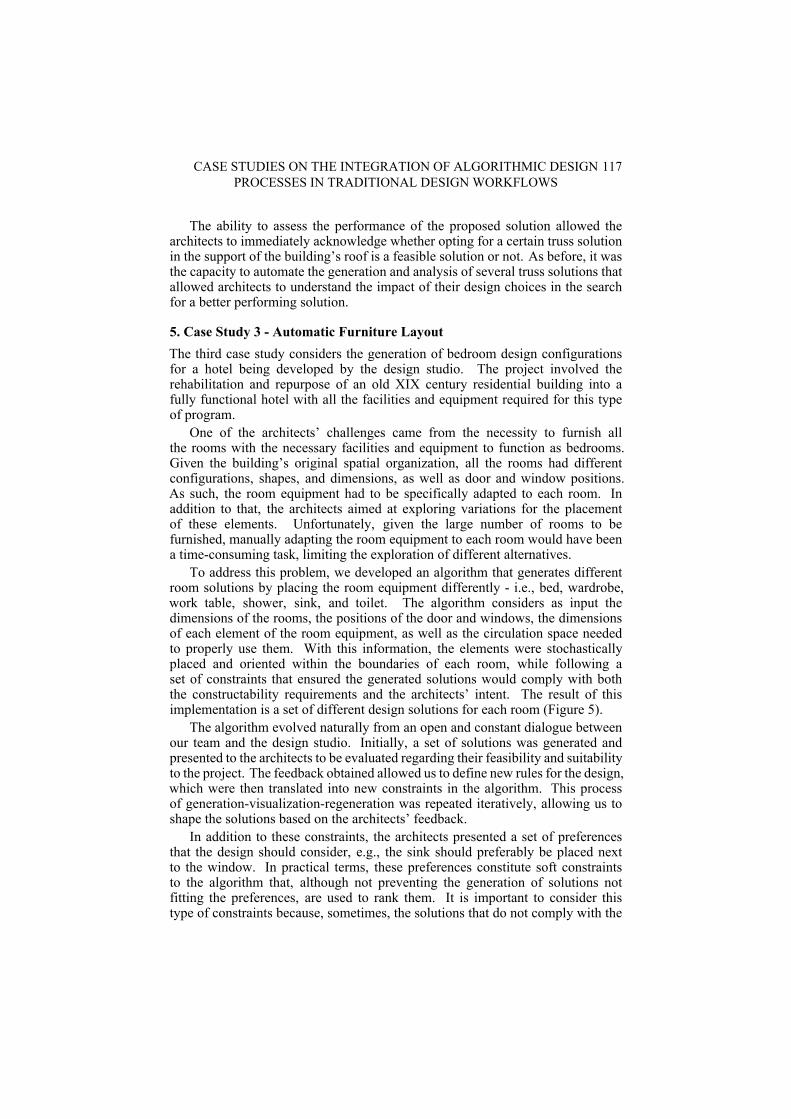
CASE STUDIES ON THE INTEGRATION OF ALGORITHMIC DESIGNPROCESSES IN TRADITIONAL DESIGN WORKFLOWS
117
The ability to assess the performance of the proposed solution allowed thearchitects to immediately acknowledge whether opting for a certain truss solutionin the support of the building’s roof is a feasible solution or not. As before, it wasthe capacity to automate the generation and analysis of several truss solutions thatallowed architects to understand the impact of their design choices in the searchfor a better performing solution.
5. Case Study 3 - Automatic Furniture LayoutThe third case study considers the generation of bedroom design configurationsfor a hotel being developed by the design studio. The project involved therehabilitation and repurpose of an old XIX century residential building into afully functional hotel with all the facilities and equipment required for this typeof program.
One of the architects’ challenges came from the necessity to furnish allthe rooms with the necessary facilities and equipment to function as bedrooms.Given the building’s original spatial organization, all the rooms had differentconfigurations, shapes, and dimensions, as well as door and window positions.As such, the room equipment had to be specifically adapted to each room. Inaddition to that, the architects aimed at exploring variations for the placementof these elements. Unfortunately, given the large number of rooms to befurnished, manually adapting the room equipment to each room would have beena time-consuming task, limiting the exploration of different alternatives.
To address this problem, we developed an algorithm that generates differentroom solutions by placing the room equipment differently - i.e., bed, wardrobe,work table, shower, sink, and toilet. The algorithm considers as input thedimensions of the rooms, the positions of the door and windows, the dimensionsof each element of the room equipment, as well as the circulation space neededto properly use them. With this information, the elements were stochasticallyplaced and oriented within the boundaries of each room, while following aset of constraints that ensured the generated solutions would comply with boththe constructability requirements and the architects’ intent. The result of thisimplementation is a set of different design solutions for each room (Figure 5).
The algorithm evolved naturally from an open and constant dialogue betweenour team and the design studio. Initially, a set of solutions was generated andpresented to the architects to be evaluated regarding their feasibility and suitabilityto the project. The feedback obtained allowed us to define new rules for the design,which were then translated into new constraints in the algorithm. This processof generation-visualization-regeneration was repeated iteratively, allowing us toshape the solutions based on the architects’ feedback.
In addition to these constraints, the architects presented a set of preferencesthat the design should consider, e.g., the sink should preferably be placed nextto the window. In practical terms, these preferences constitute soft constraintsto the algorithm that, although not preventing the generation of solutions notfitting the preferences, are used to rank them. It is important to consider thistype of constraints because, sometimes, the solutions that do not comply with the

118 I. CAETANO ET AL.
architects’ preferences, are the only ones that are feasible.This project is still ongoing: we are currently defining new constraints and
preferences according to the architects’ feedback in order to guide the algorithmtowards better solutions.
Figure 5. Solutions obtained for two different rooms. The filled rectangles represent thedimensions of the room elements, which were fixed by the designers, and the outlined
rectangles represent the circulation space required for their use.
6. ConclusionDespite the recognized advantages of algorithmic design techniques, traditionalsmall-scale architectural offices still struggle to adopt them, mainly due to lack oftime and resources. In these cases, the collaboration with digital design specialistsand/or computation experts is a good alternative, which can bring the intendedbenefits without incurring dramatic changes in the studios’ workflow and methods.In this paper, we discussed three different examples of such collaboration in whichwewere recently involved. Each example described a challenge that was presentedto us by a traditional small-scale design studio.
Our goal was to use algorithmic methods to solve the studio’s limitations and,then, to deliver a solution (or set of solutions) that could be used by them as astarting point for the following phases of their workflow. The challenges included(1) generating a set of façade shading panels with a degree of randomness andoptimized regarding their lighting qualities, (2) creating a truss structure withthe minimum acceptable depth for supporting the roof slab of a building, and(3) generating different possible solutions for furnishing a large number of hotelrooms.
In all cases, algorithmic-based design was used to produce the parametricversions of the intended designs. Then, sampling methods were used to drivethe generation of design solutions until different fitness criteria were met. In allstages, a frequent interaction between the algorithmic design specialists and thedesign studio was critical: the generated solutions were presented and discussedwith the architects, who then suggested additional constraints to be satisfied andpreferences to be taken into account. This process was done through weeklymeetings between the architects and the team of specialists, and it was repeated

CASE STUDIES ON THE INTEGRATION OF ALGORITHMIC DESIGNPROCESSES IN TRADITIONAL DESIGN WORKFLOWS
119
until optimal solutions, regarding their aesthetics and function, were achieved. Thefinal solutions were then generated according to the architects’ medium of choiceso that they could simply import them into their work.
This approach allows the use of algorithmic-based design in atraditional/small-scale design studio without disturbing its working methods,thus representing an interesting solution for those studios that do not have theresources to create, in-house, their own algorithmic design team. Our approachfollows the mixed-initiative proposal of Chaszar and Joyce (2016) of continuouslyinvolving the architects in the requirements elicitation and analysis, elaborationand implementation of prototype solutions, evaluation of the solutions by thecombined team, and subsequent iterations of the process. The goal is for thestudio to maintain control of the design process but, given the multitude of actorsinvolved in the complexity of the tasks, it is inevitable that some control is lost(Chaszar 2016).
One important limitation of the process is that the algorithmic knowledgeremains with the algorithmic design specialists. For large studios with sufficientresources, it is preferable to have that knowledge influencing the studio’s practice.To that end, the studio should participate in the algorithmic developments with itsown members, increasingly promoting in-house development (Sharples 2010).
Finally, in every work produced by a combined team, there is an importantquestion that deserves to be discussed: who owns the intellectual property? Giventhe small scale of the projects we discussed, this was not a primary concern butwe expect that, for larger projects, with considerably larger investments, it mightbecome critical (Noble 2010). We do not have yet a solution for this problem butwe hope our community will be a valuable source of ideas.
AcknowledgementsThis work was supported by national funds through Fundação para a Ciênciae a Tecnologia (FCT) with reference UID/CEC/50021/2013, and by the PhDgrant under contract of University of Lisbon (UL), Instituto Superior Técnico(IST) and the research unit Investigação e Inovação em Engenharia Civil paraa Sustentabilidade (CERIS).
ReferencesCaetano, I. and Leitão, A.: 2017, Integration of an Algorithmic BIM Approach in a Traditional
Architecture Studio., Protocols, Flows and Glitches, Proceedings of the 22nd InternationalConference of the Association for Computer-Aided Architectural Design Research in Asia(CAADRIA), Souzhou, China, 633–642..
CEN, initials missing: 2005, EN 1993-1-1: Eurocode 3: Design of steel structures - Part 1-1:General rules and rules for buildings, European Comittee for Standardisation, Brussels.
Chaszar, A.: 2016, Issues of Control and Command in Digital Design and ArchitecturalComputation, CAADence in Architecture.
Chaszar, A. and Joyce, S. C.: 2016, Generating freedom�: Questions of flexibility in digitaldesign and architectural computation, International Journal of Architectural Computing,14(2), 167–181.
Giedion, S.: 1941, Space, Time and Architecture, The Harvard University Press, Cambridge.

120 I. CAETANO ET AL.
Heijden, R.V.a.n.D.e.r., Levelle, E. and Riese, M.: 2015, Parametric Building InformationGeneration for Design and Construction, ACADIA 2015: Computational Ecologies: Designin the Anthropocene [Proceedings of the 35th Annual Conference of the Association forComputer Aided Design in Architecture, Cincinnati, 417–429.
Imbert, F., Frost, K.S., Fisher, A.W., Andrew Tourre, V. and Koren, B. 2013, ConcurrentGeometric, Structural and Environmental Design: Louvre AbuDhabi, inH. Lars, S. Sharma,J. Wallner, N. Baldassini, P. Bompas and J. Raynaud (eds.), Advances in ArchitecturalGeometry 2012, Vienna: Springer Vienna, 77–90.
Marsh, K.: 2014, Autodesk Robot Structural Analysis Professional 2015: Essentials, MarshAPI LLC.
McKay, M.D., Beckman, R.J. and Conover, W.J.: 1979, A Comparison of Three Methodsfor Selecting Value of Input Variables in the Analysis of Output from a Computer Code,Technometrics, 21(2), 239–245.
Nabil, A. and Mardaljevic, J.: 2006, Useful daylight illuminances: A replacement for daylightfactors., Energy and buildings, 38(7), 905–913.
Noble, C. 2010, Controlling Intellectual Property, in P. Deamer and P.G. Bernstein (eds.),Building (in) the Future: Recasting Labor in Architecture, Princeton Architectural Press,New York, NY, USA, 171-177.
Santos, L., Lopes, J. and Leitão, A.: 2012, Collaborative Digital Design: When the architectmeets the software engineer., H. Achten et al., eds. Digital Physicality - Proceedings of the30th eCAADe Conference., Czech Technical University in Prague, Faculty of Architecture(Czech Republic), 87–96.
Shapiro, A. 2003, Monte Carlo Sampling Methods, in A. Ruszczynski and A. Shapiro (eds.),Handbooks in Operations Research and Management Science, Elsevier Science, 353–425.
Sharples, C. 2010, Technology and Labor, in P. Deamer and P.G. Bernstein (eds.), Building (in)the Future: Recasting Labor in Architecture, Princeton Architectural Press, New York, NY,USA, 90–99.

EXPLORING THE INTERSECTION OF MUSIC ANDARCHITECTURE THROUGH SPATIAL IMPROVISATION
JEREMY J. HAM1RMIT University SIAL Sound [email protected]
Abstract. Creative practice design research brings forth richopportunities for the exploration of inter-domain connections betweenmusic and architecture. Through inter-disciplinary creative practiceexplorative project work founded on a methodology of improvisationon the digital drum kit, two stages of design research project workare outlined. In the first stage, a language of polyrhythmic drummingis parametrically spatialized as a reflective lens on an extant creativepractice. From here, a new form of ‘Spatial Improvisation’ is explored,where conceptual spatial forms are generated from improvisationson the digital drum kit. This new musico-spatial design practiceinvolves mediating a spatio-temporal-dynamical ‘Y-Condition (Martin,1994)’ wherein temporal and dynamic design decisions translatefrom the musical domain into the spatial domain through ‘spatialthinking-in-action’.
Keywords. Music and Architecture; Design Research; SpatialImprovisation; Design Process; Parametric Digital Design.
1. IntroductionWhilst there has been much inter-disciplinary research and practice between thedomains of music and architecture, the focus has largely been on conceptualisingtranslations of music into “architecture” through analogue or computationalprocesses. Elizabeth Martin, in the publication ‘Architecture as a Translation ofMusic’, proposed a theoretical Y-Condition as ‘the middle position of music andarchitecture when translating one to another finding an organic union betweenthe two (Martin 1994)’. Many researchers and practitioners have addressedmusic-architectural translations, moving from architecture to music throughsonification and computational analysis (Tomara, Liapi et al. 2011) and music toarchitecture (eg. Holl (1994) and Hansen (2015)) and as digital representationswith architectural qualities (e.g. Ferschin, Lehner et al. (2001), Levy (2003),Christensen and Schnabel (2008), Krawczyk (2012) and Tomara, Liapi et al.(2011)). Marcos Novak is notable in his extended philosophical, experimentaland computational explorations of archi-music as the ‘art and science that resultsfrom the conflation of architecture and music (Novak, 2007)’. Amongst thesepractitioners and preceding many, one truly inter-disciplinary practitioner clearlystands out. The work of Iannis Xenakis provides the foundation for the exploration
T. Fukuda, W. Huang, P. Janssen, K. Crolla, S. Alhadidi (eds.), Learning, Adapting and Prototyping,Proceedings of the 23rd International Conference of the Association for Computer-Aided ArchitecturalDesign Research in Asia (CAADRIA) 2018, Volume 1, 121-130. © 2018 and published by the Associationfor Computer-Aided Architectural Design Research in Asia (CAADRIA) in Hong Kong.

122 J.J. HAM
ofmusic and architecture through his complex design and compositional processes,where synergies evolve from the translation of concepts from one domain toanother. In this paper, I examine elements of a theoretical continuum betweenperformance (in the musical domain), notation of performance (in the visual andspatial domains) and 3D spatial representation, then introduce the idea of a SpatialImprovisation as a new form of ‘Musico-Spatial design’ creative practice.
2. The Digital Drum Kit as Interface between DomainsThis research is based on the author’s creative practice as musician (drumsand percussion) and spatial designer (architect). The home music-design studioprovides the location for explorations in the fuzzy conceptual territories that existsbetween music and spatial design. The research is founded on the principles ofdesign research as ‘research through design’ (Downton 2003) wherein ‘designingis (also) a way of conducting research of the kind that design undertakes and, bythis means, of producing knowledge for use in designing’. Two stages of a largercreative practice Ph.D. by project work are discussed in this paper.
Drumming creative practice operates along a ‘Functional-CompositionalContinuum’ (FCC) between novice and advanced, experimental drummers whoexercise the four ‘levers of control’ of the temporal, the metrical, the dynamicaland the timbral in their expressive playing (Bruford 2015). Drumming isunder-recognised as a highly complex physical and cognitive activity that involvesthe live selective triggering, by way of striking with sticks, of certain drum kit‘notes’ (bass drum, snare, tom toms, hi-hat and cymbals) at certain velocities atcertain times, resulting in digital note outputs of certain durations. We can reducethe complex skill of drumming down to the dynamic placement of polyrhythmicdrum notes of certain durations in at certain times, within an overall temporalstructure.
For the research, a Roland TD20 digital drum kit acts as musical instrument,translation tool as a spatial generation interface for a variety of outputs (See Ham2016, Ham 2017). Project workflow involves the export of Musical InstrumentDigital Interface (MIDI) data from the Roland TD20 drum kit and processingthese data in Reaper on a Mac desktop. Using the Sekaiju app, MIDI files areconverted to Excel format, which are then read into Rhino3D Grasshopper (GH)(Figure 1). Digital drum parameters are then translated into spatial parametersas 3D Spatial Drum Notation (3D-SDN) and for spatialization. A key attributeof the Grasshopper definition is the ability for all spatial parameters to beflexibly adjusted easily depending on specific user requirements and purpose usingnumeric input panels and sliders. The same definition in Grasshopper can beadapted, exported or used in conjunction with other applications ranging fromdigital fabrication to Virtual Reality. MIDI data have also be used in the creation ofDigital DrumScape compositions in the musical domain as a means of furtheringdual-modality creativity (See www.jjham.com).

EXPLORING THE INTERSECTION OF MUSIC AND ARCHITECTURETHROUGH SPATIAL IMPROVISATION
123
Figure 1. Project Workflow from digital drum kit to DAW to Grasshopper.
Improvisation has been used as a methodology for the generation of a largedata set to provide the basis for translation into the spatial domain. Througha process of divergent thinking (Medonca and Wallace 2005), the improvising‘compositional’ drummer refers to, adapts and evolves a set of ‘referent (Pressing1998)’ patterns and phrases as a set of schema ‘which aid improvisation, as theyprovide variation tomusic improvisationswhile reducing the risks involved (Lewisand Lovatt 2013)’. The concept of referents draws parallels with architecturaldesign processes, wherein the architect sub-consciously draws upon a bodyof knowledge to inform a current design task as ‘reflection-in-action’. Therelationship between improvisation and design has been made by Donald Schön,who described ‘reflection-in-action’ as ameans to ‘generate new knowing, as whena jazz band improvises within a framework of meter, melody, and harmony (Schön1995)’. Thus, musical improvisation can be considered as a form of composing inreal time that has similarities to designing, however with music this involves splitsecond decision-making and response time.
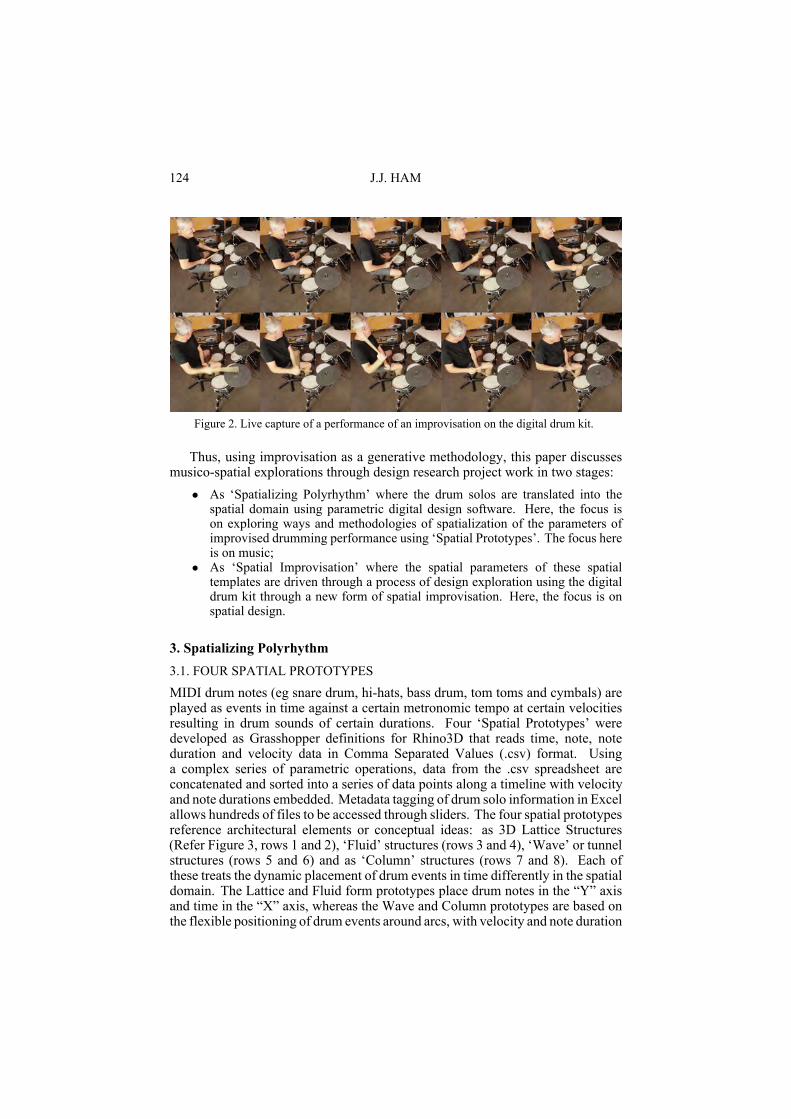
124 J.J. HAM
Figure 2. Live capture of a performance of an improvisation on the digital drum kit.
Thus, using improvisation as a generative methodology, this paper discussesmusico-spatial explorations through design research project work in two stages:
• As ‘Spatializing Polyrhythm’ where the drum solos are translated into thespatial domain using parametric digital design software. Here, the focus ison exploring ways and methodologies of spatialization of the parameters ofimprovised drumming performance using ‘Spatial Prototypes’. The focus hereis on music;
• As ‘Spatial Improvisation’ where the spatial parameters of these spatialtemplates are driven through a process of design exploration using the digitaldrum kit through a new form of spatial improvisation. Here, the focus is onspatial design.
3. Spatializing Polyrhythm3.1. FOUR SPATIAL PROTOTYPES
MIDI drum notes (eg snare drum, hi-hats, bass drum, tom toms and cymbals) areplayed as events in time against a certain metronomic tempo at certain velocitiesresulting in drum sounds of certain durations. Four ‘Spatial Prototypes’ weredeveloped as Grasshopper definitions for Rhino3D that reads time, note, noteduration and velocity data in Comma Separated Values (.csv) format. Usinga complex series of parametric operations, data from the .csv spreadsheet areconcatenated and sorted into a series of data points along a timeline with velocityand note durations embedded. Metadata tagging of drum solo information in Excelallows hundreds of files to be accessed through sliders. The four spatial prototypesreference architectural elements or conceptual ideas: as 3D Lattice Structures(Refer Figure 3, rows 1 and 2), ‘Fluid’ structures (rows 3 and 4), ‘Wave’ or tunnelstructures (rows 5 and 6) and as ‘Column’ structures (rows 7 and 8). Each ofthese treats the dynamic placement of drum events in time differently in the spatialdomain. The Lattice and Fluid form prototypes place drum notes in the “Y” axisand time in the “X” axis, whereas the Wave and Column prototypes are based onthe flexible positioning of drum events around arcs, with velocity and note duration

EXPLORING THE INTERSECTION OF MUSIC AND ARCHITECTURETHROUGH SPATIAL IMPROVISATION
125
radiating outward from a central setout point.
Figure 3. Rhino3D Grasshopper Spatialization of polyrhythmic drum solos in Lattice, Fluid,Wave and Column prototypes.
3.2. SPATIALIZATION OF 100 DIGITAL DRUM SOLOS
This project involves the transformation of drum improvisations from themusical domain into the spatial domain. Musical drum improvisation is thusexplored through the lens of spatial design, wherein musical parameters areembodied within spatial parameters and parametric functions enable form-makingexplorations. Here, there is an inversion in the freedom vs complexity workflowbetween improvised drumming, mixing and mastering to final output and themapping of musical: spatial parameters and the production of multiple potentialoutcomes: ‘One moves from simplicity of operation to complexity in processing,the other from complexity of parameterisation to simplicity of generation ofmultiple spatial alternatives (Ham et. al 2016)’. Once the parametric ‘system’is established, multiple variations can be explored with ease. This parametric playis, in itself, is a form of improvisation.
This project explores the author’s ‘polyrhythmic idiolect (Gander 2017)’ asbrought about through a methodology involving the generation of a large numberof drumming improvisations. From the corpus of hundreds of 60-second drumbeats and drum solos, 100 short (1-4 bar) patterns and phrases were curated that

126 J.J. HAM
represent the ‘go to’ schema or ‘referents’ that are called upon in improvisationalsituations. These may range from a standard 4:4 beat pattern, to breakout drumrolls, flams and other commonly used elements of drumming. Previous researchhas used 3D-Spatial Drum Notation (3D-SDN) to enable the analysis of thesepatterns and phrases in plan, elevation and 3D to unpack elements of micro-timing,rubato, ritardando, ghosting and other individual elements of drumming style(Ham, 2017).
By evolving the 3D-SDN Grasshopper definition, this research moves fromnotational to representational means of understanding drumming improvisation.As a secondary outcome of this process, novel and unique spatial forms arecreated that serve artistic or creative purposes as ’proto-architectures (Fowler,2012). Figure 4 illustrates a sample of ten 10m x 10m 3D Delaunay’Event-Time-Dynamics’ lattice structures. Drums are arranged on the ”Y” axis(Bass drum at bottom, tom toms, snare in middle, cymbals and hi-hat at top)and time is arranged on the ”X” axis from left to right. Drum notes at variablevelocities and note durations are represented by data points in the ”Z” axis. A 3DDelaunay triangulation GH function finds the closest data point from one drumto another. From this superimposition of a geometric relational overlay on thedrum data points, insights into what Frank Zappa termed the ’statistical density(Redrup 2012)’ of the author’s ’polyrhythmic idiolect’ can be spatialized in threedimensions. Fast double kick drumming and closed roll fills are spatially identifiedby the tight spacing between points in the triangles, whereas sparse, minimalisticplaying results in more ’open’ triangulation of the lattices (Figure 4, below). Asquare outline of the lattice indicates use of the bass drum and hi hats at the startand finish.
Figure 4. 3D Delaunay ‘Event-Time’ lattices of ten referent patterns and phrases.
This small example is one of many methods of spatial representations ofdrum improvisations that have been developed as part of the greater researchproject. These representations can be used to provide an ‘affordance’ for analyticalpurposes in terms of how the attributes of designed objects provides visual cuesas to how they are to be used (Gibson 1979, Norman 2002). In this case, the3D spatial representations provide insights into musical attributes of drummingpatterns and phrases that are otherwise unavailable in musical notation or throughlistening. At the same time, the spatial representations reveal properties ofdrumming improvisation that architects may find opportunities to exploit in real

EXPLORING THE INTERSECTION OF MUSIC AND ARCHITECTURETHROUGH SPATIAL IMPROVISATION
127
or imagined scenarios.
4. Spatial ImprovisationFollowing on from the ‘Spatializing Polyrhythm’ project, the ‘SpatialImprovisation’ project adapts the practice of drum based musical improvisationinto a new practice of spatial exploration. This requires the transformation of amusical practice into a ‘musico-spatial design’ creative practice. In this context,the project addresses the following question:
• How can the knowledge and skills inherent in a musical improvisation practicetranslate into the spatial domain as Spatial Improvisation?
A series of five spatial design propositions were established that set up spatialintentions for spatial improvisation. These propositions required the spatialdrummer to ‘design in time and space’ by exercising the ‘levers of control (Bruford,2015)’ to generate forms in the spatial domain. Designing in space and timerequires the translation of spatial thinking into physical interaction with the drumkit through drum-based improvisation. Spatial intentions were ‘designed’ througha process of mass improvisation, with twenty drum improvisations performed foreach design intention. The spatial design intention discussed in this paper imaginesa 30-metre-long fluid wave form that twists and deviates from one end to another,with an enlarged section in the middle (refer Figure 5). Based on the layout ofcertain drums along the length of the twisted form, the drummer designer mustperform certain notes at certain times in order to produce the required form in thespatial domain. The GH definition utilises two forms of lofting to create a 3Dspatialization with thickness and double-sided NURBS surfaces. On the top side,note duration data points are lofted, whereas on the underside, note velocities arelofted. This lofting provides an element of indeterminancy brought about by thesweeping of surfaces along curves derived from velocity and note duration datapoints. This indeterminancy, in turn, brings an element of complexity into thedesign process.
Figure 5. Ten ‘Twisted Deviations’ Spatializations derived from the playing of the bass drum(bottom right), snare drum (middle section) and hi hat (top left) as well as other drums.
The term ‘spatial improvisation’ has been used in the areas of dance andthe arts and in architectural research to refer to layered sketching as designprocess (Philemon, 2015) and as a means of understanding the creative process

128 J.J. HAM
amongst multiple actors (Waddell, 2017). The temporal displacement betweenimprovisation as design and static representation inherent in the project workflow(see Figure 1, above) brings a degree of intuitive to this form of spatialimprovisation. With musical improvisation, the drummer is able to respondto micro-second timing variations instantly, whereas with spatial improvisation,spatial intentions are designed with only intuitive insights into the outcome ofeach iteration. This makes spatial improvisation a very difficult creative practiceto master. Spatial improvisation constitutes a new creative practice that requiresthe adaptation of the body of referent patterns and phrases used in the musicaldomain into the spatial domain. The new creative practice is not entirely musical,nor spatial- but ‘musico-spatial’. I propose that that musical improvisationconstitutes a form of design activity, or at least a ‘design-like’ activity. Designthinking within this new practice of spatial improvisation involves the translationof skills and knowledge from a career of drumming into spatial thinking-in-action.Spatial thinking-in-action plays with the temporal and the dynamical. Whereasa drummer performing a solo musical improvisation will initiate a series ofphrases and patterns on the drum kit in succession to serve musical intentions,the spatial improviser plays the drum kit to serve pre-conceived or improvisedspatial intentions. This occurs in the knowledge of a spatio-temporal-dynamical‘Y-Condition (to borrow the term from Martin (1994))’ wherein temporal anddynamic design decisions translate from the musical domain into the spatialdomain.
This spatial thinking-in-action, as a new practice, involves learning the system,and gaming the system until degrees of ‘tacit knowing-in-action (Schön 1995)’ caninform novel spatial improvisations. The knowledge and skill base is drawn, in thiscase of a dual skilled practitioner in the author (as musician-architect) separatelyfrom the creative practice of drumming, and also the practice of architecture into athird practice of spatial improvisation. In this new practice, a new knowledge baseevolves that integrates the skills, dexterity and temporal thinking of the drummerwith the spatial compositional skills of the architect. Physical combinations ofdrum patterns and phrases as musical ‘referents’ are thus re-purposed as spatial‘referents’. This requires a certain ‘untraining’ from a long-established musicalpractice. The ‘in the moment’ nature of this improvised practice forces spatialdecision-making, providing an environment where risk of failure is real. Withinthis risk, novel opportunities arise- just as in musical improvisation where ‘inthe moment mistakes’ form the basis for new improvisational directions. Thisspatial improvisation is also founded on the temporality of design decision making.Unlike traditional spatial design, the designer must make split second designdecisions that cannot be undone, are final and are not made with the benefitof immediate visual feedback. spatial improvisation is thus ‘spatial designin-the-moment’. Mastery of this new spatial improvisation, as an evolvingpractice, may take many months or years to master.
5. Conclusions and Further ResearchThe nexus of music and architecture has been explored through a trajectory ofresearch starting at 3D Spatial Drum Notation (not discussed here) through to the

EXPLORING THE INTERSECTION OF MUSIC AND ARCHITECTURETHROUGH SPATIAL IMPROVISATION
129
spatialization of polyrhythmic digital drumming, and a new spatial improvisationas a ‘musico-spatial design’ creative practice. The mapping and translation ofdrum data into the spatial domain provides affordances for understanding elementsof improvisational drumming practice whilst also allowing creative opportunitiesin the spatial domain. Spatial improvisation, as a complex and indeterminant formof improvisational practice, relies on the interplay between design thinking andphysical dexterity and skills on the digital drum kit. This transforms the designprocess from the spatial to the spatio-temporal. The concept of ‘spatial thinking inaction’ references Schön’s ‘reflection-in-action’ and proposes a process wherebydesigners engage with the interface of the drum kit to deliver spatial intentions.This requires an adaptation of the skills of a musical practice into a new formof spatial practice. Improvisation as methodology provides opportunities for thispractice to be developed through a process of repetitive learning by playing. Thus,‘Spatial improvisation’ provides a basis for creative exploration and, throughlearning the system, repetition, and learning from anticipated and unanticipatedoutcomes, skills as a musico-spatial designer are built.
This Spatial Improvisation informs the next stage of the research, wherein thepractices of music and spatial design are brought back together as Musico-SpatialImprovisation. Working in a Virtual Reality environment, musico-spatialimprovisation relies on the integration of musical and spatial design practicethrough the real-time dynamic contemporaneous generation of spatial and musicaloutputs. This design exploration is facilitated by the use of the digital drum kitin association with VR headsets and spatial sound arrays. This extension of thedesign research trajectory will be explored in future publications.
AcknowledgementsI gratefully acknowledge the support of the Australian Government PostgraduateResearch Scholarship. The author would like to acknowledge the supervision ofLawrence Harvey, Malte Wagenfeld and Jules Moloney, and Awnili Shabnam forher work on the GH definition for this research.
References“The Music of Architecture: Computation and Composition” : 2007. Available from <http://w
ww.mat.ucsb.edu/̃marcos/TheMusicOfArchitecture.pdf> (accessed 11th December 2017).Bruford, W.: 2015,Making it work: Creative music performance and the western kit drummer,
Ph.D. Thesis, School of Arts, University of Surrey.Christensen, P. and Schnabel, M. A.: 2008, Spatial Polyphony: Virtual architecture generated
from the music of JS Bach, Proceedings of the 13th International Conference on ComputerAided Architectural Design Research in Asia, Chiang Mai, Thailand, 501-509.
Downton, P.: 2003, Design Research, RMIT Publishing, Melbourne.Ferschin, P., Lehner, D. and Oka, Y.: 2001, Translating Music into Architecture, Proceedings
of the Third International Mathematics and Design Conference M&D2001: digital, hand,eye, ear, mind, Geelong, Australia.
Fowler, M.: 2012, Reading John Cage’s Variations III as a Process for GeneratingProto-Architectural Form, Leonardo, 45(1), 34-41.
Gander, A.: 2017, Developing a Polyrhythmic Idiolect, Ph.D. Thesis, Sydney Conservatoriumof Music, University of Sydney.

130 J.J. HAM
Gibson, J.: 1979, The Theory of Affordances in the Ecological Approach to Visual Perceptual,Houghton Mifflin.
von Goethe, J.: 1832, Conversations with Goethe in the Last Years of His Life, Hilliard, Gray,and Company, Boston.
Ham, J. J.: 2017, AnArchitectural Approach to 3D Spatial Notation, TENOR 2017 InternationalConference on Technologies for Music Notation and Representation, A Coruna, Spain.
Ham, J. J., Kieferle, J. and Woessner, U.: 2017, Exploring the Three Dimensional Spatialityof Polyrhythmic Drum Improvisation, ShoCK! - Sharing Computational Knowledge! -Proceedings of the 35th eCAADe Conference, Rome, Italy, 629-63.
Ham, J. J., Schnabel, M. A., Harvey, L. and Prohasky, D.: 2016, Starting with Nothing,Complexity & Simplicity - Proceedings of the 34th eCAADe Conference, Oulu, Finland,377-386.
Hansen, J. H.: 2015, “Form follows funk” . Available from <www.formfollowsfunk.com>(accessed 13th April 2015).
Holl, S. 1994, Stretto House, in E. Martin (ed.), Pamphlet Architecture 16: Architecture as aTranslation of Music, Princeton Architectural Press, New York, 56-59.
Krawczyk, R. J.: 2012, Exploring the Visualization of Music. „ Proceedings of Bridges 2012:Mathematics, Music, Art, Architecture, Culture, Baltimore, USA.
Levy, A. J.: 2003, Real and Virtual Spaces Generated By Music, International Journal ofArchitectural Computing, 1(3), 375-391.
Lewis, C. and Lovatt, P.: 2013, Breaking away from set patterns of thinking: Improvisation anddivergent thinking, Thinking Skills and Creativity, 9, 46-58.
Martin, E.: 1994, Pamphlet Architecture 16: Architecture as a translation of music, PrincetonArchitectural Press, New York.
Medonca, D. and Wallace, W.: 2005, Cognition in jazz improvisation: An explanatory study,26th annual meeting of the cognitive science society, Chicago, Ilinois.
Norman, D. A.: 2002, The design of everyday things, Basic books, New York.Philemon, W.: 2015, “Spatial Improvisation: From Giants Steps to Architecture” . Available
from <https://books.google.com.au/books?id=SYXcjgEACAAJ> (accessed 11th December2017).
Pressing, J.: 1998, Psychological constraints on improvisational expertise and communication,Unpublished manuscript.
Redrup, P.: 2012, “Dancing About Architecture: Frank Zappa Reissues 1972-1979” .Available from <http://thequietus.com/articles/10934-frank-zappa-reissues-review-2-1972-1979> (accessed 11th December 2017).
Schön, D.: 1995, Knowing-in-action: The new scholarship requires a new epistemology,Change: The Magazine of Higher Learning, 27(6), 27-34.
Tomara, A., Liapi, M. and Parthenios, P.: 2011, Translating Urban Environment to Music,SIGRADI 2011: Proceedings of the 38th International conference and exhibition oncomputer graphics and interactive techniques, Vancouver, Canada.
Waddell, T.: 2017, “Our architecture is hear” . Available from <https://situatedarchitecture.wordpress.com> (accessed 11th December 2017).

Generative, Algorithmic andEvolutionary Design

132

DISCRETE SWARM LOGICS
CONNOR HYMES1 and CHRISTOPH KLEMMT21University of [email protected] / University of Cincinnati / University of Applied [email protected]
Abstract. The logics of agent-based behaviors have found interestin architectural design for their possibility to generate self-organizinggeometries. However, the resulting free-form geometries are usuallycomplex and costly to construct as buildings. Recently architects haveproposed discrete components to create a cost-effective computationaldesigns. This research explores the possibilities of discretizingagent-based simulations to make their bottom-up behaviors andresulting geometries more easily usable for economic construction.Different types of discretization have been explored. The simulationshave been evaluated as a design tool at scales from the urban to thedetail. The outcomes at the larger scale provide design possibilities,but with little influence on construction costs. At the smaller scale, thegeometric assemblies show good possibilities for an economic designand a feasible construction, by altering, but not compromising, theemergent self-organizing principles that guide the simulations.
Keywords. Discrete; swarm; agent; simulation.
1. IntroductionArchitectural designers have been interested in principles of self-organizationfor many years, and many have successfully utilized geometries that have beengenerated by self-organizing systems. As computational design and architecturehave evolved, bottom-up design methodologies have become a tool for mimickingcomplex arrangements found in natural systems as a means of form generation.Agent-based swarm simulations, a type of self-organized systems extensivelyinvestigated for architectural applications, are able to generate increasinglycomplex arrangements through the design of the initial parameters, allowing thesimulation to build upon relationships the agents have with one another. Whileagent-based simulations and swarm logics have been able to generate highlyemergent geometries that can respond dynamically to a variety of requirementsand constraints, the resulting geometries are usually of a complexity and geometricrefinement that make them extremely difficult, if not impossible, to construct atan architectural scale and budget. The authors are not aware of any economicallyviable building that has yet been constructed that is based on a swarm-basedgeometry.
T. Fukuda, W. Huang, P. Janssen, K. Crolla, S. Alhadidi (eds.), Learning, Adapting and Prototyping,Proceedings of the 23rd International Conference of the Association for Computer-Aided ArchitecturalDesign Research in Asia (CAADRIA) 2018, Volume 1, 133-142. © 2018 and published by the Associationfor Computer-Aided Architectural Design Research in Asia (CAADRIA) in Hong Kong.

134 C. HYMES AND C. KLEMMT
While new construction technologies and large-scale 3D-printing are evolving,the construction industry today is still very much based on the use of straightextrusions, flat sheet materials, and repetitive identical components. In order toexplore ways of using agent-based design and swarm logics for commerciallyviable projects, this paper therefore sets out to explore the possibilities of usingdiscrete swarms. Rather than allowing the generation of free-form geometry,agents are constrained to specified angles, lengths or three-dimensional grids. Theaim of these constraints is to create architectural geometries that can be constructedfrom standard components or that use repetitive elements and joints, while stillutilizing the emergent qualities and spatial complexities that swarm logics are ableto offer.
The translation from swarm to building is envisioned through trails left alongthe agent’s paths; segments of the trails are turned into straight linear components;the members are connected at joints; the surfaces between those members becomefaçade panels, interior wall panels, or floor slabs. The possibilities of the discreteswarms are explored at four different scales from the urban to the detail (Fig. 1).
Figure 1. Discrete Swarm Physical Model.
2. Related Work2.1. AGENT-BASED SWARM SIMULATIONS
Agent-based swarm simulations are based on the work of Craig Reynolds, whodeveloped an algorithm to simulate the behavior of flocks and swarms (Reynolds1987). Various architects and designers have used simulations based on those ofReynolds in order to generate forms for use in architecture. Examples are the workof Kokkugia, Alisa Andrasek, David Gerber or Satoru Sugihara (Andrasek 2012;

DISCRETE SWARM LOGICS 135
Pantazis et al. 2014; Snooks 2013; Stuart-Smith 2014; Sugihara 2014). Often theagents are used to leave trails along their paths that are turned into architecturalgeometry, or the agents are constrained to a given geometry onto which they leavea pattern. The use of the swarm logic allows a self-organized formation of thegeometry that can respond to a variety of external influences. However, the resultsare often highly complex free-form geometries that are difficult to construct forcommercially viable projects.
2.2. DISCRETE DESIGN LOGICS
Recent architectural discourse has seen an interest in design that is based ondiscrete components. A defined limit in the number of different components andin the ways that they can be assembled can allow for a cost-effective construction.The arrangement of the components can follow combinatorial logics as in thework of Jose Sanchez (Sanchez 2016), or algorithmic logics as in the work ofGilles Retsin (Retsin and Jimenez Garcia 2016; Retsin et al. 2017). The rationalebehind the use of discrete components is partially their feasibility in constructionand partially for the aim of moving away from the existing realms of free-formdesign and biomimicry (Retsin 2016). However, the discourse so far appears tohave a limited concern for a functional logic in the arrangement of the components,and seems to a large extent be aesthetically driven.
This research therefore proposes a combination of swarm simulations in adiscretized environment, such that the resulting geometry can make use of theemergent behaviors of the responsive swarm logic while at the same time beingan economically buildable agglomeration of identical discrete components. Somerelated work appears to have been produced by students of the Bartlett (Neira 2015,Retsin and Jimenez Garcia 2016).
3. Algorithmic Simulations3.1. AGENT-BASED SWARM BEHAVIORS
The swarm simulations are based on the work by Reynolds (Reynolds 1987). Themovement of the agents is calculated as an acceleration-velocity model, in whichthe different forces acting on an agent are accelerating its velocity. The velocityis then used to calculate the agent’s new position in each iteration. Agents followthree rules in their movement in relation to their neighbors:
• Separation causes agents to avoid their neighbors.• Alignment causes an agent to align its direction with that of its neighbors.• Cohesion causes agents to seek the proximity of their neighbors.
All three rules have different variables for their control, such as the number ofneighbors they react to, the strength of the force in relation to the distance to aneighbor, or a field of vision so that an agent only reacts to those other agents thatare positioned in front of it. Additionally, other rules are applied that have foundwidespread use in architectural design:
• The drawing of trails along which the agents have moved.• Attraction or alignment to trails that the other agents have left.

136 C. HYMES AND C. KLEMMT
• Attraction or repulsion toward attractor points.• Attraction to, or a fixed constraint onto an existing mesh geometry.
Those behaviors are commonly used for swarm logics in architectural design, forexample by the designers mentioned in section 2.1 Previous Work.
Figure 2. Agent-Based Simulation Development, from Free-form to Linear.
3.2. DISCRETIZATION
The discretization of the swarms and their resulting trail geometries is aimedat making them more feasible for construction than their otherwise free-formgeometry, with the potential to unitize their geometries and joints (Fig. 2). Threedifferent methods of discretization have been explored:
3.2.1. Free Movement Post-Processed into a GridThe swarm simulation is calculated in a non-discretized 3D space, and trails arecalculated with free-form movement. However for a further utilization of thegeometry, and possibly also for the visualization during the runtime, the positionsof every agent, and therefore also the points of their trails, are adjusted to theclosest nodes of a 3-dimensional grid. The grid can be a regular and orthogonalby defining the x, y and z-spacing. Other grids can also be used. For a regularorthogonal grid, the resulting trail geometries will always connect neighboringgrid points in an orthogonal manner, or they will cross grid cells diagonally. Thelength of the members, their joints, and the surface geometries that they enclosewill therefore all be discrete components out of a limited set (Fig. 3).
3.2.2. Movement Constrained to a Grid at RuntimeAnother method of discretization is utilized while the simulation is in progress.The agents are subjected to align to a grid and the actual position of the agent ismoved into the grid during the simulation. Then in the next step the agent continuesto move on from the position on the grid, rather than from a free position in space.Agent alignment within the grid creates a swarm that is influenced by the grid as aparameter in its self-organization. The free movement that is post-processed intothe grid formation develops members, joints, and enclosed surfaces as discrete

DISCRETE SWARM LOGICS 137
components out of the same limited set. However in this case, the actual behaviorof the agents is influenced by their alignment to the grid, creating a differentoutcome of that discussed in section 3.2.1.
Figure 3. Agent Trails Post Processed Onto Different Grids.
3.2.3. Discretization of Lengths and AnglesDiscretization can be utilized to control the angle of an agent’s movement and thelength of the steps an agent can move in each iteration. This method allows forthe agent location to be anywhere in space, but when it moves in each iteration,it is constrained to movement at a defined angle (possibly 45, 60 or 90 degree),and/or it is constrained to movement by a specified length. By using this type ofdiscretization it is possible to constrain the members to a set that only uses a singlecomponent of the length that the agent’s step size is constrained to. The jointcan be discretized by defining the possible angles at which the agents can move.However, neighboring trails are unlikely to align or to be positioned at constantor discretized distances. In order to bridge neighboring trails it would thereforerequire the introduction of additional members of varying lengths and angles thatlink the joints of one trail with the joints of the next. Also, surfaces betweenadjacent trails will not follow identical geometries. This type of discretizationtherefore offers little advantage for an economic construction and has not beenpursued further for this research.
In all of the discretization methods, the definition of the grid spacing, step andangle size are important and can have a significant influence on the behavior ofthe simulation and its implementation in a design project.
4. Design Explorations at Varying Scales4.1. URBAN SCALE
At the urban scale, discrete swarms have the ability to connect major areas withinthe city creating unforeseen connections. Urban swarms can generate emergentsystems that can act as paths of connections or organizational grids within a city.Attractor points can be implemented within 3D environments to represent majorpublic spaces, influencing the swarm with specific contextual elements of the

138 C. HYMES AND C. KLEMMT
city. This design methodology can connect areas of the city using agent trailsas proposed circulation paths of the emergent system.
The utilization of discretized swarm behaviors on the urban scale can thereforefollow similar directions as described above. For example by restricting agentmovement to a specific length based upon a city’s grid, agents canmove in betweencity blocks and streets. This method can operate by creating grid constraints insimulations or through post-processing techniques, both with a variety of differentend results. The benefits of the discretization at this scale can relate to thegeneration of grid-based urban layouts that have emergent qualities (Fig. 4).
Figure 4. Urban Scale Swarm Diagram - Block Scale Spatial Hierarchy.
4.2. BLOCK SCALE
The block scale looks at the agent interaction toward a collection of buildingswithin a city block of an urban environment. Swarms can use a proposed city gridor paths of circulation and transform them into connections between buildings.The agent trail alignment within a swarm creates redundancies and overlappinglines that can be utilized to create spatial hierarchies within a system of trails.
The discretization of these trails is applied to their extrusions as the proposedconnection to buildings within a city block. Overlapping lines can influencethe size of the extrusion, giving importance to trail alignment within a swarm.Discretization through post-processing simulations refines agent trails to createmore contextualized paths of circulation through a particular city block inaccordance with adjacent buildings. For this research in particular, the rectangularextrusions created at this scale are used as a mesh geometry that can bereintroduced for interaction at other scales of design. Design logics that arespecific to the block can create spatial hierarchy and differentiation through theimplementation of distinct parameters toward spatial complexities within a swarm(Fig. 4).
4.3. BUILDING SCALE
At the building scale, discrete swarm simulations have the ability to generatestructural and circulatory elements based on a predefined mesh geometry bycreating intensified refinement of the agent interactions with the mesh geometries.Structurally defined agents can operate within the boundaries of the mesh,interacting with the mesh vertices, while agents defined for circulatory use can

DISCRETE SWARM LOGICS 139
operate on the interior using the mesh as a bounding box. In order to generatefeasible structural systems, the discretization of the agent trails allows for the useof identical structural components such as columns and beams. The intersectionof these structural components at defined angles allows for similar joints to beimplemented as standardized details.
The generation of suitable human circulation can be designed to directly followthe agent movement. In this case, discretization can ensure suitable widths forcirculation paths, creating wider corridors where paths are most frequented byagents. If the circulation is to work together with a structural system, then a gridoffset from the structural grid can be defined for the circulation-generating agents.For vertical circulation, suitable angles for stairs or escalators can be implementedas parameters for agent movement. Floor to floor heights can be used for thevertical grid spacing so that the trail agglomerations create spaces of usable height.
Discretization at the building scale can help translate emergent swarms intosystems that have repetitive structural members and corresponding circulationelements based on rational, discretized principles using the same grid (Fig. 5).
Figure 5. Primary Structure - Secondary Structure.
4.4. DETAIL SCALE
Swarm discretization at the detail scale establishes possibilities for the creation ofskin, cladding, details, interior finish patterns, and secondary structural elements.Agent movement and interaction with a mesh geometry can be used in a mannersimilar to operations at the building scale in order to create a system alignmentbetween structure and skin that benefits the construction of repetitive architecturalcomponents. Discrete swarms at the detail scale can have a range of formationsand combinations through varying swarm logics.
For the generation of secondary structure, the swarm logics can likewise beused in a manner similar to those at the building scale. However, a significantdifference in the spacing between the different grid axes, or the use of differenttypes of grids, can create distinct variations. For a building façade the swarms cangenerate expressive geometric arrangements similar to those proposed by otherdesigners. However, the discretization allows for the use of identical extrusions,joints, and façade panels, so that no additional façade rationalization is necessary.Interior finishes, similar to the façade geometries, can be generated to only use alimited amount of components or panels.
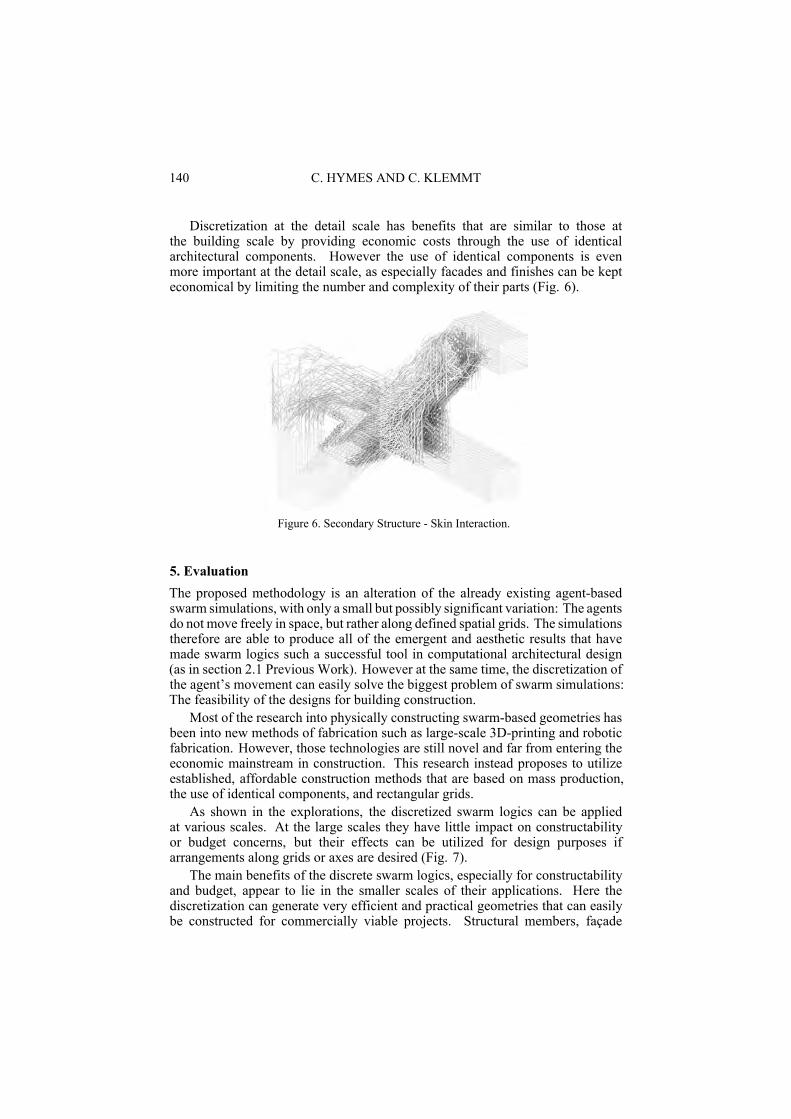
140 C. HYMES AND C. KLEMMT
Discretization at the detail scale has benefits that are similar to those atthe building scale by providing economic costs through the use of identicalarchitectural components. However the use of identical components is evenmore important at the detail scale, as especially facades and finishes can be kepteconomical by limiting the number and complexity of their parts (Fig. 6).
Figure 6. Secondary Structure - Skin Interaction.
5. EvaluationThe proposed methodology is an alteration of the already existing agent-basedswarm simulations, with only a small but possibly significant variation: The agentsdo not move freely in space, but rather along defined spatial grids. The simulationstherefore are able to produce all of the emergent and aesthetic results that havemade swarm logics such a successful tool in computational architectural design(as in section 2.1 Previous Work). However at the same time, the discretization ofthe agent’s movement can easily solve the biggest problem of swarm simulations:The feasibility of the designs for building construction.
Most of the research into physically constructing swarm-based geometries hasbeen into new methods of fabrication such as large-scale 3D-printing and roboticfabrication. However, those technologies are still novel and far from entering theeconomic mainstream in construction. This research instead proposes to utilizeestablished, affordable construction methods that are based on mass production,the use of identical components, and rectangular grids.
As shown in the explorations, the discretized swarm logics can be appliedat various scales. At the large scales they have little impact on constructabilityor budget concerns, but their effects can be utilized for design purposes ifarrangements along grids or axes are desired (Fig. 7).
The main benefits of the discrete swarm logics, especially for constructabilityand budget, appear to lie in the smaller scales of their applications. Here thediscretization can generate very efficient and practical geometries that can easilybe constructed for commercially viable projects. Structural members, façade

DISCRETE SWARM LOGICS 141
extrusions, joints and panels can all be based on identical components that aresimple to manufacture and assemble. This can range from the scales of structuralgrids to those of façade elements and interior finishes.
Figure 7. Large-scale massing, Circulation, Structure, Façade.
Swarm behaviors in general have become widely used in architectural designbecause of their bottom up approach that can react to various influences such as siteor programmatic requirements, and that can generate highly complex geometrieswith emergent behaviors. The swarm simulations, if set up well, can becomea functional design tool while at the same time creating a distinct free-formaesthetic. The discretization still allows for all of the emergent behaviors tomanifest, however the aesthetics will become less free-form. The scale of the griddimensions in relation to the overall scale of the design is a crucial factor for this.The choice of a very fine grid will make the geometric outcomes appear almostfree-form, but at a higher effort for construction, while the choice of a large gridwill significantly affect the appearance towards a more rectangular look (Figs. 8,9).
Figure 8. Structure - Façade Interaction.
6. ConclusionsThe proposed method of discretizing swarm simulations into grids appears to bevery promising in order to bring agent-based design into the real world. While theaesthetics are different from those of free-form swarm simulations, the generatedgeometries still have their emergent properties, but are also more feasible for

142 C. HYMES AND C. KLEMMT
construction due to their use of identical architectural components. Future workshould include a cost evaluation of constructing a building or a facade as afree-form vs. a voxelized geometry. At a smaller scale it would be possible tobuild an installation in both its free-form and voxelized geometries to evaluate thecost as well as the construction logistics. In order tomake this an achievable reality,further research needs to be done in order to define manufacturing and assemblymethods at a variety of scales.
Figure 9. Discrete Swarm.
ReferencesAndrasek, A.: 2012, Open Synthesis//Toward a Resilient Fabric of Architecture, Log, 25, 45-54.Neira, J.: 2016, “SpaceStream uses generative computational strategies applied to welding”
. Available from <http://www.designboom.com/design/spacestream-project-rc6-ad-bartlett-school-architecture-02-15-2016/accessed16-02-2017> (accessed 16th February 2017).
Pantazis, E., Gerber, D.J. and Pantazis, J.: 2014, Material Swarm Articulations: The New ViewReciprocal Frame Canopy, Proceedings of ACADIA 2014, Los Angeles, 127-130.
Retsin, G.: 2016, Discrete Assembly and Digital Materials in Architecture, Proceedings ofeCAADe 2016, Oulu, 143-151.
Retsin, G. and JimenezGarcia, M.: 2016, Discrete ComputationalMethods for Robotic AdditiveManufacturing, Proceedings of ACADIA 2016, Ann Arbor, 332-341.
Retsin, G., Jimenez Garcia, M. and Soler, V.: 2017, Discrete Computation for AdditiveManufacturing, Proceedings of Fabricate 2017, Stuttgart, 178-183.
Reynolds, C.: 1987, Flocks, herds and schools: A distributed behavioral model, Proceedings ofSIGGRAPH 1987, 25-34.
Sanchez, J.: 2016, Combinatorial design: Non-parametric computational design strategies,Proceedings of ACADIA 2016, Ann Arbor, 1-13.
Snooks, R. 2013, Self-organised bodies, in P. Lorenzo-Eiroa and A. Sprecher (eds.),Architecture In Formation: On The Nature of Information in Digital Architecture,Routledge, London, 264-267.
Stuart-Smith, R. 2014, Qualitative Affects of Building Life Cycle: The Formationof Architectural Matter, in S.T. Rassia and P.M. Pardalos (eds.), Cities for SmartEnvironmental and Energy Futures, Springer, 101-113.
Sugihara, S.: 2014, A(g)ntense: Installation of swarm formation and agent basedself-optimization of tensile and compression structure, Proceedings of ACADIA 2014, LosAngeles, 51-54.

QUASICRYSTAL STRUCTURE INSPIRED SPATIALTESSELLATION IN GENERATIVE DESIGN
PENGYU ZHANG1 and WEIGUO XU21,2School of Architecture, Tsinghua [email protected] [email protected]
Abstract. Quasicrystal structure is a kind of quasiperiodic spatialtessellation formed by several kinds of tiles. Compared with periodicor other aperiodic tiling, it shows superiorities but also drawbacks whenused for generative design. It can generate attractive and irregular novelforms with controllable cost for construction, but its strict rules restrictits variety. To cover the disadvantages of these tessellations withoutdiminishing their advantages, a new kind of spatial tessellation, namedas Periodic-to-Aperiodic (P-A) Tiling is proposed in this paper with aseries of installation design cases, inspired by the primary principles andarchitectural applications of quasicrystal structure.
Keywords. Spatial tessellation; Quasicrystal structure; GenerativeDesign.
1. IntroductionNatural forms are prototypes for many generative designs, creating various novelforms. Within the diverse natural forms, biological forms are used as prototypesmore than other natural existences. Unlike biological forms with the ability toact and evolve for adaptation, inorganic substances, such as stones and crystals,hold a variety of valid structures or high density to resist the various externalpressure or infringement. Thus, they also have special properties to be used asprototypes in generative design, such as the quasicrystal structure. In this paper, anew tessellation inspired by the quasicrystal structure is introduced detailly.
1.1. QUASICRYSTAL STRUCTURE AND PREVIOUS CASES
Quasicrystal discovered by Shechtman is formed by a quasiperiodic spatialtessellation in microstructure. Shechtman first observed the tenfold electrondiffraction patterns of quasicrystal in 1982, implying the existence of a new kind ofthree-dimensional tessellation in nature (Shechtman and Blech 1985). It is orderedbut not periodic. As an analogy, it is neither periodic like crystals nor unorderedlike stones. It appears to be a transition from stones to crystals, from unordered toordered, and from aperiodic to periodic. The two main types of quasicrystal implyits characteristics as a transition: one is periodic in one axis and quasiperiodic inplanes normal to it; the other is aperiodic in all directions (Yamamoto 2008). It isinorganic but adaptable and responsive to the surroundings with several states like
T. Fukuda, W. Huang, P. Janssen, K. Crolla, S. Alhadidi (eds.), Learning, Adapting and Prototyping,Proceedings of the 23rd International Conference of the Association for Computer-Aided ArchitecturalDesign Research in Asia (CAADRIA) 2018, Volume 1, 143-152. © 2018 and published by the Associationfor Computer-Aided Architectural Design Research in Asia (CAADRIA) in Hong Kong.

144 P. ZHANG AND W. XU
the organisms. And this similarity indicates its potential to be used as prototypein generative design, in a similar way of the organisms.
Before the discovery of quasicrystal in nature, in mathematics, one similar 2Dpattern, specifically Penrose Tiling (Figure 1), is a kind of quasiperiodic tilingand introduced by Roger Penrose in 1974 (Penrose 1974). It is different fromperiodic tilings which can form a new copy by translation over a fixed distance in agiven direction (Grünbaum and Shephard 1987); with symmetrical axes, it is moreregular than common kinds of aperiodic tilings, such as Voronoi. Furthermore, DeBruijn introduced the methods to construct Penrose Tiling in 1981 and viewed itas 2D slices of five-dimensional hyper-cubic structures (De Bruijin 1981). Thisindicates the potential relationship between the 2D tiling and 3D structures.
Figure 1. Penrose Tiling, a kind of quasiperiodic pattern with two kinds of tiles (Penrose 1974,https://en.wikipedia.org/wiki/File:Penrose_Tiling_(Rhombi).svg;
https://en.wikipedia.org/wiki/File:Penrose_rhombs_matching_rules.svg).
Quasicrystal Structure was used as the prototype for building skin generation inthe design of Battersea Power Station Redevelopment by Cecil Balmond, makinga unique and structurally valid form (Balmond and Yoshida 2006; Figure 2, left);and our studio also conducted a structural design based on its performance (Figure2, right). Furthermore, its form with the unique and simple formal rules was fullyexplored by our studio in an architectural design case of Port Terminal Design(Figure 3). In this case, based on the spatial structure of Al-Mn Quasicrystal, thearchitectural form was generated from an icosahedron (any polyhedron havingtwenty plane faces) with octahedrons (any polyhedron having eight plane faces).

QUASICRYSTAL STRUCTURE INSPIRED SPATIAL TESSELLATIONIN GENERATIVE DESIGN
145
Figure 2. Two Previous Design Cases (The left picture is credited to a+u Cecil Balmond).
Figure 3. Form Generation Diagram and Functional Layouts for Port Terminal Design.
1.2. ADVANTAGES AND DISADVANTAGES
The previous cases show the advantages and disadvantages of quasicrystal used asprototypes.
The quasicrystal structure also has some superiorities when compared withperiodic and aperiodic tiling. Periodic tiling, such as crystals, follows strictmathematical rules to form spatial tessellation by one or several kinds of tiles(Mozes 1997). Comparing it, the quasicrystal structure has more variabilityand interesting. Every part of the quasicrystal structure is similar but different,attracting the viewers to seek its principles. Aperiodic tiling, such as Voronoi,

146 P. ZHANG AND W. XU
is a way to generate spatial tessellations composed of diverse tile shapes bycomputational geometry (Aurenhammer 1991). In comparison with it, thequasicrystal structure has fewer types of tile shapes cutting down the cost directly.And the cost is almost the most significant aspect in most cases nowadays.
Nevertheless, quasicrystal structure also has a shortage. It has just a few typesdue to its strict rules. This means that its application in architectural design islimited to these few types.
Thus, under its inspiration, a new spatial tessellation named “P-A Tiling(Periodic-to-Aperiodic Tiling)”, with its advantages is proposed with theapproaches and cases in this paper, to account for its disadvantages in architecturaldesign.
2. Approach and StagesThe approach of this research is similar to the way to solve technical problemsby searching for biological analogies (top-down) (Knippers and Speck 2012). Theproposed tessellation is evaluated and promoted as a new one to cover the shortagesof the previous prototypes. Considering the advantages and disadvantages ofquasicrystal structure and other tessellations, it comes to an improvement ofquasicrystal structure. A new tiling is proposed to account for the disadvantages,generating additional various and adaptable forms with fewer kinds of tiles (Figure4). Although the quasicrystal structure is of a few types, a variety of forms can begenerated by P-A Tiling.
Figure 4. Approach Diagram.
The method for P-A Tiling has four main stages: Basic Geometry, BasicForm Generation, Spatial Tessellation, and Adjustment (Figure 5). Python forGrasshopper is used for programming.
At the first stage, basic geometries are selected with two parts. One is the

QUASICRYSTAL STRUCTURE INSPIRED SPATIAL TESSELLATIONIN GENERATIVE DESIGN
147
repeating parts, composed of one or two kinds of shapes, and make up the basicform and the regular part of the final form. The other part is composed of periodictiling (PT) that can be a cluster of cubes or other polyhedrons.
Second, the basic form (BF) are generated by duplicating and connecting theregular shapes in stage one without any valid intersections. The designers canadjust and optimize BF by hand or by setting rules in programs only if no validintersection happens.
The main task for the third stage is to fill the gaps in BF. Wrap BF in PT, andthen remove or reshape some shapes of PT, which are inside of or intersect withBF, to make all the shapes in PT connected with BF face to face without extraintersections.
At the last stage, the main task is to optimize the whole shape of the form.At the beginning, remove the outer shapes of PT in order to unveil the wrappedBF. Then reshape the remaining part of PT to fit the surroundings, optimize theentity form, and serve structural purposes. Mostly, merging some PT shapes caneffectively reduce the quantity of irregular shapes. Afterwards, inspect the wholeshape and fill some gaps by program if needed. In the end, a spatial tessellation isobtained.
Figure 5. Diagram for Form Generating.

148 P. ZHANG AND W. XU
3. ApplicationsThis method is used for the generation of the third to fifth version of the interactiveinstallations named as Swarm Nest. Swarm Nest is a series of projects conductedby our studio and exploring the forms that indicate swarm behaviours in the nature.In these cases, the process of form generation is similar while the fabrications arequite different.
3.1. GENERATION
As for the generation, dodecahedrons and tetrahedrons are used as the main shape,and it was generated by the following steps as it is shown in Figure 6:
To start, the dodecahedron (any polyhedron having twelve plane faces) is takenas the repeating shape of the basic geometry, and periodic tiling (PT) formed bytwo kinds of tetrahedrons (any polyhedron having four plane faces) serves as theirregular part. The polyhedrons in PT are smaller than the dodecahedrons to makeit easier to form the spatial tessellation.
Generated by the program, a basic form (BF) composed of dodecahedrons iscreated and adjusted. By comparing the two connections, “vertex to vertex” canbetter fit in the tessellation with flexible angles and large gaps.
Then, the dodecahedrons are wrapped in the periodic tiling of tetrahedrons andoctahedrons. To form a spatial tessellation, the PT tetrahedrons that are fully insidethe dodecahedrons of BF are removed. For the tetrahedrons that have intersectionswith dodecahedrons, the vertices inside the dodecahedrons aremoved to the closestvertex in BF. In this way, the intersections can be diminished, and the gaps betweenthe shapes can be filled by adding tetrahedrons or reshaping the neighbouringtetrahedrons. Moreover, the shapes of tetrahedrons are approximately aligned tothe regular tetrahedron by moving some of their vertices. Afterwards, a spatialtessellation composed of tetrahedrons and dodecahedrons is almost created.
Finally, some outer tetrahedrons are randomly removed to expose thewrapped dodecahedrons, while some inner shapes are removed to form cavities.Furthermore, the outer shapes are reshaped by dragging their vertices to modifythe whole form into a better appearance. By merging all the shapes into an entityand calculating its outer surface, the gaps inside will be found and can be filled bytetrahedrons if gaps still exist. Then, some tetrahedrons merge into octahedronsor hexahedrons (any polyhedron having six plane faces) to reduce the quantity ofall the polyhedrons in the final form. After all, the final form is obtained.

QUASICRYSTAL STRUCTURE INSPIRED SPATIAL TESSELLATIONIN GENERATIVE DESIGN
149
Figure 6. Diagram for Swarm Nest by P-A Tiling Method.
3.2. FABRICATION
There are three different ways of fabrication based on different materials andstructures.
The first one is made up of transparent acrylic sheets and hinges. To make theinstallation, the whole form is deconstructed into numbered faces, and these facesare made of acrylic by laser cutting. A series of numbered circular acrylic sheetsare used for the connection, and the incisions of the sheets fix the angles betweenfaces. The acrylic hinges are also used for the connection. Five students finishedthis 1.8-meter-long model in 15 days (Figure 7).
Figure 7. Details of Swarm Nest 3.

150 P. ZHANG AND W. XU
The second one is made up of white acrylic and 3D printed joints. Similar to thefirst one, the whole model is deconstructed into numbered faces that are made ofwhite acrylic. The joints are carefully designed and tested with different shapes tomake a perfect a form. The joints are also numbered. And the connection withoutglue or screw is much easier and faster to fabricate than the former one. The wholeform is assembled by one person in less than 5 days (Figure 8).
Figure 8. Details of Swarm Nest 4.
The third one is composed of Aluminium sheets. Different from the formercases, each polyhedron of the whole form is unrolled into a surface with extrashapes on it for connections. And then, fold these Aluminium surfaces into acertain shape and connected them together. Because the Aluminium is light andthin, the whole shape is much lighter and bigger. The whole process of assemblingtakes 10 students for about 4 days (Figure 9).
Figure 9. Details of Swarm Nest 5.
4. AdvantagesP-A Tiling shows its advantages based on the Swarm Nest cases.

QUASICRYSTAL STRUCTURE INSPIRED SPATIAL TESSELLATIONIN GENERATIVE DESIGN
151
First, the principles of the tessellation make it easier to generate various andadaptable forms, which inspiring the architectural design and making it suitablefor much more real sites. A variety of forms can be generated by changingthe basic geometries of the kinds of polyhedrons or their positional relationships.The changeable final form makes it adaptive to different surroundings by addinginterferences.
Second, the kinds of components in the final form can be adjusted to reduce theconstruction cost or enrich its morphological diversity. Themore that duplicates ofthe repeating parts are generated at the first stage, the fewer kinds of polyhedronswill be included in the final form, making it easier to construct; on the contrary,when the kinds of polyhedrons increase, it shows more variability.
Finally, the designer can change the form directly and conveniently with thehelp of computer programs, making it easier for the designers to control the finalform without too much randomness. On the one hand, because the principle of thistessellation is unique from others with strict mathematical rules, the designer canset rules for its generation. For example, the designer can select different kinds ofpolyhedrons as basic geometries and adjust their positional relationship, resultingin various final forms. On the other hand, different from the previous generativedesign, the final form is generated not only by programs but also by the designer’shand-made modification assisted by programs. For example, at the fourth stageof the Swarm Nest, the outer polyhedrons are reshaped by dragging the verticeswith the help of programs. In this way, the process is easier than remodellingpolyhedrons one by one and is done more directly than changing the parametersin the programs to optimize the polyhedrons.
However, some problems still exist and require further research. Morepolyhedrons need to be used in this tessellation to see if some polyhedrons are notsuitable for this method to form a spatial tessellation. The program for aligningirregular shapes still needs to be optimized to meet different requirements, suchas the least number or kinds of irregular shapes. Although the connections ofrepeating shapes were considered in this process, more work is required for a newmethod to organize the repeating shapes.
5. Conclusion and Future WorkAs a new spatial tessellation inspired by quasicrystal structure, P-A Tiling caninherit advantages of the quasicrystal structure and minimize its drawbacks,making it more potential to be used in architectural design. On the one hand,P-A Tiling inherits its transitional features. The form based on P-A Tiling isgenerated by transferring the periodic tiling into aperiodic tiling. Part of the formis formed by repeating one or several kinds of tile shapes like periodic tilings, andothers are composed of a series of different irregular shapes similar to aperiodictilings. Thus, the new tessellation can also generate variable forms with fewerkinds of shapes as does a quasicrystal structure, cutting down the construction costsignificantly. On the other hand, more kinds of various and adaptable forms can beobtained by the new spatial tessellation than with a quasicrystal structure. Morepolyhedrons can be used for P-A Tiling, resulting in more various novel forms

152 P. ZHANG AND W. XU
and inspiring the architectural design indeed. Additionally, the form is easy to bemodified by designers or programs, making it adaptable to different surroundingsor requirements.
Nevertheless, some work still needs to be done in the future, such as exploringmore types of polyhedrons and connections for the tessellation to promote theefficiency of prototype selection, and optimizing the structural capability withmechanical analyses. Furthermore, the forms need to perform a certain functionto explore its application in architectural design.
This research is supported by National Natural Science Fund of China(NO.51538006).
ReferencesAurenhammer, F.: 1991, Voronoi diagrams—a survey of a fundamental geometric data
structure, ACM Computing Surveys, 23(3), 345-405.Balmond, C. and Yoshida, N.: 2006, a+u Cecil Balmond, The Japan Architect Co., Ltd, Tokyo.De Bruijn, N.: 1981, Algebraic theory of Penrose’s non-periodic tilings of the plane 1,
Indagationes Mathematicae 1980, North-Holland, 39-52.Grünbaum, B. and Shephard, G.C.: 1987, Tilings and Patterns, W. H. Freeman, New York.Knippers, J. and Speck, T.: 2012, Design and construction principles in nature and architecture,
Bioinspiration & biomimetics, 7(1), 015002.Mozes, S.: 1997, Aperiodic tilings, Inventiones mathematicae, 128, 603-611.Penrose, R.: 1974, The role of aesthetics in pure and applied mathematical research, Bulletin of
the Institute of Mathematics and its Applications, 10(7/8), 266-271.Shechtman, D. and Blech, I.A.: 1985, The Microstructure of Rapidly Solidified Al6Mn,
Metallurgical Transactions A, 16(6), 1005-1012.Yamamoto, A.: 2008, Software package for structure analysis of quasicrystals, Science and
Technology of Advanced Materials, 9(1), 013001.

CONTROL OF MORPHOLOGICAL VARIATION THROUGHPOPULATION BASED FITNESS CRITERIA
MOHAMMED MAKKI1 and MILAD SHOWKATBAKHSH21,2Architectural Association1,2{mohammed.makki|showkatbakhsh}@aaschool.ac.uk
Abstract. A primary challenge for the application of an evolutionaryprocess as a design tool is the ability to maintain variation amongstdesign solutions while simultaneously increasing in fitness. The ‘goldenrule’ of balancing exploration versus exploitation of solutions withinthe population becomes more critical when the solution set is requiredto present a controlled degree of phenotypic variation but ensure thatconvergence of the solution set continues towards increased levels offitness. The experiments presented within this paper address the controlof variation throughout the simulation by means of incorporating apopulation-based fitness criterion that is utilised as a fitness objectiveand is calculated dynamically throughout the algorithmic run in bothsingle and multi objective design problems.
Keywords. Architecture; Computation; Evolution; Urban;Variation.
1. Introduction:The computational application of natural evolutionary processes as aproblem-solving tool has been well established since the mid-20th century.However, its application within architecture and design has only gained groundin recent years, with an increasing number of academics and professionals in thefield electing to utilize evolutionary computation to address problems comprisedfrom multiple conflicting objectives with no clear optimal solution.
Recent advances in computer science and its consequent constructive influenceon the architectural discourse has led to the development of multiple algorithmicprocesseswithin 3d design software capable of simulating the evolutionary processin nature within an efficient timescale (most prominently the grasshopper add-onsGalapagos and Octopus). Many of the developed processes of generating apopulation of candidate solutions to a design problem through an evolutionarybased stochastic search process are often driven through the application of bothenvironmental and architectural parameters, allowing for conflicting objectives tobe simultaneously, independently and objectively optimized for; an approach thatis essential in design problems with a final product that must address the demandof a multitude of individuals with various requirements.
However, one of the main challenges encountered through the application ofan evolutionary process as a design tool is the ability for the simulation to maintain
T. Fukuda, W. Huang, P. Janssen, K. Crolla, S. Alhadidi (eds.), Learning, Adapting and Prototyping,Proceedings of the 23rd International Conference of the Association for Computer-Aided ArchitecturalDesign Research in Asia (CAADRIA) 2018, Volume 1, 153-162. © 2018 and published by the Associationfor Computer-Aided Architectural Design Research in Asia (CAADRIA) in Hong Kong.

154 M. MAKKI AND M. SHOWKATBAKHSH
variation amongst design solutions in the population while simultaneouslyincreasing in fitness. This is most commonly known as the ‘golden rule’ ofbalancing exploration versus exploitation over time (Luke, 2014); the difficulty ofachieving this balance in the simulation is due to the tendency of either variationor optimization being favoured over the other as the simulation progresses. Insuch cases, the generated population of candidate solutions has either convergedvery early in the simulation or has continued to maintain high levels of variationto which an optimal set could not be discerned; thus, providing the user witha solution set that has not evolved efficiently to the objectives outlined in theproblem at hand. As such, control over directing the degree of variation across thegeneration as well as among the population becomes critical for the user, this ismore so within design as the morphological attributes of the resulting phenotypesare central to a successful algorithmic run.
2. Variation Through Evolutionary ComputationDavid Goldberg, one of the seminal figures in the field of evolutionarycomputation, and in specific, multi objective evolutionary algorithms, put forwardthe concept of integrating Pareto optimality and dominance as a selection strategywithin an evolutionary algorithm, allowing for the algorithm to incrementallyincrease the fitness of the solutions for each fitness criteria independently yetmaintain an adequate degree of variation among the population to avoid earlyconvergence towards a local optima (Goldberg, 1989). Inspired by Goldberg’sresearch, many of the leading evolutionary algorithms of the 1990’s incorporatedhis selection strategies, most famous were the Multi-Objective Genetic Algorithm(MOGA) (Fonseca and Fleming, 1993), Niched-Pareto Genetic Algorithm (Hornet al., 1994) and the Non-Dominated Sorting Genetic Algorithm (NSGA) (Srinivasand Deb, 1994).
Goldberg’s selection strategies (and incorporation thereof) advanced the fieldsignificantly; more importantly, it led to one of the field’s major advancementsin the 21st century by means of introducing the concept of Elitism, a strategyprimarily credited to Eckart Zitzler through his algorithm titled Strength-ParetoEvolutionary Algorithm (SPEA) (Zitzler, 1999) (the SPEA was developed into asecond more robust algorithm titled SPEA-2 (Zitzler et al., 2001)). The objectiveof utilizing an elitism strategy (or what is sometimes called an Archive) withinevolutionary algorithms was to allow non-dominated solutions to compete withindividuals that lie outside of their respective generations. Zitzler’s concernwas that although a non-dominated solution may have earned its non-dominatedstatus within its own generation, it may also be non-dominated across multiplegenerations, however by not allowing it to ‘survive’ in order to compete withfuture generations, the solver may lose potentially highly fit individuals, thereforethe elite were the solutions that were preserved across multiple generationsand only replaced by fitter non-dominated solutions (Zitzler, 1999). Zitzler’sSPEA inspired other evolutionary algorithms to incorporate the elitism strategy,most notably Knowles and Conre’s Pareto-Archived Evolution Strategy (PAES)(Knowles and Corne, 2000) and Kalyanmoy Deb’s second attempt at his NSGAalgorithm titled NSGA II (Deb et al., 2000); all with the intent to better control

CONTROL OF MORPHOLOGICAL VARIATION THROUGHPOPULATION BASED FITNESS CRITERIA
155
variation among the population while simultaneously increasing its fitness levels,thus gaining more control over the balance between exploration and exploitationof the problem’s fitness landscape.
3. Experiment Setup3.1. CONTROLLING VARIATION AMONG THE POPULATION:
As mentioned, one of the primary challenges of evolutionary algorithms isestablishing an ideal balance between the exploration and exploitation of fitnessvalues across the population. However, achieving this balance becomes highlychallenging as the problem - and the fitness landscape associated with the problem- increases in complexity. A complex fitness landscape decreases the chances ofthe simulation from finding a global optimum; however more importantly, it alsoincreases dramatically the risk of the simulation generating a solution set that isrestricted to a local optimum (Figure 1). As such, the experiments presented withinthis paper examine the possibility of utilising a population-based fitness criterionas a secondary unit of control that directs the balance between exploration andexploitation of individuals throughout the simulation.
Figure 1. Examples of different fitness landscapes recreated from (Luke,2014), each carrying adegree of complexity that challenges the simulation from finding a global optima.
3.2. POPULATION BASED FITNESS CRITERIA
To control variation amongst the population, the differences in fitness valuesbetween all individuals within a single generation needs to be calculated. Thechallenge arises by the fact that this calculation must occur iteratively at the endof each generation, with the resulting value to be attributed to each solution in thegeneration and utilised as a fitness criterion to evolve subsequent generations. Assuch, a multi objective approach is needed due to the population-based fitnesscriterion being utilised as an additional fitness objective. Initial attempts toincorporate the population-based fitness criteria were carried out in ‘Octopus’, agrasshopper plugin that runs a multi objective evolutionary algorithm (the SPEA-2algorithm) developed by Robert Vierlinger (Vierlinger 2013); however, as thealgorithm’s loop process within ‘Octopus’ could not be interrupted, the software

156 M. MAKKI AND M. SHOWKATBAKHSH
‘Octopus.explicit’ - a variation of ‘Octopus’ developed by the same author -was utilized as an alternative, which allows the user to interrupt the algorithm’sworkflow and make adjustments as required (Figure 2).
Figure 2. a)The algorithmic loop of the Octopus.Explicit software. b) The proposed loopwhich incorporates the population-based fitness criterion within the algorithm. .
When calculating the population-based fitness criterion, the value necessitatedtwo critical properties: a) The value must be derived from all the individualswithin a generation, and b) it had to be a value that would be unique to eachsolution. Although the standard deviation value of each generation reflects thedegree of variation between solutions, the value calculated is a single value, onethat was not unique to each individual. As such, to bypass this issue, the deviationof each individual’s fitness value from the population average was calculatedand attributed to each individual uniquely. Although this indicates the level ofvariance within the population, it also allows for two solutions with differentfitness values that are equidistant from either side of the population averageto have the same population-based fitness value, thus driving the algorithm tominimise (or maximise) variance levels by reducing (or increasing) each solution’sdistance to the average in both its positive and negative. An increase in thispopulation-based fitness criterion throughout the simulation translates to greaterdeviations between each individual and the generation average, meaning greatervariation among solutions. In contrast, a decrease in this value conveys lowerdeviation of individuals to the average thus translating to lower diversity amongsolutions. The objective is to increase/decrease the population-based fitnesscriterionwhile simultaneously optimizing for the fitness objective used to calculateit.

CONTROL OF MORPHOLOGICAL VARIATION THROUGHPOPULATION BASED FITNESS CRITERIA
157
4. Results:4.1. COMPUTATIONAL SETUP
The computational setup for the design experiments presented have beendeveloped according to the complexity of the problem being investigated. Theultimate goal of the presented experiments is the analysis and examination of theeffects of incorporating a population-based fitness criterion on the morphologicalvariation within a population. Therefore, the experiments were designed to ensurea full understanding of their results. Experiment 1 investigates the morphologicalvariation of phenotypes within the context of an urban tissue; therefore, theselected primitive was based on the block typology of the city of Fez in Morocco,a typology that is highly integrated to its environmental and cultural context.However, within the scope of the presented experiment, the typologywasmodifiedto allow for elevated connections between multi-level spaces throughout the urbansuperblock (this is part of current body of research by the authors that investigatesvariation of the Fez superblock as an urban typology) (Figure 3).
Figure 3. Fes El Bali is distinctive in the preservation of its ancient urban configuration. Theexperiments presented modify the block to allow for upper-level connections.
In contrast, and in response to the complexity of the problem, the secondexperiment utilised a highly simplified phenotype as the base primitive (explainedin the following sections), this was in response to the complex fitness landscapesthat accompany multi objective problems. However, both experiments shared thesame algorithmic parameters; a population size of 20 individuals per generation,a mutation rate of 50%, mutation probability of 20%, a crossover rate of 80% andan elitism size of 50%. Finally, the simulation time for both experiments was setto 50 generations (for a detailed description of the solver parameters listed above,please see (Makki et. al, 2015)).
4.2. EXPERIMENT 1 - VARIATION FOR A SINGLE OBJECTIVE
Within the first experiment, the population-based fitness criterion is applied to asingle objective problem while experiment 2 (presented in the following section)

158 M. MAKKI AND M. SHOWKATBAKHSH
applies it to a multiple objective problem. The primitive phenotype for the firstexperiment was the urban superblock discussed previously. The algorithm was setup to maximise the floor areas and connections of all upper level spaces.
Both experiments 1 and 2 were carried out as a two-step process; firstly,the simulation ran without the population-based fitness criterion, in essence thealgorithm was simply attempting to increase the area of upper level spaces withoutany restrictions; as expected, this resulted in a solution set that converged quiteeasily to phenotypes that had maximized upper level areas (Figure 4). Althoughunsurprising, this was necessary for a comparative analysis to the second step ofthis two-step process. Step 2 ran the exact same experiment as step 1, with theonly difference being that the population-based fitness criterion was introduced,and the simulation was required to increase its value; in an attempt to reduceconvergence and maintain a degree of variation among the population. Thecomparisons between the normal distribution curves and their respective standarddeviation values as well as the generated phenotypic morphologies present verypromising results (Figure 5).
Figure 4. Evolution of upper level spaces when attempting to only optimize for increasing theirareas. The result is a clear convergence towards an optimal solution.
The utilisation of the population-based fitness criterion as a fitness objectiveallowed the simulation to maintain a high degree of variation among solutions;more importantly however, the fitness levels of the generations throughoutthe simulation continued to incrementally increase. The results present that apopulation-based fitness criterion, that is derived from the values of an objectiveof which the algorithm is optimising for, has been able to maintain an adequatelevel of variation without limiting optimisation. This is examined further in thefollowing section.

CONTROL OF MORPHOLOGICAL VARIATION THROUGHPOPULATION BASED FITNESS CRITERIA
159
Figure 5. Evolution of upper level spaces while attempting to increase in the variation of thepopulation by utilising the population-based fitness criterion.
4.3. EXPERIMENT 2 - VARIATION FOR MULTIPLE OBJECTIVES
Applying the population-based fitness criterion on a problem with multipleobjectives becomes significantly more challenging. The difficulty does not arisefrom its application, but from its analysis. Multiple objectives (and their effectson the simulation) require a highly simplistic problem in order to comprehensivelyexamine and assess the effects of incorporating the population-based fitnesscriterion within the algorithm. This is due to the fact that a complexproblem increases the complexity of the fitness landscape dramatically, addingmultiple additional variables that may affect the balance between explorationand exploitation of solutions throughout the simulation; thus the analysis of theeffects of the population-based fitness criterion becomes more difficult to discernas multiple other factors are involved in the variation and/or convergence of thepopulation. As such, rather than relying on the primitive utilized in experiment1 (the urban superblock); experiment 2 employed a simplified primitive derivedfrom a 4x4 grid of blocks. The objectives defined for the simulation werethe following; the algorithm will minimise the volume of the solutions whilesimultaneously maximise their surface envelope area - 2 criteria that are in clearconflict.
As with experiment 1, experiment 2 was carried out as a two-step process.Step 1 ran the simulation without the incorporation of the population-based fitnesscriterion; the result was typical to a multi-objective problem with conflictingcriteria; the Pareto front distribution was concave (please note, the directionsof the x and y-axes on the graph are reversed), implying that as the solution’sfitness value for one objective was optimized, this resulted in the decrease infitness of the second objective (Figure 6). This is also visible through the normaldistribution graphs for the two criteria, as they are inversely proportional to oneanother. However, what was unexpected (as well as unintentional) was that onecriterionwas favoured over the other, in this case, maximising the surface envelope

160 M. MAKKI AND M. SHOWKATBAKHSH
area was awarded more weight by the algorithm over minimising the total volume.In step 2 of the experiment, the population-based fitness criterion was derived
from the volume fitness objective value, therefore the algorithm setup attemptedto maximise surface envelope area, minimise total volume area and minimize thevariation of individuals with regards to their volume; by doing so, the ambitionwas to drive the experiment towards awarding greater weight in minimising thevolume of solutions in an attempt to counteract the dominance displayed bythe surface envelope area criterion that was exhibited in the first step of theexperiment. As with Experiment 1, the results are promising; through applyingthe population-based fitness criterion and minimizing its value, the simulationfavoured optimising the volume criterion over the surface area criterion (Figure7). This is evident when comparing the normal distribution graphs and standarddeviation factors of the populations between these two experiments, as well asthe distribution of solutions in the objective space and the resulting phenotypemorphologies.
Figure 6. Evolution of simplified phenotype towards minimizing volume and maximizingsurface envelope area.
Although promising, significant work needs to be carried out to furtherdevelop the applied strategy and gain more control over the degree by whichvariation and convergence is directed throughout the simulation, however thepreliminary results signify that the selected population-based fitness criterionis advantageous to controlling variation among the population within bothsingle objective evolutionary algorithms as well as multi objective evolutionaryalgorithms. More importantly, there is an opportunity to investigate the benefits ofactivating and deactivating this criterion dynamically throughout the algorithmicrun, thus serving as a regulator for when the simulation encounters high degreesof convergence or variation. This is currently being researched by the authors.

CONTROL OF MORPHOLOGICAL VARIATION THROUGHPOPULATION BASED FITNESS CRITERIA
161
Figure 7. Incorporating the population-based fitness criterion into the experiment; the criteriaattempted to reduce variation among solutions optimizing for minimizing the volume.
5. Conclusions:The utilisation of evolutionary algorithms as a problem-solving strategy hasbeen proven to be an advantageous approach for complex problems across arange of different disciplines as well as a multitude of scales. In design, thepotential of evolving a population of design solutions that vary in morphologicaldiversity is central for when the end user of the proposed design is not limitedto a single individual or group of individuals, rather a population of individualsthat all hold a stake in the final output. This is most prominent in designproblems at an urban scale, where variation takes precedence over repetition.The generic city that is comprised from an array of the same block (or a slightvariant of a block), taking into little account the geographic or environmentalcontext, has been implemented in different parts of the world throughout the20th century. However, with the rapidly changing climatic conditions, theexponentially growing global demographic and unprecedented migration of thepopulation from rural areas to urban settlements, the ‘generic cities’ of the pasthave been unable to adapt to these changes; thus, morphological variation ofblocks and superblocks within an urban tissue is paramount. As such, the degree ofvariation generatedwhen utilising evolutionary algorithms is essential for allowinggreater flexibility when responding to the fitness objectives driving the designexperiments. However, unlimited variation serves very little purpose, but whencoupled with optimization, the evolved solution set is a robust and powerfulalternative to a user preference-based approach.
Control over the degree of variation amongst solutions throughout theevolved population is critical (exploration vs. exploitation). By incorporating apopulation-based fitness criterion that is derived dynamically from the objectivevalues being optimised for within the algorithm, variation of solutions among the

162 M. MAKKI AND M. SHOWKATBAKHSH
population is directed by the levels of convergence and variation resulting fromthe algorithm itself. More importantly, there is an opportunity for the degreeof variation to be adjusted dynamically throughout the algorithmic run, servingas a control mechanism that is suppressed in its default state, and expressedonly when needed. Additionally, at its current state, solutions located on eitherside of the average are given the same population-based fitness value, whichdrives the algorithm to minimise (or maximise) the distance between the solutionson both sides of the average; however, there is an opportunity to drive thepopulation towards increased (or decreased) average levels by minimising (ormaximising) the distance between solutions on only one side of the average,thus allowing for added weight to be applied to solutions with greater (or lower)fitness values. In addition to its computational load from being minimal (therewere no significant differences in computation time when compared to MOEA’sthat did not incorporate the population-based fitness criterion), the practicality ofutilising a dynamic population-based fitness criterion becomes highly beneficialwhen attempting to develop an adaptable model that can be utilised across a rangeof different design problems.
ReferencesDeb, K., Agrawal, S., Pratap, A. andMeyarivan, T.: 2000, A Fast Elitist Non-Dominated Sorting
Genetic Algorithm for Multi-Objective Optimization: NSGA-II, International Conferenceon Parallel Problem Solving From Nature, Paris, France, 849-858.
Fonseca, C.M. and Fleming, P.J.: 1993, Genetic Algorithms for Multiobjective Optimization:Formulation, Discussion and Generalization., Proceedings of the Fifth InternationalConference on Genetic Algorithms, California, 416-423.
Goldberg, D.: 1989, Genetic Algorithms in Search, Optimization, and Machine Learning,Addison Wesley, Boston.
Horn, J., Nafpliotis, N. and Goldberg, D.E.: 1994, A Niched Pareto Genetic Algorithm forMultiobjective Optimization, Proceedings of IEEE Conference, 82-87.
Knowles, J.D. and Corne, D.W.: 2000, Approximating the Nondominated Front Using thePareto Archived Evolution Strategy, Evolutionary computation, 8(2), 149-172.
Luke, S.: 2013, Essentials of metaheuristics: a set of undergraduate lecture notes.Makki, M., Navarro, D. and Farzaneh, A.: 2015, The Evolutionary Adaptation of Urban Tissues
through Computational Analysis, Proceedings of eCAADe, Vienna, 563-571.Srinivas, N. and Deb, K.: 1994, Muiltiobjective Optimization Using Nondominated Sorting in
Genetic Algorithms, Evolutionary computation, 2(3), 221-248.Vierlinger, R.: 2013, Multi Objective Design Interface, Ph.D. Thesis, U. of Applied Arts.Zitzler, E., Laumanns, M. and Thiele, L.: 2001, SPEA2: Improving the Strength Pareto
Evolutionary Algorithm, ETH Research Collection, 1, 1-21.Zitzler, E. and Thiele, L.: 1999, Multiobjective Evolutionary Algorithms: A Comparative Case
Study and the Strength Pareto Approach, IEEE on Evolutionary Computation, 257-271.

EFFICIENCY VERSUS EFFECTIVENESS
A Study on Constraint Handling for Architectural Evolutionary Design
LIKAI WANG1, PATRICK JANSSEN2 and GUOHUA JI31,3School of Architecture and Urban Planning Nanjing [email protected] [email protected] of Design and Environment National University of [email protected]
Abstract. This paper investigates the impacts of constraint handlingon the evolutionary designs in terms of time efficiency and evolutionaryeffectiveness. To analyse this issue systematically, three generativemodels with different constraint handling strategies were constructed.The locality of the models and the associated positive and negativeimpacts on evolutionary designs were analysed.
Keywords. Constraint handling; locality; evolutionary design; timeefficiency; evolutionary effectiveness.
1. IntroductionIn the last decade, the use of evolutionary design has been gaining popularity asa strategy for architects to improve building performance. By defining generativemodels (GM) and evaluative models, evolutionary algorithms can be used toexplore complex design spaces and to discover creative design alternatives fordifferent objectives.
Along with the instrumental development of various evolutionary design tools,GMs have become an important area of research. Form-finding approacheshave been theoretically introduced by early pioneers such as Frazer (1995) andBentley and Kumar (1999). Following these pioneers, other researchers anddesigners have attempted to find ways to construct GMs with wide-ranging formaldiversity. Different modelling approaches have been experimentedwith, includingsurface and solid modelling approaches using NURBS and Boolean operations,and rule-based modelling approaches such as cellular automata and agent-basedmodelling.
When the evolutionary design is applied to real-world problems, it is oftendifficult to find viable solutions within the short time-frames and deadlines set bypractice. In such cases, the overall progress made by the search process in the shortterm is often much important than the ability to find the true optimal solutions inthe long term.
We describe the search process using two qualities: efficiency versuseffectiveness. We use the term efficiency to refer to how quickly the search is
T. Fukuda, W. Huang, P. Janssen, K. Crolla, S. Alhadidi (eds.), Learning, Adapting and Prototyping,Proceedings of the 23rd International Conference of the Association for Computer-Aided ArchitecturalDesign Research in Asia (CAADRIA) 2018, Volume 1, 163-172. © 2018 and published by the Associationfor Computer-Aided Architectural Design Research in Asia (CAADRIA) in Hong Kong.

164 L. WANG, P. JANSSEN AND G. JI
able to find reasonable solutions. We use the term effectiveness to refer to howconsistently the search is able to find improved solutions. Aside from the impactsof the evolutionary algorithm, the way that GMs are implemented also affects thesetwo qualities significantly.
As GMs become complex, these two qualities come into conflict with oneanother. For example, some search processes are efficient but not effective: inthe short term, they quickly discover some reasonable solutions but are then ratherpoor at improving on those solutions in the long term. Other search processes areeffective but not efficient: in the long term, they may discover excellent solutionsthrough consistent incremental steps, but they are too slow for use in the shortterm.
Efficiency and effectiveness are strongly affected by the way that GMs handleconstraints. In order to control design search spaces, GMs can incorporateconstraint handling techniques that exclude infeasible solutions by using explicitor implicit rules (Bentley and Kumar, 1999) in the genotype-phenotype mappingor phenotypic representing (Eiben and Smith 2004).
Embedding constraints in a GM can significantly reduce the size of the searchspace (Janssen et al. 2014). In general, a smaller search space will require fewercomputational resources, thereby improving the overall efficiency. However,such additional constraints also have a negative impact in that they weaken thelandscape locality of the search space. Landscape locality is a concept thatdescribes how well neighbourhood is preserved in the genotype-fitness mapping(Galván-López et al. 2011). If the neighbourhood is well preserved, then a smallchange to a genotype will result in a small change to the phenotype, which will,in turn, result in a small change in fitness. In general, the weakened locality willmake it harder for the search process to consistently improve performance, therebyreducing overall search process effectiveness.
Thus, when embedding constraints into a GM, a trade-off needs to beconsidered (Figure 1 left). One the one hand, additional constraints will compressthe search space and improve efficiency in the short term. On the other hand,additional constraints will weaken locality and reduce effectiveness in the longterm (Figure 1 right).
Figure 1. The relationship between efficiency and effectiveness of the search process.
When designers implement GMs, the issue of finding an appropriate balancebetween efficiency and effectiveness should be considered. In most cases,designers may prefer to use simple GMs with few constraints despite the factthat this will result in a larger search space. However, such large search space

EFFICIENCY VERSUS EFFECTIVENESS 165
will make the search process difficult to find reasonable solutions in the shortterm. This may undermine the practical value of using any such algorithms inpractice. The development of GMs that achieve amore balanced trade-off betweenefficiency and effectiveness is therefore desirable.
Taking this as the point of departure, this study mainly focuses on theimpact that different constraint handling techniques have on the balance betweenefficiency versus effectiveness. To investigate this issue systematically, threeGMs are constructed using different constraint handling techniques. Each GMis then analysed from the perspectives of the trade-off between efficiency andeffectiveness. Finally, the advantages and disadvantages of the constraint handlingtechniques are analysed.
2. Case StudyA high-rise 40 storey office design with an atrium and vertical gardens isintroduced as a case study. Such atriums and vertical gardens can be used toimproving environmental performance inmany regions, from tropical to temperateclimate zones (Wood and Salib, 2013). However, finding an appropriate trade-offbetween economic performance and environmental performance requires atriumsand vertical gardens to be carefully controlled and configured within the buildingvolume.
For the case study, a fixed structural frame is used, consisting of a rectangularplan office floor with an open atrium in the centre rising up through the wholebuilding, flanked by two structural cores on either side.
All three GMs use the same general mechanism for inserting vertical gardens:first dividing the tower volume into 3D cells, and then switching cells from solid tovoid, thereby creating complex patterns of interlocking indoor and outdoor spaces.For the subdivision of the tower into cells, floors are first grouped into ranges of2-to-5 floors, and each group is then divided in plan into 11 cells (see Figure 2).(Applying floors ranges is not only for reducing the number of parameters but alsofor the reason that single floor vertical gardens are impractical.)
Figure 2. The structural frame.
Based on this structural frame and generative mechanism, three GMsare implemented, called the naïve GM, the constrained GM and theconstrained-repaired GM, each inserting vertical gardens with progressively moreconstraints.

166 L. WANG, P. JANSSEN AND G. JI
2.1. THE NAIVE GM
The naïve GM has the fewest constraints. In this GM, the on-off condition of everycell is defined by a binary switch externally. Such simple control structures areeasy to construct and often applied in these types of optimisation problems.
The genotype defines the layout for ten floor groups. For each floor group, thegenotype contains two parameters. The first parameter is an integer between 2 and5, defining the number of floors in that group. The second parameter is a stringcontaining 11 binary switches, defining the solid and void pattern for the 11 cellsin that floor group.
The ten groups will each have variable floors, which may result in either toomany or too few floors. Some simple rules are therefore applied in order to ensurethat the correct number of floors is achieved. If the total floors are less than 40,then the topmost floor layout will be taken to fill the rest floors. If the total floorsare greater than 40, then extra floors will be culled.
The simple genotype-phenotype mapping ensures that the GM has goodlocality, which should result in an effective evolutionary process. However, thesimple mapping also results in a very large genotype and phenotype search spacewith large numbers of naïve solutions. Such a large genotype and phenotypespace can severely hinder the evolutionary process. As a result, constraints maybe needed in order to ensure that time taken to discover reasonable solutions isacceptable.
2.2. THE CONSTRAINED GM
In practice, certain basic architectural design rules for atriums and vertical gardenscan be defined, which can then be implemented as constraints in the GM. First,the number of vertical gardens should be limited to one vertical garden per floor.Second, the size of a vertical garden should be controlled and should not besignificantly larger than that of the indoor space. Third, vertical gardens shouldbe connected to the atrium to facilitate natural ventilation.
For this GM, the genotype still defines the layout for ten floor groups.However, in order to constrain the GM to the above rules, certain modificationswere introduced into the control structure. For each floor group, the genotype nowcontains three parameters. The first parameter is the same as the naïve GM, anddefined the number of floors in that group.
The second and third parameters replace the binary string. Instead of simplebinary switches, these parameters are used to create voids through an explicitrule-based approach. Since there are only two cells directly connecting the atrium,and vertical garden must include one of these two cells. The second parameteris either 0, 1, or 2. If the value is 0, then it indicates that there will be no void,in which case the third parameter can be ignored. If the value is 1 or 2, then itindicates which one of the two cells adjacent to the atrium will be included in thevertical garden. Finally, the third parameter is an integer that selects a void patternfrom a predefined set of patterns. To restrict the size of the vertical garden, thenumber of cells in each void pattern is limited to a maximum of 5, which resultsin a total of 14 unique patterns (Figure 3).

EFFICIENCY VERSUS EFFECTIVENESS 167
Figure 3. Different floor layouts from one initial position.
The constrained rules result in the possibility of there being neutral mutationsthat have no effect on the phenotype. In some circumstances, the GM is indifferentto the value of the third parameter if the second one defines that no vertical gardensare generated. Although this will significantly degrade locality, the constrainedrules are able to significantly reduce the size of the search space and also ensurethat most of the phenotypes meet basic architectural design rules.
The independence between floors layouts, however, can create certain types ofvoids that may be problematic. Two key types of problematic voids are identified:oversized voids in cases where two voids meet above one another and becomemerged, or cross-diagonal voids in cases where two voids meet at a point on thediagonal. Such voids are hard to avoid within the generated designs changingdynamically.
2.3. THE CONSTRAINED-REPAIRED GM
The genotype for the constrained-repaired GM uses the same control structureas the constrained GM. However, additional implicit rules are introduced asrepair operations in order to amend the oversized voids and cross-diagonal voidsgenerated by the constrained GM. If an oversized or a cross-diagonal void isgenerated, then a repair operation will modify a floor from one or more groupsand will assign all cells on that floor to be non-void. In the case of the oversizedvoid there being another operation, floors are iteratively removed from the top andthe bottom of the void, until a suitable height is reached (a-a’ in Figure 4). In thecase of the cross-diagonal void, all cells on the floor in the middle will be assignednon-void, so that the two voids become disconnected (b-b’ in Figure 4).
These repair operations may, however, result in additional problematicconditions being generated. In particular, inserting non-void floors in certaingroups can result in many single-floor pendulous cells which are hard to rent orconstruct. Hence, an extra repair operation is needed in order to correct theseconditions. This repair operation will identify isolated or pendulous cells and willswitch them to the opposite solid-void condition. Due to the fact that additionalproblematic conditions can continuously emerge after the execution of the first and

168 L. WANG, P. JANSSEN AND G. JI
the second repair operations, these operations are run in a loop until all infeasibleconditions have been eliminated.
Figure 4. Example of repair operations.
2.4. THE FITNESS FUNCTION
In order to evaluate the generated solutions, a simplified economic index was used.This index has the advantage that it is fast to calculate.
For each floor, the fitness function calculates the the potential profit that canresult from the rentable floor area, and subtracts three construction cost factors:the core cost, the slab cost, and the facade cost.
• Potential profit: Rentable floor area multiplied by a factor that gives preferenceto south facing spaces and spaces on the upper or lower floors (due to the betterview or accessibility).
• Core cost: Core area in plan multiplied by a factor that increases with floornumber.
• Slab cost: Slab area (excluding core but including outside spaces) multipliedby a factor that increases with floor number.
• Facade cost: Facade area multiplied by a constant cost factor.
Aside from the above index for every single floor, an upper limit of the grossarea for the whole building is also defined. A building whose gross floor areasurpasses the predefined limit will have its potential profit proportionally scaledback according to the excess area.
Based on the above fitness function, every change in the building willcause a corresponding change in its fitness. This fitness function can drive theevolutionary process towards a valid and feasible solution from the perspective ofarchitectural designs.
3. ResultsBased on the external (naïve GM), explicit (constrained GM) or implicit(constrained-repaired GM) rules, different constraint handling strategies appliedin the presented GMs have a strong impact on the formal and structural featuresof generated designs (see Figure 5). It is clear that, by embedding moreconstraints, the associated rationality of the designs in the population are improvedsignificantly even before the evolving processes. The capability to avoid infeasible

EFFICIENCY VERSUS EFFECTIVENESS 169
solutions from being generated means that it is easier for the evolutionaryprocesses to discover promising areas of the search space, thereby improving theefficiency of the search process.
Figure 5. Random sampling based on the presented GMs.
In a first stage, locality and fitness were analysed by randomly generatingpopulations of designs for each GMs, without running any evolutionary searchprocess. However, although the additional constraints would be expected toimprove efficiency, theymay also reduce effectiveness due to the negative impactson locality. In order to investigate the impacts of weaker locality, a second stageof the research ran the evolutionary search process based on the presented GMsand analysed both efficiency and effectiveness.
3.1. GM LOCALITY AND FITNESS
Whenmeasuring locality, only the phenotypic response to small genotype changesare taken into account, since good respondency between two neighbouringgenotypes is critical to ensure that the design can be continuously evolved,especially when the evolutionary process begins to converge and differencesbetween parents and children reduce. There are several approaches to evaluatethe locality. For this study, a random sampling approach referred as fitness clouds(Vanneschi et al. 2004) was applied. This approach evaluates locality through thephenotype respondency. The respondency is calculated by the fitness differencebetween two phenotypes which are generated by a pair of neighboring genotypes.Thus, for calculating the locality of each GM, a Latin hypercube sampling of100 pairs of neighbouring genotypes were selected, and the associated phenotyperespondency was then evaluated.
The quantitative criteria defining locality currently remains a disputed issue.One of the arguments is how to define neutral mutations (the fitness difference is0 between two neighbouring genotypes). Table 1 shows three common methods(Galván-López et al. 2011), but it is also reported that none of these methods canaccurately predict the locality in all different scenarios. For this study, since there

170 L. WANG, P. JANSSEN AND G. JI
are considerable numbers of many-to-one genotype-phenotype mappings in theconstrained and constrained-repaired GMs, simply ignoring such neutral mutationis inadvisable. As the result, Def0 and Def1 were applied for the evaluation of thelocality.
Table 1. Definition of different fitness distances.
Figure 6 shows the locality calculated using two different methods. Thegeneral tendencies for these two methods are similar, with only minor differencesin the actual values. This result reveals that the locality can be predicted coherentlyby two methods, which suggests that the locality of the presented GMs is accurate.The results show that the locality of the naïve GM is markedly better than thatof the other two GMs. Between the constrained and constrained-repaired GMs,the additional constraints (repair operations) do not further degrade its localitysignificantly.
Figure 6. The statistical analysis of locality based on Def0 and Def1.
Figure 7. The statistical analysis of the fitness values.
Although the constrained and the constrained-repaired GMs are non-local ingeneral, the constraint handling brings noticeable benefits. Figure 7 shows thebox plot of the statistical results from the above samplings.The results show thatthe median and average fitness value of the constrained and constrained-repairedGMs are better than that of the naïve GM, which can allow the evolving processmore likely to find feasible solutions during the early stochastic search phase.However, between the constrained and constrained-repaired GMs, the additional

EFFICIENCY VERSUS EFFECTIVENESS 171
constraints make the average fitness value of constrained-repaired GM dropmarkedly. This can be explained by the reason that most solutions corrected bythe repair operations usually have larger gross area surpassing the upper limit. But,even so, the maximum fitness value of the constrained-repaired GM is still higherthan that of the constrained GM.
3.2. EVOLUTIONARY EFFICIENCY AND EFFECTIVENESS
In order to further investigate the impacts of the different constraint handlingstrategies had on efficiency and effectiveness, the evolutionary search processwas run and the results analysed. The evolutionary algorithm was executed usingthe Rhino-Grasshopper environment, and the standard genetic algorithm in theGalapagos was applied. The population size was set to 100. Due to the largegenotype space for some of the presented GMs, the population of the initialgeneration was raised to 1000. Meanwhile, to avoid the premature convergence,a higher mutation rate and a lower selection pressure were used. (In Galapagos,the settings are 25% for maintain and 25% for inbreeding). Last but not the least,the evolutionary process was repeated five times in order to reduce the impact ofstochastic variation.
Figure 8 shows the trend lines of fitness improvement during the evolutionaryprocesses. Certain key features of the trend lines seem to confirm the expectedimpacts of locality. The more local of the GM is, the more smoothly and gentlythe trend line grows. However, it is also clear that the improved effectiveness hasnot been able to deliver better designs, as the fitness levels of the naïve GM aremuch lower than that of the other GMs. Thus, in this case, efficiency seems tooutweigh effectiveness.
Figure 8. Convergent trend lines.
Even with the poor locality, the constrained and constrained-repaired GMs cansignificantly improve the time efficiency of the evolutionary designs and, moreimportantly, the fitness level of the evolved designs. Even though the poor localitycauses fitness levels to fluctuate significantly, the associated reduced search spaceseems to be resulting in a faster convergence of the evolutionary process onreasonable solutions.

172 L. WANG, P. JANSSEN AND G. JI
4. DiscussionThis study has investigated the trade-off between efficiency and effectivenesswhen applying constraint handling in the GM. The results of the case study supportthe proposed hypothesis with regards to the efficient-effective trade-off (Figure1). For the given time frame, reducing search space size was found to be moreimportant than maintaining good locality. Constraint handling, therefore, had apositive impact on both the efficiency as well as the final quality of the evolvedresults, despite the reduced effectiveness.
In the second analysis, the designs evolved using the naïve GM never managedto surpass the designs evolved using the constrained and constrained-repairedGMs. But the search space defined by the naïve GM is a super-set of the searchspaces defined by the constrained and constrained-repaired GMs. Therefore, givenenough time, onemight conclude that the naïve GM should be able to find the samesolutions as the other two GMs, and might even be able to find better solutions(Eiben and Smith 2004). However, when practical limitations are imposed oncomputational resources, the time taken may simply be too long.
To conclude, when available computational resources are not able to keepup with the ever larger design search spaces, shrinking the design space byincorporating additional constraints can be a beneficial strategy. In particular,such additional constraints can result in significantly improved design beingevolved within the time that is available. These benefits become more pertinentwhen applied to evolutionary designs approaches that require time-consumingperformance simulations.
AcknowledgementThis paper was supported by the National Natural Science Foundation of China(51378248) and the China Scholarship Council (201706190203).
ReferencesBentley, P. and Kumar, S.: 1999, Three ways to grow designs: a comparison of embryogenies
for an evolutionary design problem, Proceedings of the 1st Annual Conference on Geneticand Evolutionary Computation - Volume 1, Orlando, Florida, 35-43.
Eiben, A.E. and Smith, J.E.: 2004, Introduction to Evolutionary Computing, Springer, NewYork.
Frazer, J.: 1995, An Evolutionary Architecture, Architectural Association.Galván-López, E., McDermott, J., O’Neill, M. and Brabazon, A.: 2011, Defining locality as a
problem difficulty measure in genetic programming, Genetic Programming and EvolvableMachines, 12, 365-401.
Janssen, P. and Kaushik, V.: 2014, Evolving Lego, Rethinking Comprehensive Design:Speculative Counterculture, Proceedings of the 19th International Conference onComputer-Aided Architectural Design Research in Asia (CAADRIA 2014), Kyoto 14-16May 2014, 523–532.
Vanneschi, L., Clergue, M., Collard, P., Tomassini, M. and Vérel, S.: 2004, Fitness Cloudsand Problem Hardness in Genetic Programming, Genetic and Evolutionary ComputationGECCO2004 Part II, 3103, 690-701.
A. Wood and R. Salib (eds.): 2013, Guide to Natural Ventilation in High Rise Office Buildings,Routledge.

DATA-DRIVEN URBAN POROSITY
Incorporating Parameters of Public Space into a Generative Urban DesignProcess
JEROEN VAN AMEIJDE1 and YUTAO SONG21,2Urban Systems Office for Generative Architecture1,2{jeroen|yutao}@urban-systems-office.com
Abstract. This paper presents an urban design project for a new citydistrict, using generative design processes in architecture and urbanismdeveloped over several years within academic research and practicework. The paper discusses the opportunities and challenges found whenusing a data-driven urban design methodology in relation to the complexlogistical, social and economical networks of new urban centers.
Keywords. Design Methods and Information Processing;Generative System; Simulation&Optimization; Urban Planning andDesign; Public Space Design.
1. AbstractThis paper presents an urban design project for a new city district, developed in thecontext of the authors‘ architecture and urban design practice commissioned by therelated local government body. The project employs the authors’ previous researchinto the use of generative design processes in architecture and urbanism, developedover several years within academic research and practice work. The paperdiscusses the opportunities and challenges found when using a data-driven urbandesign methodology in relation to the complex logistical, social and economicalnetworks of new urban centers.
This paper gives a description of the tools and processes used for the project,and describes the parameters that were used to predict the qualities of urbanspaces as developed in earlier research within the field. The paper then discussesthe project’s application of rule-based and evolutionary design methodologies tocreate an open-ended design proposal for a 1x1 km new urban district. The finalresult demonstrates the allocation of programs and open spaces in a way thatstimulates interaction between different user groups, conceiving urban massingas a complex multi-programmatic, three-dimensional framework for urban life.
2. Project ObjectivesThe brief for the new urban district included functions that would form a newhub for improved international collaboration and stimulate economic growth in
T. Fukuda, W. Huang, P. Janssen, K. Crolla, S. Alhadidi (eds.), Learning, Adapting and Prototyping,Proceedings of the 23rd International Conference of the Association for Computer-Aided ArchitecturalDesign Research in Asia (CAADRIA) 2018, Volume 1, 173-182. © 2018 and published by the Associationfor Computer-Aided Architectural Design Research in Asia (CAADRIA) in Hong Kong.

174 J. VAN AMEIJDE AND Y. SONG
Central China. The district should house embassies, international companiesand institutions, housing and services for expats and Chinese employees ofinternationally operating corporations. The brief also requested a ‘’land-intensivedevelopment aiming to conserve natural resources, creating livable urban areasthat promote quality of life, incorporating the most advanced types of commerce,science and technology, and ecology in a single modern city district‘’.
Following the requests for density and ‘quality of life’, we chose to focus ourdesignmethodology on the calibration of small open spaces within the urban fabric.In combination with the urban block sizes, the strategic placement of public spacescould catalyze the socio-economic synergy within the area. In between clustersof buildings of high density and efficiency, public spaces provide the means forpeople to meet and interact, either as part of their daily live-work processes or aspart of the un-planned encounters or extra-curricular activities that make city lifeenriching and fulfilling.
3. PrecedentsIn order to be able to ‘parametrize’ the quality of public space, it is important tounderstand the relationship between the physical properties of urban spaces suchas size, enclosure, surface materiality, sun access and the activities that humans arelikely to engage in, if certain combinations of the right properties are all present.Extensive research in this field has been done in the 1950’s - 80’s by the sociologistWilliam H. Whyte, who published several books on the subject, including TheSocial Life of Small Urban Spaces (Whyte 1980). Using measuring, mapping anddirect observation techniques, he deducted many practical rule-sets for creatingsuccessful public spaces, including guidelines for visibility, accessibility, seating,greenery and environmental conditions such as sun and wind. Whyte consultedfor several municipal governments on public space renovation and served as amentor to Jane Jacobs, who published the highly influential book The Death andLife of Great American Cities (Jacobs 1961). Jacobs argued for the conservationof organically grown neighborhood qualities, against large scale urban renewalschemes that were at the center of political thought at the time. Jacobs in turninspired Jan Gehl who wrote Life in Between Buildings (Gehl 1987), furtherdeveloping the manifesto of the ‘New Urbanism’ movement which promotesenvironmentally friendly urban networks by creating walkable neighborhoodscontaining a mixture of housing types and work spaces.
Further research has attempted to deepen our understanding of the beneficialqualities of the mixed neighborhoods that Jacobs and Gehl promote. In theirchapter of the book Heterotopia and the City, titled ‘’Public-Space Heterotopias‘’,Yael Allweil and Rachael Kallus argue how architecture can be used to establish‘counter-hegemonic’ practices. They explain that ‘informal groups, having nodemarcated space to enact their communal identity, carve out sites within urbanpublic space by using them regularly’ (Allweil and Kallus, 2008). They discoverthat hegemonic tendencies towards spatial means of controlling cultural behaviorcan be reversed by fostering the diffusion of people, activities and ideas inopen territory, or public space visible to all. This understanding has led us toincorporate specific parameters for urban spaces into our methodologies, related

DATA-DRIVEN URBAN POROSITY 175
to accessibility, visibility and flexibility, and creating deliberately un-programmedactivity areas or covered urban spaces designated for non-commercial activities.
4. Methodology: Generative Urban DesignFollowing these precedents of thought, we set up a design methodology to createurban street networks and building massing strategies that would amend thecurrently prevalent urban planning models in China, moving from a car-dominatedcity to a pedestrian-oriented city. We applied a specific generative design process,using computational tools to helpmanage the complexity of the task and coordinatein between the different layers of information related to the site.
Our research methodology departed from the desire to explore and test newmeans by which we conceive of, and inhabit the city when it is understood asa highly complex set of interdependent ecologies. We are interested in howhigh-resolution mapping of urban spaces and the use of digital design softwareallow us to set up design processes that are calibrated against precise sets of social,environmental and programmatic information related to the urban environment.
As documented by Lima and Kós (2014), the application of mathematicalmodels as a mechanism for optimization of urban development has been studiedand proposed by specialists since many years, including by Dantzig (1973) andLeite (2012). Leite understands the ‘smart city’ as one in which basic functions ofthe city - to establish economic and social freedom and offer freedom of movement- are optimized using new forms of information and communication technology(Lima and Kós 2014).
The potential role of generative design processes within this task has beenidentified early on by Mitchell and McCullough (1991), who contemplated theimplications of computational processes being able to address a complexity ofparameters and interactions, much greater than could be handled by humancognitive processes alone. They emphasized however the central role ofthe designer’s intellectual capacity instead of promoting ‘automated designprocedures’, using critical human thought in the employment of algorithms, theinput of data parameters and the definition of the evaluation criteria.
It is also important to define the way in which generative design in thiscontext is employed, operating on the underlying relationships rather than formalcharacteristics of the built environment. As Lima and Kós write, ‘’this formof algorithmic or parametric modeling transcends the understanding of thecomputational paradigm as a mere promoter of complex forms, and contributes toprocesses capable of formingmodels that contemplate several parameters involvedin the functional, environmental and of the cities and the buildings they contain‘’(Lima and Kós 2014).
An example of this currently expanding field of research is the 3D datavisualization tool by Ferreira, Lage and others, developed to support decisionmaking in urban development (Ferreira et al. 2015). Their system, named‘Urbane’, integrates several layers of information from different sources into a 3Dmodel of a city, allowing to quantify the impact of design decisions or comparevarious options. Besides analyzing the volumetric properties of a new building

176 J. VAN AMEIJDE AND Y. SONG
or urban block such as sky exposure and views towards parks or landmarks, thesystem can incorporate data associated with quality of life in the city, such as thelocation of restaurants, noise complaints, crime reports, etc.
The limited accuracy of these data systems highlights that urban environmentsare highly dynamic, leading to the necessity to consider generative designproposals and scenarios that can adapt and evolve over time. Proposals need tobe developed in dialogue with the potential occupancy of the buildings and thesurroundings in which the solution is to intervene.
5. Design DevelopmentThe starting point for the design was the location of several center points and edgeconditions based on the analysis of regional and local connectivity requirements.The points acted as program centers, locating new areas of specialized programssuch as housing and offices, as well as a ‘mixing zone’ in between them (figure 1).The mixing zone contains smaller urban blocks and a higher plot density, intendedto house hybrid programs and activities.
Figure 1. Diagrams showing how a ‘mixing zone’ was generated in relation to three programlocation points. The desired range of Floor Area Ratio (FAR) values was determined first,
based on planning and development targets.
In the next stage, a range of urban massing typologies was mapped onto thesite, using a detailed allocation of spatial requirements that was derived from ananalysis of the qualities of the surrounding neighborhoods (figure 2). Zoningcriteria for live and work buildings, commercial and cultural facilities were basedon the proximity to urban or landscaped areas, or planned commercial and culturalcenters in the masterplan for the surrounding urban areas. Zoning for ‘introvert’and ‘extrovert’ urban block typologies was based on the ‘mixing zone’ location,placing spaces of higher social and commercial interaction towards the center ofthe site, drawing people in from the different program areas and stimulating theefficient and progressive sharing of activities and services.

DATA-DRIVEN URBAN POROSITY 177
Figure 2. Mapping of qualitative spatial and programmatic requirements for urban blocks onthe site area in relation to the desired relationships of the area to the context.
The purpose of these mappings was to be able to populate each plot withan urban block typology generated by a digital process that produced hundredsof potential urban blocks, analyzed and categorized them according their spatialperformance characteristics. Both the catalog of typologies as well as the sitemapping were set up as fully parametric entities within the design software, whichallowed them to be updated easily and generate different outcomes.
The plinth massing was generated by moving two cutting volumes (internalcourtyards and street corner plazas). Urban block typologies were created bycombining different types of volumes for the four different quadrants of eachplot (figure 4). Using the genetic algorithm software ‘Octopus’ (a plug-in forRhino/Grasshopper), a large population of urban block typologies was generatedand evaluated for their characteristics.
Figure 3. Logic for the digital generation of urban block typologies.
The criteria used in this project included sunlight exposure in the open spaces,

178 J. VAN AMEIJDE AND Y. SONG
the total FAR of the plot, the geometry of the blocks and their capacity toaccommodate larger or smaller program areas, and the accessibility of the openspaces. If the corner plazas are open from the street, the plot is considered ‘public’or ‘extrovert’, as opposed to ‘private’ or ‘introvert’ (figure 4).
Figure 4. Evaluation criteria for spatial and programmatic opportunities for the urban blocktypologies.
The software automatically selected and refined themore successful typologies- depending on criteria that are defined as ‘successful’ (figure 5).
Figure 5. Mapping of a field of block typology solutions against the axes of success criteria.
To populate the most appropriate block typologies into the site, the site wasanalyzed by the genetic algorithm for the different requirements for each plot.These requirements were a combination of the several layers of information asdescribed in figure 4, translated into fields of numeric values between 0 and 1. Foreach of the required plot characteristics, the closest matching individuals wereselected automatically by the algorithm out of the solution space of the latestgeneration of optimized individuals. The urban block typologies were populatedinto the site, adapting the geometry to the particular topography and layout of

DATA-DRIVEN URBAN POROSITY 179
the area. The urban massing was calibrated against different setback lines (whichcould be adjusted for each of the different road type dimensions) and was splitwhere plots are subdivided (figure 6).
Figure 6. Workflow diagram of the block typology allocation on to the site.
Using a separate genetic algorithm, high-rise tower locations were varied andevaluated against the optimal configuration to maximize the sun exposure to allof the tower facades in the site. This minimized self shading and contributed togood quality living and working spaces, using passive heating in the winter season.Based on the ‘mixing zone’ mapping layer developed earlier, the FAR distributionmap for the individual plots was generated. A range of building typologies wasgenerated to populate the masterplan area following criteria for proximity to views,pedestrian areas, busy roads and some top-down zoning criteria set out by thelocal government. A residential zone in the north-east corner was populated withelongated tower slabs for high-end apartment buildings, while the high-rise aroundthe mixing zone attracted a number of taller compact footprint towers suitablefor corporate headquarters and tenanted floors including embassies and relatedinternational agencies.
6. Result: Urban Mixing to Promote SynergyThe final design proposal for the new International Communication Districtincorporates a range of public spaces suitable for a variety of social andcommercial activities, materializing into a raised pedestrian network that is part ofthe public domain. The elevated pedestrian network is located within the ‘mixingzone’, emphasizing and intensifying the dynamic and diverse nature of this area. It

180 J. VAN AMEIJDE AND Y. SONG
covers parts of the street surfaces in the center, creating an efficient and sustainabledouble use of limited urban space. The concept for the urban fabric on the raisedplaza is that of ‘varying porosity’, using a transforming grid system to locatedifferent conditions ranging from an open field with small free-standing retail unitto and dense cluster of larger commercial spaces.
The center of the International District becomes a dynamic and vibrant urbanplace, that has zones containing smaller urban spaces surrounding it, which allowsfor different atmospheres and activities to take place (figures 7 and 8). It createsopportunities for the collision between different types of commercial and culturalservices as well as between different user groups, to promote social interaction andcultural exchange.
Figure 7. Central pedestrian zone with a porous urban fabric.

DATA-DRIVEN URBAN POROSITY 181
Figure 8. Elevated pedestrian deck with various scale urban spaces.
7. Conclusions and Future DevelopmentsThis project has demonstrated the application of rule-based and evolutionarydesign methodologies to generate urban design solutions centered around astrategic distribution of public space. Following research of urbanists from thepast and present, we can quantify certain properties of urban spaces and use thesein a generative design process that can create a highly differentiated urban fabricat a larger scale. The methodology allows to analyze and safeguard the propertiesof all of the building volumes and spaces within the urban proposal, despite thecomplexity of the overall design. The resulting solution, that could have neverbeen modeled ‘by hand’, can easily be adjusted and different options can beevaluated in conversation with a client or other stakeholders, giving insight in theconsequences of particular policy decisions.
The use of rule sets allowed us to generate site-specific outcomes within thelimitations of the context, allowing the project to take full advantage of andcontribute to the environmental, programmatic and connectivity characteristicsof the surroundings. This approach to generative design resulted in aprecisely calibrated design scheme, addressing several complex functionalitiesand accommodating its adaptation towards social, economical and environmentalperformance criteria and contexts.
We acknowledge that the socio-economic performance of these types of urbanprojects once realized is very complex and difficult to simulate, and will depend onmany factors that are not covered in this design process and may not even be undercontrol of the designers or the client. Our attitude towards this is that no urbandesign should aim to control the urban life within it to the last detail, but rathershould incorporate flexibilities for changes in requirements and activities over time.

182 J. VAN AMEIJDE AND Y. SONG
We aim to create ‘open-ended’ urban design proposals that stimulate economic andsocial development, based on general rule-sets derived from successful precedentsand field research. As our current methodologies are limited to incorporatingfixed data, it is our ambition to continue future research to develop methods thatcan incorporate dynamic information. If we can use detailed simulations of userpatterns based on real-world data to evaluate our designs, we can use this feedbackto incrementally improve our solutions in the context of the full complexity of ourvibrant urban ecologies.
Our research will continue to explore multi-layered, multi-programmatic,networked architecture of hyper-density which accepts certain realities ofdevelopment in the city, while at the same time fundamentally rethinking urbantypologies. It is our ambition to design ever more informed projects that canfunction as attractors, reactors and mediators in the city. We will continue thedevelopment of generative design methodologies that incorporate more layers ofinformation sourced from real-world and real-time data sources that are becomingincreasingly available accessible.
Through further field studies with more developed mapping techniques andtools, we aim to incorporate and catalyze complex and dynamic existing culturaland socio-economic urban conditions and take advantage of open-endedness indesign, construction and use. This could allow future projects to be conceived as‘data-driven urban frameworks’, using innovative architectural systems to provokethe emergence of vibrant and unique new urban realities.
AcknowledgmentsProject design and computation: Jeroen van Ameijde / Yutao Song / Kai Yang /James Chung / Yu Zheng
In collaboration with: Changsha Planning and Design Institute
ReferencesAllweil, Y. and Kallus, R. 2008, Public-Space Heterotopias: Heterotopias of masculinity along
the Tel Aviv shoreline., in M. Dehaen and L. DeCauter (eds.), Heterotopia and the City,Routledge, London, 191-20.
Ferreira, N., Lage, M., Doraiswamy, H., Vo, H., Wilson, L., Werner, H., Park, M. and Silva,C.: 2015, Urbane: A 3D Framework to Support Data Driven Decision Making in UrbanDevelopment, IEEE Conference on Visual Analytics Science and Technology (VAST).
Gehl, J.: 1987, Life Between Buildings: Using Public Space. Translated by Jo Koch, VanNostrand Reinhold., New York.
Jacobs, J.: 1961, The Death and Life of Great American Cities, Random House., New York.Lima, F.T. and Kós, J.R.: 2014, Algorithmic thinking, parameterization and sustainable
urbanism: an assessment of parameters for intelligent urban design strategies., Conferenceof the Iberoamerican Society of Digital Graphics - SIGraDi: Design in Freedom..
Mitchell, W.J. andMcCullough, M.: 1991,Digital DesignMedia, Van Nostrand Reinhold, NewYork.
Saaby, T.: 2012, Urban life for everyone – temporary measures as a planning method., UrbanDesign Journal, Spring 2012(122), 19-22.
Whyte, W.H.: 1980, The Social Life of Small Urban Spaces, Conservation Foundation,Washington, D.C..

ARCHITECTONICS OF CRYSTAL SPACE
POLTAK PANDJAITAN1ETH Zurich; Department of Architecture; ITA Institute of Technologyin Architecture; Chair for Computer Aided Architectural [email protected]
Abstract. The basic research project addresses the question ofspatiality in architecture and how to define space by geometricallymediating between spatialities. Based on interdisciplinary explorationsof crystal structures and their specific constitutions, spatial paradigmsare examined and implemented in the algebraic framework of crystals.The goal of the ongoing research is not to resemble and mimic theseemergent crystal arrangements. It is only about the general principleof these formation processes particularly with regard to aperiodicquasicrystals. Through the purposive abstraction and translation ofspatialities combined with the notion of crystals as a code like structure,it is possible to scrutinize the meaning of space in order to create spacefor new architectonical articulations.
Keywords. Crystal; quasicrystal; lattice; aperiodic; architectonics.
1. IntroductionThe current and available research on creating structural objects in architectureshows the typical approach to find complex geometry or procedures and directlytranslate them as examples in architecture. But the problem is that these abstractconcepts and their mathematical derivations often can’t be related to the real worldor any physicality. To do so, they get superimposed with notional materiality.Trying to find a direct translation and to interpret emergent phenomena in natureone-to-one to architecture always has the unavoidable issue that the designatedintention, to be able to grasp “nature”, is not achieved and the result is only anembodiment of the phenomenon. It is the materialization, but it could be thespatialization of the phenomenon. The most relevant and crucial part to exploit thespatial potential of this knowledge gets lost right at the beginning. The question ofwhether it is necessary to discuss the aesthetics and reasonability of the translatedembodiments is for the purpose of the research not relevant. The more importantissue will be if there is a conjunction to relate these abstract notions to architecture.
T. Fukuda, W. Huang, P. Janssen, K. Crolla, S. Alhadidi (eds.), Learning, Adapting and Prototyping,Proceedings of the 23rd International Conference of the Association for Computer-Aided ArchitecturalDesign Research in Asia (CAADRIA) 2018, Volume 1, 183-192. © 2018 and published by the Associationfor Computer-Aided Architectural Design Research in Asia (CAADRIA) in Hong Kong.

184 P. PANDJAITAN
Figure 1. Konrad Wachsmann’s Space Frame Aircraft Hangar (Wachsmann, 1989).
When it comes to the differentiation of constructed human-made structuresand ones resulting from a natural process, crystals seem to have properties that areascribed to those of an artificial nature, since they rarely occur in nature. Crystalsgrow from the outside through parallel aggregation of matter (apposition), whereasorganisms, a plant or an animal, develop from the inside (intussusception) afterfood intake. A crystal, even though it is so small, is an individual by itself withidentical properties of the large crystals. It is hardly imaginable that such regularstructures in the macroscopic as well as in the microscopic scope, even undernatural conditions, are possible at all. Crystals have specific properties which,as such, cannot be found in nature. (Hoffmann, 2016)
2. Research layoutTo get the research idea of how to implement and translate spatial concepts incrystal topologies and to link architecturewith the abstract notion of space dividing,it is necessary to split the research project into three main parts. This layoutrepresents the outline and basic methodology of the project.
Figure 2. Agencies in geometry triangle.
The geometry of space represents the theoretical and current state of researchin crystals as divisions of space. It focuses on analyzing and gathering severalspace-related subjects. Through the examination of crystallography, the science ofcrystals, it is possible to explore many spatial and geometrical properties based onthe logic of crystal structures. The geometric mediation covers the computationalconcept of how to represent abstract spatial relations geometrically. And thecrystal space is where the knowledge of the two parts are combined and built thesetup to develop an algebraic language based on the topology of crystals.

ARCHITECTONICS OF CRYSTAL SPACE 185
3. Geometry of spaceCrystals in crystallography are described by idealized arrays of geometrical pointsin space. This perfect infinite alignment of points is called lattice. Becauseof inheriting perfect translational spatial symmetry, all points of the lattice areequivalent, and each point has the same surrounding neighbors. There are onlyfourteen different ways to arrange points in three-dimensional space to create aperiodic array of points, called the Bravais lattice. (Janot, 2012; Ladd, 1999;Prince, 2004; Steurer & Deloudi, 2009)
Each lattice point can be coupled with a group of atoms to create a crystal. Thisunit cell of clustered atoms is arranged in every point of the lattice. The unit cellis described as the basis. Therefore, a Bravais lattice in a combination of a basisdescribes the structural arrangement of a crystal. Lattice + Basis = Crystal (DeGraef & McHenry, 2012; Janot, 2012; Steurer & Deloudi, 2009; Sunada, 2012)
In 1982 the world of crystallographic science was confused by the discoveryof a crystal structure that has a regular structure, but on a global scope the structureis non-periodic, each cell is surrounded by a different pattern. The classicalcrystallographic restriction theorem indicated that all crystalline structures musthave periodically repeating patterns and can only possess two, three, four, andsix-fold rotational symmetries. But the discovered structure maintains long-rangeorientational order but no translational symmetry. (Steurer & Deloudi, 2009)
Figure 3. Picture of a five-fold high-resolution transmission electron microscopy (Yacamán,1993, p. 71).
Dan Schechtman’s discovery of the icosahedral phase that could be foundin the diffraction pattern of aluminum-manganese alloys, was condemned for along time by his colleagues to be impossible. The fundamental hypothesis of theperiodicity of crystal structures was made naught with his breakthrough becausefive-fold rotational symmetry is incompatible with periodicity. This led to the term“quasicrystal” that defines a structure that has a non-periodic ordering and lackstranslational symmetry. (Senechal, 1996)
In 1973, nine years before, Roger Penrose and Robert Ammann discoveredthe Penrose tiling. It is a regular pattern in which the arrangements of the basicunits never repeat themselves. They are ordered structural forms that are alsonon-periodic, just like a section of a suitable quasicrystal. In comparison to theregular Bravais lattices that have single unit cells to create an infinite lattice, thequasi-lattices require more than one cell shape to develop. In case of the famous

186 P. PANDJAITAN
Penrose tiling, the plane pattern holds a fivefold-symmetry and is constructed bytwo rhombs (prototiles).
The illustrations below show how two unit cells are organized in a regularlattice compared to a quasi-lattice. The information of the basis is the same. Theyonly differ in the order of arrangement of the tiles. In a periodic arrangement, it iseasy to decode the underlying symmetry order of the lattice, but it is much harderto find the present order in a quasi-lattice. Depending on the information of thebasis, the involved local symmetries of the aperiodic pattern take more distinctshape.
Figure 4. Periodic vs. aperiodic arrangement of two unit cells.
The ambition of the part “geometry of space” is to study the division of spaceon the level of crystals in which all these distinct atomic agglomerations andformation principles are brought together. The purpose is to decode the specificsof different groups of space-filling crystals and aperiodic quasicrystals. (Baake &Grimm, 2013; Steurer & Deloudi, 2009)
4. Geometric mediationBut crystals themselves don’t represent a descriptive geometry. They only inheritthe information of multiple coexisting localized spaces, without embodying them.Andmethods to represent the notion of topological crystals geometrically is treatedin the second part of the research. The geometric mediation.
Abstracted geometry can be reduced to a network of curves and surfaces, withthe help of the medial axis transformation. This algorithm describes every shape inresulting axes or surfaces (diagrammed in blue axes) that contains the data of themaximum inscribed volumes (diagrammed in red circles) on the medial geometry.This data of volumes describes the dimension and expansion of spheres, calculatedfor each point on this surface/axis. The radii of the spheres are defined by themaximum extension of it within the scanned geometry. (Blum, 1967; Kimia &Frederic, 2005)
Figure 5. Medial axis transformation.
With this approach, it is possible to describe any geometry in a resultingmedial surface/axis of an object that is very similar to the principle to reduce an

ARCHITECTONICS OF CRYSTAL SPACE 187
architectural layout into a graph of connections within a building. It resembles apermeability map that illustrates the spatial topology, the organization of rooms,of a floor plan. (Deleuran & Derix, 2013; Hillier, 1996)
Instead of applying this algorithm as an analyzing tool, the principle canbe used the other way around. The reversed medial axis transformation actsas a geometric mediation between defined complementary spatialities. Anymanipulation of the axes (topographical and topological change) has a directinfluence on the resulting geometry. What remains is the basic principle todescribe geometry through the mediation of spatialities. One space can onlybe described through the existence of the other one. They are in constantinterdependency, and their relation defines them.
Figure 6. Manipulation of paths (f.l.t.r. origin, topographical manipulation, topologicalchange).
Just like the abstract idea of crystals. Each combination and agglomerationof elements within the crystal in relation to the other ones defines the structure,but crystals still don’t represent a descriptive geometry. The geometric mediationonly acts as a geometric renderer and visualizes these complementary relationalspatialities. It delineates this spatial separation and mediates between themgeometrically.
Figure 7. Crystallographic structures.
To see the crystal code behind structures is unapparent and to analyze thestructure of relational criteria is also not obvious. So we tend to compare thesestructures with existing designs or buildings and put them in predefined separatesets based on explicit criteria like a style, shape, material and so on.

188 P. PANDJAITAN
Figure 8. Transition of spatial order.
But instead, we can talk about Toyo Ito’s Taichung Metropolitan Opera Housewith its organic minimal surface appearance (triply periodic Schwarz’ P surface)and link it with the iconic Dom-Ino House of Le Corbusier, with its parallelhorizontal floors, to highlight that the spatial organization of these two can berelated. The mathematical concept and design method might be different, butthey can be set in relation regarding spatial separation and how to combine andorientate spaces. The underlying topological information deals with the translationproblem of geometry and the geometricmediation serves as one possible geometricrepresentation.
5. Crystal spaceWith the fundamental knowledge of geometric morphology and syntax from thefirst part of the geometry of space, combined with the potential to visualize spatialideas from the second with the geometric mediation, there is a possibility toestablish a language for these new architectonical articulations. It is about howto treat the abstract idea of crystals and to express its algebraic nature in differentexperiments that are addressed in the third part of the research project. The crystalspace.
Figure 9. Crystal representation in vertices and edges.
The approach to the geometry of crystals or even quasicrystals doesn’t goalong with the idea to treat geometry as an accumulation of elements in space.Basic shapes of geometry, such as the triangle, the square and even the beginningof crystallographic thinking, with the platonic solids as definitions of vertices inspace, are already renderings of a specific kind. The focus is on the topologyof crystals that describe the composition and relational order within the structure.

ARCHITECTONICS OF CRYSTAL SPACE 189
There is no information about the crystals’ shape and geometry, but the pattern ofthe structure acts as a code, which in the broadest sense resembles a language.
As already mentioned in the first part, the atoms or molecules in quasicrystalsare arranged in an ordered, aperiodic structure. The symmetry of quasicrystalsis not part of the 32 crystallographic point groups, and because of not havingtranslational symmetry they are not based on Bravais lattices. As well thediffraction pattern doesn’t represent crystallographic symmetry. But there is arelationship between periodic crystals and non-periodic quasicrystals. In 1981,the mathematician de Bruijn introduced the “cut and project” method. With thisapproach, the quasi-periodic pattern of dots can be formed by the projection of aperiodic lattice in a higher dimension onto a lower dimensional space.
Figure 10. Cut and project with an irrational slope creates an aperiodic 1D-sequence.
In case of one-dimensional structures, the projection of points of atwo-dimensional lattice onto a line that cuts the space creates a sequence ofsections. The length of each section on the projection line can only take twovalues. To create a one-dimensional quasi-periodic structure, the slope of thecutting line in relation to the square lattice has to be irrational (y = (ϕ− 1) · x).In comparison, a cut with a rational angle leads to a sequence of values withan iterating pattern and has, therefore, a periodic structure. The sequence ofvalues of an irrational cut is not periodic, and it doesn’t possess any translationalsymmetry. It is a one-dimensional quasicrystal that resembles the Fibonaccinumber sequence, which is defined through the recursion of: fn = fn − 1 +fn − 2f or n > 2 with the initial values f1 = f2 = 1. Even in a Fibonacciseries (wn = LSLLSLSLLSLLS; fn = 13) it is difficult to see the order andto understand the aperiodicity. The raising of the dimensional space exposes theunderlying structure of the quasicrystal and makes the non-periodic order feasible.A projection from 2-D to 1-D results in a Fibonacci chain. The 2-D quasicrystallattice, like the well-known Penrose tiling, results from the projection of a 5-Dspace. For 3-D quasicrystal structures, projections from the 6-D are chosen.
Figure 11. shadow projection of a three-dimensional dedocehedral quasicrystal cluster.

190 P. PANDJAITAN
Considering this, to create a three-dimensional quasicrystal is to findthe “location” of the dots in a periodic arrangement of points in a six- orhigher-dimensional space. The three-dimensional space is a linear subspace of thesix-dimensional space that cuts it at a certain angle. The projection of every pointof the six-dimensional space to the three-dimensional subspace (perp-space) thatis located within a certain distance and the angle is an irrational number such as thegolden mean, results in a quasi-periodic pattern. Any pattern obtained in this wayis either periodic or quasi-periodic, depending on the angle and distances of thearrangements in the higher dimensional space. The fascinating fact of aperiodicityis its close relationship to periodic order, without itself being periodic. (De Graef& McHenry, 2012; Robbin, 2008; Senechal, 1996; Socolar, 1999)
Besides the fact that different crystal arrangements do vary geometrically andin their chemical constitution, their underlying code may even contain differentinformation. By recognizing patterns in the code, regularities and recurringsequences can form single unit crystals, as in case of perfect crystals, or severaldifferently shaped ones, in composed structures. These recurring patterns can beperceived as an expression of a language. The individual elements in the code arelike single letters in the alphabet or indices of a finite set; they form separate wordsand several words result in a series, which can create a sentence.
Figure 12. Sixteen quasitiles with distinct decorations.
Just like sequences of the four different nucleotides (A, T, G, C) expressesthe DNA information of cells, the code sequences in crystals represent thecrystallization instruction for the growth and development. The DNA helixstructure with the four base pairs can be understood as a quasicrystal since theaperiodicness of sequence in the code is the same as that in quasicrystals and neverrepeats periodically.(Monod, 1971)
The aperiodic structure acts as a language and code. What they both have incommon is the meaningfulness in the organization. It seems like they deal withpermutation and combination of a small finite set of basic units in order to createsystems of communication. On the contrary to a written text, the sequence of theDNA itself doesn’t inherit any meaning. The DNA is more like a programminglanguage that through the computation of the code it is gaining in significance.
In the world of quasicrystals, specific sections of the code describe aperiodicoccurring crystal clusters. Simple periodic order or complex aperiodicness isembedded in the code. The development of this specificity is equivalent to thestructure of a narrative. It is a language that makes it possible to articulateand to differentiate in crystalline structures. The crystal code can be interpreted

ARCHITECTONICS OF CRYSTAL SPACE 191
differently, and the geometric translation can show various renderings. Just likea periodic crystal is a combination of a regular lattice and a basis information.This act of differentiation of geometry allows a universal abstract system to beunderstood in different bodies.
Figure 13. Crystal-quasicrystal lattice.
The focus of the ongoing examination of crystals and other structuralconstitutions is not to resemble or to mimic these crystalline arrangements. It isonly about the general principle of these formation processes. It is the principle ofthe code that already represents a structure. The general goal of the research is tocreate a kind of an “alphabet” in which the code of crystals is the articulation ofspace. The code characterizes a concept or process as well as an actual buildingor design. A crystal is built up on the three-dimensional arrangement of unitsthat defines the mathematical concept of a lattice (crystal system). Each unitcomprises a pattern of translated, rotated and reflected elements within a unit (pointgroup symmetry). The lattice only supplies the framework that is filled in crystalstructures by patterns of elements. Elements are organized to establish spatialconcepts with the notion of topological crystals.
Figure 14. Organization of joining elements.
The research project is not about to invent new shapes or about how toimplement these ideas to design whole architectural buildings in the first place.It’s more about the knowledge we gain from the exploration of these algebraicmodels of crystals.

192 P. PANDJAITAN
Figure 15. Render of crystal space.
6. ConclusionThere is still so much to discover in the concept of crystals as characteristicelements of spatialities. Not only is this research project an enrichment to thefield of mathematics and applied geometry, but also opens up perspectives inarchitecture. Through the purposive abstraction and translation of spatialitiescombined with the notion of crystals as a code like structure, it is possible toscrutinize the meaning of space in order to create space for new architectonicalarticulations. Even the consideration, of translating and combining variousalgorithmic principles without directly embodying these algorithms in a geometricshape, is another approach to design. Because to make use of generativealgorithms, does not automatically mean to mimic or recreate structures. It is theprinciple of the code that already represents a structure, which provides a basis forspatial ideas.
ReferencesBaake, M. and Grimm, U.: 2013, Aperiodic Order, Cambridge University Press.Blum, H.: 1967, A transformation for extracting new descriptors of shape, MIT Press.Deleuran, A. and Derix, C.: 2013, Topological infrastructure analysis of the built environment,
11th EAEA Envisioning Architecture: Design, Evaluation, Communication Conference.De Graef, M. and McHenry, M. E.: 2012, Structure of Materials: An Introduction to
Crystallography, Diffraction and Symmetry, Cambridge University Press.Hillier, B.: 1996, Space is the machine a configurational theory of architecture, Cambridge
University Press.Hoffmann, F.: 2016, Faszination Kristalle und Symmetrie: Einführung in die Kristallographie,
Springer Fachmedien Wiesbaden.Janot, C.: 2012, Quasicrystals: A Primer, OUP Oxford.Kimia, B. B. and Frederic, F. L.: 2005, From the Infinitely Large to the Infinitely Small:
Applications of Medial Symmetry Representations of Shape, Kluwer.Monod, J.: 1971, Chance and necessity: an essay on the natural philosophy of modern biology,
Knopf.Senechal, M.: 1996, Quasicrystals and Geometry, Cambridge University Press.Steurer, W. and Deloudi, S.: 2009, Crystallography of Quasicrystals: Concepts, Methods and
Structures, Springer Berlin Heidelberg.Sunada, T.: 2012, Topological Crystallography: With a View Towards Discrete Geometric
Analysis, Springer Japan.Wachsmann, K.: 1989, Wendepunkt im Bauen, Dt. Verlag-Anst.Yacamán, J.: 1993, Crystal-Quasicrystal Transitions, Elsevier Science.

Additive Manufacturing andOptimization Processes

194

LOCALLY DIFFERENTIATED CONCRETE BY DIGITALLYCONTROLLED INJECTION
RYAN WEI SHEN CHEE1, WEI LIN TAN2, WEI HERN GOH3,FELIX AMTSBERG4 and STYLIANOS DRITSAS51,2,3,4,5Singapore University of Technology and Design1,2,3{ryan_chee|weilin_tan|weihern_goh}@[email protected] [email protected]
Abstract. This paper presents a digital fabrication process for concretewhich may be deployed for surface texturing, volumetric modificationof material properties and 2D and 3D forming. We process concrete inits slurry state by locally injecting chemicals in solution which causevigorous effervescent reaction to take place. By precise and controlleddispensing, using computer software and robotic hardware developed,we produce local differentiation in the finally set concrete artefacts. Ourwork contributes to additive and subtractive 3D manufacturing as wellas functionally graded materials fabrication.
Keywords. Digital Fabrication; Additive Manufacturing;Functionally Graded Materials; Architectural Robotics.
1. IntroductionAs Ordinary Portland Cement (OCP) cures, it undergoes an exothermic hydrationreaction producing a highly alkaline chemical environment that reacts with locallyinjected aluminium particles to produce hydrogen gas. The immediate andvigorous formation of bubbles within the slurry results into the spectacularmaterialtransformation. The aluminium oxide which normally develops in the presenceof atmospheric oxygen on the surface of the metal and prevents its corrosion, isattacked and converted by the lime in cement emitting hydrogen and buildingpressure within the concrete. Shortly after the reaction has completed all visualtraces of the events that took place - including local discoloration, fumes exhaustedand intense foaming - dissipates, leaving no immediate evidence of somethingdifferent than a regular sloppy concrete pour. However, once the concrete hashardened, can be removed from the formwork and carefully examined, some quiteremarkable properties can be observed which give rise to a spectrum of materialeffects.
1.1. SURFACE TEXTURE
Aluminium causes surface deterioration when directly dispensed on the still-wetconcrete. The corrosive properties of wet concrete to metals has been longstudied, generally considered undesirable (Portland Cement Association, 1969)
T. Fukuda, W. Huang, P. Janssen, K. Crolla, S. Alhadidi (eds.), Learning, Adapting and Prototyping,Proceedings of the 23rd International Conference of the Association for Computer-Aided ArchitecturalDesign Research in Asia (CAADRIA) 2018, Volume 1, 195-204. © 2018 and published by the Associationfor Computer-Aided Architectural Design Research in Asia (CAADRIA) in Hong Kong.

196 R.W.S. CHEE ET AL.
and mitigated using protective surface coatings such as galvanization. However,visually it results in remarkable surface patterns reminiscent of conventionalconcrete texturing techniques produced by timber formworks, brushing and beadblasting. Illustrative examples include the use of tree trunks and hay bales asformwork in Bruder Klaus Field Chapel by Peter Zumthor and The Truffle byEnsamble Studio respectively, which create interior material finishes reflectiveof their original formwork. In these experiments, the result surface roughnessnonetheless is high with a finish that resembles a natural patination due to ageingor erosion by weathering (Figure 1).
Figure 1. (a, b) White and regular Portland cement patterned by aluminium solution. (c, d)White and regular Portland cement after the surface has been washed off. (e) Cement mixedwith hydrogen peroxide and yeast. (f) Cement mixed with detergents. (g) Cement injected
with acrylic paint (h) Cement injected with wax after melting.
1.2. DENSITY MODULATION
Hydrogen trapped within the slurry produces volumetric porosity as minutepockets are formed after the concrete has set and all gasses have escaped. Thepresence of micro cavities affects the bulk density characteristics of the compositeproducing a result which belongs to the family of lightweight, autoclavedaerated or foamed concrete materials. Indicatively, the density of OCP is circa3,150Kg/m3 (Lafarge, 2015), medium density concrete at circa 2,000Kg/m3 andthermal conductivity of 1.35W/mK, while aerated concrete can reach as lowdensities and thermal conductivities as 300Kg/m3 and 0.1W/mK respectively(ISO/DIS 10456, 2007). Nevertheless, permeability and often lower load-bearingperformance characteristics are also associatedwith thismaterial innovation datingback in the 1920’s (Mathey and Rossiter, 1988).
Recent emphasis in sustainable development and the circular economy hasresurged interest in aerated concrete for reducing bulk usage of cement and whilerecycling dross by-products of industrial manufacturing for ceramic materials

LOCALLY DIFFERENTIATED CONCRETE BY DIGITALLYCONTROLLED INJECTION
197
additives (Studart et al, 2005; Maziah, 2001; Kinoshita et al, 2013; Liu etal, 2017). Relevant to this is research in controlled density modulation ofmaterial properties for functionally graded materials (FGM), originating from thefields of mechanical engineering and material science (Mahamood and Akinlabi,2017). Examples of influential architectural work include gravity and formworkinduced variable porosity in aluminium-based aerated concrete (Cooke, 2012)and functionally graded rapid prototyping (Oxman, Keating and Tsai, 2011;Duro-Royo, Mogas-Soldevila and Oxman, 2015). Further development in thecontrolledmodulation ofmaterial properties at the scale of construction fabricationcould lead to architectural innovations such as pre-cast concrete panels that havehigh structural and thermal performance in the same domain, removing the needfor material assemblies such as concrete sandwich walls.
Figure 2. Detail of porosity characteristics.
1.3. FORMING DISCONTINUITIES
If the solution is carefully injected by continuous volumetric dispensing in theform or liquid beads, it is not only possible to texture or aerate concrete butalso simultaneously create severe and permanent discontinuities which emergeas large volume of gases travel vertically, puncture the top surface and escapethe material. To achieve full perforation the aluminium solution must be injectedat high flow rates at the base of the mould. 3D sculpting can be also achievedby depth control of continuous injection producing height-field surfaces of thef(x,y)=z type. The proposed method offers the opportunity to perforate and evensculpt concrete unlike any other conventional method. When considered againstthe difficulty of cutting and shaping concrete after it has hardened, which requiressignificant investment in specialty impact equipment and expensive consumablessuch as diamond grade abrasives, this feature provides an insight for the potentialof the presented method.

198 R.W.S. CHEE ET AL.
Figure 3. (a) Circular cut-out sample (b) 3D shaping by wave patterned motion (c) Cut-out ofvernacular ventilation brick panel (d) Segmentation by continuous variable injection
experiment.
2. BackgroundOur project is situated within the domain of digital design and fabrication. Itinvestigates creative material transformation processes (Lefteri, 2007). It isinformed by conventional waterjet cutting, the Direct Ink Writing (DIW) 3Dprinting for FDM (Lewis, 2006) and research work in suspended matter withinviscous media (Johns, Kilian and Foley, 2014). Studies performed include:(a) Decorative surface patterning by erosion, (b) FDM fabrication via spatialdensity modification, and (c) Fusing additive and subtractive manufacturingby injection. The paper is organized by the following research tasks: (a)Material Studies: investigation of chemical reactions between OPC and additives,(b) Software and Hardware: development of servo-motor controlled syringeinjection system, integration of micro-controller dispensing logic with industrialProgrammable Logic Control, translation of design geometry to robotic motion, (c)Fabrication and prototyping: design and development of artefacts demonstratingthe capabilities of injection fabrication process.

LOCALLY DIFFERENTIATED CONCRETE BY DIGITALLYCONTROLLED INJECTION
199
2.1. MATERIAL STUDIES
The project developed as an exploration of a controlled volumetric injectionprocess. Portland cement was selected as the base substrate because it is a commonconstruction material. The material allows for producing large-scale artefacts withmechanical properties favourable to architectural applications, and it has a lowbulk cost. Initial experiments, involving the injection of inert solutions such aspigments, produced visually interesting results (Figure 1). However, they wereevaluated as rather exclusively decorative and abandoned in favour of injectionsthat begun to alter the base material properties.
Introducing hydrophobic agents such as surfactants and detergents, offeredthe first positive results where concrete transformed into a fragile sponge-likesubstance, extremely prone to crumbling as the internal bonding was locallysuppressed (Figure 1). This approach was also abandoned, yet the notion oflocalized material disruption was a concept carried forward. Experiments withorganic and inorganic additives such as common yeast, paraffin wax and hydrogenperoxide were attempted to induce cavitation and enable density modificationand volumetric anisotropy. The industrial method of aluminium for aeratedconcrete production was adopted due to availability of materials and its rapidreaction. Use of finely powdered aluminium suspended in water, increasedthe metal’s surface area in contact with the slurry, amplified the foaming andaccelerated the fabrication time. Unlike previous experiments where externallyintroduced chemicals were absorbed and homogenized past curing, aluminiumcaused separation as surface interfaces developed. This was a critical propertythat enabled the retention of voids internally and parting surfaces as opposed topost-reaction fusion.
Figure 4. (a) Initial manually produced prototypes with various additives, (b) Prototypesproduced with robotic injection of aluminium, (c) Experiments with image transfer byinjection, (d) Medium scale panel experiments, (e) Large scale variably perforated white
cement panel.
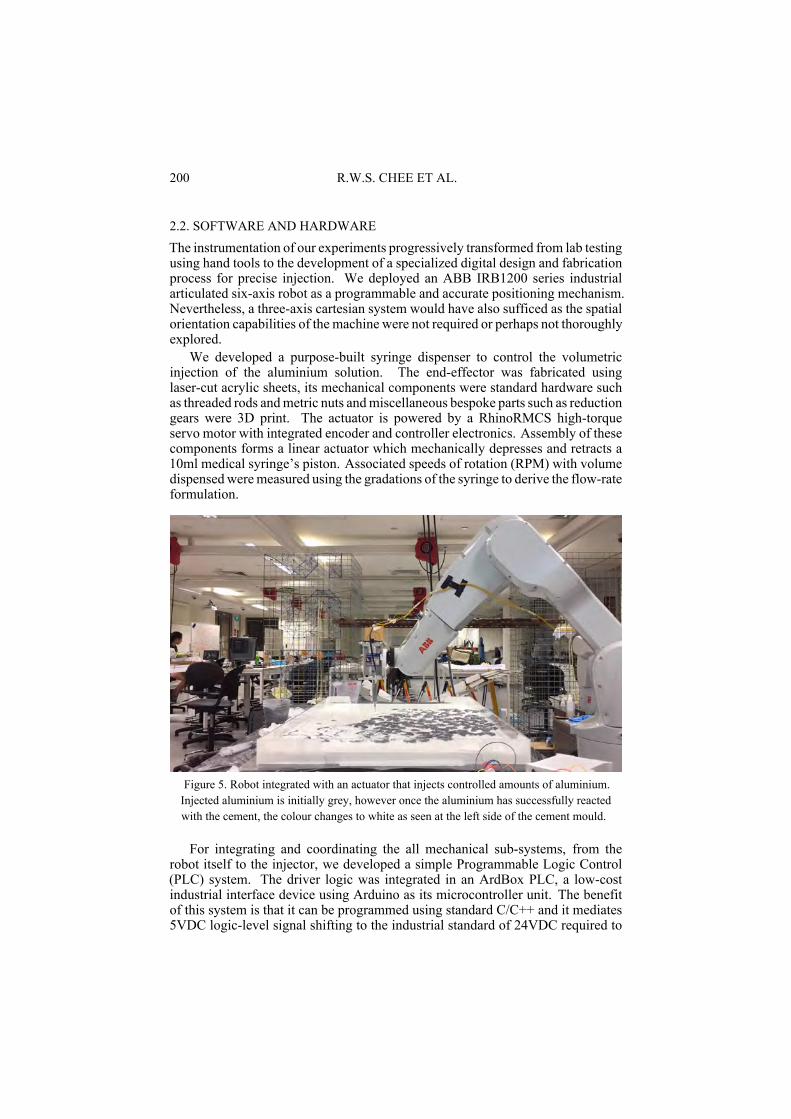
200 R.W.S. CHEE ET AL.
2.2. SOFTWARE AND HARDWARE
The instrumentation of our experiments progressively transformed from lab testingusing hand tools to the development of a specialized digital design and fabricationprocess for precise injection. We deployed an ABB IRB1200 series industrialarticulated six-axis robot as a programmable and accurate positioning mechanism.Nevertheless, a three-axis cartesian system would have also sufficed as the spatialorientation capabilities of the machine were not required or perhaps not thoroughlyexplored.
We developed a purpose-built syringe dispenser to control the volumetricinjection of the aluminium solution. The end-effector was fabricated usinglaser-cut acrylic sheets, its mechanical components were standard hardware suchas threaded rods andmetric nuts andmiscellaneous bespoke parts such as reductiongears were 3D print. The actuator is powered by a RhinoRMCS high-torqueservo motor with integrated encoder and controller electronics. Assembly of thesecomponents forms a linear actuator which mechanically depresses and retracts a10ml medical syringe’s piston. Associated speeds of rotation (RPM) with volumedispensedweremeasured using the gradations of the syringe to derive the flow-rateformulation.
Figure 5. Robot integrated with an actuator that injects controlled amounts of aluminium.Injected aluminium is initially grey, however once the aluminium has successfully reactedwith the cement, the colour changes to white as seen at the left side of the cement mould.
For integrating and coordinating the all mechanical sub-systems, from therobot itself to the injector, we developed a simple Programmable Logic Control(PLC) system. The driver logic was integrated in an ArdBox PLC, a low-costindustrial interface device using Arduino as its microcontroller unit. The benefitof this system is that it can be programmed using standard C/C++ and it mediates5VDC logic-level signal shifting to the industrial standard of 24VDC required to

LOCALLY DIFFERENTIATED CONCRETE BY DIGITALLYCONTROLLED INJECTION
201
communicate between the servo motor driver and robot controller. A firmwarewas developed to convert a digital array of bits from the robot controller to signedspeed instructions for the servo drive. As such the dispenser could be controlled byABB RAPID programming without need for external control and synchronizationlogic.
Figure 6. Left-to-Right: Robot setup, exploded diagram of end effector and electronic logic.
Workspace calibration, motion planning, simulation, off-line programmingand communications with the robot were performed using the JeneratiffDigital Design and Fabrication library for the Rhino/Grasshopper visualprogramming environment. Using parametric modeling techniques enabled rapidexperimentation and fine-tuning of critical for the process settings such asmotion speed and injection feed-rate and eventually automating the productionof prototypes.
2.3. LARGE PANEL DESIGN
We designed and fabricated a large prototype comprised of three white cementpanels with dimensions of 1,650mm by 850mm and 35mm thick in total. Theobjective of the prototype was to evaluate the process parameters beyond thepreviously created small and medium-size prototypes. The design is comprisedof 335 perforations derived from an algorithmic process blending imagery datafrom multiple sources. The combined weighted sums of overlapped raster imageintensities were converted to an abstract perforation pattern artwork.
The range of diameters used, spans between 5mm and 30mm, with minimumdistance between circle perimeters at least 5mm. The constraint was derivedexperimentally, where below this nominal tolerance the concrete became toobrittle for further processing. The syringe needle of 0.75mm internal diameterwas ground flat and depth-set at the very bottom of the acrylic mould. Linearmotion speed was 75mm/sec and injection flow rate at 0.375ml/sec. Those settingsensured full penetration of the solution with enough material available to reach thetop surface.

202 R.W.S. CHEE ET AL.
Figure 7. (a) Top view of panels after the cement has cured (b) Top view of panels after waterblasting, (c) Top detail view of aluminium not reaching the mold’s bottom hence some areaswere not fully cut. Grey areas indicate excess unreacted aluminium whereas white areas
indicate concrete of high porosity. (d) Bottom detail view of highly smooth surface finish dueto acrylic mold. (e) Top detail view of the textured perforations with approximately square
draft angle.
Nevertheless, due to the low rigidity of the acrylic injector, scrapping ofthe bottom mould’s surface due to leveling calibration and induced vibrations,the finished front-facing/bottom-of-mould surface was irregularly punctured. To

LOCALLY DIFFERENTIATED CONCRETE BY DIGITALLYCONTROLLED INJECTION
203
dislodge the non-fully disconnected concrete plugs from the panels we useda power washing system for ejection. Nevertheless, the hole diameters weresurprisingly consistent, with an average error of ±1.2mm or approximatelybetween 0.2mm to 3mm with respect to largest and smallest programmed holesizes. In addition, due to the upward direction of escaping gasses, the interiorwall finish of perforations was rough including a nominal draft angle similar towaterjet cutting edge-tapers but with inverse orientation. The prototype panelsweight 16kg each, required approximately 20mins of the injection process, at least24hrs of curing and 5mins of high-pressure water blasting. Each panel used intotal 30ml of equal aluminium to water solution by weight. The excess aluminiumsolution that reached the top and pooled around the perforation produced a highlypatterned, unforeseen and beautiful result which combines both the cutting andtexturing features of the process.
3. ConclusionsThe experiments performed and documented herein, demonstrate that fromthe three trajectories investigated, our approach offers the most interestingcontributions to digital fabrication. In functionally graded materials we offer acase study beyond the popular approach of multi-material rapid prototyping tosimulate FGM manufacturing. Local material differentiation by injection affectsdensity, mechanical and thermal insulation characteristics and enables creatingvaried material properties within the same component. At this phase, we havenot exploited the capability towards a concrete functional objective, such asmodulation of structural or environmental performance, but focused on developingexperience and understanding the process parameters. This requires additionalwork in Design of Experiment models to enable prediction of composite propertiesparametrically.
The second aspect of the proposed process, namely a 2D/3D hybrid castingand forming, holds the potential for a unique approach to fabrication with concrete.In-situ and even pre-cast concrete in controlled environments usingmolds are oftenlaborious, inaccurate and time-consuming. Perforating or generally sculptingcured concrete is labour-, time- and cost-intensive. By controlling the depth,motion, and injection flow rate, we can produce direct cuts and even surfacecontours similar to those created by milling machines. While the fabricated35mm-thick prototype panels - due to limited lengths of injection needles used- pale in comparison to actual pre-fabricated walls that are upwards of 100mmthick, injection shafts of extended lengths may be specially fabricated and used inindustrial concrete casting tables. The escaping gases partition the material locallyin a similar fashion to an end-mill subtracting material by mechanical forces.Experiments with the injection of inert compounds explored may also becomefruitful for accommodating embedded components, such as creating conduitchannels in the slurry for later routing electrical and mechanical installations.
The surface finish of the gas-cement interface leaves a lot to be desired andample more room for future work. Additional challenges include the controlof curing time, precise dispensing and volume diffusion study and inclusionof aggregates, fillers and reinforcement. Nevertheless, the ease and speed of

204 R.W.S. CHEE ET AL.
forming 2D and 3D concrete surfaces by chemical injection is still remarkablewhen contrasted to casting, depositing and machining methods. In conclusion, ourwet injection method suggests for an alternative approach to concrete fabricationfor some applications potentially may be a faster and more cost-effective, or justpurely aesthetically and creatively interesting.
AcknowledgementsThis research work was supported by Singapore University of Technology andDesign, Office of Education and the Digital Manufacturing and Design Centre.
References“Building materials and products, Hygrothermal properties, Tabulated design values and
procedures for determining declared and design thermal values.” : 2007. Available from <ISO/DIS10456> (accessed 12 December 2017).
“Lafarge Portland Cement, Safety Data Sheet, Version 2.0.” : 2015. Available from <LafargeNorthAmericaInc.> (accessed 12 December 2017).
Portland Cement, A.s.s.o.c.i.a.t.i.o.n.: 1969, Concrete Information: Corrosion of NonferrousMetals in Contact with Concrete, Portland Cement Association (PCA), IS136T, 1-3.
Cooke, T.G.: 2012, Lightweight Concrete: Investigations into the production of variable densitycellular materials, Master’s Thesis, Department of Architecture, Massachusetts Institute ofTechnology.
Duro-Royo, J., Mogas-Soldevila, L. and Oxman, N.: 2015, , Flow-Based Fabrication: AnIntegrated Computational Workflow for Design and Digital Additive Manufacturing ofMultifunctional Heterogeneously Structured Objects, Computer-Aided Design Journal,Special Issue on Geometric and Physical Modeling for Additive Manufacturing..
Johns, R.L., Kilian, A. and Foley, N.: 2014, Design Approaches Through AugmentedMateriality and Embodied Computation, Robotic Fabrication in Architecture, Art andDesign, 319-332.
Kinoshita, H., Swift, P., Utton, C., Carro-Mateo, B., Marchand, G., Collier, H. and Milestone,N.: 2013, Corrosion of aluminium metal in OPC- and CAC-based cement matrices, Cementand Concrete Research, 50, 11-18.
Lefteri, C.: 2007, Making It: Manufacturing Techniques for Product Design, Laurence KingPublishing.
Lewis, A.J.: 2006, Direct Ink Writing of 3D Functional Materials, Advanced FunctionalMaterials, 16, 2193-2204.
Liu, Y., Leong, B.S., Hu, Z.T. and Yang, E.H.: 2017, utoclaved aerated concrete incorporatingwaste aluminum dust as foaming agent, Construction and Building Materials, 148, 140-147.
Mahamood, R.M. and Akinlabi, E.T.: 2017, Functionally Graded Materials, Springer.G.R. Mathey and J.r. Rossiter, J. W (eds.): 1998, A Review of Autoclaved Aerated
Concrete Products, U.S. Department of Commerce, National Bureau of Standards, NationalEngineering Laboratory, Center for Building Technology, NBSIR 87-3670.
Maziah, M.: 2011, Development of Foamed Concrete: Enabling and Supporting Design, Ph.D.Thesis, Department of Civil Engineering, University of Dundee..
Oxman, N., Keating, S. and Tsai, E.: 2011, Functionally Graded Rapid Prototyping, InnovativeDevelopments in Virtual and Physical Prototyping: Proceedings of the 5th InternationalConference on Advanced Research in Virtual and Rapid Prototyping., Mediated MatterGroup, MIT Media Lab.
Studart, A.R., Innocentini, M.d.m., Oliveira, I.R. and Pandolfelli, V.C.: 2005, Reaction ofaluminum powder with water in cement-containing refractory castables, Journal of theEuropean Ceramic Society 25, 13, 3135-3143.

TOPO-JOINT
Topology Optimization Framework for 3D-Printed Building Joints
JUNHO CHUN1, JUHUN LEE2 and DAEKWON PARK31,3Syracuse University, Syracuse, NY, USA1,3{jchun04|dpark103}@syr.edu2Simpson Gumpertz & Heger, Boston, MA, [email protected]
Abstract. Joints and connectors are often the most complex elementin building assemblies and systems. To ensure the performance ofthe assemblies and systems, it is critical to optimize the geometryand configurations of the joints based on key functional requirements(e.g., stiffness and thermal exchange). The proposed research focuseson developing a multi-objective topology optimization framework thatcan be utilized to design highly customized joints and connectionsfor building applications. The optimized joints that often resembletree structures or bones are fabricated using additive manufacturingtechniques. This framework is built upon the integration of high-fidelitytopology optimization algorithms, additive manufacturing, computersimulations and parametric design. Case studies and numericalapplications are presented to demonstrate the validity and effectivenessof the proposed optimization and additive manufacturing framework.Optimal joint designs from a variety of architectural and structuraldesign considerations, such as stiffness, thermal exchange, andvibration are discussed to provide an insightful interpretation of theseinterrelationships and their impact on joint performance.
Keywords. Topology optimization; parametric design; 3d printing.
1. IntroductionJoints and connectors are among the most critical components that affect theoverall performance of building assemblies and systems. This is because thesecomponents are often the most complex element in an assembly regardinggeometry, functional requirement, and detailing. Many of the mechanical failuresoccur at joints as the stresses, loads, vibrations, andmovements tend to concentrateat these locations. A structural connection is commonly exposed to a set of uniquefactors which makes it practically impossible to create a single joint or connectorthat can be universally applied to all conditions.
Some of the critical factors include load conditions, the material property of thestructural components, and connection types. Metals have been the most desirable
T. Fukuda, W. Huang, P. Janssen, K. Crolla, S. Alhadidi (eds.), Learning, Adapting and Prototyping,Proceedings of the 23rd International Conference of the Association for Computer-Aided ArchitecturalDesign Research in Asia (CAADRIA) 2018, Volume 1, 205-214. © 2018 and published by the Associationfor Computer-Aided Architectural Design Research in Asia (CAADRIA) in Hong Kong.

206 J. CHUN, J. LEE AND D. PARK
material for addressing these factors due to its superior mechanical properties.However, similar to the automotive, aviation and marine industry; the attributesof synthetic composite materials (e.g., light, inert, and durable) have potential tobecome a viable alternative material for the construction industry. The recentadvancement in additive manufacturing (AM) technology is further contributingto this change, particularly for low volume production of highly customized andintricate geometries such as the joints and connectors.
Furthermore, joints and connectors are often the direct sources ofundesirable heat and sound transmission (e.g., thermal and acoustical bridge).High-performance building joints and connectors are commonly made of metalswhich are not only highly conductive regarding heat, but also create and transmitboth airborne and impact noise very efficiently. Existing strategies for mitigatingthe heat, and sound transmission include using bracing, anchoring, or proppingto prevent the movement from occurring or insert polymer breaks to reduce theadverse effects (e.g., thermal breaks in fenestration detail). These strategies tend tobemore susceptible to failure or malfunction compared to conventional connectorsdue to its complexity and high tolerance requirements.
Figure 1. (a) dynamic façade detail (Image © Christian Richters); (b) curtain wall joint detail(Retrieved from http://letsglass.com); (c) toothed timber connector detail (Retrieved fromhttp://trada.co.uk); (d) expansion joint (Retrieved from http://srwaterproofing.com); (e) steel
connector detail (Retrieved from http://publicdomainpictures.net).
In this context, this research aims to investigate the potentials of 3dprinted topologically optimized hybrid materials as a means to overcome theabovementioned challenges and needs. The primary focus of this paper isto develop a multi-objective topology optimization framework for designinghigh-performance building joints and connections.
2. Topology Optimization Framework2.1. TOPOLOGY OPTIMIZATION
The goal of optimization is to find a design solution that provides the bestperformance of the objective function while satisfying given design constraints.Topology optimization (Bendsøe and Sigmund, 2004) is a mathematical methodto find a shape by acting on its topology where the design variable is a materialdensity in a continuum setting or a cross-sectional size in a discrete setting.Therefore, topology optimization determines the best physical size, shape, and

TOPO-JOINT 207
connectivity for generating material layouts.
Figure 2. Topology optimization and its applications. Topology optimization process: (a)design prob-lem showing loading and boundary conditions and finite element discretization,(b) optimal topology for maximization of stiffness. Results of topology optimization: (c)
optimal topology for craniofacial bone construction (Sutradhar et al., 2010), and (d) unit celltopologies opti-mized for elastic properties (Osanov and Guest, 2016).
Topology optimization has been successfully applied in various fields such asmechanical engineering (Paulino and Silva, 2005), aerospace engineering (Kroget al., 2004), and medical field (Sutradhar et al., 2010). Currently, this approachis progressively transitioning into the structural engineering industry (Chun, Song,and Paulino, 2016; Filipov et al., 2016). Figure 2 illustrates the diversity of designproblems and applications of topology optimization. The proposed research strivesto link joint designs and detailing intents with the structural performance andmanufacturing constraints through topology optimization. The general optimaldesign problem is stated as follows:
mind
f(d, u) (1)
s.t gi(d, u) = 0 for i = 1, . . . , n (2)
hj(d, u) ≤ 0 for j = 1, . . . ,m (3)Where, f is the objective function; d is the design variables, and u ≡ u(d) is theresponse, which is related to the equality and inequality constraint functions gi andhj , respectively; i and j are the indices of constraint function, and n and m denotethe number of constraints. As part of this research, the proposed optimizationframework includes various engineering objective and constraint functions; andmulti-functional joint analysis and design process.
2.2. ADDITIVE MANUFACTURING
Additive manufacturing (colloquially known as 3D printing) has been makingrapid progress through the recent years, overcoming the limitations of speed,resolution, type of materials, and diversification of application fields (Jones etal., 2011). Additive manufacturing is heavily used in the medical, robotics,and aviation industry attributable to its capacity to cope with the demand forhighly customized small quantity components. The complexity of the geometry
208 J. CHUN, J. LEE AND D. PARK
does not add additional cost, and waste produced during the manufacturingprocess is also less compared to the subtractive manufacturing process. Additivemanufacturing continues to challenge the limitations of 3D printing technologythrough developing high-performance materials that are stronger, more flexible,or tougher. It is now possible to print materials such as metal alloys, glass,conductive ink, heat-resistant materials, ceramics, and nano-materials amongmany others. Materials with low embodied energy, functional materials, hybridcomposite materials, and adaptive materials (e.g., 4D printing) are expected to bethe next generation materials that will further advance the capability of 3d printingtechnology.
2.3. ARCHITECTURED MATERIAL
In this context, there is an interest in exploring the design of architectured(or hybrid) materials (Fleck, Deshpande and Ashby, 2010) to achieve specificmechanical properties using topology optimization and additive manufacturing(Osanov and Guest, 2016). There also have been discussions on several key areasof work related to topology optimization of elastic, thermal, and thermoplasticmaterials (Cadman et al., 2013). Finally, some speculative and experimentalmaterials research are in progress. These include the research on the properties offluidic materials (Andreasen and Sigmund, 2011), piezoelectricity (Silva, Fonsecaand Kikuchi, 1997), viscoelastic damping (Andreassen and Jensen, 2014), andmetamaterials (Zhou et al., 2011).
In the building industry, 3d printing large-scale composite materials suchas reinforced concrete have been one of the most significant challenges. Withthe introduction of reliable metal 3d printing and multi-material 3d printing, thepotential for 3d printed composites for buildings is becoming increasingly feasible.Although there are some efforts to combine additive manufacturing and topologyoptimization techniques (Vil-lanueva and Maute, 2014), further research by thescientific community is necessary to establish a rational framework and processesfor implementation.
3. Architectural and Engineering Optimization in Joint DesignJoints are analyzed and designed to satisfy the target performances. They includestiffness for structural connections; heat transfer for architectural façade or walljoints; and vibrational resonance control of members subjected to periodic forces.Also, microscopic material structures of joints can be reconstructed to improvearchitectural and structural performance. In this section, different optimizationobjectives are briefly discussed, and optimal results associated with them arepresented. The development of a parametric joint design tool presented in Section4, incorporates architectural and engineering considerations.
3.1. STIFFNESS (STATIC COMPLIANCE)
Building joints such as truss, beam-column, and curtain wall need to have therequired stiffness. Using the topology optimization method, the stiffness of jointssubjected to multi-directional forces can be maximized with a certain amount of

TOPO-JOINT 209
volume. For instance, a joint design domain and boundary conditions are shownin Figure 3(a). The optimized material layout (Figures 3 (b)-(c)) that provides thestiffest structure for the defined set of loads with a certain amount of volume isidentified using topology optimization.
Figure 3. (a) joint design domain, force, and boundary conditions, (b) optimal topology, (c)iteration histories of optimization.
3.2. THERMAL CONDUCTIVITY
Controlling thermal conductivity is crucial in joint design because a significantamount of heat is transferred through joint areas. The exchange of kinetic energythrough the boundary between two systems is thermal conduction. When an objectis at a different temperature from its surrounding, heat energy flows to yieldthe same temperature between the body and the surroundings, which is thermalequilibrium. The optimization problem for thermal conduction aims to find thetopological material distribution that minimizes the heat compliance. A jointdesign space is uniformly heated and holds a heat sink such as the low-temperaturearea (e.g., T = 0) as shown in Figure 4. Optimal topology and temperaturedistributions between the initial and optimized solutions are shown in Figures 4(b)-(c).
Figure 4. Thermal conductivity optimization. (a) Design domain, (b) optimal topology, (c)initial and op-timized temperature distribution (cut the optimal topology at middle level).

210 J. CHUN, J. LEE AND D. PARK
3.3. NATURAL FREQUENCY AND FORCED VIBRATION
Forced harmonic vibrations are significant in practical mechanisms and arefrequently encountered in engineering systems. Also, if joints hold objectssubjected to periodic forces in a connection design, the dynamic resonance shouldbe carefully checked and avoided. The dynamic resonance is a phenomenon ofamplitude oscillation at specific frequencies (e.g., natural frequencies) and occurswhen forcing frequencies are close to object’s natural frequencies.
Figure 5. (a) The geometry of joint design domain and loading configuration, (b) normal modeshapes and natural frequencies, (c) optimal topology, (d) dynamic compliance of initial and
optimized designs.
Thus, topology optimization problem of the dynamic compliance finds optimalsolutions to minimize resonance energy. For instance, the geometry of a curvedjoint connection domain as shown in Figure 5 is under harmonic forces. Theoptimal topology of the joint reduces the dynamic compliance as shown in Figure5(d).
3.4. MATERIAL PROPERTY
Micro-scale material distribution also changes the global mechanical propertiesof the macroscopic materials (i.e., bulk material). For example, although most ofthe materials have Poisson’s ratios around 0.3, it is possible to have a materialwith negative Poisson’s ratio. A material with the negative Poisson’s ratio canachieve low bulk modulus and high shear modulus at the same time and candeliver better performance against impact loads (Park et al., 2015). To achievethe negative Poisson’s ratio, the microstructure of the material is designed usingtopology optimization. Figure 6 shows micro-structure material design targetingthe negative Poisson’s ratio with a specific volume fraction using topologyoptimization. Topology optimization utilizing mathematically driven nature leadsto alter structural connectivity for high-performance architectural material designand usages in joint-connection design.

TOPO-JOINT 211
Figure 6. Architectured material design using topology optimization. (a) Optimalmicro-structure material distribution, (b) 3D printed micro-structure.
4. The parametric design process and optimization algorithm integrationThe building joint optimization framework discussed in the previous section isapplied to the development of a structural design optimization tool. This toolaims to provide architects and engineers with a platform for resolving the conflictsbetween aesthetics, stability, and safety in de-signing building joints. Furthermore,as an integrated visualization platform, this tool will enable professionals tocommunicate and collaborate effectively with each other to design complexjoint-connection design for irregular and non-conventional configurations.
Figure 7. Integrative optimal design framework with algorithmic modeling tool: Optimal jointdesign through the parametric design process.
The advanced numerical modeling, analysis, and algorithms are developed

212 J. CHUN, J. LEE AND D. PARK
using MATLAB, and the visualization and interface were developed usingGrasshopper 3D. The geometric and parametric variations that architects generatecan be implemented in real-time. The practical constraints discussed in Section3 is also simultaneously reflected in the structural optimization results. Figure 7illustrates the overall parametric optimization process, and once the final resultsare obtained using this tool, the geometry can be further refined and post-processedfor 3D printing within the Rhinoceros 3D computer-aided design application.
The current version of the tool has the capability of examining geometricconfiguration, and loading profile; perform finite element analysis, sensitivityanalysis, and optimization algorithm; and simple multi-objective optimization(stiffness and thermal conduction) using the Pareto efficiency (see Figure 8). Theextension of optimization framework incorporating multiple design objectives ininterdisciplinary fields is in progress (e.g., vibration, material property, safety, andstructural design code).
Figure 8. Joint connection optimization and rapid prototyping (additive manufacturing).
5. Conclusion and Further ResearchThis paper presents the development of a topology optimization frame-workintegrating 3d printed non-conventional buildingmaterials for creating customizedjoints and connections for building applications. Significant optimizationproblems associated with the joint and connection design is described with

TOPO-JOINT 213
numerical applications to show the effectiveness of the developed optimizationframework. Based on this study, this research also proposes a parametric joint andconnection design tool. Using the framework, multiple design solutions satisfyingthe desirable performances are identified, and evaluations and analysis of optimaltopologies are performed to check the feasibility of practical applications. Theparametric joint and connection design tool can examine geometric configuration,loading profile, and perform finite element analysis, sensitivity analysis, andoptimization algorithm as well as simple multi-objective optimization using thePareto efficiency. As future research, a robust multi-objective optimizationalgorithm and analysis approaches need to be integrated into the proposedframework so that interdisciplinary design considerations and constraints can bereflected efficiently in the solution fields.
AcknowledgmentsThis research has been supported by Syracuse Center of Excellence and SyracuseUniversity School of Architecture.
ReferencesAndreasen, C.S. and Sigmund, O.: 2011, Saturated poroelastic actuators generated by topology
optimization, Structural and Multidisciplinary Optimization, 43 (5), 693–706.Andreassen, E. and Jensen, J.S.: 2014, Topology optimization of periodic microstructures
for enhanced dynamic properties of viscoelastic composite materials, Structural andMultidisciplinary Optimization, 48(1), 51–66.
Ashby, A.: 2013, Designing architectured materials, Scripta Materialia, 68, 4-7.Bendsøe, M.P. and Sigmund, O.: 2004, Topology optimization, Springer Berlin Heidelberg,
Berlin, Heidelberg.Cadman, J., Zhou, S., Chen, Y. and Li, Q.: 2013, On design of multi-functional microstructural
materials, Journal of Materials Science,, 48, 51-66.Chun, J., Song, J. and Paulin, G.: 2016, Structural topology optimization under constraints
on instantaneous failure probability, Structural and Multidisciplinary Optimization, 53,773-779.
Filipov, E.T., Chun, J., Paulino, G.H. and Song, J.: 2016, Polygonal multiresolution topologyoptimization (PolyMTOP) for structural dynamics, Structural and MultidisciplinaryOptimization, 53(4), 673–694.
Fleck, N.A., Deshpande, V.S. and Ashby, M.F.: 2010, Micro-architectured materials: past,present and future, Proceedings of the Royal Society A: Mathematical, Physical andEngineering Sciences.
Jones, R., Haufe, P., Sells, E., Iravani, P., Olliver, V., Palmer, C. and Bowyer, A.: 2011, RepRap– the replicating rapid prototyper, Robotica, 29(1), 177–191.
Krog, L., Tucker, A., Uk, A., Kemp, M. and Boyd, R.: 2004, Topology optimization of aircraftwing box ribs, AIAA, Multidisciplonary Analysis and Optimization Conference.
Osanov, M. and Guest, J.: 2016, Topology Optimization for Architected Materials Design, TheAnnual Review of Materials Research, 46, 211-33.
Park, D., Romo, A. and Lee, J.: 2015, Poisson’s Ratio Material Distribution, Proceedings ofCAADRIA 2015, Daegu, 735-744.
Paulino, G.H. and Silva, E.C.N.: 2005, Design of functionally graded structures using topologyoptimization, Functionally Graded Materials, VIII, 492–493, 435–440..
Silva, E.C.N., Fonseca, J.S.O. and Kikuchi, N.: 1997, Optimal design of piezoelectricmicrostructures, Computational Mechanics, 19(5), 397–410.

214 J. CHUN, J. LEE AND D. PARK
Sutradhar, A., Paulino, G.H., Miller, M.J. and Nguyen, T.H.: 2010, Topological optimizationfor designing patient-specific large craniofacial segmental bone replacements, Proceedingsof the National Academy of Sciences.
Villanueva, C.H. and Maute, K.: 2014, Density and level set-XFEM schemes for topologyoptimization of 3-D structures, Computational Mechanics, 54(1), 133–150.
Zhou, S., Chen, W., Sun, Y. and Li, Q.: 2011, Topology optimization for negative permeabilitymetamaterials using level-set algorithm, Acta Materialia, 59(7), 2624–2636.

3D PRINTING ARCHITECTURE: TOWARDS FUNCTIONAL SPACEFRAMES
FELIX RASPALL1 and CARLOS BANON21,2SUTD1,2{felix_raspall|carlos_banon}@sutd.edu.sg
Abstract. In architecture, the use of Additive Manufacturing (AM)technologies has been primarily limited to the production of scalemodels. Its application for functional buildings components hasbeen typically undermined by the long production time, elevatedcost to manufacture parts and the low mechanical properties of 3Dprinted components. As AM becomes faster, cheaper and stronger,opportunities for architectures that make creative use of AM to producefunctional architectural pieces are emerging. In this paper, we proposeand discuss the application of AM in complex space frames and thetheoretical and practical implications. Three built projects by theauthors support our hypothesis that AM has a clear application inarchitecture and that space frames constitutes a promising structuraltypology. In addition, we investigate how AM can be used to resolvearchitectural systems beyond structure and enclosure, such as dataand power transmission. The paper presents background research andour contribution to the digital design tools, the manufacturing andassembly processes, and the analysis of the performances of the buildingcomponents and the final built pieces.
Keywords. Additive Manufacturing; Digital Design; Space frames.
1. IntroductionAdditive Manufacturing (AM) technologies are well-established technologies toproduce, primarily, prototypes of products and parts. Increasingly, they gained ashare in the manufacturing of final functional parts in high value-added industriessuch as automotive and aerospace. In architecture, AM is habitually used toproduce scale models and it’s use in construction is negligible. The main limitingfactors include the elevated time and cost to manufacture parts, the lowmechanicalproperties of 3D printed components and the small build volume.
Advances in AM technologies are reducing cost and time, while expandingmaterial options with higher strength capacities and build volume, approachingrequirements for construction applications and opening two main lines of research.The first focuses on large scale printing, aiming to expand the build size and reducethe consumable costs to meet architectural requirements. The second research lineconcentrates on AM methods that deliver high mechanical strength, such as metal
T. Fukuda, W. Huang, P. Janssen, K. Crolla, S. Alhadidi (eds.), Learning, Adapting and Prototyping,Proceedings of the 23rd International Conference of the Association for Computer-Aided ArchitecturalDesign Research in Asia (CAADRIA) 2018, Volume 1, 215-224. © 2018 and published by the Associationfor Computer-Aided Architectural Design Research in Asia (CAADRIA) in Hong Kong.

216 F. RASPALL AND C. BANON
printing. Due to the cost, the applications are complex, small parts, that can resolvehigh complexity with minimal material consumption.
Our research is located within this line of research that aims to shed lighton how Additive Manufacturing can increase structural, material and spatialperformance of architectural designs, in a broad range of scales.
The paper is organized in five units. Following this Introduction, the sectionBackground, we discuss the state of the art and the gaps in the knowledge.In Methods, we clarify research questions and the research implementation.Results and Reflections describes the outcomes of the experiments. Finally, inConclusions, we discuss the implications of this research in the larger domain ofarchitecture.
2. BackgroundApplications of AM in the construction of architecture is limited to a handfulof cases with diverging goals. Most approaches ambition to enlarge the buildvolume and reduce operation costs. An initial example is concrete contour crafting,which utilizes large scale gentry to control the extrusion and contouring of concrete(Khoshnevis 2004). Following a similar approach, the recent formwork structureby the Mediated Matter Group at the Media Lab introduces a foam as mold forcast concrete (Keating et al 2017). To take advantage of the fine detail potentialof AM, Dillenburger and Hansmeyer utilize large scale binder-jetting (2014)
A second approach involves the use of AM to produce small,complex-geometry architectural components. The application in space framesor similar types becomes apparent, since this type of structures combine largerstandard components -bars- and small specialized connectors -nodes-, whichconcentrates the complexity in a relatively small volume. Several designers haveexplored this idea, but limited to furniture scale projects. At an architecturalscale, the unbuilt project tensegrity structures for the Grote Marktstraat in TheHague, investigates the use of metal SLS as technology to manufacture complex3D connectors (Galjaard et al 2014).
This line of research, remains a seldom explored area with potential forarchitectural innovation, posing questions for which evidence is currently missing.How can architects design complex structures and the required 3D parts? Whatare the challenges in the printing process? What architectural systems can the 3Dprinted part simultaneously address? What are themain challenges in the assemblyprocess?
3. MethodsOur research investigates the feasibility of AM to produce functional architectureand, more specifically, centered in space frame assemblies. It advances customdigital design tools, understanding onmanufacturability of complex geometry part,integration of structural and information systems in architecture, and assemblyof complex structures. Our ongoing project started in late 2015, and completedtwo full-scale projects. The first project, vMesh, completed in 2016, sets thebasic instruments that are needed to design, manufacture and assemble a complex

3D PRINTING ARCHITECTURE: TOWARDS FUNCTIONAL SPACEFRAMES
217
3D structure (see Figure 1a). This project was a temporary structure to hold anexhibition in the SUTD main hall (Raspall and Banon 2016)
The second project, “(ultra) light network”, designed and built for the iLightMarina Bay 2017 festival in Singapore, constitutes the main matter of this paper.It was design and built as a light art installation as a mesh that combines structureand interactive light (see Figure 1b). As a research project, it focuses on enlargingthe scale, durability and complexity of space frame structures using 3D printedcomponents and its main innovation relies on the integration of data and powertransmission into the structural frame. The main objective was to test how of AMmanufacturing can enable the creation of very complex parts which can be used tosolve multiple architectural problems concurrently.
The methodology covers all stages in the design and manufacturing process,using a single demonstrative project to advance associative modeling, electronicsdesign, part manufacturing, assembly and operation.
Figure 1. Designs for vMesh –left– and (ultra) Light Network –right–.
3.1. ASSOCIATIVE MODEL
A robust parametric script was developed to accurately manage the geometriccomplexity of both the space frame and its nodes. The modeling and programmingplatform was McNeel’s Rhinoceros and Grasshopper. The algorithm firstgenerates a tetrahedral three-dimensionalmesh from an input 10x5x2.5m prismaticvolume. This basic form meets our initial concept of a floating prism hovering ontop of three vertical supports. The result, a three-dimensional wireframe model,contains the basic graph of the space frame and the topology of every node (seeFigure 2). The naming system of nodes and bars, which will be used for theassembly, is also defined at this stage. (Ultra) light network consists of 152 nodesand 715 bars.
The conceptual and visual lightness of the design was complemented by theactual light weight of the physical structure, for which we favored very slenderlinear elements arranged into a hyper-redundant mesh. The total weight of thestructure, which covers 50m2, was 150kg. We conducted structural analysis of thestructural frame directly in the same modeling and programming platform, whichvalidated the structural stability of the project before moving into the next stagesof design development.

218 F. RASPALL AND C. BANON
Figure 2. Elevation.
The script, then, defines the geometry of each node and produces the file forprinting. The main steps of this script are described in Figure 3. The first stepinvolves the creation of the basic topology, where the length of the branch in eachnode is determined by the angle with its closest neighbor branch. Branches thatare very close together will be longer, to avoid self-intersections.
The length of the branches is then further adjusted to secure that the bars are allstandard lengths -in modules of 5cm- to simplify production of bars and assembly.The script then generates the solid, using truncated pyramids with a wall thicknessof 3mm. The connectors that will receive the bars, then are then generated andadded to the model. The final step is the addition of the ID of the node, as well asthe ID of the bar for each branch in the node.
For the bars, the procedure is simpler. The initial tetrahedral mesh has bars ofall different lengths, which makes the assembly process tedious. Therefore, thebars are adjusted to standard lengths in increments of 5cm and the printed nodesabsorb the difference between the total bar length and the rounded length.
3.2. INTERACTIVE LIGHTING SYSTEM
The project integrates an interactive lighting system that illuminates the structure inresponse to the public behavior. Physically, the structure and light sources coexistin the same space. Consequently, LED strips were placed inside of the bars andnodes, where the electronic components such as wires, LEDs, connectors, andcontrollers are hidden inside the translucent structure.

3D PRINTING ARCHITECTURE: TOWARDS FUNCTIONAL SPACEFRAMES
219
Figure 3. Main steps in the algorithm. From left to right: a. Creation of the basic geoemtry. b.Adjustment of branch length to round up the length of bars. c. Creation of the inspection
access on the least “crowded” area of the node. d. Addition of the connectors. e. Addition ofthe numbering. f. Final file for print .
Organized in 35 individual linear circuits, the 50.000 individually addressableLED dots are controlled by a bespoke algorithm running simultaneously on fiveTeensy micro-controllers. The program uses the information from three ultrasonicsensors to detect the presence of visitors and trigger light pulses through thestructure, emulating the firing of neurons in the brain. Figure 4 illustrates thediagram of circuits, which maps the individual address of each pixel into itsphysical location in the structure.
Figure 4. Diagram of the LED circuits in the structure.

220 F. RASPALL AND C. BANON
3.3. MANUFACTURING OF STRUCTURAL ELEMENTS
Because of the translucent properties required for the desired light effect, allthe elements in the mesh are made of translucent polymers. The 715 bars arepolycarbonate square tubes with high density LED strips embedded inside. Thismaterial evenly diffuses and smooth the individual light sources. As it wasinitially foreseen, the waterproofing of the electronics inside the bars constituteda time-consuming operation, which required design and 3D-printing of speciallids, inserted in-between the LED stripes and the nodes, and further sealed withtransparent silicon.
For the 152 unique nodes, we tested two printing technologies. 70 nodes weremanufacturing using FDM of clear ABS and 82 nodes were printed using SLS ofpolyamide (PA). Figure 5 shows sample prints of the ABS node and the PA node,with and without light. Both AM technologies were satisfactory, but we identifiedsome difference.
The optic properties of clear ABSwere superior in the amount of light that it letpass, but its transparency also made the LED points more visible. On the contrary,the PA node emitted less light, but the light was very even. The printing qualityhad higher resolution with SLS, but the FDM process was good enough.
We conducted tensile tests of the connectors using an UTM, and we estimatedthat the tensile capacity of each node was over 2 kN. No significant differencesbetween the two materials were detected.
The printing process did not present major problems, but the process is stilltime consuming. The lead time to get the 152 nodes ready was one month.
Figure 5. Samples of 3D printed nodes. On the left, FDM clear ABS. On the right, SLS PA.
3.4. ASSEMBLY PROCESS
Contrarily to its complex appearance, the assembly sequence was relativelyundemanding and speedy. Simple equipment was required throughout the entire
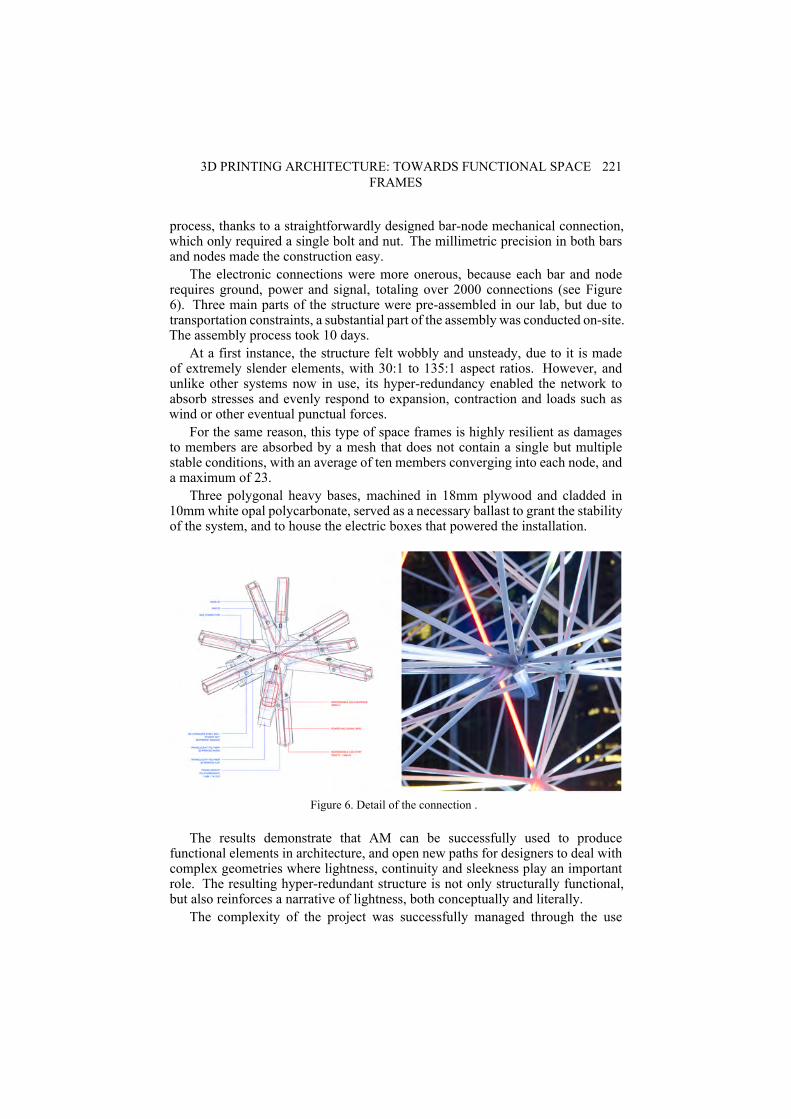
3D PRINTING ARCHITECTURE: TOWARDS FUNCTIONAL SPACEFRAMES
221
process, thanks to a straightforwardly designed bar-node mechanical connection,which only required a single bolt and nut. The millimetric precision in both barsand nodes made the construction easy.
The electronic connections were more onerous, because each bar and noderequires ground, power and signal, totaling over 2000 connections (see Figure6). Three main parts of the structure were pre-assembled in our lab, but due totransportation constraints, a substantial part of the assembly was conducted on-site.The assembly process took 10 days.
At a first instance, the structure felt wobbly and unsteady, due to it is madeof extremely slender elements, with 30:1 to 135:1 aspect ratios. However, andunlike other systems now in use, its hyper-redundancy enabled the network toabsorb stresses and evenly respond to expansion, contraction and loads such aswind or other eventual punctual forces.
For the same reason, this type of space frames is highly resilient as damagesto members are absorbed by a mesh that does not contain a single but multiplestable conditions, with an average of ten members converging into each node, anda maximum of 23.
Three polygonal heavy bases, machined in 18mm plywood and cladded in10mmwhite opal polycarbonate, served as a necessary ballast to grant the stabilityof the system, and to house the electric boxes that powered the installation.
Figure 6. Detail of the connection .
The results demonstrate that AM can be successfully used to producefunctional elements in architecture, and open new paths for designers to deal withcomplex geometries where lightness, continuity and sleekness play an importantrole. The resulting hyper-redundant structure is not only structurally functional,but also reinforces a narrative of lightness, both conceptually and literally.
The complexity of the project was successfully managed through the use

222 F. RASPALL AND C. BANON
of custom programming of an associative model that automatically solves thestructure graph, standardizes the bars lengths, produces each node geometry andvalidates the structural performance.
The manufacturing process was straightforward, as the associative modelproduced the print files and cut length sheets automatically. The standard lengthsof barsmade its manufacturing precise and simple, but the waterproofingwasmoretime consuming than expected, which will benefit from better detail engineering.
The assembly process was very smooth for a structure of such complexity(see Figure 7a). The precision of nodes and bars and well-designed node-barconnection simplified the process. We experienced some challenges related to theaccessibility of the higher nodes, which required the use of temporary scaffoldingor platforms to operate. In addition, the electric connections between nodesand bars were the most time-consuming and improve detailing will mitigate thisbottleneck.
Figure 7. Views of the installation during the event. On the left, close-up of the nodes and bars.On the right, side view of the design.
4. Results and ReflectionThe behavior of the holistic structure was extremely sturdy and stable due to itstetrahedral composition and redundancy. From the individual elements vantagepoint, only some of the bars with a length greater than 1.8m under compressivestress, showed visible traces of buckling.
The performance of the structure during the month that it was exhibitedpresented no problems (see Figure 7b). However, the electronic system sufferedfrom the relentless rain, and maintenance was required, reinforcing our concernwith the bar detailing. Upon disassembly, we took the opportunity to conduct adestructive test, whereby we added 3kN to two nodes in the bottom of the structure.Although the structure presented slight signs of deflection, withstood the load.Consecutively, we progressively cut bars until the structure collapsed under itsown weight. The hyper-redundancy allowed it to survive with at least 30% of barscut. In addition, the structure did not suddenly collapse, but visible manifested itsfailure before breaking.
Based on the high structural requirements under wind and heavy rain

3D PRINTING ARCHITECTURE: TOWARDS FUNCTIONAL SPACEFRAMES
223
conditions, and according to its material behavior, the system opens new directionsto fabricate stable and complex functional geometries that can span large distanceswith high material efficiency. Using AM, complex three-dimensional structurescan be designed and manufactured to highest precision, making the assemblyprocess simple. In addition, space frame system can integrate other technicalsystems such as information and power transmission seamlessly, which takesadvantage of the design flexibility of AM.
5. ConclusionThis project validates that AM technologies has a promising future in architecturebeyond model making. The proposed space frame system takes advantage ofthe geometric freedom of AM and translates it into architectural and structuralefficiency and expression. As each part can be uniquely designed and produced,the formal possibilities are maximised.
Moreover, the high resolution of AM enables the integration of other functionallayers in an inconspicuous manner and discloses the promise of a way to reduceconstruction costs and increase the efficiency of space frames in a broad range ofscales. In our project, information and power transmission were included in theproject, but we envision other systems such as transmission of fluids -water andair among others- can be successfully resolved. Similarly, complex connectiondetails to interface with the envelope, flooring and supports can be integrated intothe design of the node.
Applications of space frames using AM in architecture are numerous, fromshelters to large span infrastructure projects. The benefits of AM are evident,increasing the design flexibility and therefore the efficiency and aestheticpossibilities. Substantial future research is needed to transfer our findings intothe architectural practice successfully. Two ongoing projects address conceptualand practical questions that will advance the introduction of AM into architecture.
The first project aims to understand the challenges and limitations of metalAM with a smaller scale application. Metal AM, due to its high mechanicalstrength, is more compatible with architectural applications. In this research, weparametrically designed and are currently manufacturing a large meeting table,which will shed light on the design, feasibility of assembly, cost and time (seeFigure 8).
Figure 8. Design for a table usign metal AM .

224 F. RASPALL AND C. BANON
The second project is a recently awarded 3-year grant with the overarchinggoal of better understand the structural opportunities of metal SLS and binderjetting technologies for architecture, engineering and construction from the caseof space frames. The project will be carried out in collaboration with the civilengineering department at ZJU Zhejiang University will investigate, in depth,the technical feasibility of space frames using AM. The research will coverform-finding methods, AM design guidelines, engineering of connection details,integration of architectural services, and structural testing and simulation. By theend of this project, we plan to have two demonstrative projects and we aim todevelop a commerciable system.
ReferencesGaljaard, S., Hofman, S. and Ren, S.: 2015, New opportunities to optimize structural designs in
metal by using additive manufacturing, Advances in Architectural Geometry 2014, Springer,Cham., 79-93.
Gramazio, F., Kohler, M. and Langenberg, S.: 2014, Negotiating design & making,FABRICATE, Eidgenössische Technische Hochschule Zürich .
Keating, S.J., Leland, J.C., Cai, L. andOxman, N.: 2017, Toward site-specific and self-sufficientrobotic fabrication on architectural scales, Science Robotics, Vol. 2 Issue 5, 1-15.
Khoshnevis, B.: 2004, Automated construction by contour crafting—related robotics andinformation technologies., Automation in construction, 13, no. 1, 5-19.
Raspall, F. and Bañon, C.: 2016, vMESH: How to print Architecture?, Blucher DesignProceedings 3.1, SIGraDi 2016, XX Congreso de la Sociedad Ibero-americana de GráficaDigital.
FORM FINDING FOR 3D PRINTED PEDESTRIAN BRIDGES
PHILIP F. YUAN1, ZHEWEN CHEN2 and LIMING ZHANG31,2CAUP, Tongji University1,2{philipyuan007|zhewench}@tongji.edu.cn3Shanghai Fab-Union Architectural Technology and DigitalFabrication Co., [email protected]
Abstract. Due to the highly interrelation between architectureand engineering involved in the early design stage of 3D printing,form-finding is the critical step in the large-scale 3D printing projects.This paper focused on the research of form-finding applied in large-scale3D printed structures, specifically, in the design of two pedestrianbridges. A three-step form finding approach was introduced in thispaper. Multiple numerical methods were involved in the approachto find an optimal solution for both aesthetics and structural designfor two 3D printed pedestrian bridges. The application of the threesteps of form-finding, which take consideration of material properties,site limitations, applied loads etc., to the design of the large-scale 3Dprinted bridges were discussed in details in this paper. The approach ofform-finding in an early designing stage disused in this paper helps tounderstand the combination of architecture and structure engineering.
Keywords. Form Finding; 3D Printing; Structural Performance;Material Performance; Topology Optimization.
1. IntroductionAdditive manufacturing (AM) or 3D printing technology has influenced theenvironment around us continuously since the first printed solid model by HideoKodama (1981). After the rapid development of 3D printing technology of thelast thirty years, many modern industries have decided to replace traditionalmanufacturing with robotic manufacturing, for example, building industry. Fora long time, architects and engineers have been seeking a solution for 3D printingin the application to large scale structures. This paper uses 3D printed bridges asthe research objects, and addresses the solution on how to find the optimal structureform that suitable for robotic 3D printing process.
The research on 3D printed bridge has made some remarkable progress in thelast few years, and steel and concrete have been used as 3D printing materialsin large scale projects. The world’s first robotic 3D printed steel bridge wasannounced by MX3D in October 2015, and scheduled to be finished in June 2018,and this project aims to 3D print an 8m stainless steel bridge with gas metalarc welding based additive manufacturing (Joosten, 2015). Although 3D printed
T. Fukuda, W. Huang, P. Janssen, K. Crolla, S. Alhadidi (eds.), Learning, Adapting and Prototyping,Proceedings of the 23rd International Conference of the Association for Computer-Aided ArchitecturalDesign Research in Asia (CAADRIA) 2018, Volume 1, 225-234. © 2018 and published by the Associationfor Computer-Aided Architectural Design Research in Asia (CAADRIA) in Hong Kong.

226 P.F. YUAN, Z. CHEN AND L. ZHANG
steel structure has a strong structural performance, the high printing cost and slowprinting speed limits its application to regular additive manufacturing projects.
Concrete is a more common material used in 3D printing project on large scalestructure. In December 2016, the first 3D printed concrete pedestrian bridge wascompleted in Spain, and the bridge was made entirely of concrete with measuringof 12 meters in length and 1.75 meters in width (Julia, 2016). Another 3D printedconcrete bridge designed by BAM Infra was completed in Netherlands in October2017, the bridge was printed in pieces from a concrete mixture, reinforced withsteel cable, before being assembled and erected on-site (Irving, 2017). Bothprojects claimed that their material usage has been reduced in a large amount, andthe construction speed has been increased sharply by using 3D printing technology.
Due to highly interrelation between architecture and engineering involved inthe early design stage, form finding is the critical step in large scale 3D printingprojects. However, in the previous large-scale projects, the bridge forms have notbeen optimized for additive manufacturing process. This paper aims to propose amethod on finding an optimal solution from both architects and engineers aspects.Themethod was used in designing the 3D printed modified plastic (MP) pedestrianbridges at Tongji University in Shanghai, China during the Digital Future 2017Workshop (Figure 1).
Figure 1. China’s 1st 3D printed MP pedestrian bridges.
2. Three-Step Form Finding ApproachThe three-step form finding approach includes three numerical methods, which areused to conduct the form finding for 3D printed bridge, as well as other large-scale3D printed structures. All steps involved in the form finding process should takeconsideration the material properties, site layout, fabrication process, constructionperiod, and transportation. Three main principles used in this approach includecatenary equation, topology optimization theory and finite element modeling.The three-step form finding approach benefits 3D printing projects with lessmaterial cost, shorter fabrication period, lighter structure weight, and lower carbonemissions.

FORM FINDING FOR 3D PRINTED PEDESTRIAN BRIDGES 227
2.1. MINIMIZING BENDING FORCE INSIDE STRUCTURE
The first step of the three-step form finding approach is to prevent thebending failure within the structure under load applied. As the structureperformance greatly depending on material selection, material properties give awell understanding on how the material going to behave under different conditions.The detailed material properties of MP were shown in Table 1.
Table 1. Material Properties of Modified Plastic (MP).
Material properties table shown that the MP has Young’s Modulus of 3.3GPa,with tensile strength of 57.8MPa and flexural strength of 55.3MPa. The resistanttemperature indicates the 3D printed MP bridge can stand outside in a normalenvironment theoretically.
The fabrication process for 3D printed bridge was by using fused depositionmodeling (FDM) method, it varies the structural performance compare totraditional uniform material structure.
Figure 2. Load Transfer inside FDM Block.
Figure 3. Load transfer inside Uniform Block.
Fig 2&3 indicate different fabrication process may influence the load transferinside the block, if the block was made by FDM process, the tensile resistance inX direction has poor performance compare to uniform material block. The FDMblock and uniform block will have the similar performance only at the situation ofaxial load transfer within the structure without bending force.

228 P.F. YUAN, Z. CHEN AND L. ZHANG
To ensure axial load dominant the overall structure, the principle of catenaryequation was used to find the form. A catenary curve forms due to its own weightor under a uniform load, and can be described by the formula y=(1/a)cosh(ax)(Fig.4) (Becker, 2014).
Figure 4. Catenary curve and comparison to parabola.
If a catenary archwith a=0.2, with uniform load, w, and span, L, the reactions atany point along the arch at some distance x from the left support can be calculatedby the formula:
fx =wL
5.52and fy =
wL
2− wx (1)
the following diagram shown the reaction vectors at increments of L/20 (Figure 5)(Becker, 2014).
Figure 5. Forces in Catenary Curves.
By analysis with the reactions of catenary structure, no bendingmoment occursat neither supports, loads applied can transfer through the catenary curve as axialforce and therefore produce a sustainable structure.
Two reversed catenary-like curves were determined as the bridge’s upper andlower counter line to ensure no other unnecessary loads transfer within the bridgebesides axial load. A software named Kangaroo was be able to simulate thecatenary curves by apply a tension or compression force. By consideration ofsite layout (Figure 6) and measuring necessary dimensions, input the boundaryconditions from the site by using the locations of end points and the value ofapplied loads (Figure 7).
Figure 6. Site Layout.

FORM FINDING FOR 3D PRINTED PEDESTRIAN BRIDGES 229
Figure 7. Boundary Conditions for Catenary Curve Simulation.
By adjusting the value of applied force and other necessary input parameters,serval numerical results were generated (Figure 8).
Figure 8. Adjusting Input Parameters.
Considering the bridge slope required by the local building code and therelationship between the bridge geometry and surrounding environment, anoptimal result was selected as the initial design of the bridges (Figure 9).
Figure 9. Selection of Bridge Initial Design.
The structure form generated at this step is able to transfer the applied loadas axial loads and therefore minimize the possibility of bending moment. Thisis a sustainable structure laid as the foundation for the following two otheroptimization methods.
2.2. MATERIAL REDUCTION BASED ON STRUCTURAL TOPOLOGICALOPTIMIZATION
The purpose of this step is to reduce the inefficient material as much as possible,and generate the lightest structure with meet requirement of structure stiffness.Which like the purpose of topology optimization, finding the optimal lay-out of astructure within a specified region (Bendsøe, 2004). Hence, structural topologicaloptimization method was used in the project to achieve this goal.
The solid isotropic material with penalization (SIMP) method found byMlejnek can find the optimal solution for continuum structure. An applicationruns in Rhino3D software environment can calculate the optimal solution based

230 P.F. YUAN, Z. CHEN AND L. ZHANG
on SIMP method, as well as genatic algorithm (GA) to improve the calculationspeed.
Three key elements of structural topological optimization are object function,design variable, and boundary condition. In this case, the object function we usedin SIMP method is to minimize the structure weight, design variable refers thelimitation of structure stiffness, boundary condition indicates the load region, loadapplied, object region, supports type, and etc. (Figure 10).
Figure 10. Boundary Condition in SIMP Method.
After a series of iterations, achieved a clear result shown the result of SIMPmethod. Black area indicates the location of inefficient material in the structure,as white area indicates where stiffness need to take prioritized consideration indesign process (Figure 11).
Figure 11. Structural Topological Optimization Process.
All calculation was made on the assumptions of uniform load applied on theupper bridge surface, fixed supports on both sides, and isotropic material. Thechange of support type could bring significant difference in results (Figure 12),left column set support type as fix support, and right column set support type aspin support.
Figure 12. Selection of Structural Topological Optimization Results.

FORM FINDING FOR 3D PRINTED PEDESTRIAN BRIDGES 231
The results with 50% material reduction and fixed support type was selectedas the structure form in this step. It contributes the structure performance for thebridge design by reducing a large amount of the structure self-weights.
2.3. EXAMINING STRUCTURAL PERFORMANCE BY FINITE ELEMENTMODELING
To avoid local stress concentration occurs in the overall structure, a structuralanalysis based on finite element modeling was necessary to exam the structuralperformance. The percentage of material reduction used in previous step waspurely empirical, and therefore a finite element analysis helps to check if thereduction percentage within a reasonable range.
It is recommended to have a structure analysis diagram for each varied materialreduction percentage simultaneously as a monitor tool. As the structure tendinglighter, the amount of vertical displacements was increasing, then the deformationof bridge sections under load applied need to be controlled under a safe range byevaluating the stress diagram of the bridges (Figure 13).
Figure 13. Structural Performance under Different Material Reducation Percentage.
In addition, the whole big bridge was divided into multiple smaller pieces forthe convenience of transportation, and the structure analysis helps to locate an areathat suitable for cutting and minimal effect on structure strength reduction (Figure14).
Figure 14. Cutting Area on Larger Bridge.
The results from numerical simulation by FEM in Abaqus also suggest thesmaller bridge can safely supports 5 people as concentrated load with displacement

232 P.F. YUAN, Z. CHEN AND L. ZHANG
of 1cm, and the larger bridge only has 3.8mm displacement in Z direction under auniform load of 3Kn/mˆ2 (Figure 15). The safety index of the bridges is betweenthe range of 10 to 15.
Figure 15. Displacements and Stress Diagram from FEM Results .
3. Fabrication ProcessAfter finishing the form finding processes, the optimal bridges’ cross-sectionswere used for robotic fabrication by programming the robot’s movement. Twobridges were fabricated by three 6-axis robots in the laboratory for a total of 360hours and assembled on site (Figure 15&16).
Figure 16. Robotic 3D Printing Process.
Figure 17. Construion Process.

FORM FINDING FOR 3D PRINTED PEDESTRIAN BRIDGES 233
4. LimitationsThe optimal solutions from second and third step were found based on FEM,however, the results are approximate numbers due to FEM principles. Therefore,the optimized structure form by using this method can only be an approximatevalue.
No evidence showed structure under axial loads has same performance forboth FDM processed structure and uniform material structure. And the structureperformance could vary due to the optimization process was done under atwo-dimensional environment, but the loadwas transfer inside a three-dimensionalstructure in reality.
Plastic, as a 3D printing material, has always been a challenge in outdoorprojects, as the stability of the material is relative low than steel and concrete.During the extreme summer weather condition in Shanghai, the temperature onpaved road could be 70°C, and the upper surface temperature on the bridgesis about 60°C (Figure 18). The surface temperature is very closed to theMP glass transition temperature (deformation temperature) of 62°C, and causessome significant changes in material performance by long-time exposure in highenvironmental temperature. Many recent research have focused on improvingpolymer material properties for 3D printing, and stated the monomeric andpolymeric materials, like MP, is much more appropriate in next industrialrevolution than traditional building material. (Stansbury&Idacavage, 2016).
Figure 18. Thermal Image on Upper Bridge Surface.
5. ConclusionsThe three-step form-finding approach, a form-finding method for large-scale 3Dprinted objects, has been presented. The catenary curves were used to generatethe geometry outlines of the bridges; Structural Topological Optimization wasused to obtain a lighter structure, to conserve the 3D printing materials, and toincrease the construction speed; Finite Element Analysis were used to conductthe pre-structure analyses to control the 3D printing material reduction within areasonable range and to exam overall structure performance. Two large-scale 3Dprinted MP pedestrian bridges by the Tongji University in Shanghai, China, inJuly 2017, show that the three-step form-finding approach provides a reasonablemethod to find an optimal solution from both architects and structure engineersaspects. The three-step approach can be applied to all 3D printed structures.

234 P.F. YUAN, Z. CHEN AND L. ZHANG
AcknowledgementThis research is funded by National Natural Science Foundation of China(Grant No.51578378), National Key R&D Program of China(GrantNo.2016YFC0702104), Sino-German Center (Grant No.GZ1162), andShanghai Science and Technology Committee (Grant No.16dz1206502, GrantNo.16dz2250500, Grant No.17dz1203405).
References“Spain unveils world’s first 3D printed pedestrian bridge made of concrete.” : 2016. Available
from <https://www.3ders.org> (accessed 14th December 2016).“3D printed reinforced concrete bridge opens in the Netherlands” : 2017. Available from <http
s://www.newatlas.com> (accessed 18th October 2017).Becker, H.H.: 2014, Structural Competency for Architects, Routledge.Bendsøe, M.P. and Sigmund, O.: 2004, Topology optimization by distribution of isotropic
material, Topology Optimization.Frattari, L. and Leoni, G.: 2013, Form Finding and Structural Optimization in Architecture:
Case study on the pedestrian bridge Pegasus, International Conference on Architecture andCivil Engineering.
Kodama, H.: 1981, Automatic method for fabricating a three-dimensional plastic model withphoto-hardening polymer., Review of scientific instruments, 52(11).
Liu, S. and Qiao, H.: 2011, Topology optimization of continuum structures with differenttensile and compressive properties in bridge layout design, Structural & MultidisciplinaryOptimization, 43(3), 369-380.
Melnikova, R., Ehrmann, A. and Finsterbusch, K.: 2014, 3D printing of textile-based structuresby Fused Deposition Modelling (FDM) with different polymer materials,Materials Scienceand Engineering, Vol.62, pp.012018.
Piker, D.: 2013, Kangaroo: form finding with computational physics, Architectural Design,83(2), 136-137.
Rozvany, G.I.: 2000, The SIMP method in topology optimization-theoretical background,advantages and new applications, Proceedings of 8th AIAA/USAF/NASA/ISSMOSymposiumon Multidisciplinary Analysis and Optimization.
Stansbury, J.W. and Idacavage, M.J.: 2016, 3D printing with polymers: Challenges amongexpanding options and opportunities, Dental Materials.
Xie, Y.M. and Steven, G.P.: 1993, A simple evolutionary procedure for structural optimization,Computers & Structures.
STRUCTURAL OPTIMISATION FOR 3D PRINTING BESPOKEGEOMETRIES
MARYAM HOUDA1 and DAGMAR REINHARDT21,2University of Sydney, Australia1,2{maryam.houda|dagmar.reinhardt}@sydney.edu.au
Abstract. Current advances in 3D printing technology enable noveldesign explorations with the potential to inform printing depositionthrough generative scripting and structural performance analysis. Thispaper presents ongoing research that involves three scales of operation;a global geometry for multi-skin cellular mesh densities; localisedskin-porosity detailing, and material structural optimisation. Centeringon a chair as a test case scenario, the research explores the affordancesof a serialised, multi-material 3D printing process in the context ofdigital instruction, customisation, and material efficiency. The paperdiscusses two case studies with consecutive optimisation, and outlinesthe benefits and limitations of 3D printing for structural optimisationand multi-material grading in the additive process.
Keywords. 3D Printing; Bespoke Complexity; Digital Instruction;Mass Customisation; Multi-Material Grading; Robotic Deposition;Structural Optimisation.
1. Introduction: Additive FabricationIntroduced with the First Industrial Revolution, factory mass production favouredsubtractive processes that require basic tooling and an easy teaching of skills.Constraints in material and assembly processes led to the perfection andpermanency of the 20th century assembly line (Pye, 2013), where standardisationtied to productivity boosted economic growth. Ultimately, this adopted form ofproduction resulted in standard part-to-part orthogonal elements, manufacturedwith readily available stock in factories (Castaneda et al. 2015). On theother hand, 3D printing engages in an economy of a single-production modelto produce cost-effective, highly customised forms, directly buildable from adigital model without translation. It is constantly advancing in manufacturingcriteria including material advancements (plastics, timber, metals, composites);deposition technologies, ranging from Stereolithography-to-PolyJett methods(Castaneda et al. 2015) and fabrication mechanics (single to multi-extrudernozzles).
In the current context of Industry 4.0, 3D printing operates on a localisedproduction scale with a uniform procedure of digital design, structural engineeringandmanufacturing. Material testing allows for an innovative exploration of designand structural possibilities, specifically printing thermoplastics and composite
T. Fukuda, W. Huang, P. Janssen, K. Crolla, S. Alhadidi (eds.), Learning, Adapting and Prototyping,Proceedings of the 23rd International Conference of the Association for Computer-Aided ArchitecturalDesign Research in Asia (CAADRIA) 2018, Volume 1, 235-244. © 2018 and published by the Associationfor Computer-Aided Architectural Design Research in Asia (CAADRIA) in Hong Kong.

236 M. HOUDA AND D. REINHARDT
polymers. A continuous application of design-to-production can supportdesigners/manufacturers with a workflow that radically changes manufacturingof bespoke and industrial designs.
Figure 1. Varying densities of porosity.
2. MethodologyThe research explores the advancements and potentials of 3D printing intwo iterative case studies for single and multi-material/density extrusion of afull-scaled multi-cellular chair. This works as a prototype for larger architecturalimplications as the chair investigates internal and external stimuli, such as stressloads, applicable to building design. Inspired by the Panton Chair, the form isexplicitly and ergonomically designed from a spline-curve profile to accommodatethe human reclining body. It integrates form-finding processes via a digitalframework and optimises material through porosity distribution for structuralperformance.
The first case study focuses on generating parametric form and surfacedetailing where a 3mm thick seamless geometry is localised with a Voronoi patternin the visual programming environment of Grasshopper. Cellular variables ofsize and agglomeration of perforating cells are initially coordinated by a primitivestress test using Scan-and-Solve (SNS) for Rhino3D, simulating displacement andindicating areas that require denser cell perforations for structural performance.Rapid prototyping of themono-material chair is printedwith glow-in-the-dark bluePLA using a desktop FlashForge Guider with a single-head extruder, allowing forfull fidelity of the digital model.
A second case study ratifies the physical prototype and part-to-partchallenges of the original form, achieving structural optimisation withmulti-material/multi-grade 3D printing, using a dual-head FlashForge Dreamer. Itexpands from the previous study by integrating structural performance workflows,tested with an empirical study of structurally optimised branch-like geometriesinspired by nature, where biomimicry can be seen as a driver for functionalperformance.

STRUCTURAL OPTIMISATION FOR 3D PRINTING BESPOKEGEOMETRIES
237
3. Case Study One: Cellular Strategies for Serialised ModulesThe first case study focuses on development of a digital framework across threescale of operation: global shape, localised materiality and cellular definitionand modelling. The global shape of the chair is defined by three principalparametric-driver-curves, a central distinct curve profile and two symmetricalouter curves. These are subsequently ‘lofted’ to produce a generic surface forthe optimisation and surface detailing processes that follow.
Figure 2. Digital and Material framework.
3.1. MULTI-CELLULAR DISTRIBUTION
Localised materialisation of the surface for both performance and aesthetics, isachieved via bespoke codes developed in Grasshopper. The generic ‘lofted’ formis populated with 1900 randomly-seeded points to allow for a point-cloud analysisof the geometry to be made. This analysis, in combination with more obviousstructural prerequisites regarding areas of increased stress in specific load areas,required greater freedom to inform the redistribution of cell points, prior to theirconversion to 3D Voronoi cells. Thus, the point distribution can be optimisedinto a multi-cellular material that varies in porosity and density for structuralperformance. In this case study, additional points are imported to strengthen thefollowing priority load areas: top rest (25), back rest (280), chair spine (50), spineedges (50), seat edges (50), and foot (35), totalling to 2540 points.
To achieve a multi-cellular distribution, a 3D Voronoi diagram is generatedfrom the collection of the 2540 cell points that populate the generic form. Their

238 M. HOUDA AND D. REINHARDT
cell openings are offset to create apertures that vary in porosity. Thus, themodelling of each cell is indexed to the overarching performance of the chair.Parametric variables, namely offset and thickness, ensure both viability for 3Dprinting (minimum thickness) and to achieve the stiffness and flexibility describedpreviously. The techniques make full use of Weaverbird’s mesh subdivision andsmoothening algorithms (Catmull Clark, Laplace) ensuring a watertight and stablemesh for printing purposes to allow for a low-to-high-polygon approach to themodelling of the final chair. This approach afforded a practical workflow thatenabled a systematic reduction of geometric information during the analytical orform-finding design stage.
Figure 3. Case Study One- 3D printed chair.
3.2. MATERIAL FRAMEWORK
The chair is thickened evenly at 3mm and printed with a 1.75mm blueglow-in-the-dark PLA filament (Figure 3). The 3D model is made watertightready for 3D printing. Using a commercially available 3D Printer, with a250x250x200mm large print space, the FlashForge Guider prints the chair intoeighteen separate pieces, using the maximum amount of working area. A raftand tree-structure supports are generated which are required in most 3D prints,as standard 3D extrusion is unable to deposit freestanding or cantilevered layers.Thus, the printing involves a layer-by-layer deposition of the CAD model broughtto life from a virtual workspace and a set of digital instructions (2013, Strauss).
3D printing produces ‘raw’ objects which involve a post-production clean-upof rafts and supports, similar to the post-erection removal of a building’sscaffolding. All eighteen pieces are printed in a week and assembled andclamped with two-part epoxy glue for maximised bondage of the final product. Inconclusion, what the engagement with digital instruction offers to designers is adirect deposition of a customised and material efficient form in a specific location.

STRUCTURAL OPTIMISATION FOR 3D PRINTING BESPOKEGEOMETRIES
239
3D printing delivers the multiple complexities of the digitally designed chair fromits seamless form, to the detailing of 2540 unique cells, dynamic scaling of cellopenings, and cell smoothening.
4. Case Study Two: Structural OptimisationThe second case study of this chair investigates form based on structuralorganisational strategies of specific materials that are able to perform at an optimallevel as a response to a mechanical load (human-80 Kg). Rather than a primitivestructural distribution of cell detailing, this case study investigates a data-informedmaterial approach using branching mesh densities to produce a lightweight andstructurally optimised chair. Similar to using analogue methods of form finding(Gaudi, Otto) the research here adopts a method of branching systems. Thisstructurally optimised additive fabrication process is aided with computationaldesign and finite element analysis (FEA) to generate a series of prototypical casestudies of branch and node mesh densities.
4.1. MULTI-SCALAR PERFORMATIVE BRANCHANDNODEMESHDENSITY
In nature, fractal-like branching structures also known as dendriform structures arefound in plant and tree growth, fashioned according to functional requirements,where splitting and diverging occurs for maximum sun exposure for the mostefficient method of photosynthesis (Rian et al. 2014). Dendriform structures canalso operate in architectural engineering as a structural system that can work intension and compression (von Buelow, 2017). This is evident in Gaudi’s six-sidedbranching columns in La Sagrada Familia which transition into six branchesto hold a vaulted roof (Hernandez, 2006). The reverse rotations resolved thestructural performance of a single rotated geometry (Burry, 2002).
Drawing from formative processes in nature, the second case study exploresa multi-material, structurally optimised, computational design-to-fabricationprocess whereby material is deposited based on specific performative globaland local restraints. A primitive stress test was initially simulated usingScan-and-Solve (Intact Solutions, 2017) for a visual analysis of stress levels.Areas highlighted in red indicated that a stronger, more durable material tobe considered. Karamba is then simultaneously employed to a matrix ofstructural possibilities, in case study two, indicating stress moments in thegeometry and adopts multi-material/multi-grading for the structural optimisationof non-linear curved forms. The bespoke, cellular form merges the organic withthe industrial, contrasting the geometrical-driven structure in the first case studywith a structurally optimised design in this iteration. A multi-scalar performativebranch and node mesh density is investigated in Figure 4, where a parametricstrategy at a macro-scale is implemented for functional requirements of supportinga human sitting on the chair, and a micro-scale material distribution coupled withFEA for multi-material distribution and optimisation of PLA and PETG.

240 M. HOUDA AND D. REINHARDT
Figure 4. Stress test simulation using Scan-and-Solve (SNS).
4.2. MACRO SCALE DEVELOPMENT
Localised materiality and cellular definitions take on structural optimisation andinnovation as the form’s key driver while carrying over from case study one,the concepts of porosity, cell detailing and material optimisation. Structuraloptimisation now becomes the generator of the form, as a 200(l) x100(w) x100(h) mm portion of the chair’s lofted form from case study one in Figure 5,is extracted as a testing ground to examine how two surfaces speak to each other.Point-to-point and branching examples are tested comparing linear and curvilinearsurface grids, thickened with the ‘exoskeleton’ component in Grasshopper at 3mmand 5mm diameters for a shell view analysis in Karamba. In the visual structuralanalysis, minimal displacement of the geometry as well as minimal stress of theoverall model are desired.
Figure 5. Process of generating form for structural optimisation.
The matrix in Figure 6 algorithmically applies conventional truss, lattice,beam, and dendriform structural systems to linear and curvilinear surfaces. FEAindicates that curvilinear surfaces account for greater utilisation figures due to lessdefined support points in Karamba. A 5mm thickness displays better utilisationvalues, where anything less than 50% is a safe indicator that the geometry willnot break in tension under the applied force of an 80kg mechanical human load.Dendriform and lattice branching systems are the most effective, indicative ofa fractal-like structural performance. While curvilinear surfaces are the desired

STRUCTURAL OPTIMISATION FOR 3D PRINTING BESPOKEGEOMETRIES
241
framework or ‘skeleton’ for this bespoke geometry, it is necessary for an effectivestructural optimisation. A Voronoi rather than a regular grid offers a more naturalrelationship to a curvilinear surface. Where a Voronoi cell polygon varies betweenfour to six sides, corresponding cells between each surface are connected anditeratively tested for 1, 2, 3, and 4 branches. The ‘Topologiser’ componentoptimises the structural diagram to eliminate duplicate points and identify noderelationships. Branching structures are intensified and are most effective in twocases, 3 branches per cell and those with alternating cells which generate morenode-and-branch intersections. The same structural strategies matrix is also testedto perform under different material properties, in this case PLA, PETG and a PLAhybrid.
Figure 6. Regular Matrix (left), and Voronoi Matrix (right).
4.3. MICRO SCALE
Figure 7. (left): Cross-sections of Gaudi’s columns (Image Source: Lorenzi & Francaviglia,2010). (right): Three structural components observed across selected iteration.

242 M. HOUDA AND D. REINHARDT
Alongside a material hybrid for structural enhancement, the organic dendriformstructures with intersecting grid Voronoi cells is the most structurally optimisedform. Three structural components are employed across the entire parametricgeometry: truss, lattice, and dendriform. When considering material properties,the maximum stress indicated in utilisation figures are ideal. Structural analysisrequirements for each material include the ‘Young Modulus’ which evaluates thematerial’s elasticity and relation between its deformation and the power needed todeform it; the ‘Shear Modulus’ which indicates the material’s response to strain;as well as the material’s ‘Specific Weight’; and ‘Yield Strength’.
Table 1. Material Properties for structural analysis inputs of each material.
Where there are higher stress moments in the shell view analysis of the finaliteration model in both the generic PLA and PETG models, a PLA composite isallocated for multi-material 3D printing to perform better in tension strength thanPLA.
Table 2. FEA results indicating PLA Hybrid performs the best for a multi-material application.
The final mesh geometry is refined using Weaverbird’s Catmull ClarkSubdivision for a smoothened material finish. The printing takes on average 55hours for each iteration, with printing settings of 35% infill, 53mm/s extruderspeeds and tree-structure supports using the FlashForge Dreamer. Initially, despitethe use of an ooze wall (Figure 8) a multi-material deposition of PLA and PETGprinted without success due to bondage issues of different thermoplastics inconventional desktop 3D printers. Ultimately, PLA and a PLA composite (Print3: PLA Hybrid) results rather in a successful multi-grade additive process as theyare from the same material category. FEA results in Karamba indicate that thisprint can carry the most stress capacity or ‘utilisation’. In this material-drivenapproach, the form is predominantly PLA, thereby producing a cheaper print foryet a structurally optimised output.

STRUCTURAL OPTIMISATION FOR 3D PRINTING BESPOKEGEOMETRIES
243
Figure 8. Print 1(left). Print 2 (middle), and Print 3 (right).
5. DiscussionThe first case study demonstrated that 3D printing can afford multi-skin cellularmesh densities and localised skin-porosity detailing for bespoke form-finding. Thesecond showed that an understanding of structural typologies resolve the structuralintegrity of the seamless chair design. Therefore digital feedback loops betweenmaterial, geometry and fabrication allow for the efficient production of additive,multi-material bespoke geometries that vary in mesh density.
The piece-to-piece production indicates the prototyping capabilities of acommercial 3D printer for a quick, cost-effective experimental analysis of additivefabrication. The development of an algorithmic process for a material andstructural data-informed geometry extends the research towards generating theentire form and thus the application of large-scale 3D printing that entailsmulti-axis robotic fabrication. SLAM research is a relevant example that isinterested in alternative methods to the layer -by- layer deposition of conventional3D printers, essentially implementing the orientation flexibility of a 6-axis roboticarm to 3D extrude stress lines to achieve a structurally optimised pattern in relationto a geometry’s axial forces (Tam et al., 2016).
New empirical studies arise when investigating varying load area profilesincluding different branch-structure parameters and cell densities for spanninglonger distances between curvilinear surfaces, as well as new experimentsfor topographic 3D printing and multi-material grading. By shifting fromthermoplastics to an appropriate construction material, ideally concrete, anindustrial relevance could be realised, expanding the workspace and reachabilityof additive fabrication in construction (Ardiny et al., 2015).
6. ConclusionThis research has discussed ongoing research into a novel, material efficientdesign to production framework for additive processes intended for architecturaldesign where form-finding is informed at a micro and macro scale, by astructurally- performative material application. The merging fields of design tofabrication and computation to engineering seeks to create a materially informedarchitecture (Mostafavi &Bier, 2016) simultaneously allowing for bespoke design,

244 M. HOUDA AND D. REINHARDT
cost-effective detailing and real-time structural performance. What this researchinforms is that when dealing with curvilinear surfaces and bespoke typologies,digital designers cannot fall back on standardised and repetitive structural formatsbut must appropriate a novel system such as fractal systems found in nature. In thismindset digital designers become both structural and material-aware innovators.We must learn what nature has already solved, adopting the lessons of thesebranch-like systems to maximise the performance of digital technologies.
Three topics define future work: i. scalability, ii. material optimisationusing multi-functional-graded materials, iii. and multiple extruder heads fornew material blends for novel additive possibilities. While in both case studiesfabrication was thus restricted to individual segmented pieces, opening up moredegrees of freedom and reachability, larger products could be printed at full scale(Lipson, 2013). Future work will eliminate piece-to-piece production and proposea truer replication of digital design and efficient workflow, using a robotic armequipped with a 3D extruder to print the chair as a whole.
AcknowledgementsThe authors of this paper would like to acknowledge the support given for 3Dprinting from the Design, Modelling and Fabrication Lab (DMaF) at the Universityof Sydney School of Architecture, Design and Planning.
ReferencesArdiny, H., Witwicki, S. andMondada, F.: 2015, Are AutonomousMobile Robots Able to Take
Over Construction? A Review, International Journal of Robotics, 4(3), 10-21.von Buelow, P.: 2007, A Geometric Comparison of Branching Structures in Tension and
Compression versus Minimal Paths, Shell and Spatial Structures: Structural Architecture-Towards the future looking to the past, Venice.
Burry, M.: 2002, Rapid Prototyping, CAD/CAM and Human Factors, Automation inConstruction, 11(3), 313-333.
Hernandez, C.: 2006, Thinking Parametric Design: Introducing Parametric Gaudi, DesignStudies, 17(3), 309-324.
Lipson, H. and Kurman, M.: 2013, Fabricated: The New World of 3D Printing, John Wiley &Sons, Somerset.
Lorenzi, G. and Francaviglia, M.: 2010, Art and Mathematics in Antoni Gaudi’s Architecture:“LA SAGRADA FAMILIA”, Journal of Applied Mathematics, 3(1), 133.
Mostafavi, S. and Bier, H.: 2016, Materially Informed Design to Robotic Production: A Robotic3D Printing System for Informed Material Deposition, Robotic Fabrication in Architecture,Art and Design 2016, Sydney, 338-349.
Pye, D.: 2013, America’s Assembly Line, MIT Press, Cambridge.Rian, I., Sassone, M. and Asyama, S.: 2014, Fractal Shell Design Using Iterated Function
System, Proceedings of IASS-SLTE 2014: International Association of Shell and SpatialStructures, Brasilia.
Sherman, L.M.: 2009, Additive Manufacturing: New Capabilities for Rapid Prototypes andProduction Parts, Plastics Technology, 55(3), 35-45.
Strauss, H.: 2013, AM Envelope- The Potential of Additive Manufacturing for FaçadeConstruction, Delft University of Technology, Delft.
Tam, K., Coleman, J., Fine, N. and Mueller, C.: 2016, Robotics-enabled Stress LineAdditiveManufacturing, Robotic Fabrication in Architecture, Art andDesign 2016, Sydney,350-361.

BAMBOO³
FELIX AMTSBERG1 and FELIX RASPALL21Singapore University of Technology and Design, MassachusettsInstitute of [email protected] University of Technology and [email protected]
Abstract. The presented paper discusses the combination of cuttingedge technology (i.e. 3D-pinting) and raw natural grown resources (i.e.bamboo) to develop resource efficient load carrying truss structures inarchitectural scale. Via visual sensing the individual material propertiesof various bamboo poles are analyzed and directly used to inform thedigital model. Comparing load carrying capacity of the bamboo poleand structural requirements of the design, the poles are placed and theconnections designed. Conventional 3D-pinters produce the nodes andconnectors and enable to merge natural and “digital” materiality.
Keywords. Visual sensing; digital fabrication; materialindividuality; 3d-printing; bamboo.
1. Introduction and Research Context1.1. ADDITIVE MANUFACTURING
The digital materialization of art, architectural thoughts and constructionelements has left a remarkable footprint in the discourse of contemporaryarchitecture.Recently 3D-printing technology enabled a significant step: Froma model making device, predominately used for the representation of designconcepts to the production tool of real architectural components.While it is stillmost common to use these tool for thematerialization of concepts quasi a touchable3d-rendering, several researches started to look at additive manufacturing toexceed the model scale and use 3D-printing to construct and fabricate real scalebuilding components. The open house pavilion “V-Mesh” presented at the OpenHouse at Singapore University of Technology combines 3d-printed nylon andmetal nodes with 10mm diameter Aluminum pipes to generate a lightweightspatial grid structure, forming a first pavilion of architectural scale (Raspall andBañón,2016). The 3d-printed steel node by Arup (Shibo and Galjaard 2015)showcases the possibility of material optimization and cost reduction for theproduction of tensile structures. The node design reacts to the force-flow and theadditive manufacturing method distributes the material exactly where it is needed.
T. Fukuda, W. Huang, P. Janssen, K. Crolla, S. Alhadidi (eds.), Learning, Adapting and Prototyping,Proceedings of the 23rd International Conference of the Association for Computer-Aided ArchitecturalDesign Research in Asia (CAADRIA) 2018, Volume 1, 245-254. © 2018 and published by the Associationfor Computer-Aided Architectural Design Research in Asia (CAADRIA) in Hong Kong.

246 F. AMTSBERG AND F. RASPALL
Figure 1. Customized 3D-printed node and the equivalent bamboo pole.
1.2. MATERIAL INDIVIDUAL INFORMATION
The second important recent achievement severing as a foundation for this researchis the implementation of “material individual information” in the fabricationprocess. Sensing devices like cameras, 3d-Scanners or even x-ray enable theusage of visual information and its direct integration in the fabrication process.For example, this information is used in industrial application like saw mills, tolocalize metal scraps enclosed in raw timber logs and protect the cutting toolsor to optimize the cutting sequences. While in this example the output still isthe standardized production of construction wood according a norm, architectsand designers have taken advantage of the accessibility of this information andcreated sophisticated fabrication cycles to propose up-cycling of discarded andscrap material, feedback based production cycles1 or to relate the output of a finaldesign to the specific geometry of the raw material input. The proposed formulais relatively simple but effective:
High congruence of input and output geometry → short fabrication time, lowmaterial waste→ efficiency in production and material
Individual material properties, usually a handicap in mass fabrication, becomean advantage in customization. The project “Bandsawn Bands” for example useda specially shaped timber plank to build a double curved divan (Johns, Foley,2014) and the research team of the Architectural Association even surveyed awhole forest to identify the best fitting tree forks for the load-carrying arch oftheir Woodchip Barn (Self, Vercruysse, 2017).
1.3. BAMBOO
Bamboo is under continuous investigation as a construction material for itsmechanical strength its wide distribution and its renewable property. Among

BAMBOO³ 247
others Vo Trong Nghia Architects, Simon Velez or Shigeru Ban use it multipleand manifold in contemporary architecture, from emergency shelters to big scaledomes, from low cost products to exclusive resorts. The versatility of this materialis as impressive as its structural behavior. It can be used as a pole, a split,it can be cold or heat bent. The high tensile strength of the fiber even leadto researches using it as concrete reinforcement (Hebel, 2014).Nevertheless theindividual properties of each pole are unconsidered. Bundles and redundantstructures are designed, the production and here especially the joining methods,is relying on manual labor.Sometimes even called the “Steel of the 21st century”(Niwa, 2016). by its advocates, bamboo still is an “analog” material almostuntouched by the digital impact in architecture.
1.4. RESEARCH APPROACH
The presented research combines these two concepts of Additive Manufacturingand Material individual Information, 3d printing and visual sensing to a novelapproach: Working with the individual properties of the natural grown materialbamboo. While the Additive Manufacturing references have shown the capacityto react to specific conditions, but were used in the combination of highlyprocessed standard materials Material individual Information has demonstratedthe possibility to react on the individual material capacity, but still processedthe material itself, cutting an milling it into a desired shape. Bamboo isunder investigation in architectural context, material research and contemporaryarchitecture, but has been used labor intensively or as a highly processed material,predominantly. The chosen approach of this research aims to use visual sensingto identify the individual strength of raw unprocessed bamboo. 3D-printingtechnology reacts to the individual geometry and reduces the machining effort ofthe bamboo poles.
2. Workflow Description2.1. CONCEPT DESCRIPTION
The defined research approach uses raw bamboo poles as the bars in a node-barsystem. Forming hollow straight tubes by its nature, bamboo poles appear to bethe ideal base material for trusses and bar-node systems. While the poles serveas the bars, 3D-printed nodes serve as the connectors. Scanning of the bamboosections informs a Grasshopper(C) Script, which customizes the nodes globallyand in detail (Fig. 2).

248 F. AMTSBERG AND F. RASPALL
Figure 2. Workflow Diagram.
The production process can be separated into the following steps:• Generation of the digital model• Structural analysis of the model• Bamboo selection regarding the structural analysis• Cutting to length of the bamboo• Scanning of the sections• Implementing of the scanned geometry in the digital model• “Baking” of the designed node geometry• 3D-priniting of the nodes• Assembly process of the node-bar system
2.2. DIGITAL WORKFLOW IN DETAIL: FORM MATERIAL ANALYSIS TOANALYZED MATERIALIZATION
First the desired geometry is designed and transformed into a polyline geometryconstruable with the designed node-bar system. A self developed Grasshopper(C)script using Karamba(C) analyzes the structure under specific load cases andquantifies the bamboo diameter requested for each bar in the system.
Figure 3. Design, Structural Analysis and Material Selection according the analysis.

BAMBOO³ 249
The bamboo poles fitting the specified criteria are selected and cut to length.They are marked with printed stickers on both ends to to be identified later in theprocess. These stickers are aligned via laser level to guaranty the alignment of bothscans and that way right orientation of the to corresponding nodes, connecting thisand other bars in 3D-space. A transportable flatbed scanner allows a 2D-Scanof the sections on both sides. (Note: Focus was set on 2D-Scanning and thecorresponding connector type for the realization of the first prototypes, due tohandiness of the process. A scanning process using a 3D-scanner attached toan industrial robot was developed and tested as well. This approach enablesto gain the 3D-geometry of a bamboo pole close to the node. A dowel systemincorporating the analysis and implementation of the bamboo diaphragm and thecorresponding dowel is currently under investigation).
Figure 4. 3D and 2D-Scanning of the bamboo geometry.
The image taken by the scanner is uploaded in a script named “bamboleo”(designed and written by Pablo Odorico). This script is use the .jpg of the scansmade, identifies the bamboo section as a tube and vectorizes the image and drawsthe contour curves of the inner and outer edge of the pole. Containing informationlike section area, inner and outer diameter, the contour curves are saved as .dxffiles, processible by the Grasshopper(C) Script. The examples (Fig. 5) show theinner (yellow) and the outer contour curve (purple). Since the bamboo chosen forthis example was green on the outside and beige on the inside, the whole sectionwas colored (blue) to highlight the contrast.
Figure 5. Examples of the determined contour curves using the bamboleo script.

250 F. AMTSBERG AND F. RASPALL
In the next step this .dxf is imported into Rhinoceros(C), which generates theequivalent connector geometry (Fig. 6). The outer socket refers to and covers theouter surface, while the information of the inner surface is used to tailor a dowel.Different variations of the dowel design have been tested . The current focus lieson two versions. The dowel system used in theworkshop (see chapter 3) works likea wooden plug and uses PU-based glue to be fixed. One other dowel functions asa mechanical connection and works without glue. This enables an easy assemblyprocess and more important reversible disassembly process on site.
Figure 6. Mechanical connector 1 (with integrated dowel) and glued connector 2 (withseparated dowel).
In the last step the designed node is “baked” and conventional 3d-printers onPLA base are used to fabricate the nodes and connectors and enable the resourceefficient and versatile bar-node production system (Fig.7).

BAMBOO³ 251
Figure 7. 3D-printing of the nodes.
3. Prototypes3.1. FIRST PROTOTYPE
The first big scale prototype using this technique was designed in a workshop classheld by the authors at Zhejiang University (Fig. 8). The arch presented in thispaper consists of 24 nodes and 37 bars and spans 6,87m with a clearance height of1,85m. Regarding the tight schedule of the class, the node system was split intonodes and connectors. That way the printing of the nodes could be started beforethe bamboo arrived. The 74 connectors where printed separately an plugged intothe nodes. Therefor the connectors were printed with a standard cylinder witha diameter of 30mm on the node side and with a dowel according the scannedbamboo geometry on the bamboo side. The connections between the connectorand the node were fixed using metal bolts, the bamboo poles were glued to theconnector using a PU based glue.
Figure 8. First big scale prototype.
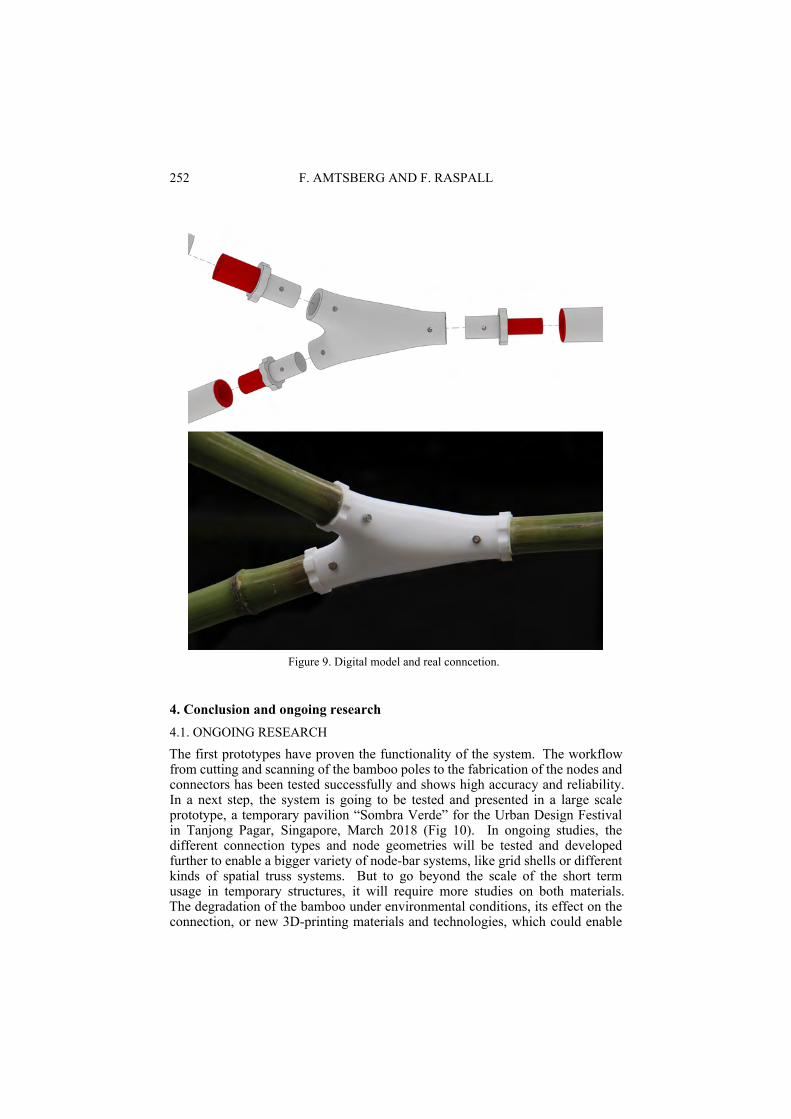
252 F. AMTSBERG AND F. RASPALL
Figure 9. Digital model and real conncetion.
4. Conclusion and ongoing research4.1. ONGOING RESEARCH
The first prototypes have proven the functionality of the system. The workflowfrom cutting and scanning of the bamboo poles to the fabrication of the nodes andconnectors has been tested successfully and shows high accuracy and reliability.In a next step, the system is going to be tested and presented in a large scaleprototype, a temporary pavilion “Sombra Verde” for the Urban Design Festivalin Tanjong Pagar, Singapore, March 2018 (Fig 10). In ongoing studies, thedifferent connection types and node geometries will be tested and developedfurther to enable a bigger variety of node-bar systems, like grid shells or differentkinds of spatial truss systems. But to go beyond the scale of the short termusage in temporary structures, it will require more studies on both materials.The degradation of the bamboo under environmental conditions, its effect on theconnection, or new 3D-printing materials and technologies, which could enable

BAMBOO³ 253
new connection details or concepts.
Figure 10. Sombra Verde– An urban shelter for Tanjong Pagar.
4.2. RESUME
Nevertheless, the information gained via visual sensing shows the capacity tobridge the gap between the former unknown individuality of this constructionmaterial and to combine it with the versatile and adaptable fabrication strategyof 3D-printing. The presented application tailors each connector of this bar-nodesystem and provides individual solutions able to react on design intentions,material accessibility or structural performance among other things.The approachpresented with this project, integrates individual material information in smart,adaptive and resource efficient digital fabrication processes. That way it opensup new ways of design thinking beyond the project boundaries and sets a generalstatement to rethink future design and fabrication strategies end enrich them within-detail analysis of material individuality.
4.3. ACKNOWLEDGMENTS
The script “bamboleo” used to identify the section geometry of the bamboo poleswas written by Pablo Odorico. The first prototype “Nautilus” presented in thispaper was designed by the students Li Jiaji, Hu Yuxin, Yang Yue, Huang Jiawen,Lan Zhiyu and Huang Jianan, during the workshop class “bamboo in formation”held by the authors. The workshop was held in collaboration with Prof. JiangHao, International Desing Center, Zhejiang University. The Pavilion “Youzhisan- An urban shelter for Tanjong Pagar” is designed planned and build by AIRLab

254 F. AMTSBERG AND F. RASPALL
Architectural Intelligence Research Laboratory, by Felix Amtsberg, Carlos Bañónand Felix Raspall.
ReferencesAmtsberg, F., Raspall, F. and Trummer, A.: 2015, Digital-Material Feedback in Architectural
Design, CAADRIA 2015, Daegu.Hebel, D. E.: 2014, Process-controlled optimization of the tensile strength of bamboo fiber
composites for structural applications, Composites Part B: Engineering, 67, 125-131.Johns, R.L. and Foley, N.: 2014, Bandsawn Bands: feature-Based Design and Fabrication of
Nested Freeform Surfaces in Wood, Robotic Fabrication in Architecture, Art and Design2014, Ann Arbour, 17-32.
Niwa, T. 2016, The Steel of the 21st Century: Bamboo, in A.D. Editorial Team (ed.),Architecture and Urbanism 550, A+U Architecture + Urbanism.
Raspall, F. and Bañón, C.: 2016, vMESH: How to print Architecture?, Blucher DesignProceedings 3.1 2016, 394-398.
Ren, S. and Galjaard, S.: 2015, Topology optimisation for steel structural design with additivemanufacturing, Modelling Behaviour: Design Modelling Symposium 2015, Copenhagen ,35-44.
Self, M. and Vercruysse, M.: 2017, Infinite variations, radical strategies, Fabricate, Stuttgart,30-35.

ADAPTIVE CONTROL SYSTEM FOR SMART DYNAMIC CASTING
Defining Fabrication-Informed Design Tools and Process Parameters in DigitalFabrication Processes
FABIO SCOTTO1, ENA LLORET FRITSCHI2,FABIO GRAMAZIO3, MATTHIAS KOHLER4 andROBERT J. FLATT51,2,3,4Institute of Technology in Architecture, Department ofArchitecture, ETH Zurich1,2,3,4{scotto|lloret|gramazio|kohler}@arch.ethz.ch5Institute of Building Materials, ETH [email protected]
Abstract. This paper describes the process control system and thefabrication-informed design tool developed for Smart Dynamic Casting(SDC) - the innovative technique that merges the process of slipformingwith robotic fabrication technologies to enable greater geometricalfreedom in the production of architectural components made of concrete.The paper focuses on the process parameters that characterizes theproduction workflow and it outlines the system-specific geometryrationalization algorithm developed for the definition of feasiblegeometries. Furthermore, the paper introduces the first applicationof the SDC design tool within the architectural context of the DFABHOUSE, a building project realized entirely by robotic and digitaltechnologies.
Keywords. Digital fabrication; Smart Dynamic Casting; ControlSystem; Design tool.
1. IntroductionThe rapid development in computer-aided design and manufacturing (CAD/CAM)of the last decades has revitalized the design and fabrication of complexarchitectural structures. Several pioneering projects have focused on linkingthe design and production processes by exploiting digital fabrication techniquesand applying them to architecture and construction. (Gerber and Pantazis2016) (Willmann, et al. 2013). These processes are controlled through theimplementation of computational tools that generally neglect the properties ofthe chosen material system (Picon 2010) and consequently, lead to architecturaldesigns that are often difficult to fabricate and therefore costly to build (Howe2013).
In regards to concrete construction, research institutions and buildingindustries have been addressing the challenges of bridging the discipline of
T. Fukuda, W. Huang, P. Janssen, K. Crolla, S. Alhadidi (eds.), Learning, Adapting and Prototyping,Proceedings of the 23rd International Conference of the Association for Computer-Aided ArchitecturalDesign Research in Asia (CAADRIA) 2018, Volume 1, 255-264. © 2018 and published by the Associationfor Computer-Aided Architectural Design Research in Asia (CAADRIA) in Hong Kong.

256 F. SCOTTO ET AL.
computational design to digital fabrication for the production of bespoke concretestructures (Martins and Sousa 2014). The major focus in recent years has beenon Contour Crafting, a layer based concrete extrusion technique that combineslayer deposition methods with the extrusion of cementitious materials (Khohnevis,D. and Yao 2006) (Lim, et al. 2012). The layer-by-layer process requires thebottom layer to be strong enough to carry the weight of the upper layers and,at the same time, to be soft enough to ensure the bonding between individuallayers (Wangler, et al. 2016). In addition, the full integration of a reinforcementsystem with this technique is still at its early stages. For both of these reasons theconstruction of 3D-printed architectural structures still requires extensive manualpost-processing to comply with the structural requirements of building norms(Lund-Nielsen 2017).
Smart Dynamic Casting (SDC) utilizes the well-known construction techniqueknown as slipforming, traditionally applied for the fabrication of large scaleon-site constructions of silos and high-rise buildings (R. G. Batterham 1980).By implementing an adaptive formwork system and a sophisticated approach tothe use of admixtures in concrete processing, SDC enables the production ofbespoke concrete elements (reinforced structural columns and façade mullions)that eliminates the need for labor-intensive and expensive non-standard formworksystems. In this process a formwork, considerably smaller than the structureproduced, moves vertically while being filled with concrete at a velocity set tomatch the hydration rate of the concrete. The material inside the formwork isshaped by a dynamically controlled mechanical actuation system that enables thefabrication of vertical reinforced concrete elements with significant cross sectionalchange (Schraner, Sigrist and Brasey 2016). The potential of SDC in producing1:1 architectural structures is demonstrated in its first architectural application:the production of interior façade mullions for the DFAB HOUSE (NCCR DigitalFabrication 2017) (Empa 2017). A project that highlights the potential of digitaland robotic fabrication technologies and it links it to the exploration of newpossibilities in architectures.
Figure 1. Left:NEST building at Empa; Right: DFAB HOUSE technologies description.
The paper introduces the SDC production setup and outlines the processparameters and their interdependence in the fabrication workflow. Furthermore,the paper links those parameters to the developed process control system, with

ADAPTIVE CONTROL SYSTEM FOR SMART DYNAMIC CASTING 257
detailed analysis of the functionalities of its modules.
2. Fabrication SetupThe SDC fabrication setup relies on a control system to synchronize all majorfabrication procedures. It centralizes all main operations to enable a stableproduction while providing continuous feedback on the properties of the concreteduring the fabrication process. The schematic representation in Figure 2 showsthe procedural workflow of the SDC production.
Figure 2. Diagrammatic representation of SDC fabrication setup.
Prior to initiating the fabrication procedure, a large batch of concrete isprepared and retarded to delay the hydration process (a). A custom softwaresystem (b) controls the pumping of small batches of concrete and accelerators(c) into a mixer (d) placed right above the formwork (e). In the mixer thematerial transforms gradually into a self-compacting concrete - that flows into theformwork in specific time intervals. The intervals are defined by the softwarethat synchronizes the vertical movement of the formwork with the pumping rate.By doing this, the height of concrete inside the formwork is kept constant toensure a continuous casting process. An inline feedback system (f) has beendeveloped to monitor the material properties at the formwork exit point and toadjust accordingly, the vertical speed and pumping rate (E. Lloret-Fritschi, L.Reiter, et al. 2017).
In this setup, the formwork is built up following the concept of ‘global shaping’

258 F. SCOTTO ET AL.
(Lloret-Fritschi, Reiter, et al. 2017) in which the material is shaped along the entireheight of the formwork by themeans ofmultiple actuators that are spaced verticallyat defined distances (see Figure 6). The range of movement of the actuatorsalong with the shapability of the material determine the main design constraintsintegrated in the digital design tool presented in this paper.
Analysis on previous prototypes revealed that the weight load of the concreteat the formwork exit point is greater when the cross-sectional area is continuouslyincreased (E. Lloret-Fritschi, L. Reiter, et al. 2017). Thus, the design tool mustprovide geometrical solutions that are developed within the constraints providedby the formwork setup and the material properties.
3. Fabrication Parameters and Process ControlThe SDC fabrication process control system ensures that the slipping procedureis executed in a time range in which the material fulfill the following conditions.The retarded material must be self-compacting when pumped into the formwork,it should be shapable while inside the formwork and, moreover, it should reachenough strength at the formwork exit to sustain its own weight and the weightof the material inside the formwork. The synchronization of those properties is afundamental operation of the SDC process and three main fabrication parametershave been identified to define the fabrication control system. Those parameters areexemplified in Figure 3 and are defined as follows: the rate at which the concreteis pumped inside the formwork (P), the vertical speed with which the formworkis moved upwards (V) and the horizontal positioning (H) of the shaping actuatorsalong the fabrication paths (Figure 3).
Figure 3. Diagrammatic representation of the fabrication parameters defined for the SDCcontrol system.

ADAPTIVE CONTROL SYSTEM FOR SMART DYNAMIC CASTING 259
The interactions of those parameters have been regulated within the controlsystem specifically designed for the SDC fabrication process, defined here as‘Process Control System’ (PCS). The following paragraph will introduce theprocedural logic of the PCS and it will describe the characteristics of the modulesthat constitutes it.
3.1. PROCESS CONTROL SYSTEM (PCS)
The PCS is characterized by three consequential modules and its workflow isrepresented in the flowchart in Figure 4. The first is the ‘Input ParametersAnalysis’ (IPA) module, in which the input variables are defined and evaluated.The IPA is then followed by the ‘Sync Module’ (SM) which configuresand initiates the actuation and pumping operations and synchronizes all theprocess parameters before initiating the fabrication procedure. And finally, the‘Fabrication Processing Module’ (FPM) that is designed to provide control andfeedback during the fabrication process.
Figure 4. Flowchart diagram representing the SDC Process Control System.

260 F. SCOTTO ET AL.
3.1.1. Input Parameters Analysis (IPA)The IPA module requires three main user-defined parameters that are specifiedas Geometry Input, System Settings and Material Settings. The Geometry Inputexpects a curve geometry that is used as fabrication path for the shaping process.In order to rationalize the input curve into a feasible SDC fabrication path, asub-process has been developed to optimize the input geometry to fit with thefabrication constraints of the system. The process is referred as ‘GeometryOptimization Algorithm’ (GOA) and it procedural operations are described indetails in paragraph 4. In the System Settings, the program collects information onthe pumps‘ flowrates and the formwork parameters. The pumps’ flowrates refersto the settings of the swing and peristaltic pumps, respectively used for preciselydosing the amounts of concrete and accelerator that are systematically pumpedthrough the equipment. The formwork parameters are used to calculate the amountof concrete pumped inside the formwork. The depth and height of the formworkare fixed parameters, whereas the length value is variable and dependent on thegeometry to execute. The Material Settings of the IPA module refers to the totalmass of concrete and accelerator used in the fabrication process and they are usedto calculate the volume of each respective component for every pump cycle.
3.1.2. Sync Module (SM)The SM executes the synchronization routine needed to proceed into thefabrication operations. The module requires two main procedures. The first drivesthe vertical axis and the horizontal actuators to the start position. The secondinitializes the mixing of small amounts of concrete and accelerator to provide ahomogenous material for the casting process.
The synchronization operation consists in linking the user-defined speedparameter to the coordinates of the vertical axis and, consequentially, to theposition in time of the actuators along the fabrication path. The diagram inFigure 5a, depicts the setup configuration at the start position, prior initiatingthe fabrication process. In this state, the time value t is equal to zero since itrefers to the production time. After providing the driving speed and initiatingthe fabrication process, the position of each actuator is linked with the verticalcoordinate of the formwork, by extracting their correlated horizontal values onthe fabrication path. The position of the actuators along the fabrication path isupdated once a second and Figure 5b depicts their configuration after 60 minutesof production with a constant vertical speed of 12mm/minute.
In addition to the actuation control, the vertical speed is also used tosynchronize the rate with which the concrete is pumped inside the formwork. Byreading the position of the actuators, the system constantly calculates the volumeof concrete needed inside the formwork and adjust the intervals between the fillingcycles to match with the provided vertical and filling speed. It increases the lengthof those intervals for smaller cross-sections and, on the contrary, it reduces themto fill concrete in larger cross-sections.

ADAPTIVE CONTROL SYSTEM FOR SMART DYNAMIC CASTING 261
Figure 5. The diagram show the synchronization of the horizontal actuators along thefabrication path. On the left, their positions at the start; On the right, their position on the
fabrication path after one hour of production time.
3.1.3. Fabrication Processing Module (FPM)After finalizing the synchronization procedure, the real time fabrication controlis executed through the ‘Fabrication Processing Module’ (FPM). While theformwork is at its start position, accelerated concrete is pumped into the formworkin specified intervals, which are defined by the hydration rate of the concrete.A laser sensor above the formwork monitors the height of the material insidethe formwork and, when the maximum height is reached the process starts ata speed defined by the user. After starting the slipping procedure, the FPMevaluates the vertical speed and pumping rate at every second in order to generateappropriate filling cycles that fulfill the requirements provided. Additionally, theinline feedback system evaluates the hydrostatic pressure inside the formworkduring the fabrication process and provides data that can be used by the FPMto adjust the production parameters while running (Lloret-Fritschi, Reiter, et al.2017) .
4. Geometry Optimization Algorithm (GOA)The GOA is a sub-process of the above mentioned IPA (paragraph 3.1.1) and itis designed to evaluate the geometrical suitability of an input curve in respectto the constraints of the fabrication setup. The range of feasible geometries forthe SDC process is highly dependent on the limitations given by the flexibleformwork and the properties of the processed material. Although the full scaleexperiments allowed to define the specific geometrical constraints provided by

262 F. SCOTTO ET AL.
the material system, this section will only focus on the analysis of the constraintsof the formwork system. The ‘global shaping’ operation is executed by 4 actuators,placed vertically at a distance d of 100 mm and a flexible metal strip to which theactuator are connected to.
The geometries supported by the formwork system have been validatedthrough a set of experiments that allowed to evaluate the maximum bendingproperties of the flexible strip attached to the actuators. This was done by movingeach actuator individually and defining the minimum and maximum values for themovement range. The outcome of this analysis led to the definition of a horizontaldisplacement (∆x), which refers to the range of motion each actuators can executewhile connected to the shaping strip (Figure 6).
Figure 6. Diagram showing the horizontal displacement relative to actuator 3.
The horizontal displacement is later used in the geometry optimization processfor the evaluation of the input geometry. The geometry is user-defined and it isrepresented as a two-dimensional curve. The initial phase of the GOA focuses onconstraining the input curve geometry to a perpendicular YZ plane and matchesits direction to the direction of the slipping process (Figure 7).
Figure 7. Diagram showing the optimization operations executed within the ‘GeometryOptimization Algorithm’.
The curve is then divided in n number of points that are vertically spaced with adistance equal to d, the distance between each actuators. They are compiled into an

ADAPTIVE CONTROL SYSTEM FOR SMART DYNAMIC CASTING 263
array and sorted by their vertical position. The iterative operation of the algorithmis based on the analysis of the horizontal displacement value (∆ix) of each of thepoints, retrieved by subtracting the coordinate of a point along the horizontal x axis(pix) and the x coordinate value of the point that precedes it in the array (pi−1x).The displacement parameter of each point is expressed as follow:
∆ix = pix− pi−1x (1)The initial empirical analysis of the physical properties of the shaping metal stripand its effect on the range of movement of the actuators, enabled to define a fixedhorizontal displacement equal to amaximum of 30mm in each direction (Figure 7).Therefore the horizontal displacement of each point (∆ix) must fulfill the followcondition:
−30mm < ix < 30mm (2)The algorithm computes the horizontal displacement for each of the points in thearray and it evaluates it against the above mentioned condition. If the conditionis not fulfilled, the point and its displacement value are used as parameters for thesuccessive phase of the algorithm. In this next step, the algorithm intervenes onthe position of the given point in order to optimize its displacement value to fitwithin the given range. The direction of the movement vector is identified withthe displacement value and its amplitude calculate as shown in Figure 7. Once allthe points in the array are analyzed and the appropriate modifications are applied,the points are interpolated to generate the optimized curve geometry that is usedas fabrication path for the shaping process.
The first applications of the design tool focused on understanding thegeometrical limitations indicated by the physical prototypes. These observationsled to a series of revisions of the design tool in order to provide geometricalsolutions that are more tailored to the fabrication system.
5. Conclusions and OutlookThe geometry optimization algorithm and production processing logic presentedin this paper, illustrates the advances of the SDC technology towards thedevelopment of an adaptive fabrication control system. The observed setof constrains (provided by the material and formwork system) informed theimplementation of a specific design framework which allows for the fabricationof geometries that reflects the characteristics of the fabrication process.
The evaluation operations (geometry optimization, sensor reading) have notbeen implemented in the fabrication program and are still executed externallyby the process control system. Thus, strategies to integrate those functionalitieswithin the SDC computational tools are part of ongoing research and they aredeveloped with the aim of achieving a fully adaptive process. By embedding asystem-specific feedback process, the control system would provide an automatedinteraction between the process and its production parameters. A further topic ofresearch is to define machine learning algorithms to provide prediction on materialbehavior during the fabrication procedure and provide unsupervised control of thefabrication process.

264 F. SCOTTO ET AL.
AcknowledgementsThe authors thank the following colleagues for enriching discussions, exchangesand collaboration on the topic of digital fabrication with concrete. In particular:Lex Reiter, TimothyWangler, Andreas Reusser, Heinz Richner, Marc Schultheiss,Konrad Graser, Lukas Fuhrimann, and finally to Lukas Sigrist, Tobias Schranerand Pierre Antoine Brasey for the initial work on the global shaping formwork.This research was supported by the NCCRDigital Fabrication, funded by theSwiss National Science Foundation. (NCCR Digital Fabrication, Agreement51NF40-141853).
ReferencesBatterham, R. G.: 1980, Slipform Concrete, The Construction press, New York.EMPA, initials missing: 2017, “DFAB HOUSE - Digital Fabrication and Living” . Available
from <https://www.empa.ch/web/nest/digital-fabrication> (accessed 19th December 2017).NCCR Digital Fabrication, initials missing: 2017, “DFAB HOUSE” . Available from <http://d
fabhouse.ch/> (accessed 19th Decemebr 2017).Gerber, D. J. and Pantazis, E.: 2016, A Multi-Agent System for Facade Design: A
design methodology for Design Exploration, Analysis and Simulated Robotic Fabrication,Proceedings of the 36th Annual Conference of the Association for Computer Aided Designin Architecture (ACADIA), Ann Arbor, Michigan, 12 -23.
Gramazio, F. and Kohler, M.: 2008, Digital Materiality, Müller Verlag.Howe, N.: 2013, FluidScape: Research in Parametric Concrete Formwork, Proceedings of the
17th Conference of the Iberoamerican Society of Digital Graphics (SiGraDi), Valparaíso,Chile, 405-409.
Khohnevis, B., Hwang, D. and Yao, K.T.: 2006, Mega Scale Fabrication by Contour Crafting,International Journal of Industrial and system Engineering, 1, 301-320.
Lim, S., Buswell, R.A., Le, T.T., Austin, S.A., Gib, A.G.F. and Thorpe, T.: 2012, Developmentsin construction-scale additive manufacturing processes, Automation in Construction, 21,262-268.
Lloret-Fritschi, E.: 2016, Smart Dynamic Casting: A digital fabrication method fornon-standard concrte structures, Ph.D. Thesis, ETH Zurich.
Lloret-Fritschi, E., Reiter, L., Wangler, T., Gramazio, F., Kohler, M. and Flatt, R.J.: 2017, SmartDynamic Casting: Slipforming with Flexible Formwork - Inline Measurement and Control,Second Concrete Innovation Conference (2nd CIC), Tromsø.
Lund-Nielsen, H.: 2017, “3D Printhuset” . Available from <https://3dprinthuset.dk/wp-content/uploads/2017/09/press-release-3dph-3d-printuset-has-begun-the-construction-of-europes-first-3d-printed-building-in-copenhagen.compressed.pdf>.
Martins, P. F. and Sousa, J. P.: 2014, Digital Fabrication Technology in Concrete Architecture,Proceedings of the 32nd International Conference on Education and Research in ComputerAided Architectural Design in Europe, Newcastle upon Tyne, UK: Northumbria Universit,475-484..
Picon, A.: 2010, Architecture and the Virtual: Towards a New Materiality, PrincetonArchitectural Press.
Schraner, T., Sigrist, L. and Brasey, P.A.: 2016, Smart Dynamic Casting: Investigating theProcess Constraints, Master’s Thesis, ETH Zurich.
Wangler, T., Lloret, E., Reiter, L., Hack, N., Gramazio, F., Kohler, M., Bernhard, M.,Dillenburger, B., Buchli, J., Roussel, N. and Flatt, R.: 2016, Digital Concrete: Opportunitiesand Challenges, RILEM Technical Letters, 1, 67-75.
Willmann, J., Gramazio, F., Kohler, M. and Langeberg, S.: 2013, The Digitalisation ofMateriality, Springer.

Digital Fabrication andConstruction

266

DIGITAL FORM-FINDING AND FABRICATION OF STRAINEDGRIDSHELLS WITH COMPLEX GEOMETRIES
PHILIP F. YUAN1, HUA CHAI2 and JINXI JIN31,2,3Tongji University1,2,3{philipyuan007|chaihua|jinjess}@tongji.edu.cn
Abstract. Strained gridshells has been one of the most efficientstructure system to cover large spans by lightweight construction.Nevertheless, gridshells structure has been seldom used due to thedifficulties in gridshells form-finding and erection, as well as itslimitation of morphological possibilities. In this regard, this paperaims to provide an integrated design and fabrication approach forextending the application of strained gridshells into the field of complexgeometries. First, a form-finding method for complex gridshellsdesign was put forward and tested taking Enneper surface as examples;secondly, the form-finding result was further developed into a gridshellssystem consisting of continuous laths, rotatable joints and rigid edgebeams, which were optimized afterwards based on the structuralsimulation result with Finite Element Analysis. Third, the constructiondifficulties of this system were fully addressed in the robotic fabricationand erection process of a full scale prototype. This research tries tofully combine the structural characteristics of the strained gridshell withdigital fabrication technologies to extend the application of strainedgridshells into structures with more complex geometries.
Keywords. Strained Gridshell; Computational Form-finding;Structural Optimization; Robotic Fabrication.
1. IntroductionBrought forward by Frei Otto, strained gridshell is known as one of the mostefficient structure to cover large spans with lightweight materials, which isconstructed from an equal mesh net of continuous timber laths bent into theplanned shape (Lienhard et al. 2012). Strained gridshell, as opposed to the‘unstrained’ gridshell which is stress-free in the initial curved state (Adriaenssenset al. 2014), gains its strength and stiffness through the bending action in its doublecurvature configuration (Pone et al. 2013).
Nevertheless, strained gridshell structure has been seldom used since thesuccessful construction of the Multihalle Mannheim in the 1970s. The JapanPavilion for Expo 2000, theWeald and Downland Open Air Museum built in 2002(Kelly et al. 2001) and the Savill Garden in Windsor Great Park built in 2006(Harris et al. 2008) are rare practices of large-scale gridshells during the last 40years. This situation can be attributed to the difficulties of several aspects, among
T. Fukuda, W. Huang, P. Janssen, K. Crolla, S. Alhadidi (eds.), Learning, Adapting and Prototyping,Proceedings of the 23rd International Conference of the Association for Computer-Aided ArchitecturalDesign Research in Asia (CAADRIA) 2018, Volume 1, 267-276. © 2018 and published by the Associationfor Computer-Aided Architectural Design Research in Asia (CAADRIA) in Hong Kong.

268 P.F. YUAN, H. CHAI AND J. JIN
which design method is the most important one. To address the difficulties ingridshell design, which should simulate the bending construction process,severalresearches have been conducted to improve the efficiency of the design approaches,which include the development of Modified Dynamic Relaxation algorithm forform-finding with DoF (degree of freedom) varying from 3 to 6 (Peloux 2015,D’Amico,2014), the optimization of cross sections through a numerical method(D’Amico,2015), and the employment of composite materials (Baverel 2012).
However, one challenge that still remains in the designing process is therange of obtainable forms, which is not unlimited but strictly constrained bymaterials properties and grid patterns (Pone et al. 2013). It turns out to bealmost impossible to fit a flat grid to complex geometries like Enneper minimalsurface, in the way that traditional gridshells are erected. When trying to extendthe range of obtainable forms to organic shapes or complex geometries, findingan appropriate grid pattern that is compatible with the material properties, is themost crucial issue. Several attempts have been made to apply the principles ofstrained gridshells to free forms. The Smart Geometry 2012 gridshell (2017) wasbuilt using only straight wood members bent along geodesic lines on a relaxedsurface(see Figure1 left). The Ongreening Pavilion designed and constructedby Ramboll Computational Design (RCD) in 2013 (see Figure1 right) adopted amuch more complex grid pattern, which was realized by bending each individuallath sequentially (Harding 2015). All experiments explored complex gridshellsat the cost of requiring a more complex fabrication and assembly. But theinconvenience of a complex fabrication process was well balanced by digitalfabrication technologies.
Figure 1. The SmartGeometry 2012 gridshell (left, photo © matsysdesign) and the OngreeningPavilion (right, photo © Ramboll).
In this context, this paper aims to introduce another solution for the design andoptimization of the grid pattern on complex gridshells. To validate the methodsproposed, an integrated design and fabrication process of a full scale strainedtimber gridshell will be presented (see Figure 2).

DIGITAL FORM-FINDING AND FABRICATION OF STRAINEDGRIDSHELLS WITH COMPLEX GEOMETRIES
269
Figure 2. the research project workflow.
2. MethodA minimal surface structure was required to be built for DigitalFUTURE 2017events. Taking Enneper surface as prototype, this research mainly focused on thedesign and fabrication method of Enneper surface-shape gridshells.
In this section the integrated design and fabricationmethod for Enneper surfacewill be described in four parts. In section 2.1 and 2.2, the form-finding andoptimization method of grid patterns with grasshopper-based plug-ins Millipedeand Kangaroo is introduced. In section 2.3, structural simulation and optimizationmethod with grasshopper-based plug-in Karamba is described. In section2.4, different digital fabrication approaches are introduced to process differentcomponents of the gridshell system.
2.1. GRID PATTERN GENERATION
The arrangement of grid patterns on the designed surfaces is a key issueconcerning the design of gridshell structure. Besides the limitation by thebending performance of materials, the obtainable form of traditional gridshellsform-finding method - simulation of the bending process - is strictly limited bythe initial flat grids. Only a limit number of surfaces can be fitted with flatgrids. Instead of using a flat grid at the first place, the form-finding methodproposed in this research is to generate a quadrilateral grid pattern directly onthe designed complex surface. The grid pattern will be optimized afterward tomeet the limitation of material performance by simulating the bending action inthe computer.
There are many ways to create a quadrilateral grid on the surface, such asisocurves, principal curvature lines, asymptotic lines, geodesic lines, principalstress lines. The generation methods of the grid patterns varied from one surfacetype to another, and it is important to adopt the appropriate method for differentgeometries. For example, extracting isocurves from designed surface is themost common idea to create a quadrilateral pattern on the surface, but obviouslyisocurves of a Enneper surface can’t be used as grid patterns as part of them areclosed curves and others are intersect at the centre point(see Figure 3).

270 P.F. YUAN, H. CHAI AND J. JIN
Figure 3. Isocurves of Enneper Surface.
In order to avoid circular curves, this research tried to use principal curvaturelines as the initial grid pattern for the Enneper surface-shape structure. The initialform was a parameter-defined Enneper surface, which was subsequently wentthrough some simple operation to meet the design requirements, such as verticallyscaled and an central opening. The Principal curvature lines were generatedon the surface using Grasshopper-based plugin Millipede. A set of SurfaceReparameterization tools that is built into Millipede could create nearly conformalmaps following some input vector field that determines directionality. Firstly theprincipal curvature of the designed surface was calculated in grasshopper so as todefine the parameterization field in Millipede. Then a network of curves alignedto the field were extracted with the Reparameterization Outputs components ofMillipede. The density of the output curves can be controlled by manuallyadjusting the scaling factor, which allowed designer to choose themost appropriatecurves density. After reconstructing, the resulting grid pattern was a relativelyuniform, orthogonal grid (see Figure 4).
Figure 4. the generation of the principal curvature lines on the designed surface.
2.2. GRID PATTERN OPTIMIZATION
As the resulting curves may have problems like excessive curvatures, they couldhardly be used directly as the grid pattern for gridshells and built with timber.Further measures were taken to optimize the curves. The most important objectiveof optimization was to reduce the curvature of the curves. Therefore, a hypothesiswas put forward that, the curvature and complexity can be reduced effectively ifan appropriate bending force was applied to the grid in computer.
The Live Physics engine of Kangaroo played a significant role in this stage.

DIGITAL FORM-FINDING AND FABRICATION OF STRAINEDGRIDSHELLS WITH COMPLEX GEOMETRIES
271
Each continuous curve was considered as one timber lath in the strained gridshell.Starting with the unstrained curves, a certain amount of bending force was appliedto the continuous curves in kangaroo. At the same time, a few other constraintswere also applied to the curves to keep the curves on the surface throughout theoptimization. Therefore the curves were allowed to move freely on the surfaceunder bending action. Once the simulation was started, the curvature tended todecrease with the increase of the bending force. The interaction between curveswill cause the whole grid to slide on the surface, so that the overall shape will beoptimized simultaneously (see Figure 5).
Figure 5. the optimization process of the grid pattern.
Since the optimization criterion was that the curvature of each curve need tobe smaller than the maximum curvature allowed by the material, the maximumcurvature of the materials that will be used to construct the large scale prototype- plywood plate with a thickness of 5mm - was roughly measured by bendingseveral sample pieces of 100mm*1000mm(see figure 6). The ratio between theheight of the arch and the initial length was used to quantify the material’s abilityof bending, which is was about 0.34 in this case. This ratio was reduced from0.416 to 0.151 after optimization. Therefore this optimization greatly reduced theoverall curvature (see figure 7), thus effectively reduce the difficulties of assemblyprocess.
Figure 6. manually testing of material’s bending capability.

272 P.F. YUAN, H. CHAI AND J. JIN
Figure 7. the curvature of the laths was greatly reduced.
However, as the grid pattern was optimized as curves instead of surfaces, it isworth noting that torsion was not considered in this case. This was a simplificationon one hand, but on the other hand this approach will increase the overall stiffnessof the structure as torsion action would add more pre-stress into the structure.
2.3. STRUCTURAL OPTIMIZATION
Since this method intended to integrate gridshells and digital fabricationtechniques, each component in this structural system does not necessarily needto have consistent cross-section. Therefore, after the detailed gridshell systemwas developed, this research further optimized the cross-section of the structure toimprove utilization efficiency of materials.
Following the structural system of traditional gridshells, this structure consistsof three parts: rigid edge beam, continuous laths and rotatable joints. The edgebeam took rigid Glued-Laminated Timber as material to resist bending action ofthe shell. Using 5mm plywood plate laths as the material, the laths employedthe double-layer system developed by Frei Otto. As for the joints between laths,instead of using tradition joints, this research invented a mortise and tenon jointsystem following the same principle, which was much convenient to install andremove, and thus more suitable for this experimental project (see Figure 8).
Figure 8. the double layer laths system and joints design.
The gridshell was optimized afterwards based on FEA (Finite ElementAnalysis). An analysis model was built in Karamba (see Figure 9). Taking digitalmodel and material properties of different components as input, the analysis model

DIGITAL FORM-FINDING AND FABRICATION OF STRAINEDGRIDSHELLS WITH COMPLEX GEOMETRIES
273
could simulate the structural performance of the gridshell system under differentloads and boundary conditions, and at the same time, output the performanceparameter values corresponding to the geometric model, which can used to guidethe geometric optimization. Both the cross-sections of laths and edge beam wereoptimized according to the material utilization efficiency. As the bending actioncould hardly be simulated directly in Karamba, bending action was considered toas pretension stress applied to the laths beforehand.
Figure 9. Structural simulation and optimization process with Karamba.
Besides gradient graphs,the simulation results were also output in the formof parameter values correspondence with the geometric components one-to-one.The efficiency of material utilization was used as the parameter to determinethe cross-sections. Larger cross-sections were used where material utilizationefficiency was high and smaller cross-sections where efficiency was low. Theinitial cross section of edge beam was 80mm*100mm, while the width of lathswas 70mm. After the optimization, the cross-sectional dimensions varied withmaterial utilization efficiency, which of edge beam varied between 60mm*90mmand 90mm*120mm, and that of laths varied between 40mm and 90mm. Theoptimization process enhanced the structure performance of gridshell by creatinga direct connection between form and inner forces(see figure 10).
Figure 10. the Gridshell system after optimization: Edge beam (left); Laths (middle); theGridshell Structure (right).

274 P.F. YUAN, H. CHAI AND J. JIN
2.4. DIGITAL FABRICATION AND ASSEMBLY
The resulting complexities of the gridshell were fully addressed in the fabricationand erection process of a large scale gridshell structure. Different digitalfabrication methods were explored in the fabrication of different parts.
The laths were straightened onto a plane with all the information retained,such as the location of joints and the width of the laths. Then the straight lathswere subdivided into segments which can easily fit into the plywood boards of1220mm*2440mm, and milled with CNC (see Figure11). The milling of 38plywood boards were completed in 2 days.
Figure 11. the laths were straightened on to the plywood boards and milled by CNC.
The fabrication of spatial curved edge beam which was made of GLT (GlueLaminated Timber) was the main challenge of this stage. Currently, whileplane curved GLT could be easily produced in the factory, there were still noefficient solutions for spatial curved GLT production. Robotic timber wire-cuttingtechnique, whose capacity was tested in the previous research project(Yuan andChai 2017),was employed in this project to deal with the spatial curved edge beam.A modified 14-inch bandsaw was mounted on a robust Kuka R2700 robot, tocut the beam segments out from prefabricated simple ones. The edge beam wasdivided into 12 segments according to the machine range. Each segment was cutfrom the planar one through 6 cuts with the robotic bandsaw (see Figure 12). Thespeed of the cutting process was about 3-6m per hour. The entire cutting processtook about 10 days in total. The perfect matching between segments proved theaccuracy of this technique.
As the edge beams and laths are all fully informed, the on-site assemblyprocess of the large scale structure was quite simple and efficient. First of all12 edge beam segment were connected with bolts and erected in place. Thenlaths were assembled one by one in a similar way of weaving. As long asthe double-layer laths were placed in the correct order, ordinary workers couldassemble the structure. The entire assembly work was done in a joint effort of onedesigner and four workers, which took less than 20 hours (see Figure 13).

DIGITAL FORM-FINDING AND FABRICATION OF STRAINEDGRIDSHELLS WITH COMPLEX GEOMETRIES
275
Figure 12. the edge beams were cutted from planner beams with robotic bandsaw.
Figure 13. the assemble process.
3. Results and discussionWith a height up to 6m, the large scale structure demonstrates the feasibilityand efficiency of the design and fabrication methods proposed in this paper (seeFigure14).
Figure 14. the large scale research pavilion.
Although some advantages of gridshells are lost in this method, the mostimportant merit of gridshells–the form-resistant mechanism imparted by thebending of the timbers is retained. Not only the complexities can be balancedby the novel robotic technology, more importantly, this method demonstrates itspotential to extend strained gridshell into structures of complex geometries. Asan experimental project, there are some shortcomings in this research that worthpointing out. As the thin plywood used in this project is quite different from thelaths used in practices, the feasibility of the method needs to be further tested withlarger materials. In the meantime, the structural simulation also need to be furtherstudied to avoid simplifications mentioned before.

276 P.F. YUAN, H. CHAI AND J. JIN
4. ConclusionThis paper presents an integrated method of complex gridshell design andfabrication through the experimental construction of a large scale prototype.Form-finding, structural optimization, digital fabrication and assembly process aredescribed in detail to demonstrate the feasibility of the methods. By taking fulladvantages of digital fabrication technologies, this method opens up new outlooksfor complex strained gridshells.
AcknowledgementsThis research is funded by National Natural Science Foundation of China(Grant No.51578378), National Key R&D Program of China(GrantNo.2016YFC0702104), Sino-German Center (Grant No.GZ1162), andShanghai Science and Technology Committee (Grant No.16dz1206502, GrantNo.16dz2250500, Grant No.17dz1203405).
References“SG2012 GRIDSHELL” : 2012. Available from <http://matsysdesign.com/2012/04/13/sg2012-
gridshell/> (accessed 12th October 2017).Adriaenssens, S., Block, P., Veenendaal, D. and Williams, C.: 2014, Shell structures for
architecture: form finding and optimization, Routledge, London and New York.Baverel, O., Caron, J.F., Tayeb, F. and Peloux, L.D.: 2012, Gridshells in composite materials:
Construction of a 300 m2 forum for the solidays’ festival in Paris, Structural EngineeringInternational, 22(3), 408-414.
D, B., Kermani, A. and Zhang, H.: 2014, A Form Finding Method for Post Formed Timber GridShell Structures,World Conference Timber Engineering.
D’Amico, B., Kermani, A., Zhang, H., Shepherd, P. and Williams, C.: 2015, Optimizationof cross-section of actively bent grid shells with strength and geometric compatibilityconstraints, Computers & Structures, 154, 163-176.
Harding, J., Pearson, W., Lewis, H. and Melville, S. 2015, The ongreening pavilion, in P. Block,J. Knippers, N. J. Mitra and W. Wang (eds.), Advances in Architectural Geometry 2014,Springer, 295-308.
Harris, R., Haskins, S. and Roynon, J.: 2008, The Savill Garden gridshell: Design andconstruction, Structural Engineer, 86(17), 27-34.
Kelly, O.J., Harris, R.J.L., Dickson, M.G.T. and Rowe, J.A.: 2001, Construction of thedownland gridshell, Structural Engineer, 79(17), 25-33.
Lienhard, J., Gengnagel, C., Knippers, J. and Alpermann, H.: 2012, Active Bending, A Reviewon Structures where Bending is used as a Self-Formation Process, International Journal ofSpace Structures, 28(2-3), 187-196.
Peloux, L.D., Tayeb, F., Lefevre, B., Baverel, O. and Caron, J.F.: 2015, Formulation of a4-DoF torsion/bending element for the formfinding of elastic gridshells, Proceedings ofthe International Association for Shell and Spatial Structures (IASS) Symposium 2015,,Amsterdam.
Pone, S., Colabella, S., D, B., Fiore, A., Lancia, D. and Parenti, B.: 2013, Timber post formedgrid shell: digital form finding / drawing and building tool, IASS 2013: Beyond the Limitsof Man.
Pone, S., D, B., Portioli, F., Landolfo, R., Colabella, S., Parenti, B., Lancia, D., Fiore, A., D,M. and Ceraldi, C.: 2013, Construction and form-finding of a post-formed timber grid-shell,International Conference on Structures and Architecture.
Yuan, P.F. and Chai, H.: 2017, Robotic Wood Tectonics, Fabricate 2017, Stuttgart, 44-49.

GLUEHOUSE
Towards an Open, Integrated Design-To-Fabrication Workflow for RealizingVariable-Geometry Stress-Skin Plywood Cassette Panels
JONATHAN NELSON1 and CHRIS KNAPP21Bond University, Gold Coast, Queensland, [email protected] Sydney [email protected]
Abstract. This paper documents the development and application ofan open, flexible, and highly integrated design to fabrication workflowcapable of resolving complex geometries into a stress-skin panel systemready for direct construction. The system was developed in late 2016and has been tested at full scale by being utilized to build a complete225 m2 single-family dwelling.
Keywords. Digital Fabrication; FIle-to-Factory; AutomatedConstruction.
1. Background1.1. BACKGROUND
The Gluehouse is a 4 bedroom, 225 m2 (2500 ft2) house (Fig 1) acting as thecase study for the research and development of an integrated design-to-productionworkflow that generates a bespoke structural plywood cassette prefabricationsystem that focuses on a high degree of flexibility in design coupled with easeof fabrication and assembly. This system has resulted in a full-scale proof ofconcept on the basis of preliminary structural dynamic and load bearing tests.Whilemass-customisation is an often referred to ambitionwithin the discipline, theGluehouse displays a bespoke approach to prefabrication, where each panel andsubcomponent is geometrically and dimensionally differentiated yet self-similaroverall. In particular, an aspiration of the work is to push the expressive potentialof the system to augment spatial effect and with reference to Meredith (2010),using parametric software tools to create ornate architectural expression (or rather,a specific spatial affect) that escapes semiotic referents.
1.2. INTEGRATED WORKFLOWS
Since the time of the Albertian shift in the role of the discipline purely uponrepresentation, rather than as the master builder in the Brunelleschian sense,architects have operated with drawing as the primary intermediary between
T. Fukuda, W. Huang, P. Janssen, K. Crolla, S. Alhadidi (eds.), Learning, Adapting and Prototyping,Proceedings of the 23rd International Conference of the Association for Computer-Aided ArchitecturalDesign Research in Asia (CAADRIA) 2018, Volume 1, 277-286. © 2018 and published by the Associationfor Computer-Aided Architectural Design Research in Asia (CAADRIA) in Hong Kong.

278 J. NELSON AND C. KNAPP
design and execution (Pigram and Maxwell 2014). Recent decades have seenthe possibility for digital design tools to form a bridge across this divide.Generally, the work described herein exemplifies the disciplinary shift to thepost-representational where design, fabrication, and output form a continuousfeedback loop directed to a tested and validated prototype (Burry 2012). Theauthors are actively seeking to shift the boundary between designer and builder viathe facility of digital processes, as with Pigram and Maxwell (2014), constructiondrawings are no longer the reference for construction, but rather the machineinstruction code that is directly output from a parametric process that hasembedded within it the constraints of material and fabrication. This locatescraftsmanship into the space of the digital model, and thusly, places the architectat the centre of the construction process. As in this case, tight integration andintelligent incorporation of material and tool constraints into the design processis required, allowing for questions of both technical and formal complexity to beaddressed in a profound way that was not possible previously in the context ofconstruction. (Kolarevic 2008).
Figure 1. The Completed Case Study House.
1.3. PREFABRICATION VERSUS TRADITIONAL CONSTRUCTION
Many of the advantages of prefabrication stem from disadvantages to traditionalbuilding techniques. For example, a non-linear construction process which allowstrades to work concurrently, is generally agreed to compress total building time.Increased quality control, consistency, and precision are oft-cited major benefit toworking in controlled conditions with access to digital and automated productiontools. Perhaps the most advantageous benefit is the ability to utilize integrateddigital design and production workflows, something the general constructionindustry has been historically slow to develop (Kieran and Timberlake 2004).
There are, however, some advantages to traditional building techniques thatare not often acknowledged amid the allure of prefabrication. Most obviously,the techniques are well understood and labour is relatively plentiful with a highbaseline of skill. This follows with a second advantage: materials and techniquesallow for a great deal of flexibility coupled with a relatively low level of requiredspecificity. Construction information (drawings) for even moderately complexshapes are abstract and contain few dimensions as it is generally understood thata builder’s experience will allow for missing information or other contingencies.Additionally, the inherently high level of structural redundancy and the readyavailability of standardized materials allows for changes to a structure over its

GLUEHOUSE 279
lifetime; traditionally built structures are easily renovated, added to, or evenstopped and started again with a revised scope at a later date.
Conversely, prefabrication also has disadvantages which merit mention. Thereliance on a predefined system and its inherent limitations and constraints ischief among them. Additionally, many of these systems do not generally allowfor a high degree of customization. Rather the majority of systems have adistinct stylization or formal vocabulary which requires a prospective owner beamenable. Additionally, the owner must fully commit to a chosen system withinits own scope; one cannot generally integrate incomplete portions of a system.Finally, there is the issue of cost; many prefabricated systems - especially onesoriented towards design rather than economy - generally cost more per unit area,particularly in areas without an established market.
2. AimsThe Gluehouse Project is an attempt to create a bespoke prefabrication system thataddresses the strengths and weaknesses of both construction types. Specifically,the system is geared toward maximizing design freedom by being both formallyagnostic and structurally flexible; there is no predefined kit of parts or imposedaesthetic, and structural constraints are generous as is accommodation ofnon-standard geometry. The system is also capable of being applied to walls,floors and roofs without changing the structural schema (Fig 2) Most importantly,the system described here can be applied as these elements on an ad-hoc orchanging basis; floors and/or roofs can use the system but walls can be traditionallyframed or vice-versa. This variable level of integration also applies to the system’sability to interface with other traditional construction techniques such as masonryand structural steel as is shown in the case study.
Figure 2. Integrated system of Walls, Floors, and Roofs. Vaulted and Folded geometries areacceptable inputs.
To accomplish this, the authors have developed a flexible and comprehensivedesign-to-production workflow that is capable of automating the processing ofa wide variety of input geometry and outputting fabrication-ready data whichis executable on a wide variety of commonly available 3-axis CNC routers.

280 J. NELSON AND C. KNAPP
From a fabrication standpoint, the system is designed to maximize benefits offile-to-factory workflows such as decreased production time and reliance onskilled labour through simplified assemblymethods, enhanced waste management,and increased quality and precision, and significantly reduced need for drawings.
3. The Gluehouse SystemThe approach undertaken here utilizes a novel approach to stress-skin (monocoque)construction techniques (Fig 3). The panels utilize a 4mm (3/16“) plywoodwaffle core with 6mm (1/4”) skins, where glue is the only fixing. Analogous tocorrugated cardboard, this results in a super lightweight, high strength-to-weightratio building system that minimizes resource consumption and embodied energy.Panels are joined end-to-end with 15mm plywood joiner assemblies which are alsoprocedurally generated. A grid of variable sized holes in the webs allow for thepassing of ducting, conduit, and piping, and the cells between webs accommodatesthe insertion of various types of insulation.
Figure 3. Exploded View of Typical Panel Assembly.
Architecturally, this provides a high level of customization and articulationof assembly. In the case of this prototype, the plan and section illustrate acomposition of subtly torqued geometry. What is effectively a “bar” type planis cranked at the central stair core by 5 degrees, and the ceiling of the principleliving area raked at 2.5 degrees. These moves have been deliberately incorporatedinto the house design to add a degree of complexity that would not be easilyachievedwith conventional site-crafted construction. Thus, this prototype is one ofa myriad of mass-customized iterations of a domestic residential paradigm, usingthe efficiency of digital tools to add greater value (aesthetic, intrinsic, intellectual)to the realized object. (Fig 4)

GLUEHOUSE 281
Figure 4. Case Study House Plans.
4. Fabrication and AssemblyThe prefabrication process follows a simple and standard procedure where cut-filesare generated from the system and sent directly to the CNC for cutting. A referenceindex is printed for the operator to label the parts as they are cut, and they aresubsequently sorted. An 1.4m wide x 8m long steel benchtop was fabricated forthe assembly process. The panels are assembled with the finished face down onthe steel, and they act as an index for all of the components as they are broughttogether. Once fully assembled and glue applied, the panels are pressed with barclamps and left to set. This proved to be a limiting factor during the prototypeconstruction - that only one panel could be made every 8 hours. Fabrication ofcomponents could be made at the capacity of the CNC, but the glue-curing wasthe bottleneck. Panels proved to be highly accurate throughout the entire processwith on-site assembly shadow gaps of only 3mm achievable consistently (Fig. 5).
Figure 5. Fabrication and Assembly of Panels.
5. ImplementationFor the purposes of maintaining geometric flexibility while ensuring informationfidelity in this project through the early stages of development, a single integratedalgorithm was developed in the generative algorithm design environmentGrasshopper, a plugin for McNeel’s Rhinoceros NURBS-based modeler. Thesystem was continually amended and augmented throughout the early prototyping
282 J. NELSON AND C. KNAPP
stages and even during construction as the need to address issues of fabricationand field assembly illuminated required refinements.
5.1. MODELS AND DATA
Typical scenarios incorporating digital production workflows make use ofmultiple types of digital models, developed at different project stages andfor different immediate purposes; for instance, design-oriented models andconstruction-oriented models. These can have vastly different data requirementsand mediating between the two is a major ongoing challenge (Sass, 2007)especially in construction as projects are subject to change at any time. TheGluehouse project offers a solution to this by automating the generation ofconstruction and fabrication information through the algorithm, reducing the needto coordinate between multiple models. In effect the construction model is a fluidrepresentation of the algorithm and exists primarily to support the delivery ofrelevant data at intermediary states such as geometric integrity or conflicts duringresolution, or at end states such as quantity estimates and reference diagrams.
5.2. SYSTEM DESIGN AND GEOMETRIC RATIONALIZATION
The general arrangement of the system is a hierarchical structure of componentsand sub-components which are generated in a top-down manner starting with theinput geometry. Input geometry is subdivided into rows of offset panels based onparameters which can be assigned as an application of manufacturing constraintsor aesthetic choice, including minimum and maximum panel dimensions andpanel offset. Since these constraints can conflict with each other and produceunappealing or incorrect results they are routed through a built-in genetic solverthat produces options geared toward the minimisation of small or oddly shapedpanels which the designer can choose from.
Once a panel arrangement is chosen the system is triggered to generatecomponents and subcomponents (Fig 3 above). Optional components availablefor generation include integrated nailing battens for cladding and roofing.
In addition to geometric generation of components and assemblies, a corefeature of this system is the integration of material and tool constraints directly intothe system at various scales. Large scale parameters such as panel sizes or conduithole sizes can be chosen based on equipment and material constraints or throughaesthetic means. Medium scale parameters are generally enforced by the systembased on material inputs such as plywood thicknesses which affect join conditions,web insets and spacings, glue slots, alignment tabs and similar parameters thataffect fabrication and assembly. Small scale parameters can be either aesthetic,as in adjustment of panel reveals, or functional, as in the declaration of router bitdiameter and global tolerances. That said, many of these parameters propagatethrough the system at various levels and influence each other; for instance tabsand slots for web alignment between skins are partially driven by bit diameter andtolerance parameters to ensure accuracy.
Bespoke detail options can also be integrated into the system, as shown withthe decorative cutouts in the ceiling panels {Fig 7). In this case the cutouts serve to

GLUEHOUSE 283
add detail to the ceiling while integrating room lighting by masking the otherwiseconspicuous light fixtures within a larger field. In the case study house the cutoutshapes are also numbered and sent for laser-cutting from brass to insert into theceiling.
Figure 6. Ceiling Detail Reference Diagram (left) and Cutouts in Finished Ceiling.
Processing time is generally very fast considering the complexity of thealgorithm. A 64 square meter plate (8m x 8m or 688 square feet) with 25 panelstakes about 90 seconds to fully propagate a detail model and output all pieces forfabrication, not including running the genetic solver or nesting pieces on sheets.
5.3. MANAGING COMPLEXITY
In any highly integrated system, components and modules interact with each other(correctly or incorrectly) both functionally and geometrically, which has an addedeffect of greatly increased internal complexity. This can lead to extensive timereworking or debugging a system if results are not as expected. Evenworse, resultscan be algorithmically correct but not as intended (Scheurer, 2012), which may benoticeable if large scale or discovered very late during fabrication or installationif very small scale.
To address these potential issues, the authors have adopted two separate butcomplimentary strategies. Firstly, the number of input design parameters areminimized by emphasizing numeric relationships between elements wheneverpossible. Secondly, a strategy of internal error checking mechanisms which reporton data integrity at critical points within the systemwas implemented. These rangefrom simple checks that the number of panels at the beginning and end of theprocess are identical (no gross geometric errors) to planarity checks for surfaces,to verifying that the number of slots on a skin panel matches the number of tabson the corresponding webs.
Measures to manage complexity are extended to assembly as well. Geometricvariations ensure webs and skins are oriented correctly; mating tabs and slots foralignment are only on the top skin and top of a web, while the bottom skin containsonly a glue-receiving channel. Other members, such as stitching tongues or nailingbattens are made from stock lumber and are identically sized to reduce complexityand processing time.

284 J. NELSON AND C. KNAPP
6. Results6.1. SYSTEM PERFORMANCE
The prototype panels developed as part of this research provide spans up to 7.2m(24’) while outperforming local code limits for conventional site built timberframing systems at a fraction of the mass. During loaded testing, span deflectionproved to be 50% less than typical systems in the same depth. The systemrelies upon using 2 constituent parts: Finnish structural b-face birch plywood andmarine-purpose expanding polyurethane glue. Both materials were assumed to beconsistent in supply and quality, and readily available.
In terms of installation in situ, the system performed very well. The panelizedmodules are very lightweight, requiring a crane for bulk rather than mass. A full7.2m panel can be easily lifted by two people. Panels were delivered to site inbatches of 6-8 to complete a zone of the house, and took only one day includingdelivery and installation. The on-site assembly included the introduction of ajoining tongue between panels, which is expressed in the final appearance of theproject as a black shadow gap with variable pockets. Slight amounts of cuttingand checking were required to correct human errors with measurement in the field(e.g. distance between support beams), but overall panels simply “dropped intoplace” on site. Sections were then waterproofed and the next section prepared forinstallation in the next phase. (Fig 8)
As discussed, the real-time variable level of integration shows its advantagesduring construction and installation. The combination of rapid fabrication andassembly, easy access to required equipment, and low skill requirement allowsthe system to be integrated with a fast turnaround time. For example, if a decisionis made on-site to construct a roof from the panel system rather than traditionallyframing, as-built measurements can be added to the model and fabrication can startalmost immediately.
Figure 7. Delivery and Installation of Panels.
6.2. LIMITATIONS AND FUTURE DEVELOPMENT
While this paper documents successful competition of a 1:1 case study project witha relatively complex form, there are a few current known limitations of the system.Primary among these is the system’s inability to process certain geometries aseither wall or plate assemblies, including curved or nonplanar shapes. It is possibleto include 2d curves in plan orientations but more complex shapes are beyondthe scope of the system as they would add to the complexity for fabrication andinstallation. While not a serious limitation, the system’s inability to process

GLUEHOUSE 285
more than one assembly (wall, floor, roof) at a time interrupts the throughputof the system as new elements are loaded, and can lead to system numberinginconsistencies if operators are not careful. Additionally, highly complex shapes,such as the floor plan of the case study house, should be manually broken intosmaller quadrilateral shapes for best processing results.
The system is under active development and planned additions include theincorporation of pipelines for structural analysis, refinement to joining systems,and redeveloping into a standalone software plugin which will greatly increasespeed.
7. ConclusionsThe objective as set out at the beginning of this paper was to develop a digitaldesign to fabrication workflow that would allow for integration of specific materialand fabrication constraints for a project that uses a system of unique but self-similarcomponents to constitute an assembled whole. Fundamental to this approachwas the creation of an algorithmic workflow that could be readily updated andmodified to suit changing requirements during the fabrication and constructionprocess, allowing the making of the house in question to remain prototypicalthrough succussive iterations and applications of the fabricated system.
In the making of this system, we found that one can build a project witha similar level of abstract data that a framer can as in reading from drawings.However in this case, the abstract construction intelligence that would rest witha carpenter is displaced into the digital model: the understanding of tolerance,adjustment to material characteristics, and precision of fabrication is anticipated,observed, and adapted digitally. This achieves what Kolarevic (2003) describes athe ‘fluid amalgamation’ of design, fabrication, and construction.
This work is understood as part of a lineage of projects that place a digitalfabrication approach at their core. Beginning with Preston Scott Cohen’s “Houseon a Terminal Line” (1999), one sees the novel use of cross-sectional waffle slabsto create the entirety of the project. Following on from this are similar works suchas the Raybould House by Kolatan MacDonald (2003). One of the authors servedas the site architect for the 2005 “BURST House” by systemarchitects. BURSTrepresents one of the very first built instances of this ply waffle type, however theply ribs actmore like beams running between supports rather than as a homogenoussystem. Further on, Kieran Timberlake’s Loblolly House take a polemical stanceusing a modular approach. The Gluehouse contributes to this lineage by offeringthe digital workflow as part of the overall feedback loop in the project lifecycle toa house conceived of as the result of a system. There is no distance or separationbetween architect and builder, or between conception and execution. The digitaltools developed for Gluehouse allow for the iteration and adaptation to continueas a live process from start to finish.
Former CTO of Gehry Technologies, Dennis Shelden, notes that “architectsused to not care (about fabrication) at all, it was not supposed to be part of thearchitectural agenda and it was discouraged that you would even design buildingsthat were at that level of attention to fabrication...” (Knapp, 2014). While this

286 J. NELSON AND C. KNAPP
project faced certain challenges, limitations, and identified areas for improvement,the principle of creating a digital tool that is linked to real material and fabricationconstraints illustrates an opportunity for architects to posit new value and qualityinto the built realm through the use of contemporary tools. The disciplinenow has fabrication intimately linked with design and ideation; Gluehouse is ademonstration of how these processes can play out at the architectural, residentialscale.
AcknowledgementsThe Gluehouse is the result of the authors overlapping academic research andprofessional endeavours. As such this project is the result of collaboration with ourteam at StudioWorkshop, consulting engineer PhillipWallace (structural), builderand managing site contractor Peter McCabe who were integral in refining andproviding feedback into the process. A special thank you to DMK Forest Products(exclusive importer of WISA Birch Ply in Australia) and FixTech, suppliers of theadhesive used throughout the project.
ReferencesBurry, M. 2012, Models, Prototypes, and Archetypes: Fresh Dilemmas Emerging from the “File
to Factory” era, in B. Shiel (ed.), Manufacturing the Bespoke, WIley, London.Kieran, S. and Timberlake, J.: 2003, Refabricating Architecture, Spon, New York.Knapp, C.: 2014, Interview: Dennis Shelden, Architectural Review Asia Pacific, 134, 24.Kolarevic, B. 2003, Information Master Builders, in B. Kolarevic (ed.), Architecture in the
Digital Age: Design and Manufacturing, Spon, New York.Maxwell, I. and Pigram, D.: 2014, Long Division: The Drawing(s) of Architecture,
Architectural Review Asia Pacific, 134, 26-29.Meredith, M. 2008, Never Enough (Transform, Repeat ad Nausea), in T. Sakamoto and A. Ferre
(eds.), From Control to Design: Parametric/Algorithmic Architecture, Actar, Barcelona.Pigram, D. and McGee, W.: 2011, Formation Embedded Design; a Methodology for the
Integration of Fabrication Constraints into Architectural Design, Proceedings of ACADIA2011, Calgary/Banff, Canada, 122-131.
Sass, L.: 2007, Synthesis of Design Production with Integrated Digital Fabrication, Automationin Construction, 16(3), 298-310.
Scheurer, F. 2012, Digital Craftsmanship: FromThinking toModelling to Building, in S.Marble(ed.), Digital Workflows in Architecture: Design-Assembly-Industry, Birkhauser, 110-129.

{IN}FORMED PANELS
Towards Rethinking the Precast Concrete Industry in the UAE
BASEM EID MOHAMED1, MOHAMED ELKAFTANGUI2 andRANA ZUREIKAT31,2Abu Dhabi University1,2{basem.mohamed|mohamed.elkaftangui}@adu.ac.ae3Abu Dhabi Tourism & Culture [email protected]
Abstract. The convergence of digital design and fabricationtechnologies have offered architects and designers the means by whichto develop customized architectural artifacts, ones that goes beyondthe standards of “one size fits all”. Such applications have beenapplied extensively in various architectural practices, and specificallyin the realm of industrialized building production, given that theypresent a suitable model. Although unrecognized within standardprecast concrete production, current research acknowledges the need foradvanced computer applications for shifting the industry into a digitizedprocess. This paper represent a critical phase of an ongoing researchendeavor that aims at rethinking the precast concrete production inthe UAE, and MENA region for housing typologies. The projectexplores possibilities of a new protocol that is focused from designto production, relying on performative design strategies, and possibleoptimized for large format 3D printing of concrete elements. The aim isto develop an integrated façade panels system that is tailored for designand production; an approach that goes beyond current industry practices.
Keywords. Precast Concrete; Industrialized Construction;Evolutionary Design; Optimization.
1. IntroductionConcrete is one of the most usable materials in construction worldwide, andspecifically in the MENA (Middle East and North Africa) region. It is consideredas a cheap composite due to low cost of raw material. Additionally, it is a strongmaterial in compression, durable, resistant, and versatile. One of themost commonapplications in concrete construction is precast concrete, a production model thatoperates by building up offsite molds and formwork for each specific project. It isused for walls, floors, and structural elements. Once completed, these componentsare delivered to construction site, then assembled by cranes to form a building.
There are several reasons why architectural precast has gained popularity in thepast few decades and particularly in the MENA region. First, architectural precast
T. Fukuda, W. Huang, P. Janssen, K. Crolla, S. Alhadidi (eds.), Learning, Adapting and Prototyping,Proceedings of the 23rd International Conference of the Association for Computer-Aided ArchitecturalDesign Research in Asia (CAADRIA) 2018, Volume 1, 287-296. © 2018 and published by the Associationfor Computer-Aided Architectural Design Research in Asia (CAADRIA) in Hong Kong.

288 B. EID MOHAMED, M. ELKAFTANGUI AND R. ZUREIKAT
offers long term durability and require minor maintenance, given that it achieveshigh strength relying on high cement contents and low water-cement ratios,coupled with good compaction and curing in a controlled factory environment.Second, the process of developing architectural precast allows for diverse surfaceand volumetric articulations, all in a cost effective manner. The material ischaracterized with high plasticity, and can be designed for variable appearances.Third, being produced within a controlled factory environment, this leveragequality and accordingly has economic benefits with regard to initial and lifecycle cost. Last, with growing interest in environmentally conscious material,it is argued that architectural precast can be designed to provide high degree ofenergy efficiency in buildings. Such a trend includes integrated shading deviceswithin façade panels, and specific wall thermal characteristics through combinedinsulation in the form of sandwich panels (PCI 2017).
Withing the United Arab Emirates (UAE) construction market, precastconcrete production has been growing remarkably in the past decade. Marketresearch indicates that the 6 billion AED industry in 2015, comprised almost 30%of the total construction. Multiple reports refer to precast concrete as a 10%cheaper solution than conventional construction, because of lower cost in labor,time-saving, while offering significant environmental benefits. Additionally, it isargued that such a system is driving creativity in the real estate sector as architectshave greater leverage to develop intricate designs that can be produced off-site(Kumar 2011).
Recent advancements in material processing though the use of cutting-edge digital design and fabrication technologies have offered architects anddesigners new modes of creativity, and the means by which to developcustomized architectural artifacts, ones that goes beyond the standards of “onesize fits all”. Such applications have been applied extensively in variousarchitectural practices, and specifically in the realm of industrialized buildingproduction, given that it presents a suitable model. Although unrecognizedwithin standard precast concrete production, current research acknowledges theneed for advanced computer applications for shifting the industry into a digitizedprocess. This research thus proposes a novel framework and a systematic groupof methodologies for the design and optimization of a façade panels system inresponse to specific contextual conditions.
The framework is based on developing an algorithmic process to manipulateand optimize the parameters of a self-shading system, thus result in a unique,and orientation-responsive design. Such an approach derives its logic froma computational design processes, where a evolutionary solver employs aform-finding strategy, supported by simulation tools, to optimize window shapeand extrusion based on orientation.
In order to achieve the research objectives, the paper is structured as follows.The first section is denoted with briefly shedding the light on precast concretepractice in the UAE with focus on design and production practices. Then, thedesign and optimization framework is explained, resulting in the taxonomy ofdeveloped façade panels. Finally, we evaluate the process and describe potentialof future research.

{IN}FORMED PANELS 289
2. The precast concrete industry in the UAEAs mentioned earlier, precast concrete production has been in the GCCmarket since the 1970s, initially in Saudi Arabia and Kuwait, but then in theUAE. Currently, the UAE market has been growing immensely, supported byimplementing advanced infrastructure in precast, where factories pursue the latesttechnologies in production line. According to statistical data provided by theAbu Dhabi Chamber of Commerce and Industry, the precast sector in the UAEis valued at $1.6bn, employing over 25,000 laborers and technicians workingin in around 20 manufacturing facilities, with the construction cost of each ofthese factories ranging from $50m to $350m. The industry is considered a keyrevenue-generating sector, where pioneer companies are driving a new trend inthe construction industry through offering high-quality products and maintainingsafety and environmental standards (Kumar 2011).
The UAE housing sector relies extensively on precast concrete where it playsan important role in supplying the housing market with diverse products such assingle family homes, and specifically projects funded by the government. Thecommon practice is based on the production of wall panels in an engineeringto order fashion. For the sake of standardization and cost saving, these panelsare often replicated within the same housing development without consideringvarious factors like context, orientation, climate, and user requirements. One ofthe recently projects Al-Falah community, a vast national housing developmentin Abu Dhabi that utilized precast concrete components. The project; consists of2069 housing units, including only nine variations of single family homes in styleand size. Figure 1 represents images of the project.
Figure 1. Images from Al-Falah housing project showing an aerial view of the site, and one ofthe single family houses by the company Gulf Precast (Source: Gulf Precast 2017).
A major outcome of our study on market practices is the deficiencyof technological applications, where it is commonly limited to 2D draftingand 3D modeling, for the sake of clash detection, and issuing fabricationorders. Additionally, production is being dominated by manual labor, thoughautomation takes part at some stages of the process. while we believe thatthe industry’s diverse business practices evidence several on-going concerns:targeting affordability, responding to environmental challenges, and contributing

290 B. EID MOHAMED, M. ELKAFTANGUI AND R. ZUREIKAT
to innovation in the homebuilding sector, we argue that a major drawback is thatlacks the opportunity to develop more advanced production protocols. In thatsense, it is understandable that there is a clear gap between what has been proposedin research, and current precast concrete trends in the UAE. In order to respond tosuch an argument, we envision a road map that the industry can pursue to highlybenefit from recent advancement in digital tools in design and fabrication.
3. Redefining façade panels : Optimization methodologyThe interest in generative design processes has been growing recently as a result ofadvances in applications of computational methods, supported by models from thefield of Artificial Intelligence (AI). Such an arrangement has offered designers themeans by which the design process can be informed by a series of parameters. Oneof the powerful tools has been identified as evolutionary computing, expressedas an application advanced algorithms employed by designers to automaticallyimprove the performance of design processes. Such algorithms set the stage fornumerous creative solutions, as they possess the ability to generate and suggestnew design alternatives for a specific problem. Evolutionary algorithms arein some cases classified as heuristic algorithms, due to their search-orientednature. They define a design problem in terms of a search, in which the searchspace contains all possible solutions and a point in that space defines a solution.Evolutionary search algorithms express their full potential by simulating theprocess of natural selection and reproduction on a computer, thus shaping theevolution of solutions in response to a problem. These algorithms thereforeconsider a large group of solutions at once, rather than working with only onesolution at a time (Bentley 1999), following a learning process.
Evolutionary computing is commonly applied towards optimization of aspecific design solution. In another word, it enables exploring a pool ofdesign alternatives then pick the fittest solution of a well-defined problem,driven by single or multi- objective optimization (Eiben and Smith 2003). Theprocess can be set for single or multi-objective, based on the type of thedesign problem. Pertaining to architecture, the notion of optimization hasbeen explored towards various types of design problems, including space layoutplanning (Gero 1996), (Jagielski, I., & Gero, J. S.,1997), form finding (O’Reillyand Ramachandran,1998), and opening size and location (Tuhus-Dubrow andKrarti 2010). Commonly, when the case relates to building performance, theoptimization model is combined with a simulation engine to insure adequatesolutions.
One of the relevant examples to our proposed research is the paper entitled“A design optimization tool based on a genetic algorithm” (2002). The paperproposed a generative tool that can assist designers to generating and evaluatingparticular features of a solution towards an optimized behavior of the finalbuilding configuration. The tool applied Genetic Algorithms (GA) as a generationand search media to look for optimized solutions with regard to lighting andthermal performance of the building. The GA is first used to generate possibledesign geometrical answers, which are then evaluated with regard to lighting andthermal behavior using a detailed thermal analysis program. The results from

{IN}FORMED PANELS 291
the simulation are consequently used to further direct the GA search towardsfinding low energy solutions, by assigning strength scores, to the studied problem.Solutions can be visualized via AutoLisp routine. The system targets optimizationrather than simulation, and results proved to be highly satisfactory.
Pertaining to precedents exploring potential of computational design processesand its possible application with precast concrete system, the paper “Parametricprecast concrete panel system” Bell (2015) proposes a series of parametricallydriven geometries toward producing formwork based on quantitative andqualitative data. The research proposes three types of panels based on function:solar, aperture, and sound diffusion. Solar panels use forces from projectorientation to coordinate panel geometry with specific surrounding context.Panels can either integrate solar photovoltaic or create façade fenestration.The complex geometry of the panels would require a Computer NumericallyControl (CNC) milled mold. In order to overcome some of the draw backsof the proposed methodology, Bell (2017) proposed further developments tothis research. However, the proposal lacks a simulation model to validate theeffectiveness of the geometry’s response to the surrounding
In response to precedent efforts, combined with the goals of the intendedresearch project, we propose a process that aims at optimizing self-shading façadesystem, at the level of a single room to start with and after generating a buildingprototype that aggregates all of the optimized panels in one BIMmodel. We reliedon existing computing tools that combine design, optimization, and simulation.We employed a series of plugins and-add on components within the visualprogramming platform Grasshopper to develop the catalogue of façade systemoptimized panels.The following section elaborates on the process with specificfocus on design procedures, and parameters.
3.1. PANEL TAXONOMY: THE MECHANICS OF THE PROCESS
One of the features of the precast concrete industry in the UAE is the practice ofa production to order model, one that in many cases lacks a modular strategy. Inother words, façade and interior wall panels are designed and produced on-demandin response to project requirements. While such a trend allows for designflexibility, and offers high levels of customization, yet we believe that it does notcomply with the economies of industrialized production. In that sense, we initiatedthe design process following amodular strategy, where precast panels are designedbased on of 1.50 m wide module. Based on exploring the market standards withregard to opening sizes, these panels are denoted with hosting fenestrations. Toleverage typology- based flexibility, we devised two variations: narrow panelof 1.5m and a wide panel 3.0 m wide. We anticipate a flexible, adaptable, andcustomizable modular system. Nevertheless, the design system is set to acceptfurther iterations in the design of wall panels. Figure 2 represents the classificationof wall panels.

292 B. EID MOHAMED, M. ELKAFTANGUI AND R. ZUREIKAT
Figure 2. Classification of façade panels based on size and function.
Given the climatic conditions in the UAE, the need for a shading system canbe considered inevitable. In fact, the design of climatic features dates back tothe 1950s, when construction of houses employed masonry structure, resultingin simple, practical and functional expressions to meet the demands of a harshenvironment. While expressions at that time took the form of a pattern- based sunscreens, our approach for the design of a shading systems stems from the plasticityof concrete as a material, and advocated by a computational strategy. We initiatedthe process with a series of assumptions derived from examining residential designtrends in the UAE, with specific focus on opening size in relation to allocatedfunction.
Pertaining to the shading system, the pursue of an integrated façade schemedictated the utilization of a self-shading element, one that emerges from the panelitself. Accordingly, the element has been set within a predefined volume, andcontrolled by a series of parameters in the form of vertices in x,y,z directions.The purpose is to allow for flexibility in performance optimization, throughmanipulating various parameters. additionally, in order to control the generationprocess, a set of constraints where involved, related to housing design andopenings guidelines in the UAE.
A multiplicity of tools and plugins were utilized to develop the optimizedpanels and customizable scheme. The process is initiated with devising abasic room model in Rhinoceros (Rhino3D) with one glazed opening, hostinga non-uniformly extruded virtual shading element. While the shading elementis set to operate as dynamic component, at this stage it the follows perimeterof the fenestration. As mentioned earlier, the opening size and virtual shadingextrusion bounding values, and the constrains on the direction of movementbetween vertical and horizontal elements are all predefined settings, respondingto functional requirements and following housing guidelines in the UAE. Thisgeneric configuration is then fed into Grasshopper, the visual programmingplatform, where the optimization process occurs.
Grasshopper allows for structuring a definition that interprets the basicgeometry, and furthermore identifies it within the digital model’s bounding

{IN}FORMED PANELS 293
elements; walls, floor, ceiling, and glazing zones. It also enables the input ofan orientation, a predefined parameter as South, East, or West. The following stepis then denoted with establishing parameters of the shading element. Being a corefeature in Grasshopper, the process is characterized by building up associativerelationships with a clear set of parameters and range for the values. This dynamicsetup is then optimized, manipulating extrusion parameters in x,y,z directionwith the sake of attaining the most fit extrusion and orientation of the shadingelement, using a carefully calculated fitness criteria to achieve the most efficientperformance.
In order to achieve the intended optimization model, a series of Grasshopperplugins and components were employed, each performing a very specific task.The core component for performing the form finding process is GalapagosEvolutionary Solver. It operates by searching within a pool of solution space forthe fittest solution, with regard to shading system parameters in x,y,z directionthus resulting in a specific configuration. To insure adequate performance, theprocess is combinedwith Honeybee, Ladybug, EnergyPlus, Radiance, Daysim andOpenStudio, a series of necessary components for building energy and daylightsimulation. These components act as a normalizing medium for the form findingprocess, hence ensure adequate shading while maintaining required illuminationwithin the space. In that sense, result from the analysis becomes the fitnessfactor for the optimization process. Figure 3 displays an abstract descriptionof the process, and resulting shading element for a specific orientation, and theGrasshopper definition.
Figure 3. The optimization process combining a series of computational tools, and the outcomeof optimizing an East oriented 3.0 m wide bedroom panel. Visualization of the simulation
results with color codes indicating for each grid square of the layout the annual percentage ofachieving optimal heat gain and lighting conditions. .

294 B. EID MOHAMED, M. ELKAFTANGUI AND R. ZUREIKAT
3.2. BEYOND OPTIMIZATION: EXPLORING THE ROLE OF BIM
Building Information Modeling (BIM) has proven an important role in theindustrialized building industry, where it enables creating BIM parametric andcustomizable product families that can be shared between the manufacturer andother components’ producers in the production process. Such a scheme entailsstandardizing the structure of object information beyond geometry, so as to includespecifications for selection and use in analysis, along with material properties.Additionally, the capacity to establish a multiuser environment which enablesefficient collaboration and data exchange within the design and production team.This includes the ability to export data in suitable forms for automation of thefabrication tasks using CNCmachinery, based onmanufacturer’s capabilities, thusreducing the time required to generate technical drawings.
Within the proposed framework, there are some important capabilities that aBIM platform could support. In order to explore various possibilities, optimizedpanels were then exported as mesh component to Autodesk Revit, identified asa Revit panels family, and collectively fed into a comnprehensive a Panel BasedCurtain System. Panels were identified under one parametric family with differenttypes to accommodate all possibilities of orientation, function, and opening size.This mode of representation aims at developing an integrated process where panelscan be interchanged within one framework, and modified according to spatialfunction, and orientation, resulting in a setting that is efficiently responsive to thesurrounding environment. Figure 4 represents a print screen of a panel family onRevit, then how panels are applied within a house prototype based on orientation.
Figure 4. The panel family as it shows on Revit, 3D view and plan, then its application towardsa prototype of a house in Revit.
In order to explore the practicality of such a panel system, we simulated theprocess to a housing prototype where various panel typology was inserted withinthe skin, thus demonstrate the flexibility and adaptability needed to respond todifferent site conditions and client requirements. This can be achieved by simplyusing the corresponding set of panels for each challenge, while maintaining aconstant level of energy efficiency, given that all skin elements are optimized to

{IN}FORMED PANELS 295
achieve appropriate daylighting conditions throughout the year with the minimumpossible heat gain. Furthermore, Revit enabled the possibility to investigate thepanel materiality, where layers of concrete and insulation were introduced, withspecific properties following market standards. This allowed to produce an energymodel for the full house, which reflected the huge impact of micromanaging panelsand material properties on the overall performance of the prototype.
4. Reflections: Towards a comprehensive model for design to productionThis paper represent a research effort that aims at rethinking the design andproduction of precast concrete façade panels, with a specific focus on the UAEindustry. We propose a digital workflow that combines a series of computationaltools to design and optimize an integrated facade system. The workflow aimsprimarily to generate a self-shading element in response to specific contextualconditions.
Combining the power of the previously mentioned tools, the workflow allowedto develop a series of façade panels that satisfactorily respond to the researchgoals. To sum up the process, the application of an evolutionary solver withinGrasshopper enabled manipulating the intended shading element’s parameterswith the aim of minimizing annual direct heat gain, while maintaining adequatelighting within the space, and according to codes. The process was connectedto a set of energy simulation engines that run daylight analysis and thermalsimulation to optimize window extrusion and rotation, and find the fittest solution.Initiating the process with six generic panel prototypes, the optimization followingcardinal orientations; East, South East, South, South West, and West, Resulted ina catalogue of 30 variations of optimized panels, corresponding to all possiblelocations, functions and orientations.
While we believe the process workflow was successful on the design end, yetthree drawbacks could be identified. First, the resultant of the optimization processas represented earlier in figure 6 is a surface model, with edged corners. We hadto remodel the panel with smoother edges to expose the plasticity of concrete as amaterial, and also ease to exporting the file to Revit. Second, we did not yet havethe chance to explore possibilities of fabrication. We are aware that productionof resulting panels would require specific formwork and molds that would requirespecific production model. Lastly, the process and flow of information betweenGrasshopper and Revit is still very linear and in one direction, and the link is mademechanically.
In order to overcome the formerly mentioned drawbacks, we propose possiblesolutions that would require further exploration. On the first hand, the issue oftransforming the surface model in Rhino3D into a mesh model can be introducedin the Grasshopper definition. We are currently working on restructuring theGrasshopper definition to develop the outcome of the process as a mesh rather thana surface, and perhaps automate the export-import action with better model qualityresults. Furthermore,another area of development with regards to the digitalworkflows is to introduce feedback loops to better inform both the simulation andthe ptrototype BIM model.On the second hand, we anticipate the role of digital
296 B. EID MOHAMED, M. ELKAFTANGUI AND R. ZUREIKAT
fabrication in the form of 3D Printing in the process. Recently, advancementsin Additive Manufacturing techniques, such 3-Dimentional printing have beena vital area of exploration since its development in the mid-1990s. We believethat 3D printing has the potential to offer a solution for current challenges facingthe concrete construction industry. Additive Manufacturing, and specifically 3Dprinting of concrete allows for producing highly customized building components.It is believed that these technologies could create a new era in the constructionindustry, one that is more adapted to specific contextual and cultural conditions.
This paper represents a critical phase of an ongoing research endeavor that aimsat rethinking the precast concrete production in the UAE. The research explorespossibilities for a new protocol that is focused on design to production, relyingon computational design strategies in the form of energy performance simulationtools, and optimized for large format 3D printing of concrete elements. The aimis to develop an integrated approach that goes beyond current industry practices.
References“Precast/Prestressed Concrete Institute (PCI)” : 2017. Available from <Precast/prestressedconc
reteinstitute.Availableat:https://www.pci.org/PCI/Bookstore/Architectural_Resources_Bookstore.aspx> (accessed 2 Dec. 2017).
“Al Falah Community Development - Gulf Precast” : 2017. Available from <http://www.gulfprecast.ae/portfolio/al-falah-community-development/> (accessed 4 Dec 2017).
Bell, B.: 2012, Parametric precast concrete panel system, Proceedings of ACADIA 2012 //Synthetic Digital Ecologies, San Francisco.
Bell, B.: 2017, “Topocast | Parametric Precast” . Available from <http://topocastlab.com/portfolio/parametric-precast/> (accessed 4 Dec 2017).
Bentley, P.: 1999, Evolutionary design by computers, Morgan Kaufmann, San Francisco.Caldas, L. and Norford, L.: 2002, A design optimization tool based on a genetic algorithm,
Automation in Construction, 11 (2), 173-184.Eiben„ A. and Smith, J.: 2003, Introduction to Evolutionary Computing, Springer, New York.Gero, J.: 1996, Computers and Creative Design, Proceedings of CAAD Futures 1996,
Singapore.Krarti, D. and Tuhus-Dubrow, M.: 2010, Genetic-algorithm based approach to optimize
building envelope design for residential buildings, Building and Environment, 45(7),1574-1581.
Kumar, S.: 2011, “Precast Take the Lead” . Available from <http://www.constructionweekonline.com/article-17403-precast-takes-the-lead/> (accessed 13 Nov 2017).
O’Reilly, U. and Ramachandran, G.: 1998, A Preliminary Investigation of Evolution as a FormDesign Strategy, Proceedings of Sixth International Conference on Artificial Life, Madison,Wisconsin, USA.
Romuald, J. and Gero, J.: 1997, A Genetic Programming Approach to the Space LayoutPlanning Problem, Proceedings of CAAD Futures 1997, Munich.

CELLULAR CAVITY STRUCTURE AND ITS APPLICATION ON ALONG-SPAN FORM-FOUND SHELL DESIGN
PHILIP F. YUAN1, XIANG WANG2 and XIANG WANG31,2,3CAUP,Tongji University1,3{philipyuan007|1530296}@tongji.edu.cn [email protected]
Abstract. This paper shows a design and building application ofa novel structure concept which is presented and developed by theauthor. The form-found pavilion demonstrates the validity of thedesign methodology and the related technical details of the designand fabrication process in an arbitrary design domain. The largepavilion (7m*6m*2.5m) with only 1mm paperboard also shows thegreat potentials of the thin sheet materials to be used in shell structuredesigns. The structural concept is based on the spatial tessellation ofshell spaces into groups of cellular cavities. The cellular cavity ismainly composed of two curved membranes and the circumferentialribs. Both global and local membrane actions can be activated by theuse of materials as thin as 1mm. Based on the structural analysis of theforegoing pavilion, the structural behavior is discussed in detail witha physical compressive test of the different group of cellular cavities.The assembly process of the pavilion is discussed with a prototype infull scale. As a successful efficient paper-shell structure, this paviliondemonstrates the structural concept and could inspire the potentials ofthin materials for future shell designs.
Keywords. Cellular Cavity Structure; Shell Structure; ThinPaperboard; Large Pavilion Design; Parametric Design Method.
1. IntroductionShell structures have taken and will take an important role in architecture andengineering due to its ability to create eye-catching forms and to resist loads inan efficient way(Adriaenssens et al., 2014). As the thin cross-section and thecurved geometry itself will enable the transfer of external loads to its supportspredominantly through the in-plane stress in the shell surface (which is so-calledmembrane actions), it enables architects to use very little material to create thelong-span structure with elegant geometry.
Although the curved geometry and the inherited form-finding technique havealways been in the central position of shell structure designs, it is mostly inthe building process that the distinctive material characteristics inspire the finaldesign, the details and the form itself. From the ancient masonry domesto the popular spatial framework structure with steel and glass, it can beobserved that a transition of structure morphology has always been emerging
T. Fukuda, W. Huang, P. Janssen, K. Crolla, S. Alhadidi (eds.), Learning, Adapting and Prototyping,Proceedings of the 23rd International Conference of the Association for Computer-Aided ArchitecturalDesign Research in Asia (CAADRIA) 2018, Volume 1, 297-306. © 2018 and published by the Associationfor Computer-Aided Architectural Design Research in Asia (CAADRIA) in Hong Kong.

298 P.F. YUAN, X. WANG AND X. WANG
with a material-driven inspiration in structural design (Ramm, 2011).With thedevelopment of computational fabrication techniques and the explosion ofmaterials in architectural design, this research focuses mostly on the new efficientpossibilities of building new shell structures with new materials. The thin sheetmaterials, with their high qualities and advantages such as low cost, lightweightand the environment-friendly recyclability, are chosen as one typical type of thematerials.
Specific to the thin panel forms of industrial thin sheet products, researcheshave been carried out to develop shell structure concepts aimed at differentcorresponding materials such as metal sheets (Hachul 2006), timber panels (LaMagna, Waimer et al. 2012, Krieg, Schwinn et al. 2015, Schwinn and Menges2015) and glass sheets(Aanhaanen 2008, Bagger 2010). Since 2012, a novelstructural concept has been proposed and researched by the author to develop aninnovative structure concept which enables the application of thinner industrialsheets in the shell structure by introducing a “cellular cavity structure” to activateboth the global and local membrane-actions of the structural system (Wang 2017).In this paper, more researches of such concept and an experimental application ofsuch structural concept (Figure 1) are presented.
Figure 1. A Form-found pavilion built with the concept of Cellular Cavity structure.
2. Concept of Cellular Cavity Structure and its design processIn the preliminary empirical experiments with super thin sheet materialsand traditional ribbed shells and grid shells, it is found that an innovativestructural concept was required due to the insufficient structural stiffnessfrom the cross-section of materials. Based on the researches on the natural

CELLULAR CAVITY STRUCTURE AND ITS APPLICATION ON ALONG-SPAN FORM-FOUND SHELL DESIGN
299
cellular structures and their basic geometrical principles (Brinkmann andFlächentragwerke 1990, Pottmann, Jiang et al. 2015), a cavity alternative isdesigned for the targeted super thin sheets to provide sufficient strength andstiffness for the structure.
Figure 2. Diagram of the cellular cavity structural concept.
2.1. GEOMETRY AND DEVELOPABLE SURFACES
A cellular cavity is mainly composed of two single-curved membranes and thecircumferential ribs which define the basic tessellation of the shell space(Figure2). With a suitable tessellation such as a Voronoi method in this paper, thediscretization of a shell space based on an arbitrary surface or a mesh systemcan be achieved. Geometrically, the developable surfaces are investigated in thegeneration of the structural system to guarantee an efficient building process of thecellular cavity structure. Based on a 3-valency mesh, advantages can be derivedfrom the design of the shell. On one hand, as the 3-valency mesh is derived from atriangulation system, planar surfaces of the circumferential ribs can be guaranteedby defining the corner point of the 3-valency mesh on the center point of thecircumferential circle of the triangles (Wang, 2017). At the same time, because aG3 continuous spatial curve can be gotten by interpolating the corner vertices ofthe mesh, it is possible to define the two membranes as the developable surfaceby extruding the curve to the center seed point of the mesh polygon. On the otherhand, as the transfer of forces between the cells can be assumpted as the edgesof the triangulation system, an equilibrium of the shell can be found through aform-finding technique and the membranes can work in this system to provideenough local stiffness for the flexible circumferential ribs.

300 P.F. YUAN, X. WANG AND X. WANG
2.2. STRUCTURAL CONSIDERATION AND UNDERSTANDING OF THESYSTEM
As the structure is divided into cells and the cells are also defined withcircumferential ribs and covering membranes, the structural behavior of thecellular cavity structure should also be understood in a discrete way with ahierarchical method. Globally, the system should be considered as an anisotropicshell where the anisotropy is defined similarly to the property of the double-layeredshell with inner and outer membranes and in-between ribs (Flügge 2013). Becauseonly limited in-between bonding connection can be provided for the structure, thedesign of the structure system should first be the design of the equilibrium state ofthe discrete cells in the system. In this case, a first assumption is made that everycell could provide enough compressive capacity so that the global design can beachieved by the form-finding techniques with methods such as the Force DensityMethods and the Dynamic Relaxation Method. Locally, the covering membranesare defined as two conical-like developable surfaces facing each other. In thisway, the distance of both the membranes varies, with the closest distance at theapex point of the membranes surfaces (the seed point of the mesh polygon) andthe largest distance at the corners of the outer circumferential ribs. So that both themembranes will work as the local stiffeners in the structural system and transferthe stresses in-between the cells with in-plane stresses on the membrane surfaces.Hence, the local membrane actions will be activated to enable the applicationof super thin materials. At the same time, as the curvature will cause a stressconcentration in the center of the cell, a tube element is designed to provide enoughstiffness for every cell.
As an integrated and interacting system, the shell should bear the external loadmainly through the membrane forces on the surface of the covering membranesto simulate the theoretical behavior of the double-layered shell (Flügge 2013).The separation of the whole shell through ribs, membranes and the tube helps toestablish a coupling structure which leads to a higher stiffness of the superstructure.In this way, the ribs will obtain extra stiffness against its lateral buckling whichcan be caused by its thin cross-section and will also be saved to minimize thepossibility against the lateral torsional buckling behavior.
The combination of the global membrane behavior such as in the masonryshells and the local membrane behavior in the double-layered shells offers a certainamount of redundancy of the structure’s strength. This can be achieved in thefirst design process by considering only the global transferring of forces withoutthe extra stiffening effect of the covering membranes. In the next design step,when the local membranes are added onto the structure to activate their membraneactions, the stresses in every element in the structure will be reduced as expectedin the double-layered shell theory. In this case, if any element fails, e.g. due to thebuckling of membranes or damage by external forces, the whole structure will beguaranteed that it will not collapse or be further damaged.

CELLULAR CAVITY STRUCTURE AND ITS APPLICATION ON ALONG-SPAN FORM-FOUND SHELL DESIGN
301
2.3. CONSTRUCTION DETAILS AND PROTOTYPE
Especially for the application of thin sheet materials in an efficient and feasiblebuilding process, a prototype is made firstly to discuss a possible fabricationmethod with folding and gluing as the main connecting technique. In this way, thecomplicated and coupled geometry can be divided into different classes and canbe fabricated with the CNC laser cutter and manually gluing of the finger stripsas well as an assistant curved frame. A prototype was then built as a group with 4cells in different sizes (Figure 3).
The fabrication process can be divided into several steps: 1, fold the rib frameto create the basic form of the cells, connect the ribs with bolts, nuts and washers;2, paste the assist curved frame to find the correct form of the cell through the cutgeometry and also to offer more adherent surface for the membranes, at the sametime prefabricating the curved membranes; 3, paste the membranes and insertingthe center tube, which will make the cellular cavity structure very stable.
Figure 3. Prototype and construction details of the cell group.
2.4. DESIGN PROCEDURE OF CELLULAR CAVITY STRUCTURES
Based on the assumption and the analysis of the expected structural behavior, afinal summary of the whole design procedure of the structure system is madeas the guideline of the design process for the structure concept. Starting froman arbitrary geometry or a simple planar region as design domain, a basictessellation should be generated as the primary discretization of the structuralsystem. Form-finding techniques can be applied in the next step to gain the spatialmesh in pure compressive equilibrium. By changing the triangulation into thereciprocal 3-valency mesh or by optimizing the quadrilateral mesh into a circularmesh, the circumferential ribs can be obtained as planar surfaces. By adding boththe top and bottom covering membranes into the structure, an initial design canbe achieved in a feasible and rational method. However, a full structural FEManalysis or a physical test is still required as there are some assumptions in thedesign. In conclusion, a workflow should be required to establish such a designmethodology of the negotiation between form and forces and the iteration loopsof the design procedure are introduced from both the architectural and structuralrealms.

302 P.F. YUAN, X. WANG AND X. WANG
Figure 4. Comprehensive design loops of the Cellular Cavity structure.
3. Material Analysis and the Structural Behavior3.1. PROPERTIES OF PAPERBOARD AND THE PARAMETRIZED MODEL
In the research presented in this paper, the paperboard is chosen as therepresentative building material. As the applied press paperboard has beenspecificly treated with a chemical process, the mechanical properties and behaviorneed a suitable model for analysis and dimensioning the structure. Based onthe similar researches on the same kind of materials (Schönwälder and Rots,2008), it is possible to connect the design parameters with proportionality factorsfrom material testing, reducing the amount of key parameters that are needed foranalysis. So the parametricmodel was extended and scaled for the use in the designof the pavilion. The simplified TSAI-WU-criterion for paper products (Niskanen,2012) was used for dimensioning and the safety model from the Eurocode 5 designstandard integrated to incorporate creep and relaxation via kmod-factors, whichwas necessary since creep and relaxation of wood and paper products are stillsubject of research and a suitable generalized model is up to date not available.A simple linear model used for the design with a trilinear approximation of theactual tensile stress diagram was used as the parameters of the materials (Table 1).

CELLULAR CAVITY STRUCTURE AND ITS APPLICATION ON ALONG-SPAN FORM-FOUND SHELL DESIGN
303
Table 1. Details of the parameters of the paperboard.
3.2. STRUCTURAL ANALYSIS WITH A SIMPLE HALF-DOME PAVILION
A full structural analysis with the FEM software is carried out and finished in theforegoing research pavilion with a relatively simple pavilion (Figure 5a) and is alsoused as the foundation of the design of the shell in this paper, because the shape of ahalf dome is classic and symmetric so that multiple simplification of the structureand multiple load cases can be analyzed and also compared with the theoreticalstructural analysis of the dome shells. As shown in Figure 5b, shell surfaces weresimplified with a constant substitute thickness and the model is simplified to treatthe local membrane action on both covering membranes as a simple membraneaction on a fictitious shell surface. In this case, multiple load cases such as theself-weight and its combination with the assumed wind load and the snow load areconsidered and analyzed (Figure 5c). While effective (von Mises-) stresses wereused to visualize stress concentrations, the stress checks were done externally withthe maximum-stress- and Tsai-Wu-criterion. To examine stability, eigenmodes ofthe structure were used as imperfection and the second and third order theorieswere applied, the latter because of higher deformations were expected.
Figure 5. Finite Element Analysis of the foregoing research pavilion of the Cellular CavityStructure.
The result of the basic structural analysis shows a similar structural behavioras the classic half sphere dome structure. Finally, a hemisphere section modelsolely with shell elements was used to reproduce the structure as close to realityas possible and to compare with the analysis of the simplified model. As shown

304 P.F. YUAN, X. WANG AND X. WANG
in Figure 5d, a similar global stress distribution can be observed as the simplifiedmodel and meanwhile a prominent reduction of maximum stresses can be found inthe detailed model with both coveringmembranes. The result follows the expectedstructural behavior as explained in section 2.2. The covering membranes togethertake most of the external load through the membrane forces and the stressesconcentrate on the apex point of every curved membranes. The ribs themselvestake little stresses in the stable condition and will help to stiffen the superstructure.In conclusion, the expected global and local membrane behavior are both testifiedwith the FEM analysis and the global structural behavior is also similar to thetraditional theoretical analysis of the classic dome structure.
3.3. BUCKLING ANALYSIS AND PHYSICAL EXPERIMENTS
To test the effect of the covering membranes for the local stability under axialcompression, a pressing test is finished in laboratory as a basis of the buildingpractice (Figure 6a). As it is impossible to design a compressive test underbidirectional forces, a uni-axial compressive test is carried out with extra supportson the other axis. At the same time, different shapes of the covering membranes(conical, folded and planar) are also compared to test the effectiveness of thecurved membranes to activate the local membrane behavior (Figure 6b).
Figure 6. Pressing test and the DIC analysis of the buckling behavior.
The result of the physical tests of different groups (Figure 6c) and the detailedDIC analysis (Figure 6d) show the similar structural behavior as the FEM analysis.However, the critical buckling load in the physical tests has shown to be largelyreduced compared with the theoretical critical load in the linear buckling analysisin the Finite Element Software. This shows the possible great effect of initialimperfections of the geometry on the buckling behavior of the structure. However,for the chosen curved membranes, it has been shown that the critical buckling loadin the physical tests (about 5739N) was almost 1200 times of the self-weight ofthe tested specimen. Hence the assumption that the cells could be considered asstable enough under compression can be proved as correct.

CELLULAR CAVITY STRUCTURE AND ITS APPLICATION ON ALONG-SPAN FORM-FOUND SHELL DESIGN
305
4. The Design, Fabrication and Assembly of a Long-span Form-foundPavilionThe pavilion is built with 179 distinct cellular cavities whose design and fabricationprocess is fully under a parametric approach. The global geometry of the pavilionis defined through a form-finding technique of shell structure with a funicularsystem with a triangular mesh as a preliminary design. A Voronoi tessellation isthen applied onto this system to find the developable surfaces of all the structuralelements. The fabrication of all the cells are then finished with a laser machineand a simple manually gluing process.
The fabrication process of the complicated and large shell paviliondemonstrates the high efficiency of the structural concept. The whole fabricationand building process of the large pavilion is finished by a workshop in 3 dayswith 15 students. The total budget of the shell pavilion is only about 1300 USDollar and no extra scaffolds are required due to the light weight of the structuralelements. The high redundancy of the structure is proved because the structure isstill left unfinished without most of the bottom covering membranes. It is foundduring the assembly that the structure itself already provides enough stiffness tostand only by itself.
Figure 7. The fabrication and assembly of the form-found shell pavilion.
The assembly process of the pavilion is finished by the group of student in ashort time about 4 hours. Because a group strategy is applied in the prefabricationto build the structural elements into several groups, it only needs to fix theconnection in-between the groups with screws. As the holes are prefabricated withCNC laser cutter, the accuracy of the arrangement of cells can also be providedduring the assembly process. Hence the building techniques of the proposed in thispaper is also demonstrated to be feasible to be used in complicated shell designs.
5. Conclusion and Future ResearchesWith the complicated form-found shell and the sufficient structural analysis andtests, the cellular cavity structure has shown its great potentials and feasibilityas a more efficient structural concept for the selected materials and as suitableto be used in a complex design condition and domain. The research method of

306 P.F. YUAN, X. WANG AND X. WANG
the generation process of this structural concept will lead a further research onthe discrete cellular structure based on the structural-performative design methodas well as an automated digital fabrication process based on the application ofmachines such as the robotics.
AcknowledgementThis research is funded by the National Natural Science Foundation of China(Grant No.51578378), the Special Funds for State Key R&D Program duringthe 13th Five-year Plan Period of China (Grant No.2016YFC0702104), theSino- German Center Research Program (Grant No.GZ1162), and Science andTechnology Commission of Shanghai Municipality (Grant No.16dz1206502,Grant No.16dz2250500, Grant No.17dz1203405).
ReferencesAanhaanen, J.: 2008, The stability of a glass facetted shell structure, Master’s Thesis, The
Netherlands: Delft University of Technology.S. Adriaenssens, P. Block, D. Veenendaal and C. Williams (eds.): 2014, Shell structures for
architecture: form finding and optimization, Routledge.Ayan, Ö: 2009, Cardboard in Architectural Technology and Structural Engineering: A
Conceptual Approach to Cardboard Buildings in Architecture, Ph.D. Thesis, ETH.Bagger, A., Jönsson, J., Almegaard, H., Hertz, K.D. and Sobek, W.: 2010, Plate shell structures
of glass: Studies leading to guidelines for structural design, Technical University ofDenmark (DTU).
Brinkmann, G.: 1990, Leicht und weit: zur Konstruktion weitgespannter Flächentragwerke;Ergebnisse aus dem Sonderforschungsbereich 64 “Weitgespannte Flächentragwerke” derUniversität Stuttgart, VCH-Verlag-Ges..
Flügge, W.: 2013, Stresses in shells, Springer Science & Business Media.Hachul, H.: 2006, Neue Strukturformen und Technologien für Tragkonstruktionen aus
Feinblech, Ph.D. Thesis, RWTH AACHEN UNIVERSITY.Krieg, O.D., Schwinn, T., Menges, A., Li, J.M., Knippers, J., Schmitt, A. and Schwieger, V.
2015, Biomimetic lightweight timber plate shells: Computational integration of roboticfabrication, architectural geometry and structural design, in P. Block, J. Knippers, N.J. Mitraand W.P. Wang (eds.), Advances in Architectural Geometry 2014, Springer, 109-125.
La Magna, R., Waimer, F. and Knippers, J.: 2012, Nature-inspired generation scheme for shellstructures, 2013 IASS Annual Symposium: Beyond the Limits of Man, , .
Niskanen, K.: 2012, Mechanics of paper products, Walter de Gruyter.Pottmann, H., Jiang, C., Höbinger, M.,Wang, J., Bompas, P. andWallner, J.: 2015, Cell packing
structures, Computer-Aided Design, 60, 70-83.Ramm, E. 2011, From “Shell” to “Shell and Spatial” Structures, in I. Mungan and J.F. Abel
(eds.), Fifty Years of Progress for Shell and Spatial Structures, Multi-Sciences.Schönwälder, J. and Rots, J.: 2008, Mechanical behaviour of cardboard in Construction,
Cardboard in Architecture, 7, 131.Wang, X.: 2017, Cellular Cavity Structure and its Building Technology for Shell Structure with
Thin Sheet Materials–Geometrical Analysis and Structural Consideration in the Design andBuilding Processes, Ph.D. Thesis, Technische Universität Darmstadt.
Werth, R.: 2015, Entwurf, Berechnung und Konstruktion einer Schalenstruktur aus Papier undDünnglas, Master’s Thesis, Technische Universität Darmstadt.
Yuan, P.F., Xiao, T. and Devadass, P.: 2014, Fabricating Complexity - A Performance BasedMethodology through Parametric Optimization., Advanced Materials Research, 889-890,1240-1245.

3D GROWTH MORPHOLOGY - TECTONICS OF CUSTOM SHAPESIN RECIPROCAL SYSTEMS
REBEKAH ARAULLO1University of [email protected]
Abstract. Traditionally, Reciprocal Frame (RF) structures feature theuse of linear materials such as rods, beams and bars. Their potential invaried curvature and doubly-curved forms illustrate ongoing advances incomputation and fabrication. Flexible to using small available materialsthat span large areas, RF systems appeal as a popular research topic todemonstrate tectonic and engineering feats. However, RF using planarmaterials is a non-traditional application and is not widely explored inresearch. This paper discusses RF research projects that feature planarcustom shapes with unique 3D tectonic capabilities. Their aestheticproperties and structural opportunities will be discussed and evaluated.The objective of this paper is to examine the use of planar materialsand highlight the potential of irregular 3D reciprocal systems. Theuse of custom shapes in a reciprocal system and their unique growthmorphologies presents a novel direction in the practice of reciprocalsystems.
Keywords. Reciprocal Frames; Spaceframes; ComputationalDesign; Digital Fabrication; RF Growth Morphology.
1. IntroductionReciprocal Frame structures have been featured extensively in research. Theirdiverse tectonic capabilities in the use of small materials that can span doublycurved forms and freeform structures continue to be of interest in many researchlabs and institutions. With the rise in computational power, robotics and CNCmachines, reciprocal frames serve as a great topic that can demonstrate manyadvances in these areas, such as research from Gramazio and Kohler in ComplexTimber Structures (Søndergaard et al 2016). When exploring form and elaboratestructures, reciprocal systems showcase developments in computation and digitalfabrication. Extensively, linear materials such as beams, rods and bars make upthese research projects. They demonstrate that through advances in computation,the geometric configuration of linear materials in RF structures can achievevarying degrees of complexity, as well, featured in such works of Larsen, Bavereland Pugnale, to name a few.
The concept of the reciprocal frame derives its roots from prehistoric buildingtypes where the issue of availability of materials and the relevance of humanagents in their development are central. Similarly today, as mobile and rapidly
T. Fukuda, W. Huang, P. Janssen, K. Crolla, S. Alhadidi (eds.), Learning, Adapting and Prototyping,Proceedings of the 23rd International Conference of the Association for Computer-Aided ArchitecturalDesign Research in Asia (CAADRIA) 2018, Volume 1, 307-316. © 2018 and published by the Associationfor Computer-Aided Architectural Design Research in Asia (CAADRIA) in Hong Kong.

308 R. ARAULLO
assembled structures play a major role in contemporary society (De Temmermanand Brebbia 2014), reciprocal frames are designed and constructed for its economyand mobility, renewing the role of the designer, architect and fabricator. This isevidenced by small-scale fablabs to a shift in DIY full scale RF assemblage of rodsand bars featured in most research projects. Like linear RF, planar RF’s prolificnetwork can result in elaborate configurations to provide new design and structuralopportunities unique to the use of planar RF (Araullo and Haeusler 2017).
1.1. OBSERVATIONS
Advances in computation and fabrication usher in a revival of the practice ofreciprocal frames which predates modern design and construction. In the lasttwo decades we see novel freeform RF structures achieved in varying degreesof complexity. When populated over a global form, the geometric profile of RFconfigurations represents polygons and can be considered as its basic DNA. Bydefinition, polygons are 2D shapes bounded by a finite number of straight edges.These polygons offer opportunities to elicit ways to re-configure and discretise theglobal form. The rods and bars of an RF populated over the global form representedges of polygons, or as a 3D RF, their polyhedra counterpart (Figure 1).
Figure 1. 2D to 3D Reciprocal Frame.
Examine the 3DRFwhere the faces of the cube can be arranged and configuredin an RF assembly, such as the Ptolemi project (Araullo and Haeusler 2017). Asestablished, when linear materials in regular RF assemblies are replaced by customshapes, the size and nature of the shapes extend design opportunities. The basicprinciples of reciprocity can be observed where planar shapes are configured tosupport one another. This paper examines projects that explore diverse planar RFarrangements and investigates the potential for using custom 2-D shapes.
2. Background2.1. RECIPROCAL FRAME STRUCTURES
Reciprocal Frame structures are often associated with weaving structures,tensegrity structures, mandala roofs, nexorades and grillages. The basic assemblyof these is described by Popovic Larsen (2008) and features the use of linearmaterials (Figure 2).
Figure 2. Fan/Nexor; Reciprocal Frames (Larsen, 2008) .

3D GROWTH MORPHOLOGY - TECTONICS OF CUSTOM SHAPES INRECIPROCAL SYSTEMS
309
These basic configurations are generally referred to as ‘fans’ or ‘nexors’. Therules for linear RF require each member to support and be supported by another,and that the supported element sits along the span of the support away from thevertices to avoid the generation of a space grid, as well configured without anyclear structural hierarchy.
Moreover, an RF configuration can also be constructed from identical ornon-identical basic elements as long as a tessellation pattern exists (Kohlhammerand Kotnik 2011).
2.2. PLANAR RECIPROCAL FRAME STRUCTURES
In this paper, the definition of Planar RF is emphasized as being the kind ofstructure that uses planar shapes in place of linear materials such as rods, beamsand bars. The term ‘planar RF’ was also used by Popovic Larsen (2008) whenreferring to the flooring of the Mill Creek Public Housing Project by Louis Kahn.However, this paper refers to building materials that are planar such as timbersheeting, composites and acrylic sheeting in place of beams, bars and rods used inan RF assembly.
When compared to linear RF, the sizing of planar members - their depth - is anexternal parameter (Garcia Puyol 2015) which extend opportunities in planar RFconfigurations. Examples that feature planar RF include the Serpentine GalleryPavilion in 2005 by Siza and deMoura with Balmond (Figure 3) using planarboards arranged in an RF. Similarly, the Coca Cola Beatbox Pavilion by Khanand Ohrstedt in 2012 uses planar materials (Figure 4).
Figure 3. Serpentine Gallery Pavilion 2005 (C Balmond).
Figure 4. Coca Cola Beatbox Pavilion 2012 (Khan and Ohrstedt).
2.2.1. Planar RF Tentative ClassificationIn 2013 Baverel and Pugnale have presented a first attempt of planar RFclassification (Baverel and Pugnale 2013). The first classification is describedas those where the planar boards are treated the same way as rods and beams,classified as ‘Thick Elongated Elements’, such as the system employed in the

310 R. ARAULLO
2005 Serpentine Gallery Pavilion and the Coca Cola Beatbox Pavilion. The secondclassification refers to grouping linear elements that represent planar shapes, called‘Groups of Linear Elements’ (Figure 5), and often times arranged as skins or as asurface.
Figure 5. Class 2: Groups of Linear Elements (Baverel and Pugnale 2013) .
The third classification by Baverel and Pugnale describes all those that fallin neither of the first two classifications. Two types can be distinguished inthis classification: One, where the notch between the planar elements transmitsa bending moment (Figure 6a); two, where the notch permits the element totransmit traction or compression forces (Figure 6b). This basic configurationcan be developed in a surface-like way or as a fully three dimensional structure(Baverel and Pugnale 2013).
Figure 6. (a) Class 3: Bending moment at notches; (b) Class 3: Truss-like.
In this, we posit that irregular custom shapes when introduced and configuredin this third RF classification new design opportunities can be further elicited.It can be conceived that when the basic geometry of individual elements in aregular RF is altered, akin to altering its basic geometric DNA and which canvary greatly from the conventional tessellation pattern often seen in reciprocalframe configurations, such as rectangles, triangles, hexagons and the like, the finaloutcome can be unpredictable and can produce interesting forms.
3. Research QuestionWe can observe that planar basic geometric profiles are often featured inconventional linear reciprocal frames, such as hexagons, triangles, rectangles andas described in the first 3D classification such as those illustrated in Figures3 and 4. We can also predict that when the basic geometric DNA of RF

3D GROWTH MORPHOLOGY - TECTONICS OF CUSTOM SHAPES INRECIPROCAL SYSTEMS
311
systems are none of these shapes but are instead replaced by irregular customshapes, design configurations can be harder to conceive producing erratic andunpredictable tectonic results. What criteria can be considered in mapping itsUVW morphology? As illustrated in Figure 1, UVW can present challenges inthe issue of supporting and supported members. As demonstrated in the Ptolemiproject (Araullo and Haeusler 2017), where a quadrilateral RF can be generative in3 dimensions, the localised UVW of irregular members or custom shapes howeverproduces new morphological challenges.
4. MethodologyBuilding on existing knowledge and studies of RF as well as research that explorethe potential of using planar materials in a reciprocal configuration, the followingcase study of built prototypes will discuss design opportunities and challenges inscenarios where irregular custom shapes are featured in an RF. The research useda design research method to develop 1:1 scale prototype of multi-unit reciprocalframe system that have three dimensional capabilities. The case study aligns itsinvestigations within the third classification of RF structures described by Bavereland Pugnale.
4.1. CASE STUDY
Euphonious Mobius is a freestanding structure where an irregular custom shapewas used and configured in an assembly adopting the basic principles of RF.
This project was commissioned by Destination NSW for exhibition at VividSydney. The basic concept is derived from a design of building blocks thatrepresent the Mobius geometry. As the name suggests, the resulting form is anabstract representation of a segment of the Mobius strip (Figure 7).
Figure 7. Euphonious Mobius at Vivid Sydney.
Made of 10mm acrylic the resulting overall form was intended to resemble asegment of the Mobius geometry. The RF structure featured fluid irregularities toexhibit the concept that architecture is non static (Figure 8)

312 R. ARAULLO
Figure 8. Fluid irregularities of mobius building blocks.
4.1.1. Design PrinciplesIn this reciprocal configuration, theMobius building block is considered as a singleRF unit or nexor. The members of each block consisted of two custom shapes - anirregular quadrilateral shape and a non-convex polygon similar to a boomerang,
Figure 9 illustrates an evolution from 2D to 3D. The quadrilateral RF unit orfan evolves from 1) linear bars, to 2) planar rectangular shapes, then finally to 3)an adoption of custom 2D shapes arranged along the localised UVW to form theMobius RF unit (Figure 9.3).
Figure 9. 1) Linear, 2) Planar, 3) Custom Shape .
The design and structural potential for this Mobius RF unit is illustrated inFigure 10. Growth morphology can be observed in three dimensions. Thesingle RF, when populated over the UV of a global form, can be assembled ina multi quadrilateral RF configuration. Reciprocity can also be enabled along theelevation to create a 3D space truss. Finally, to further its architectural expression,theMobius RF configuration can be adapted to an irregular quadrilateral grid or theUVW of a curvilinear form. The project additionally tests the system’s aestheticvalue by adapting the Mobius RF units to transform the tessellation pattern tofeature fluid differentiation in scale and shape for aesthetic ambition.
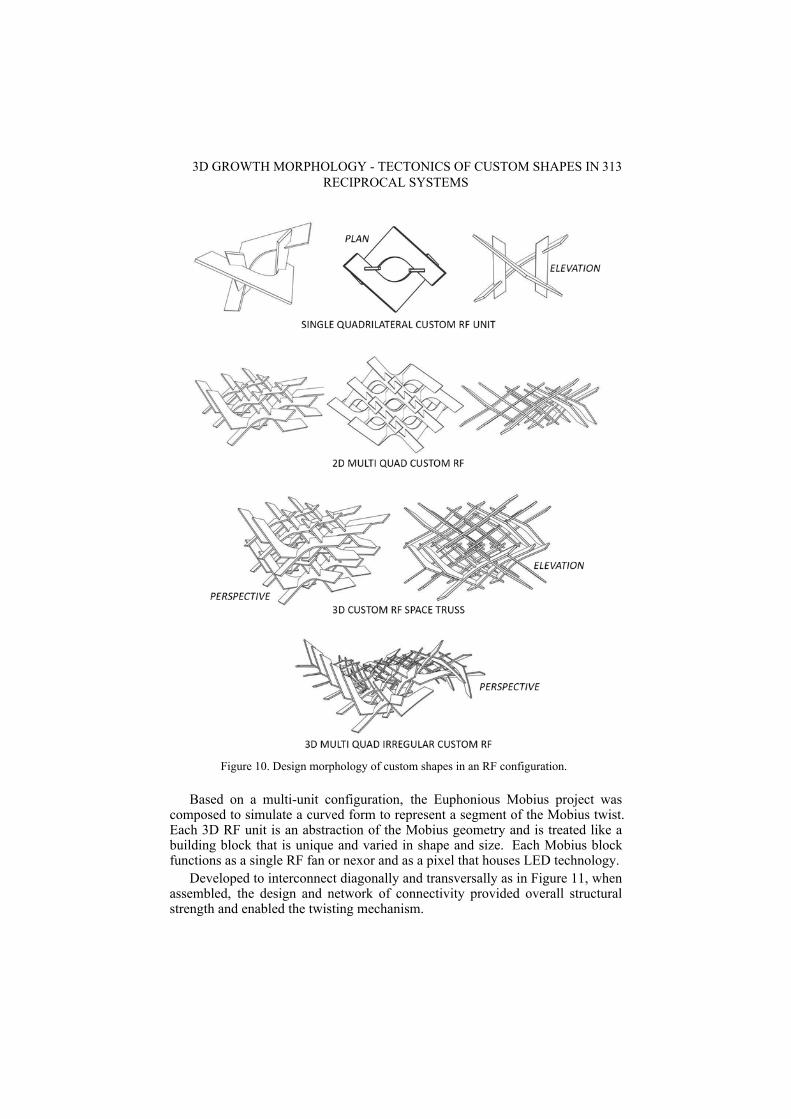
3D GROWTH MORPHOLOGY - TECTONICS OF CUSTOM SHAPES INRECIPROCAL SYSTEMS
313
Figure 10. Design morphology of custom shapes in an RF configuration.
Based on a multi-unit configuration, the Euphonious Mobius project wascomposed to simulate a curved form to represent a segment of the Mobius twist.Each 3D RF unit is an abstraction of the Mobius geometry and is treated like abuilding block that is unique and varied in shape and size. Each Mobius blockfunctions as a single RF fan or nexor and as a pixel that houses LED technology.
Developed to interconnect diagonally and transversally as in Figure 11, whenassembled, the design and network of connectivity provided overall structuralstrength and enabled the twisting mechanism.

314 R. ARAULLO
Figure 11. Assembly diagram.
As an RF spaceframe, the Mobius structure was built to span seven and a halfmeters in length, with a two and a half meter maximum height and a weight ofover a tonne (Figure 12).
Figure 12. Euphonious Mobius along UV ground plane.
The structure can flex and can be positioned in various poses as a freestandingcomplex structure. Figure 13 (a) and 13 (b) feature the twisting in form.
Figure 13. (a) Mobius segment rear; (b) Mobius segment front.
4.1.2. Material and NodesThe project used 10 mm lasercut acrylic material. In collaboration with Arupengineering 12mm industrial cable ties were instead used to connect all themembers together through lasercut holes. However the preferred alternative wasplywood, where the shapes ormembers can intersect to allow for notches to resolveconnection events. As the members intersected at varying angles,the result wouldproduce irregular 3D notches. However, this project was limited to using available

3D GROWTH MORPHOLOGY - TECTONICS OF CUSTOM SHAPES INRECIPROCAL SYSTEMS
315
acrylic sheets as material and the use of a 3-axis lasercutter.
4.1.3. Construction and AssemblyThe construction and assembly method for the RF components is similar to theassembly of conventional RF linear structures, whereby the origin of assemblyoccurs from a single RF unit. In this case, when each Mobius RF unit wasassembled, each was interconnected to be supported by their diagonal counterpartsin both directions, then transversally. As a flexible structure weighing over atonne, the challenge was being able to move the structure in different poses whichrequired rigging (Figure 14).
Figure 14. Arup engineering, rigging and 3D RF assembly.
4.1.4. EvaluationThe adoption of the Mobius segment for its global form resulted in significantcompression benefits. The transversal connection strategy allowed the complexstructure to be self-supporting under both compression and tension as the formis stretched and twisted across. The RF units connect transversally in threedimensions and were in effect assembled as a spaceframe. Through thisarrangement, each member supported and was supported by another, whereby, theconnections allowed the components to transmit traction and compression forces.The use of cable ties in this project allowed somemovementwithout compromisingtheir connectivity. The entire system is self-supporting and flexible, exhibitingdiverse topographic features (Figure 15).
Figure 15. 3D RF using 2D custom shapes generates diverse topographic features.
316 R. ARAULLO
5. ConclusionSelf-registration, digital fabrication and CNC equipment bring a level of simplicityto complex custom RF structures. The condition of whether member 1 liesunder or above member 2 (Parigi et al, 2012) is generally a main considerationin an RF assembly. Auspiciously, custom shapes in an RF allowed formultiple scenarios and conditions of supporting and supported members. Growthmorphology and possible RF configurations are intrinsic properties. The useof non-convex polygons similar to boomerang shapes that make up the MobiusRF as a spaceframe illustrates extensive possibilities on the issue of supportedand supporting conditions. Whereby, the angled boomerang shapes allowedunique intersection events where the angles are considered as another externalparameter, resulting challenges in load paths can affect structural efficienciesof an RF. However, numerous tectonic opportunities present themselves in thenature and size of the custom shapes as illustrated in this case study. As asustainable solution, RF structures are reliant on issues and limits of serviceability.In an increasingly mobile society where we see a rise in the need for portableand semi-permanent structures, custom planar RF may present and encouragenew architectural typologies. Embedded schemes such as media, sensors, etc,that informs on the overall form tests RF’s serviceability in the area of mediaarchitecture and as an architectural interface.
Further exploration into the use of custom shapes or a combination of shapesor use of different approaches such that the RF can be a top-down design approachwhere the outcome is pre-defined would be beneficial in developing a customplanar RF taxonomy for the practicing community. It is also important to point outthat this complex assemblage will require digital fabrication and can be beneficialfor advancing robotic and CNC processes.
ReferencesAraullo, R. and Haeusler, M.: 2017, Asymmetrical Double-Notch Connection System In Planar
Reciprocal Frame Structures, Proceedings of CAADRIA 2017, Suzhou.Baverel, O. and Pugnale, A.: 2013, Reciprocal systems based on planar elements, Proceedings
of the ICSA 2013 “Structures and Architecture”, Guimaraes.Kohlhammer, T. and Kotnik, T.: 2011, Systemic behaviour of plane reciprocal frame structures,
Structural Engineering International 21, 1, 80-86.Larsen, O.P.: 2008, Reciprocal frame architecture, Routledge.Parigi, D., Kirkegaard, P.H. and Sassone, M.: 2012, Hybrid optimization in the design of
reciprocal structures, Proceedings of the IASS Symposium 2012: from spatial structuresto spaces structures.
Puyol, A.G.: 2015, Mass Customization of Reciprocal Frame Structures, Proceedings of theInternational Association for Shell and Spatial Structures (IASS), Amsterdam.
Søndergaard, A., Amir, O., Eversmann, P., Piskorec, L., Stan, F., Gramazio, F. and Kohler, M.:2016, Topology Optimization and Robotic Fabrication of Advanced Timber Space-FrameStructures, Robotic Fabrication in Architecture, Art and Design 2016, 190-203.
De Temmerman, N. and Brebbia, C.: 2014, Mobile And Rapidly Assembled Structures IV, 1sted, Southampton: WIT Press.
Tong, Z. and Zhou, R.: 2016, Design and fabrication of 3D reciprocal frame structure,Proceedings of CAADRIA 2016, Hong Kong.

DIGITAL FABRICATION FOR RETROREFLECTIVE CEILINGTREATMENT
Reducing Speech Distraction in an Open Work Environment
ADAM HANNOUCH1, HUGO CALDWELL2, DENSIL CABRERA3
and DAGMAR REINHARDT41,2,3,4University of Sydney, Australia1,2,3,4{adam.hannouch|hugo.caldwell|densil.cabrera|dagmar.reinhardt}@sydney.edu.au
Abstract. This paper presents a case study for the production ofretroreflective ceiling treatment in an open work environment. In thissetting with multiple talkers, speech distraction can be a significantcause of dissatisfaction and loss of productivity. Ceiling treatmentin open plan work environments can provide an important way ofameliorating distraction from unattended speech, and rather thanabsorbing the sound at the ceiling, this paper examines the possibility ofreflecting sound back to the source. Computational design and digitalfabrication are integrated in this research for a site-specific deploymentof the ceiling treatment and physical testing of prototypes in anacoustics laboratory. The contemporary possibilities that open up withnew technologies to understand and resurrect faceted geometries andpotentially vary historical precedents via newmanufacturing techniquesare demonstrated in these novel acoustic reflective ceilings that reflectsound back to their original source.
Keywords. Acoustic Ceiling Treatment; Computational Design;Digital Fabrication; Faceted Geometries; Retroreflection.
1. IntroductionThis paper outlines a digital workflow for the design, fabrication and testingof multiple ceiling arrangements and spatial conditions for a client to minimisespeech distraction in an open workspace. A series of timber prototypes are testedfor acoustic retroreflectivity as indicated by computer simulations and physicaltesting on modular clusters of regular and irregular forms arranged in cubic ortriangular trihedral arrays of concave right-angle corners. A fluent informationtransfer sits at the core of the research, from computational design-to-generatedcode for CNC and multi-axis robotic milling which potentially streamlines theproduction of non-standard, complex geometries. A series of comparativeanalyses is conducted for acoustic testing in digital and physical scenarios, aswell as between standard non-conditioned surfaces and acoustically conditioned
T. Fukuda, W. Huang, P. Janssen, K. Crolla, S. Alhadidi (eds.), Learning, Adapting and Prototyping,Proceedings of the 23rd International Conference of the Association for Computer-Aided ArchitecturalDesign Research in Asia (CAADRIA) 2018, Volume 1, 317-325. © 2018 and published by the Associationfor Computer-Aided Architectural Design Research in Asia (CAADRIA) in Hong Kong.

318 A. HANNOUCH ET AL.
surfaces. This case study demonstrates that we can rely on computational designto explain variant complexities (Naboni, Paoletti, 2015, p. 154) for production andperformative testing.
2. Background2.1. SOUND REFLECTION: WHY RETROREFLECTION?
Very commonly, acoustic conditioning inmulti-talker environments is achieved by‘acoustic tiles’, which offer a high degree of sound absorption so as to minimisethe sound reflected from the ceiling. Minimising ceiling reflections can increasethe spatial decay rate of speech, thereby increasing privacy and reducing speechdistraction and the build-up of noise. However, a side-effect of this is that thespace becomes ‘dead’. The client of this research project desired a ‘live’ soundenvironment in an open workspace. Another common ceiling treatment (or lackthereof) is a hard flat ceiling, which produces mirror-like reflections, which cancontribute to speech disturbance over distance. Alternatively, a sound-scatteringceiling produces reflections in all directions from everywhere. This is oftenbeneficial in critical listening spaces, such as sound studios, rooms for music; andin other situations where echoes can be a problem in auditoria, and roadside noisebarriers.
The concept of a retroreflective ceiling is that it returns the sound to where itcame from. This has the potential to provide a feeling of acoustic support to aperson who is speaking, which can make communication more comfortable, andlead to a more relaxed vocal effort (Brunskog et al., 2009). It also has the potentialto reduce disturbance to others somewhat similarly to an absorptive ceiling byreducing disturbing reflections. However, as a retroreflective surface does notabsorb much sound, it engenders a ‘live’ acoustic environment.
Extensive research on retroreflective forms for optics and radar has beenimplemented to various devices, e.g. trihedral corner reflectors (e.g., Eckhardt,1971) and sheeting, but is lacking in architectural acoustics. Notable ceilingdesigns act as architectural precedents to this research, which could beretroreflective if their geometric systems were slightly altered. These includehexagonal prisms in the Harpa Foyer, Reykjavik, and non-right angled tetrahedralcavities in the Yale University Art Gallery & National Gallery of Australia, wherehad these systems been right-angled trihedra they would achieve acousticallyretroreflective ceilings. However, there are some architectural precedents foracoustically retroreflective facades, most strikingly the Ports 1961 FlagshipStore building (Shanghai) façade, which uses 300 mm glass cubes (Barr, 2016).However, acoustic retroreflectivity appears to be unintentional in that design. Thisresearch identifies a growing link between faceted geometries and architecturalacoustics.
2.2. FACETED GEOMETRIES
To test base geometries for acoustic retroreflection, inspiration is drawn from thehistoric quad-subdivision of geometries in vaulted structures, notably found atthe Alhambra Palace in Granada, c. 1200’s. The muqarnas shown in Figure 1,

DIGITAL FABRICATION FOR RETROREFLECTIVE CEILINGTREATMENT
319
a technique characterised for ornamental vaulting consisting of intricately-tiledstructures (Castera, 2003), is not purely aesthetic but also structural. Ideally, themore ornate these 90-degree facets are, the more weight they can support (Schlager& Lauer, 2001), lending to the notion that function (as load-bearing support)and form (as ornament) are synonymous. Where ornament is intrinsically linkedto structural performance in the Alhambra, the concept that faceted geometriesdrive functionality is paralleled in this research in the exploration of customisedretroflective surfaces for acoustic performance.
Figure 1. Muqarnas column and arch at the Patio de los Leones, Granada.
3. Variable Geometries for Acoustic RetroreflectionA trihedral array is examined as the principle geometry for this alternativeapproach to ceiling treatment in Figure 2a. There are two simple solutions totessellated trihedra, one with square faces (hexagonal tessellation) and the otherwith triangular faces (triangular tessellation). While the regularity of these islimiting from an architectural design perspective, intermediate solutions betweenthese extremes allow for a variable geometric design. This research conductsiterations using computational design to make variations to the ‘square’ and‘triangular’ trihedra: if not to their cluster arrangements then to their corners.Immediately, a 90-degree inversion to the convex corner of the ‘square’ is realisedfrom the geometric principle of the ‘triangle’ for different lengths of folding inFigure 2b. The two shapes nevertheless share the same principle, only differingby the length of an inverted fold to the convex corner. The inversion of all convexcorners which initially offer little by way of acoustic performance or aestheticquality now double the number of retroreflective corners.

320 A. HANNOUCH ET AL.
Figure 2. a. Principle geometry of a retroreflective trihedral array. b. Generating an irregularfold pattern for all convex corners.
The parametric design of different types of triangles solves ceiling heightconstraints and aesthetic appeal where the folding of all convex corners pushback the lengthy protrusions of a standard trihedral array. The variable geometrycontributes to the trade-off between the size and number of retroreflective corners.Right-angled folds made to all convex corners can be shaped into equilateral,isosceles and scalene triangles, where equilateral is the most regular surface; anisosceles can point in the same direction for an informed or directional visual effect;and scalene is the most irregular given that all sides are unequal. An irregularscalene pattern would be the most effective for a live space in a work environmentas the source angle of a speaker’s voice can come from any location in plan and/orelevated height. Grasshopper is used in Figure 3 for a mass deployment of 450 mmand 550mmmodular-sized iterations for comparison, and algorithmic adjustmentsto the secondary triangular folds and ‘culling’ of modules where suspended ceilingservices and structure would not permit them.
Figure 3. Ceiling deployment comparison of a. 550 mm and b. 450 mm modules in an openplan workspace (culled modules are in red).

DIGITAL FABRICATION FOR RETROREFLECTIVE CEILINGTREATMENT
321
4. Acoustic Rationale, Testing and ResultsAcoustic design of a retroreflective ceiling treatment requires a balance betweenthe size of each reflector and the number of reflectors per unit area. The bestsolution is likely to depend upon ceiling height: a lower ceiling will benefitfrom more densely packed smaller reflectors. Simply put, the energy of theretroreflection focus depends on the number of simultaneously visible concavecorners (or full faces), but is highly frequency-dependent, with larger reflectorsextending the effect to lower frequencies. To be effective for speech in amulti-talker environment, the aim of the treatment is to reduce intelligibility ofothers’ irrelevant speech (Virjonen et al, 2007). Fortunately, consonant phonemes,which often have distinctive features in the high frequency range, are much moreimportant than vowel phonemes (which have main distinctive features in themid-frequency range) for speech intelligibility. Therefore we aimed to provideretroreflection from 1 kHz and above through the ceiling treatment, which shouldsubstantially affect the most important part of the spectrum for intelligibility (andhence distraction). Hence wavelengths of around 344 mm and smaller should beretroreflected, which implies that the reflector appertures need to be at least thissize, and preferably larger (Ichikawa, 2004).
Initial tests were done using regular arrays of 10 square and 9 triangulartrihedra, with 300 mm edge lengths, made from timber. Measurements were madewith the sample at the equator of a hemispherical (2.1 m radius) 196-loudspeakerarray in a highly sound-absorptive environment, described by Cabrera et al.(2015). Figure 4 shows an example of the distribution of reflected sound energyin mid-to-high frequency octave bands. Retroreflectivity is summarized by theamount of reflected energy returned to the source (Lretro) and by the retroreflectivedirectivity index (DI), which is the ratio of this to the average energy over thewholehemisphere, expressed in decibels.
Figure 4. Spatial distribution of octave band reflected sound energy received at a normalincidence microphone from 196 loudspeakers distributed over a hemisphere, using a square
trihedral array (top row) and triangular trihedral array (bottom row) with 300 mm edge lengths.Values are in decibels, normalised to the greatest value. Mesh intersections indicate
loudspeaker positions (using stereographic projection of the hemisphere onto a plane).

322 A. HANNOUCH ET AL.
Results indicate that the 300mmedge regular arrays are strongly retroreflectivein the 4 kHz and 8 kHz octave bands, moderately so at 2 kHz, and weakly at 1kHz. The triangular array reflects less sound because it is smaller, because it has9 corners instead of 10, and because the corner reflectors have smaller effectiveapertures. Results suggest that larger retroreflective elements would be beneficialfor controlling speech consonants, as intended. Doubling the edge lengths wouldtranspose reflection patterns down by one octave, which would better achieve thedesired effect. Following this, two irregular prototype samples were constructed,one with a base edge length of 550 mm (with 7 retroreflective corners), and theother 450 mm (with 4 retroreflective corners). Some results for the larger 7-cornerprototype are presented in this paper.
The reinforcement of the sound of one’s own voice by an acoustic environmentcan be quantified in terms of the acoustic parameter ‘voice support’, STV. Thisis the ratio of reflected sound energy to direct sound energy transmitted frommouth to ears of a head and torso simulator (HATS), expressed in decibels(Pelegrín-García, 2011). Measurements of STV were made in an anechoic room,using a Brüel & Kjær 4128C HATS, oriented such that the reflector acted as eithera ceiling or wall element (Figure 5), at 1 m intervals up to 4 m from the reflector.
Figure 5. Acoustic testing of the 550 mm timber physical model in an anechoic room, using ahead and torso simulator: as a ceiling element (left) or wall element (right).
Overall STV values for the ceiling configuration are -13.3, -18.7, -21.3, and-23.8 dB at distances of 1, 2, 3 and 4 m from the reflector respectively. For the wallconfiguration, values are between 3 and 5 dB greater (-8.2, -15.3, -18.3 and -19.9dB), this increasemostly due to the directivity of themouth. Considering that thesemeasurements were made in an anechoic room with one reflective surface, thevalues are quite high - by way of comparison Pelegrín-García (2011) reports valuesranging between -14.9 to -9.8 dB for various non-anechoic rooms. If the surfacewas extended to a larger array of retroreflectors (e.g. a whole ceiling or wall), STVvalues would likely increase considerably, especially for more distant positions.As a first approximation, if constant aperture and incoherent summation areassumed, each doubling of visible corner cubes in a retroreflective surface shouldincrease STV by 3 dB. In a real room STV would be supplemented by reflectionsfrom other surfaces (e.g., floor, furniture, walls, and general reverberation).

DIGITAL FABRICATION FOR RETROREFLECTIVE CEILINGTREATMENT
323
The aforementioned STV values are averages of the 125 Hz - 4 kHz octaveband values (Brunskog et al. 2009), and so are not influenced by the very highfrequency range. However, for this retroreflective surface, voice support valuesare particularly interesting as a function of frequency. Figure 6 shows a steepincrease in octave band voice support over 1-8 kHz for both ceiling andwall spatialconfigurations. An increase in voice support peaking at 8 kHz is usual in roommeasurements, because of the increasing voice directivity at high frequencies, butthe increase in these results is about 5 dB greater than typical.
In cases where the value exceeds 0 dB, this means that the energy in thereflected sound is greater than that of the direct airborne sound from mouth toear (even though the reflected sound has travelled some metres).
Figure 6. Octave band voice support, measured at four distances from the 550 mm timberphysical model: as a ceiling element (left) or wall element (right).
5. DiscussionThe adoption of digital workflows for variable control of the same fabricationprocess can effortlessly produce different outcomes for design variations, keepingcosts and production times low to achieve a non-standard architecture (Carpo,2011, p. 97). This research will continue to investigate different work andspatial conditions from mid- to high-ceiling spaces, and their relationships toretroreflective elements, as well as the possibility to hybridise the geometriesdiscussed in this paper with acoustic absorption, and other non-physical factors,such as light scattering. Cost-effective digital production processes are shown tomake cross-disciplinary outcomes andmass customisation efforts easier to achieve,while further applications to this research can involve climatic zoning for roomtransitions (Willmert, 2011, p. 159) and light conditions, reminiscing traditionalstone architectures. Digital fabrication can afford an efficient, rapid and precisecontemporary approach to the realisation of complex, structural and ornamentalsurfaces such as those found at the Alhambra; albeit considering the context oftoday’s labour market. Their complex carved geometries inspire a continuousworkflow of geometrical rules, acoustic simulation, and digital fabrication andthe assembly of components in this research.
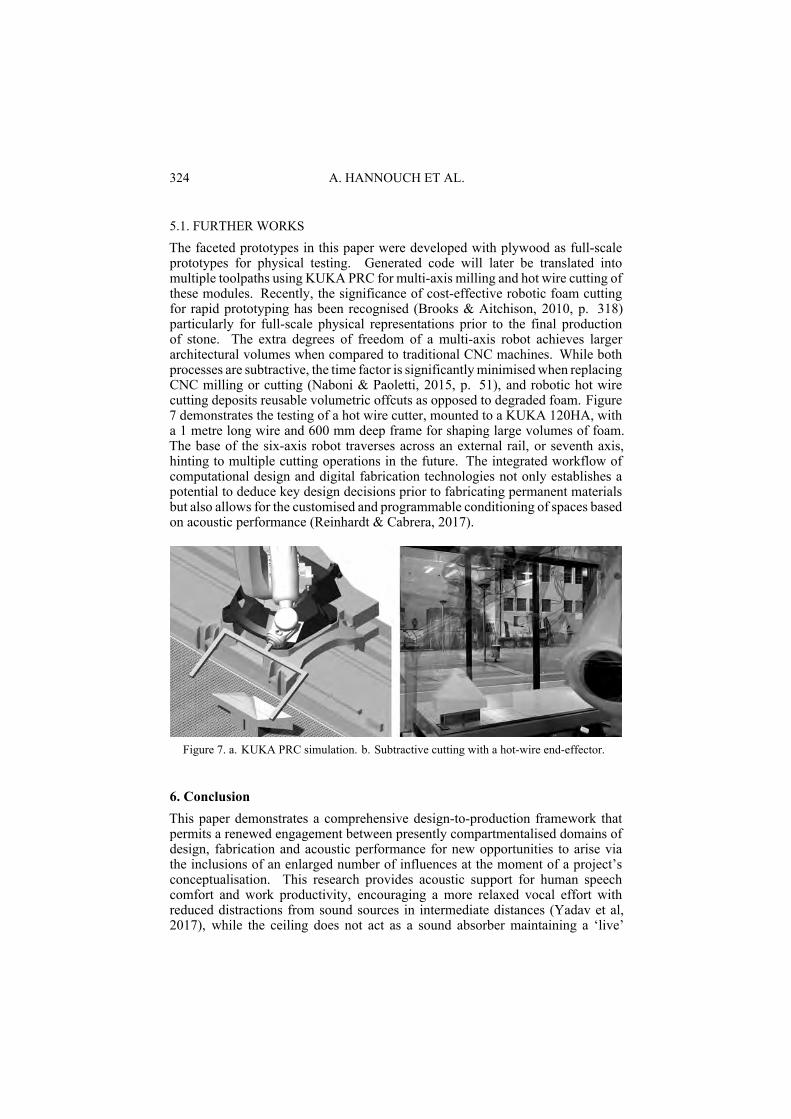
324 A. HANNOUCH ET AL.
5.1. FURTHER WORKS
The faceted prototypes in this paper were developed with plywood as full-scaleprototypes for physical testing. Generated code will later be translated intomultiple toolpaths using KUKA PRC for multi-axis milling and hot wire cutting ofthese modules. Recently, the significance of cost-effective robotic foam cuttingfor rapid prototyping has been recognised (Brooks & Aitchison, 2010, p. 318)particularly for full-scale physical representations prior to the final productionof stone. The extra degrees of freedom of a multi-axis robot achieves largerarchitectural volumes when compared to traditional CNC machines. While bothprocesses are subtractive, the time factor is significantlyminimisedwhen replacingCNC milling or cutting (Naboni & Paoletti, 2015, p. 51), and robotic hot wirecutting deposits reusable volumetric offcuts as opposed to degraded foam. Figure7 demonstrates the testing of a hot wire cutter, mounted to a KUKA 120HA, witha 1 metre long wire and 600 mm deep frame for shaping large volumes of foam.The base of the six-axis robot traverses across an external rail, or seventh axis,hinting to multiple cutting operations in the future. The integrated workflow ofcomputational design and digital fabrication technologies not only establishes apotential to deduce key design decisions prior to fabricating permanent materialsbut also allows for the customised and programmable conditioning of spaces basedon acoustic performance (Reinhardt & Cabrera, 2017).
Figure 7. a. KUKA PRC simulation. b. Subtractive cutting with a hot-wire end-effector.
6. ConclusionThis paper demonstrates a comprehensive design-to-production framework thatpermits a renewed engagement between presently compartmentalised domains ofdesign, fabrication and acoustic performance for new opportunities to arise viathe inclusions of an enlarged number of influences at the moment of a project’sconceptualisation. This research provides acoustic support for human speechcomfort and work productivity, encouraging a more relaxed vocal effort withreduced distractions from sound sources in intermediate distances (Yadav et al,2017), while the ceiling does not act as a sound absorber maintaining a ‘live’

DIGITAL FABRICATION FOR RETROREFLECTIVE CEILINGTREATMENT
325
room sound in an open plan work environment. Computational design anddigital fabrication will assist in the future installation of these acoustic reflectiveceilings for dynamic architectures that result in dramatic transitions in acousticenvironments from retroreflective to flat, scattering, or absorptive.
AcknowledgementsThe authors of this paper would like to acknowledge the support given forfabrication from the Design, Modelling and Fabrication Lab (DMaF) and fortesting and results by Manuj Yadav and Jonothan Holmes from the Audio andAcoustics Lab in the University of Sydney School of Architecture, Design andPlanning. This study was partly funded through the Australian Research Council’sDiscovery Projects scheme (project DP160103978), in addition to a primaryfunding source through BVN Architecture for an ongoing research project.
ReferencesBarr, V.: 2016, Shanghai Sensation, Design: Retail, 28(3), 88-92, 94.Brooks, H. and Aitchison, D.: 2010, A Review of State-of-the-Art Large-Sized Foam Cutting
Rapid Prototyping and Manufacturing Technologies, Rapid Prototyping Journal, 16(5),318-327.
Brunskog, J., Gade, A.C., Bellester, G.P. and Calbo, L.R.: 2009, Increase in voice level andspeaker comfort in lecture rooms, Journal of the Acoustical Society of America, 125(4),2072-2082.
Cabrera, D., Miranda, L., Jimenez, D., Edser, C. and Martens, W.L.: 2015, A facility forsimulating room acoustics, employing a high density hemispherical array of loudspeakers,Acoustics Australia, 43(1), 77-81.
Carpo, M.: 2011, Alphabet and the Algorithm: Form, Standards, and Authorship in Times ofVariable Media, MIT Press, Cambridge.
Castera, J.: 2003, Play with Infinite, Meeting Alhambra, ISAMA-BRIDGES ConferenceProceedings, 189–196.
Eckhardt, H.D.: 1971, Simple model of corner reflector phenomena, Applied Optics, 10(7),1559-1566.
Ichikawa, H.: 2004, Numerical analysis of microretroreflectors: transition from reflection todiffraction, Journal of Optics A: Pure and Applied Optics, 6(3), S121.
Naboni, R. and Paoletti, I.: 2015, Advanced Customization in Architectural Design andConstruction, Springer, London.
Pelegrín-García, D.: 2011, Comment on “Increase in voice level and speaker comfort in lecturerooms”, Journal of the Acoustical Society of America, 129, 1161–1164.
Reinhardt, D. and Cabrera, D.: 2017, Randomness in Robotically Fabricated Micro-AcousticPatterns, Protocols, Flows and Glitches, Proceedings of the 22nd International Conferenceof the Association for Computer-Aided Architectural Design Research in Asia (CAADRIA)2017, 853-863.
N. Schlager and J. Lauer (eds.): 2001, Science and Its Times: Understanding the SocialSignificance of Scientific Discovery, Gale Research International.
Virjonen, P., Keränen, J., Helenius, R., Hakala, J. and Hongisto, O.V.: 2007, Speech privacybetween neighboring workstations in an open office-a laboratory study, Acta Acustica unitedwith Acustica, 93(5), 771-782.
Willmert, T.: 2010, Alhambra Palace Architecture: An Environmental Consideration of ItsInhabitation,Muqarnas: An Annual on the Visual Culture of the Islamic World, 27, 157-188.
Yadav, M., Kim, J., Cabrera, D. and De Dear, R.: 2017, Auditory distraction in open-plan officeenvironments: The effect of multi-talker acoustics, Applied Acoustics, 126, 68-80.


ADAPTABLE DESIGN-CONSTRUCTION METHOD FORREMOTE-LOCATION
Experiment with Reverse-Engineering System to Expand the Possibilities ofNatural Materials with Bamboo Concrete Shell as a Case Study
NAOKI IMANISHI1, HISAYUKI OGIHARA2,CHEDDADI MOHAMMED AQIL3, KENSUKE HOTTA4 andYASUSHI IKEDA51,2,3,4,5Keio University ,Kanagawa,Japan1,3,4,5{naokiti|aqil|kensuke|yasushi}@sfc.keio.ac.jp [email protected]
Abstract. In this paper, the aim is to develop a construction systemthat utilizes digital technology which measures the completed shapeand checks its degree of safety. This is because in the case ofconventional construction, it is assumed that drawing and structure areconsistent by using advanced construction techniques. However, itcannot always be assumed that there are correct composition parts andadvanced construction techniques in all geographical areas. Under suchconditions, and through the use of digital technology, it can be easierto integrate the errors that occurred while the structure is being built aspart of the construction process rather than to try to make the structureconsistent with the original design.
Keywords. Remote-Locaton; Natural material; Adaptable model;Construction process; Bamboo.
1. IntroductionIn this paper, the place where the infrastructure is not sufficient is defined as the‘Remote-Location’. In the case of on-site construction, there is usually a difficultyconcerning delivery access and transportation. For example, overall costs dotypically increase due to the high costs of transporting workers, materials andconstruction heavy machinery. On the other hand, the transport and disseminationof digital technology is easy. As such, when establishing this system, it is expectedthat construction capabilities will increase. In addition to this, in conventionalconstruction work, the design is decided in advance, and it is difficult to change itduring the course of construction. However, when this construction system is used,it becomes possible to perform construction by allowing errors that occur duringconstruction to be part of the building up process. By using digital technologies,we expect to develop construction techniques that are easy and affordable, andadditionally, certain accuracy is guaranteed in the outcome. Thus, this can enablethe possibility of building various architectural forms even in remote areas that
T. Fukuda, W. Huang, P. Janssen, K. Crolla, S. Alhadidi (eds.), Learning, Adapting and Prototyping,Proceedings of the 23rd International Conference of the Association for Computer-Aided ArchitecturalDesign Research in Asia (CAADRIA) 2018, Volume 1, 327-336. © 2018 and published by the Associationfor Computer-Aided Architectural Design Research in Asia (CAADRIA) in Hong Kong.
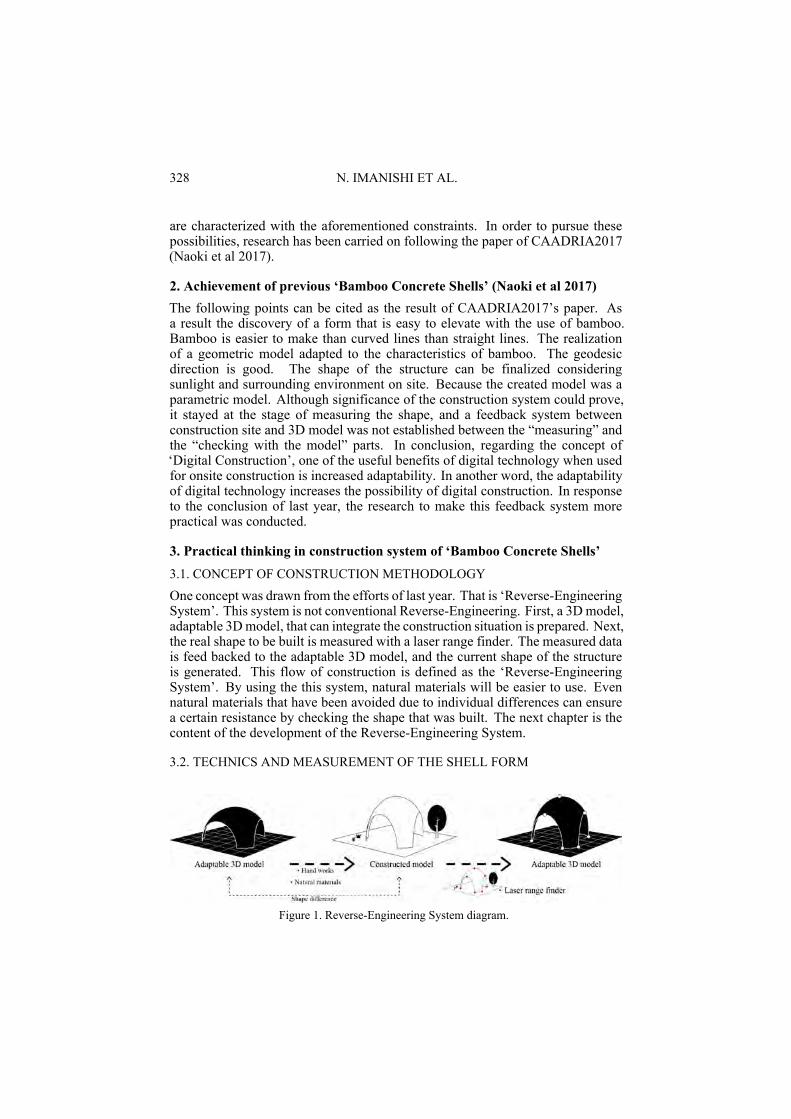
328 N. IMANISHI ET AL.
are characterized with the aforementioned constraints. In order to pursue thesepossibilities, research has been carried on following the paper of CAADRIA2017(Naoki et al 2017).
2. Achievement of previous ‘Bamboo Concrete Shells’ (Naoki et al 2017)The following points can be cited as the result of CAADRIA2017’s paper. Asa result the discovery of a form that is easy to elevate with the use of bamboo.Bamboo is easier to make than curved lines than straight lines. The realizationof a geometric model adapted to the characteristics of bamboo. The geodesicdirection is good. The shape of the structure can be finalized consideringsunlight and surrounding environment on site. Because the created model was aparametric model. Although significance of the construction system could prove,it stayed at the stage of measuring the shape, and a feedback system betweenconstruction site and 3D model was not established between the “measuring” andthe “checking with the model” parts. In conclusion, regarding the concept of‘Digital Construction’, one of the useful benefits of digital technology when usedfor onsite construction is increased adaptability. In another word, the adaptabilityof digital technology increases the possibility of digital construction. In responseto the conclusion of last year, the research to make this feedback system morepractical was conducted.
3. Practical thinking in construction system of ‘Bamboo Concrete Shells’3.1. CONCEPT OF CONSTRUCTION METHODOLOGY
One concept was drawn from the efforts of last year. That is ‘Reverse-EngineeringSystem’. This system is not conventional Reverse-Engineering. First, a 3D model,adaptable 3D model, that can integrate the construction situation is prepared. Next,the real shape to be built is measured with a laser range finder. The measured datais feed backed to the adaptable 3D model, and the current shape of the structureis generated. This flow of construction is defined as the ‘Reverse-EngineeringSystem’. By using the this system, natural materials will be easier to use. Evennatural materials that have been avoided due to individual differences can ensurea certain resistance by checking the shape that was built. The next chapter is thecontent of the development of the Reverse-Engineering System.
3.2. TECHNICS AND MEASUREMENT OF THE SHELL FORM
Figure 1. Reverse-Engineering System diagram.

ADAPTABLE DESIGN-CONSTRUCTION METHOD FORREMOTE-LOCATION
329
The diagram (figure 1) is basic concept of Reverse-Engineering System.This system uses the laser range finder and Excel to measure the target point
coordinate data. Next, using rhinoceros and grasshopper, the measurement datais recreated on the adaptable 3D model and analyzed. The point coordinate datameasured by the laser range finder can be connected by interpolating the curve Inthis way, the bamboo shape is recreated on the adaptable 3D model. That is, ifthere are many points to be measured, it will be accurate as the reproduction of theshape. However, if the number of measurement points is excessive, it will makeconstruction rather difficult. It is necessary to clarify the following two points. 1)In order to grasp the general shape of the shell, what part of the bamboo should bemeasured? 2) How many points must be measured for the bamboo shape selectedin 1) to be reproduced on the 3D model? Regarding 1), this geometry is a structure,ridge arch, that forms a shell which is radially divided from the shell top. Next, theshape is roughly determined by the arch, edge arch, which becomes the opening ofthe shell. Furthermore, a rhombus grid is constructed so as to draw the geodesicdirection between the arches (figure 2). In addition, the edge arch has a rib arch toincrease the overall strength and prevent rainwater from flowing into the shell.Inother words, the ridge arch and the edge arch create the general shape of the shell(figure 2).
Figure 2. Bamboo Concrete Shell geometry, Ridge arch and Edge arch and Measurement studyresult of bamboo arch.
Regarding 2), it was verified whether the reproducibility would be high bymeasuring at least the number of points. The arch was divided into 3 points, 5points, 7 points, 9 points, 11 points. Then the measurement of the bamboo archwas performed in each different case (figure3).When connecting 11 points, highlyreproducible curves are reproduced. The curve was compared with 9, 7, 5, 3 pointsrespectively reproduced curves. A difference of maximum 12mm at 9 points, adifference of maximum 20mm at 7 points, a difference of 26mm at maximum at5 points, a difference of 138mm at maximum at 3 points. From this result, it wasfound that the difference is increased by 3 points. Since it was found that therewas no difference to 9 or 7 or 5 points, it was decided as the number of pointsto measure 5 points that are not troublesome (Figure 2). However, this result isconsidered to change the length of each arch depending on the size of the structure.
3.3. LINK ADAPTABLE 3D MODEL AND CONSTRUCTION PROCESS
The construction process consists of the positioning of the foundation, the edgearch, the installation of the ridge arch, the creation of a rhombus grid, the settingof a rib arch and the concrete casting. The adaptable 3D model created bygrasshopper is also created by the same on-site construction process. Therefore,

330 N. IMANISHI ET AL.
making measurement and confirmation easier. By linking it with construction,the adaptable 3D model incorporating the construction information shows theshape that can be finally formed. Therefore, measurement with a laser rangefinder is also performed for each construction step. By making the adaptable 3Dmodel like it was shown above, implementing the Reverse-Engineering Systemwill be easy. Next, advantages and disadvantages of the ‘geometry that facilitatesReverse-Engineering’ which can be confirmed are listed at this stage (Seturo et al2009). Advantages: 1) Makes it easier to feed back the laser measurements and theinformation obtained thereby onto the adaptable 3D model. 2) The constructionprocess is easy and accessible. 3) The method of filling with the rhombus gridbetween the ridge arch reduces the risk of encountering problems because thebamboo is arranged in the geodesic direction. Disadvantage: Comparatively, itwas easier to change last year’s 3D model’s shape (Naoki et al 2017) according tothe on-site conditions. However, this year’s adaptable 3D model has no relationbetween edge arch and ridge arch, not on the same curved surface. Therefore,parameters such as the size of the edge arch and the ridge arch and the inclinationposition must be arbitrarily adjusted.
4. Verification experiment in 2017
Figure 3. Bamboo Concrete Shell 2017 and Construction process.
Last year, it was a construction method that could cope with the site’s environment,but this year an experiment was conducted to decide what kind of constructionprocess is best for dealing with natural materials used for construction. In August2017 the construction of a dome-shaped bamboo concrete shell with a heightof 2 meter was performed (Figure 3). The site was the same as last year, atKuchierabu-Island, which is located in the south of Japan.The construction periodwas about 2 weeks, the work was done with a minimum of 2 people, and amaximum of 10 people cooperating at once. For the outline of the shell, therequired number of round bamboo is 125, preliminary is 20, and cast concreteis 0.9m3 (Figure 3).
This experiment was aimed at comparing the two methods.• How to bring the constructed model closer to the 3D model? Conventional
way (Bui et al 2010) in general public.

ADAPTABLE DESIGN-CONSTRUCTION METHOD FORREMOTE-LOCATION
331
• How to bring the 3D model closer to constructed model? This concept isReverse-Engineering System.
4.1. HOW TO BRING CONSTRUCTED MODEL CLOSER TO THE 3D MODEL?
The length of the bamboo for arch and the position of the installation point, thestart point and the end point of the bamboo, on the ground are fixed, and thecurvature of the bamboo is controlled by the support. Position the support andcut the supporting bamboo to a predetermined length. Fix the arch bamboo at thetop of the supports bamboo. In this way, bending of the bamboo is realized asshown in the design.
4.2. HOW TO BRING THE 3D MODEL CLOSER TO CONSTRUCTED MODEL?
The length of the bamboo for arch, the installation point on the ground, the startpoint to the end point of the bamboo, shall be fixed. The shape of the arch is left tothe natural curvature of the bamboo. The measure with a laser range finder is doneat the same time as the construction process. In order to improve the accuracy,it is done multiple times, not only once. Details are described in the followingflowchart (Figure 4).
Figure 4. Measurement flowchart.
In the above order, it is possible to grasp the shape of what was constructed.And the size and position of the bamboo to be used in the next process arepredicted.
5. Experiment result / Assessment5.1. RESULT AND ASSESSMENT OF 4.1
In the method of bringing the constructed model closer to the 3D model, bamboobreakage and twisting has occurred. When construction is done ignoring those

332 N. IMANISHI ET AL.
characteristics of bamboo, the curve required on the 3D model is not reproduced.Because the curvature which can not be reproduced with bamboo and the directionthe bamboo wants to bend naturally influence (figure 5).
Figure 5. Forced the bamboo closer to the model.
In order to reproduce the curve more than now, it is necessary to select eachbamboo. Increase the curvature indication by support or indicate the curvature inanother way. The indication of bamboo curvature by the support carried out inthis experiment had a lot of time loss, which is a laborious work. In the method ofbringing the model closer to constructed model, this process can be omitted andthe flow of construction is made smooth.
5.2. RESULT AND ASSESSMENT OF 4.2
Figure 6. Surface creation process and Comparison of three models.
In the method of bringing the 3D model closer to the constructed model,measurement could be done smoothly because the measurement point was fixed.Since it was linked with construction, the timing of measurement was easy tounderstand. On the other hand, there are two problems to be considered. Thefirst problem is that it is not possible to create a rhombus grid between each arch.In detail, from the information of the measured ridge arch and edge arch, it is notpossible to predict the completed rhombus grid in the process of creating the nextmesh. The configuration of the geometry linked with the construction process hasled to easier measurement. However, there is also a problem in feed backing themeasurement results to the 3D model. From the information of the ridge arch andthe edge arch, there is a problem with the method of reproducing the curved surfacebetween the arches. At the time of this experiment, the ridge arch division line wasincreased, and the surface was created (Figure 6).
However, connecting the point coordinate data of the measured ridge arch

ADAPTABLE DESIGN-CONSTRUCTION METHOD FORREMOTE-LOCATION
333
resulted in a twisted curve. When practicing how to paste the surface as describedabove, such curve data caused an error on the 3D model. When connecting themeasured point coordinate data, the following two points are considered as causesof the twisted curve. 1) It is a material with a structure that bamboo itself twists.2) Manual error in measuring bamboo will occur. Therefore, the 3D model thatcan tolerate such twist and error is necessary.
Next problem is that the difference between pre-designed shape and result isso huge. By giving priority to the bending of natural bamboo, measurements weremade on how much error it has with the 3D model. Experiment: How much is thedifference between the 3D model and the actual structure? Result: The shell afterthe concrete casting was measured by 502 points with the back side and the frontside by laser range finder. Using that data, a highly reproducible “measurementresult model” was created (Figure 6). It was thought that a deviation of 350mmoccurred before casting the concrete and then deviated further by 49mm due tocreep reduction, resulting in a total deviation of 399mm.
Even with the concept of Reverse-Engineering, it is a problem that there is a‘huge’ difference in prediction and result. As for the reason, it seems that it isbecause there is no information such as the direction in which bamboo naturallybends when creating a curve in pre-designed 3D model. A curve is an arbitrarycurve connecting points with each other by an interpolate curve. Because ofcatenary curve similar to actual bamboo curve. If this curve was supposed to be acatenary curve, the overall shape approached the actual bamboo curve (Figure 6).In other words, by clarifying the tendency of the bending direction of bamboo andby providing this information in the pre-designed 3D model, it becomes possibleto make the prediction closer to the result. Furthermore, even when predictingthe shape to be created in the next construction process, by providing the bamboocharacteristics in the pre-designed 3D model, it becomes a shape close to the actualstructure.
6. ConclusionIn conclusion, there are still two problems to be dealt with. 1) Information ofbamboo characteristics are essential to the adaptable 3D model. 2) The modelthat can tolerate with bamboo twist and error is necessary. However, in aconstruction that uses natural materials with physical properties that cannot bechanged, a Reverse-Engineering System that allows what is already made isless labor-intensive when compared to conventional construction methods, thusleading to facilitation in the process of construction.
7. ConsiderationIn order to bring constructed model to the adaptable 3D model, it is necessary tograsp the characteristics of natural materials and to add information of it to theadaptable 3D model. However, it must grasp the characteristics of bamboo whichbamboo not only draws naturally, but also difficult to measure with a laser rangefinder. One of them is ‘tensile strength’. Bamboo concrete shell such as reinforcedconcrete, expects bamboo to have tensile strength. Therefore, it is necessary to

334 N. IMANISHI ET AL.
test, digitize, and evaluate how much tensile strength can be expected for bamboo,Ryukyu bamboo, to use (Francis et al 1966, Masakazu et al 2010). Therefore,bamboo strength test is being conducted. Divide four pieces of bamboos, pull itfrom both ends, and prepare a device to check the broken load. Currently, thetest is continued and the results are collected. From the results, it is beginning toturn out that the strength of bamboo is very fluctuating. In other words, throughan experiment that brings the 3D model closer to constructed model, the resultwas obtained that ‘the shape to be built can be grasped for the first time at thesite’–1). At the same time, because there are individual differences in bamboo, itis necessary to assume that ‘it is possible to grasp physical properties for the firsttime at the stage of collecting bamboo’–2).
8. Prospect
Figure 7. New Measurement flowchart .
By considering both 1) and 2) that were described above, it is possible to calculatethe structure in real time. The result of the structural calculation can be expectednot only to grasp the current structure but also to assist in the correction of thestructure. The creation of ‘Bamboo Building Information Modeling’ - making itpossible to handle information on physical properties and the shape of bamboo asa model is also a goal in the future.Therefore, a new reverse engineering system isproposed.(Figure 7)
1.Increase accuracy of Predesigned 3D model. It is necessary to increasethe accuracy of the prediction of the predesigned 3D model (5-2. Result andAssessment of 4-2). However, it is difficult to predict a complete form. Thereare two kinds of information (1) that must be grasped from the design stage andinformation (2) that can not be grasped in advance.(1) The required number ofbamboo, the amount of concrete, the shell thickness, the bamboo material length,the foundation position.(2) Errors caused by the variation of the original bamboo

ADAPTABLE DESIGN-CONSTRUCTION METHOD FORREMOTE-LOCATION
335
during construction.Although it is desirable to create a model that can predictaccurately, variations due to natural properties of the materials (variations in thebending of bamboo) will certainly come out. By making simple measurementsof the error at each construction stage and grasping the construction situation, itis possible to proceed with safe and accurate construction while correcting thetrajectory iteratively. Therefore, in order to improve the accuracy of the prediction,it is thought that it is necessary to understand the degree of variation of bamboo andnarrow the range of prediction on the Pre designed 3D model in order to improvethe accuracy. Actually dividing the cases into different lengths of 1 m, 2 m, 3 m,changing the widths of both ends to create curves, and collecting data of variationsusing a laser rangefinder(Figure 8).
Figure 8. Bamboo bending test and 3D scan test.
2.Improvement of shell measurement method. It is also necessary to improvethe shell measurement method. Although the shape after concrete casting wasmeasured by the laser rangefinder, the number of measurement points was 502,which was very troublesome. Therefore, a measuring method using a laserrangefinder and 3D scanning (iSence, Canvas, Roomchapture) was proposed.The 3D scan makes it possible to measure the shape of the actually constructedshell, which is necessary for structural analysis, faster and easier than the laserrangefinder.However, 3D scanning also has problems. The Shell was measuredusing three kinds of scan applications: iSence, Canvas, Roomchapture. The roughshape and the thickness of the shell were much easier to measure than the laserrangefinder, but since the 3D model is formed by mesh data, it is difficult tograsp the detailed surface irregularities and the shape of the curve . In order toimprove the measurement precision, it is primordial to research scan sensors andmeasurement devices for scanning methods(Figure 8).
3.Structural analysis. In this part we will describe the structural analysismethodology for the shell(Figure 9). We measure the current physical conditionsby enumerating the load conditions assumed for this shell, such as net-weight,wind load, lateral load, etc. After setting up the previously mentioned loadconditions, we proceed by performing the structural analysis by using Karamba,FEM analysis, etc. for each load condition (Shigeru et al 1980, Hiroshi et al 1995).Based on the result, the weak part of the shell becomes known to us. By taking intoaccount these informations, it is then necessary to consider whether reinforcementby a rib and a method to open a hole can be applied to the weak part of the shellin order to disperse the force.

336 N. IMANISHI ET AL.
Figure 9. Structural analysis methodology for the shell.
Finally, when establishing a method to grasp the current shape of the structureand grasping the physical properties of bamboo used as building material, thepossibility of the idea of site-oriented construction instead of conventionaldesign-oriented construction is expected to widen.
ReferencesFrancis, E. and Paul, J.: 1966, BAMBOO REINFORCED CONCRETE CONSTRUCTION.,
California:U. S. NAVAL CIVIL ENGINEERING LABORATORY.Masakazu, T. and Koichi, M.: 2010, A basic research of adherability and flexibility of concrete
that reinforced by bamboo, Proceedings of the Japan Concrete Institute vol. 32, No. 2, 2010,Page 1188.
Naoki, I.: 2017, Bamboo Concrete Shells An Adaptable Construction Method Using OnsiteMaterials in a Remote Location, Proceedings of CAADRIA2017, XJTLU SUZHOU CHINA,445-455.
Seturo, I.: 2009, A Study on the Mechanical Properties of Bamboo, Kobe: Otemae UniversityPublicity.
Shigeru, A.: 1980, Present state and outlook of concrete shell structure, Jstage Concrete journal,Volume 18 (1980) Issue 1, 61-65.
Bui Trong, C.A.U., Kazumasa, O.Z.A.W.A. and Masahiko, K.U.N.I.S.H.I.M.A.:2010, A DECISION-MAHING METHOD ON DESIGN ALTERNATIVES FORCONSTRUCTION PROJECTS., Journal of Construction Management, JSCE, Volume 8(2000) , Pages 11-23.

Augmented and Mixed Reality inArchitecture

338

TRACKING ROBUSTNESS AND GREEN VIEW INDEXESTIMATION OF AUGMENTED AND DIMINISHED REALITY FORENVIRONMENTAL DESIGN
PhotoAR+DR2017 project
KAZUYA INOUE1, TOMOHIRO FUKUDA2, RUI CAO3 andNOBUYOSHI YABUKI41,2,3,4Osaka University, Suita, Osaka, Japan1,3{inoue|cao}@it.see.eng.osaka-u.ac.jp 2,4{fukuda|yabuki}@see.eng.osaka-u.ac.jp
Abstract. To assess an environmental design, augmented anddiminished reality (AR/DR) have a potential to build a consensus moresmoothly through the landscape simulation of new design visualizationof the items to be assessed, such as the green view index. However,the current system is still considered to be impractical because it doesnot provide complete user experience. Thus, we aim to improve therobustness of the AR/DR system and to integrate the estimation of thegreen view index into the AR/DR system on a game engine. Further,we achieve an improved stable tracking by eliminating the outliersof the tracking reference points using the random sample consensus(RANSAC) method and by defining the tracking reference points overan extensive area of the AR/DR display. Additionally, two moduleswere implemented, among which one module is used to solve theocclusion problem while the other is used to estimate the green viewindex. The novel integrated AR/DR system with all modules wasdeveloped on the game engine. Amock design project was developed inan outdoor environment for simulation purposes, thereby verifying theapplicability of the developed system.
Keywords. Environmental Design; Augmented Reality (AR);Diminished Reality (DR); Green View Index; Segmentation.
1. IntroductionAugmented reality (AR) involves displaying virtual objects to provide an enhancedexperience of the physical world through virtual objects its application to exteriorconstruction has gained popularity (Klinker et al., 2001). AR can facilitate theprocess of building a consensus on the basis of landscape design because it iscapable to simulate real-scaled new structures in three-dimensional (3D) views.However, a drawback of AR is that it cannot be used to simulate new buildings orstructures while the old structure is still present. To address this issue, diminishedreality (DR) can be used to visually eliminate an existing object from a scene by
T. Fukuda, W. Huang, P. Janssen, K. Crolla, S. Alhadidi (eds.), Learning, Adapting and Prototyping,Proceedings of the 23rd International Conference of the Association for Computer-Aided ArchitecturalDesign Research in Asia (CAADRIA) 2018, Volume 1, 339-348. © 2018 and published by the Associationfor Computer-Aided Architectural Design Research in Asia (CAADRIA) in Hong Kong.

340 K. INOUE ET AL.
overlaying an appropriate background image on the area that is occupied by theobject (Mori et al., 2017). While AR is often interpreted in a limited sense torepresent only the visual effects that are overlaid on a screen, it can further augmentthe physical world with digital information. In a landscape, AR can be used tovisualize the 3D virtual models of the new structures and to display the items tobe assessed so that the stakeholders can easily build a consensus more smoothly.
Urban vegetation is a key element of landscape and urban design. It has beenused to tackle the various architectural and urban problems, such as urban heatislands, biodiversity, and resident comfortability. The amount of urban vegetationcan be quantified using various metrics that can be used by the environmentalstakeholders to advocate for the addition of more vegetation. One metric forevaluation is the percentage of green space, which is suitable for assessing largeareas, but a drawback of this metric is that it does not consider the experience ofthe people on the ground. Another metric is the green view index, which is definedas the ratio of the green area to total area in the field of view of a person, and it isan effective and efficient metric for assessing the visual effects of the green areasin increasing urban comfort (Yang et al., 2009).
The study focuses on a method for simultaneously simulating the building andvegetation designs and assessing the landscape by estimating the green view index.In a previous study, PhotoAR+DR2016 was developed to integrate the simulationby augmented and diminished reality (AR/DR) and the real-time estimation ofthe green view index (Fukuda et al., 2017). However, this system is impracticalbecause it does not provide a remarkable user experience, such as the lack of therobustness of tracking, the occlusion expression, and the system usability.
Therefore, the objective of this research is to improve the robustness of theAR/DR system and to integrate the estimation of the green view index into thesystem on a game engine. Further, we achieved improved stable tracking byeliminating the outliers of the tracking reference points using the random sampleconsensus (RANSAC)method and by defining the tracking reference points acrossan extensive range of the image. Furthermore, we observe that the user experienceis affected not only by the robustness of the system, but also by the perceivedreality and usability of the AR/DR system. Therefore, the burden on the user isreduced by using game engine in this study. The AR/DR system was designed ona game engine, thereby, the amount of redundant code described by the user forparameter adjustment is reduced. Additionally, two modules were implemented.The first module solves the occlusion problem using the 3D model reconstructedby photogrammetry. This module enables the user to easily perceive depth. Thesecond module estimates the green view index. This module was implementedbased on a process that is different from that used in the previous system. Finally,a mock design project was conducted to validate the applicability of the developedsystem.

TRACKING ROBUSTNESS AND GREEN VIEW INDEX ESTIMATIONOF AUGMENTED AND DIMINISHED REALITY FOR
ENVIRONMENTAL DESIGN
341
2. Improving the tracking of the AR / DR system2.1. OUTLIER ELIMINATION
The virtual objects must be properly aligned with respect to the physical worldwhile the camera is moved. However, stable tracking is difficult in an outdoorenvironment due to the inconstant illumination and many noises. Therefore,maintaining stable tracking over an extensive period of time can be critical problemto improve the user experience of outdoor AR/DR system.
In our tracking methodology, camera motion is computed by solving theperspective n-points (PnP) problem. This is a problem of estimating the camerapose from n 3D-to-2D point correspondences. In the proposed method, the n 3Dpoints are in advance defined as tracking reference points and their corresponding2D points are traced by estimating the optical flow (Tomasi and Kanade, 1992). Inthe previous system, the camera pose was estimated so that the sum of the errors ofall the tracking reference points would be minimized. Thus, the previous systemwas observed to be susceptible to the influence of the outliers. Additionally, it wasdifficult to accurately estimate the accurate camera pose for a long period of timebecause of the accumulated errors. Therefore, we achieved more stable trackingby eliminating the outliers in this study.
To detect the outliers, the RANSAC method was applied as depicted in Figure1 (Fraundorfer and Scaramuzza, 2012). First, several (in this case, five) trackingreference points are randomly selected. Second, the camera pose was estimatedby solving the PnP problem using the tracking reference points. Third, all of thetracking reference points were projected from 3D coordinates to 2D coordinates.Fourth, the errors (called the reprojection errors) between the projected and theoriginal points were calculated. Fifth, the tracking reference points containingreprojection errors, which are observed to be greater than the threshold (in thiscase, five pixels), were classified as outliers.
Figure 2 depicts comparison between the previous tracking flow (the red wire)and the tracking flow that is proposed in this study (the blue wire). The yellowlines represented the optical flows of the tracking reference points. In the previoustracking flow of the red wire model, the camera pose estimation was observed to beinaccurate after 15 s of tracking. However, the camera pose estimation observedto be accurate for 45 s in the novel tracking flow of the blue wire model.
Figure 1. The flow that is used by the outlier detection module.

342 K. INOUE ET AL.
Figure 2. Comparison of the tracking flows in the outdoor experiment blue wire: the noveltracking flow; red wire: the previous tracking flow; yellow lines: the optical flows of the
tracking reference points.
2.2. ARRANGEMENT OF THE TRACKING REFERENCE POINTS
In our proposed method, it is necessary to arbitrarily define various trackingreference points in advance. Therefore, the influence of the arrangement of thetracking reference points on the tracking stability was investigated. The portionof the image was occupied by the bounding box of the tracking reference pointswas used as an index to arrange the points. The error in camera pose estimation inthe virtual world was measured while varying the portion that is occupied by thetracking reference points, which is observed to be in the range from 2% to 100%.This was performed on a 1024 × 576 pixel image. First, the tracking referencepoints were defined to reach an arbitrary portion that is occupied by the trackingreference point. Next, an error of the optical flow estimation was given artificially;in this situation, this value was 1 pixel or 2 pixels. Finally, the camera pose wasestimated and the result was compared with that of the correct camera pose.
The results are depicted in Figure 3. It was confirmed that the larger the portionof that is occupied by the tracking reference points, the smaller is the average errorin camera pose estimation. Therefore, it was concluded that, tracking can be morestable by defining the tracking reference points to maximize the portion that isoccupied by the points. However, when the tracking reference points are definedacross an extensive range of the image, it is difficult to keep estimating their opticalflow because the points are likely to go out of the screen by moving the camera.Therefore, the restoration module of the tracking reference points whose opticalflow could not be estimated was implemented to perform the tracking for a long

TRACKING ROBUSTNESS AND GREEN VIEW INDEX ESTIMATIONOF AUGMENTED AND DIMINISHED REALITY FOR
ENVIRONMENTAL DESIGN
343
period of time.
Figure 3. The influence of the arrangement on tracking reference points on the trackingstability.
3. Integrating the module into the game engine3.1. SYSTEM ENVIRONMENT
Considering the application of our system to various practical projects, it isimportant to minimize the burden on the user. The previous system wasdeveloped using Visual Studio (Visual C++, OpenGL, OpenCV), which is anintegrated development environment. In order to render the 3D models moregraphically and realistically, it is necessary to finely tune the rendering settings,such as the light source definition, the material settings, and so on. Everytime the usage environment and time changes, the user should repeatedly adjustseveral parameters and verify the quality of the rendered images to improvethe photometric consistency between the real world and rendered 3D models.However, to adjust the parameters, the user must define the redundant codes. Forthe application of our system to various practical projects, a large burden is placedon the user. Therefore, we developed this system using Unity (a game engine) andOpenCV for Unity (a computer vision plugin for Unity). In this system, the amountof code that is described by the user is drastically reduced because the renderingsettings can be adjusted easily and efficiently using the developed graphical userinterface (GUI).
In our proposed system, the 3D models for AR/DR are manufacturedby reconstructing the photographs of the surrounding environments usingphotogrammetry software. If the 3D models are not reconstructed byphotogrammetry, our system cannot be used. Therefore, the photographs of thesurrounding environments were often retaken. In the developed system, AgisoftPhotoScan was used instead of OpenMVG, which was used in the previous system,because it can reconstruct 3D models more stably and accurately. This reduces theprobability that photographs have to be retaken.

344 K. INOUE ET AL.
3.2. OCCLUSION PROBLEM
Occlusion greatly influences the depth perception of the user (i.e., the relationshipbetween the physical and virtual world). This is one of the elements that must beaccurately expressed to assess an environmental design. The occlusion problem isan AR/DR challenge of rendering the real objects in front of the 3D models.
In order to solve the occlusion problem, information about the depth ofthe surrounding environment is required. Portalés et al. (2010) introduced alow-cost outdoor mobile AR application with solving the occlusion problem usingHigh-accuracy 3D photo-models. In our proposed system, depth information canbe acquired from a reconstructed 3Dmodel of the surrounding environment, whichis referred to as an occlusion model. The virtual world consists of the 3D virtualmodel to be superimposed for AR and a part of 3D virtual model of the physicalworld. In this virtual world, it is possible to determine which part of the 3D virtualmodel for AR is hiding behind the occlusion model from the viewpoint. Theocclusion problem is solved by not rendering the pixels of the 3D models thatare hidden by the occlusion model, as depicted in Figure 4. This module enablesthe user to easily perceive the depth.
Figure 4. Example of a solution to the occlusion problem.
3.3. ESTIMATION OF THE GREEN VIEW INDEX
In the previous system, the green view index was automatically estimated basedon the three filtering steps that include Gaussian, mean-shift, and hue, saturation,and value (HSV) filtering methods (Ding et al., 2016). However, this mean-shiftfiltering could not be used in the new development environment. Therefore, anovel flow using median filtering instead of Gaussian and mean-shift filtering wasimplemented as depicted in Figure 5. Further, logical operation and morphologyoperation were added behind HSV filtering. In the logical operation, the imageapplied to the median and HSV filtering and the original image applied to HSVfiltering are used to obtain the per-pixel bitwise logical conjunction. This operationis defined as bitwise and filtering and it is used to reduce the noise such as the greenarea reflected on the window. In the morphology operation, the result image of
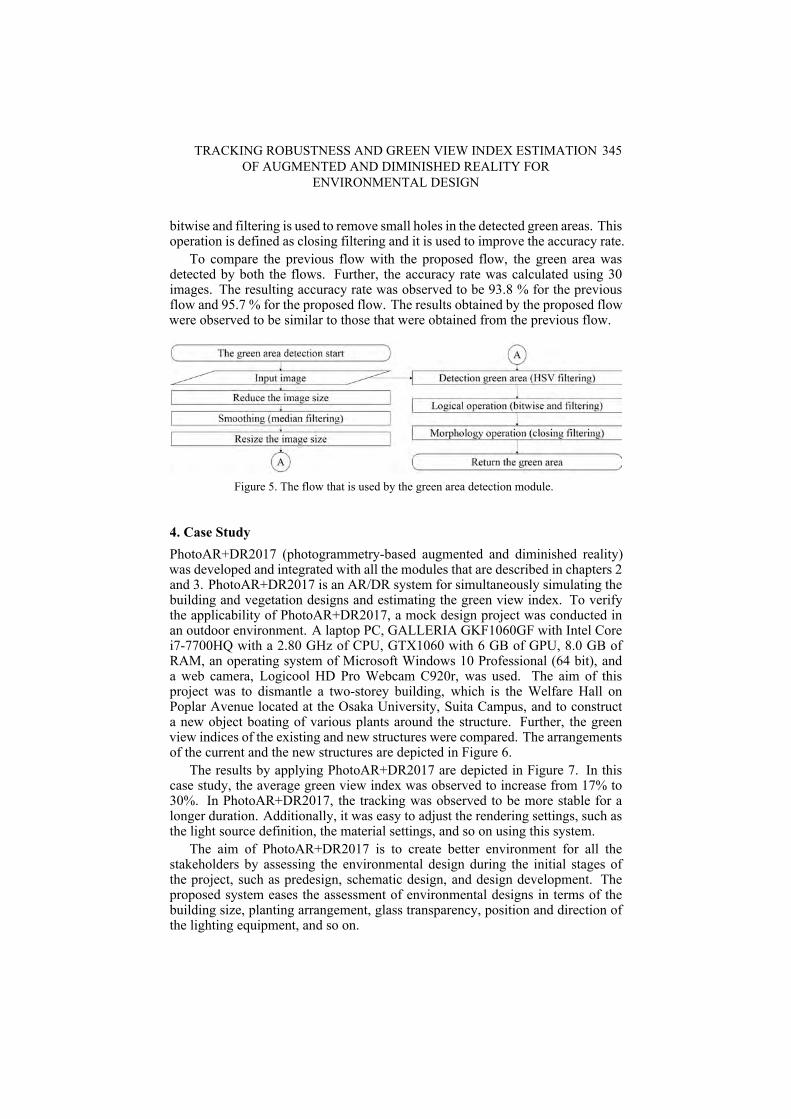
TRACKING ROBUSTNESS AND GREEN VIEW INDEX ESTIMATIONOF AUGMENTED AND DIMINISHED REALITY FOR
ENVIRONMENTAL DESIGN
345
bitwise and filtering is used to remove small holes in the detected green areas. Thisoperation is defined as closing filtering and it is used to improve the accuracy rate.
To compare the previous flow with the proposed flow, the green area wasdetected by both the flows. Further, the accuracy rate was calculated using 30images. The resulting accuracy rate was observed to be 93.8 % for the previousflow and 95.7 % for the proposed flow. The results obtained by the proposed flowwere observed to be similar to those that were obtained from the previous flow.
Figure 5. The flow that is used by the green area detection module.
4. Case StudyPhotoAR+DR2017 (photogrammetry-based augmented and diminished reality)was developed and integrated with all the modules that are described in chapters 2and 3. PhotoAR+DR2017 is an AR/DR system for simultaneously simulating thebuilding and vegetation designs and estimating the green view index. To verifythe applicability of PhotoAR+DR2017, a mock design project was conducted inan outdoor environment. A laptop PC, GALLERIA GKF1060GF with Intel Corei7-7700HQ with a 2.80 GHz of CPU, GTX1060 with 6 GB of GPU, 8.0 GB ofRAM, an operating system of Microsoft Windows 10 Professional (64 bit), anda web camera, Logicool HD Pro Webcam C920r, was used. The aim of thisproject was to dismantle a two-storey building, which is the Welfare Hall onPoplar Avenue located at the Osaka University, Suita Campus, and to constructa new object boating of various plants around the structure. Further, the greenview indices of the existing and new structures were compared. The arrangementsof the current and the new structures are depicted in Figure 6.
The results by applying PhotoAR+DR2017 are depicted in Figure 7. In thiscase study, the average green view index was observed to increase from 17% to30%. In PhotoAR+DR2017, the tracking was observed to be more stable for alonger duration. Additionally, it was easy to adjust the rendering settings, such asthe light source definition, the material settings, and so on using this system.
The aim of PhotoAR+DR2017 is to create better environment for all thestakeholders by assessing the environmental design during the initial stages ofthe project, such as predesign, schematic design, and design development. Theproposed system eases the assessment of environmental designs in terms of thebuilding size, planting arrangement, glass transparency, position and direction ofthe lighting equipment, and so on.
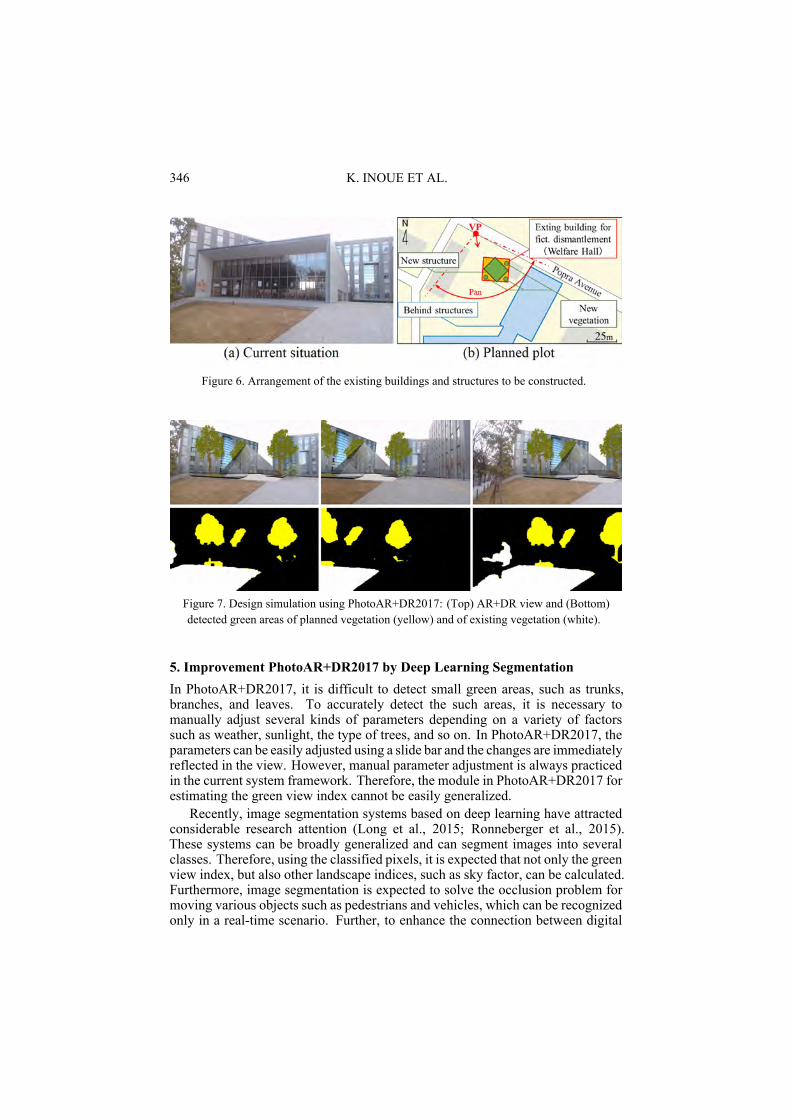
346 K. INOUE ET AL.
Figure 6. Arrangement of the existing buildings and structures to be constructed.
Figure 7. Design simulation using PhotoAR+DR2017: (Top) AR+DR view and (Bottom)detected green areas of planned vegetation (yellow) and of existing vegetation (white).
5. Improvement PhotoAR+DR2017 by Deep Learning SegmentationIn PhotoAR+DR2017, it is difficult to detect small green areas, such as trunks,branches, and leaves. To accurately detect the such areas, it is necessary tomanually adjust several kinds of parameters depending on a variety of factorssuch as weather, sunlight, the type of trees, and so on. In PhotoAR+DR2017, theparameters can be easily adjusted using a slide bar and the changes are immediatelyreflected in the view. However, manual parameter adjustment is always practicedin the current system framework. Therefore, the module in PhotoAR+DR2017 forestimating the green view index cannot be easily generalized.
Recently, image segmentation systems based on deep learning have attractedconsiderable research attention (Long et al., 2015; Ronneberger et al., 2015).These systems can be broadly generalized and can segment images into severalclasses. Therefore, using the classified pixels, it is expected that not only the greenview index, but also other landscape indices, such as sky factor, can be calculated.Furthermore, image segmentation is expected to solve the occlusion problem formoving various objects such as pedestrians and vehicles, which can be recognizedonly in a real-time scenario. Further, to enhance the connection between digital

TRACKING ROBUSTNESS AND GREEN VIEW INDEX ESTIMATIONOF AUGMENTED AND DIMINISHED REALITY FOR
ENVIRONMENTAL DESIGN
347
information and the physical world, it is necessary to recognize various elementsin the environment.
Therefore, a pilot system model was constructed using SegNet, which is adeep learning segmentation technology (Badrinarayanan, 2015), as depicted inFigure 8. SegNet can classify each pixel of an urban street image into one of thetwelve classes (building, sky, tree, pedestrian, etc.,) by inputting real-time imagesor video. In this model, a real-time video is captured on the laptop and sent toa server using a WiFi network. The AR/DR simulation and image segmentationare performed on the server in real-time and the output movie is transmitted to thelaptop. Further, the series of flows can be processed in real time. While SegNethas not yet been integrated with PhotoAR+DR2017, but it is possible to segmentthe result of the landscape simulation image and real-time video.
Figure 8. PhotoAR+DR2017 and SegNet.
6. Conclusions and Future WorksHere, we developed an AR/DR system (PhotoAR+DR2017) that cansimultaneously simulate the building and vegetation designs and estimatethe green view index to assess the landscape. The contributions of this researchare as follows:
• To improve the robustness of the AR/DR system, a relatively stable trackingwas achieved by eliminating the outliers by the RANSAC method and bydefining the tracking reference points over an extensive area of the AR/DRdisplay.
• By integrating the AR/DR system and estimation of the green view index on agame engine, it is easy to adjust the rendering settings such as the light sourcedefinition, the material settings, and so on.
• We have constructed a system model to calculate the green view indexautomatically using SegNet. This system model can be used on a laptop, withonly basic specifications in a real-time scenario. While SegNet has not yetbeen integrated into PhotoAR+DR2017 in real time, it has been confirmed thatit can be used to automatically calculate the green view index by inputting thesimulated landscape image and a video.

348 K. INOUE ET AL.
For future studies, we note that further improvement of the tracking stability isnecessary to allow the web camera to be moved over a long distance to assess alarge and continuous landscape. In PhotoAR+DR2017, the occlusion problem issolved using a 3D model that was reconstructed by photogrammetry. However,the 3D models of the trees and moving objects may be observed to be differentfrom the shapes of these objects, when used in practical applications. Therefore,it is necessary to recognize various objects in real time and solve the occlusionproblem. This will lead to an enhanced connection between digital informationand the physical world.
AcknowledgementsThis research has been partly supported by the research grant of ARMOARCHITECTS & ENGINEERS CO., LTD., and by JSPS KAKENHI GrantNumber JP16K00707.
ReferencesBadrinarayanan, V., Kendall, A. and Cipolla, R.: 2017, SegNet: A Deep Convolutional
Encoder-Decoder Architecture for Image Segmentation, IEEE Transactions on PatternAnalysis and Machine Intelligence, 39(12), 2481–2495.
Ding, Y., Fukuda, T., Yabuki, N. and Motamedi, A.: 2016, Automatic Measurement Systemof Visible Greenery Ratio Using Augmented Reality, Proceedings of the 21st InternationalConference on Computer-Aided Architectural Design Research in Asia (CAADRIA 2016),703–712.
Fraundorfer, F. and Scaramuzza, D.: 2012, Visual Odometry : Part II: Matching, Robustness,Optimization, and Applications, IEEE Robotics & Automation Magazine, 19, 79–90.
Fukuda, T., Inoue, K. and Yabuki, N.: 2017, PhotoAR+DR2016 - Integrating AutomaticEstimation of Green View Index and Augmented and Diminished Reality for ArchitecturalDesign Simulation, Proceedings of eCAADe 2017, apienza University of Rome, Rome, Italy,495–502.
Klinker, G., Stricker, D. and Reiners, D. 2001, Augmented Reality for Exterior ConstructionApplications, in W. Barfield and T. Caudell (eds.), Augmented Reality and WearableComputers, Lawrence Erlbaum Press, New Jersey, 397–427.
Long, J., Shelhamer, E. and Darrell, T.: 2015, Fully Convolutional Networks for SemanticSegmentation, the IEEE Conference on Computer Vision and Pattern Recognition (CVPR),3431–3440.
Mori, S., Ikeda, S. and Saito, H.: 2017, A survey of diminished reality: Techniques for visuallyconcealing, eliminating, and seeing through real objects, IPSJ Transactions on ComputerVision and Applications, 9, 1–17.
Portalés, C., Lerma, J.L. and Navarro, S.: 2010, Augmented reality and photogrammetry:A synergy to visualize physical and virtual city environments, ISPRS Journal ofPhotogrammetry and Remote Sensing, 65, 134–142.
Ronneberger, O., Fischer, P. and Brox, T.: 2015, U-Net: Convolutional Networks forBiomedical Image Segmentation, Medical Image Computing and Computer AssistedIntervention, 9351, 234–241.
Tomasi, C. and Kanade, T.: 1992, Shape and motion from image streams under orthography: afactorization method, International Journal of Computer Vision, 9, 137–154.
Yang, J., Zhao, L., Mcbride, J. and Gong, P.: 2009, Can you see green? Assessing the visibilityof urban forests in cities, Landscape and Urban Planning, 91, 97–104.

AN ASSEMBLY GUIDANCE SYSTEM OF TOU KUNG BASED ONAUGMENTED REALITY
ZI-RU CHEN1, CHIEN-JUNG LIAO2 and CHIH-HSING CHU31Southern Taiwan University of Science and [email protected],3National Tsing Hua [email protected] [email protected]
Abstract. Tou kung represent Chinese architecture. Due to thedifficulty of learning from ancient books, some develop 3D assemblymodels. Still, there are limits while using 2D images for assemblyinstructions. The purpose of this study is to explore whether theapplication of AR technology can guide the process of tou kungassembly and address the recognition gap between paper illustrationsand the physical assembly process. The method is to observes the user’stou kung assembly behavior and performance. Then the study proposedan dynamic simulation AR guidance system to help people not onlyunderstand the structure, but also the culture behind to reach the goalof education promotion.
Keywords. Augmented Reality; Tou-Kung; assembly.
1. Introduction1.1. IMPORTANCE OF TOU KUNG IN CHINESE ARCHITECTURE
Architecture is the largest, the most complex, and the most durable among humancreations. Understanding an architectural structural system reveals its ethnicculture and art, and reflects the social life and scientific developments of that time.It records the living track of different regions and ethnic groups, thus, creatinga live history reference book. “Tou kung” plays a decisive role in the Chinesearchitectural development process, and is one of the most notable features ofChinese architecture. The “tou kung” structure is the key characteristic in thestructural determination method and development of Chinese architecture. It is animportant feature of the “pillar” of Chinese architecture, and a unit of measurefor the overall building volume (Liang 2011). As the foundation of Chinesearchitectural formal grammar, “tou kung” represents the oriental tectonic culturalcharacteristics, and tells of a system of tectonics different from theWestern system.Therefore, tou kung can offer an insight into the life values and science history ofOriental nations.
Tou kung consists of a series of basic bracket sets placed on pillar tops, whichsupport the wooden beams internally and the eaves externally. It is an objectthat buffers shear forces in the building structure (Liang 2012). Although the
T. Fukuda, W. Huang, P. Janssen, K. Crolla, S. Alhadidi (eds.), Learning, Adapting and Prototyping,Proceedings of the 23rd International Conference of the Association for Computer-Aided ArchitecturalDesign Research in Asia (CAADRIA) 2018, Volume 1, 349-358. © 2018 and published by the Associationfor Computer-Aided Architectural Design Research in Asia (CAADRIA) in Hong Kong.

350 Z.R. CHEN, C.J. LIAO AND C.H. CHU
standard of the tou kung structure was formalized after the completion of thebook, Creation Grammar, by Li Jie in the Song Dynasty, the actual form andproportion of tou kung are quite varied. However, in practice, varied results canbe produced in response to the overall building form. Therefore, through analysisof tou kung, we can understand the relationship among ancient Chinese buildingmaterials, structures, and external forms, and gain insight into the development ofengineering and technology at that time.
However, as Chinese architecture is dominated by wood structures, andsuch architectural entities are easily damaged by nature and humans, there arefewer and fewer opportunities for actually observing, manually practicing, anddeconstructing the tou kung structure. In addition, changes in the applicationof contemporary building materials renders the Western architectural style themainstream of current architectural design teaching materials, thus, relevantresearch and historical data are very limited. As it is very difficult to understand thecomplex structural styles and other factors simply by 2D drawings, it sets a highthreshold for the assembly learning of tou kung, and increases the difficulty ofpromoting oriental architectural culture, thus, it is necessary to propose a guidingmethod for the general public to understand tou kung.
1.2. RESEARCHES OF AUGMENTED REALITY ON MODEL ASSEMBLY
Augmented reality(AR) is a technology that combines the real world with virtualspaces, which enable them to interact through a camera’s location and imageanalysis algorithms, thus, providing users with different personal experiences.In the area of learning experience, AR can be applied to the tourism guides ofmonuments and temples, thus, improving learners’ sense of participation(Wang2010). In addition, AR can be combined with three-dimensional puzzle teachingaids to enhance learning motivation(Le 2015), which shows that AR is helpfulfor learning. In the area of assembly guidance, an AR identification functioncan provide more detailed information regarding parts, enhance the sense of userspace, and guide the assembly process. Compared with the traditional manual,the application of AR technology takes significantly less time to complete theassembly work, which demonstrates the AR system effectively helps users inassembly and enhances user satisfaction(Wu 2012). Therefore, if AR technologyis used to guide the assembly learning of the tou kung model, there may be anopportunity for more people to recognize the complicated structure of tou kungto understand the beauty of Chinese architecture, and to realize the purpose ofpromoting culture and education.
In the interface design of AR assembly guidance, Renner and Pfeiffer(2017)explored the impact of different assembly instructions on assembly time, as shownin Figure 1a. The experimental results show that displaying both the leader andthe part on a screen is better, presumably because they are more intuitive and theinstructions still exist when the screen does not detect an object, thus, improvingthe assembly experience. The interface, as developed by Hahn et al.(2015), canprovide assembly location information and display a progress bar at the top of thescreen to let users know the current assembly progress. See Figure 1b. In addition,a study byWoodward et al.(2008) proposed increasing the users’ awareness of the

AN ASSEMBLY GUIDANCE SYSTEM OF TOU KUNG BASED ONAUGMENTED REALITY
351
assembly instructions and the actual assembly object by combining the assemblyinstruction animation with the actual object. See Figure 1c.
Falck et al. (2017) allows users to wear AR glasses to view a recognition card,which shows the instruction buttons of the previous step and the next step to helpthe users complete the model assembly, as shown in Figure 1d. However, whencompared with paper and video teaching, the teaching mode that requires the leasttime is the video teachingmethod, presumably because real human operation in thevideomakes it easier for the user to comprehend. Syberfeldt et al. (2015) proposeda process design for a 3D puzzle assembly. The system directly marked the partsrequired by the user in obvious colors. It also displayed the 3D assembly modelat a specific location, as shown in Figure 1e. However, the experimental resultsalso mentioned that the assembly time was not reduced, as users were unfamiliarwith the system. The above studies are all examples of various assembly taskscombined with AR systems, demonstrating the feasibility of augmented realitytechnology for various assembly requirements; however, there is still room forimprovement in the process and interface designs.
Figure 1. Different AR-aided assembly system from previous research.
2. Problem and objectiveAs tou kung is a complex architectural object, although the Creation Grammarof the Song Dynasty interprets tou kung with a lot of writings and provides alarge number of drawings, it is knowledge that is difficult for most people toread, thus, the tou kung structure must be explored through the actual assemblyand implementation of the physical tou kung model. However, it is difficultto actually learn the structural system of a tou kung structure and its culturalmeaning only through the assembly of the physical model. In addition, it isdifficult for traditional paper-based illustrations to completely present complicated3D shapes and structures, thus, it is necessary to provide a 3D interactive assemblyinterpretation system. Therefore, the purpose of this study is to explore whetherthe application of AR technology can guide the process of tou kung assembly andaddress the recognition gap between paper illustrations and the physical assemblyprocess, as well as provide a better assembly learning experience, thus, achievingthe purpose of knowledge inheritance.

352 Z.R. CHEN, C.J. LIAO AND C.H. CHU
3. Methodology and stepsThe design of this research method first observes the user’s tou kung assemblybehavior and their tou kung learning performance during the process, which can beused as reference for AR assembly guidance design. Next, a design for augmentedreality assembly guidance is proposed in an attempt to address the assemblyproblems encountered during the assembly process of a physical tou kung model,facilitate assembly of the tou kung assembly process with the help of AR assemblyguidance, and provide insight into the constitution principle.
3.1. SELECTION OF TOU KUNG ASSEMBLY PATTERNS
There are only two works about architecture in ancient Chinese books, one is theCreation Grammar, an architectural guidebook from the Song Dynasty, and theother is the Engineering Practice Cases of QingMinistry ofWorks, an architecturalregulation handbook from the Qing Dynasty. It can be observed that with thechange of the times, the tou kung style developed from the early macro structurewith a load-bearing function to a reduced volume with only decorative function inthe Qing Dynasty (Liang 2016). Considering that the authors hope to use the ARsystem to explain the complex relationship of tou kung structure, the tou kung styleexemplified in this study is mainly Song-styled tou kung, and a set of “five-storyinsertion” tou kung style of moderate difficulty is selected as an example, as shownin Figure 2.
Figure 2. Left and middle: “Five-story insertion” tou kung in ancient books ; Right: Model of“five-story insertion” tou kung.
3.2. STAGE 1: PRE-TEST EXPERIMENT OF USER TOU KUNG ASSEMBLY
3.2.1. Step 1: selection of subjectsFive subjects were invited to assemble a set of “five-story insertion” tou kungmodel, and the subjects selected in the experiment were students, aged between 20and 24 years, from polytechnic universities, who have basic assembly experience,such as furniture and Lego. However, none of them have ever come into contactwith the tou kung model. The purpose of this experiment is to understand whethersubjects with basic assembly experience can use their past experience to assemblea set of five-story tou kung model. If they can, which assembly experience andbehaviors were used? If they cannot, what was the biggest assembly difficulty inthe tou kung assembly process?

AN ASSEMBLY GUIDANCE SYSTEM OF TOU KUNG BASED ONAUGMENTED REALITY
353
3.2.2. Step 2: manufacture of paper assembly manual for the “five-story insertion”tou kung modelAccording to Fan (2010), a few design principles for an assembly manual havebeen referred to, including that illustrations must fully express the steps andsequence. Icons should be used to depict the actions, arrows and dotted linesshould be used to guide the assembly position, the model perspective should notbe changed arbitrarily during the assembly display, etc. In this experiment, theassembly process of a “five-story insertion” tou kung model was divided into fivestages, 4 to 7 components (object) must be assembled in each stage, and a commonexplosion diagram was used to display the assembly sequence. Refer to Figure 3for the assembly drawing.
Figure 3. Designed paper instrutions.
3.2.3. Step 3: planning of the assembly experiment processThe experiment process has three parts, as shown in Figure 4. The entireexperiment took about 1 hour.
Figure 4. Experiment process.
3.3. STAGE 2: DESIGN OF AR ASSEMBLY GUIDANCE SYSTEM
Stage 2 is to develop and implement the AR assembly learning system. First,the pre-test observations of the user assembly behavior and the limitations of thepaper manual served as the basis for the development and implementation of theAR assembly learning system. After that, with reference to the AR applicationin the assembly during previous studies, four kinds of AR assembly guidancemethods were summarized, as shown in Table 1. Based on the above, thevisual demonstration and interface design of tou kung information on the ARapplication were planned as the learning mechanism for guiding the users in toukung assembly.

354 Z.R. CHEN, C.J. LIAO AND C.H. CHU
Table 1. Summarized of AR assembly guidance methods.
4. Results and discussion4.1. ANALYSIS OF ASSEMBLY TIME
Table 2. Assembly time analysis.
There were a total of 5 subjects in Stage 1 of this study, respectively, which took anaverage of 20 minutes to assemble the same set of tou kung, as shown in Table 2.Regarding the analysis of the time spent on assembly in each stage, Figure 5 showsthe box-whisker diagram of each assembly stage. Stage 2 had the maximum timespent on assembly, and the largest time difference among the different subjects,which may be because Stage 2 was the early stage of the assembly stage, and therewere many new components that had to be identified and learned. Moreover, thesubjects were still learning to interpret the surface descriptions of the assemblyinstructions, which increased the thinking and assembly time. However, as theassembly progressed to the late stage, it can be seen that the assembly timewas significantly shortened. In particular, the time spent in the last stage wasthe shortest, and the number of components to be assembled in the last stagewas six, which were more than with those in Stage 1 and Stage 2. However,observations indicated that the assembly time was significantly reduced, whichwas probably because there were fewer components that needed to be assembled,fewer judgment options were required, or because the subjects had graduallymastered the tou kung structure and the composition mode of tou kung in theprevious assembly process, which reduce the assembly time. Thus, the subjectslearned the structural relationship of tou kung through the assembly process of thephysical model.
Figure 5. Box-whisker diagram of each assembly stage.

AN ASSEMBLY GUIDANCE SYSTEM OF TOU KUNG BASED ONAUGMENTED REALITY
355
4.2. OBSERVATION OF ASSEMBLY TRIAL AND ERROR
The trial and error behavior in the assembly process can be divided into threeforms: (1) selection of wrong components; (2) incorrect component assemblyposition; and (3) incorrect assembly direction. There are two possible causes forselection of wrong components: the first is that the subjects are not aware of thecomponent size; second is that the shapes of different components are very similar,leading to judgment error. The incorrect component assembly position is mainlybecause the positions of the physical model and arrow guidance, as recognizedby the subjects, are different. The incorrect assembly direction is because theperspectives drawn in the figure are different from the actual assembly modelperspective, as recognized by the subjects, thus, the subjects had to shift amongthe different angles to find the correct angle. Figure 6 shows the statistics ofthe number of trial and error in each stage. The number of these trial and errorbehaviors significantly decreases as the stage progresses, which is speculated to becaused by the reduction in the selection of assembly components or the improveduser recognition of the components.
Figure 6. Errors of every stage.
4.3. OBSERVATION OF OVERALL ASSEMBLY BEHAVIOR
From the overall observation of assembly behavior, with the exception ofSubject D, all the subjects conducted component classification behavior at thebeginning of assembly, mainly placing the bow-shaped tou separately fromthe arch-shaped kung, which is mainly due to their previous model assemblyexperience and strategies, or to the brief introduction about the basics before theexperiment.However, although the complex forms of tou kung are composed oftwo basic units, tou and kung, there are a variety of results due to different locationsand compositions. Therefore, it might not be suitable to adopt classification meansof similar shaped components of the tou kung architectural structures. Moreover,in the early assembly stage, the subjects must spend a lot of time identifyingwhether the shape of each component conforms to the component required in thisstage, which generates many mistakes in the selection process. It can be seen that,in the assembly process of tou kung, more information must be provided to helpusers to determine whether the current assembly steps are correct.

356 Z.R. CHEN, C.J. LIAO AND C.H. CHU
4.4. ASSEMBLY GUIDANCE SUGGESTIONS ON SUB-CONCLUSION ANDPOST-TEST INTERVIEW
1. In the late stage of the assembly process, the users were able to graduallymaster the structural relationship and composition principle of tou kung,thus, assembly and guidance should be the focus of the pre-assembly guidancedesign. In the post-assembly discussion, Subject A had expressed that he was notfamiliar with the mortise and tenon assembly mode of tou kung, and only began tounderstand the structural relationship between the tenon and mortise connectionas the assembly proceeded to the later steps.
2. The size and the relationship of the components of the assemblymodel cannotbe read through the paper assemblymanual,which easily leads to a recognitiongap from the physical model in terms of shape identification, body size, assemblyposition, and orientation, resulting in assembly errors. Subject A suggested thatsome details of the component cannot be seen in the whole picture, and therefore,would affect judgment regarding whether the selected component is correct ornot, thus, more pictures from different angles should be provided. In addition,Subjects A, B, C, and E thought that a “steps completion figure” and a “sub-groupcomponent completion figure” were necessary, and should be added to the manualto help users make their judgment.
3. Provide guide design on component classification and assembly process.Component classification should be based on the content of the componentsneeded in each stage, rather than the shape similarity method. The subjects needto understand this structure, and then decide the assembly order. The Subjects A,B, and D suggested that the instructions on the arrow should be distinguished bydifferent colors, which could make the instructions more clear.
5. Design of the AR tou kung assembly guidance systemThe experimental analysis of the previous stage can provide insight into the user’sproblems and needs during the assembly of a tou kung model. Based on the abovesuggestions and conclusions, this stage explores how augmented reality can beapplied to guide the assembly behavior according to different assembly situationsand dilemmas. The observation process of tou kung assembly behaviors can bedivided into two main situations: (1) component classification and selection, (2)component assembly. Thus, based on the observation results of the previousstage, different augmented reality assistance and guidance programs are proposed,respectively, for the above two situations, in order to explore how these auxiliarysuggestions can solve the assembly problems.
5.1. COMPONENT CLASSIFICATION AND SELECTION
1. Component classification in each stage: display and switching of assemblysteps As mentioned in the previous stage, users often classify scatteredcomponents prior to assembly, thus, the classification method should be based onthe components required for each assembly stage. Therefore, augmented realityguidance can refer to a method to display and switch the assembly steps, andprovide a progress bar and the component images required in each stage, as shown

AN ASSEMBLY GUIDANCE SYSTEM OF TOU KUNG BASED ONAUGMENTED REALITY
357
in Figure 7. The user can use this in the augmented reality interface to classifythe components in various stages to gradually understand the composition formof tou kung.
2. Component searching: interactive 3D model display.In the componentsearching process, an interactive 3D model display mode can be used to displaythe 3D virtual model of the next required component on the AR device screen,as shown in Figure 7. Users can zoom in, zoom out, and rotate the 3D model ofthe component to observe the different angles of the component, in order to helpusers identify each component. This approach also allows the details of the entirecomponent to be observed, and thus, solves the problem of paper manuals, whichprovide only one perspective.
5.2. COMPONENT ASSEMBLY: DYNAMIC VIDEO PLAYING
In the design of the component assembly guidance system, the “dynamic videoplaying” mode can be used to display animated instructions combined with theactual scene in the augmented reality interface, as shown in Figure 7. The usercan clearly understand the position and orientation of the component, which solvesthe complex arrow pointing problem of the paper manual. In addition, the designprinciple should be able to show the 3D completion figure of each step, and markthe newly added components in different colors, to help the user more easilyconfirm the position of the component (Fan 2010).
Figure 7. Dynamic video playing.
5.3. ARCHITECTURE OF ASSEMBLY GUIDANCE SYSTEM
To sum up above analysis, this study proposes a set of “dynamic simulation ARguidance system”. Firstly, a camera is used to recognize the image and identifythe current progress of the physical model assembly. The system searches forthe corresponding current digital model progress, including the 3D model filesand assembly animation, and places them on the device screen through real-timecalculation. The system then provides guidance on the progress implementation inthe next stage. During the selection of components, the user can freely zoom in onthe model to observe the details of the components, in order to guide the assemblybehavior, and switch to the next step after completion. At this point, the systemstatus will be updated. Repeat the above search for components and assemblyprocess to help users until assembly is completed. Figure 8 shows the architectureof the augmented reality system for dynamic simulation assembly guidance.

358 Z.R. CHEN, C.J. LIAO AND C.H. CHU
Figure 8. Architecture of assembly guidance system.
6. ConclusionThrough the design of the AR tou kung assembly guidance system, the studyproposes a set of innovative augmented reality applications for tou kung assemblyguidance and learning. In addition to improving the problem of the inadequateinformation of only 2D images and the spatial recognition of complex structures, itprovides more introductions regarding the structures and their construction duringthe interaction process, as well as more learning information, which a papermanual cannot provide.Future research requires further testing of this system formore users to understand the problems in the AR assembly guidance. At present,as only one set of tou kung is selected for testing in this study, the system shouldalso be applied to tou kung with different modules in the future, in order to upgradeit to a more general AR assembly guidance system model.
ReferencesBusck, N.: 2017, Assembly Instructions for the Swedish Manufacturing Industry of the Future.,
Master’s Thesis, Chalmers University of Technology.Hahn, J., Ludwig, B. and Wolff, C.: 2015, Augmented reality-based training of the PCB
assembly process, Proceedings of the 14th International Conference on Mobile andUbiquitous Multimedia, 395-399.
Liang, S. C.: 2011, Chinese Architecture, A Pictorial History, Joint Publishing, Beijing.Liang, S. C.: 2012, the Beauty of Simplicity, Joint Publishing, Hong Kong.Renner, P. and Pfeiffer, T.: 2017, Evaluation of Attention Guiding Techniques for Augmented
Reality-based Assistance in Picking and Assembly Tasks, Proceedings of the 22ndInternational Conference on Intelligent User Interfaces Companion, 89-92.
Syberfeldt, A., Danielsson, O., Holm, M. and Wang, L.: 2015, Visual Assembling GuidanceUsing Augmented Reality, Procedia Manufacturing, 98-109.
Wang, K. S.: 2010, A Comparative Study on the Interaction Styles of Multi-tagged AugmentedReality Games for Supporting Mobile Learning in a Heritage Temple, Master’s Thesis,Tatung University.
C. Woodward, M. Hakkarainen and M. Billinghurst (eds.): 2012, Research on Mobile SoftwareEngineering: Design Implementation and Emergent Applications, IGI Global.
Wu, T. Y.: 2012, A Study on Feasibility Design of DIY Furniture Assembly by Augmented RealityTechnology, Master’s Thesis, Tatung University.

RETHINKING AND DESIGNING THE KEY BEHAVIOURS OFARCHITECTURAL RESPONSIVENESS IN THE DIGITAL AGE
JU HYUN LEE1, NING GU2, MARK TAYLOR3 andMICHAEL OSTWALD41,2University of South Australia1,2{juhyun.lee|ning.gu}@unisa.edu.au3Swinburne University of [email protected] of [email protected]
Abstract. In the late 1960s the architect Nicholas Negroponteintroduced that the physical environment could exhibit reflexive andsimulated behaviours, an idea that has since been widely explored.Despite of this wider interest, there is not, however, a systematicapproach to understanding architectural responsiveness in the digitalage. This paper aims to provide a formal way to facilitate designingsmart and interactive artificiality in the built environment. This paperpresents a conceptual framework, through exploratory studies on recentarchitecture, highlighting four key behaviours: (1) tangible interaction,(2) embodied response, (3) ambient simulation, and (4) mixed reality.In addition, two essential enablers, collectiveness and immersion, areproposed to enhance these key behaviours. This framework can be usedas a tool to systematically identify and characterise the responsiveness of“responsive architecture”. The creative mixtures of the key behaviourswill contribute to the development of unique responsive environments.
Keywords. Responsive architecture; Responsive behaviour;Interactive art; Negroponte.
1. IntroductionThe evolution of communication and networked technologies is rapidly changingour world, redefining the roles of, and access to, digital information. Theseprogressive changes have significantly challenged the traditional values of thephysical, social, and economic aspects of the world. In architectural scienceand design, specific examples such as ubiquitous computing, are used toembed microprocessors into everyday objects so that they can directly storeand proactively communicate information. The use of advanced computationaldesign and manufacturing technologies allows architecture to be more sensitiveand responsive to human needs. Moreover, the convergence of wireless andsensor networks, advanced electronics and materials enables new types ofinteraction between humans and their environments. These ongoing technological
T. Fukuda, W. Huang, P. Janssen, K. Crolla, S. Alhadidi (eds.), Learning, Adapting and Prototyping,Proceedings of the 23rd International Conference of the Association for Computer-Aided ArchitecturalDesign Research in Asia (CAADRIA) 2018, Volume 1, 359-368. © 2018 and published by the Associationfor Computer-Aided Architectural Design Research in Asia (CAADRIA) in Hong Kong.

360 J.H. LEE ET AL.
developments, design applications and philosophical debates have been looselystudied since the late 1960s, and are todaymore closely associatedwith the conceptof “responsive architecture”.
More recently, ideas and prototypes of responsive architecture have drawnincreasing interest from researchers, practitioners, artists and even the public.However, a critical understanding of the subject area as a whole is still largelymissing. In particular, there is a lack of a systematic approach to effectivelydesign smart interactive artificiality in the built environment. There is also a lackof cohesive guidelines for design practice to make full use of new ambient andubiquitous interfaces.
To address these gaps, this paper provides a formal way to facilitate designingresponsive architecture. This research firstly reframes responsiveness in the builtenvironment and secondly develops four key behaviours of responsive architecturein the digital age. These behaviours are (1) tangible interaction, (2) embodiedresponse, (3) ambient simulation, and (4) mixed reality. Through four exploratorystudies, this paper examines and demonstrates the key behaviours that responsivearchitecture exhibits. A conceptual framework is then presented, identifying twoessential enablers, collectiveness and immersion, to enhance the key behaviours.Finally, this paper concludes with a discussion about how the framework is appliedto systematically build responsive architecture from hand-held applications toanonymous networked environments.
2. Reframing responsiveness in the built environment“Responsive architecture” is a type of architecture that can change its form inresponses to changing conditions (Sterk, 2005). Related ideas including Brodey’ssoft architecture, Negroponte’s architecture machine, and soft architecturemachine (Brodey, 1967; Negroponte, 1969; 1975) are still valid means to exploreresponsive architecture. “Responsive”, being adaptable or reactive, is whenthe environment takes an active role, initiating different degrees of changes.Responsive architecture could be a result of complex or even simple computation,or so-called “trivial-but-serious computing” (Negroponte, 1975). The idea ofbeing responsive in this sense is distinguished from being flexible or manipulative.
Soft architecture machine was Negroponte’s experimental attempt to builda theory of responsive architecture as well as to design it, using reflexiveand simulated behaviours. Negroponte proposed some examples for the firstbehaviour, further considering self-organising controllers, recognising mood andthe enhancement of mutual involvement, while he also realised that the gesturalnature of reflexive responses was still hard to imagine. The second, simulatedresponse, is relatively easy to construct within a “simulatorium” (Negroponte,1975). Underlying these two types of behaviours is a theoretical framework toeffectively build responsive architecture, but also facilitates the understanding ofthe recent evolution, which further produces a variety of architectural responses.They can be used to explain and design emerging interactive, informativebehaviours in the built environment.
Advances in computation have significantly enabled the emergence of robotics

RETHINKING AND DESIGNING THE KEY BEHAVIOURS OFARCHITECTURAL RESPONSIVENESS IN THE DIGITAL AGE
361
and Artificial Intelligence (AI) technologies. Sensory interaction would be afundamental behaviour explaining responsiveness. For example, audiences inmany interactive art exhibitions actively participate in the interactive process ofan artwork. The audience is not a passive one, but an active part of the artwork.They become the listeners as well as the composers, conveying a similar processof self-organising behaviours in architecture. This creates two-way simultaneouscommunication. Effectively, process replaces product, just as system supersedesstructure (Ascott, 1969). That is, as art becomes a form of behaviour, the builtenvironment can be software beyond hardware. These sorts of behavioural effectscan influence individuals, communities and cultures connected by continuoussensory data to dynamic architecture. This is one potential way that responsivenessin the built environment may arise in the digital age (Kolarevic, 2004). Thus,responsive architecture can be regarded as a dynamic built environment interactingwith constantly changing bits captured by ubiquitous sensor networks.
Architecture was often socially framed in its long history and has recentlybecome an operable equipment, e.g., home automation and smart home(McCullough, 2005). Although computing was traditionally separated fromsocially framed architecture, architecture has since combined with computing toform both inhabitable and operatable environments. The high flexibility of theurban system, combined with the fantasy of a responsive environment capableof feedback, was symptomatic of the 1960s belief that inhabited spaces could berendered adjustable to the changing needs of their inhabitants (Colombino, 2012).In the meantime, since Negroponte’s conceptual development of responsivearchitecture, computers have become faster, cheaper, smaller, and capable of beinginjected into a very small object. Pervasive computing, also called ubiquitouscomputing, is realised by embedded microprocessors and sensors in everydayobjects, buildings and environments. It is globally networked and graduallyinserted into “everything”. Thus, everyday devices and objects have become theInternet of Things (IoT).
Kroner (1997) identified the potential of transforming the built environmentsfrom a collection of static objects into a world of dynamic and interactive builtforms. Emerging architectural technologies enable representing and facilitating acomplex set of personal non-linear interactions. That is, architecture has becomeinformation dense, real-time interactive and constructive (Yoon, 2008). It existsin a “thick air” (Velikov et al., 2012) of information and interaction surroundingus. In order to explore these sorts of responsive processes in the digital age, thispaper proposes four key behaviours as categorised in Table 1.
Table 1. Reframing key behaviours of responsive architecture.
While tangible interactions and embodied responses evolve out ofNegroponte’s reflexive behaviour, his simulated behaviour can be extended

362 J.H. LEE ET AL.
to ambient simulation and mixed reality in the current digital age. Reframing keybehaviours is designed to critically understand recent innovative responsivenessas well as to provide conceptual directions for explanatory research on responsivearchitecture, as discussed in the next section.
3. Four key behaviours of responsive architectureThis section illustrates four key behaviours of responsive architecture througha critical literature review and case studies. These case studies demonstrateeach behaviour and have been conducted on artworks selected from variousinteractive art exhibitions, including the Borderless Reality exhibition supportedby International Symposium on Mixed and Augmented Reality (ISMAR) 2010,Incheon International Digital Art Festival (INDAF) 2010, Vivid Sydney 2014,19th and 20th Biennale of Sydney, and interactive systems reported in recentliterature.
3.1. TANGIBLE INTERACTION
The first key behaviour of responsive architecture is tangible Interaction. This hasbeen widely investigated in the field of Human Computer Interaction (HCI) underthe topic of Tangible User Interfaces (TUI). Ullmer and Ishii (2000) described TUIas “giving physical form to digital information” that can be understood as certainresponses in the environments reflecting on their surrounding contexts. Horneckerand Buur (2006) extended it to social interaction. By contrast, our explorationstarts with the “graspable interface” (Fitzmaurice et al., 1995).
Tangible interaction starts by tangible manipulation that relies on materialrepresentations with distinct tactile qualities. Under this, the physicallymanipulated interactions are often enhanced by ubiquitous and mobile computingto support the so-called “space multiplex design”. For example, The Wikitudeworld browser, introduced in 2008, projects local information such as landmarksonto the camera view of a smart phone. This kind of AR has already beencommercially used in the context of Social Network Service (SNS). With thesupport of this social context, this new responsive behaviour can realise the sharing,collaboration, and interactivity of personalised contents, which can encourage andevoke collective intelligence.
3.2. EMBODIED RESPONSE
Embodied responses are often exhibited in a ubiquitous environment that blurs andmerges both physical and digital spaces. The design of these smart environmentsis, therefore, closely supported by many emerging technologies: pervasive andmobile computing, sensor networks, robotics, multimedia computing, middlewareand agent-based software (Cook and Das, 2007). Negroponte also predictedthe integration of computing into the built environment and highlighted thatcontext recognition would be an important component of responsive architecture.Emerging architecture that embodies responses can recognise users’ behavioursand needs through the context-aware inference, and then provides suitable,personalised services (responses). Embodied interaction (Dourish, 2004) relates

RETHINKING AND DESIGNING THE KEY BEHAVIOURS OFARCHITECTURAL RESPONSIVENESS IN THE DIGITAL AGE
363
to embodied cognition focusing on unconscious or intuitive interactions in space.It further highlights human input and output mechanisms in a ”human-machinesystem”. This phenomenon can also be interpreted in terms of two components -spatial interaction and embodied facilitation - derived from Hornecker and Buur’sframework. Spatiality is an inherent property of a tangible interface and interactionand facilitation are embedded and situated in physical space, and users need tomove in real space when interacting. Interactions are not restricted to touchingand moving objects in space, but rely on moving one’s body (Hornecker and Buur2006).
Embodied response, in responsive architecture, is highlighting a kind of spatialinteraction, which is accommodated in physical space and operated in softwarespace. Ishii and Ullmer (1997) introduced the term ‘tangible bit’, to representinteractive surfaces, coupling of bits and atoms, and ambient media, in whichcomputational power is seamlessly integrated into the objects and environment. Asa result, computers have “disappeared”, but computation is embedded everywhere(Weiser, 1991). After implementing the computing infrastructure, the question ofhow to exhibit appropriate architectural responses is a core issue for responsivearchitecture.
3.3. AMBIENT SIMULATION
Ambient simulation creates immersive virtual environments enclosing us inarchitecture and the associated virtual reality (VR) and AR devices. These sortsof responsive environments often adopt wearable devices or large displays thatisolate the users from the real context, and place them into a virtual or augmentedrealm. Examples can include VR/AR eyewear like the Google glass, which can beconsidered as a more contemporary and economical version of Sutherland’s headmounted display, but most ambient simulation includes the use of large displaysand surrounding interfaces. Many VR/AR systems - e.g., CAVE sytem, iDome,and VR museums -have typically supported the interactive and immersive aspectsof ambient simulation.
The level of immersion can range from non-immersive ones (i.e. desktopsystems) to more immersive systems varying on the level of invasiveness(wearable devices are considered more invasive than non-wearable ones). IdealVR systems would be enabling both non-invasive immersion and naturalinteraction. Carrozzino and Bergamasco (2010) highlighted that VR systemsallowing for naturalness recognise natural human behaviours through sensornetworks (such as motion-capture devices and speech-recognition systems).That is, ambient simulation seeking for high immersion and a more directcorrespondence with users’ actions needs to consider natural interaction - similarto ’embodied response’ discussed above - rather than non-interactive or mediatedinteraction.
On a different scale, massive light projections, like “Vivid Sydney”, largelyoccur outdoors in many cities. These light projections, often on the facades oflarge buildings, are mostly a one-way interaction, but can also provoke sensoryimmersion because of the massive scale of the ambient projections. For example,“Play Me at Customs House” for Vivid Sydney 2014 projected a series of gigantic

364 J.H. LEE ET AL.
images onto the outer skin of the Customs House in Sydney. Large-scalesimulation of this type can generate a high level of immersion, in spite oflimitations of the interface for projection and interaction. Pedestrians are oftenstruck by the “massiveness” of such installations, which can arguably be definedas an alternative ambient simulation.
Ambient simulation originates from Negroponte’s simulated behaviour, whichis often an easier and more economical way to realise responsiveness in the“hard” architecture. In this context, we highlight both embodied interaction andimmersion as two important factors to effectively facilitate this type of simulatedbehaviour. The future of ambient simulation should go beyond supporting thenatural responses to static or pre-recorded/defined visualisation, but also allow forreal-time simulation that is addressed in the next section as “mixed reality”.
3.4. MIXED REALITY
Mixed reality refers to real-time interaction and registration in the digital worldacross the boundaries between the real and the virtual. Milgram and Kishino(1994) defined it with reality-virtuality continuum ranging from augmented reality(discussed above as AR) to augmented virtuality. Augmented virtuality can beconsidered as a kind of ambient simulation for the virtual environment, while theseamless responsiveness of the AR environment is a characterised feature of mixedreality.
As a critical survey on this field, Azuma et al. (2001) identified nineareas for consideration when commonly adopting AR environments, whichinclude applications for responsive architecture. Mixed-reality environments buildinteractive relations between persons, objects and locations, using ubiquitous andmobile computing, and overlay computer-generated visualisations and realisticvisualisation in the physical world. Such systems connect the built environmentwith geometric information as well as virtual citizens through the social network.“SLARiPS” (Second Life Augmented Reality in Physical Space) project (Stadon,2009) represented one such attempt to extend the Second Life virtual communityinto mixed reality.
More recently, the advent of the smart phone has extended and personalisedmixed reality. “EYEPLY” (Hurwitz and Jeff, 2009) allowed for personalisedmarketing and promotion of products and services to individual users at stadiums,parks, conventions or shopping malls to the individual displays of smart phones.There are further mobile applications operating through Location-Based Service(LBS) and SNS. When presented through smart phones, mixed reality is oftenassociated with tangible interaction, through the direct input and manipulation ofthese mobile devices.
Most cases, nevertheless, use more conventional architectural surfacesas projection screens for mix-reality environments. For example, ”MirrorScrutinizer”, developed by V2_Lab, projects two facial images - one is a physicalaudience’s face and the other is a corresponding facial image in a digital database- onto a glass wall (Figure 1.a). Biometric video-analysis software is used tosupport the matching. In contrast, ”Positive Feedback”, one of the key interactive

RETHINKING AND DESIGNING THE KEY BEHAVIOURS OFARCHITECTURAL RESPONSIVENESS IN THE DIGITAL AGE
365
installations for Vivid Sydney 2014, projects participants’ bodies at various scalesin unfamiliar settings, featuring multiple shadows (Figure 1.b). Audiences enjoydancing and jumping in front of the wall screen due to such interactivity. Althoughthe installation does not show the common mixture of real and virtual images,the participants’ transformed silhouettes enable responsiveness and thereforesupports the audiences’ engagement. Ideas demonstrated in these mixed-realityapplications, can be easily adapted for different architectural surfaces. This mixedreality has also been used for the immersive collaborative design environment (seeFigure 1.c), which generates a new augmented, immersive design space.
Figure 1. Examples of mixed reality.
4. A conceptual frameworkAs demonstrated in Section 3, the convergence of wireless technologies,advanced electronics and materials, as well as sensor networks has enabled newtypes of everyday experiences in the built environment. With Artificial Life(Langton, 1995), for example, local interactions and self-organising behaviours inarchitecture, enable individuals to seamlessly interact with the environment, suchthat the four responsive behaviours discussed above can emerge. In response, thissection proposes a conceptual framework for understanding and evaluating theseresponsive behaviours (Figure 2) for the development of responsive architecture.
Each behaviour independently has its distinct responsive phenomenon inarchitecture, but reflexive-originated behaviours often exist together with thoseof ambient simulation and mixed reality. For example, tangible interactionoften adopts mixed reality to emphasise spatial experience through mobilecomputing. Ambient simulation often becomes more pervasive through embodiedresponses, the so-called “naturalness”, using ubiquitous computing. Thus, thecreative mixture of the four responsive behaviours can enhance the experiencesin responsive architecture.
The four responsive behaviours are amplified further by two essential factors:collectiveness and immersion. Collectiveness here refers to the collectiveresponsiveness to architecture, either at a varying range of spatial scales froma very small component (e.g. nanomaterial) to an entire urban area, or throughfrom multiple to massive number of users’ participation. ”Collective intelligence”highlighted the reformulation of design practices via networked communicationinfrastructures as well as the development of responsive environments as new

366 J.H. LEE ET AL.
territories to connect the social network (Hight and Perry, 2006).
Figure 2. A conceptual framework for developing responsive architecture in the digital age.
Collectiveness is not the simple aggregation of individuals, but the conjunctionof the social network embodied in the environment (Halpin, 2008). The sociallyextended cognition is mediated by the interactive World Wide Web and updatedby users’ collective authorising applications (Bruns, 2008), which can often beinterfaced with hand-held devices supporting tangible interaction. It is located inthe network of relationships that the individual has with the external environmentand other individuals, thus focusing on the role of embodied interaction.
On the other hand, immersion is another quality pursued by responsivearchitecture. The interaction between sensory stimulation and environmentalfactors encourage participant involvement and enable immersion (Witmer andSinger, 1998). Immersion can be enhanced through “stimuli from reality”,“sensory modalities”, “field of view” and “display resolution” (Slater and Wilbur,1997). Thus, immersion can improve the quality of ambient simulation and mixedreality. In addition, the informative behaviours based on the relationships betweenvarious entities in the environments can evoke ‘context immersion’ beyond theconventional sensory immersion.
5. ConclusionNegroponte’s reflexive and simulated behaviours, conceptualised more than fourdecades’ ago, has evolved into new responsive behaviours supported by newtechnologies such as ubiquitous computing andmobile computing. The conceptualframework proposed in this paper facilitates the current exploration of four keybehaviours for responsive architecture: tangible interaction, embodied response,ambient simulation, and mixed reality.
With the rise of responsive architecture, our everyday experiences are getting

RETHINKING AND DESIGNING THE KEY BEHAVIOURS OFARCHITECTURAL RESPONSIVENESS IN THE DIGITAL AGE
367
closer to those illustrated in Langton’s Artificial Life. For example, withembodied response, seamless responsive behaviours can be exhibited in thebuilt environment through context awareness. Responsive architecture generallyrequires incorporating sensory data into a central inference system to correctlyinterpret our needs or contexts and provides appropriate responses managed bythe central controller. The architectural responses can then be distributed intosmall components, i.e. smart materials or nanomaterials, spreading across theenvironment. Responsive capacity is therefore embedded in the structure of thematerial or surface itself. This kind of set-up also allows for distributed (ornetworked) computation through a suite of building components that enables theircollective responsiveness.
The main goal of most responsive architecture is to develop a proactiveand performative environment based on the direct or indirect communicationbetween people and architecture. There is obviously a two-way simultaneouscommunication, from people to architecture (P2A) and from architecture to people(A2P). The former has been widely researched with a focus on home networkand context awareness, but the latter has still not been adequately explored due to“hard” architecture. In this regard, the two simulated behaviours in the frameworkhave potential to improveA2P communication through different sensory responsessuch as visual, auditory, and/or kinetic simulation. Of course, architecture hasalready been accommodating various “responsive skins” such as performativebuilding surfaces, Kinetic environment-responsive interior envelope systems, andother smart materials. Nonetheless, these behaviours of ambient simulation andmixed reality will enhance the experiences in responsive architecture.
The four key behaviours identified in this exploratory research often overlapto amplify the responsiveness. There is a close association between embodiedresponse and ambient simulation, supported through ubiquitous computing.Tangible interaction is also strongly related to mixed reality through the use ofboth AR and mobile computing. Different combinations of these key behavioursfor different desired effects, is an open question for the future design of responsivearchitecture. In addition, collectiveness and immersion add two importantspectrums to consider responsive behaviours. The conceptual framework canbe used for a formal tool to clearly identify and understand desired behavioursfor effective design of responsive architecture. In order to successfully developresponsive architecture, we also require further investigation on, and engagementwith, engineering challenges, specifically structural, mechanical and materialtechnologies of the built environment. The framework therefore is a crucialstarting point for understanding and designing responsive architecture that stillrequires significant research into various related transdisciplinary fields.
ReferencesAscott, R.: 1970, Behaviourables and Futuribles, Control, 5, 3.Azuma, R., Baillot, Y., Behringer, R., Feiner, S., Julier, S. and MacIntyre, B.: 2001, Recent
advances in augmented reality, IEEE Computer Graphics and Applications, 21(6), 34-47.Brodey, W.M.: 1967, The Design of Intelligent Environments: Soft Architecture, Landscape,
Autumn, 8-12.

368 J.H. LEE ET AL.
Bruns, A.: 2008, Blogs, Wikipedia, Second Life, and beyond: From production to produsage,Peter Lang.
Carrozzino, M. and Bergamasco, M.: 2010, Beyond virtual museums: Experiencing immersivevirtual reality in real museums, Journal of Cultural Heritage, 11(4), 452-458.
Colombino, L.: 2012, The House As SKIN, European Journal of English Studies, 16(1), 21-31.Cook, D.J. and Das, S.K.: 2007, How smart are our environments? An updated look at the state
of the art, Pervasive and Mobile Computing, 3(2), 53-73.Dourish, P.: 2004,Where The Action Is: The Foundations of Embodied Interaction, MIT Press,
Cambridge.Fitzmaurice, G.W., Ishii, H. and Buxton, W.A.S.: 1995, Bricks: laying the foundations for
graspable user interfaces, Proceedings of the SIGCHI Conference on Human Factors inComputing Systems, Denver, USA, 442-449.
Halpin, H.: 2008, Foundations of a Philosophy of Collective Intelligence, AISB Convention,12-19.
Hight, C. and Perry, C.: 2006, Collective Intelligence in Design, Architectural Design, 76(5),5-9.
Hornecker, E. and Buur, J.: 2006, Getting a grip on tangible interaction: a framework onphysical space and social interaction, Proceedings of the SIGCHI Conference on HumanFactors in Computing Systems, Montréal, 437-446.
Hurwitz, A. and Jeffs, A.: 2009, EYEPLY: Baseball proof of concept – Mobile augmentationfor entertainment and shopping venues, IEEE International Symposium on Mixed andAugmented Reality - Arts, Media and Humanities, Orlando, 55-56.
Ishii, H. and Ullmer, B.: 1997, Tangible bits: towards seamless interfaces between people, bitsand atoms, Proceedings of the ACM SIGCHI Conference on Human factors in computingsystems, Atlanta, 234-241.
Kolarevic, B.: 2004, Architecture in the Digital Age: Design and Manufacturing, Taylor &Francis.
Kroner, W.M.: 1997, An intelligent and responsive architecture, Automation in Construction,6(5–6), 381-393.
C.G. Langton (ed.): 1995, Artificial Life: An Overview, MIT Press, Cambridge.McCullough, M.: 2005, Digital Ground: Architecture, Pervasive Computing, and
Environmental Knowing, MIT Press, Cambridge.Milgram, P. and Kishino, F.: 1994, A taxonomy of mixed reality visual displays, IEICE
TRANSACTIONS on Information and Systems, 77(12), 1321-1329.Negroponte, N.: 1969, Toward a Theory of Architecture Machines, Journal of Architectural
Education, 23(2), 9-12.Negroponte, N.: 1975, Soft architecture machine, MIT Press, Cambridge.Slater, M. and Wilbur, S.: 1997, A framework for immersive virtual environments (FIVE):
Speculations on the role of presence in virtual environments, Presence: Teleoperators andvirtual environments, 6(6), 603-616.
Stadon, J.: 2009, Project SLARiPS: An investigation of mediated mixed reality, IEEEInternational Symposium on Mixed and Augmented Reality - Arts, Media and Humanities,Orlando, 55-56.
Sterk, T.D.E.: 2005, Building upon Negroponte: a hybridized model of control suitable forresponsive architecture, Automation in Construction, 14(2), 225-232.
Ullmer, B. and Ishii, H.: 2000, Emerging frameworks for tangible user interfaces, IBM SystemsJournal, 39(3.4), 915-931.
Velikov, K., Thün, G. and Ripley, C.: 2012, Thick Air, Journal of Architectural Education,65(2), 69-79.
Weiser, M.: 1991, The computer for the 21st century, Scientific american, 265(3), 94-104.Witmer, B.G. and Singer, M.J.: 1998, Measuring Presence in Virtual Environments: A Presence
Questionnaire, Presence: Teleoper. Virtual Environ., 7(3), 225-240.Yoon, M.J.: 2008, Public Works, Journal of Architectural Education, 61(4), 59-68.

AUGMENTED REALITY TECHNOLOGY BASED WINDENVIRONMENT VISUALIZATION
JIAWEI YAO1, YUQIONG LIN2, YAO ZHAO3, CHAO YAN4,CHANGLIN LI5 and PHILIP F. YUAN61,2,3,4,6College of Architecture and Urban Planning, Tongji Univerisity1,2,3,4,6{jiawei.yao|1630237|1630238|yanchao|philipyuan007}@tongji.edu.cn5Beijing DreamDeck Technologies Co. [email protected]
Abstract. Considering the outdoor environment at the initial stage ofdesign process plays a significant role on future building performance.Augmented Reality (AR) technology applied in this research canintegrate real world building morphology information and virtual worldventilation information seamlessly that rapidly and directly providesdesigners information for observation and evaluation. During thecase study of “2017 Shanghai DigitalFUTURE” summer workshop,a research on augmented reality technology based wind environmentvisualization was carried on. The achievement with an applicationsoftware not only showed the geometric information of the real worldobjects (such as buildings), but also the virtual wind environment hasdisplayed. Thus, these two kinds of information can complementand superimpose each other. This AR technology based softwarebrings multiple synthetic together, which can (1) visualize the air flowaround buildings that provides designers rapid and direct information forevaluation; (2) deal with wind-environment-related data quantitativelyand present in an intuitive, easy-to-interpret graphical way; and (3)be further developed as a visualization system based on built-inenvironments in the future, which contributes to rapid evaluation of aseries of programs at the beginning of the building design.
Keywords. Environment visualization; Augmented realitytechnology; Fast response; Outdoor ventilation.
1. IntroductionThe creation of a livable urban space environment has gradually become the themeof today’s architectural and urban planning disciplines. The study of microclimatesuch as the urban wind environment has also become a remarkable topic ofacademic concern. As an important factor of urban microclimate, urban naturalventilation plays an important role in the diffusion of air pollutants, the eliminationof heat island effect, the perception of thermal/wind comfort in open space as wellas the wind safety of high-rise buildings. Thus, the response to climate change inurban planning and architectural design is particularly urgent at this moment.
T. Fukuda, W. Huang, P. Janssen, K. Crolla, S. Alhadidi (eds.), Learning, Adapting and Prototyping,Proceedings of the 23rd International Conference of the Association for Computer-Aided ArchitecturalDesign Research in Asia (CAADRIA) 2018, Volume 1, 369-377. © 2018 and published by the Associationfor Computer-Aided Architectural Design Research in Asia (CAADRIA) in Hong Kong.

370 J. YAO ET AL.
On the other hand, with the advent of the digital age, a deep discussion of themeaning of architectural form has been aroused. “Performance Building” providesa new perspective for this topic, and presents the “formal meaning” transformationin architecture - Form Follows Performance (Yuan et al., 2016). Most researchesand practices indicate that the initial stage of design decisions has a significantimpact on future building performance. At this stage, taking the wind speed, winddirection and architectural form, opening, orientation and other parameters into thedesign considerations, will generate the passive wind environment design strategy,which can effectively create a comfortable microclimate environment by using thenatural ventilation (Daniel and Rafael, 2016; Zheng, 2017).
Most research and practice has shown that decisions at the early stages ofdesign have an extremely important impact on the future performance of thebuilding (Oxman, 2009; Attia et al., 2013). In recent years, wind environmentbased passive design strategy can effectively use the natural flow of windto create a comfortable micro-environment. However, the wind environmentmay not convenient to employ by architects because of its invisibility andcomplexity. Although with the development of technology, wind environmentcan be evaluated by frequently-used wind tunnel experiments and computationalfluid dynamics (CFD) simulations, , while the simulations requires relativelyprofessional knowledge, complex simulation settings, and plenty of time andcost. These restrictions led to less than 1% penetration of the architectural windenvironment in the architecture industry (Hong, 2015). On the other hand, theseresults tend to be interpreted and analyzed by professional engineers, and thenprovided to the designers with some suggestions.
Visual design, on the other hand, is the key for architects to share designperspective and collaborative design. A more intuitive visualization platformis even more essential to the architectural design industry that today needs toeffectively handle digital information. Seichter et al. (2004) applied augmentedreality (AR) in urban planning so that designers can understand urban spatialparameters in three dimensions to load mass scale more quickly and convenient tomake decisions.
At present, most of the traditional modes of education in Chinese architectureare displayed through blackboards, printed books as learning materials andcomputer screens, which bring a large amount of texts and data to the audience(Cheng et al., 2014). However, the lack of visual elements may make studentsmore difficult to understand the design thinking, especially the environmentalperformance design. Unless specifically for students to set up a series ofenvironmental simulation software courses, such as Fluent for wind environmentsimulation, Ecotect for daylighting and energy consumption calculation as wellas other simulation software. If students were not experienced to these softwareand the utilizing of simulation results, the designed architecture might not be wellconsidered and sustainable.
In contrast, once integrated with the AR technology, three-dimensionalperspective of the built environment can be superimposed on architecture.Designers can observe and further analyse the environmental performance of thedesigned buildings from various angles by simply scanning the markers with a

AUGMENTED REALITY TECHNOLOGY BASED WINDENVIRONMENT VISUALIZATION
371
camera connected with a customized application installed in the computer or smartphones. By superimposing the dynamic video of the wind environment simulatedin the processor onto the scene, the students can well observe and understandthe impact of the building on the environment from multiple perspectives, whichcontributes designers to find effective methods to optimize the designing scheme(Behzadan et al., 2015).
Therefore, in recent years, lots of universities and research institutes havealready focused on augmented reality technologies and developed extensiveapplications in fields ofmedical, education, military, industrial, advertising, gamesand tourism fields (Mochida et al., 2008; Behzadan et al,. 2015; Daniel andRafael, 2016). The widespread application and rapid popularization of mobile ARterminals also provide beneficial reference for the three-dimensional innovation ofbuilding and environment 3D performance display. Based on the above concepts,this study mainly focuses on the application of AR technology in the field ofarchitecture, introducing the visualization method and process of building windenvironment based on AR technology. Furthermore, according to the case studyof “DigitalFUTURE Shanghai 2017” summer workshop, with the applicationof Unity3D game development engine and Vuforia software, an application forvisualizing building wind environment with AR technology has been developed.It conveniently displays the outdoor natural ventilation around buildings.
2. Methodology2.1. AUGMENTED REALITY (AR) TECHNOLOGY
The goal of augmented reality technology is to superimpose computer-generatedvirtual objects, scenes or system prompts into real scenes to enhance the real worldscene (Zhu et al., 2004). The technology can be applied to the virtual world ofreal-world information through the computer system to effectively improve theuser’s perception of the real world and interactive experience. Based on computerscience and technology, invisible information, including built environment, canbe simulated and then superimposed with the virtual information applied to thereal world, perceived by human senses, so as to achieve beyond the sensoryexperience of reality (Irizarry et al., 2013). In this condition, in the same screenor space, both real and virtual world display together. On the other hand, with therecent rapid development and continuous improvement of computer technology,augmented reality technology is changing the traditional technical methods frommany aspects. It is changing the way human observe and feel the world. RonaldAzuma indicated that augmented reality should have three specific characteristics(Mahapatroa and Khilar, 2012). First characteristic is the integration of the virtualscene and real scene, which means augmented reality does not completely replacethe real world information. Instead, it relies more on the real world. Relying oncomputer technology, virtual objects such as pictures, videos and 3D models aregenerated to integrate with the physical world. The Second one is characterized as3D Registration. Augmented reality real-time tracks camera’s attitude angle forcalculating the camera’s influence location and the registration location of virtualscene in real world. It aims to achieve full integration of the virtual scene and the

372 J. YAO ET AL.
real scene. The last one is real-time interaction, which refers to the user can obtainthe corresponding feedback information through the real world timely.
AR system does not need to display the complete scene, but due to therequirement of analyzing a large number of positioning data and scene informationto ensure that the computer-generated virtual objects can be accurately positionedin the real scene (Zhu et al., 2004). Hence, AR system generally contains thefollowing four basic steps (Figure 1): (1) obtain real scene information; (2) analyzethe real scene and camera location information; (3) generate a virtual scene; and(4) merge the videos or directly display.
Figure 1. AR System Flow.
2.2. BUILDING DIGITAL MODEL COMBINED WITH CFD SIMULATIONANALYSIS
Fluid scene reconstruction is the emphasis and difficulties in augmented realitytechnology research. Fluid has complex motion characteristics, and there is alsothe problem that the topological structure changes with time and space duringmovement, which increases the difficulty of reconstruction of the fluid scene.Thus, the general scene reconstruction method is no longer suitable for the fluid.At present, researchers usually employ the physical properties of the fluid for itssurface reconstruction, such as reflection and refraction. Some of them try toreconstruct water by measuring the amplitude of light refracted from the waterby means of adding some chemical dyes or fluorescer to the water and then usingspecial camera equipment. On the other hand, wind can be visualized with theapplication of smoke wire test and scour experiment in wind tunnel (Zheng etal., 2017). However, these kinds of method and technology require advanced orspecific equipment as well as sophisticated experimental setups that may be notuniversal.
Recently, the method of fluid simulation is mainly with the help ofcomputational fluid dynamics. However, the development of virtual and ARtechnology has spawned a novel human-machine interaction platform, whichvisualizes the trajectory of the wind and projects it into the real physicalworld. These visualizations are not intended to measure or mimic the realwind environment, but rather to promote people better understanding andcommunication by observing complex wind phenomena (Wang, 2009).
2.3. APPLICATION OF VUFORIA AND UNITY3D
Vuforia(TM) is a product of Qualcomm Connected Experiences, Inc. It isa development tool for developing augmented reality applications for mobile
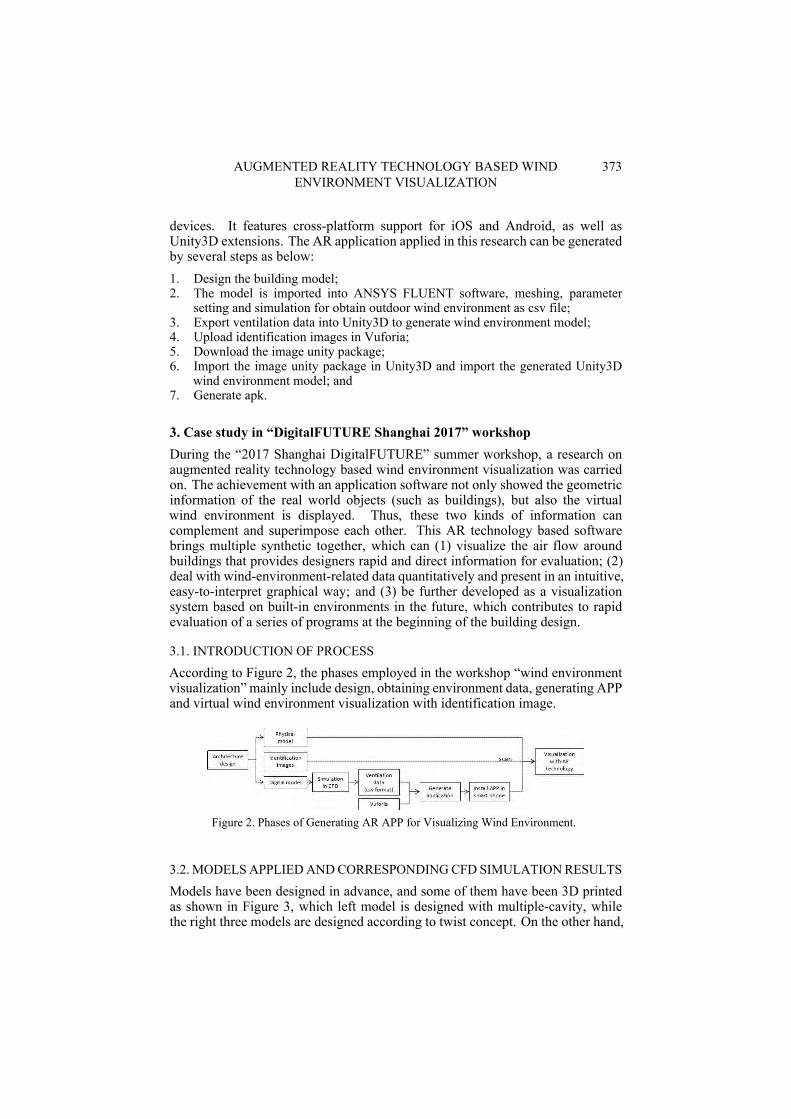
AUGMENTED REALITY TECHNOLOGY BASED WINDENVIRONMENT VISUALIZATION
373
devices. It features cross-platform support for iOS and Android, as well asUnity3D extensions. The AR application applied in this research can be generatedby several steps as below:1. Design the building model;2. The model is imported into ANSYS FLUENT software, meshing, parameter
setting and simulation for obtain outdoor wind environment as csv file;3. Export ventilation data into Unity3D to generate wind environment model;4. Upload identification images in Vuforia;5. Download the image unity package;6. Import the image unity package in Unity3D and import the generated Unity3D
wind environment model; and7. Generate apk.
3. Case study in “DigitalFUTURE Shanghai 2017” workshopDuring the “2017 Shanghai DigitalFUTURE” summer workshop, a research onaugmented reality technology based wind environment visualization was carriedon. The achievement with an application software not only showed the geometricinformation of the real world objects (such as buildings), but also the virtualwind environment is displayed. Thus, these two kinds of information cancomplement and superimpose each other. This AR technology based softwarebrings multiple synthetic together, which can (1) visualize the air flow aroundbuildings that provides designers rapid and direct information for evaluation; (2)deal with wind-environment-related data quantitatively and present in an intuitive,easy-to-interpret graphical way; and (3) be further developed as a visualizationsystem based on built-in environments in the future, which contributes to rapidevaluation of a series of programs at the beginning of the building design.
3.1. INTRODUCTION OF PROCESS
According to Figure 2, the phases employed in the workshop “wind environmentvisualization” mainly include design, obtaining environment data, generating APPand virtual wind environment visualization with identification image.
Figure 2. Phases of Generating AR APP for Visualizing Wind Environment.
3.2. MODELSAPPLIEDANDCORRESPONDINGCFD SIMULATIONRESULTS
Models have been designed in advance, and some of them have been 3D printedas shown in Figure 3, which left model is designed with multiple-cavity, whilethe right three models are designed according to twist concept. On the other hand,

374 J. YAO ET AL.
their surrounding wind environment has been simulated in CFD respectively.
Figure 3. 3D Printed Models.
3.3. APP GENERATION, INTRODUCTION OF RELATED CODES AND KEYTECHNOLOGIES
3.3.1. Tracking Registration TechnologyIn this study, tracking and registration technology is the camera as a tracking object.The tracking technology based on computer vision uses the camera to acquire theimage of the real scene, and employs the algorithm of machine vision to fuse thevirtual object with the real scene in the same video or image. Hardware sensortracking technology through mobile smart phones and other portable devices toobtain the location of the device and mobile information. In addition, artificialidentification images (markers) were applied in this study. The strong markerbased tracking registration technology needs to place a marker in advance in thereal scene as an identification mark. The purpose of employing the marker is toquickly and efficiently detect the presence of the marker in a complex real scene,and then register the virtual scene in the space where the marker is located.
The marker used in AR technology is normally simple. A marker can be arectangular block with only black and white colors, or an artificial marker witha special geometry (Hou and Xu, 2017). In this case study, black words onwhite panels were applied as markers, such as “Digital FUTURE”, while differentmarkers were designed for each models differently. These patterns on the markersindicate various virtual objects with different information.
Figure 4. AR Virtual Button Coding Example.

AUGMENTED REALITY TECHNOLOGY BASED WINDENVIRONMENT VISUALIZATION
375
3.3.2. Display TechnologyVisual may be the most important and direct information transmission channelbetween human and the external environment. Therefore, the display technologyis one of the key technologies in augmented reality. The role of display technologyis to combine computer-generated virtual information with the real world in whichthe user is located. Display technology in AR display system usually includeshelmet display, handheld displays and projection display. This research wasmainly based on the handheld display (mobile smart phone). Smart phonesgenerally have a built-in camera, GPS function and magnetic sensors, etc., whilemost of them have a large high-resolution display screen. Small size andconvenient to carry contribute to become the ideal AR development equipment.
3.3.3. AchievementWith applying Vuforia software and Unity3D game engine, the SDK has beengenerated for installation in one Android mobile phone. Once the camera theidentification images (markers), the supposed invisible wind environment becamevisualize on screen.
Figure 5. Wind environment visualization based on AR technology.
4. ConclusionsAugmented Reality is a new technology that can integrate real world buildingmorphology information and virtual world information seamlessly. In the realworld, the entity information, including visual information, might be difficult tobe experienced in a certain time and space. However, with AR technology, theseinformation can be simulated by computers and further superimposed into the realworld that can be sensed by human. In this condition, the real environment andvirtual material data is integrated in the same space in real-time.
Considering the outdoor environment at the initial stage of design processplays a significant role on future building performance. AR technology appliedin the research can integrate building morphology information in real worldand virtual ventilation information seamlessly that provides designers rapid anddirect information for observation and evaluation. Based on the CFD simulationresults, the invisible wind environment can be visualized on the mobile portableend to depict the movement trajectory of the wind around the building, which

376 J. YAO ET AL.
qualitatively provides the designer with information to evaluate the designstrategy.
Therefore, it can deal with wind environment data such as wind speed andsurface wind pressure quantitatively and help the interpretation of professionalsand non-professionals in an intuitive and augmented reality way. For thenext phase of real-time dynamic architectural design process of environmentalvisualization to get through the path, it will be possible to become the earlyperformance of building design through the performance of a handheld tool.
AcknowledgementsThis research is funded by the National Natural Science Foundation of China(Grant No.51578378), the Special Funds for State Key R&D Program duringthe 13th Five-year Plan Period of China (Grant No.2016YFC0702104), theSino-German Scientific Research Program (Grant No.GZ1162) and Scienceand Technology Commission of Shanghai Municipality (Grant No.16dz1206502,Grant No.16dz2250500, Grant No.17dz1203405).
ReferencesAttia, S., Hamdy, M., O’Brien, W. and Carlucci, S.: 2013, Assessing gaps and needs for
integrating building performance optimization tools in net zero energy buildings design,Energy & Buildings, 60, 110-124.
Behzadan, A.H., Dong, S. and Kamat, V.R.: 2015, Augmented reality visualization, ElsevierScience Publishers B. V., 29, 252-267.
Cheng, W. Y., Mao, C. and Song, X. Y.: 2014, The application and development of Augmentedreality in construction industry, Urban construction theory research, 24, 763-765.
Daniel, J. P. and Rafael, M. C.: 2016, Design driven physical experimentation: a flexible windsensing platform for architects, Proceedings of CAADRIA 2016, 239–248.
Hong, B. and Lin, B.: 2015, Numerical studies of the outdoor wind environment and thermalcomfort at pedestrian level in housing blocks with different building layout patterns andtrees arrangement, Renewable Energy, 73, 18-27.
Hou, Y. and Xu, W. W.: 2017, A survey of Augmented Reality Technology, ComputerMeasurement & Control, 25, 1-7, 22.
Irizarry, J., Gheisari, M., Williams, G. and Walker, B. N.: 2013, InfoSPOT: A mobileAugmentedRealitymethod for accessing building information through a situation awarenessapproach, Automationin in Construction, 33, 11-23.
Mahapatroa, A. and Khilar, P. M.: 2012, Transient fault tolerant wireless sensor networks,Proceeding Technology, 4, 97-101.
Mochida, A., Tabata, Y., Iwata, T. and Yoshino, H.: 2008, Examining tree canopy models forCFD prediction of wind environment at pedestrian level, Journal of Wind Engineering andIndustrial Aerodynamics, 96, 1667-1677.
Oxman, R.: 2009, Performative design: a performance-based model of digital architecturaldesign, Environment & Planning B Planning & Design, 36, 1026-1037.
Seichter, H.: 2003, Sketchand+ a Collaborative Augmented Reality Sketching Application,Proceedings of CAADRIA 2003.
Wang, X. Y.: 2009, Augmented reality in architecture and design: potentials and challenges forapplication, International Journal of Architectural Computing, 7, 309-326.
Yuan, F., Huang, S. Y. and Xiao, T.: 2016, Physical and numerical simulation as a generativedesign tool, Proceedings of CAADRIA 2016, 353–362.
Zheng, J. Y., Yao, J.W. andYuan, F.: 2017, Architectural generation approach with wind tunneland simulation, Proceedings of CAADRIA Short Papers 2017, 13-18.

AUGMENTED REALITY TECHNOLOGY BASED WINDENVIRONMENT VISUALIZATION
377
Zhu, M. L., Yao, Y. and Jiang, Y. L.: 2004, A Survey on Augmented Reality, Journal of Imageand Graphics, 9, 767-774.


TAKE A LOOK THROUGH MY EYES: AN AUGMENTED REALITYPLANNING COMMUNICATION SYSTEM
MICHAEL MÜHLHAUS1, SARAH LOUISE JENNEY2 andFRANK PETZOLD31,2,3Technische Universität München1,2{michael.muehlhaus|s.jenney}@tum.de [email protected]
Abstract. Participation and communication in urban planning,visualisation, spatial perception, and motivation through gamificationare discussed and system requirements derived. An augmentedreality multi-client communication prototype is described improvingtransparency and utilising local expertise in planning processes. Theselection, processing and visualisation of planning data takes individualstakeholders knowledge and skill levels, cultural backgrounds, andinterests into account to facilitate understanding throughmoderation andthe ability to change perspective.
Keywords. Augmented Reality; Gameification; Communication;Public Participation; Visualisation.
1. IntroductionPlanners traditionally communicate design ideas and concepts, highlight assetsof proposals, advise contractors on what to build, and record existing buildingsor building processes through plans and visualisations. Communication about“planning” becomes difficult however, when those who make the plans (experts)and those who are supposed to follow them (other experts or novices), do nothave the same understanding or background in planning. Planning is therefor,not simply a cognitive process, but also a social one involving many differentstakeholders.
This “ill-defined problem”, a term coined by Rittel (2013), presents a numberof issues. Planning problems cannot be definitively expressed, nor do they havea definable end, there are infinite solutions, which are neither right nor wrong butrather good or bad, and the solution depends on how a problem is framed andvice versa. As a result, it has become clear that communication is not a quality inplanning, but a necessary medium for the success and sustainability of planningsolutions; “communication is not everything, but planningwithout communicationis nothing” (Quote translated by Authors; Selle 2005). This changes the questionfrom whether we should communicate with the public in planning, to how weshould communicate with them.
In Germany planning proposals must be laid out for the public to view, inquireand comment on prior to the acceptance of a planning application in accordance
T. Fukuda, W. Huang, P. Janssen, K. Crolla, S. Alhadidi (eds.), Learning, Adapting and Prototyping,Proceedings of the 23rd International Conference of the Association for Computer-Aided ArchitecturalDesign Research in Asia (CAADRIA) 2018, Volume 1, 379-388. © 2018 and published by the Associationfor Computer-Aided Architectural Design Research in Asia (CAADRIA) in Hong Kong.

380 M. MÜHLHAUS, S.L. JENNEY AND F. PETZOLD
with formal information processes determined by planning legislation (e.g. § 3BauGB). Whilst formal public participation processes are desirable, the executionoften fails due to a locational displacement between the actual site of the planningproposal and the plans which the public can view; the visual representation of theproposals; the physical accessibility to these plans by the public; and the people’sheterogeneous backgrounds (Mühlhaus 2017).
Because of this, some offices are implementing informal processes, whichgo beyond what is required by law. These can include leaflets, presentations,workshops and discussions. What almost all these processes have in common isthat the content is generated especially for the purpose of public participation andare therefore time consuming and costly. In addition, these processes require thepublic to sacrifice their free time and actively participate without a clear, director immediate benefit to themselves. This can lead to rational ignorance (Downs1957), the refrain from gaining knowledge on a subject when the cost of educationoutweighs the benefit. Consequently, it is difficult to find a representative numberof participants for these more informal processes (Deutsche Städtetag 2013). Tosucceed, public participation needs to become less time consuming and costly forboth planners and the public. Public participation needs to become a by-productof the architectural and urban planning process.
The development of computer aided design systems (CAD) and later buildinginformation modelling systems (BIM) made the fast and precise production andstraightforward replication and dissemination of building plans a natural part ofthe planning process. These systems have become established, functional toolsfounded on both geometric and semantic information to create three dimensionalintelligent models that can be used for presentations and simulations.
Based on this idea and a theoretical analysis of both content and technicalsystem requirements (see sections 2 and 3), an augmented reality communicationsystem was conceived and prototypically implemented as a tool for publicparticipation. The presented prototype, based on a parametric city model (Seifertet al. 2016), is able to extract relevant information from this city model for“on-the-fly” visualisations on hand-held or see-through devices. By combiningdigital models, and their existing semantic knowledge, with augmented realitytechnologies as defined by Azuma (1997), which are readily available and allowfor contextual integration, this communication system provides a significantpotential to address planning communication deficits in public participation, byproviding planning information and the possibility to influence planning solutionsin preliminary and early design phases, where costs (money and time) to adaptdesign variants are still relatively low. This approach highlights the highpotential these early phases have in strengthening active participation over simpleinformation processes.
2. Framing the ContextPublic participation, expert-laymen communication, vision, visual perception,and motivation form the theoretical foundation for the augmented realitycommunication system supporting public participation.

TAKE A LOOK THROUGH MY EYES: AN AUGMENTED REALITYPLANNING COMMUNICATION SYSTEM
381
2.1. ABOUT PARTICIPATING
In 1962 Arnstein defined eight levels of empowerment, known as the Ladder ofCitizen Participation. She developed a ladder system of eight rungs divided intothree categories; “non-participation” which she considers pseudo participation onthe bottom two rungs; “degrees of tokenism” for rungs three to five (informing,consulting, placating), which she regards as a vital first step towards citizenempowerment; and finally, “degrees of participation” (partnerships, delegatingpower, citizen control), allowing public bodies full decision opportunities. TheOECD (2001) summarises this theory in its three-stage model of informationdistribution, consultation and active participation (OECD 2001). An issue faced inpublic information processes is the psychological effect of loss aversion, the fearof losing what we already have, which makes any change to our existing situationa threat and a potential loss. Because of this people are unable to see the socialand personal benefits of planning proposals. Part of the challenge is making thisclearer to them by enabling more active participation.
2.2. ABOUT COMMUNICATION
People who have knowledge on a specific subject, such as planning experts, tendto assume that others have that knowledge too. They overestimate how widelyspread that knowledge is and they overestimate the depth of knowledge othersmay have on that topic. In his book, Expert-Laymen-Communication, Rambow(2000) identified several differences between how experts and laymen perceiveplanning and the planning world. Firstly, he found there to be a visual-semanticcommunication gap. Planning is highly professionalised with a strong use ofconvention and code to clearly communicate and avoid misunderstandings whencommunicating planning intentions to other professionals. Additionally, plannersstill predominantly use two-dimensional representations of three-dimensionalspaces when discussing. Secondly, the technical language of planning doesnot only include technical terms, as is the case in most professions, but alsoincludes a high number of metaphors to explain and verbally visualise concepts.Thirdly, experts and laymen organise information differently, whichmeans that thedifferent stakeholders will search for, identify, and connect planning informationdifferently. Finally, experts and laymen experience and perceive the architecturaland therefor the planning world differently. For an expert, any building isassociated with planning, whilst laymen only connect iconic buildings witharchitecture and planning, buildings which they tend not to interact with in theirdaily lives. Changing perspective is an approach to bridge the communicationbetween experts and laymen.
2.3. ABOUT SEEING
Physically we perceive information through ocular motor stimuli adjusting our eyemuscles and focus. Visually we perceive through monocular cues and binocularcues. Monocular cues are indicators influencing our depth perception that onlyrequire one eye. They include the relative size of an object, how close an objectis to the horizon, texture, motion parallax, overlap or interposition, shading and

382 M. MÜHLHAUS, S.L. JENNEY AND F. PETZOLD
lighting, etc. These indicators are all related to imagery and play a great rollin information visualisation and architectural renderings (Ware 2013), (Tufte2005; 2007). Monocular cues can also be related to the position of an objectin relation to oneself over time, in other words, the objects motion. Binocularcues on the other hand, are visual clues we get from both eyes. This is knownas stereopsis; horizontal disparities gained from two slightly shifted images(one image from each eye), which is processed in our visual cortex enablingdepth perception. The problem with common visualisation practices is that theyonly address a single aspect of visual-spatial-perception; imagery (monocular).Physical (and digital) building and city models have a significant advantage inthis respect as they provide a rich source of three-dimensional and contextualinformation. Technologies such as augmented reality support understandingthrough the integration of both monocular and binocular visual cues and context,for example by situating engagement (Korn 2013).
2.4. ABOUT VISUALISING AND PERCEIVING
Visualising planning information is a key part to tackling these communicationproblems. It enables large amounts of data to be comprehended, facilitates theperception of patterns and the understanding of information beyond a person’sexpertise and helps in the formation of hypotheses (Fiske and Jenkins 2011).Visualising information is making it visible to the eyes using graphs, maps,images or diagrams. “Tufte argues that ‘the principles of analytical design areuniversal - like mathematics, the laws of Nature, the deep structure of language- and are not tied to any particular language, culture, style, century, gender,or technology of information display’ (Tufte 2007). In contrast Ware clearlydiffers between arbitrary and sensory principles and aspects. Sensory aspects aredescribed as biological, using the brains perceptual processing power without aneed for learning. They allow cognition without prior knowledge, are resistant toinstructional bias, and are valid across cultures (Ware 2013). Arbitrary aspectshowever, are governed by society and culture. Because they are symbols whichdon’t resemble their object (Saussure et al. 2011) they are hard to learn, can beeasily forgotten; are capable of rapid change; and are formal in structure, suchas in mathematics (Ware 2013). In traditional planning and architectural visualcommunication, many of the visualisations fall into this second category” (Jenneyand Petzold 2017).
2.5. ABOUT MOTIVATING
Without participants there can be no participation. ”The use of game designelements characteristic for games in non-game contexts” (Deterding et al. 2011)or ”the process of game-thinking and game mechanics to engage users andsolve problems” (Zicherman and Cunningham 2011), ”usually intended to creategameful and playful user experiences, motivate desired user behaviors, andgenerally, increase joy of use” (Deterding et al. 2013) is known as gamification.These elements or mechanics include ”a feedback layer of points, badges, leaderboards, and incentives” (Fuchs et al. 2014), as well as story, challenge, quests,competition and collaboration, conflict, levels, rules, goals, progress information,

TAKE A LOOK THROUGH MY EYES: AN AUGMENTED REALITYPLANNING COMMUNICATION SYSTEM
383
etc. and often include multiple players (Schell 2010), (Fullerton et al. 2014).Gamification shows a high potential for public participation as key aspectsof intrinsic motivation, such as experiencing one’s own competency, havingautonomy and social relatedness can be addressed. By making personal andsocial benefits visible to a user and supporting intrinsic motivation, the overallbenefit of a planning proposal is increased, favouring participation (counteringrational ignorance). A game-full and collaborative approach to solving problemscan lead to broader consensus as it enables us to view a problem from differentangles, supporting objective reasoning. This improves understanding and ones’willingness to compromise and is therefore well suited in mediation situations suchas planning.
3. System Foundation and RequirementsThe augmented reality communication prototype is based on a planning tool,developed to support political decision-making and urban strategy developmentin early planing phases. This tool was developed by the Urban StrategyPlayground Research Group (USP) to analyse and compare different strategiesand development measures. The developed USP system makes it possible toconsider the variants by automating key computation steps while continuouslymonitoring limiting parameters, such as building codes. The modular expandablesystem architecture of the USP system uses a parametric city model as a planningbasis and combines it with a visual programming interface for the definition offunctionalities. The result is an accessible and highly customisable planning toolfor early design phases (Seifert et al. 2014).
The parametric city-model is composed of elements representing the legal andregulatory structures and functions of a city (block, plot, building, etc.) and therelated semantics needed to use these structures and functions within the contextof German planning regulation. Additionally, the geometry of the model is basedon a Petri net (also known as place/transition nets) (Seifert et al. 2016). Withinthis dependency graph primitives, values and modelling functions define the finalgeometry. The resulting model has three main advantages which can be tapped bythe augmented reality communication prototype explained in this paper:
• It is possible to access and implement necessary functions and key valueparameters (e.g. depth, height, etc.), independent of the approach used tomodel the geometry.
• It is possible to lock individual input primitives and value parameters, toconstrain the changes possible within the petri-net for different users or tasks.
• If the geometry is changed, it is possible to identify precisely which otherelements or geometries are affected by this change through the execution path.
Exporting plans, datasheets, and models for digital fabrication (CNC-milling,rapid prototyping, etc.) as a basis for discussion, archiving and submission toauthorities are also implemented in USP using the expandable visual programminglanguage. These export capabilities however, focus on static and analoguemedia, as they are currently commonly used in discussion and public participationprocedures.

384 M. MÜHLHAUS, S.L. JENNEY AND F. PETZOLD
Figure 1. Information loss by exporting static media from digital planning models. As depictedusing the USP-Planning-Tool example.
Planning, on the other hand, is a dynamic process. Questions arising fromdiscussions may require information which is not available at that moment intime. Traditional architectural plans or models contain some of this informationimplicitly in their visual representation but today’s digital design methods, whichare based on rich semantic data models, make visualisation-on-demand feasible,enabling a user orientated tailoring of visualisation and information depth forindependent audiences and situations (Tory and Möller 2004).
Building on the advantages of the USP model and the literature researchinto participation processes, visualisation, communication, visual perception,motivation and gamification, the following requirements on the augmented realitycommunication system were derived:
• Accessibility: The necessary technologies to access planning-informationin-situ have permeated our living rooms and even our pockets. This meansthat there are new ways to reach a large number of people. The system shouldbe designed in a way that it is platform independent and easily adaptable tospecial augmented reality (AR) or mixed reality (MR) hardware.
• Low Cost: Early Participation has the most value, for both planners andcitizens, as the opportunities for influence are still high and resulting financialcosts low. Public participation should be by-product of planning efforts as faras this is possible.
• Flexibility: The system should allow for different situations, such as in-situ orusing a model or plan, as well as for different communication scenarios, e.g.for moderation, discussion, or self-education etc.
• Tailoring: The system should be able to take different knowledge levels,planning backgrounds and interests into account, but also enable exploration ofplanning information. It should be able to deal with arising queries by adaptinginformation to the user’s needs.
• Direct Feedback: The system should motivate participants to interact with itand enable two-way communication, i.e. it should include a direct feedbackloop as well as make one’s actions and their results visible.

TAKE A LOOK THROUGH MY EYES: AN AUGMENTED REALITYPLANNING COMMUNICATION SYSTEM
385
4. System Concept and Prototype
Figure 2. Augmebted reality planing communication system concept.
Figure 2 depicts the system concept. Planners and authorities develop strategiesand make plans for city development with the USP-Planning-Tool (1). Differentplanning strategies are created on basis of a reference model, which defines theinitial situation. Strategy variants are always put in relation to this referencemodel, making different strategies comparable. The projects and models arestored in a central project database (2). When a project is advanced farenough it can be made available to the public. It can then be accessed bythe participation server (3). This server manages the communication with theparticipating clients. Whenever a client (5) connects to the server a new clientspecific process is created, handling tcp/ip and udp connections and initialisingthe visualisation-communication pipeline (4). User accounts store user profilesdefining the knowledge level, interests and rights determining which templatesare accessible to the client. Templates (6) describe which functionalities andinformation are presented, how they are presented, and which possibilities existfor feedback and modification based on the participation context (in-situ on site,augmenting a physical model, at home) and the user profile. Template suggestionsare provided; however, the user is free to explore all templates within their profilerights. The visualisation-communication pipeline (4) adjusts information based onthe template in use.
It is possible for the client to participate, give feedback and comment (7)within the category and the spatial context of the problem, for example usingpins or annotations on the three-dimensional model. The comments can be eitherpublic, i.e. visible for others to join the discussion, or private, only visible to theplanner or a defined user group. These comments are saved in a participationdatabase (8) through the visualisation-communication pipeline (4) including their

386 M. MÜHLHAUS, S.L. JENNEY AND F. PETZOLD
links to spatial context, user profile, and comment category. Themachine-readablenature of these contributions enables planners to sort, evaluate and filter themfor incorporation in the planning process. More extensive analyses, simulations,calculations, or queries are incorporated as services (10). These are availableto both the planners, to support the decision-making process, and the clients, tosupport understanding.
The software environment is designed as an interactive expandable IT system.Based on the USP-model the system is developed in JAVA, whilst the client isdeveloped using the game engine and authoring software Unity. Unity providesa robust and well-established platform that is supported by many third-partydevelopers. Therefore it is possible to produce applications from one projectfor a wide variety of platforms, including Virtual Reality (HTC-Vive, OculusRift, SteamVR, Windows Mixed Reality), Augmented Reality (Vuforia, ARCore,ARkit, HoloLens), Android and iOS applications for tablets and smartphones, andbrowser with only minor adjustments. While at its core unity is an authoringtool, the scripting possibilities enabled us to realise a highly customisablecommunication platform using Unity mostly as render engine. The scene,geometry, and graphical user interface is generated “on-the-fly” based on the datareceived by the participation-server.
Figure 3. Left: USP-planning-tool, Right: Unity augmented reality mockup showingexploration of design variants.
In the current prototype the parametric-semantic petri-net model is transformedinto a geometry model that is then streamed to the client. Client interactions withthe model are realised using individual pre-constrained control points and values,which are linked to the petri-net, and occur through the client’s user interface.Changes made by the client are communicated to the participation-server, theparametric-semantic petri-net model is then updated on the server side and thechanged geometry is sent back to the client. Clients that are connected to thesame project and are publicly visible can share their current field-of-view allowingusers to visually support their explanations letting others take a look through theireyes. When a client “follows” another, the participation-server acts as a brokerand mediates a direct connection between the two clients (9). This provides the

TAKE A LOOK THROUGH MY EYES: AN AUGMENTED REALITYPLANNING COMMUNICATION SYSTEM
387
future potential for users to communicate with each other through chats, etc.
5. Conclusion and OutlookFor public participation to be successful the cost of preparing and participating inthese processes needs to be reduced for both members of the public and planners.For planners, this means that public participation needs to become a by-productof existing planning processes. We suggest that this is possible by introducing a“middle man” between models used by planners and the information accessibleto the public in the form of a visualisation-communication-pipeline with feedbackcapabilities, where visualisation is generated on-the-fly in response to user andsituation requirements and queries. The implemented working prototype provesthe technical feasibility of this approach.
To improve physical and cognitive access, the suggested prototype usesaugmented reality on hand-held and see-through devices which have thetechnical capabilities necessary and are already established, readily available, andwidespread, such as mobile phones. Using user profiles, situation templates andvisual-perceptual parameters, information can be tailored to users’ needs andinterests as well as the situation in which participation is occurring (discussion,moderation, self-education, etc.). User profile requirements will be analysedin an upcoming research project in collaboration a large housing company.Furthermore, a project with students will be developing prototypes to investigatethe requirements of in-situ augmented reality communication processes in termsof both content required and visual interpretation.
It is not enough to only improve physical and cognitive access, processes mustbecome more motivational by visualising actions and their impact. Gamificationwill be explored within this system, to strengthen public experience, interactionand participation. This could be used to influence the selection of the user profileor adjust the profile over time though levels, leader boards and scoring systems.Planners could set challenges or quests when in need of local information and inthis way, utilise local knowledge. In turn, the public can track both the progressof a building project but also visualise their own input or influence, providingthe user with multiple levels of feedback and interaction. Finally, the individualcomponents of the system concept need to be brought together.
References“OECD - Citizens as Partners, OECD Handbook on Information, Consultation and public
participation in policy making.” : 2001. Available from <https://www.internationalbudget.org/wp-content/uploads/Citizens-as-Partners-OECD-Handbook.pdf> (accessed 24thDecember 2017).
“Deutscher Städtetag - Beteiligungskultur in der integrierten Stadtentwicklung” : 2013.Available from <http://www.staedtetag.de/imperia/md/content/dst/veroeffentlichungen/mat/mat_beteiligungskultur_2013_web.pdf> (accessed 24th December 2017).
“VDI - Kommunalbefragung der VDI-Initiative Stadt:Denken” : 2017. Availablefrom <https://www.vdi.de/fileadmin/user_upload/VDI-Kommunalbefragung_Handlungsfelder.pdf> (accessed 24th December 2017).
Arnstein, S.R.: 1969, A Ladder Of Citizen Participation, Journal of the American PlanningAssociation, 53, 216-224.

388 M. MÜHLHAUS, S.L. JENNEY AND F. PETZOLD
Azuma, R.T.: 1997, A Survey of Augmented Reality, Presence: Teleoperators and VirtualEnvironments, 6(4), 355-385.
Deterding, D.: 2013, Modes of Play. A Frame Analytic Account of Video Game Play, Ph.D.Thesis, Universität Hamburg.
Deterding, S., Dixon, D., Khaled, R. and Nacke, L.: 2011, From game design elements togamefulness: defining “gamification”, Proceedings of MindTrek 2011, Tampere, 9-15.
Downs, A.: 1957, An Economic Theory of Political Action in a Democracy., Journal of PoliticalEconomy, 65(2), 135-150.
Fiske, J. and Jenkins, H.: 2011, Introduction to communication studies, Routledge Classics,London.
M. Fuchs, S. Fizek, P. Ruffino and N. Schrape (eds.): 2014, Rethinking Gamification, mesonpress eG, Lüneburg.
Fullerton, T.: 2008, Game design workshop. A playcentric approach to creating innovative,Elsevier Inc., Burlington.
Jenney, S.L. and Petzold, F.: 2017, Question of Perspective: Information Visualisation inGames and its Possible Application in Planning Communication, CAADFutures 2017,Istanbul, 66-83.
Korn, M.: 2013, Situating Engagement. Ubiquitous Infrastructures for In-Situ CivicEngagement., Ph.D. Thesis, Aarhus University.
Mühlhaus, M.: 2017, Wer plant wie, wann, was und warum? Augmented Reality als Mediumder Experten-Laien Kommunikation, Forum Bauinformatik 2017, Dresden.
Rambow, R.: 2000, Experten-Laien-Kommunikation in der Architektur, Waxmann, Münster.Rittel, H.W.J.: 2013, Thinking Design: Transdisziplinäre Konzepte für Planer und Entwerfer,
Birkhäuser, Basel.Saussure, F.: 2011, Course in General Linguistics, Columbia University Press, New York City.Schell, J.: 2010, The Art of Game Design: A book of lenses, Elsevier Inc., Amsterdam.Seifert, N., Mühlhaus, M. and Petzold, F.: 2016, A Parametric 3d City Model: Basis for
Decision Support in Inner-City Development, ICCCBE 2016, Osaka.Seifert, N., Mühlhaus, M., Schubert, G., Fink, D. and Petzold, F.: 2014, Decision support
for inner-city development - An interactive customizable environment for decision-makingprocesses in urban planning, eCAADe 2014, Newcastle, 43-52.
Selle, K.: 2005, Planen, Steuern, Entwickeln. Über den Beitrag öffentlicher Akteure zurEntwicklung von Stadt und Land, Dortmunder Vertrieb für Bau- und Planungsliteratur,Dortmund.
Tory, M. andMöller, T.: 2004, RethinkingVisualization AHigh-Level Taxonomy, Proceedingsof IEEE Symposium on Information Visualization, Austin, 151-158.
Tufte, E.R.: 2005, Visual explanations, Graphics Press, Cheshire.Tufte, E.R.: 2007, Beautiful evidence, Graphics Press, Cheshire.Ware, C.: 2013, Information Visualization, Morgan Kaufmann, Waltham.Zichermann, G. and Cunningham, C.: 2011, Gamification by Design, O’Reilly, Sebastopol.

Mixed Reality and InteractiveEnvironments

390

SLAM-BASED MR WITH ANIMATED CFD FOR BUILDING DESIGNSIMULATION
YUEHAN ZHU1, TOMOHIRO FUKUDA2 andNOBUYOSHI YABUKI31,2,3Osaka University, Suita, Osaka, [email protected] 2,3{fukuda|yabuki}@see.eng.osaka-u.ac.jp
Abstract. In advanced society, the existing building stock hashuge social, economic, and environmental impact. There is a highdemand for stock renovation, which gives existing buildings new lives,rather than building new ones. During the renovation process, it isnecessary to simultaneously achieve architectural, facilities, structural,and environmental design in order to accomplish a healthy, comfortable,and energy-saving indoor environment, prevent delays in problemsolving, and achieve a timely feedback process. This study tackled thedevelopment of an integrated system for stock renovation by consideringcomputational fluid dynamics (CFD) and Mixed Reality (MR) in orderto allow the simultaneous design of a building plan and thermalenvironment. The CFD analysis enables the simulation of the indoorthermal environment, including the effects of daylight and ventilation.The MR system visualizes the simulation results intuitively and makesrenovation projects perform in a very efficient manner with regard tovarious stakeholders. In addition, a new CFD animation generationmethod is proposed in MR system, in order for users to consider theentirety of changes in the thermal environment.
Keywords. Thermal environment; computational fluid dynamics(CFD); mixed reality (MR); daylight; ventilation.
1. IntroductionIn the market of building stock renovation, there is a constant demand for creatingbuilding designs that save energy and are environmentally friendly. A goodthermal environment design accomplishes this by adding comfort to a living space,which is equally important to the seismic performance of the structure (Tanabe etal., 2013).
Usually, the renovation design process follows the waterfall model, whichis a sequential and non-iterative design process. By the waterfall approach, thethermal design belongs to the latter process (Laplante et al., 2004). Feedbackis an indispensable element in the design process. The integration of buildingperformance feedback in the design process is increasingly being considered as acore element of the decision support framework that currently drives sustainable
T. Fukuda, W. Huang, P. Janssen, K. Crolla, S. Alhadidi (eds.), Learning, Adapting and Prototyping,Proceedings of the 23rd International Conference of the Association for Computer-Aided ArchitecturalDesign Research in Asia (CAADRIA) 2018, Volume 1, 391-400. © 2018 and published by the Associationfor Computer-Aided Architectural Design Research in Asia (CAADRIA) in Hong Kong.

392 Y. ZHU, T. FUKUDA AND N. YABUKI
building, from early conception to fabrication (Chronis et al., 2017). The waterfallapproach is an inefficient process because it is a one-way approach, whichaffects the feedback efficiency and discourages stakeholders from collaboratingin a synchronized manner. Moreover, many stakeholders do not have thechance to participate in a discussion regarding thermal design. Even when thedesigners identify problems that need to be solved, it is difficult to modifythe architectural design with regard to thermal environment design after thearchitectural design is complete. This problem has resulted in occupants facinguncomfortable experiences. Thus, it is necessary to bring together stakeholders,such as owners and designers, and involve them in the decision-making processfrom the very beginning of the building design. Additionally, the thermaldesign process should be synchronized with architectural, facilities, and structuraldesign. Building information modeling (BIM) has been proposed for realizingsimultaneous building design with consideration to the lifecycle data of the entirestructure (Ashcraft, 2008). However, BIM still does not allow all stakeholders toparticipate in environmental design. The challenge lies in how to integrate BIMintuitively with computational fluid dynamics (CFD) software, which is used toanalyze fluid flows in the design of the thermal environment. In fact, methods ofintegrating BIM and CFD, such as Autodesk CFD and DesignBuilder, have beenproposed. CFD analysis produces a large amount of numerical data that can beused in three-dimensional (3D) modeling by using the proposed post-processingsoftware. However, those softwares are not open source and cannot export arrowsand color map information as vector data (Fukuda et al., 2015). Integrating CFDresults with other system has many limitations. Additionally, there is difficulty inbuilding a relationship between the CFD model and the BIM model in 2D display.To bridge the gap between stakeholders, a visualization method has been proposed(Berger and Cristie, 2015). However, the time-line information of CFD simulationresults is not used in this method. Additionally, the results are displayed on a35 megapixel video wall (8k in 4x4 2k screens), which still lacks connection toreality. Another interactive visualization system using marker-based augmentedreality (AR) has been proposed in order to achieve this connection (Yokoi et al.,2017). Although the system could display CFD results on a video see-throughhead-mounted display (HMD), it could only display the thermal environment atdiscrete points in time; therefore, the result could not express the entire thermalenvironment changing process. The AR system overlapped the CFD informationonto the video as heat maps and arrows without occlusion, which means that theinteraction with users depends on the AR maker and that the relationship betweenthe CFD results and the real world was very weak. Moreover, the user activityarea was restricted owing to the AR marker, which also caused a diminished userexperience. Additionally, for an accurate prediction of the indoor environment,daylight is an indispensable external condition (Buratti et al., 2017), which hasnot been utilized by either of the two studies mentioned above.
This paper demonstrates the development and application of an evaluationsystem integrating CFD and Mixed Reality (MR) for architectural designers. Incomparison to AR, which enriches the real world with digital information, MRmixes the real world and the digital world to produce new environments where

SLAM-BASED MR WITH ANIMATED CFD FOR BUILDING DESIGNSIMULATION
393
physical and digital objects co-exist, and the digital world is influenced more fromthe real world than in AR (Milgram and Kishino, 1994). With the MR system, avariety of design options can be demonstrated in the real world. Users are free tochange the indoor structure or to add greenery, and then simulate and evaluatethese proposals by using CFD software. By integrating CFD and MR, usersachieve more interaction with the system and the design is easier to understand.To make the simulation results more credible, the daylight factor is introduced andanimated CFD results are generated in order to express the continuous changesof the indoor thermal environment. The simultaneous localization and mapping(SLAM)-based MR technology allows users to walk around freely indoors andexperience the CFD simulation results intuitively. Moreover, once a problem isdetected, a correction can be generated immediately.
An assessment of the proposed system was carried out through a trialimplementation. The BIM model of the target room was created, and thebuilding properties were incorporated into the CFD software. The indoor thermalenvironment condition was assessed by CFD analysis. The effect of daylight indifferent seasons was compared. Data from the CFD analysis were parsed frameby frame, followed by data integration and visualization using the MR system.A cube was created in order to locate the CFD results with the target room andensure a stable registration, it was termed the anchor cube. The animated CFDsimulation results reflect a fragment of time; thus, the thermal environment wasdynamically expressed in order for the user to be able to experience the entireprocess of temperature and airflow changes. The MR system used a wirelessoptical see-through HMD, which allowed the user to walk around and observethe thermal environment.
2. Proposed MR System with Animated CFDThis system consists of four steps, namely, BIM creation, mesh generation, CFDanalysis, and MR visualization. At first, the target room’s BIMmodel was createdaccording to the design drawings by using the BIM software. All the informationabout geometry, material, properties, and so on were input at this step. Secondly,the mesh used in the CFD calculation was generated based on BIM geometryinformation. Thirdly, the boundary conditions were set based on BIM properties,and the initial conditions were input. Both operations were completed manually.Then, a steady-state fluid simulation was executed by the CFD software. Finally,the CFD simulation results were exported and these data were converted to anotherformat in order to generate the CFD animation. Then, the animated CFD resultswere visualized by SLAM-based MR technology.
2.1. BIM MODELLING AND MESH GENERATION
The software used to create the BIM model was Autodesk Revit Architecture. Asan evaluation system, the BIMmodel canmanage the life cycle of the entire project.Moreover, it can also provide the volume mesh required during the CFD analysis.
There are many methods to generate the mesh such as block mesh method andsnappyHexMesh software, and all of them need the BIM model. Moreover, the

394 Y. ZHU, T. FUKUDA AND N. YABUKI
more complex the BIM model is, the more time it will take.
2.2. CFD ANALYSIS
The boundaries need to be set for CFD analysis, including the wall, ceiling, floor,window, table, and heat source. Their properties were set manually based on theBIM information. The initial conditions including indoor temperature and airflowconditions were set respectively in different case studies. The daylight factor wasintroduced and its strength was decided by solar direction and insolation, whichwere set in reference to the government database (Japan Meteorological Agency,2017). In this study, it was assumed that the thermal environment of the buildingwas in a stable state. After some system parameter settings such as parallel settingand time control, the CFD analysis was executed by OpenFOAM, which is anopensource CFD toolbox.
2.3. MR VISUALIZATION
2.3.1. Model GenerationThe numerical data of the thermal environment were calculated after the CFDanalysis. These data were introduced into ParaView, which is a post-processingsoftware. The numerical data were changed into 3D graphics information byadding different filters. Subsequently, these data were exported in VRML formatframe by frame. Next, these VRML files were converted to FBX format andcould be imported to the Unity engine, which is a game engine used widely inintegration system development. However, these FBX files were converted frompoint cloud data, and Unity could not read the complete data file. A shader scriptwas programmed in order to recognize the vertex color. By adding this script, thecomplete CFD results including geometry data and color data were displayed inthe Unity engine.
2.3.2. Animation GenerationThe traditional way to create the CFD animation is to convert the same angle of the3Dmodel, at different times, into frame animation (Ludwig et al., 2015). However,the CFD animation with the same angle would havemany limitations, whichmightincrease the difficulty of communication among the stakeholders. If we want toachieve a freedom perspective, each angle change will need to be rendered inreal-time, which requires many system resources. Therefore, another solutionis proposed. The imported FBX models were organized into a sequence, andeach time step imported the next frame model and destroyed the previous framemodel. A component based on javascript was programmed in order to control thisoperation. By this method, users could watch the animated CFD data from alldirections.
2.3.3. Integration of Animated ModelThe CFD animation andMR systemwere operated on different hardware, personalcomputer (PC) and head-mounted display (HMD) (HoloLens). The HoloToolkit is

SLAM-BASED MR WITH ANIMATED CFD FOR BUILDING DESIGNSIMULATION
395
a plug-in used to adjust theMR system, pack the Unity contents onto the HoloLens,and integrate the animated CFD post-processing data with the MR system. Theanchor cube was placed in order to adjust the registration and was bound to theSLAM generated mesh that avoids manual re-registration every time the systemruns.
3. System EvaluationTo validate the advantages of the proposed system, an evaluation test was carriedout in room 411, M3 building, Suita Campus, Osaka University. The area of room411 was 150 m2. There were three operating air conditioners and 18 windowswithout curtains; the anchor cube was set next to the front door (which was thesame place in real world and digital world), where registration was provided(Figure 1). The system data flow is shown in Figure 2. The BIM model wasmodeled by Autodesk Revit Architecture 2016. Then, the model was exportedin IFC format and converted to STL format by SketchUp 2016. Subsequently,the model was used in order to generate a polymesh by SnappyHexMesh. Thepolymesh could be used directly in OpenFOAM (ver. 1706). After the CFDanalysis was completed, the simulation results were read by ParaView, whichcarried out post-processing. Thereby, the simulation results were converted intoVRML format. Then the simulation results were converted again to FBX format by3dsMax, and imported into the Unity engine (ver. 5.6.1f1). The simulation resultswere generated in order to sequence the animation in Unity and load it to the HMDcompiled by HoloToolkit. The HMD used in the experiment was HoloLens, whichprojects virtual objects directly on a translucent screen so that people can see thereal world scene directly (Figure 3).
Figure 1. Room floor plan.

396 Y. ZHU, T. FUKUDA AND N. YABUKI
Figure 2. System data flow.
Figure 3. HoloLens (left); view using HoloLens (right).
3.1. IMPLEMENTATION
The following settings were assumed in the evaluation experiments: (a) winterwith daylight, (b) winter without daylight, (c) summer with daylight, (d) summerwithout daylight. The boundary condition settings for each air conditioner werefour outlets and one inlet, as shown in Table 1. The boundary settings of thearchitectural components, including boundary radiation properties, are shown inTable 2. The summer conditions were set at 14:40 on August 15th, when theamount of solar radiation was 214.12 W / m2 and the solar direction was 45°,which was calculated according to location, date, and time. The winter conditionswere set at 14:40 on January 15th, when the amount of solar radiation was 90.28W/m2 and the solar elevation was 16.23°. Each case simulated the indoors situationfor 100 seconds.
In order to test the accuracy of the simulation, a measurement experimentwas also implemented on December 17 and 18 for 100 seconds. The shadingplates were used on December 17 in order to cut off the daylight. The outdoortemperature was 14.7°C, and 10 sensors were set in Figure 1. The hight of thesensors were set between 70 cm to 140 cm randomly in order to obtain the indooraverage temperature.
3.2. RESULTS
The sensor measurement results in winter are shown in Table 3 which werecompared with the simulated temperature values. The simulation results of theindoor temperature distribution are shown in Figure 4. Each CFD simulationresults contain more than 370,000 points. The maximum temperatures and

SLAM-BASED MR WITH ANIMATED CFD FOR BUILDING DESIGNSIMULATION
397
minimum temperatures were removed in order to eliminate systematic errors.In the rest of the data, the decimal points were removed in order to obtain anapproximation.
The visualization results of the three air conditioners for case (a) are shown inFigure 5, while the animated results of one of the air conditioners are shown inFigure 6, where color indicates the temperature and radius indicates the air rate.
Table 1. Air conditioner boundary conditions.
Table 2. Architectural component boundary conditions.
Figure 4. Indoor Temperature Distribution (100 Seconds): (a) winter with daylight (left); (b)winter without daylight (left); (c) summer with daylight (right); (d) summer without daylight
(right).

398 Y. ZHU, T. FUKUDA AND N. YABUKI
Table 3. Sensor measurement results.
3.3. DISCUSSION
For renovation projects, building design is not usually performed in a veryefficient manner for the stakeholders, since the owners cannot fully understandthe designers’ intentions. In this study, the indoor temperature and airflow weredisplayed around users by using HoloLens. The performance of the visualizationresults was intuitive and easy to understand. Users received the informationdirectly from the CFD animation, which displayed the indoor warming process.This experience made building design feedback faster. The screenshots in Figure 5show the thermal environment around three air conditioners at the beginning of thesimulation. The CFD animation was displayed smoothly so that the entire processof temperature and airflow changes could be observed. During the building designprocess, the designers usually proposed several renovation plans. Therefore, theevaluation method was important. A good evaluation method should be accurate,quick, and easy to understand. When introducing renovation plans to stakeholders,the expertise of different departments is not interlinked. The system proposed inthis paper can visually show all the necessary information, which strengthens thecommunication between different departments. Additionally, proposals can alsobe presented in a short amount of time. However, CFD analysis requires a lotof resources and real-time calculation is hard to achieve. Alternatively, Fast FluidDynamics (FFD), which is a real-time technique, calculates fluid visualizationwithcalculation speed that is hundreds of times faster in comparison to CFD (Zuo etal., 2016). Although FFD sacrifices some accuracy, the real-time feedback still hashuge potential for building-design simulation. If real-time feedback and evaluationare implemented, this will greatly increase the effectiveness of renovation design.Therefore, the FFD based system should be considered as the next step.
The disadvantage of the HMD (HoloLens) is the field of view (FOV) ofHoloLens, which sounds incredible at approximately 30 horizontal degrees and17.5 vertical degrees. The experience of using HoloLens is like seeing a digitalworld through a small magic window in the center of ones view.
The daylight factor is an important component in reducing a building’s energyuse and environmental effects. The simulation results of case (a) and case (b)were compared to the actual measurements. The difference of average temperaturechange was 2.8°C in the measurement results (Table 3), while for case (a) and case(b) the average temperature difference was 2.21°C. The difference was 0.59°Cwhich is an acceptable error in the indoor environment simulation. Additionally,these results proved the accuracy of the proposed simulation method.

SLAM-BASED MR WITH ANIMATED CFD FOR BUILDING DESIGNSIMULATION
399
Figure 5. Thermal environment performance by MR.
Figure 6. Animated CFD results (Air conditioner 1).
4. Conclusions and Future WorkThis research demonstrated the development and application for stock renovationwith CFD and MR in order to enable the simultaneous design of the building planand thermal environment during the renovation process. The proposed systemprovided a more intuitive and efficient solution, in comparison to traditionalmethods, by using CFD animation and MR technology. The thermal environmentwas expressed dynamically in order for the user to experience the entire processof temperature and airflow changes. People without professional skills canunderstand the design content independently and participate in the building designmore smoothly. The owners are enabled to put forward their own ideas, and thendiscuss immediately with design specialists, within the MR system, about designpossibilities.
As future work, it is necessary to find an alternative optimization method in

400 Y. ZHU, T. FUKUDA AND N. YABUKI
order to simplify the CFD animation generation process. Currently, the processis a complex sequence that entails a lot of manual operation, which brings a lotof inconvenience to the designers. Moreover, the process to obtain the CFDsimulation results is also a long time operation. If the CFD simulation andanimation generation can be carried out in real-time, the simulation results can beexperienced immediately after a new design is proposed; thereby, the efficiencyof design feedback will be greatly enhanced.
Additionally, except the current indoor environmental factors simulated in thisstudy, there are many other factors such as lighting and sound, which are alsonecessary to building design. Adding these new factors into simulation systemswill contribute to the improvement of renovation plans.
AcknowledgementThis research has been partly supported by the research grant of NohmuraFoundation forMembrane Structure’s Technology, and by JSPSKAKENHI GrantNumber JP16K00707.
References“Japan Meteorological Agency” : 2017. Available from <http://www.data.jma.go.jp> (accessed
10th December 2017).Ashcraft, H.W.: 2008, Building Information Modeling: A Framework for Collaboration,
Construction Lawyer, 28(3), 1-14.Berger, M. and Cristie, V.: 2015, CFD Post-processing in Unity3D,Procedia Computer Science,
51, 2913-2922.Buratti, C., Palladino, D. and Moretti, E.: 2017, Prediction of Indoor Conditions And Thermal
Comfort Using CFD Simulations: A Case Study Based On Experimental Data, EnergyProcedia, 126, 115-122.
Chronis, A., Dubor, A. and Cabay, E.: 2017, Integration of CFD in Computational Design: Anevaluation of the current state of the art, eCAADe 35, 1, 601-610.
Fukuda, T., Mori, K. and Imaizumi, J.: 2015, Integration of CFD, VR, AR and BIM for DesignFeedback in a Design Process - An Experimental Study, eCAADe 33, 1, 665-672.
Laplante, P.A. and Neill, C.J.: 2004, “The Demise of the Waterfall Model Is Imminent” andOther Urban Myths, acmqueue, 1(10), 10-15.
Ludwig, M., Berrier, S., Tetzlaff, M. and Meyer, G.: 2015, 3D Shape and Texture MorphingUsing 2D Projection and Reconstruction, Computers & Graphics, 51, 146-156.
Milgram, P. and Kishino, F.: 1994, A Taxonomy of Mixed Reality Visual Displays, IEICETransactions on Information Systems, E77-D(12), 1-15.
Tanabe, S., Iwahashi, Y., Tsushima, S. and Nishihara, N.: 2013, Thermal Comfort andProductivity in Offices Under Mandatory Electricity Savings after the Great East JapanEarthquake, Architectural Science Review, 56, 1-10.
Yokoi, K., Fukuda, T., Yabuki, N. and Motamedi, A.: 2017, Integrating BIM, CFD and AR forThermal Assessment of Indoor Greenery, CAADRIA, Suzhou, 85-95.
Zuo, W., Wetter, M., Tian, W., Li, D., Jin, M. and Chen, Q.: 2016, Coupling Indoor Airflow,HVAC, Control and Building Envelope Heat Transfer in the Modelica Buildings Library,Building Performance Simulation, 9(4), 366-381.

HOLOSYNC
A Comparative Study on Mixed Reality and Contemporary CommunicationMethods in a Building Design Context
NARISSA BUNGBRAKEARTI1, BEN COOPER-WOOLEY2,JORKE ODOLPHI3, BEN DOHERTY4, ALESSANDRA FABBRI5,NICOLE GARDNER6 and M. HANK HAEUSLER71,4,5,7UNSW / Computational Design1,5,7{n.bungbrakearti|a.fabbri|m.haeusler}@[email protected],3Arup Digital Sydney2,3{ben.cooper-woolley|jorke.odolphi}@arup.com6UNSW / Computational [email protected]
Abstract. The integration of technology into the design process hasenabled us to communicate through various modes of virtuality, whilemore traditional face-to-face collaborations are becoming less frequent,specifically for large scale companies. Both modes of communicationhave benefits and disadvantages - virtual communication enablesus to connect over large distances, however can often lead tomiscommunication, while face-to-face communication builds strongerrelationship, however may be problematic for geographically dispersedteams. Mixed Reality is argued to be a hybrid of face-to-face andvirtual communication, and is yet to be integrated into the buildingdesign process. Despite its current limitations, such as field of view,Mixed Reality is an effective tool that generates high levels of nonverbaland verbal communication, and encourages a high and equal level ofparticipation in comparison to virtual and face-to-face communication.Being a powerful communication tool for complex visualisations, itwould be best implemented in the later stages of the building designprocess where teams can present designs to clients or where multipledesigners can collaborate over final details.
Keywords. Mixed Reality; Communication; Hololens;Collaboration; Virtual.
1. Research Aims, Motivations and QuestionThe integration of technology in the design process allow more effectivecommunication of ideas and information, overcoming limitations of locationsand time difference. Traditionally, Face-To-Face (FTF) meetings have been thedominant method for collaborative projects. Yet in contemporary offices FTF
T. Fukuda, W. Huang, P. Janssen, K. Crolla, S. Alhadidi (eds.), Learning, Adapting and Prototyping,Proceedings of the 23rd International Conference of the Association for Computer-Aided ArchitecturalDesign Research in Asia (CAADRIA) 2018, Volume 1, 401-410. © 2018 and published by the Associationfor Computer-Aided Architectural Design Research in Asia (CAADRIA) in Hong Kong.

402 N. BUNGBRAKEARTI ET AL.
communication can often not be achieved and increasingly comprise of less FTFinteractions and more virtual interactions. Virtual technologies such as Skypeor email help to overcome geospatial locational communication issues, yet losesome of the important qualities inherent to FTF. The benefits of using virtualcommunication technologies include a more equal level of participation within aheterogenous group, and cost reduction for those who would otherwise be requiredto travel. However, virtual communication can lead to miscommunicationthrough the misinterpretation of body language (Billinghurst et al, 2002). Inthese situations and in the context of building design decision-making, space iscreated for weak design decisions to be made by both parties. Conversely, FTFcommunication allows for stronger relationships between parties and thereforea sense of trust is formed. Being within another person’s social or personalspace enables the direct translation of body language and nonverbal cues platform(Blenke, 2013). Nonetheless, technological advances have created a paradigmof computer-mediated humans who are more familiar with social interactionsthrough a virtual. Mixed Reality (MR) is argued here to reside between FTFand virtual communication. While the device is hands free and you are able toview the environment and people around you, holographic projections and spatialsound make for a unique experience, enabled through ie. the Microsoft HoloLens(Microsoft, 2017). It is considered conventional for design firms to use FTFand virtual platforms heavily to communicate between design teams that are bothco-located and non-collocated. The pattern that often follows the advancementof technology suggests that the integration of more modes of virtuality is likely.MR being a hybridized tool between FTF and virtual communications, providesa fresh platform for designers to utilise. However, how do we know if thistechnology is in fact effective? Being in its infancy, it is unclear where MRcould be best used within the building design process if at all, and whether itwould promote better communication and relationships within a team as FTFdoes, or if it is another virtual wall that will divide design teams. Hence theobjective of this research is to address and determine in what ways MR technologyis an effective communication method in comparison to current methods. FTFcommunication and virtual communication are studied through a collection ofexisting literature. Through this analysis, an argument is created for the use ofMR as a beneficial hybrid tool between FTF and virtual communication. In orderto explore the advantages and disadvantages of MR, user-testing is conducted andanalysed via video recordings to determine where MR would be best used withinthe building design process and in what ways it is a successful communication tool.Through the modification of an existing methodology for testing three differentcommunication methods, five sets of valuable data were collected and analysedto determine in what ways MR is an effective communication tool and where itwould be best utilised during the design process. In comparison to Billinghurtset al’s 2002 study using FTF, screen based projection, and AR, it is clear thatthe technology has advanced over the past decade, with new data suggesting thatMR is more effective than FTF in many ways. Despite teams not being ableto complete tasks as quickly in MR than in FTF collaborations, the amount ofverbal and nonverbal communication is much higher when using an MR device,

HOLOSYNC 403
suggesting that it is successful in terms of information exchange and participation.Although MR has constraints, it is a powerful visualisation tool and would bebest utilised when visualizing complex environments. Additionally, it should beused towards the later stages of the design process where multiple designers cancollaborate over final details or teams can present ideas to clients.
• Does MR encourage a higher level of participation through nonverbal cues?• Does MR encourage a higher level of participation through verbal exchange?
2. MethodologyTo evaluate MR as a communication tool, a holographic design review platformis created that allows you to interact and assess models. This applicationencourages collaboration through a shared MR experience and uses voicecommands to explore holographic models. In an action research frameworkuser-testing is conducted, data is observed and collected, and the resultsare analysed (Gabel, 1995). Through the analysis of existing literature,an evaluation method is proposed for user-testing. Three scenarios usingsubjects split into pairs in a co-located environment are tested. The firstscenario requires the subjects to communicate FTF, the second scenario usesa Computer-Mediated-Communication (CMC) method of communication, andthe third scenario uses MR communication using HoloLens devices. Thesubjects are recorded and observed while performing a problem-solving task toexamine the effectiveness of FTF, CMC and MR communication methods. Aquantitative methodology is adopted to measure the outcomes of user-testing andto determine which communication approach is most beneficial in a buildingdesign context. The data collected consists of calculating the number ofnonverbal communications (pointing gestures and model interactions), and verbalcommunications (questions and statements) through observation of recordeduser-testing scenarios. In addition to observational data, pre- and post- testingsurveys are conducted to gather the subject’s opinions on which methods would bebest for visualisation, communication, focus, and user-friendliness. These resultsare then reflected upon to determine in what ways MR could be used within thebuilding design process.
2.1. PROPOSING A METHODOLOGY FOR TESTING
The 2002 study comparing Augmented Reality (AR) interfaces with screen-basedprojection and FTF interactions conducted by Billinghurst et al, is the primarysource for the methodology chosen for this research. The experiment consisted of3 scenarios (FTF, AR, and screen-based projection), assigning a pair of subjects toeach scenario. The pairs were provided with 10 sets of rules which were dividedin half. Each subject within the paired team would receive 5 sets of rules each.The subjects were made to organise 9 virtual or physical models on a 3 x 3 grid,using the rules as clues as to where each building needed to be placed. Thenumber of gestures, number of words per phrase, number of speaker turns, andperformance time were observed and compared against the 3 scenarios to concludehow effective the AR interface was. Additionally, video and audio recordings

404 N. BUNGBRAKEARTI ET AL.
were collected of each scenario. This study used 12 pairs of adults as subjectsfor testing. Billinghurst et al’s results showed that the subjects were able to solvetheir task much faster using FTF communication in comparison to the remainingtwo methods - AR taking the longest to complete. The number of speaker turnsand number of words per phrase was also measured during each scenario. Speakerturns was defined as “one user taking control of the conversation and speakinguntil either the other user interrupted, or he stopped speaking for more than threeseconds” (Billinghurst et al, 2002). The summary of these averaged measurementsshowed that there was not much difference in both average number of words perphrase and average number of speaker turns. The number of pointing gesturesmade per minute was also measured, with FTF showing the most amount ofnonverbal collaboration and screen-based projection encouraging the least amountof nonverbal communication. Similar to the results of the number of pointinggestures per minute, FTF subjects showed the highest level of picks, or modelinteractions, per minute, while AR was recorded to have had the least amount ofpicks. A subject’s comment that was included in the study depicted what was feltoverall by the subjects in the study. “AR’S biggest limit was lack of peripheralvision. The interaction physically as well as spatial movement was natural, it wasjust a little difficult to see. By contrast in the Projection condition you could seeeverything beautifully but the interaction was tough because the interface didn’tfeel instinctive,” (Billinghurst et al, 2002). This study provides an insight in towhat kinds of quantitative and qualitative data that could be extracted and analysed.As the case study is based on early 2000 technologies, this methodology has beenrecycled and modified to suit current technology for this research.
3. Background ResearchFACE-TO-FACE COMMUNICATIONMETHODS. There are beneficial aspectsto FTF collaborations, mostly involving laying the foundation of a relationshipbetween yourself and your collaborators, however there are also downfalls torelying solely on FTF meetings. Blenke (2013) identifies key aspects of FTFcommunication that are neglected through virtual communication such as theobservation of nonverbal cues, and the establishment of trust between teammembers. Collaborating through FTF meetings also opens the opportunityfor relationships to develop beyond the professional kind, allowing futurecollaborations to be more personal and enjoyable. Studies have shown that CMCgroups that were given tasks took longer to complete in comparison to the groupswho completed the tasks FTF. In 1986, Hiltz et al. reported that some participatinggroups had to be stopped mid task due to them taking so long. However, factorssuch as time taken to type may have factored in to the overall time recorded andmay have been a factor that slowed subjects down. However, there have beenstudies that suggest CMC groups generate more ideas than groups who collaborateFTF. These studies show that non-redundant idea generation was higher in CMCgroups in comparison to FTF groups (Bordia, 1997).
VIRTUAL AND COMPUTER-MEDIATED COMMUNICATIONMETHODS. Pauleen et al (2001) states “Unlike in co-located teams, subtleyet important cues are easily missed in the virtual environment”. Particularly

HOLOSYNC 405
with colleagues and team members who have not met in person, it is quite easyto misinterpret a comment or remark without being able to observe that person’ssubtle nonverbal cues and body language (Burgoon et al, 2002). More notably,relationships that are formed through a virtual network tend to be less personalin comparison to a team that works in the same office. This relationship canaffect how teams work, making the relationship and experience less personal andmore task oriented (Blenke, 2013). Despite the possibilities for misinterpretation,communicating via technology gives us the ability to connect and network withpeople we may not have the chance to meet in person.
MIXED REALITY / MICROSOFT HOLOLENS. Mixed Reality (MR) isa hybridization between the tradition FTF and more contemporary methods ofvirtuality. In 1994, Milgram defined MR as “a subclass of [Virtual Reality]related technologies that involve merging of real and virtual worlds... the moststraightforward way to view a Mixed Reality environment, is one in which realworld and virtual world objects are presented together within a single display...”(Milgram, 1994). At the time of Milgram’s exploration, the technology waslimited and still very experimental. At present Microsoft’s HoloLens is anon-tethered MR headset that allows the user to roam around their environmentfreely, allowing interaction with holographic overlays mapped on to real-worldsurfaces. Although MR has been present in research and development for manyyears, only recently has the technology become readily available and affordable.MR devices currently have limitations such as field of view, however these maybe refined and mitigated in the future. A current communication application onthe HoloLens is Skype. The application can be used between multiple users tointeract with one another’s space. While making a Skype call using the HoloLens,the companion is able to observewhat you see and “as the [companion] sees objectsto note, he can annotate items in the space for [you] to see” (Chen et al, 2015).
4. Comparitive StudyThe holographic design review platform combines a shared experience with voicecontrol interaction. With the capability to have multiple users experience the sameholograms, the platform could be used by different design disciplines discussinga common idea/design, or by the designer and the clients. This paper focusesspecifically on establishing a shared connection and conducting user-testing todetermine how effective MR is as a communication tool. Due to the scope ofthe paper a detailed explanation of how to establish a shared network and how toincorporate Vuforia, an AR platform that recognises images as anchors, could notbe included.
4.1. USER-TESTING
Three scenarios were tested using three different forms of communication.Scenario 1 required subjects to work together FTF, Scenario 2 used CMC, andScenario 3 used MR through the Microsoft HoloLens. Subjects were asked toarrange nine light rail carriage models on to a 3 x 3 grid. These carriages weredistinguished by colour and varied in material/medium over the three scenarios.
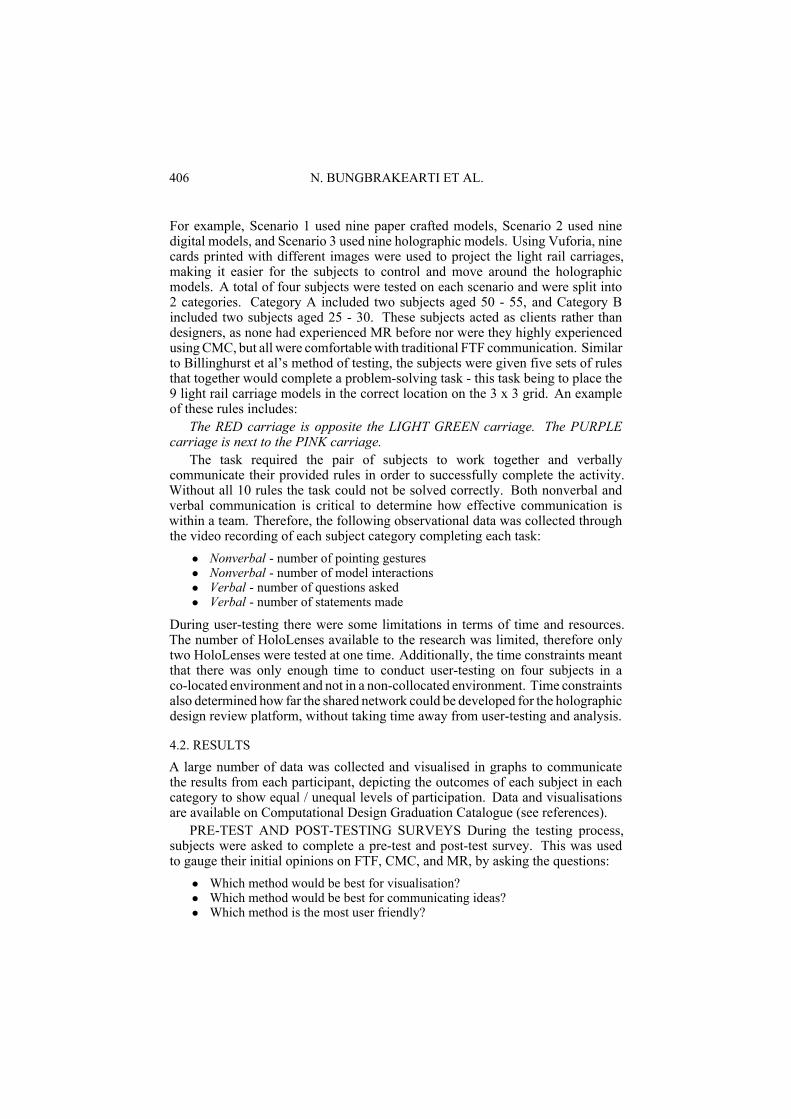
406 N. BUNGBRAKEARTI ET AL.
For example, Scenario 1 used nine paper crafted models, Scenario 2 used ninedigital models, and Scenario 3 used nine holographic models. Using Vuforia, ninecards printed with different images were used to project the light rail carriages,making it easier for the subjects to control and move around the holographicmodels. A total of four subjects were tested on each scenario and were split into2 categories. Category A included two subjects aged 50 - 55, and Category Bincluded two subjects aged 25 - 30. These subjects acted as clients rather thandesigners, as none had experienced MR before nor were they highly experiencedusingCMC, but all were comfortablewith traditional FTF communication. Similarto Billinghurst et al’s method of testing, the subjects were given five sets of rulesthat together would complete a problem-solving task - this task being to place the9 light rail carriage models in the correct location on the 3 x 3 grid. An exampleof these rules includes:
The RED carriage is opposite the LIGHT GREEN carriage. The PURPLEcarriage is next to the PINK carriage.
The task required the pair of subjects to work together and verballycommunicate their provided rules in order to successfully complete the activity.Without all 10 rules the task could not be solved correctly. Both nonverbal andverbal communication is critical to determine how effective communication iswithin a team. Therefore, the following observational data was collected throughthe video recording of each subject category completing each task:
• Nonverbal - number of pointing gestures• Nonverbal - number of model interactions• Verbal - number of questions asked• Verbal - number of statements made
During user-testing there were some limitations in terms of time and resources.The number of HoloLenses available to the research was limited, therefore onlytwo HoloLenses were tested at one time. Additionally, the time constraints meantthat there was only enough time to conduct user-testing on four subjects in aco-located environment and not in a non-collocated environment. Time constraintsalso determined how far the shared network could be developed for the holographicdesign review platform, without taking time away from user-testing and analysis.
4.2. RESULTS
A large number of data was collected and visualised in graphs to communicatethe results from each participant, depicting the outcomes of each subject in eachcategory to show equal / unequal levels of participation. Data and visualisationsare available on Computational Design Graduation Catalogue (see references).
PRE-TEST AND POST-TESTING SURVEYS During the testing process,subjects were asked to complete a pre-test and post-test survey. This was usedto gauge their initial opinions on FTF, CMC, and MR, by asking the questions:
• Which method would be best for visualisation?• Which method would be best for communicating ideas?• Which method is the most user friendly?

HOLOSYNC 407
• Which method is the least distracting?
The pre-testing survey revealed that FTF was chosen as the best method. Thiscould be due to subjects beingmore comfortable and familiar with FTF interactionsand not having experienced MR communication before. Here all subjects fromboth Category A and B, chose FTF as their preferred method, with the exceptionof one subject from Category B selectingMR as their choice for visualisation. Thepost-testing survey results are very different to the pre-testing survey. The datashows that after having experienced MR communication, the subjects were morein favour of MR than before, however some subjects still chose FTF. Looking atthe results from the specific categories, both of the older subjects from CategoryA chose MR as their preferred method for all questions, however Category B hasmixed reviews on MR and FTF. In both, pre-testing and post-testing surveys it isevident that CMC was the least preferred method, not being selected at all.
COMPLETION TIME Completion time was recorded from the momentsubjects began reading their rules to the time of task completion. The results shownthat CMC communication takes the longest amount of time to complete, FTF isthe quickest method and MR sits in between. These results are unexpected as itwas assumed that MR would take the longest to complete due to it possibly beingmore difficult and less intuitive to use, especially for first time users.
NONVERBAL CUES - GESTURES Pointing gestures were measured fromeach subject to identify how much nonverbal interaction occurred during eachcommunicationmethod. It is clear that there was very little pointing gestures whileusing CMC to complete the task, however for both FTF and MR methods, therewas a significant amount of gestures. Although Category A shows a higher levelof pointing gestures than Category B, there is still an equal level of participationbetween both subjects in each category when looking at the results from MR incomparison to the results from FTF which have a larger ratio of participation.
NONVERBAL CUES - MODEL INTERACTIONS Model interaction wasmeasured any time a subject picked up or moved one of the train carriages. Itwas observed that during CMC there were common questions asked at the startof the task between the subjects involving who would like to ‘drive’ the mouseand take charge of moving around the train carriages. By doing so there wasan immediate designated driver who would take control of most, if not all, ofthe model interactions. Although there is was a high level of model interactionbetween the subjects when interacting FTF, there was more of an equal levelof participation when using MR. This could be due to the subjects wanting toplay and understand the technology better hence there was more interaction withholographic model.
VERBALCUES - QUESTIONSDuring each task, the subjects communicatedverbally, asking each other a variety of questions. Unlike the previous two resultsof nonverbal cues, it is evident that CMC encourages a high level of questions.Although FTF has amore equal level of participation, the least amount of questionswere asked. The unfamiliar MR environment could be what caused such a highvolume of overall questions asked during Scenario 3, although unlike the previousresults for MR, the participation levels are not equal.
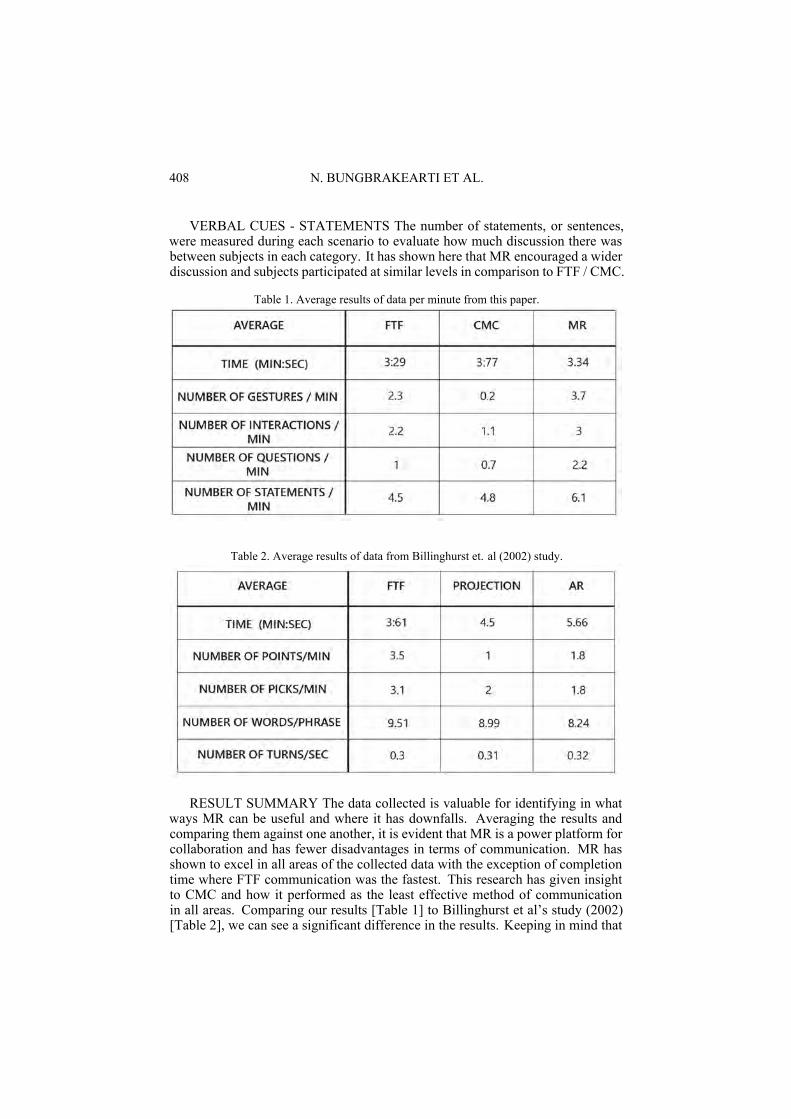
408 N. BUNGBRAKEARTI ET AL.
VERBAL CUES - STATEMENTS The number of statements, or sentences,were measured during each scenario to evaluate how much discussion there wasbetween subjects in each category. It has shown here that MR encouraged a widerdiscussion and subjects participated at similar levels in comparison to FTF / CMC.
Table 1. Average results of data per minute from this paper.
Table 2. Average results of data from Billinghurst et. al (2002) study.
RESULT SUMMARY The data collected is valuable for identifying in whatways MR can be useful and where it has downfalls. Averaging the results andcomparing them against one another, it is evident that MR is a power platform forcollaboration and has fewer disadvantages in terms of communication. MR hasshown to excel in all areas of the collected data with the exception of completiontime where FTF communication was the fastest. This research has given insightto CMC and how it performed as the least effective method of communicationin all areas. Comparing our results [Table 1] to Billinghurst et al’s study (2002)[Table 2], we can see a significant difference in the results. Keeping in mind that

HOLOSYNC 409
projection is the equivalent to CMC andAR toMR, the results from the two studiessuggests that MR has developed rapidly over the past decade and has improved inboth encouraging verbal and nonverbal communication and in completion time.
5. Significance, Evaluation and Conclusion of ResearchAlthough MR is not a new concept, is still in its infancy due to its currentlimitations. Yet, the technology has proven to be able to provide new andinnovative ways to share and communicate designs and ideas. This paper exploresthe concept of MR as a communication tool and where it could be best utilised inthe design process. From user-testing, the data suggests that tasks are performedmore quickly when using MR than CMC, and MR encourages a higher and moreequal level of nonverbal and verbal communication. It would be effective forcomplex visualisations, howevermay not be necessary for simple forms. For some,the technology seemed to be on par with FTF visualisations and user-friendliness.The division of method choice came down to the complexity of the models, as itwas believed that for simple models, MR would be unnecessary as it would besimpler to physically create the model. For more complex forms such as detailedbuildings or visualising context environments, MR would be more effective.Being an unnecessary platform for simple forms, MR would not be best utilisedduring the preliminary stages of the design process where building forms arevisualised through block forms or other rough design forms. Instead, it couldbe used during the later design stages where the design has been refined anddetail has been added as an effective presentation tool to multiple and varyingdesign disciplines or client. Results suggest that we should take advantage of thecapabilities of MR and implement them more so in the later stages of the designprocess. This research explored communication within a collaborative setting,focusing mainly onMR as a contemporary communication platform. Furthermore,a shared connection betweenmultiple HoloLens users was successfully establishedfor the holographic design review platform in conjunction with voice controlledinteractions. Although the shared network between multiple HoloLens headsetswas created and holograms were successfully anchored in the same location foreach user within the holographic design review platform, the interactions foreach user has not been synchronized. The consequences of this would meanthat if User 1 were to turn off all floors, User 2 would have to turn off floorsthemselves as the hologram interactions would not sync between them. This issomething that could be further explored in the future to create a more finalizedproduct. It is recommended for future testing that more subjects be included foruser-testing to generate a richer set of data. In doing so a more well-roundedconclusion can be drawn. Non-collocated communication user-testing would addto a richer data set and would further explore ways in which MR would be aneffective communication tool in a non-collocated scenario. These factors shouldbe considered when re-testing and re-analysing data in the future. However, thisresearch acts as a foundation for further complex development and more detailedtesting. Through the modification of an existing methodology for testing threedifferent communication methods, five sets of valuable data were collected andanalysed to determine in what ways MR is an effective communication tool and

410 N. BUNGBRAKEARTI ET AL.
where it would be best utilised during the design process. In comparison toBillinghurts et al’s 2002 study using FTF, screen based projection, and AR, itis clear that the technology has advanced over the past decade, with new datasuggesting that MR is more effective than FTF in many ways. Despite teams notbeing able to complete tasks as quickly in MR than in FTF collaborations, theamount of verbal and nonverbal communication is much higher when using anMR device, suggesting that it is successful in terms of information exchange andparticipation. Although MR has constraints, it is a powerful visualisation tooland would be best utilised when visualizing complex environments. Additionally,it should be used towards the later stages of the design process where multipledesigners can collaborate over final details or teams can present ideas to clients.
References“Computational Design Graduation Catalogue” : 2017. Available from <https://catalogues.be.
unsw.edu.au/2017-computational-design-graduation-catalogue/constructing-i-vrar/narissa-bungbrakearti/> (accessed 20. February 2018).
“Microsoft HoloLens” : 2017. Available from Microsoft<https://www.microsoft.com/en-au/hololens> (accessed 12 August 2017).
Billinghurst, M., Kiyokawa, K., Belcher, D. and Poupyrev, I.: 2002, Experiments withFace-To-Face Collaborative AR Interfaces, Springer Link, 6, 107-121.
Raymond Blenke, L.: 2013, The Role of Face-to-Face Interactions in the Success of VirtualProject Teams, Ph.D. Thesis, Missouri University of Science and Technology.
Bordia, P.: 1997, Face-to-Face Versus Computer-Mediated Communication: A Synthesis of theExperimental Literature, Journal of Business Communication, 34, 99-120.
Burgoon, -, Judee, K., Joseph, A.B., Norah, E., Dunbar, A., Artemio, R., Karadeen, K. andJenna, F.: 2002, Testing the interactive Principle: Effects of mediation, propinquity, andverbal and nonverbal modalities in interpersonal interaction, Journal of Communication,52(3), 657-677.
Chen, H., Lee, A., Swift, M. and Tang, J.: 2015, “3D Collaboration Method over HoloLens andSkype End Points, Proceedings of the 3rd International Workshop on Immersive MediaExperiences” . Available from <http://doi.org/10.1145/2814347.2814350> (accessed 27August 2017).
Gabel, D.: 1995, “An Introduction to Action Research” . Available from <http://physicsed.buffalostate.edu/danowner/actionrsch.html> (accessed 5 September 2017).
Hachman, M.: 2015, “Hands-on withMicrosoft’s HoloLens: The 3D augmented reality future isnow” . Available from <https://www.pcworld.com/article/2873657/hands-on-with-microsofts-hololens-the-3d-augmented-reality-future-is-now.html> (accessed 2 November 2017).
Hiltz, S.R. and Johnson, K.: 1989, Disinhibition, deindividuation, and group process in penname and real name computer conferences, Experiments in group decision making, 3,210-232.
Milgram, P. and Kishino, F.: 1994, A Taxonomy of Mixed Reality Visual Displays, IEICETransactions on Information Systems, E77-D(12), 1321-1329.
Muchmore, M.: 2016, “Microsoft HoloLens Now Available to Developers” . Availablefrom <http://au.pcmag.com/microsoft/42808/news/microsoft-hololens-now-available-to-developers> (accessed 2 November 2017).
Pauleen, D. and Yoong, P.: 2001, Facilitating virtual team relationships via the internetand conventional communication channels, Internet Research: Electronic NetworkingApplications and Policies, 11(3), 190-202.

SIGHT DEPTH ILLUSION WITH PERFORATED PLANE
Evaluate in Mixed Reality with Head Mounted Display
IKUYA HANAOKA1, SEIGO TANAKA2, ALRIC LEE3 andKENSUKE HOTTA41Takenaka [email protected]@1ft-seabass.jp3Automatter [email protected] [email protected]
Abstract. This paper examines the existence of a visual illusionwith depth of sight involving a perforated panel layered above anotherplane, evaluates the illusion’s properties with virtual projection on asee-through, head-mounted display, and illustrates the relation betweenthe veridical and perceived distances through amathematical expression.The result would be indicative to egocentric spatial analysis research,and reveal potentials as a reference point for a new architectural designtool.
Keywords. Sight Depth; Kansei Engeneering; Mixed Reality.
1. IntroductionAccording to recent market research reports, virtual reality (VR) would gainincreasing popularity in fields such as video games, live events, healthcare,education,engineering, and military. The technology has been pointed out tohave the possibility to become a platform of computing (Goldman sachs group2016). Meanwhile, the terms of VR, augmented reality (AR), and mixed reality(MR) are gaining awareness but their differences are not clearly defined in generalapplications. In the field of architecture and construction, the technologies havebeen adopted in many way; proposed space design can be experienced in thevirtual world without having to materialize CAD models, invisible phenomenacan be attempted to be visualized and analyzed (Fukuda 2015), constructionprocess can be guided digitally by utilizing a smart network on site. In this paper,VR technology would be used to evaluate the assumed illusion of sight depthassociated with overlapping planes within the context of interior architecturaldesign.
T. Fukuda, W. Huang, P. Janssen, K. Crolla, S. Alhadidi (eds.), Learning, Adapting and Prototyping,Proceedings of the 23rd International Conference of the Association for Computer-Aided ArchitecturalDesign Research in Asia (CAADRIA) 2018, Volume 1, 411-420. © 2018 and published by the Associationfor Computer-Aided Architectural Design Research in Asia (CAADRIA) in Hong Kong.

412 I. HANAOKA ET AL.
2. Aim of this paperThis paper proposes and defines an interior architecture finishing method, similartechniques of which may have been employed by designers and architectstraditionally in the history, but are yet to be validated with scientific experiments.The method concerns a wall/ceiling finish with a perforated panel that creates anoptical-space illusion, made of semi-transparent material and complemented withlighting effects from behind. The aim of such is to create an impression to thespectator of a bigger, deeper space than the actual environment which are oftenrestricted to site constraints.
Secondly, this paper examines the validity of the design hypothesis, andevaluates its effectiveness. The evaluation is conducted through a series ofsubjective evaluation experiments that is supported by a see-through glass typemixed reality (AR/MR) head mounted display (HMD), which superimposes avirtual model on top of the reality. In the experiment, the participants areshown, through the HMD, random material configurations of the virtual, illusionperforated panel juxtapositioned in front of a real wall, to examine the relationshipbetween veridical distance and the perceived depth with the intervention of theillusion panel.
3. State of ArtOriginates from paintings, the practice of illusionism has seen a long history ofapplication in various art forms, in which the subject is designed to deceive thespectator’s perception into sensing a reality that does not objectively exist, inanother word, an intentionally caused misinterpretation. Such illusion is madepossible by the brain’s fallibility to be persuaded of illogical concepts as the mindsubconsciously assimilates inconsistent sensory information (Massey. 1997).
In the engineering field, there are papers studying subjective evaluation,namingly Kansei Engineering. For example, there are car designers who foundout the coefficient between the distance and width of a pillar in the interior of avehicle (Takeda et al. 2013). The study concludes that there the difference betweenveridical distance and cognitive distance can be modeled with a sigmoid-likefunction, depending on the position of the object in one’s field of view.
There are several precedents concerning perceptual recognition in architectureand urbanism field too, a group in Nagoya Technical University referred itas sight-depth (Kitagawa et al. 1999). In the urban design field, the spacesyntax group (Hillier et al.1984) have been conducting axial map researches.Those researches assessed intuitive feeling with mathematics and computationalmethods.

SIGHT DEPTH ILLUSION WITH PERFORATED PLANE 413
Figure 1. Examples as architectural application, Left;Light window in Joan-tea-house, (picfrom Inuyama-city), Centre;Garan-renji-window in Horyu-ji (pic from 663highland), ceiling
finish in Nissei Theater (pic by author).
Traditional Japanese architecture in a city, as typified by tea room, has beendesigned with a dense in a small space in a small site. Its spatial impression becreated beyond the actual conditions including not only distance but also the wayof look at world. Even today, this method is effective in high-density cities suchas Tokyo, creating ‘feeling of breadth’ in a limited space contributes greatly tobuilding value improvement.
4. Problem statementIn such situation, though there are several theories about optical space cognitionwith a perforated panel (perforated wall) from interior view. Furthermore, thereare few description about its details such as the translucence, reflection rate, aswell as colors and objects behind such as top light or indirect lighting. Thishypothesis came from author’s practical experience but had not yet been proved.Also, evaluation with physical models is difficult not only because of costsbut the lack of a verified model of effect for the client’s reference. However,recent development in parametric modeling software and VR/AR/MR technologyenables thematerial properties to be visualized and tested before built; furthermore,AR/MR when coupled with subjective evaluation method, has the capacity toassess the spectator’s sensational feedback of the design being reviewed.
5. Hypothesis and Research QuestionsIf a perforated panel is layered on top of a wall as an interior finish, with a certainmargin of space in between, the spectator is assumed to perceive an illusion thatthe space is deeper than the actual dimension. As independent variables, rateof perforation and the distance between panel and the spectator would affect theresult.
The author expects the participant to overestimate the depth of the space,but also considers the possibility of underestimation. To quantify the assumedphenomenon, AR with HMD are used in the experiment to simulate the spatialsetting. Parametric-modelling can be integrated into the AR environment, andhence design properties of the perforated panel material can be adjusted in realtime. Under this agenda, there are six research questions:1. If motion parallax caused by movement of the spectator contribute to depth

414 I. HANAOKA ET AL.
illusion2. If illumination difference between the outer layer and inner layer contribute to
depth illusion3. If the texture and color of the inner wall contribute to depth illusion4. If porosity of the outer layer affect depth illusion5. If the distance between the outer layer and the spectator affect depth illusion6. If the distance between the two layers affect depth illusion
Elements in question 1, 4 and 5 may be examined as parameters in the experimentin a simplified manner. Steinman et al (2000) has suggested dynamic-motionparallax to be an important depth cue for spatial cognition, and the use of HololensHMD allows movement of the user, in comparison with wired VR headsets whichrestricts motion. Rate of perforation and the distance between two layers inquestion 4 and 5 are simplified as stepping values instead of continuous numbersin the experiment. Question 3 is reflected in the experiment conducted, bychoosing an inner wall that is textured, but the question has to be proved byan counterexample. Variables mentioned in 2 and 6 are fixed in this case forsimplification but are assumed to be correlated to the result, so further experimentsare expected.
6. ToolsHololens developed byMicrosoft is hardware chosen to be evaluate the hypothesis.As a MR device, it differentiates from VR devices that provide the spectator withan immersive virtual environment. MR devices overlays virtual information on topof the reality through a HMD, and the spectator sees a world mixed with virtualand actual information. Most of perceptions are from the physical environment,the main issue of HMD is that virtual objects tend to appear transparent in brightenvironments. In this experiment, budget sun-glass-lens are attached on top of theHMD to alleviate the problem in holo-environment (fig. 2).
Figure 2. DIYed Hololens for as a countermeasure for virtual objects appearing translucent.
The stimulated environment in Hololens is created with the Microsoftdevelopers kits (Microsoft 2017) for Unity. There are two standard developingenvironment in game engineering in 2017, Unreal Engine (Epic Games 2017) andUnity (Unity Technologies 2017), the latter was used. But for Hololens, there arealmost one choice Microsoft provide tool kit so that developer does not necessitateto type code in most of the case. Other reason is the laboring time for constructing

SIGHT DEPTH ILLUSION WITH PERFORATED PLANE 415
experienced space is relatively light for MR because this can omit to make detailssuch as modeling and lighting.
Figure 3. Software development in Unity, left is working window, right is experiment setwith/without textured wall.
There are three merits in using developer environments. Firstly, trial-and-errorin software development is easy to apply, because developer can program withlooking at the actual space in real scale. The making of objects is done inUnity, then Hololens enables the developer to check the result immediately.As such experiment which has interaction virtual and physical objects withinreal sight, necessitate manual adjustment, many times. The iteration of thisadjusting place, and sizing process is important to improve quality. The secondmerit is that this system environment can reconfigure space almost in real-time.The conventional ergonomics/Kansei engineering experiments need a full-scale,extensive mock-up for evaluation, as well as substantial manual labor in the setup.By utilizing virtual object in AR/MR, those operations became mere clicks ofbuttons. Thirdly, affinity between virtual and real is adjustable in MR. Concretely,VR-like immersive feeling can be amplified by adding a number of virtual object,which means more interference with real scene in MR too. In the initial stage,there were a discussion about whether the inner wall should be virtual or real,without having a conclusion, the examiner visited the site and decided not to usea virtual inner wall based on visual judgement. The point in here is that the useror developer can adapt adequate vitality and reality on demand.
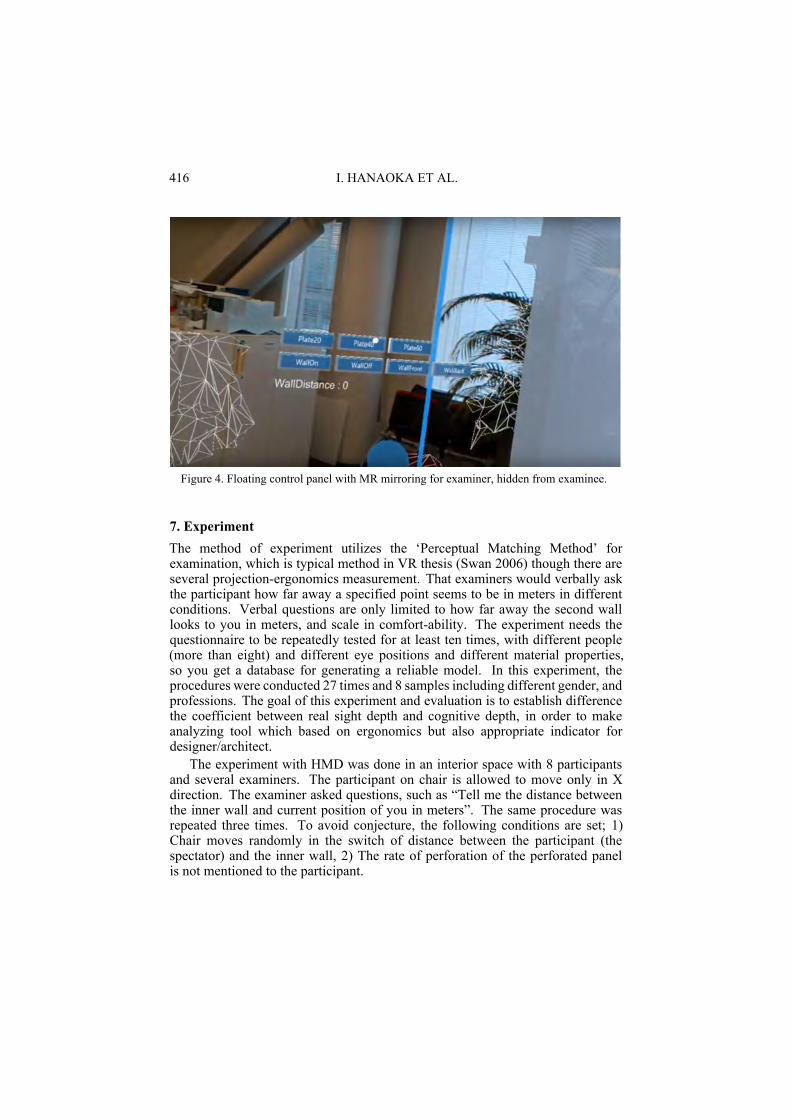
416 I. HANAOKA ET AL.
Figure 4. Floating control panel with MR mirroring for examiner, hidden from examinee.
7. ExperimentThe method of experiment utilizes the ‘Perceptual Matching Method’ forexamination, which is typical method in VR thesis (Swan 2006) though there areseveral projection-ergonomics measurement. That examiners would verbally askthe participant how far away a specified point seems to be in meters in differentconditions. Verbal questions are only limited to how far away the second walllooks to you in meters, and scale in comfort-ability. The experiment needs thequestionnaire to be repeatedly tested for at least ten times, with different people(more than eight) and different eye positions and different material properties,so you get a database for generating a reliable model. In this experiment, theprocedures were conducted 27 times and 8 samples including different gender, andprofessions. The goal of this experiment and evaluation is to establish differencethe coefficient between real sight depth and cognitive depth, in order to makeanalyzing tool which based on ergonomics but also appropriate indicator fordesigner/architect.
The experiment with HMD was done in an interior space with 8 participantsand several examiners. The participant on chair is allowed to move only in Xdirection. The examiner asked questions, such as “Tell me the distance betweenthe inner wall and current position of you in meters”. The same procedure wasrepeated three times. To avoid conjecture, the following conditions are set; 1)Chair moves randomly in the switch of distance between the participant (thespectator) and the inner wall, 2) The rate of perforation of the perforated panelis not mentioned to the participant.
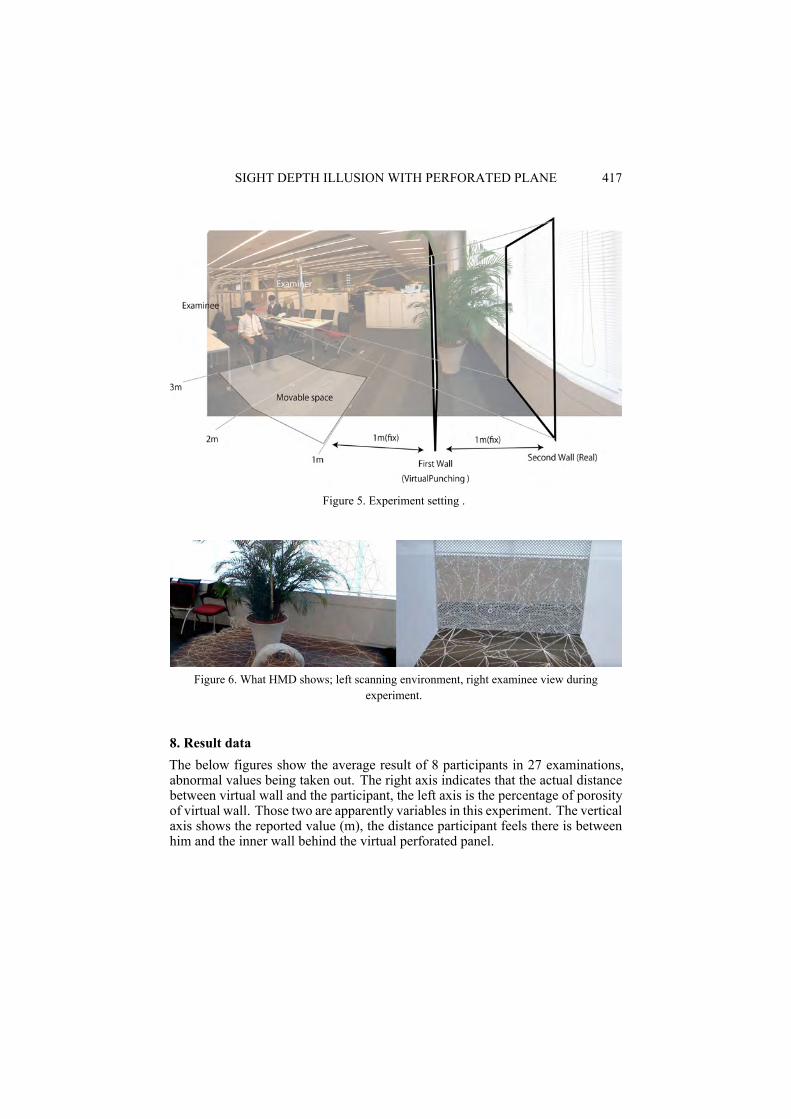
SIGHT DEPTH ILLUSION WITH PERFORATED PLANE 417
Figure 5. Experiment setting .
Figure 6. What HMD shows; left scanning environment, right examinee view duringexperiment.
8. Result dataThe below figures show the average result of 8 participants in 27 examinations,abnormal values being taken out. The right axis indicates that the actual distancebetween virtual wall and the participant, the left axis is the percentage of porosityof virtual wall. Those two are apparently variables in this experiment. The verticalaxis shows the reported value (m), the distance participant feels there is betweenhim and the inner wall behind the virtual perforated panel.

418 I. HANAOKA ET AL.
Figure 7. Perceived distance of all examinee.
Generally, this graph shows same rough tendency such as right upper partgoes higher, than left bottom part, but not easy to see accumulate information andconsideration in this representation.
Figure 8. Average of distance all examinee perceived.
Same as the previous axis definition, the above figure shows the average resultof all participants as the green surface, on the other hand the orange surfaceindicates the real distance between the second wall and the participant. The Graphshows that, 1) the larger distance between the participant and the virtual wall, thelarger the perceived space is in general. 2) In the case, the distance between thevirtual panel and participant is, with 20% porosity, less than 2 meter, as illusionbecomes bigger, while 40% and 60% almost accord.

SIGHT DEPTH ILLUSION WITH PERFORATED PLANE 419
Figure 9. The amount of sight illusion (m).
Finally, again in same measure rules, the slope shows the difference betweenthe value of real distance and perceived distance. The magnitude of illusiondistance is always positive value instead of the case people goes closer to virtualpanel, and high porosity. (the value of it nearly equals zero). Besides the case, thelager distance from a object and a person, makes the lager feeling of distance.
9. Conclusion and ProspectThe assumption that an inner wall with a perforated panel on top creates anperceptual illusion that exaggerates the in-between depth is valid with limitations.Two of the conditions are examined and revealed here. Firstly, the distancebetween the spectator and the perforated panel has to be wider than 1 meter.Secondly, the transmittance, which in here is translated into rate of perforationin perforated panel, has to be of a certain percentage. 20% proved to be the mosteffective in this experiment.While these figures work in this given environmentalconditions, but are more related to the perceive-able scale of the perforated panel.
However, some issues are yet to be addressed. One is whether theexperimented parameter range was appropriate, because the graph of the resultseems to be a continuous one. Another point is that if other untested variableswould carry a bigger impact to the outcome, such as the distance between innerand outer wall, illumination level between interior space and, interstitial space, aspointed out in heading 5. Thus further experiment would be expected.

420 I. HANAOKA ET AL.
Figure 10. The implementation in practice, at Tokyo referring this effect and its moc-up. .
This time authors quantitatively assessed howmuch impression of the distanceover the punching panel is amplified with respect to the actual situation whileutilizing MR. Based on these studies, one of the authors starts utilizing this effectas a design tool, above figure shows an example application of ceiling finish in aproject. With the limited size of sites in urban area, this office space is designedto expand the perceived spatial boundary.
References“The article of Horyu-ji” : 2006. Available from 663highland, adapted by author (Creative
Commons 2.5)<https://ja.wikipedia.org/wiki/%E6%B3%95%E9%9A%86%E5%AF%BA> (accessed 1st January 2018).
“Inuyama city official web-site” : 2008-2018. Available from <https://inuyama.gr.jp/?p=1391>(accessed 1st January 2018).
Ernst, K., Swan, J.E. and Feiner, S.: 2010, Perceptual Issues in Augmented Reality Revisited,IEEE International Symposium on Mixed and Augmented Reality 2010 Science andTechnology Proceedings, Seoul, 13-16.
Fukuda, T., Mori, K. and Imaizumi, J.: 2015, Integration of CFD, VR, AR and BIM for DesignFeedback in a Design Process - An Experimental Study, Proceedings of the 33rd eCAADeConference, Vienna, pp. 665-672.
Hillier, B. and Hanson, J.: 1984, The social logic of space, Cambridge University Press, UK.Kitagawa, K.: 1999, A Study on Architectural Plan Description and Evaluation with
“Sight-Depth”, Transactions of AIJ. Journal of architecture, planning and environmentalengineering, 522, pp.187-194.
Massey, L.: 1997, Anamorphosis through Descartes or Perspective Gone Awry, RenaissanceQuaterly, US.
Steinman, S.B. andGarzia, R.P.: 2000, Foundations of Binocular Vision: AClinical perspective,McGraw-Hill Professional, US.
Takeda, Y.: 2013, Analysis of Automotive Interior Structure Considering Relationship HumanVisual Direction Perception and Visual Space Kansei, Japan society of MechanicalEngineers, Japan, 17,807.
REMOTE STUDIO SITE EXPERIENCES: INVESTIGATING THEPOTENTIAL TO DEVELOP THE IMMERSIVE SITE VISIT
DANIELLE OPREAN1, DEBORA VERNIZ2, JIAYAN ZHAO3,JAN OLIVER WALLGRÜN4, JOSÉ P. DUARTE5 andALEXANDER KLIPPEL61,2,3,4,5,6The Pennsylvania State University1,2,3,4,5,6{dxo12|dvp6|juz64|juw30|jxp400|klippel}@psu.edu
Abstract. Immersive technologies are now enabling better andmore affordable immersive experiences, offering the opportunity torevisit their use in the architectural and landscape studio to gainsite information. Considering when travel to a site is limited ornot possible, immersive experiences can help with conveying siteinformation by overcoming issues faced in earlier virtual studios. Wefocused on developing three applications to understand the workflow forincorporating site information to generate an immersive site experience.The applications were implemented in a semester-long joint architectureand landscape architecture studio focused on remotely designing for theSanta Marta informal settlement in Rio, Brazil. Preliminary results ofimplementing the applications indicate a positive outlook towards usingimmersive experiences for site information particularly when a site isremote.
Keywords. Immersive experience; site visit; virtual reality.
1. IntroductionImmersive technologies are becoming more mainstream, improving in quality,accessibility and becoming more affordable through immersive experiences(IE). This transition allows spatial disciplines, like architecture and landscapearchitecture, to revisit possibilities for using such technology in the design process.Over the years, studios have attempted to incorporate IE to transform practiceby using such technology to complement or replace traditional media. Thisthinking had limited results due to a number of barriers which impeded widespreadadoption. As many of these barriers have been resolved by modern technology,we can revisit the possibility of reintroducing IE into the studio. Specifically,we capitalize on IE’s ability to generate site experiences and use it to addressissues in design education, particularly concerning remote locations. This ideafalls in line with original considerations for the virtual design studio, giving accessto remote locations and cultures (Kvan 2001). We broadly hypothesize that IEcan promote understanding certain aspects of a site; that computer visualizationscan help communicate site information (Wergles and Muhar 2009). IE canconvey remote sites when an actual visit may not be possible (George 2016).
T. Fukuda, W. Huang, P. Janssen, K. Crolla, S. Alhadidi (eds.), Learning, Adapting and Prototyping,Proceedings of the 23rd International Conference of the Association for Computer-Aided ArchitecturalDesign Research in Asia (CAADRIA) 2018, Volume 1, 421-430. © 2018 and published by the Associationfor Computer-Aided Architectural Design Research in Asia (CAADRIA) in Hong Kong.

422 D. OPREAN ET AL.
Our research objectives for the scope of this study focus first on developinga workflow with three different IE applications, addressing earlier barriers toimplementing IE into studios, and integrating those applications into a studioto see student’s user experiences. We present a brief background of IE forstudios, a description of modern IE technology and user experience, our workflowfor developing three modern IE applications, and a discussion with rationaleon implementing the applications into a studio with preliminary results from aninformal exploration. We conclude with implications and future directions toaddress our main hypothesis.
2. BackgroundThe history of immersive experiences (IE), including virtual and augmented reality,in architectural education is vast, spanning from the 90s to the present. Despitethis relatively long history, IE have not been genuinely accepted as a means ofconveying sites and designs in the studio. The benefits of IE for design educationare often discussed with positive outlooks but have long been overshadowed bythe barriers of earlier IE. Experiencing a site is a fundamental part of the designprocess where designers immerse themselves in the locale of a project. Withdesign occurring at an increasingly global scale, original ideas that studios shouldinvestigate more geographically distant locations is coming to the forefront ofdesign education needs.
The traditional design studio incorporates site visits to place students intothe potentially unknown (Leach 2002) for critical exploration. The need toplace students into an actual environment presents a challenge when sites aregeographically distant from a studio location. IE has been considered a solutionfor this issue by enabling students to develop an understanding of geographicallydistant environments and cultures through interactive collaboration. This ideaformed as the virtual design studio, where a group of designers could cometogether through technology mediation to share site, culture, and design ideas(Wojtowicz 1995; Duarte, Bento, and Mitchell 1999). Maher, Simoff, andCicognani (2000) explain that virtual design studios enable “sharing designinformation and supporting interaction regardless of place and time” (pg. 3). Inthese virtual collaborations, designers considered ‘local’ would physically visit thesite to “get a ‘feel’ for the place” (pg. 6). The remote designers then rely on siteanalysis information from traditional media communicated through technology.Similarly, this concept occurs in in-person studios where only a few students canvisit a site; where site characteristics are filtered through the lens of those whoactually visited (George 2016).
Virtual design studios transitioned from quasi-virtual desktop to immersivevirtual environments in order to capitalize on the immersive nature ofhead-mounted displays (Schnabel et al. 2001) and large-scale 3D screens(Kalisperis et al. 2002) to present scale andmovement in the act of design. The truestrength of IE comes from conveying architectural representation by presentingperceptual cues through movement and time to help improve comprehension ofboth space and form (Kalisperis et al. 2002a). IE can perceptually engageusers through immersive and interactive means (Bowman and McMahan 2007),

REMOTE STUDIO SITE EXPERIENCES: INVESTIGATING THEPOTENTIAL TO DEVELOP THE IMMERSIVE SITE VISIT
423
resulting in the sense of one’s self being located in the simulated space, or senseof presence (Balakrishnan and Kalisperis 2009). Presence relies on a number offactors to occur, starting with attention where focus is allocated on the simulatedspace. Once attention is allocated towards the simulated space, a user canbecome cognitively absorbed where they begin to lose track of time (Agarwal andKarahanna 2001). Lastly, a user needs to enjoy the experience which ultimatelyimproves feelings of presence. Once presence is achieved, factors such as memoryand cognition are reported to improve (Balakrishnan et al. 2012). The role ofpresence is alluded to in the history of IE in studios, where it relates to the benefitsof incorporation into studio pedagogy. The challenge faced by integration ofIE into the studio however stems from a number of barriers. IE was costly topurchase and operate, it typically required special expertise. Utilizing IE wasdifficult as content integration into an application was not easy and oftentimesnot compatible with other digital tools. Lastly, IE has continued to struggle withissues of cybersickness which become more prominent with extended use.
Modern day IE are overcoming many of the issues reported in earlier attemptsin the design studio: cost of equipment, content integration, and cybersickness.More affordable and higher fidelity IE can be purchased off the shelf, workingwithmany consumer grade computers. Content can be created with greater ease andincorporated into the growing number of technology from the Google Cardboardto more high-end head-mounted displays (e.g. Oculus Rift, HTC Vive). Realdata can be integrated into 3D environments through the use of LiDAR andphotogrammetric methods while 360° imagery captures a wide field of view in ahigh resolution (Zhao et al. 2017). Finally, the entertainment industry has heavilyinvested in reducing issues of cybersickness, enabling extended use of IE. Withthese barriers being removed, we can consider how IE can be re-introduced intothe design studio.
In summary, we revisited the need for presenting unbiased geographicallydistant information in the studio, the use of IE for comprehending space throughuser experience, and how modern day IE is overcoming the original barriers indesign studios. With these points in mind, we focus on exploring the potentialof developing IE for the studio to satisfy the need for geographically distantexperiences, while gaining an understanding of how modern day IE has overcomesome of the original barriers. We first focus our efforts on developing a workflowacross three types of modern IE: webVR, mobile VR, and head-mounted display(HMD) desktop VR, where each type becomes increasingly more immersive. Wefollow three goals in our exploration: 1) develop a plan to capture site informationthat would be relatively unbiased, 2) to develop three individual applications thatutilize the same point and click functionality to 360° content, and 3) to implementthe applications into a studio as a use case on user experience for continuousimprovement.
3. Development of the three applicationsWe collaborated with a studio course focused on a remote site, the Santa Martainformal settlement in Rio, Brazil. The Rio Studio was a joint architecture andlandscape studio aiming to explore the issue of population growth and urbanization

424 D. OPREAN ET AL.
in the southern hemisphere, exposing students to a large-scale problem thatconsists of numerous social, infrastructure, ecological, and urban planning issues.The organic structure of informal settlements proves challenging for designersto comprehend and improve without multiple visits to the site, which in someregions is both costly and dangerous. Informal settlements like SantaMarta are notgoverned and do not follow conventional policy for forming urban space, leavingdocumentation of the site limited as residents constantly make changes. LikemanyBrazilian informal settlements, SantaMarta has high building density and occupiesa very steep portion of Dona Marta Hill. The crowded space in Santa Martahas created unsafe living conditions and is representative of the socioeconomicstatus of the residents. Despite public authority interventions, the quality of lifein these informal settlements remains an issue. The Rio Studio provided a meansto develop IE for conducting a site visit remotely, not relying only on traditionalmedia (e.g. topographic maps, etc.).
Our first objective was to reduce issues of subjectivity in presenting siteinformation, particularly through visual information. Similar solutions utilizing IEfor remote site analysis incorporated 360° video captured from drones presentedon both a Google Cardboard and laptop along with a basic map showing structurelocations (George 2016). The results of student’s abilities to conduct site analysiswas promising but issues related to video resolution impacted exploration of smalldetails. To overcome this issue, we considered a mix of 360° videos and imageswhich would allow for capturing movement, sound and, small details such asmateriality of structures without directional bias found in standard photos. Unlikethe work presented in George (2016), the site itself presented challenges withgathering aerial data as it resided close to an airport restricting drone use and washighly dense in most areas making it difficult to obtain exact GPS coordinates. Thesettlement is also not well mapped in most mapping services (e.g. Google Maps,OpenStreetMaps) because it constantly changes. Our plan was to follow the mostdocumented routes of the site, attempting to capture major areas from the entranceto the uppermost region, collecting the 360° content from a first person perspective.An attempt to use a balloon for a semi-aerial perspective did not succeed due toweather. We collected 93 different 360° images and 34 360° videos the summerbefore using a Ricoh Theta S camera, an affordable consumer grade 360° camera,which was portable enough to travel and provide decent resolution. Additionalcontent included a number of high resolution images and videos as well as a basemap provided by the government in Rio, Brazil.
The second objective was to develop a workflow to create IE that capitalized oneasy content generation while considering how commercial experiential mappingprograms currently work (e.g. Google Earth for HTC Vive). Three immersiveapplications (WebVR, HTC Vive, and Cardboard with Android phones) weredeveloped using the 360° content collected from Santa Marta. The 360° contentwas mapped to the provided base map in all three applications, creating anoverview page. A point and click interaction was added to enable ‘entering’ the360° content. TheWebVRwebsite used a combination of HTML, CSS, JavaScript,JQuery and A-Frame to make the images viewable while linking videos streamedthrough YouTube (Figure 1). On the overview page, clicking any point on the

REMOTE STUDIO SITE EXPERIENCES: INVESTIGATING THEPOTENTIAL TO DEVELOP THE IMMERSIVE SITE VISIT
425
map would open up a side window with the 360° image and the photo name foreasy reference. Clicking the 360° image would change it to full screen view withrotational navigation to explore each image. Clicking the escape button wouldreturn users to the overview page. Similarly, on the 360° video overview, clickinga route would open up a side panel with the embedded YouTube 360° video.While the least immersive when running from a laptop or desktop computer, thewebsite was capable of working in stereo 3D in the Immersive Environments Lab(IEL) (Figure 1), a large screen 3D capable presentation space. It was possible toinspect the different images/videos by looking around, from either an individualor a collaborative perspective in the IEL.
Figure 1. WebVR website with the 360° images and display in the IEL.
The other two applications, the HTC Vive and Android Cardboard, usedUnity3D, placing the user inside an image textured sphere to experience each360° image. While development through Unity3D was the same, differentinterfaces using the same overview map point and click model from the websitewere incorporated. The HTC Vive application used an HMD and one of thetwo hand controllers for interacting with the scene. Controllers and HMD aretracked allowing the user to move around in the scene, the overview map or a360° image/video in this case. Figure 2 shows the overview map perspectivewith the locations for the images/videos using the HTC Vive. The one-to-onecorrespondence between points/paths on the map and 360° images/videos enablesmulti-scale spatial learning by the user. In the 360° image perspective, aminimized overview map is available for navigation with a zoom-in map attachedto the backside of the controller. Specifically, the user’s current position andvisited places are marked in different colors to afford spatial awareness. Theuser can navigate between different images or go back to the overview map toselect other points, similar functionality found in Google Maps which allows fornavigating through different 360° images. Similarly, users can select paths on themap to watch videos. An animated point on the minimap continuously tracks theuser’s position in each video’s playback progress including pausing or replaying.

426 D. OPREAN ET AL.
Figure 2. HTC Vive with user inside the 360° images.
The mobile version for Android smartphones works with a Cardboard viewer.In contrast to the Vive version, only the orientation of the display can be trackedbased on the phone’s accelerometer. Other limitations include screen space, andthe lack of controllers poses additional challenges. Interaction consisted of gazecontrol based on a reticle placed in the center of the screen that can be clicked withthe Cardboard’s only button or by tapping the screen (Figure 3). Figure 4 shows themenu available in the image perspective that allows for moving between images,turning the minimap display on and off, and switching back to the overview map.
Figure 3. Overview perspective in the mobile version for the Cardboard. Gaze control to selectmap points and switch to the corresponding image.

REMOTE STUDIO SITE EXPERIENCES: INVESTIGATING THEPOTENTIAL TO DEVELOP THE IMMERSIVE SITE VISIT
427
Figure 4. Image perspective in the mobile version. Gaze-controlled menu to navigate betweenthe images, enable/disable the zoom-in map, or switch back to the overview perspective.
4. Implementation into the Rio studioThe Rio Studio was offered to architecture and landscape students. The studiointroduced a unique situation where students would not visit the Santa Martasettlement until the end of the semester to present their projects to the localcommunity. We integrated the three applications into the studio, enabling thestudents to virtually experience the site to help them access information to analyzethe underlying structure. We concluded with the students generating their own360° images of their projects as part of the presentation to the local community.
4.1. EXPLORATION DETAILS
At the beginning of the semester, we introduced the applications while seekingparticipation in an informal exploration of the user experience with suggestions forimprovement. We started by introducing the website then the HTC Vive followedby the Cardboard for Android phones. We received consent from 10 students tocollect responses from each use of an application throughout the semester. Wecollected preliminary data through surveys: demographics, 2-3 minute surveys,and a concluding survey. The demographics and concluding survey provided priorexperience and suggestions for future improvements. We used 2-3 minute surveysas informal feedback to not disrupt the actual use of the IE. The students filledout surveys after using any application. The survey consisted of 20 questionsthat were either scale-based or open-ended. The scale-based items, nine-pointscale, were adopted from known measures of losing track of time from cognitiveabsorption (Agarwal and Karahanna 2001), perceived enjoyment (Davis, Bagozziand Warshaw 1999), self-location, feeling oneself in the simulated space, frompresence (MEC-SPQ) (Vorderer et al. 2004) and, attentional allocation which

428 D. OPREAN ET AL.
we refer to as attention capture (Vorderer et al. 2004). The surveys also hadopen-ended questions focused on the purpose of using the application and anychallenges faced.
4.2. PRELIMINARY RESPONSES ON APPLICATION USE
Of the 10 participants, there were 6 females and 4 males with an even splitbetween architecture and landscape architecture, 7 grad and 3 senior students,and an average age of 24.83. Prior to the studio, only four students had used aCardboard, none had used the HTC Vive or the IEL. The small sample did notsupport full quantitative analysis but showed an interesting trend. For ongoinguser feedback from the semester, we had a total of 23 complete responses where43.5% of responses were for the website, 26.1% for the Cardboard, 17.4% forthe HTC Vive, and 13% for the website in the IEL. The response means showperceptions of user experience were relatively similar across applications, Figure5, with the IEL showing the greatest potential in presence, self-location. TheCardboard showed the lowest scores in terms of presence but was comparable forenjoyment and attention capture. Overall, the perceptions were positive in termsof user experience.
Figure 5. Calculated means for four survey categories of user experience by application.
The majority of responses (74) were open-ended and used to help improvetechnical and content issues with each application throughout the semester.Responses were grouped across two categories: need for experience and contentimprovement. Need for experience contained themes that ranged from desiredinformation type, ‘the buildings entrances in road intersections’ and ‘to seethe building materials and the feel of the corridor spaces’ to the success ofinformation provided, ‘map-picture reference....when you deal with a complex

REMOTE STUDIO SITE EXPERIENCES: INVESTIGATING THEPOTENTIAL TO DEVELOP THE IMMERSIVE SITE VISIT
429
site, it is easy to forget where you took the picture’. The second category,content improvement, contained themes for general issue reporting, ‘images wereinverted’, and suggestions for improved functionality, ‘a pause feature and fastforwarding/rewinding...’. Cumulatively, the responses were increasingly positiveas issues were resolved throughout the semester.
4.3. REFLECTIONS FROM PRELIMINARY RESULTS
The studio provided positive results on the potential of IE to supplementsite experiences. Responses indicated a sense of presence occurred in allapplications. Informal discussions and open-ended responses indicated thatimmersive applications could be a good alternative over traditional mediawhen actual site visits are not possible. Through the applications, we wereable to assist students in addressing issues within the Santa Marta site. Thesuccess of the immersive applications was indicated through interaction with thecommunity members. While limitations of the student’s proposals were notedby the community, the students indicated the applications helped them form anunderstanding of key physical characteristics of the site. This understanding wasaided by the iterative improvement of each application. Issues were immediatelyaddressed and suggestions were collected for future implementation. Accessibilityof the applications was a common issue as there was only one HTC Vive and theCardboard was only for Android phones. Making all of the applications moreavailable is a future implementation.
Other limitations focused on lack of content where more detailed informationand experiences were the most desired. The issue of content is a challenge,particularly when the sites represented are difficult to fully capture. Currently,similar consumer products such as Google StreetView and Google Earth do nothave enough content for these settlements, making it difficult to find similarapplications. One possible avenue is to consider more modalities (e.g. audio) tocreate a richer experience of the existing content. Students noted after visiting thecommunity, the largest limitation was the inability to convey the social dimensionof the community. The suggestion was to add a dialogue with the communitythrough the applications, a shared experience. The challenge then becomes howexisting technology can facilitate this dimension. In short, IE does improveunderstanding of physical features, an improvement compared to traditional media(e.g. photographs, maps) but still present limitations in capturing social andcultural dimensions.
5. Implications and future outlookUnderstanding a site is important as more projects start to occur globally withphysically distant sites. The re-vitalization of IE presents an opportunity to utilizeexperiential benefits to provide an experience of a site. The challenge presentedby the Rio Studio was to provide an experience of the current state of the SantaMarta settlement to design students. We developed a workflow for creatingthree immersive applications to portray the site. Our focus was to consider theimplications of IE as a means to communicate the site, enabling studio students to

430 D. OPREAN ET AL.
design. We successfully developed and incorporated the applications into the RioStudio while iteratively refining the workflow through an informal exploration ofuser experience. Addressing our broad hypothesis, we focused on how to developapplications that overcome past issues with IE then capitalized on identifyingtrends in user experience as a driving factor for future performance. Our futurework includes a full evaluation of the application.
ReferencesAgarwal, R. and Karahanna, E.: 2000, Time Flies When You’re Having Fun: Cognitive
Absorption and Beliefs About Information Technology Usage, Management InformationSystems Quarterly, 24(4), 665-694.
Balakrishnan, B. and Kalisperis, L. N.: 2009, Design Visualization: AMedia Effects Approach,International Journal of Architectural Computing, 7(3), 415-427.
Balakrishnan, B., Oprean, D., Martin, B. and Smith, M.: 2012, Virtual reality: Factorsdetermining spatial presence, comprehension, and memory, Proceedings of the 12thInternational Conference on Construction Applications of Virtual Reality, Taipei, 451–459.
Bowman, D. A. andMcMahan, R. P.: 2007, Virtual Reality: HowMuch Immersion Is Enough?,Computer, 40(7), 36-43.
Davis, F. D., Bagozzi, R. P. andWarshaw, P. R.: 1992, Extrinsic and IntrinsicMotivation to UseComputers in the Workplace, Journal of Applied Social Psychology, 22(14), 1111–1132.
J. P. Duarte, J. Bento andW. J. Mitchell (eds.): 1999, Remote Collaborative Design: The LisbonCharrette, IST Press, Lisbon, Portugal.
George, B. H.: 2016, Distributed Site Analysis Utilizing Drones and 360-degree Video, Journalof Digital Landscape Architecture, 1, 92–99.
Kalisperis, L., Otto, G., Muramoto, K., Gundrum, J., Masters, R. and Orland, B.: 2002, Anaffordable immersive environment in beginning design studio education, Proceedings ofthe 2002 Annual Conference of the Association for Computer-Aided Design in Architecture,Ithaca, N.Y., 47–54.
Kalisperis, L. N., Otto, G., Muramoto, K., Gundrum, J. S., Masters, R. and Orland, B.:2002a, Virtual Reality/SpaceVisualization inDesign Education: TheVR-Desktop Initiative,Proceedings of eCAADe 2002, Warsaw, Poland, 64-71.
Kvan, T.: 2001, The pedagogy of virtual design studios, Automation in Construction, 10(3),345-353.
Leach, N.: 2002, Designing for a digital world, Academy Editions, London.Maher, M. L., Simoff, S. J. and Cicognani, A.: 2000, Understanding Virtual Design Studios,
Springer London, London.Schnabel, M. A., Kvan, T., Kruijff, E. and Donath, D.: 2001, The first virtual environment
design studio, Proceedings of the 19th Conference on Education in Computer AidedArchitectural Design in Europe, Helsinki, 394-400.
Vorderer, P., Wirth, W., Gouveia, F. R., Biocca, F., Saari, T., Jäncke, F., Böcking, S. and et,a.l.: 2004, “MEC Spatial Presence Questionnaire (MEC-SPQ): Short Documentation andInstructions for Application” . Available from Project Presence: MEC (IST-2001-37661)<http://www.ijk.hmt-hannover.de/presence>.
Wergles, N. and Muhar, A.: 2009, The role of computer visualization in the communicationof urban design—A comparison of viewer responses to visualizations versus on-site visits,Landscape and Urban Planning, 91(4), 171–182.
Wojtowicz, J.: 1995, Virtual Design Studio, Hong Kong University Press, Hong Kong.Zhao, J., LaFemina, P., Wallgrun, J. O., Oprean, D. and Klippel, A.: 2017, iVR for the
geosciences, 2017 IEEE Virtual Reality Workshop on K-12 Embodied Learning ThroughVirtual and Augmented Reality (KELVAR), Piscataway, N.J., 1-6.

INTEGRATION OF VIRTUAL REALITY, 3-D EYE-TRACKING, ANDPROTOCOL ANALYSIS FOR RE-DESIGNING STREET SPACE
LE-MIN ZHANG1, TAY-SHENG JENG2 and RUO-XI ZHANG31Department of Architecture, National Cheng Kung University,Tainan; School of Architecture and Civil Engineering, XiamenUniversity, [email protected] of Architecture, National Cheng Kung University, [email protected] of Architecture and Civil Engineering, Xiamen [email protected]
Abstract. The objective of this paper is to develop an eye-trackingtechnology combined with a virtual reality system for an experimentalstudy of an historical street design. Using protocol analysis, a setof design objects, parameters, and subjects are randomly selectedfor evaluation of the virtual street space of an ancient city. 3-Dpoint-cloud data of spatial behaviors are tracked and analyzed. It isconcluded that people with different cultural backgrounds each havea considerably different perception of the street space’s characteristics.The methodology described in this paper can be used for spatial designof urban space in the future.
Keywords. Virtual Reality; Eye-Tracking; Protocol Analysis; StreetSpace.
1. INTRODUCTIONVirtual Reality (VR) technology offers new opportunities for the development ofinteractive and simulation tools for urban space and building design. VR headsetsoffer a high quality immersive environment and interactive tools for historicalsite analysis and preservation design. Traditional street spaces can be viewed as“social media” where people walk, sightsee, perceive, and cognize. The importantcomponents of historic urban districts include sitting spaces, sunlight, trees, signs,and decorations (Guo and Jeng 2008). The relationship of these componentsto the street is integral and goes far beyond the traditional urban design. Thedevelopment of an in-depth understanding of the connotations of street spaces iscritical for renovating and restoring these districts.
The objective of this paper is to develop an eye-tracking technology, combinedwith a VR system, for an experimental study of an historical street design.The paper reports a visual thinking method that includes integrated eye-trackingtechnology in the VR headset and a protocol analysis. The aim is to query subjectsso as to better understand attentiveness as well as head and body movements as
T. Fukuda, W. Huang, P. Janssen, K. Crolla, S. Alhadidi (eds.), Learning, Adapting and Prototyping,Proceedings of the 23rd International Conference of the Association for Computer-Aided ArchitecturalDesign Research in Asia (CAADRIA) 2018, Volume 1, 431-440. © 2018 and published by the Associationfor Computer-Aided Architectural Design Research in Asia (CAADRIA) in Hong Kong.

432 L.M. ZHANG, T.S. JENG AND R.X. ZHANG
they relate to particular features of the virtual scene. This suite of technologyand analytic protocols is applied to evaluate a proposed historic restoration of theHong Kong Street space in the ancient city of Zhangzhou (Fujian, China). It alsoaddresses a second objective, which is to assess the differential perceptions ofprofessionals (architects) and naive user (non-architects) of the renovated streetspace. Based on the experimental studies of attentiveness in the VR environment,the traditional street space may be redesigned in such a way as to optimize theexperience with the cultural nuances of the architectural elements of traditionalshop-lined streets.
2. RELATEDWORK2.1. ADVANCES IN VR SYSTEMS
Much synergy is expected to be gained from the combination of VR witheye-tracking technologies, until recently, the limitations of VR impeded thisprogress (Kiefer, Giannopoulos et al. 2017). Currently, the research in this fieldis more about graphics acceleration and interactive control. Little work has beendone to study eye-tracking with the subject wearing a mobile eye tracker in theVR environment. For example, study on feature of users’ eye movements duringa distributed and synchronized VR meeting using cloud computing, this paperattempted to apply the eye-tracking technology for spatial design (Fukuda andTaguchi 2013). Evaluation of indoor guidance systems often use an immersivevirtual environment in combination with a mobile eye tracking system. Thepaper presents a new approach to combining an immersive virtual environmentwith a mobile eye tracking system for 3D gaze analysis and visualization(Schrom-Feiertag, Settgast et al. 2017). Combining virtual reality and mobile eyetracking to provide a naturalistic experimental environment for shopper research,the combination provides a unique opportunity for shopper research (Meißner,Pfeiffer et al. 2017). These studies have achieved good results, greatly expandedthe study of spatial behavior. Although eye tracking in virtual reality has a wealthof data acquisition capabilities, many experiments in the VR environment stillrequire that the subject wear the traditional mobile eye tracker. Hence, the abilityof the VR helmet to assist with the determination of spatial location has not beenfully exploited.
Eye tracking has an intrinsic relationshipwithVR, the progress in hardware anddata collection has opened up more opportunities for eye-tracking research in theVR environment (Jacob and Karn 2003). It is already the case that the user wearsa head-mounted display, adding a small head-mounted eye tracker and illuminatorhas negligible impact on the equipment size and weight. As for data processing,the eye tracking data can be merged with the user spatial behavior data quicklyand accurately. Meanwhile, eye tracking accuracy and data analysis efficiencycan be improved considerably by combining the components of the 3-D modelin the VR environment with the database and object-oriented spatial positioningtechnologies.

INTEGRATION OF VIRTUAL REALITY, 3-D EYE-TRACKING, ANDPROTOCOL ANALYSIS FOR RE-DESIGNING STREET SPACE
433
2.2. AN EXAMPLE
The ancient city of Zhangzhou is about 86 hectares in area and is located at thecenter of Zhangzhou, Fujian. It has over 1300 years of history, ranging from theTang, Song, Yuan, Ming, and Qing dynasties to the modern Republic of China.Hong Kong Street is at the core of ancient city preservation. It once received theHabitat Scroll of Honor Award, but the cityscape was heavily modified due toits long history of occupation and urbanization. How to understand the currentcomposition of cityscape along Hong Kong Street and also highlight its original,traditional street space in southern Fujian province are both critical to architecturalpreservation (Zhang and Zhang 2015). The virtual image of the Hong Kong Streetcan be constructed more accurately through attention to spatial characteristics andalso the special elevations of particular features. The key to researching the designof a street space in the ancient city of Zhangzhou is to design and analyze thehuman-space-interface elements as an organic whole. That is, the form or elementcannot be treated separately because during the formation of a person’s perceptionof the ancient city, the street space is not only a carrier of the Street and theboundary, but also the interface between boundaries.
3. THE EXPERIMENTThis paper takes a protocol analysis approach to capturing the cognitive thinkingand spatial cognition of the people who walk in the VR environment. Thestudy starts with the street scene drawn from the Hong Kong Street historicstreet of ancient Zhangzhou, described above. A group of subjects with differentbackgrounds is selected for VR experiment and data on their perception of thescene is collected using experiment, behavioral record analysis and questionnairesurvey. Analysis is then performed on the data collected from the three methods.
3.1. METHODS: 3-D EYE-TRACKING ANALYSIS
Motivated by the traditional eye-tracking analytic principles, one of theinnovations in this paper is to combine the spatial depth perception with thepeople’s visual sensitivity in a 3-D VR environment. According to Besharse andBok (2011), visual acuity declines by about 50% every 2.5° from the center axis to30°, at which point visual acuity declines more steeply (Besharse and Bok 2011).In this way, 3-D eye-tracking analysis more approximates people’s actual visualbehavior, facilitating research on spatial behavior. As we know, light travelsalong a line. Thinking analogously, we might regard the eye as a light source.That is, while observing an object, the subject emits a cone-type beam of lightparticles from the eye. According to established visual principles, the beam’senergy attenuates from its center to the periphery. And the energy attenuationcoefficient is equal to the dynamic distribution of attenuation of visual sensitivity.
Then, the object’s visual thermal value is the accumulated value of the durationof attention on object multiplied by visual acuity, where visual acuity is definedas the a/2.5°th power of 1/2.

434 L.M. ZHANG, T.S. JENG AND R.X. ZHANG
C =n∑
i=1
T×V A, i = 1, 2, 3 . . . n (1)
Where: visual thermal value is C, attention object time is T, tracking scan order isn.
V A =
(1
2
)� ±2.5 °
, ∈ 0 30° (2)
Where: visual acuity is VA, viewing angle is α.The particle at the center of beam-like line of sight has more energy than those
at the edge. Where the subjects can see is where the beam of light shines. Thepoint attended to by the eye for a long time has more energy from the radiation ofbeam light, as shown in Table 1. Afterwards, the distribution of particle energyon the surface of 3-D object is determined thereby producing a 3-D eye-trackingthermal map.
3.2. PARTICIPANTS
Initially using random sampling, 100 experimental subjects were chosen. Dueto visual limitations of 18 of the participants, we only considered the data of 82subjects (36 males and 46 females) with an average age of 24.5 (SD=5.3) andranging in age from 18 to 50. Subjects have lived in southern Fujian for an averageof 5.1 (SD=6.9) years.
3.3. APPARATUS
The Spatial Behavior Simulation System is a multi-component interconnectedsystem that enables the rapid exchange of data between the SimulationMonitoringterminal and Data Acquisition terminal through a shared server. In the SimulationMonitoring component, VR headsets (Hardware: HTC-Vive) and eye-trackingtechnology (Hardware: Optical-type eye tracker, Program: C++ and Unity3D)were used to construct the VR scenario and track user behavior in the VRenvironment in real-time, as shown in Figure 1(a). In the Data Acquisitionterminal, the data from each experimental stage is recorded and aggregated.Visualization analysis is conducted on 3-D point-cloud data of spatial behaviors,as shown in Figure 1(b).
The core of this experimental system is the 3-D eye-tracking and spatialpositioning data collection. Optical-type eye tracker and VR headsets areintegrated in a single unit and the low-power infrared LED is used formulti-direction illumination. The eye-tracking data is then obtained fromHigh-speed Eye Tracking Sensor. The optical-type eye tracker is located in theVR headset and thus is able to obtain accurate spatial location data from the VRheadset using the signal of the base station. Finally, the spatial activity data isoverlaid on the virtual scene using the software to provide the 3-D point-clouddata of spatial behavior.

INTEGRATION OF VIRTUAL REALITY, 3-D EYE-TRACKING, ANDPROTOCOL ANALYSIS FOR RE-DESIGNING STREET SPACE
435
Figure 1. The spatial behavior simulation system based on virtual reality and eye tracking. (a)Composition of space behavior simulation system. (b) The data flow diagram for visualized
analysis of 3-D point-cloud data of spatial behaviors. .
3.4. VR ENVIRONMENT
The virtual Hong Kong Street has a south-north length of 95.2m, width of 3.2-5.8m and height of 3.4-9.2 m. The moving range of subjects is the street betweentwo memorial arches with a spacing of 26.8 m, as shown in Figures 2(a)(b). First,the 3-D scanner is used to survey and draw the existing Hong Kong Street, asshown in Figure 2(c). The obtained models are then simplified and correctedvia 3Dmax. Afterwards, the buildings and environments of the street space areredesigned. Finally, the redesigned models are imported to Unity Engine 4, asshown in Figure 2(d). Meanwhile, there are 3348 objects in this VR scenario, allobjects in the model are sequentially numbered for automatic data calculation.
Figure 2. General situation of Hong Kong Street, Virtual streetscape generated from real HongKong Street.
3.5. EXPERIMENT SETUP FOR PROTOCOL ANALYSIS
The subjects enter the virtual street space of Hong Kong Street wearing the helmetwith integrated eye-tracking and VR. Each subject experienced the virtual HongKong Street for two minutes. The 3-D point-cloud data of each subject is collectedin this way. Finally, the entire experience is recorded by the camera for subsequent

436 L.M. ZHANG, T.S. JENG AND R.X. ZHANG
query and review of activities. The experiment consists of three stages, details areas follows.
First, the subject complete questions providing personal information andinformation on cultural background, and then get familiarized with the VRenvironment and how to operate in that environment. After wearing the equipment,they adjust their eyeballs to the monitoring zone before the experiment begins andmatch the 9-point eye position. The subjects are asked to answer the followingthree questions during their VR process.
• “Please identify the most representative architectural element of the traditionalculture of southern Fujian province in the scene.”
• “Please identify the most attractive architectural element of the traditionalculture of southern Fujian province in the scene.”
• “Please confirm whether this scale of street space is approriate.”
Next, during the experiment, three types of street spaces with different dimensionswere simulated, and subjects experienced these spaces for periods of two minutes.In the VR traditional street space, the subjects describe their experience and answerthe three questions at their leisure. If they appear to be lost, they are remindedof the need to note their experiences in order to answer the three questions anddescribe their feelings with little time for deep reflection. Meanwhile, during theprocess of experiencing the street spaces, spatial behaviors were recorded using acamera, and an inquiry and review of activity during the experience was conductedafter completion. The quantitative analytical methods used in the questionnaireinclude descriptive statistical analysis and Pearson correlation analysis.
Finally, the 3-D point-cloud visual data of spatial behavior collected via theData Acquisition Terminal is used to show subjects their individual eye-trackingand the features they attended to on the large display. The subjects review theirexperiences one by one. Subject eye-tracking data and their descriptions areverified. Special eye movement phenomena are queried and corrected.
4. ANALYSIS AND RESULTSBy combining data collected from the above two experiments, this studydetermines similarities and differences between spatial behaviors exhibited bydifferent groups of people. Analysis of accumulated data clearly indicates thatthe subjects’ attention was concentrated in only part of the street space. Thereare 3384 objects in this scene. For each, we have a detailed description of spatiallocation and an independently collected point-cloud database of viewing behavior,that is, the spatial locations of the gaze of each viewer. Each time the surface ofthe 3-D object is viewed, the visual thermal value of that particular point increases;this value increases with viewing duration. After superimposing the data of spatialbehaviors of all subjects, if the value of certain part exceeds a threshold, it will beshown in red in the thermal map and can be regarded as a hotspot. According to thethermal map, there were only 82 hotspots, most of which were cultural elementsof southern Fujian architecture and nostalgic objects. These hotspots representa very small number of the total 3384 objects of the model in the scene. In otherwords, the subjects are only interested in 2.4% of objects in the VR space, ignoring

INTEGRATION OF VIRTUAL REALITY, 3-D EYE-TRACKING, ANDPROTOCOL ANALYSIS FOR RE-DESIGNING STREET SPACE
437
the influence of occlusion. This observation reveals some patterns of the people’sspatial behavior in this street space, as shown in Figure 3.
Figure 3. Composite thermal map of 3-D eye-tracking spatial behaviors.
According to their background in architecture, the subjects are classifiedinto two types: professional users(architects) and naive users (non-architects).Among them,27 subject are professional users (17 local architects and 10 non-localarchitects), 54 subjects are naive users. Data analysis of the eye-tracking thermalmap reveals considerable difference between the two groups.
The relative elevation of viewed objects can be obtained from a regressionanalysis of point-cloud data of viewed locations. Spatial behavior of the samplesproduces a mass data. Two minutes of viewing on the part of one usergenerates about 60,000 spatial point-cloud data arrays. 82 samples will generateapproximately 4,920,000 groups of data. Therefore, it is a major task to analyzethe mass of accumulated data. In this paper, we used SQL (Structured QueryLanguage) to extract elapsed viewing time and the height of viewed point fromtheMDB database. Regression analysis of the eye-tracking data is then performed,with elapsed viewing time on the X axis and height on the Y axis. Analysis resultsindicate that the average height of the viewed point is 3.82m for professionalsubjects, 1.83m higher than 1.99m calculated for inexperienced subjects. At thesame time, the regression lines of the two datasets are approximately horizontal,as shown in Figure 4.
• Subjects with a background in architecture. Professional users’ eye movementspatial behavior summary thermograms show a total of 45 hotspots, theeye-tracking data shows that their attention is primarily concentrated on thewooden bucket arch, the cornice, the window, the portico and the memorialarch. Based on the height of the point of view of the scattered regressionanalysis�the samples with a background in architecture has a high sight point,and the height amounts to 3.83 m in average. And they are more interestedin the second-floor features, as shown in Figure 4(a). According to protocolanalysis, their attention is drawn to the red brick, the roof, the window, and

438 L.M. ZHANG, T.S. JENG AND R.X. ZHANG
the memorial arch. The samples with a background in architecture paidmore attention to the second-floor features. And they extracted more featuresin average. This observation is especially true for the local samples witha background in architecture, compared with the non-local subjects. Theeye-tracking data of two expert samples indicates that over 73% of their timewas spent on the second-floor objects. According to the protocol analysisresults, the expert samples think that the features of southern Fujian street spaceare concentrated in the top of roof and chapter.
• Subjects without an architectural background. The eye-tracking data showsthat their attention is primarily concentrated on the colonnade, the woodenbucket arch, the lantern, the memorial arch and nostalgic objects. Accordingto protocol analysis, their attention is mostly focused on red brick, coloreditems, the arcade and the memorial arch. The samples without a backgroundin architecture has a low sight point, and the height only amounts to 1.98 min average, as shown in Figure 4(b). Most of these subjects concentrate theirattention on the first floor and are very interested in nostalgic objects used indaily life. They can quickly identify architectural features in the first floor butpay little attention to the features in the second floor and above.
Figure 4. Sight point height comparison of samples with or without a background inarchitecture. Their sight point height is 3.82 m and 1.99 m in average, respectively, thedifference being 1. 83 m. The average height of sight point of professional users is muchhigher than those of naive users. The regression line calculated for professional subjects is
Y=0.0006x+364.61. The regression line calculated for inexperienced users isY=0.0005x+184.76.
The samples with a background in architecture pay more attention to thesecond-floor architectural features than the samples without a background inarchitecture and they have little interest in the first floor. This finding can beattributed to the fact that those with professional training are more likely to

INTEGRATION OF VIRTUAL REALITY, 3-D EYE-TRACKING, ANDPROTOCOL ANALYSIS FOR RE-DESIGNING STREET SPACE
439
have their attention drawn to spatial combinations and aesthetic elements of thestreet space. For example, a series of gridded windows on the second floorcharacterized by conciseness and appropriate scale attracted the attention of 75.3%of the subjects. Attention distribution of local subjects is almost the same as thatof non-local subjects.
Samples without a background in architecture. demonstratemore interest in thefirst-floor features and nostalgic objects of daily use; they appear to have a tastefor basic characteristics of the traditional street space in southern Fujian. Thispattern is best explained by the fact that the traditional architecture of southernFujian is easy to relate to. Although they cannot appreciate the profound aspectsof architecture, the general public can properly understand the basic elements. Forexample, the samples without a background in architecture have little interestin the second-floor features and tend to be attracted by nonconforming factorslike awnings and water pipes in disorder. But they understand the first-floorarchitectural features as accurately and quickly as samples with a background inarchitecture. They also pay a lot of attention to red brick, the colonnade, andthe bucket arch. Meanwhile, the nostalgic objects associated with daily life doarouse the people’s homesickness. Many of the samples without a background inarchitecture view the nostalgic objects on the first floor (bike, bamboo chair andcouplet), associating them with personal experience.
The understanding of street space varies between architects and the generalpublic, especially when it comes to the historical street scene. For architects totune in to the public’s aesthetic appreciation is essential to design and conservationof street space. In the Production of Space, Lefebvre (1974) distinguished betweenarchitectural space and the space of architects. In his opinion, architecturalspace benefits from the people’s experience and it is one of the ways to producesocial space. The space of architects refers to the space manipulated by theprofessional practice of architects. According to Lefebvre, the space of architectsis neither neutral nor innocent, because the graph plot training and all of theother training that architects receive privilege visual perception over that of othersensory organs. In this context, the dominance of the visual sensation ismaintainedfor extended periods of time and the extraordinary scene becomes a substitute forreality, separate from the aesthetic appreciation of the general public (Lefebvre,1991). Hence, it is important to understand conservation and design of elementsof spatial characteristics in the traditional street space of southern Fujian fromthe perspective of both architects and non-architects; eye-tracking and protocolanalysis technologies potentially provide these different perspectives.
5. CONCLUSIONIn summary, the paper reports on the implementation of a visual thinking methodthat relied on 3-D eye-tracking technology integrated in the VR headset. Using thistool, the experimental study of 82 subjects identified the visual components andpatterns that capture people’s attention in the context of traditional preservationsite, a virtual rendering of the Hong Kong Street in ancient Zhangzhou (Fujian,China).This analysis was supplemented by a protocol analysis that interrogatedsubjects as to which features they focused their gaze on and why. Experimental

440 L.M. ZHANG, T.S. JENG AND R.X. ZHANG
subjects included architects, non-architects and the people with different culturalbackgrounds, who perceived different elements of the virtual street space. Thearchitects are found to differ greatly from non-architects in terms of theirunderstanding of the simulated traditional street in southern Fujian. The formertends to focus their attention on the second-floor space and understands theformation of streetscape from the perspective of aesthetics. The latter, thenon-architects, are mostly interested in the first-floor space. In addition tothe first-floor features, they are also very interested in the space for daily life,especially the nostalgic elements associated with daily life, which arouse theirhomesickness and memories of home.
Therefore, conservation and redesign of streetscape in southern Fujian doesnot merely involve rebuilding the surface and reusing the space. Instead, itshould fully and systematically accommodate the recognition and understandingof different groups. While embodying the fundamental architectural features,space and material, it should also strive to protect local culture and living space.The findings provide better references for VR-informed design, preservation anddevelopment of renovation of historic urban districts in architectural practice. Asthis paper only shows an example of Hong Kong Street, more work needs to bedone for comprehensive simulation and analysis of the entire historical region.The types of traditional street space obtained from this paper are limited, butthe analytic methodology and conclusion lay the foundation for simulation andexperimentation across a wider region. Meanwhile, the methods and technologiesused in the experimental study can be extended to support the integrated design ofurban space in the future.
ReferencesBesharse, J. and Bok, D.: 2011, The retina and its disorders, Academic Press.Fukuda, T. and Taguchi, M.: 2013, Feature of Users Eye Movements during a Distributed
and Synchronised VR Meeting using Cloud Computing, eCAADe 2013: Computationand Performance #-# Proceedings of the 31st International Conference on Education andresearch in Computer Aided Architectural Design in Europe, Delft, Netherlands, 219-226.
Jacob, R.J. and Karn, K.S.: 2003, Eye tracking in human-computer interaction and usabilityresearch: Ready to deliver the promises,Mind, 2, 4.
Kiefer, P., Giannopoulos, L., Raubal, M. and Duchowski, A.: 2017, Eye tracking for spatialresearch: Cognition, computation, challenges, Spatial Cognition & Computation, 17, 1-19.
Kuo, C.-G. and Jeng, T.-S.: 2008, The Research of Augmented Reality Registration TechnologyApplying on Architecture and Urban Outdoor Guiding Systems – Using “Cultural HeritageGuiding System” and “Invisible Shop Signboard” as Examples, Journal of Architecture, 66,145-166.
Lefebvre, H.: 1991, The production of space, Oxford Blackwell.Meißner, M., Pfeiffer, J., Pfeiffer, T. and Oppewal, H.: 2017, Combining virtual reality and
mobile eye tracking to provide a naturalistic experimental environment for shopper research,Journal of Business Research.
Schrom-Feiertag, H., Settgast, V. and Seer, S.: 2017, Evaluation of indoor guidance systemsusing eye tracking in an immersive virtual environment, Spatial Cognition & Computation,17, 163-183.
Zhang, L.-M. and Zhang, R.-X.: 2015, Analysis of nostalgic elements in organic update ofhistorical street in southern Fujian——Take conservation and design of ancient Zhangzhouas an example, Urban Architecture, 20, 12-13.

Virtual Reality and InteractiveEnvironments

442

VIRTUAL & AUGMENTED STUDIO ENVIRONMENT (VASE)
Developing the Virtual Reality Eco-System for Design Studios
TIAN TIAN LO1 and MARC AUREL SCHNABEL21,2Victoria University of [email protected] [email protected]
Abstract. Virtual Reality (VR) is being revived in major disciplines,including architecture. VR is no longer only employed for basicoperations, such as construction of 3D models, dynamic renderings,closed-loop interaction, inside-out perspective and enhance sensoryfeedback. This paper explains how over the past twenty yearstechnologies and software have evolved that a new eco-system fordesign processes have risen. This paper discusses how students madefull use of both software and equipment in the whole design process;from ideas exploration to site analysis to form generation to designrealization. Students have been exposed to a whole range of digitalsoftware tools in the beginning. As most of them were already familiarwith modelling software, they have in particular been introduced toanimation software, game engines and even 3D documentation softwaresuch as photogrammetry. Most importantly, they were led to IVE. Thepaper points out the benefits of adopting such methodology and thedifficulties faced by the students at the various stages of the designprocess.
Keywords. Design Studio; Virtual Reality; Software andEquipment; Design Exchange.
1. IntroductionThe understanding of VR is constantly changing with the advancement oftechnology. Maver and Alvarado (1999) defined VR as emergent computertechnology for full 3D-simulation. At that time, the most advanced VR equipmentwas huge installation such as CAVEs and panoramic displays (Figure 1, left)to give users a sense of immersive-ness. The equipment usually was not veryconvenient that involved much hardware and required building spaces. Moreover,the interaction with the environment was very restrictive and not much ofdifference compared to working on a monitor. However, such experience waslater used by Schnabel and Kvan (2001) only described as Virtual Environment(VE) and VR are defined as a visualisation technology to create total VE. For thefirst time, immersive VEs were successfully employed to create and communicatearchitectural design in a larger context (Schnabel et al., 2007). At present, VR is
T. Fukuda, W. Huang, P. Janssen, K. Crolla, S. Alhadidi (eds.), Learning, Adapting and Prototyping,Proceedings of the 23rd International Conference of the Association for Computer-Aided ArchitecturalDesign Research in Asia (CAADRIA) 2018, Volume 1, 443-452. © 2018 and published by the Associationfor Computer-Aided Architectural Design Research in Asia (CAADRIA) in Hong Kong.

444 T.T. LO AND M.A. SCHNABEL
no longer only employed for basic operations, such as construction of 3D models,dynamic renderings, closed-loop interaction, inside-out perspective and enhancesensory feedback (Sorguç et al., 2017). VR includes equipment that is compactwith just a simple headset and hand-held pointers although there is an option thatstill requires a certain amount of building space to have manoeuvre capabilitieswithin the environment (Figure 1, right).
Figure 1. (left) The Virtual Environment Lab at Strathclyde University (Maver et al., 2001)(right) The VR Lab at Victoria University of Wellington.
Latest VR equipment allows users to immerse themselves in a virtual socialenvironment with multi-dimensional elements to enrich the design engagement.At the same time, the standard architectural software can easily be visualised inreal-time interactive and social design experiences in a VR realm by innovativegame-based platforms. Building information and other data are linked in real-timethat it enriches and offers additionality within an immersed virtual environment(IVE). This paper reports on an investigation of how integrated use of variousdesign software with VR equipment enhances the design exchange between designstudio tutors and students. We also discuss in depth an eco-system among currentVR software that enriches the workflow of design studios, leading to a muchfulfilling experience. The findings of our research act as a basis for other educatorsof how to blend digital instruments and VR in a design studio setting.
2. VR in Architectural Design EducationThe early nineties saw the emergence of one particular form of designstudio, which investigated various possibilities that digital media and VirtualEnvironments (VE) can offer to the learning and the exploring of architecturaldesign (Kvan, 2001). These Virtual Design Studios (VDS) established virtualityas acting while physically distant or as acting by employing digital tools (Maheret al., 2000). VE was established by choice of design (Achten, 2001), ways ofcommunication (Schmitt, 1997) or digital tools (Kurmann, 1995). Later the VDSdeveloped into real immersion within a VE, the medium for design interactionbeing the VE Design Studio (VeDS) (Schnabel, 2002). The advent of Web 2.0technologies pushed the next logical step to develop the VDS with collaborationwithin a social learning environment. Ease of communication, leadershipopportunity, democratic interaction, teamwork, and the sense of community are
VIRTUAL & AUGMENTED STUDIO ENVIRONMENT (VASE) 445
some of the improved aspects that are offered by Social Networks (SN) (Owenet al., 2006). Mitchell (1995) also refers to the need for an ongoing evolution ofthe VDS towards a fully integrated studio where the borderlines between realms,professions, tools and mode of communications are dismantled. Subsequently, theadvancement of VDS moves design education beyond conventional boundariesand curricula, engaging participants socially from diverse professional fields. Thisfurther leads to the Social Network VDS (SNVDS) which is subsequently thesuccessor of the VDS enabling novel frontiers that enhance the deep learningwithin an interprofessional realm (Schnabel and Ham, 2012).
With the development of better and more immersive VR equipment, theexperience and methodology of VR in the design studio is changing. Althoughstudents taking up architecture design courses use a broad range of software to pushthe boundary of their creativity, the introduction of VR-specialised software andhardware into the design studio changed the way students interact with their design.The students also faced a different type of challenge in the design process. Still.our research has found that by employing real-time social VR as a pedagogicalapproach there is an increase of the efficiency in design communication anddesign understanding for designers. Architecture students regularly build physicalscaled-models to better experience the spatial qualities of their designs. Still,such models only provide a limited impression of their design and not enoughto fully understand the extent of the practicality of their designs. Moreover,with the increase in design complexities, the time that is necessary to build thephysical models, are no longer considered as sustainable.option This leads to theadaptation of IVE. Using IVE allows students to fully immerse themselves intheir designed environment and experience first-hand the spatial quality that theirdesigns provide.
3. The Eco-system of the Design ProcessMaver and Petric (2003) suggested that within the context of design studios, thedesigners (D) being the centre of the design process among technologies will offera rich set of opportunities (Figure 2, left). The technologies that involved thenwereonly computer graphics (CG), rapid manufacture (RM) and laser scanning (LS).Then, Schnabel (2004) proposed a design cycle to expand the digital-integrateddesign process from mental idea to a physical result via virtual and real translation(Figure 2, right). Although the designer may still be the key person handling thedesign process, the focus is not in the technologies but in the various stages of thedesign process and how they can be connected as a loop for an enhanced result. Thetechnologies are simply the tools to help realise and manipulate the design duringthe cycle. The design cycle dismantled the boundaries between the real and theVE to the extent that each crossed over to the other. VE can be an environmentfor design distinguishable from other tangible tools and yet facilitate tangible andreal products.

446 T.T. LO AND M.A. SCHNABEL
Figure 2. (left) Relationship of designer (D) to the technologies (Maver and Petric, 2003)(right) Design cycle (Schnabel et al.,2004).
However, there is still a gap between the imagination of a design and itsrepresentation, communication and realisation: architects use a variety of toolsto bridge this gap. Digital tools are increasingly playing a role in bridging thisgap yet the translation from physical to digital often poses a major barrier. Itis common for students to use only the software that they are most familiar, atypical linear design process is using one software for a particular design purposeat different stages (Figure 3). This research, therefore, proposes a pedagogicalmodel that let students use VR software and equipment as crucial part of theirdesign engagements, allowing students to break free of this linear process andmade use of a variety of resources in a very dynamic manner to reach their finaldesign outcome.
Figure 3. Linear design process.
The idea of an eco-system is inspired by nature. In biology, an ecosystemis the connections between a community of plants and animals interacting witheach other in a given area, even with the non-living environments such asweather and soil (Encyclopædia Britannica). Linking the constituents within theecosystem are the flow of energy and the cycling of nutrients. Using the sameconnotation, in the context of design, the eco-system model that this research isproposing involved the connection between the software, hardware, users, and theintangible purpose/functionalities. There is only one key factor that is linking thiseco-system; design creativity. With the increasing capabilities and complexities ofdesign software, Maver’s concept of designers being at the centre and Schnabel’sidea of a design cycle can no longer keep up with the changing flow of creativity.The abundance of tech gadgets allows general users to be involved in the designprocess, making their role almost on par with the designers. Design creativitycan be generated by any means and design methods like ‘digital transformation’need not be followed by ‘virtual manipulation’ in the form of a cycle. Therefore,

VIRTUAL & AUGMENTED STUDIO ENVIRONMENT (VASE) 447
the pedagogical model in the form of an eco-system is needed to expand thecurrent understanding in order to comprehend the new technologies into the designstudio. Figure 4 shows the intricate connections between the design software.Each software has its specialise function for a design purpose, although theyare also capable of many other features, it is usually better to use software thatspecialises in a specific task. For example, SketchUp is mainly used for designexploration and formmaking, but it is also capable of generating sections and plansfor documentation. However, the plans and sections are unable to be as detailedas those that are produced in AutoCAD. But again, by generating the plans andsections in SketchUp and import them into AutoCAD save a tremendous amountof time to redraw everything from the beginning. This interoperability is the keyto the connectivity between the software.
Figure 4. Dynamic Eco-system of the design process expanded from the conventional designprocess.
The connectivity between the software is the crucial factor that leads to theproposed eco-system. With the development of BIM software such as Fuzorthat are capable of syncing model information with design modeling softwareand linking with VR hardware, design exploration is made possible within animmersive virtual environment. Tile Brush by Google took a leap forward

448 T.T. LO AND M.A. SCHNABEL
allowing designers to sketch in an immersive 3D virtual environment. Digitalmodels can be imported into Tilt Brush from other modelling software to acts asthe context for designers to start designing from (Figure 5, left). Innes (2017)then developed a system using Unity which allows designers to build geometryand manipulate them accordingly which is very similar to SketchUp, the onlydifference is that the operations are handles with the designers totally immersedin the VE (Figure 5, right). In general, it is not hard to observe that there alreadyexist a certain form of eco-system. As described by Sorguç (2017), VR can be usedeven for the initial stage of design exploration. With the constant development oftools such as the one by Innes, the creative flow is breaking out of the conventionallinear design process.
Figure 5. (left) Digital sketches made to an imported model of a ship in Tilt Brush (Dachis,2016) (right) Creation of geometry in the VR application (Innes, 2017).
4. Design StudioA design studio is conducted to demonstrate the dynamic eco-system of thedesign process. Based on the methodology of a conventional VDS and followingAristotle’s concept of phronesis or practical wisdom (learning to judge when andwhere to put skill or knowledge into action) and drawing upon the arts to facilitateacquisition of knowledge (Dahlman, 2007), this design studio was set up toteach students the skills required for successful consultancy and interprofessionalcollaboration. This architectural design studio presented here is a core first-yeardesign unit in the Masters’ programme at Victoria University of Wellington(VUW). The studio operates in an on-campus mode with eleven students. Thestudents were introduced to a design brief which is to design a railway station forthe development ofWellington. TheWellington City Council (WCC) provided theaims and requirements that they are looking for in the design brief. The studentswere given the freedom to choose any site along the proposed railway tracks. Theycan use the software they were familiar with or explore new design tools but theyneed to fulfil one important component of the design studio; integrating the use ofVR tools in the design process.
4.1. VUW VIRTUAL AND AUGMENTED STUDIO ENVIRONMENT (VASE)
A new Virtual and Augmented Studio Environment (VASE) has been establishedat VUW to push this frontier into the design studios. It has several large sizemonitors (Figure 6, left) that can be used for design presentation and virtual

VIRTUAL & AUGMENTED STUDIO ENVIRONMENT (VASE) 449
communication. A few of the screens can be connected to provide the IVE thatMaver has used in his lab in Figure 1 (left). It is also equipped with Virtual,Augmented and Mixed Reality (VAM) hardware such as several HTC Viveheadsets, Microsoft Hololens, and Hyve3D (Figure 6, right), an immersive designand visualization system.
Figure 6. (left) Large size monitors used for presentation and virtual communication (right) Auser interacting with Hyve3D.
Hyve3D is an instrument that allows social interactions within VR. Itdiffers from CAVEs, allowing collaborative and real-time sketching in 3D. Theadvantage of Hyve3D is that users do not need headsets and the setup allowsshared interactions with 3D models inside an immersive environment withoutnecessitating a complex graphical user interface (Schnabel et al., 2016). Mostimportantly, Hyve3D allows imports of models (OBJ format) and export thesketches done to other software (DXF format). This expands the connectivity ofthe software in the eco-system.
4.2. DYNAMIC DESIGN WORKFLOW BY STUDENTS
The students who took our design studio were overwhelmed by the expandedamount of software and hardware presented to them. They started the designprocess with their familiar software and hoped to achieve the aim of the designbrief. However, the studio requires the students to generate a narrative experienceof their design and allow people without much architectural technology knowledge(in this case, the WCC personals) to interact with their design. The studentsrealised that the conventional tools could not fulfil the aim and started venturinginto the VR tools and equipment.
One student, Jessie Rogers, pushed the concept of the eco-system to quite agreat extent. She started off with a pedestrian simulation using Quelea, a pluginfor Rhino3D to do agent-based simulation. Then, she went on to try scripting inGrasshopper to generate random drawings from images of graffiti arts. From thoseexplorations, she decided to try manual sketching of lines using Hyve3D. In theend, she combined the qualities of the outputs to generate a design (Figure 7) thatis very technically driven and architecturally refined.

450 T.T. LO AND M.A. SCHNABEL
Figure 7. Design process and outcome by Jessie Rogers.
Another student, Duong Nguyen, became deeply engaged with the VRtechniques and tried to integrate his material exploration into the design. He startedoff by trying the various VR tools and work with physical materials. He made useof photogrammetry to mimic the random organic form he created with the physicalmaterials. He also went into scripting in Grasshopper with the intention to givehis organic form a quantifiable mechanism. As he faced tough challenges in thedesign process, he eventually went into using Google Tile Brush to ‘draw’ hisdesign ‘manually’ in a total IVE (Figure 8).
Figure 8. Design exploration and outcome by Duong Nguyen.
5. DiscussionBy observing the students challenging themselves to integrate the VR toolsand equipment into their conventional design method, we believe that a neweco-system for design processes have risen. The increase of VR tools suggests thatMaver’s concept and Schnabel’s design cycle needs to be expanded for educatorsand students alike to embrace the growing software complexity to handle designcreativity in design studios. Duong’s ambition towards duplicating his physicalexploration digitally might have resulted in quite a chaotic outcome. However,the quality of his work is not in the design outcome, but the exploration process.His constant move from physical to virtual techniques is what constitutes the

VIRTUAL & AUGMENTED STUDIO ENVIRONMENT (VASE) 451
eco-system. The challenge to close the gap between the real and the virtual stillexists even with the help of VR tools. However, if more time is given to him,there is an opportunity that a certain flow within the complexity of the eco-systemcould help him achieve his goal. Jessie’s effort in trying out the various toolsand exploring all the possibilities of VR has not only enabled her to generate adistinct design outcome, but also expanded her means to present her ideas throughdigital narrative. She was able to make use of VR tool to engage the audienceto experience and interact with her design immersively in the VE. The WCCpersonnel was very impressed with her output and published her design to allowthe general public to also experience her design immersively. The VR tools givethe capability that WCC needs; interaction with the public and gaining usefulfeedback.
5.1. TOWARDS SOCIAL NETWORK VE DESIGN STUDIO (SNVEDS)
Previously, Schnabel (2012) has established how SNVDS can enhance deeplearning within an interprofessional realm. With VR and its capability forcollaboration within a social learning environment, we believe that can easilylead to the establishment of a Social Network VE Design Studio (SNVeDS). Thestudents engaged in the design studio make use of the VR technologies to bringtheir design to their fellow students to gain design feedbacks. Lo et al (2015)developed a collaborative VR design tool, ModRule, and engaged a group ofdesigners in a design studio and the outcome was inspiring which brought aboutnew synergies to the process. Although there is still much improvement in terms ofsoftware interoperabilities, the VASE has proven the concept that the eco-systemraised in this research leads to a novel form of immersive and socially engagingdesign studio environment that allows for deep learning to happen.
6. ConclusionThis paper suggests that a VR eco-system exists and is necessary for designstudios to bring out the full potential of VR technologies towards the developmentof architectural designs. It provides educators and students with a designapproach that moves out of the conventional plans, section, elevation and 2Drendered output. This eco-system makes possible the movement of the designtowards multi-dimensional experiences and narratives, allowing immersive socialengagement of the community.
ReferencesAchten, H.H.: 2001, Normative positions in architectural design: deriving and applying design
methods, Proceedings of eCAADe, Helsinki, 263–268.Editors of Encyclopædia Britannica, : 2017, “Encyclopedia Britannica” . Available from <http
s://www.britannica.com/science/ecosystem> (accessed 12 December 2017).Dachis, A.: 2016, “The Incredible VR Painting Experience” . Available from <https://vive.real
ity.news/news/incredible-vr-painting-experience-tilt-brush-adds-greater-control-3d-models-word-game-0173949/> (accessed December 2017).
Dahlman, Y.: 2007, Towards a theory that links experience in the arts with the acquisition ofknowledge, International journal of art and design education, 26(3), 274–284.

452 T.T. LO AND M.A. SCHNABEL
Innes, D., Schnabel, M.A. and Moleta, T.: 2017, Virtual Inhabitation and Creation: AComparative Study of Interactive 1:1 Modelling as a Design Method, Proceedings of 2017National Conference on Digital Architecture Technologies in Architec-tural Educationand Digital Architecture Design Association (DADA), International Conference on DigitalArchitecture, Beijing, 402-408.
Kurmann, D.: 1995, Sculptor: a tool for intuitive architectural design, Proceedings ofCAADFutures, Singapore, 323–330.
Kvan, T.: 2001, The pedagogy of virtual design studios, Automation in construction, 10(3),345–354.
Lo, T.T., Schnabel, M.A. and Gao, Y.: 2015, ModRule: A user-centric mass housing designplatform, The next city - New technologies and the future of the built environment -CAADfutures, Sao Paulo, 325-344.
Maher, M.L., Simoff, S.J. and Cicognani, A.: 2000, Understanding virtual design studios,Springer-Verlag, London.
Maver, T. and Alvarado, R.G.: 1999, Virtual Reality in Architectural Education: DefiningPossibilities, ACADIA Quarterly, vol. 18, no. 4, 7-9.
Maver, T., Harrison, C. and Grant, M.: 2001, Virtual Environment for Special Needs: Changingthe VR Paradigm, Proceedings of the Ninth CAADFutures, Eindhoven, 151-160.
Maver, T. and Petric, J.: 2003, Digital Prototyping in the Architectural Design Studio,Proceedings of the 7th Iberoamerican Congress of Digital Graphics, Rosario.
Mitchell, W.J. 1995, The future of the virtual design studio, in J. Wojtowicz (ed.), Virtual designstudio, Hong Kong University Press, Hong Kong, 51–60.
Owen, M., Grant, L., Sayers, S. and Facer, K.: 2006, “Social software and learning” . Availablefrom <http://www.futurelab.org.uk/resources/documents/opening_education/Social_Software_report.pdf> (accessed 1 February 2010).
Schmitt, G.: 1997, Design medium–design object, CAADfutures 1997: 7th internationalconference on computer aided architectural design futures, Munchen, 3-13.
Schnabel, M.A.: 2012, Virtual design studio within a social network, Journal of InformationTechnology in Construction, 397-415.
Schnabel, M.A., Aydin, S., Moleta, T., Pierini, D. and Dorta, T.: 2016, Unmediated CulturalHeritage via HYVE-3D: Collecting individual and collective narra-tives with 3D sketching,Living Systems and Micro-Utopias: Towards Continuous Designing, Proceedings of the21st International Conference of the Association for Computer-Aided Architectural DesignResearch in Asia CAADRIA, Melbourne, 683-692.
Schnabel, M.A. and Ham, J.J.: 2012, Virtual design studio within a social network, Journal ofInformation Technology in Construction, 17, 397-415.
Schnabel, M.A. and Kvan, T.: 2001, 3-D Maze: Getting Lost In Virtual Reality, Proceedingsof the 5th SIGraDi, Conception, 145-147.
Schnabel, M.A., Kvan, T., Steve, K.S. and Li, W.D.: 2004, 3D Crossover: exploring objetsdigitalisé, International Journal of Architectural Computing, 2(4), 476-490.
Schnabel, M.A., Wang, X.Y., Seichter, H. and Kvan, T.: 2007, From virtuality to realityand back, Proceedings of International Association of Societies of Design Research 2007(IASDR07), Hong Kong, 1-15.
Sorguç, A.G., Yemişcioğlu, M.K., Özgenel, C.F., Katipoğlu, M.O. and Rasulzade, R.: 2017,The Role of VR as a New Game Changer in Computational Design Education, Proceedingsof the 35th eCAADe Conference, Rome, 401-408.

INTERACTIVE VIRTUAL REALITY TOOL FOR BIM BASED ON IFC
Development of OpenBIM and Game Engine Based Layout Planning Tool - ANovel Concept to Integrate BIM and VR with Bi-Directional Data Exchange
ANIRUDH NANDAVAR1, FRANK PETZOLD2, JIMMY NASSIF3and GERHARD SCHUBERT41,3BMW AG1,3{anirudh.nandavar|jimmy.nassif}@bmw.de2,4Technische Universitaet Muenchen2,4{petzold|schubert}@tum.de
Abstract. With recent advancements in VR (Virtual Reality)technology in the past year, it has emerged as a new paradigm invisualization and immersive HMI (Human-machine Interface). On theother hand, in the past decades, BIM (Building Information Modelling)has emerged as the new standard of implementing construction projectsand is quickly becoming a norm than just a co-ordination tool inthe AEC industry.Visualization of the digital data in BIM plays animportant role as it is the primary communication medium to the projectparticipants, where VR can offer a new dimension of experiencingBIM and improving the collaboration of various stakeholders of aproject. There are both open source and commercial solutions to extendvisualization of a BIM project in VR, but so far, there are no completesolutions that offer a pure IFC format based solution, which makesthe VR integration vendor neutral. This work endeavors to developa concept for a vendor-neutral BIM-VR integration with bi-directionaldata exchange in order to extend VR as a collaboration tool than a merevisualization tool in the BIM ecosystem.
Keywords. BIM; VR; IFC; Unity; BIM-VR integration; HMI.
1. IntroductionIn the recent past, VR technology has become more accessible and popular due toadvancements in the field of computer graphics and modern VR hardware. VR asan immersive visualization technology is now available at a consumer level. Asper (Gartner & Gartner 2017), VR was one the forerunner among the technologytrends in the popular Gartner’s Hype cycle.
T. Fukuda, W. Huang, P. Janssen, K. Crolla, S. Alhadidi (eds.), Learning, Adapting and Prototyping,Proceedings of the 23rd International Conference of the Association for Computer-Aided ArchitecturalDesign Research in Asia (CAADRIA) 2018, Volume 1, 453-462. © 2018 and published by the Associationfor Computer-Aided Architectural Design Research in Asia (CAADRIA) in Hong Kong.
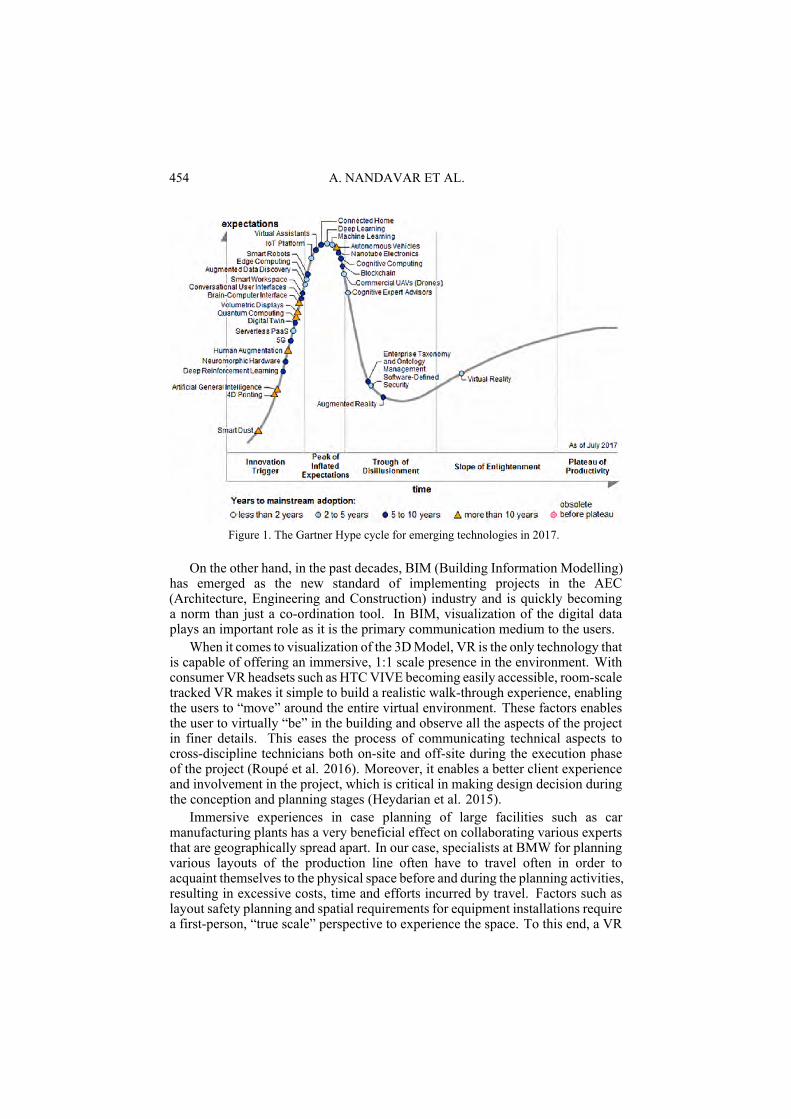
454 A. NANDAVAR ET AL.
Figure 1. The Gartner Hype cycle for emerging technologies in 2017.
On the other hand, in the past decades, BIM (Building Information Modelling)has emerged as the new standard of implementing projects in the AEC(Architecture, Engineering and Construction) industry and is quickly becominga norm than just a co-ordination tool. In BIM, visualization of the digital dataplays an important role as it is the primary communication medium to the users.
When it comes to visualization of the 3DModel, VR is the only technology thatis capable of offering an immersive, 1:1 scale presence in the environment. Withconsumer VR headsets such as HTCVIVE becoming easily accessible, room-scaletracked VR makes it simple to build a realistic walk-through experience, enablingthe users to “move” around the entire virtual environment. These factors enablesthe user to virtually “be” in the building and observe all the aspects of the projectin finer details. This eases the process of communicating technical aspects tocross-discipline technicians both on-site and off-site during the execution phaseof the project (Roupé et al. 2016). Moreover, it enables a better client experienceand involvement in the project, which is critical in making design decision duringthe conception and planning stages (Heydarian et al. 2015).
Immersive experiences in case planning of large facilities such as carmanufacturing plants has a very beneficial effect on collaborating various expertsthat are geographically spread apart. In our case, specialists at BMW for planningvarious layouts of the production line often have to travel often in order toacquaint themselves to the physical space before and during the planning activities,resulting in excessive costs, time and efforts incurred by travel. Factors such aslayout safety planning and spatial requirements for equipment installations requirea first-person, “true scale” perspective to experience the space. To this end, a VR

INTERACTIVE VIRTUAL REALITY TOOL FOR BIM BASED ON IFC 455
tool to enable virtual walk-through, measuring distances & areas and a feature towarn the user of safety risk was developed using Unity Engine and HTC VIVE.The aim is to assist layout planners to review 3D models (BIM models) of the newlayouts under planning in VR. The process of exporting BIM models to a formatcompatible with Unity (FBX or OBJ) is complex, repetitive and most importantly,eliminates the “Information” part of a BIM model. Furthermore, there existed nofeedback from the VR system back to the BIM model in order to document theoutcome of a planning session carried out in VR. To ease this bottle neck andenable an automated, rapid BIM data transfer to Unity engine and backwards, anew approach of communicating between BIM and VR based on IFC was resortedto.
Subsequently, a research on the existing solutions addressing the task ofintegrating VR to BIM was performed, both published literature addressingthe issue of BIM-VR integration and commercial software that offer BIM-VRintegration were reviewed. Though there are a few solutions that support IFCformat, no solution exists, to the extent of our knowledge, that enables a user toperform interactions with model, manipulate the model in VR and synchronize thechanges to the original model, all based on one unified, vendor-neutral platformwhich is based on the OpenBIM philosophy.
The following sections of this paper reports the development of amechanism toexchange data between BIM and VR based on IFC and XML encoding technology.Section 2 outlines the research adopted to arrive at the research questions that havebeen addressed in this paper. It further reports the review of published literatureand state-of-the art software solutions available on the topic of integrating BIMand VR. Section 3 describes the concept and development of our solution as aprototype. Section 4 reports the findings and conclusions that could be drawnfrom this work.
2. ResearchNumerous published literature reporting BIM-VR integration were reviewed inorder to study various applications that necessitated the data exchange betweenBIM and VR and mechanisms that were in-turn adopted. The major applicationsfor adopting VR in BIMwere found to be (a) Spatial familiarization for occupantsand users of the building, (Woksepp and Olofsson 2008), (Bernstein et al. 2014),(Roupé et al. 2016) and (Jones et al. 2017), (b) Effective communication oftechnical aspects to various participants (Heydarian et al. 2015), (Roupé et al.2016) and (c) As a safety evaluation tool, especially for fire safety and emergencyevacuation simulations (Kinateder et al. 2014), (Rüppel and Schatz 2011),(Wanget al. 2014),(Hilfert et al. 2016) and to check risk of falling in construction sites(Dinis et al. 2017).
On the other hand, it was found out that there are two major approaches toachieve the integration of VR to BIM: (a) Integrating BIM data to Game Engines(Yan et al. 2011), (Merschbrock et al. 2014), (Edwards et al. 2015) and (Hilfertet al. 2016) and (b) Using a customized pipeline to render BIM in VR (Johanssonet al. 2014), (Kieferle and Woessner 2015) and (Johansson et al. 2015). While

456 A. NANDAVAR ET AL.
each of them have their own pros and cons, using Game engines as the VR endof the pipeline entails advantages in terms of in-built handling of the graphicsoptimizations and user-interactions with the VR system, (Edwards et al. 2015)presents an extensive argument for adopting game engines for integrating BIMand VR. Unity Game engine has been adopted as the VR end of the pipeline inthis work, owing to the extensive VR interaction authoring resources available asplug-ins to the software and active development support for HTC VIVE.
2.1. LITERATURE REVIEW
Inherently, BIM makes available a lot of non-geometrical data about variousaspects of a building, much in advance. This meta-data needs to be leveragedin immersive visualization of the models to enhance the quality of informationconveyed to the user, which will enhance the experience of the user in immersiveenvironments beyond pure visualization. In presenting a comprehensive overviewof extending BIM into game engines, (Bille et al. 2014) report a dearth in researchon integrating meta-data of BIM into game engine formats.
One of the key constraint with Revit, the most commonly adopted BIMprogram for immersive VR is that it is only available on Microsoft Windowsplatform. During the runtime of a BIM-VR system, it is imperative to accessRevit API for all the geometric and parametric information to be able to establisha bidirectional data exchange. In solving this issue, (Kieferle and Woessner2015) present a novel approach by decoupling Revit from the Virtual Environmentrenderer, in their case OpenCOVER.
A very commendable work in interactive, immersive, VR based BIMvisualizations has been contributed by (Johansson et al. 2014) in form ofa plugin to Autodesk ® Revit. Their system, unlike other similar solutionsis a game-engine independent BIM viewer with high level of graphics-basedoptimizations implemented for viewing large scale BIM models (Johansson et al.2015). The approach is restricted to using Autodesk REVIT as the BIM end of theBIM-VR pipeline, which cannot include collaboration BIM formats like IFC.
A working prototype of a bidirectional communication between BIM programand game engine has been developed and tested using Autodesk® Revit and Unity3D (Edwards et al. 2015). They use a customOBJ class to achieve the data transfer.However, the major issue reported in testing the system is reported to be updatingchanges made in VR scene back to the BIM program based on the custom OBJclass. It can be safely assumed that the root of the problem lies in the differencein the way data (geometric and semantic) is represented in Unity in comparisonto Revit. The work concludes suggesting usage of IFC as a resolution to the issueof communicating back to BIM, emphasizing the potential of IFC in the BIM-VRpipeline.
Hilfert et al. (2016) have developed such an IFC based system, using Unrealengine as the VR platform. However, their system doesn’t address a mechanismto have feedback from the VR end back to the BIM system.
INTERACTIVE VIRTUAL REALITY TOOL FOR BIM BASED ON IFC 457
2.2. STATE-OF-THE-ART SOFTWARE SOLUTIONS FOR BIM-VRINTEROPERABILITY
Revizto (www.revizto.com) is a visual BIM collaboration tool that offers variouscollaborative planning tools for diverse, leading BIM programs available inthe market. It is a software that is aimed at enabling visualization of variouscollaborations in a typical BIM project.
Fuzor (www.kalloctech.com) is one of the most powerful VR solutionsavailable for the AEC industry, which enables multiple user to collaborate theirBIM project on a centralized platform. It offers a live link between Revit and VRseesion, whcih enables the users to manipulate the model on-the-fly in VR.
Autodesk Live for Revit is a cloud-based solution by Autodesk® for enabling“One-clickVR” for BIMmodels in Revit (www.autodesk.com/products/revit-live).It is a subscription based service that can add VR functionality to the BIMmodels. This service is a one-way integration to VR, which lacks on-the-fly modelmanipulation feature and a solution restricted to a particular BIM software.
BIMXplorer (www.bimxplorer.com) is an interactive VR visualization forBIM, which is available as a standalone program and a Revit plug-in. It is capableof importing IFC files directly and hence is a potential VR solution for OpenBIMphilosophy. It offers a direct link from BIM to VR through Autodesk Revit, whichenables the user to make design iterations to BIMmodels on-the-fly. Nevertheless,it doesn’t offer this feature in the satndalone soltion for IFC files.
2.3. SUMMARY OF RESEARCH FINDINGS
• Of the nine published research on immersive, interactive visualization ofBIM, six of them promote using a game engine for rendering the model andinteracting with it.
• Of these nine, five of the works have enabled at least a uni-directional linkbetween BIM and VR.
• Only two of them [(Edwards et al. 2015) and (Kieferle and Woessner 2015)]report a complete bi-directional model data synchronization between BIM andVR, both of which are based on Revit API.
• Only (Hilfert et al. 2016) have provided a completely IFC based BIM-VRintegration. However, the backward link from VR to BIM was not achievedusing this method.
• Though all software solutions support integrating VR into BIM, only Fuzorand BIMXplorer provide a complete data exchange between BIM and the VRtool. However, none of the solutions support such a link based purely on IFC,independent of any particular vendor of BIM software.
3. Solution ConceptThe core concept of the solution presented here is an automated mechanism forbi-directional data exchange of Building Information between native IFC files ofBIM models and Unity engine based on XML encoding. Since game engines usetriangulated geometry to render the 3D content, it is necessary to translate the

458 A. NANDAVAR ET AL.
geometry of the BIM models into such a format. Though majority BIM programsare capable of exporting 3D models to FBX or OBJ file formats, it doesn’t includethe meta-data data attached to the 3D model. Lastly, to enable manipulating the3D model and synchronize it to the original model, it is necessary to communicatewith the IFC files and register the changes, which establishes the closed-loop dataexchange from VR to BIM.
There are four major tasks to realize this mechanism:1. Transfer of geometry from the BIMModel to Unity as procedural polygons, along
with the object specific information (meta-data) as textual content.2. Rebuilding the model in Unity with correct mapping of object data to its geometry.3. Enabling VR visualization and user interactions with the re-generated geometry.4. Synchronization of user generated changes to the model in Unity with the original
BIM Model
To realize task (1), we have developed a program using the xBIM Toolkit, whichis an open-source SDK for handling IFC files. The program is capable of parsingthe entire model and generating an XML file with a customized encoding ofgeometric and meta-data of the BIM model in order to be understandable by theUnity engine. It generates what is named as in IFC_VRXML file, which is thesole forward-communication from the BIM system to the VR system. Task (2) ishandled by a custom C-sharp class in Unity, which rebuilds the 3D geometry withthe same hierarchical structure of the BIM model. Task (3) is accomplished by aset of C-sharp classes in Unity, which handle all the user-VR system interfacing.They also rely on the IFC_VRXML file to query and fetch the object-specificdata to users during run-time. Task (4) is accomplished by class in Unity whichgenerates another XML file summarizing all themanipulations to themodel, whichis subsequently parsed by another xBIM based program that registers all thechanges to the IFC file. In the end a new IFC file with all changes registeredto the original model is compiled with a nomenclature that suffixes a time-stampto the original name for the purpose of version-tracking the model.
4. System DescriptionThe system is mainly composed of 2 layers, viz. the Unity engine Layer (UeL)which represents the VR end of the system and the xBIM layer (xBL), interfacedby customized XML files that exchange the data back and forth. UeL representsthe C-Sharp classes that handle the task of parsing the IFC_VRXML file, handlingthe user inputs for navigating in the VR scene, querying BIM information,manipulating models and finally a class that translates all the changes made tothe model into an XML file, named the Changes_XML file. On the other hand,xBL represents the calss which parses the IFC file and compiles the IFC_VRXMLfile and the class that parse the Changes_XML file to register the changes to theIFC file and compile a new IFC file.
IFC_VRXML file is an XML file with a customized structure thatencapsulates all the relevant information about of a BIM model required in theUeL. Geometric information like the triangulation data of an element along withmeta-data such as the property sets and material quantities are encoded as children

INTERACTIVE VIRTUAL REALITY TOOL FOR BIM BASED ON IFC 459
nodes of each model element. Attributes such a the element ID and flags, whichprompt the UeL to understand the element hierarchy and mesh-generation areattached as well. The entire file mimics the parent-children hierarchy of the BIMmodel in order to preserve the hierarchy in the Unity VR scene.
Changes_XML file is also a customized XML file which helps incommunicating from the VR end of the system with the IFC file. The elementID of building elements that have been manipulated are listed as child nodes ofrespective nodes that that specify the nature of manipulation (e.g. moved anddeleted elements). A custom class in xBL processes this information and appliesthe respective changes to the original IFC file (BIM model).
Figure 2. Illustration of the mechanisms. (L) converting IFC into Unity VR Scene (R)Translating changes from VR scene to IFC.
4.1. FEATURES
With layout planning as the purpose, a few features to test the concept have beenimplemented in the prototype of the developed mechanism. The current version ofthe prototype is capable of 6 main features, viz. (1) Walk-through feature, whichlets the user explore and familiarize himself with the building, complete with awarning system if a user is vulnerable to falling. (2) Measurement feature, whichallows the user to mark any number of points and measure distances (in case ofonly 2 points) and areas. (3) Element Query feature, which fetches the meta-dataattached to the building element chosen and displays it on a virtual UI board tothe user. (4) Element relocation, which allows the planner to edit the layout bymoving elements (5) Element deleting, which enables deleting an element in orderto edit the layout. Finally, (6) Issue tracking feature, which allows the user tomark an issue, mark the Point of Interest (PoI) and click a snapshot of the situation.Furthermore, the user can leave voice messages a comments about the issue.
On ending a VR session, the manipulations to the scene (Element relocation,deletion) are synchronized and a new IFCmodel is generated in the same directoryas the original file. The issues marked are stored and available to review (untildeleted) in further sessions.

460 A. NANDAVAR ET AL.
4.2. PERFORMANCE
The prototype was tested with nine different IFC models categorized as explainedin the table 1. The System was tested for Geometry retainment, import speed andinteraction responsiveness. The following outcomes were observed:
• High speed of importing the BIM models to Unity (Model with >4000geometric elements in 45 seconds on a standard VR-ready gaming PC)
• High rate of retention of geometries (measured as a ratio of no. of geometriesin BIM model to no. of visible geometries regenerated in Unity scene ) : 0.991(average)
• Quick response to Information query: ca. 1 Second (average)• Very complex geometric shapes (3D object) were retained• After ending the VR session, all relocation and deletions of building elements
were reflected in the new IFC file generated• A compilation of all the features and performance of the
system is available as video under the following link:https:drive.google.com/open?id=0ByTXTd12UtbHQlAtVDRCdTVIQlU
Table 1. Categories of IFC test models.
Figure 3. Features implemented in the prototype.

INTERACTIVE VIRTUAL REALITY TOOL FOR BIM BASED ON IFC 461
Figure 4. Complex geometries recreated in Unity from IFC_VRXML file.
5. Conclusion and further workThe mechanism developed in the current work lays the foundation to build uponfor developing an OpenBIM philosophy oriented integration of VR to the BIMecosystem. The prototype fared well in the testing stage and provided a quick,automated way of importing BIM data into VR environment based on the IFCformat. Furthermore, it enabled a range of interactions with the BIM model in theVR environment, making it potentially useful as a layout planning tool. Since thesolution is based on a game engine, it has the advantage of incorporating the agile,state-of-the art advancements in the VR technology with great ease. Followingwere the key capabilities of the system:
• Information-enriched, interactive VR• Design Iterations in VR &• Mechanism to synchronize design iterations to original model• In the process, a custom UI class for using HTC VIVE Hardware in Unity has
also been realized. It is capable of accommodating future addition of featuresand is also under constant improvement based on user feedback.
The solution provided here is unique in terms of complying with the OpenBIMphilosophy. It offers a better range of interactions and functionality than thecurrent best solution that is available for importing IFC models to VR. Anyhow,unlike the commercially available BIM-VR solutions it lacks the capability tohandle very large BIM models and is yet to achieve a high-quality rendering ofthe model in VR
The system described here is under development and all the authors are activelyinvolved in the process. Features such as enabling multi-player support overnetwork , possibility to resize and add new elements to the model and integratingBCF support will be realized in the upcoming prototypes. We also take theopportunity to declare no conflicts of interests and ideas in publishing our work.
ReferencesBernstein, H.M., Jones, S.A., Laquidara-Carr, D. and Russo, M.A.: 2014, The business value
of BIM for construction in major global markets,McGraw Hill Construction, 60.

462 A. NANDAVAR ET AL.
Bille, R., Smith, S.P., Bille, R.J., Smith, S., Maund, K. and Brewer, G.: 2014, ExtendingBuilding Information Models into Game Engines, 2014 Conference on InteractiveEntertainment, Newcastle, NSW, Australia, 1-8.
Dinis, F.M. and Martins, J.P.P.: 2017, Virtual and Augmented Reality game-based applicationsto Civil Engineering Education, 2017 IEEE Global Engineering Education Conference(EDUCON), Athens, Greece, 1683-1688.
Edwards, G., Li, H. andWang, B.: 2015, BIM based collaborative and interactive design processusing computer game engine for general end-users, Visualization in Engineering, 3(4), 4.
Gartner, A.A.F. and Gartner, R.v.d.M.: 2017, “Gartner’s 2016 Hype Cycle for EmergingTechnologies Identifies Three Key Trends That Organizations Must Track to GainCompetitive Advantage” . Available from <http://www.gartner.com/newsroom/id/3412017>.
Heydarian, A., Pantazis, E., Gerber, D. and Becerik-Gerber, B.: 2015, Use of immersive virtualenvironments to understand human-building interactions and improve building design,Communications in Computer and Information Science, 528, 180-184.
Hilfert, T., König, M., Das, M., Cheng, J., Kumar, S.S., Edwards, G., Li, H., Wang, B.,Grabowski, A., Jankowski, J., Hudson, T., Manocha, D., Cohen, J., Lin, M., Hoff, K.,Zhang, H., Merchant, Z., Goetz, E.T., Cifuentes, L., Keeney-Kennicutt, W., Davis, T.J.,Roupé, M., Bosch-Sijtsema, P., Johansson, M., Rüppel, U., Schatz, K., Sampaio, A.Z. andMartins, O.P.: 2016, Low-cost virtual reality environment for engineering and construction,Visualization in Engineering, 4(1), 2-2.
Johansson, M., Roupe, M. and Tallgren, M.V.: 2014, From BIM to VR - Integrating ImmersiveVisualizations in the Current Design Process, Fusion - Proceedings of the 32nd eCAADeConference - Volume 2 (eCAADe 2014), 195, 261-269.
Johansson, M., Roupé, M. and Bosch-Sijtsema, P.: 2015, Real-Time Visualization of BuildingInformation Models (BIM), Automation in Construction, 54(6), 69-82.
Jones, S.A., Laquidara-Carr, D., Lorenz, A., Buckley, B., Katharine, L. and Barnett, S.: 2017,The Business Value of BIM for Infrastructure 2017, Dodge Data & Analytics.
Kieferle, J. and Woessner, U.: 2015, BIM Interactive - About Combining BIM and VirtualReality A Bidirectional Interaction Method for BIM Models in Different, Real Time:Proceedings of the 33rd eCAADe Conference, Vienna, Austria., 1, 69-75.
Kinateder, M., Ronchi, E., Nilsson, D., Kobes, M., Müller, M., Pauli, P. and Mühlberger, A.:2014, Virtual Reality for Fire Evacuation Research, Computer Science and InformationSystems (FedCSIS), 2014 Federated Conference on, 2, 319-327.
Merschbrock, C., Lassen, A.K. and Tollnes, T.: 2014, INTEGRATING BIM AND GAMINGTO SUPPORT BUILDING OPERATION: THE CASE OF A NEW HOSPITAL, Norskkonferanse for organisasjoners bruk at IT, 22, 1.
Roupé, M., Johansson, M., Viklund Tallgren, M., Jörnebrant, F. and Tomsa, P.:2016, Immersive visualization of Building Information Models, Living Systems andMicro-Utopias: Towards Continuous Designing, Proceedings of the 21st InternationalConference of the Association for Computer-Aided Architectural Design Research in Asia(CAADRIA 2016), 21, 673-673.
Rüppel, U. and Schatz, K.: 2011, Designing a BIM-based serious game for fire safety evacuationsimulations, Advanced Engineering Informatics, 25(4), 600-611.
Wang, X., Truijens, M., Hou, L., Wang, Y. and Zhou, Y.: 2014, Integrating Augmented Realitywith Building Information Modeling: Onsite construction process controlling for liquefiednatural gas industry, Automation in Construction, 40, 96-105.
Woksepp, S. and Olofsson, T.: 2008, Credibility and applicability of virtual reality models indesign and construction, Advanced Engineering Informatics, 22(4), 467-474.
Yan, W., Culp, C. and Graf, R.: 2011, Integrating BIM and gaming for real-time interactivearchitectural visualization, Automation in Construction, 20, 446-458.

THE “NINE-SQUARE GRID” REVISITED: 9-CUBE VR - ANEXPLORATORY VIRTUAL REALITY INSTRUCTION TOOL FORFOUNDATION STUDIOS
JAMES HOPFENBLATT1 and BIMAL BALAKRISHNAN21,2University of [email protected] [email protected]
Abstract. While the original Nine Square Grid problem, developedby John Hejduk and other influential educators, has shown manytime-tested strengths; the value of the foundation studio project reliesstrongly on repetition and iteration. This activity oftentimes can betedious when executed using traditional media. To expand uponthe pedagogical goals of the original Nine Square Grid problem,wedeveloped a virtual reality tool titled ‘Nine Cube VR.’ This tool expandsupon the pedagogical goals of the original Nine Square Grid problem.Our tool takes advantage of immersive technology and its capacityto maximize object and spatial presence to aid in teaching beginningdesign students. Using the Unity game engine for development,zSpace Virtual/Augmented Reality desktop monitor and the HTCVive head-mounted display, we created a multi-platform, easy-to-usekit-of-parts to educate beginning design students in architecture andinterior design foundation design concepts.
Keywords. Virtual Reality; Architectural Education; Interaction.
1. Context & challenge of foundation design studiosAs part of becoming an expert designer, novice architecture students learn thecomplex process of designing in a variety of ways (Cross, 2004). The developmentof an architectural or interior design project goes through a multifaceted andpersonal process that students have to develop and hone as they move throughthe design studio curriculum. Buildings and interior spaces are designed in aniterative manner that takes many types of knowledge, experience, and sensibilityto do well.
The modern architect is expected to be fluent in both digital and analog modesof creation and visual communication. Students can create, visualize, evaluate anditerate through the design process with many tools that they have at their disposal.Sketches, physical models, hand drafting and various digital tools aid in theexternalization of ideas. Additionally, timing is an essential factor in which ideasmust be expressed immediately to a client, to an instructor or oneself, allowingthe process to flow naturally towards completion. In foundation studios, studentsenter a learning environment in which their core competencies are developedin preparation for more advanced design projects. Foundation studios usually
T. Fukuda, W. Huang, P. Janssen, K. Crolla, S. Alhadidi (eds.), Learning, Adapting and Prototyping,Proceedings of the 23rd International Conference of the Association for Computer-Aided ArchitecturalDesign Research in Asia (CAADRIA) 2018, Volume 1, 463-471. © 2018 and published by the Associationfor Computer-Aided Architectural Design Research in Asia (CAADRIA) in Hong Kong.

464 J. HOPFENBLATT AND B. BALAKRISHNAN
focus on introducing 3-dimensional composition, development of a sense of scale,graphical representation, and visual communication skills. Foundation studios areoftenmore structured than advanced studios in the design curriculum to let studentsfocus on select aspects of architectural design while excluding others to keep thechallenges manageable.
1.1. TECHNOLOGY AND DESIGN EDUCATION
Technology plays a supporting role in a designer’s toolkit. The most cutting-edgesoftware and hardware in-and-of-themselves do nothing without a designermaking decisions with an objective. In the same way, computer-aided design(CAD) tools, 3Dmodeling, and rendering are not very different from sketching andillustrating because they support and facilitate the communication and evaluationof ideas. Sketching isn’t the final product of design in the same sense that a3D model isn’t - they play primarily a supporting role as visualization aids thatfacilitate the entire creative process.
Architecture firms are quickly adapting to the latest construction, simulationand visualization technologies to stay competitive in the ever-growing globaldesign market. When educating a design student in the 21st century, it is essentialthat we prepare students for this technological reality. Many design schoolstoday employ computer numerical control (CNC) routers and 3D printers in theirfabrication laboratories. Energy modeling tools, climate simulation software, andGIS are part of most computer labs as well.
Virtual Reality (VR) has now become affordable and is being embraced bythe design industry for its capacity to accurately visualize physical buildingsat a human scale. Clients are also demanding it because this technology letsthem experience future spaces relatively inexpensively while giving them a strongfeeling of being present and immersed within their project. VR thus allows them tomake more educated, executive design decisions and suggestions to the designers.Virtual Reality is also used in a multitude of fields for training and assessmentprimarily for of its capacity to mimic and control realism parameters freely. Thesedisciplines utilize VR for its excellent ability to simulate spaces and objects toincrease the sense of presence better than previous technology and media. In VR,researchers also get the benefit of being able to measure, track, and customizecontrolled experiences while being able to collect performance data for furtheranalysis (Sun et al. 2017; Indraprastha & Shinozaki 2012).
1.2. FOUNDATION STUDIOS AND THE “NINE SQUARE GRID” EXERCISE
Many different pedagogical techniques help design students grasp the differentfacets of the design process. We can trace many exercises common now infoundation design studios to those developed in the early 1970s by a group ofinfluential design educators such as John Hejduk. These exercises are effectivein introducing students to various aspects of the design process. Hejduk’s (1987)famous “Nine Square Grid” is among them. Hejduk’s exercise focuses on thesyntactical and linguistic aspects of design (Sehgal, 2015). It provides a limitedset of parts (or “kit of parts”) and a variable program for students to follow. It

THE “NINE-SQUARE GRID” REVISITED: 9-CUBE VR - ANEXPLORATORY VIRTUAL REALITY INSTRUCTION TOOL FOR
FOUNDATION STUDIOS
465
gives students a limited kit of parts with several constraints on transformationsand dimensions to maximize pedagogical goals related to composition, form, andrepresentation without overwhelming them. Within these constraints, instructorsare free to adapt and modify the focus of the exercise and better target theirinstructional goals. The capacity of the student to innovate within a limitedcontext also makes this exercise suitable to introduce core concepts of design.The problems that students must solve in these exercises teach them about thefundamental aspects of design. They also begin to comprehend the relationshipbetween 3-dimensional form and 2-dimensional projections through drawings andphysical models.
The “Nine Square Grid” and similar exercises are often explored usingtraditional media such as physical models and hand drawings. Students makemodels out of wood blocks and rubber cement. While this approach has manystrengths, it has two significant limitations. While the value of foundation projectsdepends on repetition and iteration (Kuhn, 2001), these exercises are tedious whenexecuted using traditional media. A student’s effort is more onmodel-making thanon ideation. Also, it is not easy for students to absorb the idea that these smallerscale representations are abstractions of architectural form and space that oneexperiences in real-scale. Thanks to the success of this traditional and adaptablepedagogical tool, there have been previous attempts at replicating it as well asincorporating technology into these exercises.
1.3. POTENTIAL OF DIGITAL TOOLS IN FOUNDATION STUDIO
Kalisperis and Pehlivanidou-Liakata (1998) have shown that digital tools arehelpful for 3-dimensional visualization and can result in more design alternativesunder time constraints. Yazar and Pakdil (2009) initially developed a digitalversion of the nine-square problem. Their tool nGrid consisted of a MAXScriptapplicationwhich allowed the student to designwithin the 3D StudioMax softwareunder constraints like Hejduk’s (1985) assignment. The authors found the tooluseful in allowing students to explore multiple design ideas, more than they wouldhave if they used a real kit of parts. However, nGrid has a few limitations in ourobservation:
• The learning curve involved in learning 3D Studio Max for a beginning designstudent is high.
• The tool’s screen-based, 2-dimensional, mouse and keyboard interaction limitsnatural interaction.
• The inability to explore designs in an immersive environment to truly test3-dimensional composition and experience.
We propose an easy-to-use virtual reality toolkit which introduces to beginningdesign students without needing 3D modeling skills or use of CAD software.Our approach offers an intuitive submersion into the world of iterative design,form-making, and spatial thinking. Our Nine Cube VR “kit of parts” presentsa constrained, 3-dimensional design composition problem to teach syntacticaland spatial relationships through iterative exploration. The Nine Cube VRdigital toolkit enhances ‘spatial presence,’ invites exploration with an intuitive

466 J. HOPFENBLATT AND B. BALAKRISHNAN
interface for interaction and introduces the student to architectural representations,especially orthographic projections.
1.4. PRESENCE
If a critical goal of architecture is to shape human experience through theinteractive exploration of space, then the pedagogical tools should facilitatedeveloping skills for that. It is essential therefore to talk about spatial presence,a concept borrowed from media psychology. Lombard and Ditton define presenceas “the perceptual illusion of non-mediation” (Lombard & Ditton, 2006), whichmeans that one perceives the mediated experience as reality instead of theirimmediate physical environment. In the design process, students experiencevarying degrees of spatial presence depending on the media they use (i.e., physicalmodeling vs. virtual reality). Different media and different representationaltechniques differ in their affordances for enhancing spatial presence. Floorplans and schematic drawings serve organizational planning. Other types ofrepresentations such as perspective drawings and renderings afford an increasedexperiential view of a design. Large screen displays and virtual reality thatprovides a wider field of view and stereoscopy give a more immersive experienceand enhance the sense of spatial presence. Early experiments in integrating virtualreality as part of the design studio (e.g. Kalisperis et al., 2002; Otto et al., 2003)have been received well by the students and continue to gain traction as thesetechnologies become increasingly immersive.
Educators and educational technology designers can improve both thelearning experience as well as the learning outcome by enhancing spatialpresence. Improved spatial presence achieved through increased interactivity andstereoscopy - like those found in modern VR systems has great potential forteaching more nuanced spatial skills when educating beginning design studentswith digital tools (Wang&Kim 2009; Liao 2017). We believe that we can enhancespatial presence in architectural education tools by maximizing affordances forinteractivity which then increases a student’s possibilities for action in theenvironment under design. Similarly, stereoscopy immerses a student in theirproposed design and provides a compelling visual experience and enhances theirsense of ‘being there.’ Virtual reality can overcome the gap that exists betweentraditional methods of representing space and the pedagogical goals related to thereal space they are designing.
2. Nine Cube VRThis paper presents the Nine Cube VR, a digital tool intended for early studioeducation that builds on the original nine-square grid problem. This digital tooltakes advantage of the innovations in stereoscopic 3D displays and interactiveinput devices while retaining the positive qualities of the original nine-square gridexercise which uses traditional media. Our development process for Nine CubeVR digital application started with a detailed needs assessment and underwentmultiple iterations of technology development and usability testing. The NineCube VR application can be deployed across two virtual reality displays: zSpace

THE “NINE-SQUARE GRID” REVISITED: 9-CUBE VR - ANEXPLORATORY VIRTUAL REALITY INSTRUCTION TOOL FOR
FOUNDATION STUDIOS
467
(zspace.com), an interactive, stereoscopic desktop monitor and stylus with sixdegrees of freedom and a head-mounted headset (HTC Vive) with positionaltracking. The primary development platform for the application across bothdisplay devices was the Unity game engine and its built-in scripting environment.It was used for the scripting of all necessary interactive components, theuser-interface interaction and design and implementation of intended pedagogicalconcepts. Figure 1 shows the stereoscopic 3D display of zSpace used by thestudent to create a digital model with a limited kit of parts. The compositionspace is limited to a constrained, 9x9x9 bounding box. Figure 2 shows a studentexperiencing and navigating through the same model in a 1:1, real-world scaleusing the HTC Vive VR display. Figure 5 shows two designs going throughdevelopment in zSpace, followed by the assessment of spatial experience withthe HTC Vive and finally, to a completed physical model.
Figure 1. Student creating composition in stereoscopic, interactive environment.

468 J. HOPFENBLATT AND B. BALAKRISHNAN
Figure 2. Student interacting with environment in real-world scale.
2.1. DESIGN FEATURES AND USER INTERACTION IN NINE CUBE VR
The user interaction with the kit-of-parts in Nine Cube VR is straightforward withsix degrees of freedom on both the zSpace (using a stylus) and HTC Vive VR(using handheld controllers) systems. This stylus allows the user to interact with3D objects in a way that closely resembles how one naturallymanipulates an objectin real life. A simple user interface with logical icons and toggle switches islocated in the bottom of the screen and visible at all times (Figures 3,4). Thepredetermined components come from the original Nine Square Grid kit and arebuilt into the system. Students design with the kit components from the start,and do not spend unnecessary time creating the component pieces by themselvesfrom scratch. The composition area can function as a 3-dimensional, grid-based,orthogonal space where the pieces snap into place or can be toggled to a free-formdesign mode without constraints or boundaries. Once an individual componentis placed within the design environment, a student can use keyboard shortcutsto fine-tune its location and orientation. The bounding grid can be hidden orshown in order to visualize the extents of the permissible design space. Multipleviews(plan, elevation and custom perspective) can be customized and toggled tointroduce conventions of architectural representation as the design process evolves.Furthermore, the stereoscopic displaywith head tracking enables one to experiencethe model from the first-person point of view at all times. Additionally, theNine Cube VR system lets the student experiment with an interactive light whoseposition and color can be changed. This feature provides the learner with the abilityto experiment with color and additive light. More importantly, the finalized modeliteration can be saved and loaded onto the immersive environment that the HTCVive provides. This model can then be experienced at a full architectural scale(Figure 2).

THE “NINE-SQUARE GRID” REVISITED: 9-CUBE VR - ANEXPLORATORY VIRTUAL REALITY INSTRUCTION TOOL FOR
FOUNDATION STUDIOS
469
Figure 3. Nine Cube VR screenshot with feature labels.
Figure 4. Working model showing split RGB lighting experimentation.

470 J. HOPFENBLATT AND B. BALAKRISHNAN
Figure 5. Process from zSpace to HTC Vive to physical model.
3. Usability feedback and future workInitial feedback from studio instructors and students were positive, pointing to thetool’s good potential for improving student’s design skills. We are further refiningthis tool and are currently in the process of integrating it with our foundation studiocurriculum. The application demonstrated its usefulness for creating a variety ofdesign alternatives rapidly in an intuitive fashion. It is also a valuable meansfor teaching lighting concepts, orthographic projections, and ideas of architecturalrepresentations without the necessity of learning complex 3D modeling programs.In future versions, we will incorporate drawing and sketching tools, for example,perspective grids, and silhouette mode for contour drawing exercises to furtherteach students quick prototyping and evaluation techniques with the aid of moderntechnology. On the immersive environment space, we plan on incorporating3-dimensional sketching, multiple actor interactions, collaborative options andthe implementation of building information modeling concepts in the earlystages of design. The user interface can be further optimized and improvedin future versions to integrate gestural interaction. Also, currently all parts arepredetermined and non-modifiable. Future versions can include customizable setsthat the instructor can give to students to meet various pedagogical goals as it wasoriginally intended in Hejduk’s “kit of parts.”
ReferencesCross, N.: 2004, Expertise in design: an overview, Design Studies, 25(5), 427-441.Hejduk, J.: 1985,Mask of Medusa, Rizzoli International Publications, Inc., New York.Indraprastha, A. and Shinozaki, M.: 2012, Computational models for measuring spatial quality
of interior design in virtual environment., Building and Environment, 49, 67-85.Kalisperis, L. N., Otto, G., Muramoto, K., Gundrum, J. S., Masters, R. and Orland, B.: 2002,
An affordable immersive environment in beginning design studio education., Proceedingsof ACADIA 2002, Thresholds Between Real and Virtual: Design Research, Education, andPractice in the Space Between the Physical and the Virtual, Pomona, CA, 49-56.
THE “NINE-SQUARE GRID” REVISITED: 9-CUBE VR - ANEXPLORATORY VIRTUAL REALITY INSTRUCTION TOOL FOR
FOUNDATION STUDIOS
471
Kalisperis, L.N. and Pehlivanidou-Liakata, A.: 1998, Architectural design studio: Digiall andtraditional, in Computers in Design Studio Teaching, Proceedings of the AEE/eCAADeInternational Workshop, Lauven, Belgium, 73-81.
Kuhn, S.: 2001, Learning from the architecture studio: Implications for project-basedpedagogy., International Journal of Engineering Education, 17, 349-352.
Liao, K. H.: 2017, The abilities of understanding spatial relations, spatial orientation and spatialvisualization affect 3D product design performance: using carton box design as an example,International Journal of Technology and Design Education, 27(1), 131-147.
Lombard, M. and Ditton, T.: 2006, At the Heart of It All: The Concept of Presence, Journal ofComputer-Mediated Communication: JCMC, 3(2), 0.
Otto, G., Kalisperis, L. N., Gundrum, J., Muramoto, K., Burris, G., Masters, R., Slobounoy,E., Heilman, J. and Agarwala, V.: 2003, The VR-desktop: an accessible approach to VRenvironments in teaching and research, International Journal of Architectural Computing,1(2), 233-246.
Sehgal, V.: 2015, Formative Studios in Architecture Design: Pedagogy Based on the Syntax.,Creative Space, 3, 83-101.
Sun, C., Qing, Z., Edara, P., Balakrishnan, B. and Hopfenblatt, J.: 2017, Driving SimulatorStudy of J-Turn Acceleration–Deceleration Lane and U-Turn Spacing Configurations.,Transportation Research Board, 2638, 26-34.
Wang, X. and Kim, M. J. 2009, Exploring Presence And Performance In Mixed Reality-BasedDesign Space, inX.Wang andM. A. Schnabel (eds.),Mixed Reality In Architecture, DesignAnd Construction, Springer, Dordrecht.
Yazar, T. and Pakdil, O.: 2009, Role of Studio Exercises in Digital Design Education: CaseStudy of the Nine-Square Grid., Proceedings of 27th eCAADe Conference, Istanbul, Turkey,145-152.


DESIGN GLOBALLY, IMMERSE LOCALLY
A Synthetic Design Approach by Integrating Agent Based Modelling with VirtualReality
XIAORAN HUANG1, MARCUS WHITE2 and MARK BURRY31The University of [email protected],3Swinburne University of Technology2,3{marcuswhite|mburry}@swin.edu.au
Abstract. The last three decades have witnessed the explosion oftechnology and its impact on the architecture discipline which hasdrastically changed the methods of design. New techniques such asAgent-based modeling (ABM) and Virtual Reality (VR) have beenwidely implemented in architectural and urban design domains, yetthe potential integration between these two methods remains arguablyunexploited. The investigation in this paper aims to probe the followingquestions: How can architects and urban designers be informedmore comprehensively by melding ABM and VR techniques at thepreliminary/conceptual design stage? Which platform is consideredmore appropriate to facilitate a user-friendly system and reduces thesteep learning curve? And what are the potential benefits of thisapproach in architectural education, particularly for the design studioenvironment? With those questions, we proposed a prototype in Unity, amulti-platform development tool that originated from the game industry,to simulate and visualize pedestrian behaviors in urban environmentswith immersive design experience and tested it in a scenario-based casestudy. This approach has also been further tested in an architecturaldesign studio, demonstrating its technical feasibility as well as thepotential contributions to the pedagogy.
Keywords. Agent based modelling; Virtual Reality; Urban Design.
1. IntroductionFrom modeling to renderings, from conceptualization to visualization, digitalapplications are ubiquitous amongst architectural industries that now afforddesigners with the opportunity to access and analyze information with acomplexity at an order of speed and depth that wasn’t conceived as being possiblebefore. In urban design particularly, the growing complexity of cities requires newmodeling techniques as traditional approaches are no longer adequate to describecomplicated urban scenarios. (Batty 2007) In this case, agent-based modeling is
T. Fukuda, W. Huang, P. Janssen, K. Crolla, S. Alhadidi (eds.), Learning, Adapting and Prototyping,Proceedings of the 23rd International Conference of the Association for Computer-Aided ArchitecturalDesign Research in Asia (CAADRIA) 2018, Volume 1, 473-482. © 2018 and published by the Associationfor Computer-Aided Architectural Design Research in Asia (CAADRIA) in Hong Kong.
474 X. HUANG, M. WHITE AND M. BURRY
considered one of the applicable methods and has been further developed to adoptdifferent objectives, (Heppenstall, 2011) and has proved useful for design processby suggesting various forms of analytical and statistical evidence (Aschwanden2011).
In most agent-based simulations, particularly in crowd simulation scenarios,the outputs we expected are usually a series of intricate 2D evaluation mapswith corresponding figures and recorded animations. However, we argue thatthe classic post-simulation procedure which follows observation - analysis -design adaption (Aschwanden 2011) can be tuned and further enhanced in threeaspects. Firstly, pattern observation and data analysis are commonly accomplishedtwo-dimensionally that might overlook some crucial architectural properties from3D. Secondly, rules of agents and system are frequently preset and calibratedglobally from a ‘god perspective’ and neglects the engagements in local scale.Finally, a typical simulation offers a series of objective metrics but rarelywell-correlated with subjective aspects like aesthetics, resulting revised modelsmay not be properly integrated with design propositions.
To overcome those issues, we are proposing a new possibility that emergedfrom the available technologies by synthesizing ABM pedestrian simulation withthe Virtual reality devices. Immersive environments become feasible during thesimulation process where local awareness and factors are greatly emphasized andglobal design decisions are further informed.
2. Background2.1. ABM IN ARCHITECTURAL AND URBAN DESIGN
Agent-based modeling is considered as an applicable method to inspect and testincreasingly complex issues and emergent properties. (Macal and North 2007) Ingeneral, ABM is a system that models a collection of autonomous decision entitiescalled agents and described from the perspective of its constituent parts. Thisidea can be tracking back to late 1940s yet, as the procedure of ABM is usuallycomputationally intensive, it has not become widely employed until the 1990s.(Batty 2007)
The early agent-based modeling approaches in urban design were initiated onlarge scales research. In the 1990s, Benenson (1997) and Coates had proposed aseries of planning ABMonGIS platform and soon, in precinct level, more rigorouspedestrian movement simulations were carried out by Batty (1998) based on spacesyntax theory. Since 2000, new techniques and skills have been widely employed.Turner and Penn (2001) crystalized visual graphical analysis (VGA) ABM whichassumes pedestrians’ movement behaviors are dominated by destination selectionand the field of views. In 2008, a synthetic methodology was implemented byAschwanden (2011) where ABM is closely correlated with procedural modelingthat both static and interactive behaviors can be described. To date, somedesign-based lightweight ABM methods have emerged. Pedcatch (Badland andWhite 2013), provides an accessible online platform to evaluate the accessibilityfrom given nodes. Apart from cases mentioned above, many other techniqueshave also been proposed to simulate crowd and pedestrian behaviors, all of which
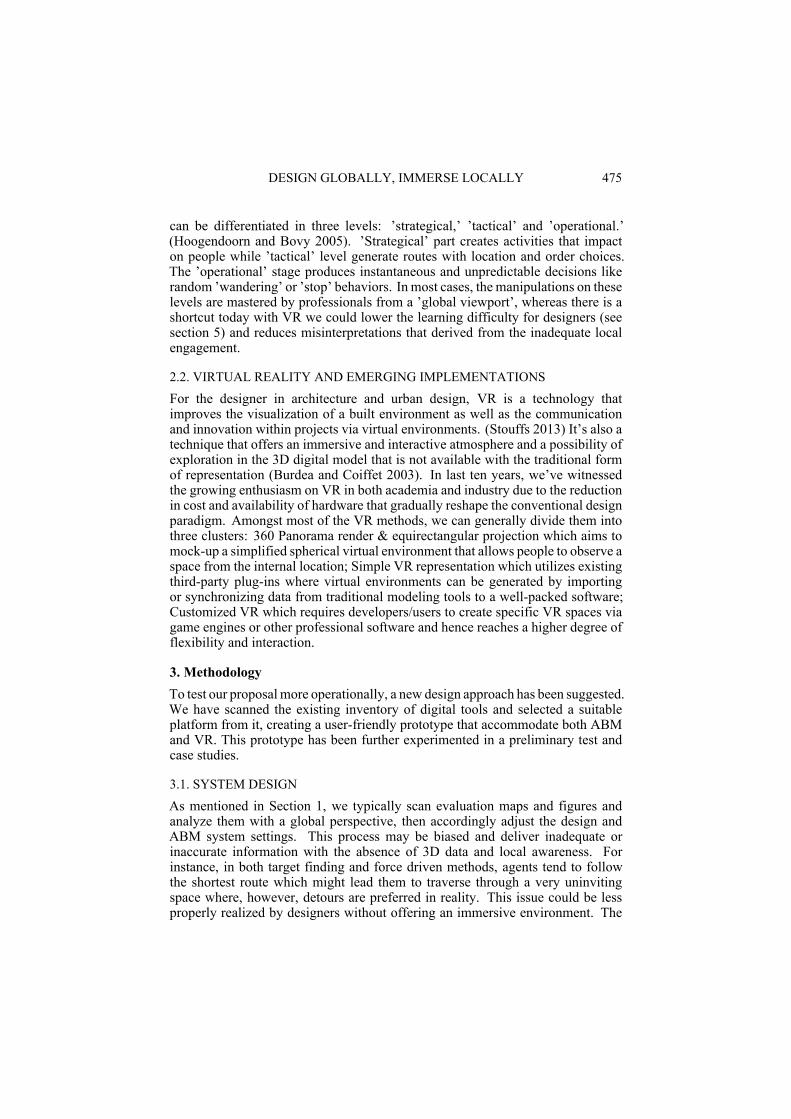
DESIGN GLOBALLY, IMMERSE LOCALLY 475
can be differentiated in three levels: ’strategical,’ ’tactical’ and ’operational.’(Hoogendoorn and Bovy 2005). ’Strategical’ part creates activities that impacton people while ’tactical’ level generate routes with location and order choices.The ’operational’ stage produces instantaneous and unpredictable decisions likerandom ’wandering’ or ’stop’ behaviors. In most cases, the manipulations on theselevels are mastered by professionals from a ’global viewport’, whereas there is ashortcut today with VR we could lower the learning difficulty for designers (seesection 5) and reduces misinterpretations that derived from the inadequate localengagement.
2.2. VIRTUAL REALITY AND EMERGING IMPLEMENTATIONS
For the designer in architecture and urban design, VR is a technology thatimproves the visualization of a built environment as well as the communicationand innovation within projects via virtual environments. (Stouffs 2013) It’s also atechnique that offers an immersive and interactive atmosphere and a possibility ofexploration in the 3D digital model that is not available with the traditional formof representation (Burdea and Coiffet 2003). In last ten years, we’ve witnessedthe growing enthusiasm on VR in both academia and industry due to the reductionin cost and availability of hardware that gradually reshape the conventional designparadigm. Amongst most of the VR methods, we can generally divide them intothree clusters: 360 Panorama render & equirectangular projection which aims tomock-up a simplified spherical virtual environment that allows people to observe aspace from the internal location; Simple VR representation which utilizes existingthird-party plug-ins where virtual environments can be generated by importingor synchronizing data from traditional modeling tools to a well-packed software;Customized VR which requires developers/users to create specific VR spaces viagame engines or other professional software and hence reaches a higher degree offlexibility and interaction.
3. MethodologyTo test our proposal more operationally, a new design approach has been suggested.We have scanned the existing inventory of digital tools and selected a suitableplatform from it, creating a user-friendly prototype that accommodate both ABMand VR. This prototype has been further experimented in a preliminary test andcase studies.
3.1. SYSTEM DESIGN
As mentioned in Section 1, we typically scan evaluation maps and figures andanalyze them with a global perspective, then accordingly adjust the design andABM system settings. This process may be biased and deliver inadequate orinaccurate information with the absence of 3D data and local awareness. Forinstance, in both target finding and force driven methods, agents tend to followthe shortest route which might lead them to traverse through a very uninvitingspace where, however, detours are preferred in reality. This issue could be lessproperly realized by designers without offering an immersive environment. The

476 X. HUANG, M. WHITE AND M. BURRY
new system agenda we proposed aims to enhance whole procedure on differentlevels by utilizing VR techniques, which is particularly beneficial for preliminarydesign stage where flexible and agile design workflow is required. Followingelaborates the correlation between the VR and the original ABM structure (Figure1):
VR & Observation: revealing spatial details and concerns that are omittedbefore like building environments in 3D perspective and immersive walkingexperiences. Delivering multi-level information from not only visual discoverybut also acoustic perception if needed.
VR & Analysis: verifying calibration in both global and local perspective andrevise ABM system accordingly, e.g., wandering force could bemore convenientlyadjusted with the local viewport that we could therefore eliminate the ‘drunkenagent’.
VR&DesignAdaption: it amplifies the sense of scale as well as material, form,and aesthetics, allowing designers to comprehend and revise the built environmentwith a higher degree of profundity.
Figure 1. Comparison between “traditional” ABM and ABM-VR working procedures.
3.2. PREVAILING TOOLBOXES
At present, there are many commercial software for crowd simulations, suchas Oasys and MASSIVE. However most of them offer neither moderate pricethat individual designer can afford nor the potential for further extensions whichin our case, the VR device. On the other hand, for many research projects,open-sourced scripting platforms are extensively used for the free license andrelatively unconstrained possibility they offer. Nevertheless, engaging withthose platforms like Eclipse/Processing and Visual Studio/NetLogo still requireback-end skills of programing which are not common for normal designers.
In this case, we consider game engine as a viable choice where most prevailinggame development apps now contain built-in VR toolkits and modular scriptingfunctions. Unity3D, Unreal Engine4 (UE4) and Autodesk Stingray are now

DESIGN GLOBALLY, IMMERSE LOCALLY 477
most predominant software in the market and offering enough flexibility to adoptdifferent external devices, e.g., HTC Vive and Oculus. Compare with UE4 andStingray, Unity3D might be less powerful regarding the visualization authenticityand suitability to specific software, yet we reckon it is overall more suitablefor testing early-stage architectural and urban design scenarios due the accesibleworkflow, better correlation with ABM and the wider user communities. (Figure2)
Figure 2. Potential ABM-VR synthesized workflows via different toolboxes and protocols.
3.3. PROTOTYPE
The idea and the resulting paradigm we proposed are further tested and verifiedby establishing a digital apparatus in Unity3D which is considerably accessibleand supports most of the VR gears. For the purpose of a better demonstration,we’ve divided our prototype setup into four stages, elaborating how the workingenvironment is being initialized in detail:
1. Model import: Unlike well-defined models in the design developmentstage, VR environment favors meshes with simple definitions, as the renderingrate is around 90fps which require smooth computation. Therefore, in our case, wedidn’t attempt to reach highly detailed representation of buildings at the conceptualdesign stage that in most areas onlymassing and simple texture maps applied whiletrees and other small amenities are inserted from external libraries afterward.
2. Basic environment settings: in this part, we are to set up primary attributesfor the geometric environment, light system, and cameras. We assign static builtenvironments and infrastructures as colliders that assure agents would obey thebasic physics settings; For the lighting environment, baked GI has been selectedsince the sunlight movement is insignificant in our case and it offers a much highercomputation efficiency; Cameras can be set freely according to various designobjectives, including classic top/masterplan view and static local perspectives.Dynamic cameras are designated as child objects with 1.6 meters height underdifferent agent (pedestrian) Prefabs, offering local visions when the simulation is

478 X. HUANG, M. WHITE AND M. BURRY
running.3. Pedestrian system: Unity3D has a powerful scripting compiler that allows
most of the crowd simulations to be realized. The embedded NavMesh functionmakes the target finding method achievable within several clicks while thecore mechanism of Force-driven and Trajectory-based methods are also easilyachievable. What fascinates us more is that different methods and systems cancoexist under the same umbrella where designers can shift from one algorithmto another by simply activating/deactivating several components. Spawning andvanishing area for agents are set as basic geometries which could move or omitsmoothly, while other parameters like agent population and different force factorscan be manipulated by dragging sliders in the inspector panel or customized UI ifneeded.
4. Gear Deployment: In our prototype, two assets (SteamVR and GoolgleVR)are used to empower PC and mobile devices respectively. An Android cellphonewith GearVR can be linked with Unity console via USB protocol and allow peopleto immerse into the environment that an agent can perceive or, switch back to thestatic views for global observation. In the Vive environment, end-user is equippedwith controller alongside with headset which makes it possible not only to observebut also interact with the surroundings.
3.4. PRELIMINARY TEST
In this test, we proposed a simple simulation in the Federation Square, Melbournewith adjacent urban massing models. Agents tend to follow the preset trajectorieswhich are based on pavement positions, yet have the freedom to deviate sincethe VGA has also been applied that places with higher visual accessibility arepreferred. In a typical post-simulation procedure, we interpret space popularitybased on the pattern draw from two-dimensional agent trails and adapt designcorrespondingly. However, as the experience of passing in front of a 5 meterspavilion is different from walking by a highrise, describing 3D urban entities intraditional 2D ABM approaches are often challenging. With the VR environmentthat an agent’s camera offered, designers could receive far richer sourcesintuitively. In the initial test, the place indicated by the red dot on Figure 6 is lessvisited by agents due to the blocked view of its enclosed typology, whereas whenzooming in with 3D perspective we find this space inviting and in fact attracts morepeople in reality. Nevertheless, we should not impute this issue to VGA methodper se yet, at very least, this case demonstrates the significance of introducingstereo perceptions of the built environment that even 3D IsoVist algorithm cannotoffer. By observing the space more properly, we can calibrate agent/NavMeshparameters or create new POI (points of interest) in a more accurate manner.(Figure 3)

DESIGN GLOBALLY, IMMERSE LOCALLY 479
Figure 3. Left: Prototypical test in Unity3D. Agents navigate by both preset trajectories whichbased on pavement positions and visual accessibility analysis. Right: Perspectives are subjectto change between static cameras and individual agent visions where local immersion and
global awareness could be correlated, informing designers with far richer details that couldn’tbe properly realized before.
4. Studio ExperimentsAs vehicles for examining the opportunities of this approach, two scenario-basedcase studies in an architectural design studio were offered, demonstrating itstechnical feasibility as well as the potential contributions to the pedagogy. Inthis studio, students were asked to deliver prompt speculative urban design andarchitectural proposals in a condensed schedule, and engage with multiple digitaltoolboxes including ABM and VR assessing the existing urban form and attemptto weave current urbanism into their own propositions.
4.1. VISUAL CONNECTIVITY
The first proposal emphasized visual connectivity as the design priority byexplored the field of vision at certain points/routes on the site. The studentsintended to increase the permeability of the existing urban blocks in both physicaland visual aspects while limit building height to maintain the view linkage towardsvarious landmarks. A simple agent-based modeling and VR technique have beenimplemented in this project to facilitate their proposition. The pedestrians aredesignated to moving toward to different positions of interest via target findingmethod where both VGA and shortest walk algorithmwere applied. This approachdoesn’t require any long-term training since essential components are alreadypackaged and the user interface is friendly enough that student can master it ina short period. In the simulation, agents are navigated by the NavMesh andcan be observed from both global and local positions while resulting procedurecould be mutually informed from both perspectives. The Vive and affiliatedcontrollers provide a possibility to switch between different agents or even teleportto the designated area if necessary. During the test, multiple urban schemeswere modeled and simulated in an iterative design process to optimize visualaccessibility on different pedestrian paths, while other aspects of scale, form,and function were concurrently discovered and further balanced under the visualpriority agenda. (Figure 4)

480 X. HUANG, M. WHITE AND M. BURRY
Figure 4. Topleft: A zoomed-in view on elevated links between highrises in the Vive goggles.Topright: Immersed in an agent’s view and interacting with the adjacent built environment viaHTC Vive and controller. Bottom: A proposed scenario with stilt blocks and distributed tower
massing to enhance visual accessibility.
4.2. WALKABILITY AND MIXED LAND USE
Walkability is, in general, a measurement that describes how a natural or builtenvironment is “friendly” to walking (Giles-Corti and Donovan 2002) and isbecoming an important objective in many city planning schemes. This projectparticularly focused on one significant aspect that influences the pedestrianexperience, the land use mix (LUM). To evaluate the pedestrian experience, oneof the most widely-used methods is the walkability index (WI) which translatesphysical urban attributes into the readable cumulative indices. However, manyargue that this method doesn’t involve all design elements (Ewing 2009) whichmay bias by simplistic numerical accumulations. Therefore, the students startedtheir proposal with the assessment of WI and reshaped the design (mainly landuse mix) with suggested information and executed crowd simulation with virtualscenarios to inspect and discover potential misconceptions. In the experiment,several areas and routes that with high WI have been selected. Crowds weregenerated in these places and students were able to ‘walk’ along the street theydesigned then fine-tuning streetscapes, as some places might not as good asindicated on the WI map yet favored by optimized route. This time the VRenvironment was powered by Gear VR SDK that could not only applied as atestbed on PC but also used as portable demonstrations strategy by exporting thescenarios into mobile devices. (Figure 5)

DESIGN GLOBALLY, IMMERSE LOCALLY 481
Figure 5. Left: Colored walkability index (WI) map indicates walkability in the selected areawhere green represents lower walking experience. Right: A plaza with surrounding massinghas been revised with the information provided in VR and presented on the dual viewports in
GearVR device.
In this studio, the students presented an in-depth cluster of pedestrian-orientedurban design proposals with the assistance of different ABM-VR approaches.The apparatus built in Unity3D has proved feasible for many participants andabovementioned two projects have articulate that VR technology is a validsupplement for ABM, suggesting the potential to provide 3D information, offerlocal perception and bridge design speculation with the simulation. In addition, thefundamental ideas of the platform can be utilized by students with proper learningreferences while the system manipulation could be achieved without obtaining ahigh level of expertise. The participants showed high enthusiasm when engagedwith those new techniques andwere beneficial by the information suggested duringthe preliminary stage that we believe this design approach could further contributeto broader design pedagogies. (Figure 6)
Figure 6. Left: Guest critics are immersed in the design scenarios via cellphone VR gogglesduring the studio final presentation. Right: Students and tutors use Vive to navigate the agent
and test walking experience in VR.
5. Discussion and ConclusionCompared with the conventional agent-based modeling, this paper investigateda novel design approach by melding VR and ABM technologies, facilitating

482 X. HUANG, M. WHITE AND M. BURRY
pedestrian-oriented design positivelywith the reciprocity between local immersionand global design perception, where an agent-based simulation can be betterinformed than possible in the past. Technical viability today affords architectsand urban designers equipped with powerful toolsets with a convenient workflow,which enables this design approach by utilizing multiple professional platformsand game engines. In this research, particularly, the Unity3D shows substantialpotential to engage with pedestrian simulation, disrupting traditional ABMmodules of observation and analysis by feeding additional information from thevirtual environment and therefore enhancing the design-adaption process.
In addition, the advent of the ABM-VR strategy appears to raise promisingopportunities for the design studio. It changes the ordinary way we teach theABM where complicated operations are demanded. Students could now engagemore efficiently with those digital techniques with preset templates and masterbasic manipulations with less effort. This allows people to concentrate more onthe essence of architectural design - the space and reveals more opportunitiesat the conceptual stage which wasn’t being conceived if ABM is solely applied.However, due to the time limitation. this approach is currently lack of experimentsamples and quantitative comparisons, and we are now proposing more testsand analysis in the futher studies. With this approach, we could envision withoptimism a design shift in the near future that builds more effective bridgesbetween objective modeling/analysis and subjective design speculations, guidingradical shifts in architectural simulation during the next decades.
ReferencesAschwanden, G.D.P.A.: 2011, Empiric design evaluation in urban planning., Automation in
construction, 20.3, 299-310.Batty, M.: 2007, Cities and complexity: understanding cities with cellular automata,
agent-based models, and fractals, The MIT press.Benenson, I. and Portugali, J. 1997, Agent-based simulations of a city dynamics in a GIS
environment, in A.U. Frank (ed.), Spatial Information Theory A Theoretical Basis for GIS,Springer.
Ewing, R. and Handy, S.: 2009, Measuring the unmeasurable: Urban design qualities related towalkability, Journal of Urban design, 14.1, 65-84.
Giles-Corti, B. and Donovan, R.J.: 2002, The relative influence of individual, social andphysical environment determinants of physical activity, Social science & medicine, 54.12,1793-1812.
Hannah, B.a.d.l.a.n.d. and White, M.: 2013, Using simple agent-based modeling to informand enhance neighborhood walkability, International journal of health geographics, 12.1,58-64.
A.J., e.t. a.l. Heppenstall (ed.): 2011, Agent-based models of geographical systems, SpringerScience & Business Media.
Penn, A. and Turner, A.: 2001, Space syntax based agent simulation, Bartlett School of GraduateStudies, UCL.
Stouffs, R.: 2013, What is happening to virtual and augmented reality applied to architecture?,CAADRIA 2013.

SHARED IMMERSIVE ENVIRONMENTS FOR PARAMETRICMODEL MANIPULATION
Evaluating a Workflow for Parametric Model Manipulation from WithinImmersive Virtual Environments
DOMINIC HAWTON1, BEN COOPER-WOOLEY2,JORKE ODOLPHI3, BEN DOHERTY4, ALESSANDRA FABBRI5,NICOLE GARDNER6 and M. HANK HAEUSLER71,4,5,6,7UNSW / Computational Design1,5,6,7{d.hawton|a.fabbri|n.gardner|m.haeusler}@[email protected],3Arup Digital Sydney2,3{ben.cooper-woolley|jorke.odolphi}@arup.com
Abstract. Virtual reality (VR) and augmented reality (AR)provide designers with new visual mediums through which tocommunicate their designs. There is great potential for these mediumsto positively augment current visual communication methods byimproving remote collaboration. Enabling designers to interact withfamiliar computational tools through external virtual interfaces wouldallow them to both calibrate design parameters and visualise parametricoutcomes from within the same immersive virtual environment. Thecurrent research outlines a workflow for parametric manipulation andmesh replication between immersive applications developed in theUnity game engine and McNeel’s Grasshopper plugin. This paperserves as a foundation for future research into integrating design toolswith external VR and AR applications in an effort of enhancing remotecollaborative designs.
Keywords. Augmented Reality; Virtual Reality; Parametric Design;Procedural; Grasshopper.
1. Research Aims and MotivationCommunication can be defined as an external expression of human cognition. Thenotion of “cognitive artefacts”, initially coined in reference to human-computerinteractions (Norman, 1992), translates to design artefacts used to communicate acreative intent. Effective representation and communication are determinative ofthe designer’s cognitive process and the functional process of the ultimate outcome,while being at the crux of successful collaborative design thinking (Abdelmohsen,2012). Shared immersive environments extend this notion of the cognitiveartefact and provide an alternative form of visual communication for remotedesign collaborators that aid in reducing miscommunication when conveying
T. Fukuda, W. Huang, P. Janssen, K. Crolla, S. Alhadidi (eds.), Learning, Adapting and Prototyping,Proceedings of the 23rd International Conference of the Association for Computer-Aided ArchitecturalDesign Research in Asia (CAADRIA) 2018, Volume 1, 483-492. © 2018 and published by the Associationfor Computer-Aided Architectural Design Research in Asia (CAADRIA) in Hong Kong.

484 D. HAWTON ET AL.
design intent. The current project aims to enable designers to both visualise andmanipulate their designs from within immersive environments. Virtual Reality(VR) and Augmented Reality (AR) technologies are already enabling architects,engineers and designers to visualise their work in unparalleled immersive visualmediums (Trimble, 2017; IrisVR, 2017). Both these technologies have thepotential to augment the way designers conceptualise and communicate their intentwhen collaborating remotely and are currently being applied in the aerospace,medical and maintenance industries accordingly (Microsoft HoloLens 2017). Thecurrent research aims to determine how immersive virtual environments arecurrently being employed in the built environment industries and to examinepotential use cases for the future, outlining a model for visualisation and modelmanipulation in VR and AR applications. The investigation should serve asa foundation for further research into the benefits of using immersive virtualenvironments for remote collaboration in real-world parametric design workflows.
2. Research Observations and ObjectivesEffective collaboration is dependent on effective communication; this is pertinentfor collaborative designers, as the architectural intent is often miscommunicated,leading to a waste of time and resources (Slater et al. 2012). Research into waysfor improving visual design communication is therefore especially valuable fordesigners, and through a combination of different visual communication methodsit is expected that fewer mistakes will be made in built environment projects dueto the enhanced understanding provided by VR and AR. The current researchoutlines a preliminary model for sharing mesh geometry between Grasshopperand other connected AR and VR Unity applications via a cloud server. Cloudservers have previously been used to transmit BIM data (Afsari et al. 2016),and exchange data between BIM and VR (Kieferle et al. 2014). However,at the time of writing, exchanging mesh data between Grasshopper and VRand AR applications has been relatively unexplored. This workflow will allowdesigners to expose and manipulate parameters on a virtual interface and visualisethe resulting mesh within the same immersive environment. By using a webserver as an intermediary between the Unity and Grasshopper environments, datacan be transferred bidirectionally, meaning that parametric updates in the Unityenvironment mirror those of the Grasshopper environment. Eventually, the virtualenvironments can be shared by collaborators in remote locations, enhancing visualdesign communication on parametric projects.
3. Research QuestionVR and AR, as visual mediums, are unique in their ability to conveyscale and perspective and improve design engagement through interaction.Direct reciprocity and manipulation have been shown to promote collaborativedesign communication and understanding, thus demonstrating the importanceof incorporating immersive environments into designers workflows (Gauglitzet al. 2014). Virtual environments have also shown to encourage a moreuser-centric professional approach in university architectural studios by allowingstudents to inhabit the buildings they are designing (Moleta 2016). The current

SHARED IMMERSIVE ENVIRONMENTS FOR PARAMETRIC MODELMANIPULATION
485
research, therefore, aims to answer the question of whether shared immersiveenvironments can enhance parametric workflows. Algorithmic design is widelyused within architectural and design studios, therefore exploring how parametricdesign communication can be improved through immersive virtual environmentsis an important area of exploration. As immersive environments provide a uniqueplatform for collaboration and shared visualisation, it is anticipated that parametricworkflows would benefit from improvements in design communication.
4. MethodologyIn order to evaluate the viability of collaborative virtual environments, a modelhas been developed to demonstrate how users in different virtual or augmentedsurroundings can interact with the same parametric model. The process forexchanging data between the immersive mediums and Grasshopper comprisesfour key sections. First, the anatomy of a mesh will be explained, as it is crucialfor understanding how the mesh is organised into a transmittable data structurein Grasshopper and procedurally reconstructed within the Unity engine. Theinvestigation will then outline how to expose user inputs in the virtual spaces forenabling designers to manipulate values in the Grasshopper script. The valueswill be sent to Grasshopper via a web server to compute any model changes.Accordingly, the updated Grasshopper model data will be sent to all connectedvirtual spaces and reconstructed for visualisation. An evaluation of the proposedmethod and suggestions for further explorations are provided as part of the currentinvestigation.
5. Background ResearchShared collaboration in VR and AR is relatively new. However, several relatedprecedents already exist.
FIREFLY GRASSHOPPER PLUGIN. The Firefly Grasshopper plugin allowsdesigners to connect input/output devices and sensors to the Grasshopper platform.Designers can use sensor data or manipulate actuators such as motors from theirscripting environment. They can manipulate parameters within their Grasshopperenvironment using physical inputs, such as sliders, buttons or dials. The precedentdemonstrates how external data can be sent to and captured in Grasshopper, whichis a central part of the project outlined in this paper.
TRIMBLE SKETCHUP VIEWER. Though the HoloLens is relatively newthere are already several applications targeting architectural visual communication.Trimble’s Sketchup Viewer is one of these applications, allowing users to viewtheir Sketchup models in the HoloLens through a cloud server that users canupload to, store and download their projects from (Trimble, 2017). Users canthen navigate around the model and perform various model manipulations such asscaling, rotating and isolating elements.
IRIS VR. VR technology has recently become more common and is nowused as a visualisation tool within the architecture industry. IrisVR is aplatform developed specifically for architects who wish to easily and efficientlyvisualise their projects in VR (IrisVR, 2017). The application allows users

486 D. HAWTON ET AL.
to push their Revit or Sketchup models to the IrisVR platform easily andefficiently, removing the technical and tedious processes commonly associatedwith visualising architecture in VR.
GOOGLE VR BLOCKS. Is a VR 3D modelling application that provides animmersive environment for creating and experiencing 3D models (Google VR,2017). Artists can design and create their models in VR and export them out forrendering or use in other software. Modelling in VR provides users with a uniquesense of scale and immersion, which allows artists and designers to more closelyconvey their original design intent.
URBAN PINBOARD BI-DIRECTIONAL PIPELINE. Urban Pinboard is anonline urban design collaboration platform in development that aims to include thepublic, private and community members in a digital conversation for future smartcity initiatives (Johanson et. al, 2017). As part of this initiative a bidirectionalpipeline between online data repositories and Grasshopper was developed toautomate the computation of environmental analysis, in this case the amount ofsunlight hours buildings are receiving in their urban context. Users can selectgeographical locations from a web interface and receive back an SVG representingthe sunlight hours received for buildings in this area. Innovative tools such as thisempower architects and designers by automating data exchange between differentplatforms, making them more accessible to clients and collaborators.
PLATYPUS GRASSHOPPER PLUGIN. The Platypus Grasshopper plugin isan innovative web collaboration tool developed by CORE Studios. Multiple userscan join a Platypus web session, changing parameter’s variables and viewing theGrasshopper model being streamed from the Grasshopper environment to eachclient’s web browser (COREStudio 2017). This plugin provides an invaluable toolfor architects and designers looking to collaborate remotely, while only requiringaccess to a web browser.
6. Case StudyThe current case study outlines a model for multiple immersive virtual spacesvisualising and interacting with the same parametric models through theirrespective interfaces. The prototype and study involve exposing the parametersfor users to interact within the Unity VR or AR application. Data from the inputvalues is sent to Grasshopper via a web server to compute any change. Changesare then elaborated in Grasshopper and the mesh data sent back to the Unity VRor AR application. Consequently, the mesh is procedurally reconstructed throughthe data received from the Grasshopper environment.

SHARED IMMERSIVE ENVIRONMENTS FOR PARAMETRIC MODELMANIPULATION
487
Figure 1. An early conceptual diagram of the prototype, demonstrating the flow of data fromthe immersive environment to Grasshopper and back again.
6.1. UNDERSTANDING THE ANATOMY OF A MESH
The model will be exchanging mesh data between McNeel’s Grasshopper pluginfor Rhinoceros 3D and Unity, a popular gaming engine and currently the mostaccessible way for developers to develop applications for both VR and AR devices.It is beneficial to start by understanding the anatomy of a mesh and how meshinformation from GH can be used to procedurally create mesh geometry in Unity.
Figure 2. The anatomy of a mesh quad, highlighting the mesh characteristics that are needed tostore and retrieve mesh data.
Meshes in Grasshopper are defined by a Face-Vertex data structure (ModeLab, 2017), meaning that groups of vertices-or points in the 3D-space are groupedtogether to define polygons or triangles. To create meshes using a list of vertices,Grasshopper needs instructions that define the structure of the mesh in terms of itsindividual triangles and those triangle’s individual vertices. Grouping the vertices’positional vectors into groups of three provides Unity or Grasshopper with theinformation required to recreate a complete mesh by procedurally creating itsindividual mesh triangles in a sequential manner. The custom mesh structureused for the case study was developed by Junichiro Horikawa, whose pluginfor communicating mesh data between Grasshopper and Unity was used as thefoundation for the current workflow. The custom mesh structure comprisesa list of vertices, UV coordinates, normals and faces (Horikawa, 2017). Themesh parameters are extracted from the Grasshopper mesh using methods in

488 D. HAWTON ET AL.
McNeel’s Rhino.Geometry API and organised into Horikawa’s custom structurefundamental to themesh reconstruction in Unity. Serialisation involves convertingan object into a stream of bytes which can be more easily transmitted, being idealfor communicating the custom mesh and transmitting the corresponding data toour server and to the Unity immersive application (Microsoft, 2015).
6.2. CREATE AN APPLICATION IN UNITY TO SEND AND RECEIVE DATAFROM
First, creating a Node.js web server for relaying data between Grasshopperand Unity. A Node.js web server was used to relay data between the twosoftware environments (clients). The server receives the input values from theUnity application and sends them to the custom Grasshopper components. Italso listens out for the mesh data message from Grasshopper and relays it toUnity, being responsible for recognising WebSocket events from Grasshopperand Unity and filtering the appropriate data.The server relies on several javascriptlibraries in order to route data between the two separate platforms. Express.jsis a minimal web framework for Node.js applications, which is used for basicrouting; Socket.IO is used for realtimeWebSocket communication and this is howGrasshopper and Unity communicate with each other; Http.js is HTTP requestlibrary suggested by the Socket.IO documentation
Figure 3. Websockets listen out for input changes in Unity and relay new values toGrasshopper for computation before returning the updated mesh.
The Unity project uses a few assets from the Asset Store, namely a Socket.IOplugin for connecting to our server, the Procedural Toolkit for procedurallyreconstructing our mesh, and the VR Toolkit (VRTK) for VR functionality. It alsouses the Windows Mixed-Reality Toolkit for its HoloLens libraries and prefabs(Microsoft, 2017). In order to allow users to manipulate values in Grasshopperfrom the Unity environment, an input method must be provided. The currentcase study will use the standard Unity sliders, as they suitably replicate slidersfound in Grasshopper. The process would be similarly reproduced both in VR andAR projects that require numerical user input. The slider can then be convertedinto a Unity Prefab, which, in turn, can be used in either a VR or AR Unityapplication. Unity sliders provide several adjustable parameters out of the box,such asminimum, maximum and starting values. These value ranges should reflectthe desired value ranges for the parameters within Grasshopper. Each time a slider

SHARED IMMERSIVE ENVIRONMENTS FOR PARAMETRIC MODELMANIPULATION
489
value is manipulated, a function called SendData is fired off, which packages thevalue to be sent into a C-sharp Dictionary. The value is subsequently sent to theserver in the form of a JSON object, which is the format used to parse it on theserver side.
Second, using Socket.IO to listen for changes within Unity and broadcast themback to the server. Socket.IO is a popular javascript framework for harnessingthe power of WebSockets, which allow for interactive communication betweenclients and a server (Mozilla Developer Network, 2017). The clients, in this case,are the custom Grasshopper components and the Unity immersive environments,while Node.js is the foregoing mentioned server. Using WebSockets, the servercan listen out for events fired off from either the Unity sliders or the GrasshopperSend Mesh components and relay that information to the appropriate client.
6.3. BUILDING THE GRASSHOPPER PLUGIN TO RELAY DATA TO THEHOLOLENS APPLICATION
First, defining the Grasshopper components needed to send and receive data isrequired. The Grasshopper plugin is constructed within several components asa fine adaptation of an open-source mesh streaming library written by JunichiroHorikawa (Horikawa, 2017). The components use several external libraries forSocket.IO, JSON interpretation and mesh serialization, which are: ZeroFormatter,used for serialization of the mesh into binary data that is sent from Grasshopper toUnity; Json.NET, used to store the binary mesh data in a JSON format that can beparsed on the server; Socket.IO Client Library for .Net, used to communicate tothe Socket.IO backend server. The mesh streaming plugin contains the followingcomponents: connect, receive data, serialise mesh and send mesh (Fig. 4).
Figure 4. Components of the mesh streaming plugin, from left to right (a) Component used toconnect to the server; (b) Component that listens for a specific predefined message on theserver and outputs the data value received; (c) Component that takes a mesh as an input andserializes it into bytes to be sent to our server; and (d) Component that is used to send the
serialised mesh data to the server.
Secondly, connecting to the server is required. To connect to the server, a URLmust be provided to the Address Input of the Connect node. A boolean toggle isemployed to initiate the connection to the WebSocket on the server. The Herokucloud platform was used to host the server for the current model, as it provides afree hosting tier for small servers. Cloud hosting is essential for accessibility, andas the server requires access from both AR and VR devices, using a local serveron each device is not advised.
Thirdly, receiving numerical data from the Unity application is required. Everytime a user changes the values of a slider, a message is sent to the server toindicate that the values have been changed. This message is then relayed to the

490 D. HAWTON ET AL.
Grasshopper plugin outlined in Section 6.3.1, along with the value that requires achange. For example, if the script being manipulated contains a parameter calledNumberOfFloors, and the ReceiveData Grasshopper node receives a value of 4along with the event name NumberOfFloors, that value can be used to increase thenumber of floors in the building from the previous value to the new value of 4. Thiswould then lead to a change inmesh output connected to the SendMesh component,which would fire off a separate event with a predefined name of Grasshopper (thiscould be anything, as long as it matches the event name defined in the server script),carrying the serialised custom mesh object.
Figure 5. A Grasshopper model being manipulated and visualised from within the VRenvironment.
6.4. REASSEMBLING THE GRASSHOPPER MESH IN UNITY
Using the information from the custom mesh object passed into Unity fromGrasshopper, the mesh can now be procedurally reconstructed. Using the MeshStreaming components from Horikawa. the script iterates over the vertex, UVcoordinates, normal and face information in the Custom Mesh object, rebuildingthe mesh face-by-face. The Procedural Toolkit, an open source library availableon the Unity Asset Store and developed by Daniil Basmanov, is used to interpretthe mesh data received from Grasshopper and to generate a mesh that mirrors theone counteracting in Grasshopper (Basmanov, 2017).
6.5. EVALUATION AND LIMITATIONS
What are potential use cases and limitations of this research? This paperoutlines an experimental workflow to test the viability of real-time data transferfor collaborative design in VR and AR applications. It was anticipated thatthis would be useful for collaborators who are in different physical locationswishing to visualise and manipulate Grasshopper models in either VR or ARmediums, or a combination of both. Aiming to be viable for the industry, theworkflow required reliability, user accessibility, and distinct advantages overother collaborative communication tools.Through developmental testing, andcomparisons with alternative methods for parametric design communication, theworkflow, in its current form, has demonstrated limited viability for real-worldusage due to technical limitations. These include not being able to dynamically addor remove variables on the server or within the Unity applications and applicationcrashes with large mesh transfers, leading to the conclusion that a native VR/AR

SHARED IMMERSIVE ENVIRONMENTS FOR PARAMETRIC MODELMANIPULATION
491
parametric application that removes the need for bi-directional communicationwould likely be much more beneficial to designers collaborating remotely onparametric design. Due to time limitation, few fundamental implementation ofthe model functionality were not achieved. Between those, the most importantwas deploying the application to the HoloLens device. Specifically, the Socket.IOimplementation that worked in the Unity HoloLens emulator and the Unity VRapplication did not work when deployed to the HoloLens. The Microsoft’sUniversal Windows Platform (UWP) uses its own proprietary WebSocket classto communicate with server WebSockets, preventing a seamless integration withthe Socket.IO library, which was realised late in the project. Additionally,further quantitative and qualitative research could be conducted to determine howadvantageous design collaborators would find this tool in a real-world scenario.
7. Significance of Research and ConclusionThis research serves as the basis for future research relating to emerging mediumsfor visual design communication. Understanding how data and geometry canbe passed between applications provides designers with the tools they need toexperiment with cross-application data manipulation. This has the potential toreduce the time taken to accurately communicate original design intent through theefficient exchange of data from design environments to visualisation environments.The prototype developed for this paper has several key limitations that prevent itfrom being used in a commercial setting, as discussed in Section 6.5. With moretime these issues could likely be resolved, however user testing is still required todetermine its viability and usefulness.
It is expected that architects and designers would benefit from workflowsthat integrate currently used parametric design tools with emerging immersivetechnologies, such as VR and AR. What is not clear is how large projects withvast datasets can efficiently exchange data without significant delays betweeninteractions. The prototype presented in this paper enables designers to interactwith and visualise their Grasshopper designs from the same immersive mediumfrom which they are situated. While this worked adequately for smaller designs,it became slow and unresponsive when meshes began to grow beyond a certainsize. This is compounded if multiple users are making changes to the modelsimultaneously, which led to lengthy delays and applications crashes. This is likelydue to the procedural mesh creation method used to assemble the mesh each timea new mesh is sent over from Grasshopper into the Unity application. Perhapsthis algorithm could be improved, however it is likely that a native VR or ARparametric application would produce the most optimum results. With the releaseof Microsoft’s Windows Mixed Reality VR Headsets (Windows MR 2017) thatare part of the same ecosystem as Microsoft’s HoloLens, developing a parametricdesign platform accessible from both VR and AR environments seems the mostsensible path forward.
References“Microsoft: Serialization (C# ). [online]” : 2015. Available from <https://docs.microsoft.com/
en-us/dotnet/csharp/programming-guide/concepts/serialization/> (accessed 7. Nov 2017).

492 D. HAWTON ET AL.
“Windows MR (2017). Windows Mixed Reality | AR Mixed with VR Gaming, Travel &Streaming in Windows 10. [online]” : 2017. Available from <https://www.microsoft.com/en-au/windows/windows-mixed-reality> (accessed 7. Nov 2017).
“Mozilla Developer Network: WebSockets. [online]” : 2017. Available from <:https://developer.mozilla.org/en-US/docs/Web/API/WebSockets_API> (accessed 1. Oct 2017).
“Microsoft: Microsoft/MixedRealityToolkit-Unity. [online]” : 2017. Available from <https://github.com/Microsoft/MixedRealityToolkit-Unity> (accessed 4. Nov 2017).
“Mode Lab: What is a Mesh? | The Grasshopper Primer (EN). [online]” : 2017. Availablefrom <http://grasshopperprimer.com/en/1-foundations/1-6/1_What%20is%20a%20Mesh.html> (accessed 1 Oct 2017).
“CORE Studio Platypus” : 2017. Available from <http://core.thorntontomasetti.com/platypus/> (accessed 30. Oct 2017).
“Google VR Blocks - Create 3D models in VR - Google VR.” : 2017. Available from <https://vr.google.com/blocks/> (accessed 8. Nov 2017).
“Microsoft HoloLens” : 2017. Available from <https://www.microsoft.com/en-au/hololens/partner-program> (accessed 4. Nov 2017).
“IrisVR - Virtual Reality for Architecture, Engineering, and Construction” : 2017. Availablefrom <https://irisvr.com/> (accessed 1. Oct 2017).
“Trimple Sketch up Viewer” : 2017. Available from <https://www.sketchup.com/products/sketchup-viewer> (accessed 7 Nov. 2017).
Abdelmohsen, S.: 2012, Genres of communication interfaces in bim-enabled architecturalpractice, Ascaad CAAD | INNOVATION | PRACTICE [6th International ConferenceProceedings of the Arab Society for Computer Aided Architectural Design, Manama,Bahrain, 81-91.
Afsari, K., Eastman, C. and Shelden, D.R.: 2016, Data Transmission Opportunitiesfor Collaborative Cloud-Based Building Information Modeling, XX Congress of theIberoamerican Society of Digital Graphics, Buenos Aires, Argentina, 907-913.
Basmanov, D.: 2017, “Syomus/ProceduralToolkit. [online]” . Available from <https://github.com/Syomus/ProceduralToolkit> (accessed 4. Nov 2017).
Gauglitz, S.: 2014, In touch with the remote world: Remote collaboration with augmentedreality drawings and virtual navigation’, Proceedings of the ACM Symposium on VirtualReality Software and Technology, VRST, pp. 197–205.
Horikawa, J.: 2017, “Mesh Streaming Grasshopper. [online]” . Available from <https://github.com/jhorikawa/MeshStreamingGrasshopper> (accessed 1. Oct 2017).
Jabi, W.: 2013, Parametric Design for Architecture, Laurence King , London, United Kingdom.Johanson, M., Khan, N., Asher, R., Butler, A. and Haeusler, M.: 2017, Urban Pinboard -
Establishing a Bi-directional Workflow Between Web-based Platforms and ComputationalTools, Proceedings of the 22nd CAADRIA Conference, Suzhou, China, 715-724.
Kieferle, J. and Woessner, U.: 2014, BIM Interactive - About Combining BIM and VirtualReality A Bidirectional Interaction Method for BIM Models in Different, Proceedings ofeCAADe 2014, Newcastle upon Tyne, UK, 69-75.
Merel, T.: 2017, “The reality of VR/AR growth” . Available from <https://techcrunch.com/2017/01/11/the-reality-of-vrar-growth/> (accessed Accessed 21 Sep. 2017).
Moleta, T.: 2016, Game on: Exploring constructive design behaviors through the use ofreal-time virtual engines in architectural education, International Journal of ArchitecturalComputing, 14(3), 212-218.
Norman, D.: 1992, Design principles for cognitive artifacts, Research in Engineering Design,4(1), 43-50.
Rankohi, S. and Waugh, L.: 2013, Review and analysis of augmented reality literature forconstruction industry’, Visualization in Engineering, 1(2005), 9.
Slater, R. and Radford, A.: 2012, Perceptions in the Australian building industry of deficienciesin architects’ design documentation and the effects on project procurement’, AustralasianJournal of Construction Economics and Building, 8(1), 23-33.

DIGITAL CULTURE
An Interconnective Design Methodology Ecosystem
JESSIE ROGERS1, MARC AUREL SCHNABEL2 andTIAN TIAN LO31,2,3Victoria University of [email protected] 2,3{marcaurel.schnabel|sky.lo}@vuw.ac.nz
Abstract. Transitioning away from traditional design methodology,for example, paper sketching, CAAD works, and ‘flat screen’rendering, this paper proposes a new methodological ecosystem ofwhich tests its validity within a studio-based case study. The focuswill prove whether dynamic implementation and interconnectivity ofevolving design tools can create richness and complexity of a designoutcome through arbitrary phases of a generative design methodologyecosystem. Processes tested include combinations of agent simulations,artistic image processing analysis, site photogrammetry, 3D immersivesketching both abstract and to site-scale, parametric design generation,and virtual reality style presentations. Enhancing the process ofdesign with evolving techniques in a generative way which dynamicallyinterconnects will stimulate a digital culture of design generation thatincludes new aspects of interest and introduces innovative opportunitieswithin all corners of the architectural realm. Methodology componentswithin this ecosystem of interaction prove that the architecture cannot beas rich and complex without the utilisation of all strengths within eachunique design tool.
Keywords. Methodology Ecosystem; Simulation; Immersive;Virtual Reality; Photogrammetry.
1. IntroductionPrevailing traditional architectural design methods, for example, paper sketchingfollowed by CAADworks and standard ‘flat screen’ rendering, have since becometoo ordinary to acquire a unique richness of architectural design during theconcept, development, and presentation phases (Kvan 2004). Architectural designadvances from different approaches utilising evolving digital technologies whichembrace not one, but many modern tools existing across a range of techniques.The aim of this paper is to propose a new architectural design methodologicalecosystem within a framework which will be tested, and thus established toadvance this common issue of lack of richness and complexity within architecturaldesign projects, with the outcomes being highly resolved and intricate (Schnabel et
T. Fukuda, W. Huang, P. Janssen, K. Crolla, S. Alhadidi (eds.), Learning, Adapting and Prototyping,Proceedings of the 23rd International Conference of the Association for Computer-Aided ArchitecturalDesign Research in Asia (CAADRIA) 2018, Volume 1, 493-502. © 2018 and published by the Associationfor Computer-Aided Architectural Design Research in Asia (CAADRIA) in Hong Kong.

494 J. ROGERS, M.A. SCHNABEL AND T.T. LO
al. 2004). Throughout this paper, research via experimentation will be conductedand will critically reflect upon the viability of a vast range of evolving digitaldesign tools available. The focus will prove whether the dynamic implementationof evolving tools can create complexity and richness of a design outcome througharbitrary phases of generative design methodology (Arida 2004). Designers areimmersed in a digital culture of designing.
Contemporary software tools for form generation are partially being usedto aid architectural design processes within the early concept and developmentphases in studio (Abdelmohsen 2013). However, these are limited to oneor two techniques throughout the duration of architectural design projects.Enhancing this simple process with evolving techniques in a generative processimplementing interconnectivity will stimulate a new excitement and era (Arida2004), introducing innovative opportunities within all aspects of the architecturalrealm.
Innumerable members of the public outside of an architectural educationremain somewhat unaware of the various technological advancements, able to beimplemented collaboratively within an architectural design methodology (Segardet al. 2013). Software and hardware are advancing rapidly to a situationwhere many still believe some systems are entirely futuristic, when in fact theyare now becoming a reality (Schnabel et al. 2007). Universal discussionsare necessary regarding emerging technologies regarding their contribution onaiding and influencing design, especially referring to the public’s involvement.Already these evolving tools are being used for the simulation and observationof virtual spaces (Maver and Alvarado 1999). However, due to software andhardware developments, interactive capabilities within immersive environmentsare available but limited in comparison to what they soon will be within designstudios (Kvan 2001). The majority of the public sector are only aware of conceptand development visualisations or animations of the final product. Consideringthis, it is believable that the richness and evolving digital style of a methodologyecosystem proposedwithin this paper is irrelevant as long as a high-quality productis produced. Thus the suggested irrelevance of an interconnective and generativearchitectural design process provides the opportunity for the implementation ofthis ecosystem of evolving design tools (Lo and Schnabel 2018). Inviting andengaging the public or client into precesses dynamically, rather than wordedfeedback or paper alteration sketches will be a key for success in this manner.Collaborative virtual environments within the methodology ecosystem provide aplatformwhere this theory can occur, resulting with a new complexity and richnessof an architectural design due to the enhanced engagement (Al-Qawasmi 2000).
2. Interconnective Design Methodology Ecosystem“Many designers believe that a study of the design process will impair their abilityto design”, Wiggins suggests this situation from a period where CAAD was verylimited and in the simplest of developments on early desktop computers (1989).Comparing this state to design tools currently available today, such as usingparametric strategies, simulations and immersive environments, it would seemimpossible for an architect’s ability to design to become impaired. Countless tools

DIGITAL CULTURE 495
for interpreting and translating data now exist immensely that even attempting todesign for some architects could become more overwhelming regarding where tobegin and deciding on the initiate tool.
Studying design processes allows the architect to explore the benefits andhindrances for certain tools (Wiggins 1989), combining the art of study andpractice together provides viable inputs and outputs in order to create a successfuldesign cycle or framework within architectural design (Schnabel 2004). Figure1 presents the resulting framework derived from this combined research and casestudy with an ecosystem of dynamic interaction.
Figure 1. Proposed Interconnective Design Methodology Framework and Ecosystem.
Strategically, the key for success within this methodological ecosystem is therequirement of interconnectivity between the multiple design tools with varioustechnological capabilities. Input data could include site and context factors,influences, and client brief, these are distributed around the ecosystem purposelyor arbitrary dependent on the architect/s aspirations during any phase of thedesign. Generating rich and complex outputs transpires from advancing the designworkflow whilst also implementing outputs from other tools simultaneously. Thecommencing and concluding tool must be established by any means in order toallow sufficient strength and resolution within the architectural design to comethrough to the end of the dynamic process.
3. Ecosystem Case Study ParametersTo provide input data for the research experiment, the selected project is aLight Rail Shelter through the center of Courtenay Place within Wellington, NewZealand. Data was composed from the site specific context, such as popularcuisine establishments and attractions, roadways, footpaths and neighboringbuildings, surrounding local artistic graffiti, and the immediate neighboringbuilding texture and form.
Tools selected for testing the proposed method are chosen due to softwareand hardware accessibility within studio, subjective skill ability, and what will

496 J. ROGERS, M.A. SCHNABEL AND T.T. LO
facilitate a rich and complex outcome. These are Quelea agent simulations withGrasshopper. Photoshop, Rhinoceros and Grasshopper for image processing.Autodesk ReCap Photo Photogrammetry for a photo-scale-realistic digital siteenvironment geometry. Hyve-3D for collaborative and immersive spatialsketching on a 3D movable plane with or without any site geometry. Google’sTilt Brush for immersive, fluid, spatial 3D digital hand sketch with or withoutany site geometry. Rhinoceros 3D, Grasshopper 3D, and Fuzor for immersivedesign testing, formalisation, and development. Unity for real-time rendering andfirst-person, third-person, and immersive walk-through and interactivity.
4. Agent SimulationsCommencing the interconnectivity design experiment, Quelea agent simulationtool in Grasshopper is capable of flexible autonomous path-finding withinGrasshopper 3D and Rhinoceros 3D. Attractor and repellent properties wereassigned to specific areas on the site plan to simulate a person’s walkable path.Repellent points specify avoidance areas for example, neighbouring building andpathway boundaries. Attractor points determine pedestrian destinations of popularestablishments and attractions. Using this form of site analysis to digitally simulatethe movements of pedestrians within the space, generalized the population byruling out special and extreme cases of pathways, thus producing a habitual andsolid framework of pedestrians and their travel paths. To mimic this analysis byvisiting the site and recording the real-time movements of the available occupantswould be very time consuming and the results would vary depending on manysite factors such as weather and traffic. Quelea agent simulation rules out manyvariables and gives complete control to the analyst (Asriana and Indraprastha2016). The exportable path lines in any line format from Rhinoceros 3D canthen be manipulated in any way to derive information to influencing the use ofadditional tools (Figure 2).
Figure 2. Quelea Agent Simulation.

DIGITAL CULTURE 497
5. Artistic Image Processing AnalysisLocal artistic graffiti data input through Adobe Photoshop image samplingextracting dominant colours, contrast areas, and exaggerating shapes and shadowsof the graffiti produced many abstracted outputs. These speculative products givea sense of complexity and richness throughout the process while embracing thecultural aspect and ideas behind the works of art.
An image sampling algorithm within Grasshopper 3D was then made and usedto determine and triangulate points of various pixel occurrences both arbitrarilyand intentionally, such as dense contrast areas and linking together nodes ofsimilar colouration (Goldman and Zdepski 1990). These data outputs appearedvery abstract, disregarding the length of control and flexibility of the algorithmicdefinitions, which crafted the desired complex and rich sense of working. As aresult, this procedure produced a vast range of data outputs subject to interpretation(Abdelmohsen 2013), allowing a unique and near limitless range of data for theanalyst to use and influence other tools by. Figure 3 shows the workflow asdescribed above.
Figure 3. Graffiti Image Processing.
6. Realistic Site GeometryPhotogrammetry, the process of taking numerous photographs of a subject frommany different angles stitched together to create a 3D piece of geometry, withrealistic depth and proportions. Using Autodesk ReCap Photo, the more imagesacquired provides a higher quality output. In this research experiment, a digitalmodel of the site and surrounding buildings was manipulated and used as a visualscale guide within other 3D software, and produced as an asset to implementedwithin other tools (Figure 4).

498 J. ROGERS, M.A. SCHNABEL AND T.T. LO
Figure 4. Courtenay Place, Wellington Photogrammetry.
7. Projected 3D Space SketchingThree derived outputs were selected from the previous image sampling toolsand developed as a form of design generation. Site photogrammetry importedinto Hyve-3D created a realistic scaled environment to begin spatial form design.Agent simulation line data was also imported in the program which the sketchingwas referenced too, endorsing interconnectivity between tools. Here the tool alsoallows for a collaborative work space, increasing the range of unique interpretationto flourish between designers and client if desired (Al-Qawasmi 2000). Sketchingbegan with reference to the previously selected outputs in the 3D environment onan iPad. The sketch is instantaneously projected onto the 3Dmovable plane withinthe 360-degree view environment, at any position, rotation, or scale personallychosen. Here this method freely translates two-dimensional data to 3D data. Thegenerated illustrations were then exported as a 3D file format for continued usewith another tool (Figure 5).
Figure 5. Hyve 3D Sketching and Rhinoceros Import.
8. Immersive Space SketchingGoogle’s Tilt Brush immersive virtual environment ‘game’ tool as a way ofcreating and manipulating data. A hand-controller of tools, including differentstyle brushes, shapes, scale and settings, provided the ability of spatially generatingdesigns 3D around the designer’s body at any chosen scale. Giving complete

DIGITAL CULTURE 499
freedom of interpretation, shaping, scale, and form production (Achten et al. 2000)it allows for a novel communication of architectural designs.
The site photogrammetry model and 3D data from multiple tools usedpreviously were imported into the Tilt Brush program. This hub of datamanipulation and creation demonstrates interconnectivity between the tools,adding a complex and rich dimension to the design process, utterly diverging awayfrom traditional methods of paper or CAAD ‘flat screen’ design. Produced was anexportable geometrymeshwith limitless scaling and alteration abilities compatiblewith any 3D software (Figure 6).
Figure 6. Google Tilt Brush Immersive Virtual Reality Sketching.
9. Rhinoceros, Grasshopper and FuzorData optimisation, development, and documentation commenced withinRhinoceros and Grasshopper throughout the duration of this researchmethodologytesting, combining all tools and working as a design hub. Imported data includedthe Quelea simulation path vectors, graffiti image processing outputs, sitephotogrammetry, Hyve 3D and Tilt Brush sketching. All developments wereexplored as a first-person screen walk-through, and as a 1:1 scale immersivewalk-through within Fuzor testing the functionality of the design and withreal-time weather data and material visualisation. 3D structural analysis thencommenced supporting the validity of the tested design (Figure 7).

500 J. ROGERS, M.A. SCHNABEL AND T.T. LO
Figure 7. Rhinoceros and Grasshopper Parametric Design of Column Placement and LatticeDesign.
10. Immersive Working PresentationTheworking outcome resulting from the proposed interconnectivity design processwithin a realistic immersive environment was exhibited within Unity as an .exefile. This tool simulated the design formally working as-built in a day and nightcycle with site-specific weather patterns (Petric 2001). Rather than presentingmere flat-screen renderingswith a positioned human figure for scale, the exhibitionparticipant or experienced the design in full functionality and its impact within thespace regarding all design aspects. Here options exist to further develop the designitself or to build (Figure 8).
Figure 8. Orthographic and Perspective Views Real-time Rendered in Unity.

DIGITAL CULTURE 501
11. ConclusionInterconnective methodology ecosystem using the range of evolving digitaltools in a generative way within this architectural design research proved verysuccessful. All design inputs were strategically organised, processed and thusconverted to form an intricate outcome. These unique and complex forms havevisual and numerical reference to all the input data thus enriching the outcomewithcomplexity. Figure 9 shows an overview of how the design methods interconnectin the here presented ecosystem and how they form a digital culture in architecturaldesigning.
Figure 9. Interconnective Design Methodology Ecosystem.
“While a designer may have a good tacit justification for his or her designwork, finding the words to express the justification may be very difficult” statesWiggins (1989). This research paper’s methodology bypasses these doubtsWiggins suggests that a designer may acquire, as the processed inputs speak forthemselves as data outputs, the method always remains clear and concise. As theoption exists within the framework to revert back to a singular point within theecosystem and alter the design direction, the interconnectivity and dynamic styleof the methodology allows this flexibility to exist.
The dynamic implementation of evolving tools created the desired complexityand richness of the design outcome through all phases of the generative designecosystem. Typically design tools are treated as separate entities for different datainputs, this does not need to be so. The proposed methodology diagram treats thetools as an ecosystem of interaction, that the design cannot be as complete withoutthem all working as a combination. Each selected design tool is an essentialingredient within the ecosystem. Every selected tool will always have its ownstrengths and weaknesses regarding the capabilities of both the designer and thetool. The differing nature of each design tool allows the designer to generateoutputs that makes use of properties and functions another tool might fail to offer.
This research paper deriving the validity of the interconnective designmethodology ecosystem advanced the traditional method of design from papersketching, CAAD works, and standard ‘flat screen’ rendering. This frameworkembraces a digital culture in which designers are immersed and that revolvesaround digital technologies in a generative way across a wide range of techniquesresulting in a vast field of opportunities. Enhancing processes such asthis stimulates new excitement for all designers, clients, and the public by

502 J. ROGERS, M.A. SCHNABEL AND T.T. LO
implementing innovative procedures singularly and collaboratively to invoke newexperiences and definitions of architectural designs.
ReferencesAbdelmohsen, S.M.: 2013, Reconfiguring Architectural Space using Generative Design and
Digital Fabrication: A Project Based Course, Proceedings of SIGraDi 2013, Valparaíso,391 – 395.
Achten, H., De Vries, B. and Jessurun, J.: 2000, DDDOOLZ. A Virtual Reality Sketch Toolfor Early Design, Proceedings of the Fifth Conference on Computer Aided ArchitecturalDesign Research in Asia (CAADRIA), Singapore, 451-460.
Airda, S.: 2004, Contextualizing Generative Design, Master’s Thesis, MIT.Al-Qawasmi, J.: 2000, Learning Virtually: A Paradigm Shift in Design Education, Proceedings
of CAADRIA 2000, Singapore , 123-133.Asriana, N. and Indraprastha, A.: 2016, Making Sense of Agent-based Simulation: Developing
Design Strategy for Pedestrian-centric Urban Space, Living Systems and Micro-Utopias:Towards Continuous Designing (Proceedings of the 21st International Conference ofthe Association for Computer-Aided Architectural Design Research in Asia (CAADRIA)),Melbourne, 343-352.
Goldman, G. and Zdepski, M. S.: 1990, Image Sampling, Proceedings of ACADIA 1990,Montana, 21-28.
Kvan, T.: 2001, The pedagogy of virtual design studios, Automation in construction, 10,345–354.
Kvan, T.: 2004, Reasons to Stop Teaching CAAD in M-L Chiu (ed), Digital Design Education,1, 66-81.
Lo, T.T. and Schnabel, M.A.: 2018, Virtual and Augmented Studio Environment (VASE):Developing the Virtual Reality Eco-System for Design Studios, Learning, Adapting andPrototyping (Proceedings of the 23rd International Conference of the Association forComputer-Aided Architectural Design Research in Asia (CAADRIA)), Beijing, 10 pgs.
Maver, T. and Alvarado, R.G.: 1999, Virtual Reality in Architectural Education: DefiningPossibilities, ACADIA Quarterly, 18(4), 7-9.
Petric, J., Ucelli, G. and Conti, G.: 2001, Educating the Virtual Architect: ArchitecturalInformation Management, Proceedings of eCAADe 2001, Helsinki, 388-393.
Schnabel, M.A., Kvan, T., Steve, K.S. and Li, W.D.: 2004, 3D Crossover: exploring objetsdigitalisé, International Journal of Architectural Computing, 2(4), 476-490.
Schnabel, M.A., Wang, X.Y., Seichter, H. and Kvan, T.: 2007, From virtuality to reality andback, Proceedings of International Association of Societies of Design Research 2007, HongKong, 1-15.
Segard, A., Moloney, J. and Moleta, T.: 2013, Open Communication – Competitive Design ina Collaborative Virtual Environment, Open Systems (Proceedings of the 18th InternationalConference of the Association for Computer-Aided Architectural Design Research in Asia(CAADRIA)), Singapore, 231-240.
Wiggins, G.E.: 1989, Methodology in architectural design, Master’s Thesis, MIT.

FROM AGENT TO AVATAR
Integrate Avatar and Agent Simulation in the Virtual Reality for Wayfinding
MING TANG1University of [email protected]
Abstract. This paper describes a study of using immersive virtualreality (VR) technology to analyze user behavior related to wayfinding,and the integration of the technology with the multi-agent simulationand space syntax. Starting with a discussion on the problems of currentagent-based simulation (ABS) and space syntax in constructing themicro-level interactions for wayfinding, the author focuses on how thecognitive behavior and spatial knowledge can be achieved with a playercontrolled avatar in response to other computer controlled agents ina virtual building. This approach starts with defining the proposedAvatar Agent VR system (AAVR), which is used for capturing a player’smovement in real time and form the spatial data, then visualizing the datawith various representation methods. Combined with space syntax andABS, AAVR is used to examine various players’ wayfinding behaviorsrelated to gender, spatial recognition, and spatial features such as light,sound, material, and other architectural elements.
Keywords. Virtual Reality; wayfinding simulation; agent; avatar;multi-agent simulation; space syntax.
1. Introduction1.1. WAYFINDING SIMULATION WITH AGENT-BASED MODELING
Wayfinding refers to the ability of people and animals in orienting themselvesin a space and navigate from place to place. The related studies investigatedifferent aspects of wayfinding such as route decision making, route monitoring,and destination recognition. In architecture specifically, the wayfinding studiestend to focus on the user experience and signage (and graphic communication)studies. Kevin Lynch described it as “a consistent use and organization of definitesensory cues from the external environment.” (Lynch, 1960) In the context ofarchitectural design, the term “way showing” is used to refer to the architectonicsthat is designed in a way to facilitate and assist navigation. Romedi Passiniemphasized wayfinding from architectural design perspectives such as spatial,orientation, perception factors, and stimuli - graphic, verbal, auditory, and tactilein the book “Wayfinding: People, Signs, and Architecture” (Passini. 1992).
T. Fukuda, W. Huang, P. Janssen, K. Crolla, S. Alhadidi (eds.), Learning, Adapting and Prototyping,Proceedings of the 23rd International Conference of the Association for Computer-Aided ArchitecturalDesign Research in Asia (CAADRIA) 2018, Volume 1, 503-512. © 2018 and published by the Associationfor Computer-Aided Architectural Design Research in Asia (CAADRIA) in Hong Kong.

504 M. TANG
There are many computational wayfinding methods to simulate agentsinvolving movement, including ”The simple statistical regression, spatialinteraction theory, accessibility approach, space syntax approach and fluid-flowanalysis” (Batty, 2007). These bottom-up agents based simulation (ABS)systems can simulate real human’s movement and decision-making process.Computer models have been developed to examine the generation of agents, theirspatial properties, and their interactions with the environment. Michael Battydescribed the property of ”Autonomy” and ”The embedding of the agent intothe environment” as the two fundamental properties of agents in an ABS. AnABS consists of numerous agents, which follow localized rules to interact witha simulated environment, thereby formulating a complex system. Since CraigReynolds’ artificial ”bodies” and flock simulation, the concept of ABS has beenwidely used to study decentralized systems including the crowd simulation andsocial interaction. ABS focuses on the agent’s properties and processes used torespond to external changes, specifically how the agents can ”sense” and ”act” toform a bottom-up wayfinding system. The actions are usually based on simplerules such as separation, alignment, and cohesion. Usually, a computer algorithmis used to control agent’s velocity, maximum force, the range of vision and otherproperties. For example, Po-Han Chen’s fast flow control algorithm can calculateevacuation paths in accordance with a floor plan and the total number of evacuees.(Po-Han Chen. 2009) The movement analysis is based on the minimum overallevacuation time and an optimal number of evacuees assigned to each evacuationpath. However, the wayfinding simulation can also be achieved without usingABS. For instance, in Ming-Yuan Chen’s BIM-based intelligent fire reductionintegrated system, the shortest safe path is determined by multiplying penaltyfactor from the relative paths of on fire nodes to evade the fire areas throughBuilding Information Model (BIM). (Min-Yuan Cheng. 2016)
1.2. WAYFINDING SIMULATION WITH VIRTUAL REALITY
With the recent development of head-mounted display (HMD) such as OculusRift, HTC Vive, Microsoft HoloLens, and powerful mobile phones, bothVirtual Reality (VR) and Augmented Reality (AR) are being reintroduced assimulation instruments into the architecture design industry. Through sensoryperception and the motor response of users, VR helps a person to perform asensorimotor and cognitive activity in an artificial world. Users can virtuallychange time, place and action in the virtual environment. Through supporting theperception-decision-action loop, VR allows researchers to test peoples’ VirtualBehavioral Primitives (observing, navigating and manipulating) in an immersiveenvironment. By integrating with BIM and building emergency managementprotocol, VR-based simulation provided a closer result to the physical reality forwayfinding analysis and egress training. For example Bing Wang’s research onhow to use BIM andVR to create timely two-way information updating convenientand simple way to increase evacuation awareness. (Bing Wang. 2014).

FROM AGENT TO AVATAR 505
2. Constraints of current wayfinding methodsIn the preliminary research, we have studied several computational methods forthe wayfinding study, specifically focused on themulti-agent system, space syntax,and VR-based simulation.
2.1. PROBLEMS OF MULTI-AGENT SYSTEM FOR WAYFINDING
Amulti-agent system is established in the same relationalmodel and computationalstrategy from the early sociologists‘ research. Some of the methods involveutilizing ABS to generate micro level self-organizing movement patterns thatrespond to the top-down rules such as egress code. Multi-agent system allowsa complex behavior pattern to emerge from a simple interaction among agents.The agent can “sense” their neighbors and “react” to them by modifying theirlocation, velocity, orientation or other attributes. This multi-agent approachcan be found in the self-organizing behavior research by Kokkugia. It alsoinspired Jeff Jones’ unconventional computing using the slime mold Physarumpolycephalum to construct the natural multi-agent computational model. (Jones2014) All of these wayfinding methods modeled the interaction of agents, despitemodel the macrostructure directly. Researchers can understand the dynamics ofagents better not by modeling them at the global level but instead simulating thelocal interactions among these components and automatically construct the globalpatterns at the relational level.
The multi-agent system has been widely used to simulate the behavior ofcrowds, where the agents’ movements are computed based on the interactionsamong themselves, as well as the interactions with the environment. We designedan agent system and created the ”cognitive agents” with A.I in the Unity gameengine. The agents populated a defined space and navigated through a complex3D landscape. Different from the ”reactive” agent in the space syntax discussedlater, these ”cognitive agents” had their pre-programmed decision-making tree todecide their path in a changing environment actively. These algorithm controlledagents made various decisions while evaluating the changing context in real time.
Figure 1. Multi-agent simulation in the 4400 lecture hall, DAAP building. Unity game engine.By Laura Kennedy. .
In the evaluation stage, spatial explorations concepts of the multi-agent systemallowed us to compare the decision makings and behaviors of a digital agentwith a real human during an egress. We soon realized the difference betweenthese two and acknowledged the distinction between a computer-simulated agentand a real human regarding the wayfinding behavior. Although multi-agentsystem calculated an agent’s changing state through time, based on the state of

506 M. TANG
neighboring agents and context, it did not necessarily represent the complex, andsometimes irrational human behavior in the real world such as following the crowdand panic during the egress.
2.2. PROBLEMS OF SPACE SYNTAX FOR WAYFINDING
Space syntax is another method to study the movement pattern and accessibilityof a network based on the lines, nodes, and connections. It is widely used inthe vast urban scale to study connectivity of the street network. With its own“agent analysis” tool, space syntax does not simulate the interactions among agents.However, space syntax provides fast feedback between geometric elements andcomputes their accessibility values within an environment defined by a grid ofcells. Through importing a building floor plan into space syntax analysis tool, weproduced a heat map to represent accessibility and spatial integration. The warmercolor represents higher spatial integration values. We computed the integrationvalue of each cell by the analysis tools in space syntax and visualized the valueswith colors. The quantitative values extracted from the space syntax analysis wereimported into Grasshopper for further computing. To convert the space syntaxresult into a heat map representation, we created a data processing method toexpand the color values automatically from paths to zones. These zones wereused later to plan where to “spawn” the agents. However, it became evidentthat the interactions among agents, the complex social behavior could not besimulated through the space syntax alone, although it provided a fast way tovisualize interactions between the agents and the environment.
Figure 2. Space syntax agent analysis. DAAP building.
2.3. OUR APPROACH: AVATAR AGENT VR SYSTEM (AAVR)
As two simulated bottom-up systems, both multi-agent system and the spacesyntax computed the changing status of an agent over time. However, as discussedbefore, we discovered that the agent behaviors of these two methods were oftenunrealistic and lacked purposive planning goals. These methods merely relied onthe external rules to influence the agents’ behaviors and dictate their movement.Finally, we designed a new method by integrating ABS and Space syntax withimmersive VR through a player controlled avatar. Like in a video game, a playeris graphically represented in the virtual world as an avatar. Surrounded by thecrowd of agents who were automatically generated by the computer, the avatar’smovement was fully controlled by the player. While the agent’s ”spawn” positionwas based on the space syntax heat map, its movement was fully controlled by thecomputer simulation. This hybrid ”avatar + agent VR system” (AAVR) allowed usto examine the complexity of human cognitive pattern responding to the predefined

FROM AGENT TO AVATAR 507
rules and other ”purposive goals” beyond context awareness. In this new method,an avatar with its human master had the full decision-making ability to respondto the context and modified its complex behavioral parameters and interactedwith the computer controlled agents. AAVR allowed us to take advantage ofthe autonomous, bottom-up ABS approach and integrated various agent relatedcomputations into VR.
Figure 3. Top: third person view in VR with player controlled avatar (red color character) andA.I controlled active agents (gray color characters). Bottom: First person view in Unreal andUnity game engine with a large crowd (purple color characters) imported from external ABS.
By Ming Tang, Joe Gruzinsky.
Figure 4. Left: Three methods: space syntax, ABS, AAVR. Right: Workflow of AAVRsystem.
3. Implementations of AAVR for wayfindingIn 2017, we applied AAVR method to examine the wayfinding using the Collegeof Design, Architecture, Art, and Planning (DAAP) building at the University ofCincinnati. The DAAP building, also named as Aronoff Center for Design andArt, is a 164,000-square-foot addition, which opened in 1996 and linked togetherthe previously existing Alms, DAAP and Wolfson buildings at the University ofCincinnati. Designed by renowned architect Peter Eisenman, the DAAP buildinghas generated much national and international critical attention. Famous for its“deconstructionism” style, the building contains a complex circulation system,with many classrooms, public gathering places, critic spaces, and service areas.Wayfinding is always a big challenge for the first-time visitors, even for the
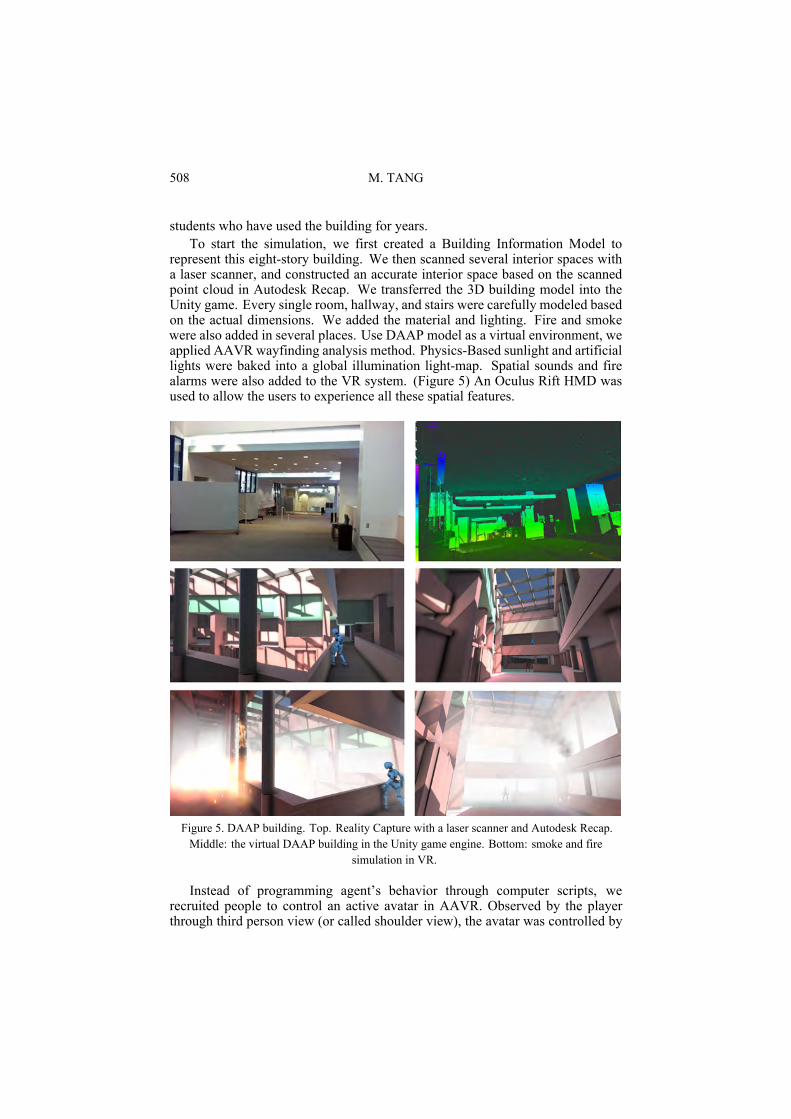
508 M. TANG
students who have used the building for years.To start the simulation, we first created a Building Information Model to
represent this eight-story building. We then scanned several interior spaces witha laser scanner, and constructed an accurate interior space based on the scannedpoint cloud in Autodesk Recap. We transferred the 3D building model into theUnity game. Every single room, hallway, and stairs were carefully modeled basedon the actual dimensions. We added the material and lighting. Fire and smokewere also added in several places. Use DAAP model as a virtual environment, weapplied AAVR wayfinding analysis method. Physics-Based sunlight and artificiallights were baked into a global illumination light-map. Spatial sounds and firealarms were also added to the VR system. (Figure 5) An Oculus Rift HMD wasused to allow the users to experience all these spatial features.
Figure 5. DAAP building. Top. Reality Capture with a laser scanner and Autodesk Recap.Middle: the virtual DAAP building in the Unity game engine. Bottom: smoke and fire
simulation in VR.
Instead of programming agent’s behavior through computer scripts, werecruited people to control an active avatar in AAVR. Observed by the playerthrough third person view (or called shoulder view), the avatar was controlled by

FROM AGENT TO AVATAR 509
the player with a game controller, a keyboard, and a mouse. The avatar interactedwith the virtual DAAP building populated with other computer controlled agents.Through the built-in character control system in the Unity game engine, weoptimized the avatar’s movement and running speed to match the real worldphysics.
Besides the player-controlled avatar, there were two groups of agents in AAVRto form the crowd. One group of agents, usually contain 200 agents or more,was precomputed in an external crowd simulation program outside of Unity. Thespawn location of these agents in the virtual DAAP building was based on theprevious space syntax analysis. Agents’ movement were baked into a series ofskeleton keyframes and imported into the Unity engine to assemble the crowd.We named this group as ”passive agents” since their simulation was baked intokeyframes and would not have real-time interaction with the avatars and changingenvironment. The second group of agents, usually 50 agents or less, was alsospawned in the zone indicated by the space syntax analysis. However, they werecontrolled by the A.I in the Unity game engine. They can actively interact withan avatar such as following, keeping distance, or running away. We named thisgroup of agents as ”active agents.” These two groups of agents created a dynamiccrowd scenario in the AAVR simulation.
At the beginning of the test, the researchers explained the wayfinding task tothe participants. The participants were told that they were in a building which ison fire, and they have to exit the building as soon as possible. A participant shoulduse all visual, audio cues, as well as their sense of spatial organization to find theirway out.
During the test, the participant’s avatar spawned in a zone full of smoke. Thevisible fire could be observed in the distance. Fire alarms could be heard and gotlouder when the avatar walked closer to the alarms. The challenge for a participantis to control an avatar to get out from one of the six exits in the building. Oncethe avatar reaches an exit, the task is complete. The avatar’s movement and traveltime were automatically recorded into series of values and stored in an externaldataset.
After the test, we extracted participants’ movement XYZ values and timevalues captured in the dataset. We then reconstructed the data as a series of travelpoints and curves in Grasshopper and Rhino. These travel points were assignedcolors based on their proximity to other points. A heat-map was automaticallyformed to represent the spatial congregation. After the participants completed theirtasks and took off the HMD, they were asked to fill out a questionnaire. Examplequestions were, to what extent the sounds assist participants in their navigation?To what extent the light assists participates in their navigation?

510 M. TANG
Figure 6. The researchers applied AAVR simulation to record how players navigated in thevirtual DAAP building and generated path graph. The Unity game engine was used as a virtual
playground to establish a series of tasks and a data capturing environment.
4. Evaluation of AAVR for wayfindingThe AAVR wayfinding study lasted three weeks. It focused on the group ofpeople who were already familiar with the building and evaluated their wayfindingbehavior in the presence of fire and dense smoke. Thirty undergraduate andgraduate students were recruited and participated the test and survey. The numberof male and female participants were nearly equal. Participants spent average 3-4minutes reading the description of the task, signing the consent form, adjusting theHMD before they started the test. Then participants spent around 10 - 15 minutescompleting two tasks. Task-A is to exit the virtual DAAP building during theemergency evacuation. Task-B is to walk through the same building in the usualsituation. Virtual fire, smoke and alarm sound were only added in the task-A.Participate spent 5 minutes filling a questionnaire after the two tasks.
In task-B, the casual walk scenario, we found the agents’ aggregation has a verysimilar pattern matching the result from the previous space syntax and multi-agentmethod. The central atrium with skylight attracted more circulation and becamea public gathering place. In task-A egress scenario, the same atrium became themost recognizable space to assist the wayfinding in the smoke condition. Thevisible daylight, material, and louder alarm sound made this space distinct fromthe rest of DAAP building.
We also found AAVR wayfinding result is different from the previous twomethods. For instance, the grand stairs in DAAP, which is a very long linearspace adjacent to the central atrium with a relatively low ceiling and dimmeddaylight, attracted many agents in the space syntax and multi-agent simulation.However, it did not attract many avatars in the AAVR simulation in task-A andtask-B. This might be due to the “less intelligent” agents in the first two methodslacking the understanding of complex spatial features such as the elevation change,height-depth proportion, space usage, and illumination level.

FROM AGENT TO AVATAR 511
Figure 7. Data analysis based on avatars’ movements. Top left: heat-map to representcongregation value. Bottom left: paths by gender. Green color: male. Purple color: female.
From the heat-map and paths generated from male and female participantsin the AAVR method, we did not find a significant gender difference in thewayfinding behavior. Although a few male and female participants failed to findan exit and end the task early, both genders had a similar reaction to the spatialfeatures such as sound, material, and light based on the survey data.
5. CONCLUSIONWayfinding simulation helps us to evaluate an architectural space and improveefficiency, accessibility, and safety of the built environment. Good design spaceand wayfinding system can help people to decrease frustration, stress, anxietycaused by getting lost. Our research investigated multi-agent simulation, spacesyntax, and VR simulation. In the first two computation methods, the simulationwas a result of the interaction between agents and their environment and themodulation of agents’ behaviors within external rules. Comparing with the firsttwo methods, the avatar-based wayfinding provided a closer result to the reality.It relies on the real human players and their wayfinding rationales. Together withsurvey and questionnaire, both quantitative and qualitative feedback was collected.As a result, the new AAVR approach produced measurable improvement in thewayfinding simulation.
However, this AAVRmethod has a few limitations. Realizing the crowds were

512 M. TANG
computer generated props, the participants often ignored these agents and onlyevaluated the environment to facilitate wayfinding decisions without the influenceof the crowds. Lacking the avatar to agent interaction, avatar’s behavior wasisolated from the influence of the crowds in the egress scenario. In our nextphase investigation, the AAVR-based analysis would be able to allow multipleparticipants to experience a shared space like a mass multi-player game andinfluence each other. We are currently designing a multiuser interface of AAVRto integrate remote players as avatars into a shared VR. We are also working oncapturing eye-tracking data of a player in the VR environment. The goal is to examthe gaze pattern and fixation duration allowing researchers to study the humanperception and attention to various spatial features related to the wayfinding.
ACKNOWLEDGMENTSThis project is led by Ming Tang, architect, associate professor at theSchool of Architecture and Interior Design, Univerity of Cincinnati. Wethank Communication Urban Environment (CUE) grant, FDC Department &Interdisciplinary Grant at University of Cincinnati, and student Craig Moyer,Michael Rogovin, Laura Kennedy, Joe Gruzinsky, Niloufar Kioumarsi at theUniversity of Cincinnati for their contribution. More information about the projectis available at ming3d.com
ReferencesAschwanden, G.: 2012, Agent-Based Social Pedestrian Simulation for the Validation of Urban
Planning Recommendations, sigradi 2012.Batty, M.: 2007, Cities and Complexity, Understanding Cities with Cellular Automata,
Agent-Based Models, and Fractals., MIT Press.Chen, P. and Feng, F.: 2009, A fast flow control algorithm for real-time emergency evacuation
in large indoor areas, Fire Safety Journal, April 2009, 732-740.Cheng, M., Chiub, K., Hsiehc, Y., Yangd, I. and Chou, J.: 2016, Development of BIM-based
Real-time Evacuation and Rescue System for Complex Buildings, Proceedings of 33rdInternational Symposium on Automation and Robotics in Construction (ISARC 2016).
Kevin, L.: 1960, The Image of The City, MIT press.Romedi, P.: 1992, Wayfinding: People, Signs, and architecture, Mcgraw-Hill.Wang, B., Li, H., Rezgui, Y., Bradley, A. and Ong, H.: 2014, BIM Based Virtual Environment
for Fire Emergency Evacuation., The Scientific World Journal, Volume 2014, 22.

Human-Computer Interactionand Wearables

514

LUDI: A CONCURRENT PHYSICAL AND DIGITAL MODELINGENVIRONMENT
LU HAN1 and DANIEL CARDOSO LLACH21,2Carnegie Mellon [email protected] [email protected]
Abstract. This paper explores the potential of a concurrent physicaland digital modeling environment. We describe a prototype for anovel design modeling interface where users can take advantage of theaffordances of both physical and digital modeling environments, andwork back and forth between the two. Using Processing, along with theKinect depth sensor, the system uses depth data read from a physicalmodeling space to produce an enhanced digital representation in realtime. Users can design by moving and stacking wooden blocks ina physical space, which is represented (and enhanced) digitally as a“voxel space,” which can in turn be edited digitally. The result is aproof-of-concept concurrent physical and digital modeling environmentcombining design affordances specific to eachmedia: the physical spaceoffers tactile and embodied forms of design inter-action, and the digitalspace offers parametric editing capabilities, along with the capacityto view the modeling space from different perspectives, and performbasic analyses on designs. Following a brief review of experimentalcomputational and tangible interaction design interfaces, the paperdiscusses the system’s implementation, its limitations, and future steps.
Keywords. Computational Design; Processing; ConcurrentModeling Environment; Tangible Interaction.
1. IntroductionWe propose that physical objects may serve as interfaces to their own digitalrepresentations in a modeling environment that combines the capacities of bothphysical and digital media. Useful features of digital modeling tools includedrawing accuracy, the encapsulation of data within different components, thecapacity to create realistic renderings through texture mapping, performance andcontextual simulation, navigation from different views on the same screen, savingand preserving data, parametric flexibility, among others (Fukuda, Tomohiro, etal. 9). A key strength of physical models in design is that users can touch themdirectly. The shape and material qualities of graspable objects arouse our naturalintuition, and our desire to touch and play (Papert, “Constructionism”). Further,physical models allow for multiple interactions at the same time, and can help toquickly and more accurately communicate scaling and spatial concepts (Sun, Lei,et al 28).
T. Fukuda, W. Huang, P. Janssen, K. Crolla, S. Alhadidi (eds.), Learning, Adapting and Prototyping,Proceedings of the 23rd International Conference of the Association for Computer-Aided ArchitecturalDesign Research in Asia (CAADRIA) 2018, Volume 1, 515-523. © 2018 and published by the Associationfor Computer-Aided Architectural Design Research in Asia (CAADRIA) in Hong Kong.

516 L. HAN AND D. CARDOSO LLACH
While the benefits of both physical and digital modeling can help tocomplement the other’s shortcomings, the workflow between them is oftensegmented (Fukuda, Tomohiro, et al. 9). Prior work addressing thisarea include configuring a robotic system as an interactive design partneroperating on a “chaotic” micro-world of cubes (Nicholas Negroponte’s SEEK);coupling physical objects or ‘interactors’ with digital interfaces to present usefulinformation (Underkoffler, Ishii, “Urp.”); to design (Viny, Dabholkar, andCardoso Llach); or to bring the fluidity and precision of digital representationsto shape-changing physical artifacts (Follmer, Leithinger, Olwal, Hogge, Ishii,“inform”). Similarly, researchers have explored synchronized modeling processeswhere digital representations can be quickly materialized through a system ofmodular rods (Fukuda, Tomohiro, et al. 9).
In contrast with these approaches, our research asks how a low-fidelitymodeling environment may enable concurrent design across physical and digitalmedia. Two practical goals guided this exploration concerning our system:
• Users shall be able to design by open-endedly configuring and reconfiguringphysical objects;
• The system shall offer a constantly-updating digital representation of thephysical modeling environment enabling users to refine, change, or evaluateaspects of the design.
For example, the proposed system would enable a user to physically reconfigurea set of physical components and then parametrically edit it, or perform basicanalysis on it, in the digital environment. By enriching digital editability withtangible interaction, our approach echoes constructionist ideas about embodiedcognition (Papert, “Constructionism”), including playful kits for design andeducation such as Froebel’s gifts (Provenzo Jr. 87).
2. MethodsWe chose a simple design vocabulary of 2-inch x 2-inch wooden cubes, whichoffer countless possibilities for rearrangements. The cubes are arranged in a flat20 -inch x 20-inch x 20-inch gridded workspace equipped with a Microsoft Kinectsensor, which tracks their position. Using the Processing programming language,we wrote software that reads the Kinect’s depth sensor data and reconstructs thephysical workspace as a digital voxel-space (Figure 1). Similar to a pixel, whichhas X and Y coordinates, a voxel has X, Y and Z coordinates. By mapping datapoints to virtual voxel points, the workspace can be visualized and manipulatedcomputationally in real time.

LUDI: A CONCURRENT PHYSICAL AND DIGITAL MODELINGENVIRONMENT
517
Figure 1. Depth to Voxel - Mapping Process, showing 1) Cubes in physical space; 2) Top viewof cubes from Kinect’s perspective; 3) Kinect’s depth data as represented by color; 4) Boxesare drawn inferred from depth data in voxel space; and 5) Digital representations of cubes in
physical space.
The Kinect sensor is fixed three feet above the workspace (see Figure 2). Itsviewport is cropped to an evenly gridded modeling space that fits exactly a matrixof 10 x 10 x 10 2-inch cubes. The software parses the Kinect depth data and -based on the height of the tallest surveyed point - infers the presence of cubes ateach point in the 3-D matrix. Based on this evaluation, the drawing space turnseach voxel on or off, offering a real-time representation of the workspace.

518 L. HAN AND D. CARDOSO LLACH
Figure 2. Ludi’s physical workspace.
3. Graphical User Interface and ViewportsA graphical user interface (Figure 3) offers users various features including modelviewports, basic shape editing, a “save” feature, and visual analysis. The system’sGUI was created with the G4P library in Processing. Users can rotate the scenearound the X, Y, and Z axis in the main viewport. Further, users have the optionto see the plan view and left, right, front and back elevations in other viewports(Figure 4). The brightness of the color in the plan and elevations indicate howclose or far away it is from the view of the “camera” - the brighter the color, thecloser the object from that viewpoint. These different viewports are updated inreal time as the user interacts with the physical cubes.

LUDI: A CONCURRENT PHYSICAL AND DIGITAL MODELINGENVIRONMENT
519
Figure 3. Ludi’s graphical user interface.
Figure 4. Multiple viewports displaying plan and elevations.

520 L. HAN AND D. CARDOSO LLACH
4. Editing GeometryBuilding on the idea that users can work back and forth between the two media-playing around with the configuration of the cubes in physical space, whileediting shapes in the digital space- we created two simple shape changing andediting features. We first offer four basic primitives (cubes, spheres, cones, tubes)selectable on the interface so that users can quickly and easily change geometricrepresentations in the model viewport. Second, we present a simple shape-editingprototype, where users can slide a bar to explore basic parametric manipulations(Figure 5). In such ways, the cubes may be seen as physical embodiments,proxies, or interactors for digital representations -encouraging a special type ofform-making experimentation.
Figure 5. Options to select and manipulate primitive representations.

LUDI: A CONCURRENT PHYSICAL AND DIGITAL MODELINGENVIRONMENT
521
5. Saving ConfigurationsA basic “save” feature allows users to keep ‘snapshots’ of configurations beforerearranging physical objects and editing geometric forms. The saved configurationpops up in a new window for convenient quick comparisons.
6. Visual AnalysisWe implemented a simple visual analysis function that colors the geometricelements according to the order in which they were placed in the physical space.The potential of this feature is to help distinguish the history of the model, todifferentiate the temporary movements and noise data from the permanent, andthe intentional. We can also take this concept further to map brightness of thecolors to reflect the time for which each unit of geometry was placed. In this way,we show how the digital space can reflect not only movements and positions, butalso additional data about the physical construction of the model.
7. ResultsThe prototype was on display in an art gallery in Pittsburgh, where it was availableto a range of gallery crawlers comprising faculty, students, and curious passersby -giving us an opportunity to informally observe people’s interactionwith the system(Figure 6). We witnessed around 30 casual user interactions, and observed thatwhen people approached the system, everyone’s inclination was first to touch thecubes, ignoring the screen and mouse. Unsurprisingly, children were less cautiousthan adults. They seemed to enjoy playing with the physical cubes, and seeing themirroring digital representations. Adults spent comparatively more time trying tounderstand how the system worked, and tried to test its limits by moving thingsaround to find the “boundaries” and making various configurations, seeminglytrying to understand the logic of the system, and its limitations.
An important limitation of the system is that the digital representation is lessflexible than the physical modeling space. While users can move the woodenblocks to any position in the physical workspace, the digital voxel-space is anorthogonal three-dimensional grid whose cells are either on or off. First-timeusers mostly did not want to follow this rigid grid and wanted to break the rules.Many experimented with stacking, rotating, and creating overhangs with the cubes,pushing the system’s limits. The digital representation is simply not as flexible asthe physical one.
A second limitation is that the system cannot distinguish between the users‘hands and the cubes. Users’ hands thus created ‘noise’ which was fascinating tosome, but distracting to others. We observed one user who flinched when firsttrying to touch the cubes after seeing the noise data appearing in digital model (hethought he had broken the system). Although we included measures to remedythis (by using color and time analysis to distinguish users‘ hands from the cubes),the system was only able to reconstruct the workspace digitally once users’ handswere away from the physical modeling space.

522 L. HAN AND D. CARDOSO LLACH
Figure 6. A user interacting with the system.
8. Next StepsMore formal testing is needed to test Ludi’s capacity to enable design work acrossboth digital and physical media. Although users were informed about its editingfeatures, most were more interested in playing and stacking the cubes while simplyseeing the digital representation on the screen, only a few engaged with its userinterface.
Several further improvements can be made. For example, equipping the cubeswith fiducial markers and physical sensors may improve the accuracy of the cubes‘positional data, and help track additional movements such as cube rotation andflipping, as well as reducing noise data from users’ movements. This wouldalso open another potential avenue of development. By identifying each cube asan individual entity, one-to-one mappings between physical and digital elementsbecome possible. For example, what if clicking on a cube in digital space cause thecorresponding physical cube to light up or vibrate? Finally, the ideas and concepts

LUDI: A CONCURRENT PHYSICAL AND DIGITAL MODELINGENVIRONMENT
523
in this project can be applied to malleable physical objects in future studies. Wecan take user manipulation to go beyond merely spatial movement to also includethe recognition of object deformation.
9. ConclusionThis paper presented a proof-of-concept prototype for a low-fidelity modelingenvironment allowing users to interact with both tangible objects and digitalrepresentations. It can be seen both as a physical interface to a digitalmodeling environment, or as a digital augmentation of a physical modelingspace. These mutual augmentations include the capacity for exploring multipleviews and perspectives, a “save” feature to quickly capture and preserve variousconfigurations, simple parametric editing capabilities, as well as a simpletime-based analysis of the design process using color. Based on a limited numberof informal user interactions observed, the system suggests that there is muchto gain by mutually-complementary physical and digital modeling environments.Some limitations and opportunities for future development were discussed. Wehope that the ideas and methods presented inspire others to study concurrentphysical and digital spaces and their potential in design and human-machineconfigurations.
References“Nicholas Negroponte’s SEEK” : 2011. Available from <https://www.cyberneticzoo.com/robo
ts-in-art/1969-70-seek-nicholas-negroponte-american/> (accessed 27th April, 2017).Follmer, S., Leithinger, D., Olwal, A., Hogge, A. and Ishii, H.: 2013, inFORM: Dynamic
Physical Affordances and Constraints Through Shape and Object Actuation, UIST.Fukuda, T.: 2016, A Dynamic Physical Model Based on a 3D Digital Model for Architectural
Rapid Prototyping, Automation in Construction, 72, 9-17.Provenzo Jr., E.: 2009, Friedrich Froebel’s Gifts, American Journal of Play, 2, 85-99.Papert, S.: 1986, Constructionism: A New Opportunity for Elementary Science Education,
Massachusetts Institute of Technology, Media Laboratory, Epistemolo-gy and LearningGroup.
Sun, L.: 2014, Differences in Spatial Understanding between Physical and Virtual Models,Frontiers of Architectural Research, 3, 28-35.
Underkoffler, J. and Hiroshi, I.: 1999, Urp, CHI ’99.Viny, A., Dabholkar, A. and Cardoso Llach, D.: 2017, Two Design Experiments in Playful
Architectural Adaptability, Nexus Network Journal.


PROTOTYPING A HUMAN-BUILDING INTERFACE WITHMULTIPLE MOBILE ROBOTS
CHIN KOI KHOO1, RUI WANG2, ANASTASIA GLOBA3 andJULES MOLONEY41,2,3,4IDeEA lab, Deakin University1,2,3,4{chin.khoo|rui.wang|anastasia.globa|jules.moloney}@deakin.edu.au
Abstract. Recent advances in miniature mobile robotic researchhave generated possibilities and potentials in a range of fields suchas the military, rescue operations, logistics and education. Withinarchitecture, especially in responsive architecture and architecturalinterface disciplines, there has been minimal uptake of this technology,and so its full potential and implications have not been fully explored.In this paper, we propose a design exploration of a human-buildinginterface (HBI) with multiple mobile robots serving as ‘physical pixels’,which investigates the latent possibilities of public interactive displaysand media screens, potentially provoking interaction with existing builtenvironments. The outcomes of this paper include an early-stage designstudy of an HBI prototype, PixelFace, which has been developed withmultiple spherical mobile robots and an existing building structure. Anearly physical implementation of the HBI as an interactive public displaywith real-time physical movement that encourages playful interaction isalso included.
Keywords. Human-Computer Interaction; Human-BuildingInterface; Mobile Robots; Responsive Architecture.
1. IntroductionCurrent digital technology and interface design are poised to cause vast changes inthe way we interact with our existing spaces and built environment. The field ofresponsive architecture has been greatly influenced by these changes, enhancingpublic interaction between human beings and the space surrounding them (Sterk2006). Interface design, mostly applied in the area of human-computer interaction(HCI), is now considered a crucial discipline that supports the implementation ofresponsive architecture such as interactive media facades and surfaces (Meagher2014).
Additionally, recent interface design has been gradually moving from commondevices for interacting with graphical user interfaces (GUIs), such as keyboards,mice and monitor screens, to tangible user interface (TUI) devices. TUls areuser interfaces that let users interact with digital information through the physicalenvironment. These represent a new way to realise Mark Weiser’s vision of
T. Fukuda, W. Huang, P. Janssen, K. Crolla, S. Alhadidi (eds.), Learning, Adapting and Prototyping,Proceedings of the 23rd International Conference of the Association for Computer-Aided ArchitecturalDesign Research in Asia (CAADRIA) 2018, Volume 1, 525-534. © 2018 and published by the Associationfor Computer-Aided Architectural Design Research in Asia (CAADRIA) in Hong Kong.

526 C.K. KHOO ET AL.
ubiquitous computing by integrating digital technology into the fabric of thephysical environment (Dourish and Bell 2011). However, most TUIs remain partof small-scale interactive devices, and TUIs are rarely explored in larger-scalecontexts such as architecture and the built environment (Ibanez and Naya 2013).
Recent developments in large-scale architectural interfaces, such as mediafacades and screens, have been limited and undermined by a lack of engagementwith users and a lack of flexibility to accommodate future technological upgradesor changes. These hindrances provide the motivation to seek alternative methodsfor designing a tangible architectural interface as an interactive public display,particularly for existing buildings. This would provide the advantage of increasedpublic interaction and engagement with more flexible, mobile, scalable-andpossibly future-proof-physical, animated objects (Ju and Sirkin 2010).
Also, recent research advances in miniature mobile robotics have generatedpossibilities and potentials in a range of fields such as the military, rescueoperations, logistics and education (Tan et al. 2016). Within the disciplines ofhuman-computer interaction (HCI) and architecture, there has so far been mini maluptake of these technologies to fully explore their potential and implications.
Instead of developing architectural interfaces with rigid, uneconomical andin flexible display technologies, such as LED screens, there is the potential toaugment existing buildings or built environments. These can be made interactive,responding to physical motion in a way that encourages public interaction with aplayful, game-like platform (Huizinga J 1998).
Since engagement and interactivity are the key factors in creating an effectivepublic interaction and display (Ojaja et al. 2012), in this paper we explore differentpossibilities of physicality and motion that will improve the approachability ofand engagement with public displays and tangible interaction devices integratedwith the existing built environment. This approach is implemented with discrete,flexible and retrofitted physical interventions such as mobile robotic devices, tocreate a human-building interface (HBI) formed by multiple mobile robots. Theproposed HBI is retrofitted to an existing building, whereby multiple mobile robotsform a playful ‘game’ platform that encourages passers-by to engage and interactwith existing building elements.
As a way to structure this approach, we adapt research into HCI and responsivearchitecture that refers to latent possibilities for action, which we present through adesign exploration. PixelFace acts as an HBI that interacts with passers-by throughmultiple mobile robots serving as physical ‘pixels’ that perform playful interactivemovement and shadow play, which encourages rapid engagement and interactionwith existing building elements such as floors and ceilings. The outcomes of thisresearch provoke design reflections on where and how miniature mobile robotscan be used to increase user engagement and interaction. Discussion of those re flections is aligned with the field of responsive architectural interfaces and playfulambient environments.
This paper will, then, report on the study of an HBI through an early designexploration and preliminary prototypical implementation. This exploration beginsfrom two enquiries: a) What are the latent possibilities of HBI to encourage public

PROTOTYPING A HUMAN-BUILDING INTERFACE WITH MULTIPLEMOBILE ROBOTS
527
interaction with existing buildings through the use of multiple mobile robots withphysicality and motion capabilities?; b) How can interactive public interfaces bedesigned that incorporate physical motion over on-screen or projection displays?
Overall, the contributions of this paper include: 1) An early-stage designstudy of a human-building interface prototype, PixelFace, which is developed withmultiple spherical mobile robots; 2) Early physical implementation of the HBI asan interactive public display that encourages playful physical movement.
2. Interactive architectural interfaces and mobile robotics2.1. ARCHITECTURAL INTERFACES
Architectural interfaces are not new, and most of their current design implicationsand applications are recognised in the areas of media facades and HCI(Mignonneau and Sommerer 2008). Architectural media facades such as theBIX facade in the Kunsthaus Graz in Austria (Elder and Elder 2003) designedby realities:united in 2003, and the Tower of Winds media facade developed byToyo Ito in 1986 (Chiu 2009) are considered earlier precedents for large-scalearchitectural interfaces. Although the interfaces took different approaches todesign implementation of lighting display, they are each considered pioneers ofthe architectural media facades developed recently for communication, socialinteraction and climatic purposes. However, most of these architectural interfaceshave remained media facades that do not function as fenestration devices withpermeability properties that allow moderation between interior and exterior spaces(Khoo and Salim 2012). Also, lack of flexibility and adaptability in thesearchitectural interfaces becomes the main hindrance for future improvement whenthe technology becomes obsolete or the functional requirements change.
Flexible large-scale architectural interfaces can be achieved by applying ahuman-building interaction approach to existing building structures and surfaces,if those interfaces are created with flexible or even replaceable devices. Miniaturemobile robots, especially wheel-based spherical robots, demonstrate potential asdevices through which to explore the new possibilities of architectural interfacesas HBI. The following subsection briefly discusses this potential in relation toselecting an off-the-shelf spherical mobile robot (SMR) to design an architecturalinterface.
2.2. DESIGNING ARCHITECTURAL INTERFACES WITH MOBILE ROBOTS
In many fields, including robotics and computer science, applications for miniaturemobile robots have been proposed, and their implications investigated, since the1980s (Dudek et al. 1993). Yet, few have explored their application in thediscipline of HCI, let alone architectural design. The accessibility, affordabilityand advancement of current micro-mobile robot technology, especially in SMRs,allow researchers and designers to explore relevant design implications, especiallyin responsive architectural surfaces and interfaces.

528 C.K. KHOO ET AL.
Figure 1. Left: Sphero programmable spherical mobile robots. Right: Sphero SPRK.
Sphero, as an off-the-shelf SMR, has been selected to explore the developmentof HBI, instead of creating a mobile robot from scratch, due to its affordability,accessibility and programmable flexibility. Sphero was originally developed asa programmable spherical robot to inspire students and children to learn codingand programming through a creative and inventive robotic platform (Figure 1).Besides functioning as an educational tool for programming, Sphero demonstratesvast potential when programmed with an algorithm and control system. Theouter sphere of Sphero is protected by a durable UV-coated polycarbonate shell toprevent damage to its internal devices and mobile mechanism. It is equipped withBluetooth connectivity up to a range of 30m and has a speed of 2m per second.The built-in LEDs can also be programmed to light up in different colours. Thesetechnical specifications of the Sphero make it the most appropriate wheel basedSMR to apply in the physical implementation of PixelFace.
Figure 2. Left: A semi-open courtyard space serves as the ‘backdrop’ for PixelFace. Right: A3D diagram of PixelFace retrofitted on a steel pergola structure, and its overall context in an
existing courtyard. .
3. Pixelface as human-building interfacePixelFace serves as the proof of concept of an HBI formed from a series ofSMRs, which can be applied in the interior and exterior spaces of an existingbuilt environment. The proposed PixelFace is retrofitted above the semi-openspace of an existing courtyard to create an interactive ambient environment (Figure2). The structural base of PixelFace is afforded by a transparent polypropylenepanel 4m long × 3.36m wide × 9mm thick, which provides a smooth surface to

PROTOTYPING A HUMAN-BUILDING INTERFACE WITH MULTIPLEMOBILE ROBOTS
529
allow seamless locomotion of each SMR and allows light fenestration below thecourtyard.
Due to its advantages of reliability and a simple control mechanism, the wheel based SMR is the preferred type for developing PixelFace. Instead of developinga new type of wheel-based SMR, Sphero was selected due to its efficiency,reliability, durability and programmability. A total of l00 SMRs were proposedto serve as the spherical ‘pixels’ of PixelFace to perform various formations andpatterns (Figure 3). However, only two hacked Spheros serving as physical ‘pixels’have been applied in the early use of PixelFace, integrated with an interactiveprojection of the other SMRs, digitally represented, to form a hybrid ambientarchitectural interface. This integration of a physical and digital approach notonly minimises the cost and technical issues involved in the overall set-up, butalso increases the flexibility and scalability of PixelFace to accommodate futuredevelopments and changes.
Figure 3. Top: PixelFace is formed from a transparent polypropylene surface and SpheroSMRs. Bottom: Ten formations and patterns PixelFace could represent with 100 SMRs.
The initial set-up of PixelFace reveals the feasibility of its implementationthrough a hybrid approach with digital projection and SMRs, and its applicabilityfor manipulating the ambience of existing spaces and as a form of horizontal HBI(Figure 4). The hybrid approach creates a flexible and adaptable platform that canaccommodate future changes and provides a novel interactive ambient experiencefor users through its performative attributes of interactive shadow play and lighting,which produce various visual and graphical patterns (Figure 3). These attributesare delivered by the SMRs, which are embedded with a leader-follower algorithmthat enables them to respond to human movements as inputs, including hand and

530 C.K. KHOO ET AL.
body gestures registered by the Microsoft Kinect, a motion-sensing input device.The leader-follower algorithm approach allows one SMR acts as a leader whosemotion defines the path for the entire groups of the follower SMRs that positionthemselves in accordance with the position and orientation of the leader SMR(Madhevan ann Sreekumar 2013)
Figure 4. Sectional diagram to illustrate the overall mock-up of PixelFace and the relativeplacement of each component: SMRs (Sphero), Kinect and LCD projector.
One of the major challenges in developing HBIs with SMRs is achievingcooperative control of multiple robots. The requirements include that eachrobot’s behaviour is affected by its neighbour’s actions and that, instead of eachrobot performing individually, the group must perform as a team (Dong 2011).In the last two decades, many studies have been done and methods proposedto overcome this challenge; solutions explored have included behaviour-basedcontrol, a virtual structure for cooperative control and a leader-follower approach(Dong 2011). The following section will explore the initial design of PixelFacearound a behaviour-based control method with digital and physical simulation.
4. Design exploration with digital and physical simulationThere are several user interaction (UI) devices that enable interaction with multipleSMRs using the leader-follower approach. Instead of conventional UI devicessuch as a touchscreen display, keyboard and mouse, a natural user interaction(NUI) de vice such as Kinect is used for this approach, as it offers a more immersiveuser experience, usually through natural hand gestures or body movement (Miuraet al. 2016). Before the physical simulation of PixelFace with Sphero, a digitalsimulation of multiple SMRs based on the leader-follower algorithm of the Unitygaming platform was developed as a pilot study and early evaluation of theinteractivity aspect of PixelFace in an augmented environment. In this study,the Kinect served as an interactive input device offering natural interaction with

PROTOTYPING A HUMAN-BUILDING INTERFACE WITH MULTIPLEMOBILE ROBOTS
531
digitally simulated SMRs.
Figure 5. Sequential images of the early study of natural hand-gesture interaction withdigitally simulated SMRs in an augmented environment.
Figure 6. Ten digitally simulated SMRs forming a linear spline formation interact with theuser’s head movement. .
4.1. DIGITAL SIMULATION
Multiple simulated SMRs are digitally represented as 10 spheres that performleader-follower behaviour when interacting with two types of user movement(hand and head) as inputs in the augmented environment. Figure 5 illustratesthe initial study of the interaction, in an augmented environment, of the multipledigitally simulated SMRs with natural hand gestures through the Kinect inputdevice. In this setting, the leader of the 10 spheres follows hand movements toperform leader-follower behaviour in a linear spline formation. This behaviouris also able to interact with different inputs, such as head movement, due to theadvanced motion-sensing abilities of the Kinect (Figure 6). Both inputs serve asexamples of gestures users may actually use to interact with the final physicalimplementation of PixelFace.
These rather straightforward studies of the leader-follower behaviour for theSMRs, controlled via the Kinect, are followed by a further feasibility study asa prologue to the subsequent physical simulation of multiple SMRs. As anextension of previous studies of user inputs to multiple SMRs in an augmentedenvironment, this prologue study of PixelFace uses a slightly different approach.It projects the simulated skylight of a proposed semi-open courtyard space withinteractive simulated SMRs on an existing ceiling, forming a simple study of theambient qualities of PixelFace (Figure 7). The outcome of this simple approachprovides early insights and experience related to PixelFace with a minimumof cost and technical complexity. In this study, the number of spheres in theformation, and their behaviour, remain identical to those in previous studies forconsistency. Although this simulated interactive display offers a certain degree ofaccuracy, and insights into the interactive ambient experience for users in terms of

532 C.K. KHOO ET AL.
leader-follower formations and visual patterns, there are limitations. It is almostimpossible to demonstrate PixelFace’s shadow-play and illumination capabilities,which can only be generated by the physical SMRs as they respond in variousexternal and internal lighting conditions.
Figure 7. A preliminary study of PixelFace involving projection of a courtyard skylight thatallows interaction between users and multiple digital SMRs.
This simple study using digitally simulated SMRs not only provides someearly insights and understandings useful for the further development of the designimplementation of PixelFace, but also identifies early challenges to seamlessinteraction with a group of physical SMRs (Spheros) on a flat physical surfaceusing the Kinect as an input device. Subsequent section of this paper will conciselyaddress these challenges and use a simple approach to overcome them and producean early implementation of PixelFace using simple leader-follower algorithm fromthe Unity game-development platform.
Figure 8. Hand-gesture interaction, through the Kinect, with two Spheros as physical ‘pixels’performing leader–follower behaviour.
4.2. PHYSICAL SIMULATION
Instead of a full-scale physical prototype, we initiate a first-stage physicalmock-up of PixelFace to reveal the feasibility and applicability of itsphysical implementation. In this mock-up, two physical Spheros simulate theleader-follower behaviour. This physical simulation is considered a pilot studyto evaluate the feasibility of the physical implementation of PixelFace. The two

PROTOTYPING A HUMAN-BUILDING INTERFACE WITH MULTIPLEMOBILE ROBOTS
533
Spheros serve as physical ‘pixels’ that interact with hand gestures through theKinect input device (Figure 8). The outcome of this simulation provides earlyobservations and evaluations of physical interaction with PixelFace constructedwith the Sphero SMRs.
Figure 9. Potential shadow play of PixelFace in an existing semi-open courtyard space.
This physical simulation will eventually facilitate a flexible and adaptableplatform that can accommodate future changes, which provides a novel interactiveambient experience for users or participants through its performative attributesof interactive shadow play and ambient lighting producing various visual andgraphical patterns (Figure 9).
5. Conclusion and future workDesign exploration of PixelFace as an HBI composed of SMRs has providedpreliminary yet insightful research outcomes. These outcomes demonstratethe challenging possibilities and potentials of large-scale architectural interfacesin encouraging public interaction with existing buildings through the use ofmultiple mobile robots equipped with physicality and motion capabilities. Thisapproach has been proposed to deliver an early and promising starting pointfor HBIs created with mobile robotics, through digital simulation and aninitial physical implementation. This type of HBI could provide a flexibleand replaceable architectural interface for existing buildings, which might beconsidered ‘future-proof’ through its ability to adapt to changes by aligning withtechnological advancements to provide updated functions. Future work willinclude a full physical implementation of PixelFace and evaluation through a

534 C.K. KHOO ET AL.
limited user study to further validate the potential implications of PixelFace asa public HBI.
ReferencesChiu, H.S.: 2009, Research on Hybrid Tectonic Methodologies for Responsive Architecture,
Proceedings of CAADRIA 2009, Yunlin, 493-502.Dong, W.: 2011, Flocking of Multiple Mobile Robots Based on Backstepping, IEEE
Transactions on Syetem, Man, and Cybernetics-Part B: Cybernetics, 41(2), 414-24.Dourish, P. and Bell, G.: 2011, Divining a Digital Future: Mess and Mythology in Ubiquitous
Computing, MIT Press.Dudek, G., Jenkin, M., Milios, E. and Wilkes, D.: 1993, A Taxonomy for Swarm Robots,
Proceedings of the 1993 IEEE/RSJ International Conference on Intelligent Robots andSystems, Yokohama, 441-47.
Elder, J. and Elder, T. 2003, Communicative display skin for buildings: BIX at the KunsthausGraz, in B. Kolarevic and A. Malkawi (eds.), Performative Architecture – BeyondInstrumentality, Taylor & Francis, New York, 150-160.
Huizinga, J.: 1998, Homo ludens : a study of the play-element in culture, Routledge, London.Ibáñez, L.A.H. and Naya, V.B.: 2013, The Building as the Interface: Architectural Design
for Education in Virtual Worlds, Lecture Notes in Computer Science (Including SubseriesLecture Notes in Artificial Intelligence and Lecture Notes in Bioinformatics), 8022 LNCS(Part 2), 152-61.
Ju, W. and Sirkin, D.: 2010, Animate Objects: How Physical Motion Encourages PublicInteraction, Lecture Notes in Computer Science (Including Subseries Lecture Notes inArtificial Intelligence and Lecture Notes in Bioinformatics), 6137 LNCS, 40-51.
Khoo, C.K. and Salim, F.D.: 2012, A responsive morphing media skin, Proceedings ofCAADRIA 2012, Chennai, 517-526.
Madhevan, B. and Sreekumar, M.: 2013, Tracking Algorithm Using Leader Follower Approachfor Multi Robots, Proceedings of IConDM 2013, Chennai, 1421-1435.
Meagher, M.: 2014, Responsive Architecture and the Problem of Obsolescence, Archnet-IJAR,8, 95-104.
Mignonneau, L. and Sommerer, C.: 2008, Media Facades as Architectural Interfaces, Studies inComputational Intelligence, 141, 93-104.
Miura, T., Urakawa, S., Isojima, M., Yu, J., Yoshii, A. and Nakajima, T.: 2016, Natural UserInteraction Requires Good Affordance When Using a Head-Mounted Display, Proceedingsof MMEDIA 2016 : The Eighth International Conferences on Advances in MultimediaNatural.
Ojaja, T., Kostakos, V., Kukka, H., Heikkinen, T., Lindén, T., Jurmu, M., Hoslo, S., Kruger,F. and Zanni, D.: 2012, Multipurpose Interactive Public Displays in the Wild: Three YearsLater, Computer, 45, 42-49.
Sterk, T.: 1997, Responsive Architecture: User-Centered Interactions within the HybridizedModel of Control, Proceedings Of The Game Set And Match II, On Computer Games,Advanced Geometries, and Digital Technologies, 494-501.
Tan, N., Mohan, R.E. and Watanabe, A.: 2016, Toward a Framework for Robot-InclusiveEnvironments, Automation in Construction, 69, 68-78.

NO KEYBOARD, NO MOUSE
Hybrid Digital-Analog Hardware Design for Enhancing Design UI and UX
EBRAHIM POUSTINCHI1, SHENGMIAN WANG2 andGREGORY LUHAN31Kent State [email protected],3University of Kentucky2,3{shengmian.wang|gregory.luhan}@uky.edu
Abstract. This paper presents a mixed-method researchdesign investigation that integrates a Hybrid Digital-AnalogSoftware-Hardware protocol referred to as the No Keyboard, NoMouse(NK-NM) platform. The NK-NM process uses both theoretical andapplied research mechanisms to measure its influence on architecturaldesign decision-making, knowledge exchange, student learning,aesthetics, and user experience in the context of an undergraduatearchitectural design studio. Observing a recognized gap in thecurrent digital architectural design environments this paper detailshow the NK-NM protocol bridges this gap through an instructedhierarchical design process, customizable physical interface, anditerative simulation-based feedback loop.
Keywords. Digital Hardware; Digital Design; Pedagogy;Human-computer Interaction; Physical computation.
1. Introduction:A literature review revealed that tools and methods for making and engagingwith design, engineering, and architecture are becoming both more pervasive,integrated, and accessible. Combined with rapid prototyping methods that arebecoming more ubiquitous and affordable there is an opportunity to developa formative framework of computationalism and experiential movement. Asa consequence of this “freedom,” there is an increased necessity to questionconventional methods for design, which is particularly true for design studioenvironments infused with design research modalities that challenge students toproduce performative results regardless of their personal level of knowledge ordesign acumen. When it comes to design students with limited design expertiseor non-design students with no design background, understanding how to make“valid” design decisions that leverage the vast possibilities of design softwareresult in two extremes - either the hesitancy to make informed decisions or theincreased facility to make uninformed decisions.
T. Fukuda, W. Huang, P. Janssen, K. Crolla, S. Alhadidi (eds.), Learning, Adapting and Prototyping,Proceedings of the 23rd International Conference of the Association for Computer-Aided ArchitecturalDesign Research in Asia (CAADRIA) 2018, Volume 1, 535-544. © 2018 and published by the Associationfor Computer-Aided Architectural Design Research in Asia (CAADRIA) in Hong Kong.

536 E. POUSTINCHI, S. WANG AND G. LUHAN
The generative idea behind the No Keyboard/No Mouse (NK-NM) researchcontributes to the established culture of “instruction” in the design studio, wherea framework of guidelines, limitations, and programmatic definitions inform thedesign solutions as both 2-, 3-, and 4-dimensional digital and fabricated outcomes.The method proposed in this paper embeds the traditional vehicle for instructionbetween the instructor and students in the design software/hardware platform asa new design tool/device: NK-NM. The NK-NM research project improves uponearlier investigations where design-researchers attempted to develop innovativedesign platforms that facilitated creative interactions between the designer andnon-design oriented user groups. These previous studies deployed only enhanceddigital design processes limited to software and algorithmic developments. TheNK-NM research project, however, is not constrained by the software ordigital design environment. Instead, it leverages existing design software andprogramming platforms to heighten user experience by formatively situating theuser and the design platform within an interactive context that harnesses the“master-designer’s” knowledge and then connects it with qualities that can betailored to define design parameters, rules, and controls.
2. Guiding Questions:This research examines three primary research questions:1. How can the proposed NK-NM platform, challenge the traditional design process
and decision-making by introducing an “instructed” hierarchical design-makingmatrix?
2. How can the design interface become easier toworkwith and enablemore in-depthexploration through the use of actual physical interface/hardware design?
3. How can the NK-NM instructional platform make digital design protocols andrapid-prototyping processes accessible in response to today’s rapidly changingand increasingly more complex environments?
3. Informal Observations:The traditional dialogue between architectural design platforms, game design, andthe gaming environment presents a range of different approaches to operating withinformation from its processing to its representation. William J. Mitchell whendiscussing the computer processors and programming, concerning their operatingtimeline, says that the first computers “were strictly sequential machines executingone operation at a time; programming was a matter of specifying these operationsin precise order.” He then compares that to the new computational process:“For example, computer animations of three-dimensional environment could becomputed and stored for later playback, or as in today’s video game framework,they could be computed and then presented on the fly, with no perceptible timelag” (Mitchell, 2003).

NO KEYBOARD, NO MOUSE 537
Table 1. Comparing design and gaming platforms with daily devices regarding user interface.
The NK-NM research identified a “qualitative” gap between the experienceddesigner-Instructor and/or upper-level student and the “user” or beginning student.In the theoretical framework of design critiquing in architecture studios, YeonjooOh asserts that “Moore argues that instructors in architectural studios havefollowed ingrained conventions through generations without seriously examiningthe underlying pedagogy (Moore, 2001). While a practicing architect no doubtbrings a great deal of experience to the studio, their teaching methods are oftenbased only on their own learning experiences or on intuition (Grasha, 1996). Theyoften cannot articulate what instructional method they are using, or is appropriate,for a specific condition” (Oh, Ishizaki, Gross, & Do, 2013).
Similar to the design profession, architectural design software platformslook beyond disciplinary boundaries for inspiration. These platforms includethose utilized by the game industry who leverage the possibilities by thefilm and animation, industrial design, media arts, etc. Although thesimulation/visualization gap seems to be bridged, there is still a considerable gapbetween the way that a gamer operates the game “software” and the way thatdesigner/architect operates an architectural design platform. Within pre-definedboundaries, the gamer is in complete control of the game “scene.” In this case, thepre-set environment and its boundaries are helping the gamer to stay within the“scenario” of the game. It maintains the design characteristics of the game whileeach gamer situates their unique experiential approach to solving the game. In thearchitectural design platform, the “designer” is similar to the gamer. The designerhas a defined toolkit and a specific set of operations. The difference, however,leaves the “designer” in a vast, open environment of possibilities. While thisflexibility provides a range of opportunities to design for experienced designersthat enable them to define their own “environment,” it also presents a range ofchallenges for those who are less experienced users with the design platform.
In the gaming environment, each “command” presents multiple digitalfunctions combined and embedded in the core of the “software.” Jose Sanchezrefers to the “command container” as a combinatorial design (Sanchez, 2016).In addition to the combinatorial design qualities, the game environment can becustomized, using a controller hardware interface such joysticks with multipleinputs and assigning each input to a task, whereas in an architectural design

538 E. POUSTINCHI, S. WANG AND G. LUHAN
platform, the designer combines multiple “commands” to complete a “function.”Moreover, since the physical controlling interface in the architectural designplatform is bound to the limited number of keys on the keyboard and themovementrestrictions of the mouse, there is a limited range of possibilities that inform thecustomization of the physical controlling interface.
Since 2014, researchers and designers such as Jose Sanchez, have triedto address these issues in a rigorous research context in his articles such asCombinatorial design: Non-parametric computational design strategies, (Sanchez,2016). The origin of this idea, of course, has roots in the interactive gamingtheories of Ian Bogost who explains the difference between unit and systemin different platforms (Bogost, 2006). In Bogost’s approach towards theconnection of the architectural design environment and the possibilities of agaming environment through combinatorial design, Sanchez uses the game engineplatform to define the design process and to create set of “commands” togetheras a cluster. This new way of thinking about design process will change thedecision-making process and the hierarchy. As Sanchez explains: “What isdescribed here as games draws concepts from gaming culture, but mainly refers toa guided simulation where the decisions, in this case, the player, start generating abranching narrative. The narrative is the geometric development and the decisionsof function and performance embedded by a designer. These game simulationsgenerate a strong feedback loop between the computational constraints and theintuition and experience of a human designer” (Sanchez, 2016).
Although the proposed method by Sanchez is tremendously valuable andbridges part of the gap between the interactivity of the game design and itspossibilities as an architectural design process, it has two main challenges:1. Most of the design process occurs either through pure coding or outside of the
“native” architectural design platforms.2. The Hardware and Physical interfaces are limited to the keyboard, mouse and
gaming controllers, which limits the degree of customization.
4. Methodology:The formulation of the hypotheses and an overview of the qualitativeand quantitative research methods used to test the hypotheses andexplore three intrinsically linked categories: the design process, thecontrolling/decision-making software platform, and the physical interactivecontrolling hardware device. As part of a more extensive interactive designmachine exploration, this research simultaneously works across the digital andphysical environments to bridge the gap caused by the lack of clear and directcommunication between the digital design environment and the physical inputhardware interfaces.
5. Definition of Terms:To better understand the NK-NM process, it is necessary to know the vocabularyused in its research:

NO KEYBOARD, NO MOUSE 539
• Master-Designer: The experienced designer that defines the guidelines of thedesign process through the script and the physical interface (hardware).
• Second-Designer: The user/designer with no or minor design experience thatinteractively designs within the flexibilities defined by the master-designer.
• Hosting Software: The primary design platform that the NK-NM protocoldevelops builds. In this paper, the hosting software is Rhinoceros 3D.
• Secondary Software: The script developed by the master-designer to operatebased on the hosting software as means of defined design rules.
• Command Cluster: A group of commands and functions that can be controlledall at the same time with one digital or physical input.
6. Limitations and DelimitationsThe main limitation of this study is the small number of students involved in theinitial research as master-designers and second-designers. The constraints thathave affected the precision of the outcome of this investigation are:
• The master-designers of the NK-NM protocol had differing designbackgrounds. As a result, the primary two issues (NK-NM devices)studied in this paper, are limited to those design backgrounds and interests.
• The users of the NK-NM platforms as second-designers are limited to the thirdand fourth-year architecture students and a limited number of participatingfaculty members. Although the difference and similarities of the outcomesare valuable, the research could benefit from a more diverse group of users.
Despite these limitations, every possible effort was made to design the researchin a way that maximizes the potential contribution of the study’s findings ofhow the NK-NM platform could inform design pedagogy. At the time of thiswriting, the NK-NM platform continues its development through a collaborativepartnership between faculty at Kent State University - College of Architectureand Environmental Design (CAED) and the University of Kentucky - College ofDesign-School of Architecture. The goal is to maintain the platform developmentand then introduce it, as a rigorous and comprehensive research project, intovarious levels of design studios and measure its impact.
7. The No Keyboard, No Mouse (NK-NM) ProtocolNK-NM has its roots in the architectural design studio and is a direct responseto the recognized lack of interactive, intuitive and organic design workflow inthe teaching/learning process of digital design. NK-NM is a bridging protocolfor design developed in both digital software and the physical interface/hardware.Most of the digital tools in the field of architecture are lacking the self-learningqualities that are prominent in digital game platforms. Although in a universaldigital design platform “everything” is possible, based on the defined limits of theprocess, only some of the outcomes are valid. Based on the aforementioned gap,NK-NM is a response to the need for a more controlled design platform for theassigned tasks. With the use of customized design software (secondary software)and the hardware (physical interface) the process validates that the outcomes meetthe design limitations.

540 E. POUSTINCHI, S. WANG AND G. LUHAN
The diversity of the possible scripting platforms is contingent on the hostingsoftware; in the case of this research, the digital controlling platforms (secondarysoftware) develops through scripting in node-based visual coding platform forRhinoceros, Grasshopper, Python, C Sharp, C, or Java. The direct connectionto the hosting design software as a design platform enables the master-designer todesign the secondary software, with the features of the hosting software but as acontainer of command clusters.
The NK-NM protocol has two design decisions categories; Master-designer’sdesign decisions and the second-designer’s design decisions.
8. The Master Designer’s Design Decision process:The work follows of the NK-NM platform contains two main steps in theproduction mode:1. Secondary Software Development: Defining the function/command “cluster,”
design “rules” and outcome through scripting in the digital design environment.During this step, using any scripting language the master-designer defines thefunctions/rules of the design environment. Similar to the game environment, thetasks and the environment/scene are flexible enough to be set at different scales,levels of restriction, environmental forces, and various operations, etc.
2. Hardware Development: Designing a corresponding controller, as the physicalinterface to make a more tangible connection between the act of design and thesteps of the design process. The master-designer makes the use of commandclusters and the secondary software even more tangible by providing thesecond-designer with a customized hardware/physical interface to enable thesecond-designer to learn the design process in a more intuitive/experimental wayby exploring the direct effects of the physical interface on the digital 3d model.
Through these steps, the master-designer instructs the second-designer. Basedon the interest and the goal of the design, the master-designer can also includefabrication controls as part of the NK-NM protocol.
9. The Second Designer’s Design Decision process:Every design decision is happening within the limitations and design rules bythe master-designer embedded into the NK-NM protocol. Although the rules aredefined and while the second designer cannot break them, the second designeris entirely free to design within constraints as long as the outcome meets thelimitation and the capabilities of the physical interface.
The workflow for the second-designer contains one main step before startingthe design process; understanding the interface through interaction. Since NK-NMassigns each of the inputs on the physical interface (controller) to a commandcluster, the user would immediately see a design outcome and the effect of thecontrolling data. This fast and intuitive learning process enables the second-userto learn the possibilities of the design tool within minutes.
As part of the NK-NM research, this workflow has been tested through twodifferent projects looking at both surface design and massing studies.

NO KEYBOARD, NO MOUSE 541
10. NK-NM <(SoftFractures) | Digital Surface DesignThe NK-NM SoftFracture is a digital/analog software/hardware hybrid protocolthat studies surface design as an instructed process. As an NK-NM protocol,the SoftFracture design process starts with the master-designer who beginsby observing the hosting digital modeling software, Rhinoceros 3D. Themaster-designer begins the modeling process by determining an “architectural”surface in Rhinoceros 3D. Then, by recording the computer screen, analyzeseach step of the modeling process and transform them into a sequence ofcomprehensible moments. Using the analytic information from the screenrecordings and extracted modeling steps, the master-designer can create the designa flowchart/decision-making matrix for the modeling process. (Figure 1)
Figure 1. SoftFractures, Digital Surface Design Process in the Hosting modeling software,Rhinoceros 3D.
Considering the hosting-software, Grasshopper was used as the nativenode-based visual programming platform in the Rhinoceros 3D to develop thesecond-software. The master-designer develops the computational flowchartdiagram of the process, aiming for reducing the steps by creating commandclusters.
Using the information from the second-software development, thedevelopment of the last component of the NK-NM protocol starts; the physicalinterface: Controller. Using a programmable microcontroller Arduino, themaster-designer studies different physical iterations and possibilities to useanalog sensors to receive input data and change values from the microcontroller.Using the bridging platform Firefly-an add-on for Grasshopper developed byAndy Payne and Jason Kelly Johnson, the research team received data in theGrasshopper environment and input it to drive command clusters. (Figure 2)

542 E. POUSTINCHI, S. WANG AND G. LUHAN
Figure 2. The physical controlling interface in connection to the second software platform.
By having the connection, the master-designer developed different iterationsfor the physical interface and the controller. The identified “favorable” option hadenough input to control the surface and afford the possibility of being hand-held.The outcome of the process is the NK-NM SoftFracture. (Figure 3)
Figure 3. Surface studies using No Keyboard, No Mouse SoftFracture platform.
11. NK-NM <(BoxCron) | Digital Massing Study / 3D printingThe design process of the NK-NM BoxCron is very similar to the NK-NMSoftFracture regarding the workflow. The significant difference, however, is thefact that the NK-NM BoxCron considers 3D printing and its restrictions as part ofthe design instructions embedded in the protocol.
Similar to the NK-NM SoftFracture, the NK-NM BoxCron starts with anobservation of the digital modeling process of a massing study in Rhinoceroshosting software. During the development of the final second-software inGrasshopper, considering 3D printing as a desired fabrication method, themaster-designer introduces another layer of guideline and instruction through theprotocol. Based on the characteristics of the 3D printer used for this study theminimum thickness of the designed massing model should not be less than amillimeter and the maximum size of the outcome model could not be bigger thana cube of 15 cm. (Figure 4)
By embedding the fabrication limitations and instructions in thesecond-software, the master-designer starts the process of designing the physicalinterface. Also, similar to the NK-NM SoftFractures project, through differentcontroller iterations, the NK-NM BoxCron master-designer had a hand-held and
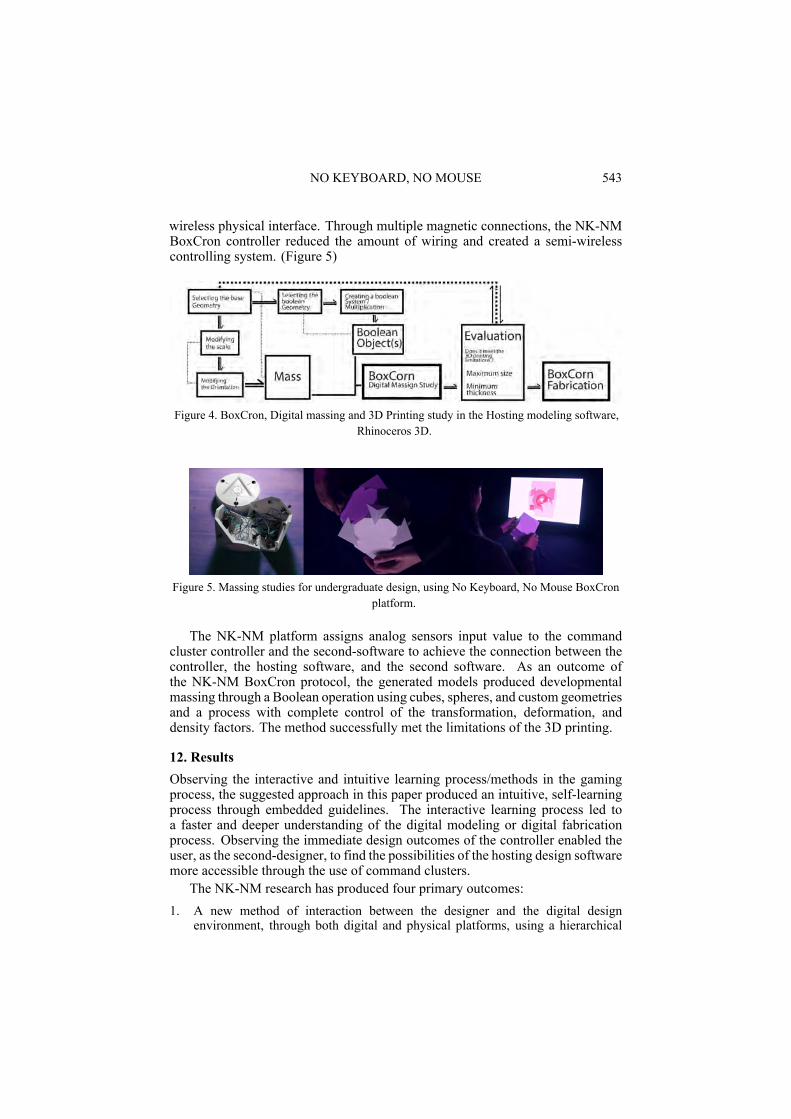
NO KEYBOARD, NO MOUSE 543
wireless physical interface. Through multiple magnetic connections, the NK-NMBoxCron controller reduced the amount of wiring and created a semi-wirelesscontrolling system. (Figure 5)
Figure 4. BoxCron, Digital massing and 3D Printing study in the Hosting modeling software,Rhinoceros 3D.
Figure 5. Massing studies for undergraduate design, using No Keyboard, No Mouse BoxCronplatform.
The NK-NM platform assigns analog sensors input value to the commandcluster controller and the second-software to achieve the connection between thecontroller, the hosting software, and the second software. As an outcome ofthe NK-NM BoxCron protocol, the generated models produced developmentalmassing through a Boolean operation using cubes, spheres, and custom geometriesand a process with complete control of the transformation, deformation, anddensity factors. The method successfully met the limitations of the 3D printing.
12. ResultsObserving the interactive and intuitive learning process/methods in the gamingprocess, the suggested approach in this paper produced an intuitive, self-learningprocess through embedded guidelines. The interactive learning process led toa faster and deeper understanding of the digital modeling or digital fabricationprocess. Observing the immediate design outcomes of the controller enabled theuser, as the second-designer, to find the possibilities of the hosting design softwaremore accessible through the use of command clusters.
The NK-NM research has produced four primary outcomes:1. A new method of interaction between the designer and the digital design
environment, through both digital and physical platforms, using a hierarchical

544 E. POUSTINCHI, S. WANG AND G. LUHAN
design process between master and second designer.2. A tool for enabling designers with limited design experience to design in an
instructed design platform, securing the design outcome validation as both adigital and digitally fabricated physical model.
3. The introduction of physical design interface as a method to increase the designawareness for designers with limited design background by increasing the tactualdesign interaction between the user and the design software.
4. The Increased ability of design instructors to introduce digital design environmentin earlier stages of design education through physical, tangible interface.
13. ConclusionThe NK-NM process advances research in the domain of physical computationand human-machine interaction by using both digital simulation and hands-oninvestigations. This paper demonstrates the potential of NK-NM as a pedagogicaltool for extending and reshaping the design and design-thinking processes byutilizing real-time physical/analog inputs and feedback. The initial results of theresearch narrowed the gap between experienced designer and designers with minorexpertise. This study moves beyond the conventional hardware and softwaresettings to produce a real-time interactive toolkit of design parameters – a datacollection system that has converted design qualities into quantitative controllableinputs. This customizable process encourages the hands-on procedures as afeedback and simulation loop from the very early stages of design.
14. Future ResearchThis paper outlines a platform that enables an iterative analog model makingprocess linked to the digital design environment. One component of thefuture research agenda of this platform will demonstrate Patkau Architects’physical-analog modeling process. In this examination, the NK-NM will bridgebetween the analog model and the analysis of inherent material properties acrossscales, to responsively inform a digital model. The research team anticipates thatsubsequent feedback loops between the digital models will allow for the generationof adaptive analog models. In this way, the NK-NM platform will directly informthe physical model iterations and ultimately influence, the final built form.
References““Man vs. Machine: Sylvia Lavin Retools Creativity.” Los Angeles Forum for Architecture
and Urban Design.” : 2015. Available from <http://laforum.org/delirious/man-vs-machine-sylvia-lavin-retools-creativity/> (accessed 2nd October 2017).
Bogost, I.: 2006, Unit Operations: An Approach to Videogame Criticism. Unit Operations,MIT Press, Cambridge, MA.
Mitchell, W.J.: 2003,Me++: The Cyborg Self and the Networked City, MIT Press, Cambridge,MA.
Oh, Y., Ishizaki, S., Gross, M.D. and Yi-Luen Do, E.: 2013, A theoretical framework of designcritiquing in architecture studios. Design Studies, Design Studies, 34, 302-325.
Sanchez, J.: 2016, Combinatorial design: Non-parametric computational design strategies,Proceedings of the 36th Annual Conference of the Association for Computer Aided Designin Architecture (ACADIA).

BODY-BORNE ASSISTIVE ROBOTS FOR HUMAN-DEPENDENTPRECISION CONSTRUCTION
The Compensation of Human Imprecision in Navigating 3-Dimensional Spacewith a Stand-Alone, Adaptive Robotic System
ALRIC LEE1, HIROKAZU TEI2 and KENSUKE HOTTA31Automatter [email protected] University of [email protected] [email protected]
Abstract. The rapid growth of complex contemporary architecturedesign, contributed by the advance in parametric CAD/CAM software,is accompanied by challenges in the production process; it demands bothhighly trained workers and technical equipments. This paper reviewscurrent technologies in robotics-aided construction and wearablecomputers for generic purposes, and proposes the design of a roboticdevice for construction guidance. It guides the user, the worker, throughthe assembly process of precision modular constructions, by providingprocedural mechanical or haptic assistance in the 3-dimensionalpositioning of building components. The device is designed to bewearable, portable, and operable as a completely stand-alone system thatrequires no external infrastructure. A prototype of the device is testedwith a mock-up masonry construction experiment, the result of whichis reported in this paper, along with discussion for future improvementand application opportunities within the context of highly developed,condensed Japanese urban environments. A greater objective of thispaper is to bridge current studies in Human-Computer Interaction (HCI)and digital fabrication in architecture and promote the potentials ofhuman workers in future construction scenes.
Keywords. Digital fabrication; human-computer interaction; 3dpositioning; wearable robotics; guided construction.
1. INTRODUCTIONIn Fumihiko Maki’s essay “Making Architecture in Japan”, he recalls Tokyoin the 1930s when small wooden houses were abundant. When a constructionbegan in the neighbourhood, the on-site craftsmen would demonstrate their skillswith tools in a working process that was transparent for the community. Theneighbors “were able to observe not only the work of carpenters but performances
T. Fukuda, W. Huang, P. Janssen, K. Crolla, S. Alhadidi (eds.), Learning, Adapting and Prototyping,Proceedings of the 23rd International Conference of the Association for Computer-Aided ArchitecturalDesign Research in Asia (CAADRIA) 2018, Volume 1, 545-554. © 2018 and published by the Associationfor Computer-Aided Architectural Design Research in Asia (CAADRIA) in Hong Kong.

546 A. LEE, H. TEI AND K. HOTTA
put on by craftsmen such as glass-workers and textile dyers.”(Buntrock. 2014)The community residents were able to intimately observe the development of thebuilding. The openness of the construction process eased the community’s concernof an unexpected intrusion and facilitates the transition of the new building to beassimilated into the existing urban fabric.
The confrontation between new construction and the neighborhood hadbecome conspicuous in modern days. The complication of contemporaryconstructions requires execution by an array of professionals with highlyspecialized skills, experience and equipments. Construction sites begin by beingsealed off by scaffolds, and the workers rarely get any chance of interactionwith the community. As the construction site operates completely in anenclosed system, the outside has no clue of what is inside until the buildingis completed. The sudden addition of an unfamiliar object into an otherwisefamiliar neighborhood brings a sense of unease to the local residents. ArchitectItsuko Hasegawa had described the problem of the uninvited intrusion of newbuildings into an established neighborhood (Iso. 2010), she thinks the communityparticipation bestows a sense of involvement upon the people. Before theconstruction of Shonandai Cultural Center, she held more than 50 meetings withover 300 residents from the area to hear about their opinions of the design. Thispaper proposes the idea of inviting the community residents to take part in theconstruction process itself, and presents a device that helps them to build withprofessional quality.
2. RESEARCH OBJECTIVEThe objective of this research is to explore the potential of an easy-to-use device forcommunity members, who may have never had any experience with construction,to participate in the construction process of simpler structures firsthand. In thecontext of the proposed scenario in this paper, the engagement of communitymembers in communal projects is hypothesized to have a stimulating effect on theneighborhood’s acceptance and interest in the new building. The proposed systemshould be easy to use, operable while detached from a stationary power source andany remote computing unit, as it would be used by individuals with no technicalknow-how in dynamic site conditions. The all-in-one system should also requireminimal or less intrusive infrastructural support, as the markers and/or camerasthat conventional guidance systems utilize to understand the environment demandsextensive setup with restrictive usage conditions, which are often unavailable inmost urban building sites.
3. RELEVANT STUDIESThere are a number of machine assisted masonry construction systems underresearch and on the market. The majority of them, however, focus primarilyon replacing the entirety of human role in construction with automation. Thestrength of these systems lies in the high precision and efficiency achievable onlywith automated machines. The downsides are their heavy reliance on a stable,controlled environment for the machines lack the adaptability in versatile site

BODY-BORNE ASSISTIVE ROBOTS FOR HUMAN-DEPENDENTPRECISION CONSTRUCTION
547
conditions, rendering them impractical to use in complex urban environmentswhere unexpected obstacles and dynamic weather conditions frequently arise.These machines themselves are also highly sophisticated pieces of equipmentsubjected to constant maintenance.
dimRob (Helm. 2014) is a door-sized robotic unit that is capable ofmaneuvering itself on site with a mobile track system. Powered by an integraldiesel engine, the robot is programmed to be fully automatic, grabbing bricks (witha vacuum gripper), placing the brick in the designated 3D location and rotationalangle one by one from a database, and scans the environment for simple inputhints. While the precision is realized by a 6-DoF industrial grade robotic armthat falls outside the scope of this paper, the driving software logic provides astarting reference points on how the system should be designed. The dimRobsoftware relies on environmental data to refer to the position of itself, the buildingelements, and the subsequent position of the robot base through constant scanningof “satellites”, which are essentially computer-recognizable markers in the spacethat provides relative distance information. This method contrasts the usage ofinternal sensors to determine self-positions, which would be discussed later in thispaper.
Despite not being designed to handle any construction-related work, ahandheld robot developed by Gregg-Smith et al. (2015) aims to collaborate withthe operator to perform tasks and enhance the capabilities of conventional toolsby actuation, sensing, and task knowledge. The device is composed of a 4-DoF,cable driven robotic platform, a RGB camera, and on-board sensors. Thoughthe information of targeted task is pre-stored in the programme, the device is notcapable of, and does not perform all of the physical operation for the worker; butrather, it provides intuitive hints on how to complete a complex task to the workerthat is otherwise difficult for a human individual to process. The system integratesenvironmental data (self position via marker placement), task information, andhaptic feedback mechanism in a portable, wearable tool.
4. DESIGN BACKGROUNDThe proposed structure to be constructed to examine the effectiveness of the deviceis a small-scale teahouse. This thesis proposes to invite the local communitymembers to participate in the assembly process of the masonry skin firsthand.Since the completed building will serve communal functions, by integrating publicparticipation in the construction stage of the design, a new type of bottom-up,collaborative construction process is formed.
The masonry envelope uses standard-sized bricks measuring 215 x 112.5 x65mm. The simplicity in the material and brick laying system makes the projectparticularly suitable to be handled by bare hands with minimal equipments andpreparation setups. Any mistakes made in the process may be rectified with arelatively straightforward manner comparing to concrete or steel constructions.
Since the contemporary lifestyles undergo frequent changes, the buildings andcommunal facilities should be adaptive to the shifting needs; therefore, the spatialconfigurations of such buildings and facilities would have to adjust or transform

548 A. LEE, H. TEI AND K. HOTTA
periodically to accommodate for such transitions. In conventional cases, anymodification to the building envelope requires a complete overhaul carried outby a professional team. In this proposal, this system allows a guided partialreconstruction to be done by the community members with minimal amount ofinfrastructure, at the time when they see fit.
5. SYSTEM OVERVIEWThe outlined guidance device aims to compensate the absence of sophisticatedmachinery and infrastructural support on site, required to achieve an equivalentlevel of professional accuracy and efficiency. As a lightweight and stand-aloneelectronic device designed to be wore by amateurs, the primary function of thesystem is to provide guidance to the user on the placement of individual bricksin sequential instruction, with no actual mechanical support, since the role ofthe device is to augment human capabilities by trying to eliminate human innatefallibility rather than replacing them. Human workers are inherently unableto precisely locate exact 3-dimensional coordinates and rotational angles in anarbitrary environment, which are the two crucial factors in building complex brickstructures. As a corrective measure, the device is to signal and lead the user infinding the targeted brick 3D location and Euler rotation on site.
In the field ofHCI (HumanComputer Interaction) research, machine-generatedsignals may be categorized into visual (projection or head-mount display), audio(speech or tone hint), and haptic (EMS devices, vibration motors, and othertactile actuators). While visual and audio signals are capable of deliveringmore comprehensive and detailed instructions, their reliability depends heavilyon external equipments and environmental conditions, for instance, projectionrequires the use of a projector in a particular position, and is subjected to obstacleinterference. On the other hand, haptic devices have the advantages of beingminuscule and portable, and give very stable performance when placed in directproximity with human skin. This paper will examine the use of haptic devicesworn on the user’s wrist to provide directional and rotational guidance.
Figure 1. Guidance device prototype.

BODY-BORNE ASSISTIVE ROBOTS FOR HUMAN-DEPENDENTPRECISION CONSTRUCTION
549
5.1. LOCATION SENSING AND GUIDANCE
Two information are essential in guiding the worker to place the brick in thecorrect position: the current position of the brick (held by the same hand wearingthe guidance device) and the target position. There are a number of real-time3D localization technologies with accuracy varying from 3.5 mm to 50 cm:wavelength triangulation (WIFI, RFID, GPS, ultra-wideband), optical tracking(QR markers, laser, infrared), ultrasound, and by calculation through movementtracking with inertial measurement unit (IMU). The triangulation method has along detection range of up to 50 meters but only has an accuracy of 5 cm, andneeds the installation of “beacon” devices; infrared and smaller laser rangefindershave an accuracy of 2.5 cm and a range of 40 meters, but are expensive. This paperseparately examines the use of the relatively budget IMU sensor and ultrasonicsensor.
Location tracking using IMU modules was first experimented with becausethe only piece of hardware required is the IMU module and a processingmicrocontroller, which are often embedded onto a single development board (e.g.Arduino 101). Described in several papers by Xiaoping Yun et al. (2007), thismethod derives movement data from the accelerometer and references it withorientation estimates from the gyroscope in the same IMU module and calculatesthe relative position of the user during walking. This method is preferable becauseit is “sourceless”, meaning the required reference data to calculate position areproduced by the module itself; no external devices or infrastructure is required,and therefore does not always need a clear line of sight between the transmitterand source, which is frequently unavailable in construction sites. However, thedisadvantage is that budget IMU modules are prone to drifting error, which isan accumulated error in measurement made by the continuous calculation ofacceleration with respect to time, causing quadratic error growth in position andvelocity.
As an alternative positioning technique, ultrasonic sensors could be perceivedas “semi-sourceless”. Having an accuracy of 1 mm and a detection range of 10meters, the sensor emits a sound wave at a specific frequency, listens to the soundwave being bounced back after it hits a surface, and calculates the distance betweenthe sensor and the surface by referring to the elapsed time. While the system doesnot require any external device, it does rely on a surface for the rebound of soundwaves. To obtain the 3-dimensional coordinates of the guidance devices, threeultrasonic sensors have to be mounted on the device, each measuring the relativedistance of the sensor and the reference surface on X-Y-Z axis respectively. Tocompare the current relative coordinates of the device and that of the targetedcoordinates taken from the virtual design data, the pose angles of sensor detectionhave to be constant across every brick in both targeted and actual world. Oneobvious problem is the involuntary constant rotational movement of the user’shand wearing the device, making the measurement data difficult to use.
To offset this undesirable movement and keep the three ultrasonic sensorsalways leveled, a compact gimbal-like stabilizer is devised and installed beneaththe ultrasonic sensors. The stabilizer is consisted of a microcontroller (Arduino

550 A. LEE, H. TEI AND K. HOTTA
Micro), a gyroscope, and three servo motors, each being responsible for offsettingrotation in X, Y, and Z axis. Servomotors, in contrast to regular DC motors,have precise control of angular position. While the gyroscope interprets the arm’sposture and returns the data in yaw, pitch and roll value, and the pitch and rollmotors can directly rotate in the opposite direction based on the returned value;however, the yaw motor has to rotate in relative movement based on incrementalchange in the user’s angle of rotation, since the pivot of rotation is located on topof the yaw motor, not underneath.
Figure 2. 3-axis stabilization mechanism of ultrasonic sensors supported by servo motors.
The use of such stabilizer keeps the ultrasonic sensors steady, but it occupiesthe space below and leaves no room for the Z-axis sensor. It has been determinedthat the Z axis sensor is not necessary in the case of masonry construction guidance,as the user would build from the bottom, and a brick in the correct X and Y positionwould also fall onto the correct Z position if the bricks are laid sequentially in arow by row fashion. Though the addition of a Z-axis sensor could potentially beuseful for application in guiding the placement of suspended objects.
The only infrastructure needed on site for this positioning technique are twoperpendicular, vertical planes that flanks the targetedmasonry structure and extendas far as the parameter of the structure goes, as surfaces for the sensor’s ultrasoundto reflect off of. The same planes would also be in the digital model of thetargeted geometry for the extraction of the reference targeted coordinates dataof each brick. However, two reference planes may not be always be availablein actual construction sites due to the presence of miscellaneous obstacles. Thispaper suggests using the existing site elements (e.g. walls, columns, slabs) as thereference surfaces by digitally reconstructing the scene in the 3D model wherethe targeted measurement data is extracted. The site digital reconstruction may beachieved using SLAM (Simultaneous Location and Mapping) scanning methodfor more complicated cases. With the pre-integration of environmental data, thepositioning system becomes self-contained and independent of any external deviceand support.
The guidance device compares the difference in the current coordinates and thetargeted coordinates, then instructs the user to move his hand to the right positionwith two tactile actuators strapped to the arm. Unlike regular vibration motors, thetactile actuator is able to induce a virtual force that simulates the force of pushing orpulling based on human sensation. Jun Rekimoto (2013) describes the method oftransmitting an asymmetric signal to the coil of an ALPS “forcereactor” to createa virtual force in a particular direction on one axis. This paper attempts to adaptRekimoto’s method to the new generation ALPS “forcereactor”, which operates

BODY-BORNE ASSISTIVE ROBOTS FOR HUMAN-DEPENDENTPRECISION CONSTRUCTION
551
on two axis. A microcontroller (Arduino UNO) and a digital amplifier are used tocontrol the signal. Using PWM (Pulse-widthModulation), signals of 2ms and 6msalternative on and off cycle are sent to the actuator. The electromagnet coil insidethe actuator is charged with a current for 2ms, pulling the weight attached to it inone direction, and returns to its neutral position when the coil is not charged for the6ms interval. The cycle repeats and creates a difference in the acceleration in thepush and pull mechanism. The on and off cycle interval is reversed to create forcein the other direction. 160 Hz and 320 Hz signals are used respectively for virtualforce in X and Y-axis. For example, if the guidance device is 50 cm away fromthe targeted brick position on X axis, a cycle of 2:6ms current in 160 Hz wouldbe sent to the actuators continuously until the user’s hand reaches the targetedposition, then the same process is repeated for guidance on Y axis.
Figure 3. ALPS “forcereactor” PWM control for electromagnet coil.
5.2. ROTATIONAL GUIDANCE
In the scenario of most masonry construction, only horizontal rotation of the brickis critical as gravity always pulls the brick down leveled (except in masonry vaultconstructions). To detect the current degree of rotation of the brick being held, andIMUmodule is placed in a glove, which will be pressed into a perpendicular anglewith the brick, when a user holds a brick. An additional microcontroller readsthe current degree of rotation from the IMU module in yaw, compares it withthe targeted data, then instructs the user to turn left or right until the differencebecomes less than 0.8 degree, which allows a margin of error that absorbs thenormal human hand jitter. The instruction is given by two-disc vibration motorlocated in the index finger and pinky finger position of the glove, which vibratesaccording to the guided direction.
Figure 4. Location & rotational guidance.

552 A. LEE, H. TEI AND K. HOTTA
6. EVALUATION & RESULTTo test the performance of the device, four volunteers with no experience inconstruction were invited to assemble a teahouse mockup. For experimentalpurpose, cardboard boxes in 23 x 15 x 6 cm are used instead of bricks, and woodglue for brick mortar. Participants were given basic instructions on operation ofthe guidance device, but are provided with no construction drawing and have noknowledge of appearance of the design. The device was powered by a USB cableconnected to a computer, and an Android phone was given to the participant as aninterface of controlling the device. The environment is set to be in a semi-interiorspace, with two perpendicular walls, 2 m and 1.1 m away from the center as thesurface of distance reference. The environment was scanned and reconstructed inthe 3D model in precise dimension for the extraction of targeted data.
Figure 5. Flow of data from site context, design geometry, virtual model to guidanceinformation stored on device.
Figure 6. Target geometry and result of assembling experiments with 4 amateur participants.
Each participant was given a maximum time of 45 minutes to complete the

BODY-BORNE ASSISTIVE ROBOTS FOR HUMAN-DEPENDENTPRECISION CONSTRUCTION
553
assembly asmuch as possible. None of the participant was able to fully accomplishthe target design; participant B completed themost with 68 bricks while participantA only completed 22. During the process of assembly alone, the system hadexperienced the following issues:
• Range ofMotion: The servomotors mounted on the stabilizer only have a rangeof motion of 180 degree. The original design had only considered the limit ofrotation of a human wrist joint, neglecting the rotation factor of the humanposture itself. When the guidance device is tilted more than 180 degree in anyof the axis, the stabilizer crashes and the system has to restart. To correct thisproblem, the servomotors should be switched to wrench motors, which allowwider range of rotation (up to 600 degrees).
• Size Factor: The participants had complained about the size and weight ofthe guidance system during the assembly process, claiming that the designhad restricted his wrist movement and the device itself often collided with siteobstacles. The weight of the device is approximately 1.5 kg; while it seemedlight at first, it put a continuous stress on the user’s hand. For the purposeof this experimental device, two generic Arduino micro-controllers are used;their sizes can be reduced significantly to about 40% of their current size if theelectronic components are made in customized production.
• User Interface: The participant used an Android phone to communicate withthe guidance device, but the Bluetooth connection was unstable and had to bereconnected several times. The need for an extra hand to operate the phonedemonstrated to be a great hassle during the construction. In the future work,the device should be equipped with an embedded display screen that showsbasic information, such as the current number of brick being worked on, andpositional information. Push buttons should also be installed to enable theoperator to directly control the device, eliminating the need for a wirelessconnection with a second device, which is subjected to electrical interference.
• Power Shortage: The motors, sensors, Bluetooth module and themicro-controller operating together would create a power usage surgesometimes, exceeding the current passage capacity of the USB adapter andcable, and thus causing the system to crash. For future improvement, thedevice should be equipped with a battery with a capacity of at least 5000mAhin 5V with a cable of at least 2A current output capacity.
The mentioned operational glitches and system flaws had contributed toinaccuracies in the completed design. Optimizing the programming code, scalingdown the device and improvement in the hardware configuration efficiency ofthe system will help make the device a viable contestant as a replacement forexpensive, fully-automated machines in smaller scale constructions. Through theevaluation of the device in the assembly of the mock-up, it had demonstratedits potential in guiding people with little technical knowledge and experience toproduce complicated architectural objects.
7. CONTRIBUTION AND FUTURE APPLICATIONWithin the field of HCI research, there is an extensive amount of studies on theextension of human capacities with machines in the form of body-born computers.

554 A. LEE, H. TEI AND K. HOTTA
Most of them had aimed for either experimental use or highly specializedprofessional use that requires extensive training and knowledge. With an agingpopulation and a dwindling workforce, this research hopes to inspire a new classof machine that helps to make accessible and popularize the currently specializedprocess of constructions, and production of goods in other fields to a wider public.The technologies used in this device can be easily reproduced without the useof any difficult-to-get electronic components, and may inspire other forms ofwearable devices that encourage amateurs to take part in tasks that are seeminglyexclusive to professionals, and thus democratizing the technical process thatoften prevent people from applying and extending the natural ability in makingthings. This also means that with more accessible design platforms, ordinaryindividuals can oversee the entire process of designing a structure constructing it,strengthening the independence of future designers and laborers. Also, this paperemphasized on not just the function of the machine, but the intimate relationshipbetween the machine and the somatosensory experience of the user, suggestingthe importance and potentials of innate human abilities. This project providesa perspective to bridge the practicality of maximizing logistical efficiency inreal-world construction scenarios and the abstraction of humanistic values thatconcerns about community involvement and revitalization.
8. SPECIAL ACKNOWLEDGEMENTThe framework of this paper was developed at the Obuchi Laboratory in theUniversity of Tokyo.The community revitalization concept was developed withI.Yoo and M.Münzenmaier, with the author investigating into the historicalbackground of Japanese construction and proposing an alternative system.
ReferencesD. Buntrock (ed.): 2014, Japanese architecture as a collaborative process: opportunities in a
flexible construction culture, Taylor & Francis.Gregg-Smith, A. and Wayol-Cuevas, W.: 2015, The design and evaluation of a cooperative
handheld robot, IEEE International Conference on Robotics and Automation (ICRA).Helm, V., Ercan, S., Gramazio, F. and Kohler, M.: 2014, In-Situ Fabrication: Mobile Robotic
Units on Construction Sites, Architectural Design, 84 no. 3, 100-07.Iso, T.: 2010, Kenchiku junrei posutomodan-hen (14) Shōnandai bunka sentā, Nikkei
āketekuchua.Lee, A.: 2017, Community Participation in Communal Building Construction: An Assistive
Haptic Tool for Amateur Masonry Assembly, Master’s Thesis, University of Tokyo.Leigh, S.W., Sareen, H., Kao, H.L., Liu, X. and Maes, P.: 2017, Body-Borne Computers as
Extensions of Self, Computers, 6(1), 12.Rekimoto, J.: 2013, Traxion, Proceedings of the 26th annual ACM symposium onUser interface
software and technology.Yun, X., Bachmann, E.R., Moore IV, H. and Calusdian, J.: 2007, Self-contained Position
Tracking ofHumanMovementUsing Small Inertial/Magnetic SensorModules, Proceedings2007 IEEE International Conference on Robotics and Automation.

MR. SAP: AN ASSISTANT CO-WORKING WITH ARCHITECTS IN ATANGIBLE-MODEL-BASED DESIGN PROCESS
CHENGYU SUN1, YUZE WANG2, ZHAOHUA ZHENG3,TONGYU SUN4 and LAURA RUIZ51,2,3,4,5Tongji University1,2{ibund|wangyuze1993}@126.com [email protected]@tongji.edu.cn [email protected]
Abstract. To avoid interruption on architects’ tangible-object-baseddesign process, MR.SAP is being developed to co-work with architectsas a cost-acceptable personal solutionwith tangible user interface, whichcan scan the tangible object, analyze its digital counterpart, and promptvisualized suggestions upon it through a portable projector in realtime. It extends the user’s capabilities of form perception, real timecalculation, and operational positioning upon tangible objects, whichcan better serve his subjective aesthetic taste and design aims.
Keywords. Mixed reality; projector and camera system; manualcraft; co-working.
1. IntroductionIn the researches of design methods, the user interface of any design toolis always an important issue having impacts on the design process and eventhe result. Traditionally, architects use a manual user interface consisting ofsketches and mockups. It provides very high fluency in design thinking (Arnheim1971). With the development of digital technologies in computer modellingsoftware and numerically controlled machines, architects use more digital toolsto extend their accuracy in design thinking and counter-part building, whichmakes computer-based architectural applications, such as digital fabrication, verypopular (Yuan 2012). However, most of the applications work with a GraphicUser Interfaces (GUI), which interrupts the users’ fluent design thinking when herepeats to build linkage between a piece of digital information and its tangiblecounter-part in real world (Ishii et al. 2008). Thus, Tangible User Interface (TUI)is raised for the designers to take the both above benefits (Ullmer and Ishii 1997).
In this study, a project called MR.SAP is introduced as a cost-acceptablesolution based on TUI concept for individual front-line designers. It tries toprovide real-time form-related visual information upon tangible objects to raisethe designer’s accuracy in perception and operation, when he simultaneouslyenjoys the fluent design thinking upon tangible objects in real world. As an initialachievement in this project, main modules of the system are depicted and a designprocess concerning Gross Floor Area (GFA) is demonstrated in the followingpaper.
T. Fukuda, W. Huang, P. Janssen, K. Crolla, S. Alhadidi (eds.), Learning, Adapting and Prototyping,Proceedings of the 23rd International Conference of the Association for Computer-Aided ArchitecturalDesign Research in Asia (CAADRIA) 2018, Volume 1, 555-564. © 2018 and published by the Associationfor Computer-Aided Architectural Design Research in Asia (CAADRIA) in Hong Kong.

556 C. SUN ET AL.
2. Literature Review2.1. TRADITIONAL DESIGN PROCESSES WITH A MANUAL USERINTERFACE
In a traditional design process with a manual user interface, a designer improveshis ideas by successively drawing sketches or making mockups, and visuallyevaluating them. A number of these cycles make up the whole design process,which is so-called “visual thinking” (Arnheim 1971), and depicted as theprototypical creative cycle of perception and presentation (Buxton 2006) shownin Figure 1. It is widely adopted by architects before the digital technologiesare involved, in which designers have the most efficient cognition on what theyare deliberating. When the manual user interface makes the design process anon-interruptive cycle, designers would acquire more inspiration benefiting fromthe direct feedbacks through the tangible interface.
While there is a limitation of manual user interface: when operating with anarchitectural model with only naked eyes, designers would have difficulty figuringout the model’s properties accurately in real time, such as the GFA, sunlightcondition, etc., especially when the form of model is irregular. Digital technologycould make up for the deficiency.
Figure 1. The creative cycle of perception and presentation (qt.Buxton 2006).
2.2. DIGITAL ARCHITECTURAL APPLICATIONS WITH GUI AND TUI
Once digital technologies are widely applied in computer-based architecturalapplications such as digital fabrication, architects are able to establish precisesketch models or even full size building parts rapidly through a robotic makingprocess. Digital technologies play the role of robotic craftsmen in all these projects,such as ICD/ITKE RESEARCH PAVILION (Fleischmann and Menges 2011),Wind Tunnel and Environment PerformanceMorphologies (Yuan and Xiao 2014),either in the process of design or fabrication. The technologies turn digital modelsinto tangible counter-parts in the interaction with architects through Graphic UserInterfaces (GUI) as shown in Figure 2. However they work as independentfunction modules interrupting the architects’ visual thinking process.
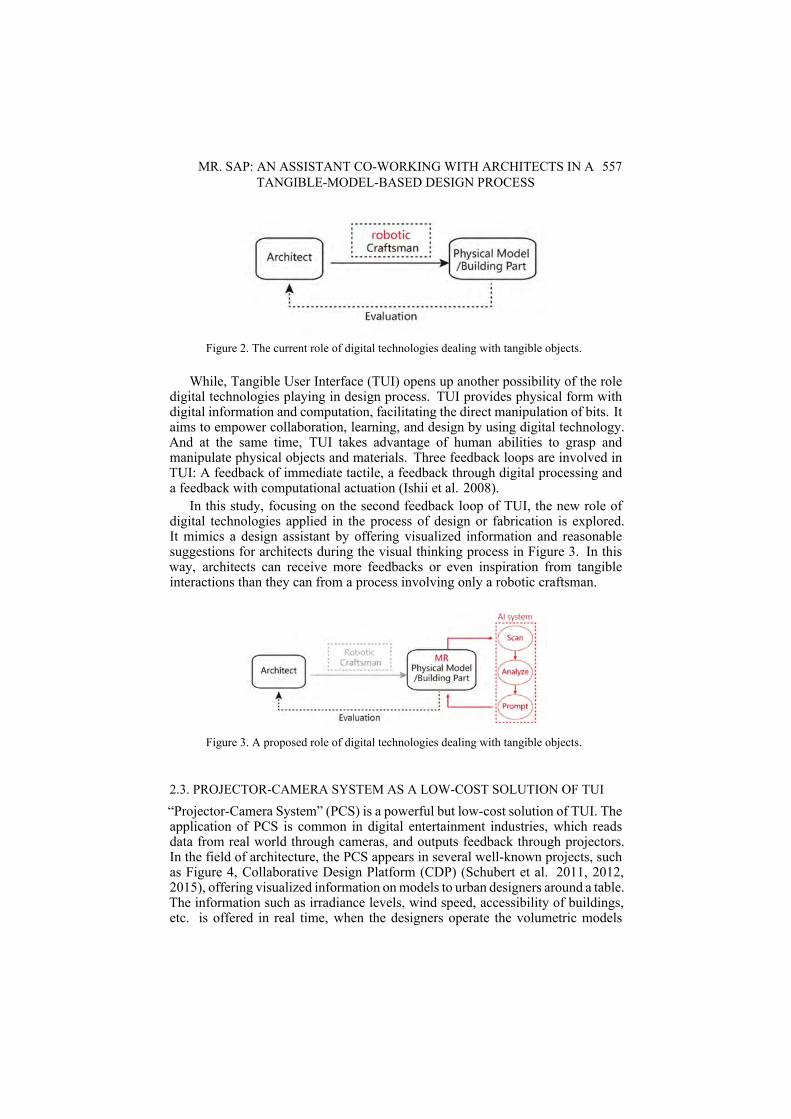
MR. SAP: AN ASSISTANT CO-WORKING WITH ARCHITECTS IN ATANGIBLE-MODEL-BASED DESIGN PROCESS
557
Figure 2. The current role of digital technologies dealing with tangible objects.
While, Tangible User Interface (TUI) opens up another possibility of the roledigital technologies playing in design process. TUI provides physical form withdigital information and computation, facilitating the direct manipulation of bits. Itaims to empower collaboration, learning, and design by using digital technology.And at the same time, TUI takes advantage of human abilities to grasp andmanipulate physical objects and materials. Three feedback loops are involved inTUI: A feedback of immediate tactile, a feedback through digital processing anda feedback with computational actuation (Ishii et al. 2008).
In this study, focusing on the second feedback loop of TUI, the new role ofdigital technologies applied in the process of design or fabrication is explored.It mimics a design assistant by offering visualized information and reasonablesuggestions for architects during the visual thinking process in Figure 3. In thisway, architects can receive more feedbacks or even inspiration from tangibleinteractions than they can from a process involving only a robotic craftsman.
Figure 3. A proposed role of digital technologies dealing with tangible objects.
2.3. PROJECTOR-CAMERA SYSTEM AS A LOW-COST SOLUTION OF TUI
“Projector-Camera System” (PCS) is a powerful but low-cost solution of TUI. Theapplication of PCS is common in digital entertainment industries, which readsdata from real world through cameras, and outputs feedback through projectors.In the field of architecture, the PCS appears in several well-known projects, suchas Figure 4, Collaborative Design Platform (CDP) (Schubert et al. 2011, 2012,2015), offering visualized information onmodels to urban designers around a table.The information such as irradiance levels, wind speed, accessibility of buildings,etc. is offered in real time, when the designers operate the volumetric models

558 C. SUN ET AL.
on the table. Another project, named Smart Drafting Table (SDT) is developedby Precision Planning Lab (PPL) of Tongji University in Figure 5. In the fieldof geographic education, AR Sandbox, is another well-known system developedby KeckCAVES of UC devis in Figure 6, in which an augment reality sandboxprovides an interactive study platform for the students and teachers (Reed etal. 2014). All of these projects work on a 2.5d mode through a depth sensorfrom a top view to perceive the tangible objects (Dalsgaard and Halskov 2013),which limits their application for true 3D architectural forms. Meanwhile, due totheir requirements on spacious room, good budget, it is almost impossible for thefront-line designers to use them as personal tools.
Figure 4. Collaborative Design Platform (qt. Schubert et al. 2011).
Figure 5. Smart Drafting Table (May 2016).

MR. SAP: AN ASSISTANT CO-WORKING WITH ARCHITECTS IN ATANGIBLE-MODEL-BASED DESIGN PROCESS
559
Figure 6. AR Sandbox (qt. Reed et al. 2014).
3. Methods3.1. MR.SAP
Based on the notion of the visual thinking, the Tangible User Interface, the solutionof PCS, algorithms in computer vision and mixed reality, a prototype system,namely “MR. SAP” is being developed (Figure 7), which can perceive tangiblemodels in architect’s hands and offer real-time prompts according to customizedalgorithms in Grasshopper. MR.SAP works in a desk scale and faces with anindividual person like a design assistant. Thus, MR.SAP is another robotic systemconsisting of physical entity scanner as eyes, analysis algorithms as a brain, andimage projector as pointing fingers on the tangible models. Essentially, MR.SAPexhibits another role of the digital technologies in computer-based architecturalapplications.
The project of MR.SAP started in mid-2016 inspired greatly from Schubert’sCDP project. While MR.SAP features itself as a visual think tool for personalusage with true 3D capability. By June 2017, the second prototype is published,which can work through the full cycle consisting of scanning, analyzing, andprompting. In December 2017 (Sun et al.2017), a new version is preparedwith more progress, including an algorithm simplifying meshes and an algorithmoptimizing the calibration accuracy.

560 C. SUN ET AL.
Figure 7. The working scenario of MR.SAP.
MR. SAP is designed as an assistant co-working with an architect followinghis visual thinking process mentioned above without interruption from arobotic craftsman. It means that the architect is still operating the tangiblemodel continuously, while in real time the computer assistant offers visualizedsuggestions as images projected on these models, which actually expands thearchitect’s ability in real-time perception and calculation. Compared with thosePCS projects mentioned above, MR.SAP is proposed to satisfy a more customizedusing experience, instead of being a public platform. In both hardware operationand software function, MR.SAP provides more flexibility. Since the positionsof the camera and projector are adjustable, they give better viewing experiencefor different persons and tasks. The analyzing module working between thecamera and the projector is connected to Grasshopper, one of the most commonscripting tools used by architects, allowing users to customize the analyzingfunction by themselves. Furthermore, to serve as a personal tool, MR.SAP isdesigned with low-cost hardware. On one hand, MR.SAP’s contribution to fluentvisual thinking makes it most suitable for the preliminary stage of architecturaldesign, which has plenty of modification possibilities and repeats many cycles ofvisual thinking process. On the other hand, the precise requirement of preliminarystage is relatively low, thus even with low-cost hardware, MR.SAP can still reachacceptable accuracy when reacting to designer’s deliberation.
3.2. HARDWARE
The system has a Microsoft Kinect2 as its “eye”, a PC as its “brain”, and a portableprojector as its “fingers”. Two types of 3d sensors (structured light and TOF)(Butkiewicz 2015) are used widely. After Kinect 1, Kinect 2, and RealSenseare evaluated, Kinect 2 (300$) is selected for its acceptable accuracy and hugedevelopment community. A portable projector (Philips ppx4010) (300$) is usedto prompt information on the surface of foam models for its portable size and bigtolerance of focus distance.
In the selection of materials of tangible models, several kinds of foams arecompared with each other. Their IR reflection ratios, prices and fabrication toolsare evaluated. Finally, normal white EPS foam, popular in design studios isselected as the working material.

MR. SAP: AN ASSISTANT CO-WORKING WITH ARCHITECTS IN ATANGIBLE-MODEL-BASED DESIGN PROCESS
561
Additionally, a turning plat decorated with ARmarkers is used to host the foammodel, which can greatly reduce the calculation time for point clouds registration.Therefore, real-time performance is improved and cost of PC is reduced. Exceptfor the PC, the hardware cost of MR.SAP adds up to 600$ approximately.
3.3. SOFTWARE
In this stage, MR. SAP is designed to work with Grasshopper (Figure 8), whichmeans:1. The tangible model is perceived as a mesh parameter component in Grasshopper
at a fixed refresh rate;2. The analysis process can be highly customized with algorithms available in
Grasshopper;3. A customized output component in Grasshopper casts the calculated suggestions
onto the foam model as distorted color points through the projector.
Thus, the start and the end components in Grasshopper are developed through the CSharp interface. Several SDKs are used, such as RealSense SDK, OpenCV 2.4.11,AR Toolkit 5.1, PCL 1.7.2.
Figure 8. MR.SAP works in Grasshopper.
4. DemonstrationsAs an initial exploration to apply the MR.SAP, a GFA involved design process fora building is demonstrated here. There are two samples in the demonstration.
The first sample illustrated in Figure 9 shows howMR.SAPworks out the GFAof a tangible model. In this scene, the foam model represents a high-rise building,cut by the user manually. When the user modifies the shape of themodel, MR.SAP,as an assistant, collects themodel’s data in a prescribed scale and provides the GFAof the building to the user on the screen in real time.

562 C. SUN ET AL.
The second sample illustrated in Figure 10 shows howMR.SAP suggests whereto cut on the foammodel through paths lit by its projector to satisfy the user’s GFAreduction requirements. In this scene, the user tries to cut the model to adjust theGFA to 20000 square meters by changing the inclination of the top surface of theshape, which is a tough task without digital assistance. MR.SAP helps work outthe exact cutting boundary and projects it on the tangible model. Therefore, theuser can follow the prompts given byMR.SAP and cut the model to reach the GFArequirements manually.
However, MR.SAP’s real-time performance still needs to be improved. Whenworking on a PC with Core i7 2.60GHz, the two samples need 5-7 seconds torebuild the image projected on the form when dealing with different scanningviews.
Figure 9. Sample 1.

MR. SAP: AN ASSISTANT CO-WORKING WITH ARCHITECTS IN ATANGIBLE-MODEL-BASED DESIGN PROCESS
563
Figure 10. Sample 2.
5. ConclusionsBased on concept of TUI and the framework of PCS, MR.SAP is built offeringa Tangible User Interface. It prevents visual thinking from being interrupted,during which digital technologies serve as an assistant instead of a roboticcraftsman. And the illustrated demonstration shows that MR. SAP is a feasibleassistant to co-work with the designer and to provide performance information andoperation suggestions. This reveals another huge potential of digital technologyin architecture field, namely “a robotic design assistant”.
Obviously, there are still two main problems in the current stage. One is thenon-linear scan deviation. In order to increase the accuracy of MR.SAP, thereshould be an engineering method to calibrate the irregular scan deviation. Theother is real-time performance in projection. The refresh rate of MR.SAP is stillvery low. Specific optimization algorism is needed and parallel computing withGPUs is planned.
AcknowledgementsThis study is supported by a project of National Natural Science Foundation ofChina (Grant No.51778417) and The National Key Research & DevelopmentProgram of China (Grant No. 2016YFC0700200).
ReferencesArnheim, R.: 1969, Visual Thinking, Berkeley: Univ of California Press B.
564 C. SUN ET AL.
Butkiewicz, T.: 2015, Low-cost coastal mapping using Kinect v2 time-of-flight cameras,Oceans - St. John, 1-9.
Buxton, W.: 2007, Sketching user experience: Getting the design right and the right design,CA: Morgan Kaufmann, San Francisco.
Dalsgaard, P. and Halskov, K.: 2012, Tangible 3D tabletops: combining tangibletabletop interaction and 3D projection, Proceeding of the 7th Nordic Conference onHuman-Computer Interaction: Making Sense Through Design Pages, Copenhagen,109-118.
Fleischmann, M. and Menges, A.: 2011, ICD/ITKE Research Pavilion: A Case Study ofMulti-disciplinary Collaborative Computational Design, Springer Berlin Heidelberg, 1,239-248.
Ishii, H.: 2008, Tangible Bits: Beyond Pixels, Proceedings of the 2nd International Conferenceon Tangible, Embedded and Embodied Interactions, Bonn, xv-xxv.
Reed, S., Kreylos, O., Hsi, S., Kellogg, L., Schladow, G., Yikilmaz, M. B., Segale, H.,Silverman, J., Yalowitz, S. and Sato, E.: 2014, Shaping Watersheds Exhibit: AnInteractive, Augmented Reality Sandbox for Advancing Earth Science Education, AmericanGeophysical Union (AGU) Fall Meeting.
Schubert, G., Anthes, C., Kranzlmuller, D. and Petzold, F.: 2012, From physical to virtual:Real-time immersive visualisations from an architect, The International Conference onConstruction Applications of Virtual Reallity, Taipei, 417-426.
Schubert, G., Eva, A., Frank, P. and Gudrun, K.: 2011, Tangible tools for architectural design:seamless integration into the architectural workflow, The Association for Computer AidedDesign in Architecture:Integration Through Computation, Calgary/Banff, 252-259.
Sun, C., Zheng, Z. and Wang, Y.: 2017, MR.SAP: An Assistant Co-working with Architectsin Tangible-Model-Based Design Process, Proceedings of 2017 National Conference onDigital Technologies in Architectural Education and DADA 2017 International Conferenceon Digital Architecture, Nanjing, 233-237.
Ullmer, B. and Ishii, H.: 1997, The metaDESK: models and prototypes for tangible userinterfaces, Proceeding of the 10th annual ACM symposium on User interface software andtechnology, 223-232.
Yuan, F.: 2012, Digital Fabrication Paradigm Shifting under the New Methodology, TimeArchitecture, 02, 74-79.
Yuan, F. and Tong, X.: 2014, The Research and Practice of Digital Design Research Center(DDRC), Achitectural Journal, 8, 14-19.
INTEGRATED IR VISION SENSOR FOR ONLINE CLOTHINGINSULATION MEASUREMENT
SILIANG LU1 and ERICA COCHRAN HAMEEN21PhD candidate, School of Architecture, Carnegie Mellon [email protected] Professor, School of Architecture, Carnegie [email protected]
Abstract. As one of the most important building systems, HVAC playsa key role in creating a comfortable thermal environment. PredictedMean Vote (PMV), an index that predicts the mean value of the votes ofa large group of persons on the thermal sensation scale, has been adoptedto evaluate the built environment. Compared to environmental factors,clothing insulation can be much harder to measure in the field. Theexisting research on real-time clothing insulation measurement mainlyfocuses on expensive infrared thermography (IR) cameras. Therefore, toensure cost-effectiveness, the paper has proposed a solution consistingof a normal camera, IR and air temperature sensors and Arduino Nanosto measure clothing insulation in real-time. Moreover, the algorithmincludes the initialization from clothing classification with pre-trainedneural network and optimization of the clothing insulation calculation.A total of 8 tests have been conducted with garments for spring/fall,summer and winter. The current results have shown the accuracy ofT-shirt classification can reach over 90%. Moreover, compared withthe results with IR cameras and reference values, the accuracies of theproposed sensing system vary with different clothing types. Researchshall be further conducted and be applied into the dynamic PMV-basedHVAC control system.
Keywords. Clothing insulation; skin temperature; clothingclassification; IR temperature sensor; Optimization.
1. IntroductionAs one of the most important building systems, HVAC plays a key role increating a comfortable thermal environment. Because there are large variationsof thermal comfort from person to person, it is difficult to satisfy everyone ina space. Therefore, Predicted Mean Vote (PMV), an index that predicts themean value of the votes of a large group of persons on the thermal sensationscale, has been adopted widely to evaluate if the environment is comfortableor not for most of occupants. Moreover, the well-known Fanger’s equationdescribes the relation between PMV and six primary factors, which are metabolic
T. Fukuda, W. Huang, P. Janssen, K. Crolla, S. Alhadidi (eds.), Learning, Adapting and Prototyping,Proceedings of the 23rd International Conference of the Association for Computer-Aided ArchitecturalDesign Research in Asia (CAADRIA) 2018, Volume 1, 565-573. © 2018 and published by the Associationfor Computer-Aided Architectural Design Research in Asia (CAADRIA) in Hong Kong.

566 S. LU AND E. COCHRAN HAMEEN
rate, clothing insulation, air temperature, mean radiant temperature, air speedand relative humidity. Compared to environmental factors, personal factors ofclothing insulation and metabolic rate can be much harder to measure in thefield. According to (ASHRAE 55, 2010), for near-sedentary activities wherethe metabolic rate is approximately 1.2 met such as in office areas, the effectof changing clothing insulation on the optimum operative temperature can reachapproximately 6 C per clo. Therefore, the effect of clothing insulation on thermalcomfort outweighs that of metabolic rate in typical office environment.
As to clothing insulation, most of the existing methods assume the valuesto be fixed by using thermal mannequins or developing some complexand time-consuming insulation models or predict them from the outdoor airtemperature and the indoor operative temperature(Schiavon & Lee, 2013). Hence,none of them reflects the real conditions in the field and can be applied intodynamic HVAC operations. Moreover, the existing research on real-time clothinginsulation measurement mainly focuses on using infrared thermography (IR)cameras so as to develop a non-invasive sensing system. However, IR cameras arestill expensive in the market compared with other sensors such as IR temperaturesensors. Therefore, this paper has proposed a real-time vision-based clothinginsulation measurement method without IR camera for thermal comfort.
To ensure cost-effectiveness of the sensing system, unlike previous research,the proposed solution consists of a webcam, IR temperature sensors, airtemperature sensors and Arduino Nanos. The total cost of the system is less than$150 while the price of a FLIR ONE Pro IR camera for smart phones could beas high as $399. Meanwhile, the algorithm of the proposed solution includesthe initial clothing insulation measurement from clothing classification with thepre-trained neural network and non-linear optimization of the clothing insulationcalculation based on ISO 7933 (ISO 7933, 2004).
The test bed is located in a typical private office room where occupants do nothave large metabolic rates and relative humidity keeps steadily around 25%, thusthe effects of moisture on clothing insulation being negligible. Moreover, the airvelocity keeps lower than 0.1 m/s for the whole experiments. A total of 8 testshave been conducted with garments for spring/fall, summer and winter seasons,respectively.
2. MethodologyThe real-time and in-situ clothing insulation estimation consists of two parts. Thefirst part is the initialization with clothing classification and the second part isthe estimation refinement. The following diagram shows the whole procedure ofclothing insulation measurement.

INTEGRATED IR VISION SENSOR FOR ONLINE CLOTHINGINSULATION MEASUREMENT
567
Figure 1. Diagram of real-time and in-situ clothing insulation estimation.
2.1. CLOTHING INSULATION ESTIMATION INITIALIZATION WITHCLOTHING DETECTION
The initialized value of clothing insulation was achieved by using pre-trainedclassifier of GoogLeNet (Szegedy et al., 2015) trained with all classes fromImageNet datasets. In addition, a general garment insulation table (ASHRAE 55,2010) was used for clothing insulation initialization to map the classified clothingtype with the clothing insulation.
2.2. CLOTHING INSULATION ESTIMATION REFINEMENT BASED ON ISO7933 (ISO 7933, 2004)
Under static state conditions, there are no movements of the air or of the person.Therefore, the total static insulation expressed in Eq.1 is the sum of clothinginsulation and the insulation of enclosed air layers under static conditions.
Itst = Iclst +I∗fcl
(1)
where Itst is the total static thermal insulation, Iclst is the static clothing insulation,
568 S. LU AND E. COCHRAN HAMEEN
I∗is the static air insulation (estimated as 0.111m2KW−1). In addition, fcl is theclothing area factor, which is the ratio of the clothed and naked-skin surface areas,which can be calculated with the static clothing insulation (Iclst) in Eq.2:
fcl =1 + 1.97Iclst (2)Based on the unit conversion from m2KW−1 into clo, the total static clothinginsulation can be represented with Icl with the unit of clo in Eq.3:
Itst = 0.155Icl +I∗
1 + 0.305Icl(3)
However, for in-situ measurement, the thermal state shall be dynamic. Therefore,when taking air movement into consideration, the dynamic air thermal insulationand the total dynamic clothing insulation shall be calculated with dynamic aircorrection factor of Cia and dynamic total clothing correction factor of Ct,respectively. In the end, based on the proposed algorithm of (Lee et al., 2016),the clothing insulation of Icl can be estimated in real-time based on the non-linearfunction of Eq. 4:
0.305I2cl + Icl −1
0.155Ct{α+ I∗(Cia − Ct)} = 0 (4)
α =tsk − tcl
hc(tcl − ta) + 3.85 · 10−8(t4cl − t4r)(5)
hc = 12.1√var if 2.38|tcl − ta|0.25 ≤ 12.1
√var (6)
Ct = Ccl if Icl ≥ 0.6 (7)
Ct = IclCcl − Cia
0.6+ Cia if Icl < 0.6 (8)
where Ccl is the correction factor of dynamic clothing insulation, which can becalculated in Eq.9:
Ccl = e−0.263(var−0.15)+0.0272(var−0.15)2+0.193vw+0.101v2w (9)
Cia = e−0.559(var−0.15)+0.057(var−0.15)2+0.271vw−0.027v2w (10)
Therefore, with the inputs of skin temperature (tsk), clothing temperature (tcl),indoor air temperature(ta), mean radiant air temperature(tr), air velocity(var)and walking velocity(vw), the clothing insulation of Icl shall be estimated byminimizing the result of left-hand side of Eq.(4) close to zero as much as possibleand the outputs of clothing insulation estimation can be used for applications likePMV-based HVAC control.
3. Experimental setupThe proposed sensing system consists of a webcam, two IR temperature sensors(tmp006), one air temperature sensors (DHT11) and two Arduino Nanos. One ofthe IR temperature sensors was used to measure the neck or the ankle temperaturewhile the other was used to measure the clothing temperature. Moreover, oneof the Arduinos was used to transfer temperature data from the air temperature

INTEGRATED IR VISION SENSOR FOR ONLINE CLOTHINGINSULATION MEASUREMENT
569
sensor to the monitor while the other was used to transfer temperature data fromIR temperature sensors to the monitor. In addition, in order to compare theperformances with IR camera, a FLIR B-series thermal camera was also used.The IR temperature sensors read a sample of clothing temperature or skin(neck)temperature every 4s and the air temperature sensors read a sample every 2.5s. Thesensing system of air temperature sensors and IR temperature sensors is shownin the following figures. In addition, since all the participants are standing, thewalking velocity is 0 m/s and the air velocity is assumed to be 0.1 m/s all the time.
3.1. SENSORS
Figure 2. IR temperature sensors(tmp006).
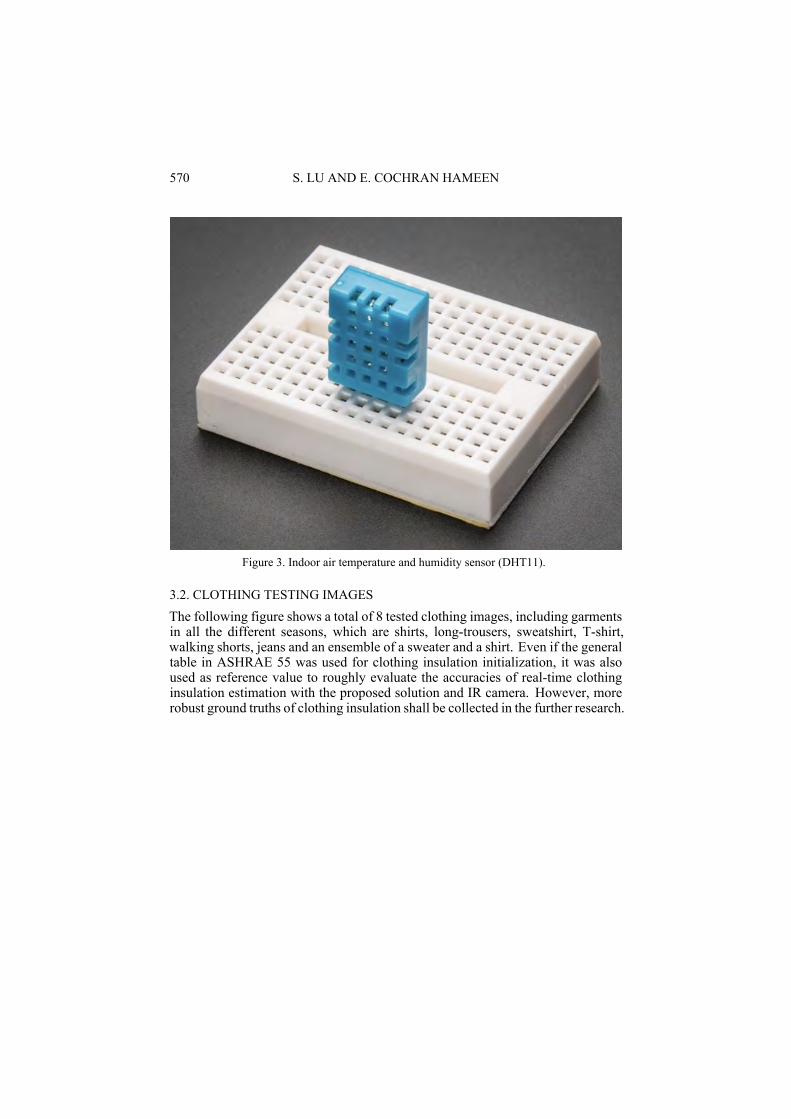
570 S. LU AND E. COCHRAN HAMEEN
Figure 3. Indoor air temperature and humidity sensor (DHT11).
3.2. CLOTHING TESTING IMAGES
The following figure shows a total of 8 tested clothing images, including garmentsin all the different seasons, which are shirts, long-trousers, sweatshirt, T-shirt,walking shorts, jeans and an ensemble of a sweater and a shirt. Even if the generaltable in ASHRAE 55 was used for clothing insulation initialization, it was alsoused as reference value to roughly evaluate the accuracies of real-time clothinginsulation estimation with the proposed solution and IR camera. However, morerobust ground truths of clothing insulation shall be collected in the further research.

INTEGRATED IR VISION SENSOR FOR ONLINE CLOTHINGINSULATION MEASUREMENT
571
Figure 4. A total of 8 different garments.
4. Result analysis4.1. CLOTHING DETECTION
The following table shows the performances of clothing classification of part ofclothing garments with the pre-trained neural network. As shown in the table, theaccuracies vary a lot for different garments. One of the reasons is that since thepre-trained classifier includes all 1000 classes, it classifies the image into the classwith the highest probability, which is not limited within classes related to clothingtypes.
Table 1. Performances of clothing detection.
4.2. CLOTHING INSULATION ESTIMATION
The following table shows the performances of real-time and in-situ clothinginsulation measurements with the proposed sensing system and IR camera. TheID numbers correspond with the numbers in Figure 3. As shown in the table, due

572 S. LU AND E. COCHRAN HAMEEN
to different materials (i.e. the cotton shirt), some of the initialized values fromASHRAE 55 cannot be used as reference values. Moreover, compared with IRcamera, 80% of the estimated values with the proposed system is closer to thereference values, which indicates the initialized clothing insulation could achievefast convergence of the non-linear function of left-hand side of Eq.4. Moreover,the proposed sensing system is more cost-effective than IR camera. However,compared with IR camera, multiple IR temperature sensors were implemented toget the average clothing temperature or skin temperature (i.e. skin temperatureof the neck for upper clothing while that of the ankle for lower clothing). It tooklonger time to get steady temperature values with the proposed solution than IRcamera and the distance between IR temperature sensors and the participants hasto be much smaller than that between IR camera and the participants.
Table 2. Performances of clothing insulation measurements.
5. DiscussionsBased on the results of clothing insulation estimation, the proposed sensing systemcan be used for estimation in real time. However, further research could be doneto enhance the performances. Firstly, instead of using the general table fromASHRAE 55, more accurate ground-truths of clothing/garments shall be collectedwith either simulations or more detailed experiments. Secondly, instead of usingpre-trained GoogLeNet with all classes, the clothing classification system shall betrained with only clothing classes to increase the accuracy of classification. Lastbut not least, due to the effects of dynamic air layers and wide angles of the IRtemperature sensors, the measured skin temperatures and clothing temperatureswith the current proposed system does not become steady within 2 minutes andthe distance between the IR temperature sensors and the participants has to belimited. Therefore, further research could also be done to mitigate the effectsof dynamic air layers and wide angles so as to increase the distances as well asdecrease the measuring periods. Moreover, the current experimental space is aprivate office room with one single participants. It is also interesting to see how tomeasure clothing insulation with multiple people in an open plan office. Since theIR temperature sensors need to be close to the surface, it could be a potential todevelop a portable sensing device or embedded into existing furnitures to measure

INTEGRATED IR VISION SENSOR FOR ONLINE CLOTHINGINSULATION MEASUREMENT
573
online clothing insulation of each individual in an open plan office.
6. ConclusionsThis paper has proposed a new sensing system for in-situ and real-time clothinginsulation estimation for applications such as PMV-basedHVAC control system toenhance the thermal environment indoors. A total of 8 tests have been conductedwith garments for spring/fall, summer and winter. Compared with the results of IRthermography and reference values, the accuracies of the proposed sensing systemvary with different clothing types. Research shall be further conducted to enhancethe performances of real-time clothing insulation estimation with the proposedsensing system in terms of accuracy and cost-effectiveness.
AcknowledgementThe project is sponsored by Chinese Scholarship Council and CMU GraduateSmall Project Help Research Grant.
ReferencesASHRAE, S.: 2010, Standard 55-2010:Thermal Environmental Conditions for Human
Occupancy, ASHRAE. Atalanta USA.Banerjee, D., Chattopadhyay, S. K. and Suneet, T.: 2013, Infrared thermography in material
research- A review of textile applications, Indian Journal of Fibre & Textile Research, 38,427-437.
Lee, J. H., Kim, Y. K. and Kim, K. S.: 2016, Estimating Clothing Thermal Insulation Using anInfrared Camera, sensors, 16(3), 341.
Liu, Z., Yan, S., Luo, P., Wang, X. and Tang, X.: 2016, Fashion Landmark Detection in theWild, European Conference on Computer Vision (ECCV).
Malchaire, J.: 2004, ISO 7933, Ergonomics of the Thermal Environment—AnalyticalDetermination and Interpretation of Heat Stress Using Calculation of the Predicted HeatStrain, 2nd ed., International Organization for Standardization (ISO), Geneva.
Schiavon, S. and Lee, K. H.: 2013, Dynamic predictive clothing insulation models based onoutdoor air and indoor operative temperatures, Building and Environment, 59, 250-260.
Szegedy, C., Liu,W., Jia, Y., Sermanet, P. and Reed, S.: 2015, GoingDeeper with Convolutions,CVPR 2015.


Index of AuthorsAAguiar, Rita 1-111van Ameijde, Jeroen 1-173Amtsberg, Felix 1-29, 1-195,
1-245Araullo, Rebekah 1-307Asher, Rob 2-21Ayoub, Mohammed 2-83
BBai, Nan 2-257Balakrishnan, Bimal 1-463Banon, Carlos 1-215Bastos, Francisco 1-111Belém, Catarina 1-111Bhagat, Nikita 2-185Bickerton, Chris 1-59Borhani, Alireza 2-339Bryant, John 2-185Bungbrakearti, Narissa 1-401Burry, Mark 1-473Butler, Andrew 2-21Byrne, Daragh 2-545
CCabrera, Densil 1-59, 1-317Caetano, Inês 1-111Caldwell, Hugo 1-317Candido, Christhina 1-59Cao, Rui 1-339Cardoso Llach, Daniel 1-515Cascaval, Dan 2-545Castelo Branco, Renata 2-557Chai, Hua 1-267Chan, Arthur Ngo Foon 1-9Chan, Ding Yuen Shan 1-9Chaplin, Ian 2-123Chee, Ryan Wei Shen 1-195Chen, Zhewen 1-225Chen, Zi-Ru 1-349Cheng, Paul Hung Hon 1-9Chirkin, Artem 2-483Choi, Jungsik 2-247Chowdhury, Shuva 2-401Chu, Chih-Hsing 1-349Chun, Junho 1-205
Chung, Chia-Chun 2-515Cochran Hameen, Erica 1-565Cooper-Wooley, Ben 1-401, 1-483Creasy, Terry 2-329Crolla, Kristof 1-9, 1-101Cupkova, Dana 2-545
DDixit, Manish 2-185Doherty, Ben 1-401, 1-483,
2-21, 2-237Doyle, Shelby 1-71Dritsas, Stylianos 1-29, 1-195Duarte, José P. 1-421
EEid Mohamed, Basem 1-287ElKaftangui, Mohamed 1-287
FFabbri, Alessandra 1-401, 1-483,
2-21, 2-237,2-381
Feist, Sofia 1-111Fereos, Pavlos 1-81Flatt, Robert J. 1-255Forehand, Leslie 1-71Fukuda, Tomohiro 1-339, 1-391Fung, Enrica 1-101
GGalobardes, Isaac 2-319Gao, Guoyuan 2-227Gardner, Nicole 1-401, 1-483,
2-21, 2-237Globa, Anastasia 1-525Goh, Wei Hern 1-195Gramazio, Fabio 1-255Gu, Jiaxi 2-297Gu, Ning 1-359Guo, Cong 2-113Guo, Zhe 2-217
HHaeusler, M. Hank 1-401, 1-483,
2-21, 2-237,

576
2-381Ham, Jeremy J. 1-121Han, Lu 1-515Han, Yunsong 2-51Hanaoka, Ikuya 1-411Hannouch, Adam 1-317Hawton, Dominic 1-483Herr, Christiane M. 2-319Hong, Sukjoo 2-587Hopfenblatt, James 1-463Hotta, Kensuke 1-327, 1-411,
1-545Hou, June-Hao 2-359Houda, Maryam 1-59, 1-235Huang, Huajing 2-123Huang, Weixin 2-197, 2-207,
2-257Huang, Xiaoran 1-473Hunt, Erin 1-71Hwang, Ji-Hyoun 2-577Hymes, Connor 1-133Hyun, Kyung Hoon 2-463
IIkeda, Yasushi 1-327, 2-31Ilunga, Guilherme 1-111Imanishi, Naoki 1-327Inoue, Kazuya 1-339Ishizawa, Tsukasa 2-31
JJanssen, Patrick 1-163, 2-61Jaschke, Clara 1-81Jeng, Tay-Sheng 1-431, 2-515Jenney, Sarah Louise 1-379Ji, Guohua 1-163Jin, Jinxi 1-267
KKalantar, Negar 2-185, 2-329,
2-339Kawabe, Akihiro 2-493Khabazi, Zubin 1-19Khean, Nariddh 2-237Khoo, Chin Koi 1-525Kim, Eonyong 2-535Kim, Hayan 2-247Kim, Jin Sung 2-247, 2-287
Kim, Lucas 2-237Kim, Meereh 2-525Klemmt, Christoph 1-133Klippel, Alexander 1-421Knapp, Chris 1-277Koh, Immanuel 2-277Kohler, Matthias 1-255
LLagemann, Dennis 2-443Lau, Darwin 1-9Lau, Siu-Kit 2-123Lau, Stephen Siu-Yu 2-123Lee, Alric 1-411, 1-545Lee, Chae-Seok 2-525, 2-587Lee, Gi Bbeum 2-525Lee, Hyunsoo 2-143, 2-411,
2-577Lee, Injung 2-525Lee, Ji-Hyun 2-525, 2-587Lee, Jin Kook 2-247, 2-287Lee, Jisun 2-143, 2-411Lee, Ju Hyun 1-359Lee, Juhun 1-205Lee, Tat Lin 2-349Leitão, António 1-111, 2-557Leung, Chi Kwan 1-29Leung, Emily 2-21Li, Changlin 1-369Li, Jin 2-297Li, Yuan 2-421Liao, Chien-Jung 1-349Lim, Joie 2-61Lin, Yuming 2-197Lin, Yuqiong 1-369, 2-165Liu, Chang 2-567Liu, Jie 2-369Lloret Fritschi, Ena 1-255Lo, Tian Tian 1-443, 1-493Lombardi, Davide 2-319Loughrey, Nick 1-71Lu, Hangxin 2-297Lu, Shuai 2-113Lu, Siliang 1-565Lu, Yao 2-297Luhan, Gregory 1-535Luo, Dan 1-39, 2-369

577
MMa, Hongtao 2-369Mahdavinejad,
Mohammadjavad 2-93Makki, Mohammed 1-153Mansoori, Maryam 2-185, 2-329Martinez, Jorge 2-237Mekawy, Mohammed 2-71Moghimi, Mahdi 2-93Mohammed Aqil, Cheddadi 1-327Molina, Kalani 2-391Moloney, Jules 1-525Mühlhaus, Michael 1-379Müller, Johannes 2-297
NNagakura, Takehiko 2-567Nandavar, Anirudh 1-453Narengerel, Amartuvshin 2-587Nassif, Jimmy 1-453Nelson, Jonathan 1-277Newton, David 2-175Ng, Cheryl 1-29
OOdolphi, Jorke 1-401, 1-483Ogihara, Hisayuki 1-327Oprean, Danielle 1-421Ostwald, Michael 1-359
PPandjaitan, Poltak 1-183Park, Daekwon 1-205, 2-309Park, Hyoung-June 2-391Petzold, Frank 1-379, 1-453,
2-11, 2-71Pilechiha, Peiman 2-93Pishniy, Maxim 2-483Poustinchi, Ebrahim 1-535Przybylski, Maya 2-267
QQiu, Lili 2-421
RRao, Jintong 2-421Raspall, Felix 1-215, 1-245Reinhardt, Dagmar 1-59, 1-235,
1-317Ren, Hui 2-51Rogers, Jessie 1-493Ruiz, Laura 1-555, 2-597Rybkowski, Zofia 2-185, 2-329
SSchmitt, Gerhard 2-297Schnabel, Marc Aurel 1-443, 1-493,
2-401Schneider, Sarah 1-71Schubert, Gerhard 1-453Scotto, Fabio 1-255Sender, Arina 2-483Senske, Nick 1-71Shen, Xiaofei 2-103Shi, Jia 2-227Showkatbakhsh, Milad 1-153Simons, Katrina 2-381Song, Jae Yeol 2-247, 2-287Song, Yutao 1-173Stouffs, Rudi 2-41, 2-61,
2-453Sun, Cheng 2-51, 2-133Sun, Chengyu 1-555, 2-597Sun, Tongyu 1-555, 2-597
TTablada, Abel 2-123Tan, Wei Lin 1-195Tan, Ying Yi 2-349Tanaka, Seigo 1-411Tang, Ming 1-503Tang, Ning 2-369Taylor, Mark 1-359Teh, Priscilla 1-29Tei, Hirokazu 1-545Titchkosky, Ninotschka 1-59Tsiliakos, Marios 1-81
VValitabar, Mahdi 2-93Verniz, Debora 1-421
WWallgrün, Jan Oliver 1-421Wang, Chun-Yung 2-359Wang, Dinglu 2-207

578
Wang, Jinsong 1-39Wang, Likai 1-163Wang, Rui 1-525Wang, Shengmian 1-535Wang, Xiang 1-297, 1-297Wang, Yuze 1-555, 2-597Wang, Zhenyu 2-227Watanabe, Shun 2-493Watt, Rodney 1-59Wei, Wenwen 2-297White, Marcus 1-473Wit, Andrew John 1-49Wozniak-O’Connor, Dylan 1-59
XXiao, Yahan 2-31Xiao, Yiqiang 2-503Xing, Kai 2-133Xu, Tongda 2-207Xu, Weiguo 1-39, 1-143,
2-369
YYabuki, Nobuyoshi 1-339, 1-391Yan, Chao 1-91, 1-369,
2-471Yan, Wei 2-431Yang, Mingyan 2-207Yang, Yang 2-155Yao, Jiawei 1-369, 2-165,
2-217, 2-471Yi, Taeha 2-525Yin, Hao 2-217Yin, Shi 2-503You, Xiaohui 2-207Yousif, Shermeen 2-431Yu, Chuanfei 2-227Yu, K. Daniel 2-381Yuan, Chao 2-123Yuan, Philip F. 1-225, 1-267,
1-297, 1-369,2-165, 2-217,2-471
ZZahedi, Ata 2-11Zeng, Jia 2-133Zhang, Le-Min 1-431
Zhang, Liming 1-225Zhang, Pengyu 1-143Zhang, Ruo-Xi 1-431Zhang, Xu 2-567Zhang, Yunyu 2-471Zhao, Jiayan 1-421Zhao, Yao 1-369, 2-217Zheng, Jingyun 2-165Zheng, Zhaohua 1-555, 2-597Zhu, Li 2-155Zhu, Yuehan 1-391Zureikat, Rana 1-287


