Embed Size (px)
Citation preview
Chapter One
MAINTENANCE 1.1 INTRODUCTION
1.1.1 THE CHANGING WORLD OF MAINTENANCE
Over the past thirty years, maintenance has changed,perhaps more so than any other management discipline.The changes are due to a huge increase in the numberand variety of physical assets (plant, equipment andbuildings) which must be maintained throughout theworld, much more complex designs, new maintenancetechniques and changing views on maintenanceorganization and responsibilities.
Maintenance is also responding to changingexpectations. These include a rapidly growingawareness of the extent to which equipment failureaffects safety and the environment, a growingawareness of the connection between maintenance andproduct quality, and increasing pressure to achievehigh plant availability and to reduce costs.
The changes are testing attitudes and skills in allbranches of industry to the limit. Maintenance peoplehave to adopt completely new ways of thinking,planning and acting, as engineers and as managers.At the same time the limitations of maintenancesystems are becoming increasingly apparent, no matterhow much they are computerized.
In the face of this avalanche of change, managerseverywhere are looking for a approach to maintenance.They want to avoid the false starts and dead endswhich always accompany major upheavals. Instead they
Page 1 of 76
seek a strategic framework which synthesizes the newdevelopments into a coherent pattern, so that theycan evaluate them sensibly and apply those likely tobe of most value to them and their companies.
1.1.2 THE FIRST GENERATION
The First Generation covers the period up to WorldWar II. In those days industry was not very highlymechanized, so downtime did not matter much. Thismeant that the prevention equipment failure was not avery high priority in the minds of most managers. Atthe same time, most equipment was simple and much ofit was over-designed. This made it reliable and easyto repair. As a result, there was no need forsystematic maintenance of any sort beyond simplecleaning and lubrication routines. The need forskills was also lower than it is today.
Chapter One
1.1.3 THE SECOND GENERATION
Things changed dramatically during World War II.Wartime pressures increased the demand for goods ofall kinds while the supply of industrial manpowerdropped sharply. This led to increasedmechanization. By the 1950’s machines of all typeswas more numerous and more complex. Industry wasbeginning to depend on them.As this dependence grew, downtime came into sharperfocus. This led to the idea that equipment failurescould and should be prevented, which led in turn tothe concept of preventive maintenance. In the 1960’s,
Page 2 of 76
this consisted mainly of equipment overhauls done atfixed intervals.The cost of maintenance also started to rise sharplyrelative to other operating costs. These led to thegrowth of maintenance planning and control, and arenow an established part of the practice ofmaintenance.Finally, the amount of capital tied up in fixedassets together with a sharp increase in the cost ofthat capital led people to start seeking ways inwhich they could maximize the life of the assets.
1.1.4 THE THIRD GENERATION
Since the mid-seventies, the process of change inindustry has gathered even greater momentum. Thechanges can be classified under the headings of newexpectations, new research and new techniques.
1.1.5 MAINTENANCE
From the engineering viewpoint, there are twoelements to the management of any physical asset. Itmust be maintained and from time to time it may alsoneed to be modified.The major dictionaries define maintain as cause tocontinue (Oxford) or keep in an existing state(Webster). This suggests that Maintenance means preserving something. On the otherhand, they agree that to modify something means tochange it in some way.When we set out to maintain something, what is itthat we wish to cause to continue? What is theexisting state that we wish to preserve?
Page 3 of 76
The answer to these questions can be found in thefact that every physical asset is put into servicebecause someone wants it to do something. In otherwords, they
Chapter One
expect it to fulfill a specific function orfunctions. So it follows that when we maintain anasset, the state we wish to preserve must be one inwhich it continues to do whatever its users want itto do.
Maintenance: Ensuring that physical assets continueto do what their users want them to do.
1.2 FUNCTIONS AND PERFORMANCE STANDARDS
Before it is possible to apply a process used todetermine what must be done to ensure that anyphysical asset continues to do whatever its userswant it to do in its present operating context, weneed to do two things:
determine what its users want it to do
ensure that it is capable of doing what it users
want to start with.
Primary functions, which summarizes’ why theasset was acquired in the first place. Thiscategory of functions covers issues such asspeed, out-put carrying or storage capacity, andproduct quality and customer service.
Page 4 of 76
Secondary functions, which recognize that everyasset is expected to do more than simply fulfillits primary functions. Users also haveexpectations in areas such as safety, control,containments, comfort, structural integrity,economy, protection, efficiency of operation,compliance with environmental regulations andeven the appearance of the asset.
1.3 OBJECTIVES OF MAINTENANCE
The objectives of maintenance are defined by thefunctions and associated performance expectations ofthe asset under consideration. But how doesmaintenance achieve these objectives?The only occurrence which is likely to stop any assetperforming to the standard required by its users issome kind of failure. This suggests that maintenanceachieves its objectives by adopting a suitableapproach to the management of failure.However,
firstly, by identifying what circumstances amount
to a failed state
then by asking what events can cause the asset to
get into a failed state.Chapter One
In the world of RCM, failed states are known asfunctional failures because they occur when an assetis unable to fulfill a function to a standard ofperformance which is acceptable to the user.
1.4 FAILURE MODES
Page 5 of 76
As mentioned all the events which are reasonablylikely to cause each failed state. These events areknown as failure modes ‘Reasonably likely’ failuremodes include those which have occurred on the sameor similar equipment operating in the same context,failures which are currently being prevented byexisting maintenance regimes, and failures which havenot happened yet but which are considered to be realpossibilities in the context in question.Most traditional lists of failure modes incorporatefailures caused by deterioration or normal wear andtear.
1.5 FAILURE EFFECTS
Failure effects, which describe what happens wheneach failure mode occurs. These descriptions includeall the information needed to support the evaluationof the consequences of the failure, such as:
what evidence (if any) that the failure has
occurred
in what ways (if any) it poses a threat to safety
or the environment
in what ways (if any) it affects production or
operations
what physical damage (if any) is caused by the
failure
what must be done to repair the failure.
The process of identifying functions, functionalfailure modes and failure effects yields surprising
Page 6 of 76
and often very exciting opportunities for improvingperformance and safety, and also for eliminatingwaste.
1.6 FAILURE CONSEQUENCES
Failure consequences can be classified into four
groups:
Hidden failure consequences: Hidden failures haveno direct impact, but they expose theorganization to multiple failures with serious,often catastrophic, consequences. (Most of thesefailures are associated with protective deviceswhich are not fail-safe.
Chapter One
SAFETY AND ENVIRONMENTAL CONSEQUENCES: A failurehas safety consequences if it could hurt or killsomeone. It has environmental consequences if itcould lead to a breach of any corporate, regionalnational or international environmental standard.
Operational consequences: A failure hasoperational consequences if it affects production(output, product quality, customer service oroperating costs in addition to the direct cost ofrepair)
Non-operational consequences: Evident failureswhich fall into this category affect neithersafety nor production, so they involve only thedirect cost of repair.
The consequence evaluation process shifts emphasisaway from the idea that all failures are bad and must
Page 7 of 76

be prevented. In so doing helps us to, it focusesattention on the maintenance activities which havemost effect on the performance of the organization,and diverts energy away from those which have littleor no effect. It also encourages us to think morebroadly about different ways of managing failure.
1.7 Age and Deterioration
Any physical asset which is required to fulfill afunction which brings it into contact with the realworld will be subjected to a variety of stresses.These stresses cause the asset to deteriorate bylowering its resistance to stress. Eventually thisresistance drops to the point at which the asset canno longer deliver the desired performance – in otherwords, it fails.
Exposure to stress is measured in a variety of waysincluding output, distance travelled, operatingcycles, calendar time or running time. These unitsare all related to time, so it is common to refer tototal exposure to stress as the age of the item. Thisconnection between stress and time suggests thatthere should be a direct relationship between therate of deterioration and the age of the item. Ifthis is so, then it follows that the point at whichfailure occurs should also depend on the age of theitem.
Deterioration is directly proportional to the
applied stress, and
The stress is applied consistently.
Page 8 of 76

If this were true of all assets, we would be able topredict equipment life with great precision. Theclassical view of preventive maintenance suggeststhat this can be done – all we need is enoughinformation about failures.
Chapter One
Most people still tend to assume that similar itemsperforming a similar duty will perform reliably for aperiod, perhaps with a small number of random earlyfailures, and then most of the items will ‘wear out’at about the same time.Age-related failure patterns apply to items which arevery simple, or to complex items which suffer from adominant failure mode. In practice, they are commonlyfound under conditions of direct wear (most oftenwhere the equipment comes into direct contact withthe product). They are also associated with fatigue,corrosion, oxidation and evaporation.
Examples of points where equipment comes with theproduct include furnace refractory, pump impellers,valve seats, machine tooling, screw conveyors,crushers and hopper liners, the inner surfaces ofpipelines, dies and so on.Fatigue affects items- especially metallic items-which are subjected to reasonably- high frequencycyclic loads. The rate and extent to which oxidationand corrosion affect any item depend of course on itschemical composition, the extent to which it isprotected and the environment in which it isoperating. Evaporation affects solvents and lighterfractions of petrochemical products.
Page 9 of 76
Two preventive options which are available underthese circumstances are scheduled restoration taskand scheduled discard tasks.
Scheduled Restoration Task
As the name implies, scheduled restoration entailstaking periodic action to restore an existing item orcomponent to its original condition ( or moreaccurately, to restore its original resistance tofailure). Specifically:
‘Scheduled restoration entails remanufacturing a single component or overhauling an entire assembly at or before a specified age limit,
regardless of its condition at the time’.
Scheduled tasks are also known as scheduled rework tasks. As the above definition suggest, they include overhauls which are done at pre-set intervals. Examples: locomotives, wagons , coaches, signaling point, e.t.c.
The Frequency of Scheduled Restoration Tasks
The frequency of a scheduled restoration task is governed by age at which the item or component shows a rapid
increase in the conditional probability of failure
Chapter One
In practice, the frequency of a scheduled restorationtask can only be determined satisfactorily on thebasis of reliable historical data. This is seldomavailable when assets first go into service, so it isusually impossible to specify scheduled restoration
Page 10 of 76
tasks in prior-to-service maintenance programs.However, items subject to very expensive failuremodes should be putting age exploration programs assoon as possible to find out if they would benefitfrom scheduled tasks.
1.8 The Technical feasibility of Scheduled Restoration
The above comments indicate that for a scheduledrestoration task to be technically feasible, thefirst criteria which must be satisfied are that
There must be a point at which there is an increase in the conditional probability of failure ( in other words, the item must have a ‘life’)
We must be reasonably sure what the life is.
Secondly, most of the items must survive to this age.If too many items fail before reaching it, the netresult is an increase in unanticipated failures. Notonly could this have unacceptable consequences, allthe items must survive to the age at which thescheduled restoration task is to be done, because wecannot risk failures which might hurt people ordamage the environment.
Finally, scheduled restoration must restore theoriginal resistance to failure of the asset, or atleast something close enough to the originalcondition to ensure that the item continues to beable to fulfill its intended function for areasonable period of time.
Scheduled restoration task are technically feasible if:
Page 11 of 76
There is an identified age at which the item shows a rapid increase in the conditional probability of failure.
Most of the items survive to that age( all of the items if the failure has safety or environmental consequences)
They restore the original resistance to failure of the item.
1.9 The Effectiveness of Scheduled Restoration Task
Even if it is technically feasible, scheduledrestoration might still not be worth doing becauseother tasks may be even more effective.If a more effective task cannot be found, there isoften a temptation to select scheduled restorationtasks purely on the grounds of technical feasibility.An age limit applied to an item means that some
Chapter One
items will receive attention before they need itwhile others might fail early, but the net effect maybe an overall reduction in number of unanticipatedfailures. However even then scheduled restorationmight not be worth doing, for the following reasons.
As mentioned earlier, a reduction in the numberof failures is not sufficient if the failure hassafety or environmental consequences, because wewant to eliminate these failure altogether.
If the consequences are economic, we need to besure that over a period of time, the cost ofdoing the scheduled restoration task is less thanthe cost of allowing the failure to occur. Whencomparing the two, bear in mind that an age limitlowers the service life of any item, so itincreases the number of items sent to theworkshop for restoration.
Page 12 of 76
When considering failures which have operationalconsequences, bear in mind that a scheduledrestoration task may affect operations. In mostcases, this effect is likely to be less than theconsequences of the failure because:
The scheduled restoration task would normally bedone at a time when it is likely to have theleast effect on production (usually during a socalled production window).
The scheduled restoration task is likely to takeless time than it would to repair the failurebecause it is possible to plan more thoroughlyfor the scheduled task.
If there are no operational consequences, scheduledrestoration is only justified if it costssubstantially less than the cost of repair (which maybe the case if the failure causes extensive secondarydamage).
1.10 Scheduled Discard Tasks
Again as the name implies, scheduled discard meansreplacing an item or component with a new one at pre-set intervals. Specifically:
Reliability - Centered Maintenance
Scheduled discard entails discarding an item or component at or before a specified age limit,
regardless of its condition at the time
Chapter One
Page 13 of 76
These tasks are done on the understanding thereplacing the old component with a new one willrestore the original resistance to failure.
1.11 The Frequency of Scheduled Discard Tasks
Like scheduled restoration tasks are only technicallyfeasible if there is a direct relationship betweenfailure and operating age. The frequency at whichthey are done is determined on the same basis, so:
The frequency of a scheduled discard task is governed bythe age at which the item or component shows a rapid
increase in the conditional probability of failure.
In general, there is a particularly widely heldbelief that all items’ have a life’ and thatinstalling a new part before this’ life’ is reachedwill automatically make it’ safe’. This is not alwaystrue, so RCM takes special care to focus on safetywhen considering scheduled discard tasks.For this reason, there are two different types oflife-limits when dealing with scheduled discardtasks. The first apply to tasks meant to avoidfailures which have safety consequences, and arecalled safe-life limits. Those which are intended toprevent failures which do not have safetyconsequences are called economic-life limits.
1.12 Safe-life limits
Safe-life limits only apply to failures which havesafety or environmental consequences so theassociated tasks must prevent all failures forexample signaling apparatus communications. In other
Page 14 of 76
words, no failures should occur before this limit isreached.In practice, safe-life limits can only apply tofailure modes which occur in such a way that nofailures can be expected to occur before the wear outzone is reached.
Ideally, safe-life limits should be determined beforethe item is put into service. It should be tested ina simulated operating environment to determine whatlife is actually achieved, and a convective fractionof this life used as the safe-life limit.
There is never a perfect correlation between a testenvironment and the operating environment. Testing along-lived part to failure is also costly andobviously takes a long time, so there is usually notenough test data for survival curves to be drawn withconfidence. In these cases safe-life limits can be
Chapter One
established by dividing the average by an arbitraryfactor as large as three and four. This implies thatthe conditional probability of failure at the safe-life limit would essentially be zero. In other wordsthe safe-life limit is based on 100% probability ofsurvival to that age.
The function of a safe-life limit is to avoid theoccurrence of a critical failure, so the resultingdiscard task is worth doing if it ensures that nofailure occur before the safe-life limit.
1.13 Economic-life limits
Page 15 of 76
Operating experience sometimes suggests that thescheduled discard of an item is desirable on economicgrounds. This is known as an economic-life limit. Itis based on the actual age-reliability relationshipof the item, rather than a fraction of the averageage at failure.
The only justification for an economic life limitsare cost-effectiveness. In the same way thatscheduled restoration increases the number of jobspassing through the workshop, so scheduled discard.As a result, the cost-effectiveness of scheduleddiscard tasks is determined in the same way as it isfor scheduled restoration tasks.In general, an economic life-limit is worth applyingif it avoids or reduces the operational consequencesof an unanticipated failure, or if the failure whichit prevents causes significant secondary damage.Clearly, we must know the failure pattern before wecan assess the cost effectiveness of scheduleddiscard tasks.
1.14 The Technical Feasibility of Scheduled Discard Tasks
Scheduled discard tasks are technically feasible under the following circumstances:
Scheduled discard tasks are technically feasible if:
There is an identifiable age at which the item shows a rapid increase in the conditional probability of failure
Most of the items survive to that age (all of the items if the failure has safety or environmental consequences).
1.15 Failures which are not Age-related
Page 16 of 76
This is due primarily to a combination of variationin applied stress and increasing complexity.
Chapter One
Many failures are caused by increases in appliedstress, which are caused in turn by incorrectoperation, incorrect assembly or external damage.(Ideally, ‘preventing’ failures of this sort shouldbe a matter of preventing whatever causes theincrease in stress levels, rather than a matter ofdoing anything to the asset.)
Items are made more complex to improve theirperformance (by incorporating new or additionaltechnology or by automation) or to make them safer(using protective devices).In other words, better performance and greater safetyare achieved at the cost of greater complexity meansbalancing, with the size and mass needed fordurability. This combination of complexity andcompromise:
Increase the number of components which can fail,and also increases the number of interfaces orconnections between components. This in turnincreases the number and variety of failureswhich can occur.
Reduces the margin between the initial capabilityof each component and the desired performance (inother words, the ‘can’ is closer to the ‘want’),which reduces scope for deterioration beforefailure occurs.
Page 17 of 76
These two developments in turn suggest thatcomplex items are more likely to suffer fromrandom failures than simple items.
Chapter Two
2.0 INTRODUCTIONThe introduction of highly reliable sensors, remotecondition monitoring equipment, data acquisition,data analysis, e.t.c will change the form andfunctionality of engineering systems and maintenancewithin any infrastructure sectors. Infrastructuralcompanies use intelligent today to increasereliability, safety and reduce cost. It is vital toknow that this intelligent infrastructure will createhuman factor challenges. In this paper, basicprinciple of intelligent infrastructure that cut
Page 18 of 76
across sectors (Cloud Computing, Cognitive Computing,Cense (sensors) Photonic etc) and human factors arediscussed.
2.1 CLOUD COMPUTING
“The cloud” is simply a business model for thecreation and delivery of computer resources. Themodel’s reliance on shared resources andvirtualization allows cloud users to achieve levelsof economy and scalability that would be difficult ina traditional data center. As such, the cloud isalready transforming how we access and use technology– similar to how adoption of mass productiontransformed manufacturing during the IndustrialRevolution.
At the same time, enterprises have been cautionsabout moving their workloads to cloud services.According to a recent Frost & Sullivan survey, just 9percent of enterprises are currently using cloudinfrastructure services. Adopters and non-adoptersalike cite concerns about security, loss of control,application performance, and availability andresilience of workloads (e.g. storage, corporateapplications, test and developments).
So, is the cloud a friend or foe to overtaxed ITdepartments? The answer depends heavily on whichcloud is chosen. Although the industry refers to“THE cloud,” it is a misnomer that can causeconfusion. In fact, each cloud is different, witheach provider offering unique cloud services andconfigurations. Common cloud options include:
Page 19 of 76
Public cloud, in which multiple companies sharephysical servers and networking resources hostedin a provider’s data center.
Private cloud, in which companies do not shareresources (although efficiencies may be realizedby hosting multiple virtual applications from thesame company on a single physical server).Private clouds can be located either in aprovider’s data center or in the company’s ownon-premises data center.
Chapter Two
Hybrid cloud, In which virtualized applicationscan be moved among private and public cloudenvironments.For each workload (e.g., storage, corporateapplications, test and development), enterpriseIT departments must not only weigh the benefitsand risks of each option from various providers,but also weigh the value against traditional in-house data center and hosting options.
Scalable, on-demand resources: The ability tolaunch a cloud application in minutes, withouthaving to purchase and configure hardware,enables enterprises to significantly cut theirtime to market. By taking advantage of cloudoptions for “bursting” during peak work periods,enterprises can also cost-effectively improveapplication performances and availability.
Budget-friendly : Cloud computing services requireno capital investment, instead tapping into the
Page 20 of 76
operating budget. As many companies tighten uptheir processes for approval of capitalexpenditures, a service can be easier and fasterto approve and deploy.
Utility pricing : The pay-per-use model thatcharacterizes most cloud services appeals toenterprises that want to avoid overinvesting. Italso can shorten the time to recoup theinvestment.
Cloud computing exhibits the following key
characteristics:
Cost Agility Virtualization Maintenance Security Reliability Device and location independence Application programming interface Multitenancy Scalability and elasticity Performance
Chapter Two
BENEFITS OF CLOUD COMPUTING
Achieve economies of scale – increase volumeoutput or productivity with fewer people.
Page 21 of 76

Reduce spending on technology infrastructure –maintain easy access to your information withminimal upfront spending. Pay as you go (weekly,quarterly or yearly) based on demand.
Globalize your workforce on the cheap. Peopleworldwide can access the cloud, provided theyhave an internet connection.
Streamline processes. Get more work done in lesstime with less people.
Reduce capital costs. There is no need to spendby money on hardware, software or licensing fees.
Improve accessibility. You have access anytime,anywhere, making your life so much easier.
Monitor projects more effectively – stay withinbudget and ahead of completion cycle times.
Less personnel training is needed – it takesfewer people to do more work on a cloud, with aminimal learning curve on hardware and softwareuses.
Minimize licensing new software - stretch andgrow without the need to buy expensive softwarelicense a program.
Improve flexibility – you can change directionwithout serious people or financial issue atstake.
Almost unlimited storage. Backup and Recovery. Automatic software integration – In the cloud,
software integration is usually something thatoccurs automatically. This means that you do notneed to take additional efforts to customize andintegrate your applications as per your
Page 22 of 76
preferences. This aspect usually takes care ofitself. Not only that, cloud computing allows you toitemize your options with great ease. Hence, youcan handpick just those service and softwareapplications that you think will best suit yourparticular enterprise
Ease access to information Quick development
DISADVANTAGES
1.Technical issues :
- ConnectingChapter Two
- Outages- Internet problem- Technical issues
2.Security in the cloud:
- Surrounding company’s sensitive informationto a third party cloud service provider.
3.Prone to attack
- Internal hack attack
Three Categories of cloud computing
1.Infrastructure as a service serves a data storage(Iass)
2.Platform as a service (Paas)3.Software provides as a service (Saas) with access
to already created applications that areoperating in the cloud.
Infrastructure as a service (IaaS)
Page 23 of 76
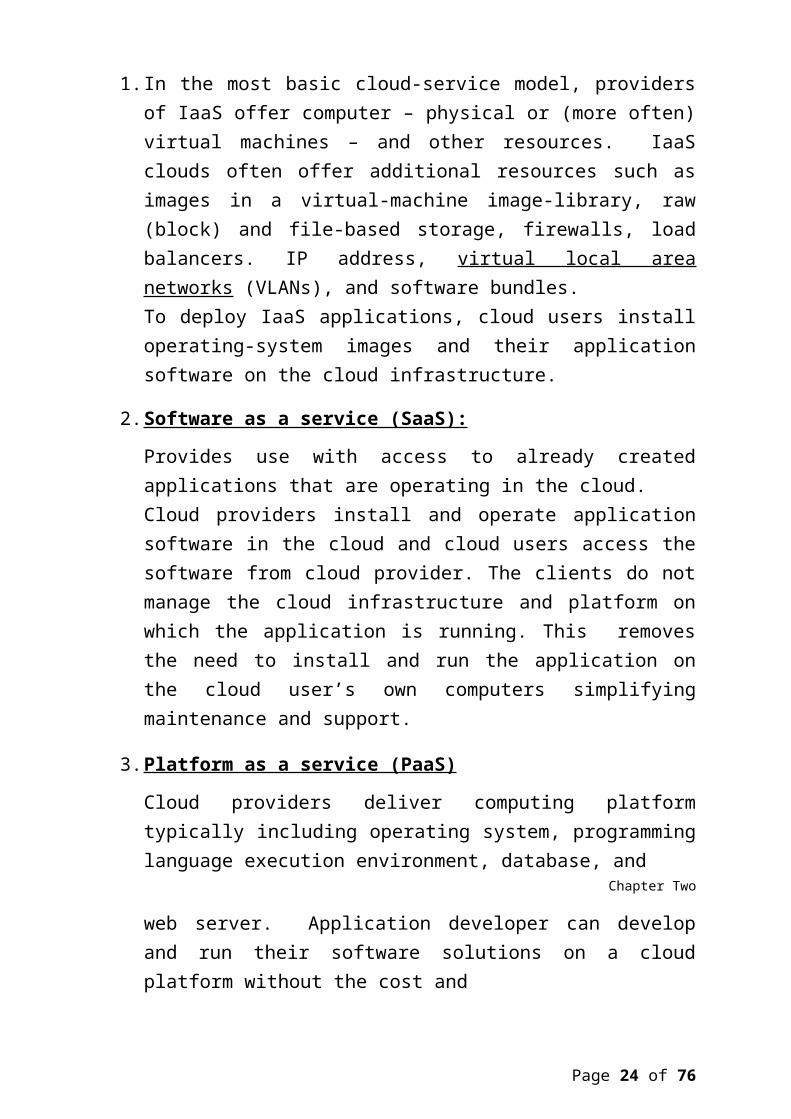
1.In the most basic cloud-service model, providersof IaaS offer computer – physical or (more often)virtual machines – and other resources. IaaSclouds often offer additional resources such asimages in a virtual-machine image-library, raw(block) and file-based storage, firewalls, loadbalancers. IP address, virtual local areanetworks (VLANs), and software bundles.To deploy IaaS applications, cloud users installoperating-system images and their applicationsoftware on the cloud infrastructure.
2.Software as a service (SaaS):
Provides use with access to already createdapplications that are operating in the cloud.Cloud providers install and operate applicationsoftware in the cloud and cloud users access thesoftware from cloud provider. The clients do notmanage the cloud infrastructure and platform onwhich the application is running. This removesthe need to install and run the application onthe cloud user’s own computers simplifyingmaintenance and support.
3.Platform as a service (PaaS)
Cloud providers deliver computing platformtypically including operating system, programminglanguage execution environment, database, and
Chapter Two
web server. Application developer can developand run their software solutions on a cloudplatform without the cost and
Page 24 of 76
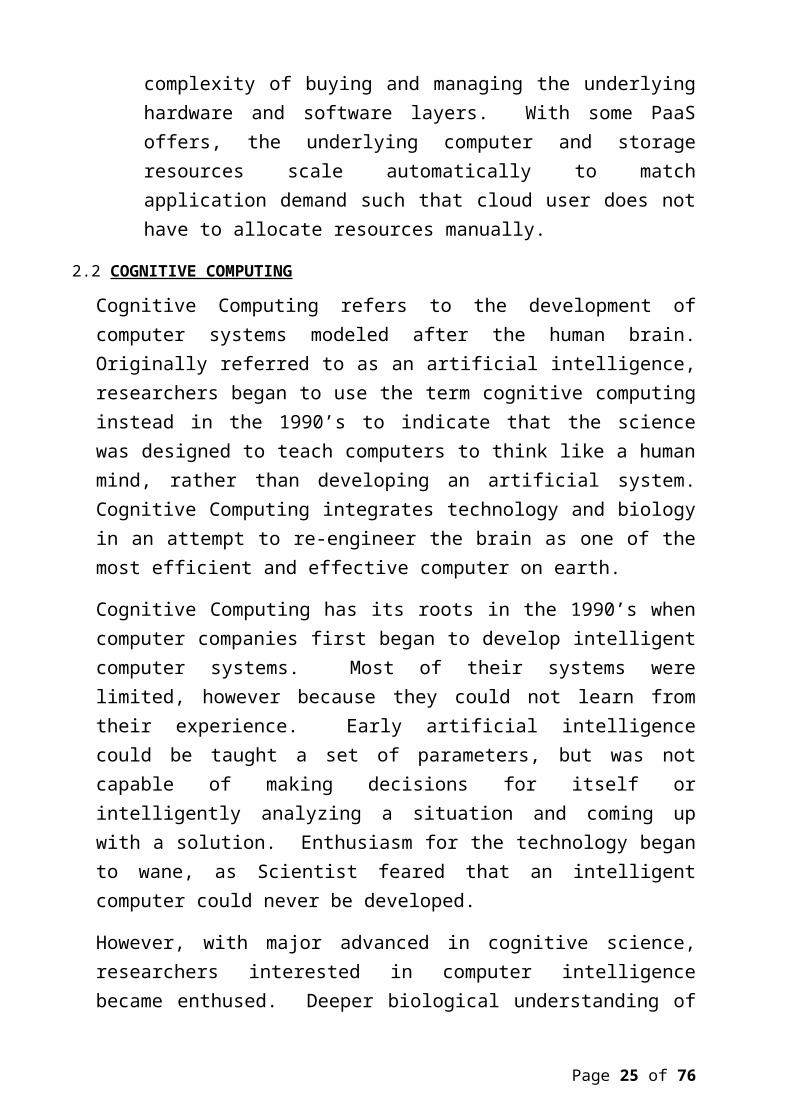
complexity of buying and managing the underlyinghardware and software layers. With some PaaSoffers, the underlying computer and storageresources scale automatically to matchapplication demand such that cloud user does nothave to allocate resources manually.
2.2 COGNITIVE COMPUTING
Cognitive Computing refers to the development ofcomputer systems modeled after the human brain.Originally referred to as an artificial intelligence,researchers began to use the term cognitive computinginstead in the 1990’s to indicate that the sciencewas designed to teach computers to think like a humanmind, rather than developing an artificial system.Cognitive Computing integrates technology and biologyin an attempt to re-engineer the brain as one of themost efficient and effective computer on earth.
Cognitive Computing has its roots in the 1990’s whencomputer companies first began to develop intelligentcomputer systems. Most of their systems werelimited, however because they could not learn fromtheir experience. Early artificial intelligencecould be taught a set of parameters, but was notcapable of making decisions for itself orintelligently analyzing a situation and coming upwith a solution. Enthusiasm for the technology beganto wane, as Scientist feared that an intelligentcomputer could never be developed.
However, with major advanced in cognitive science,researchers interested in computer intelligencebecame enthused. Deeper biological understanding of
Page 25 of 76
how the brain worked allowed scientists to buildcomputer systems modeled after their mind and mostimportantly to build a computer that could integratepast experience into its systems. CognitiveComputing was reborn with researchers at the turn ofthe 21st century developing computers which operatedat the higher rate of speed that the human brain did.
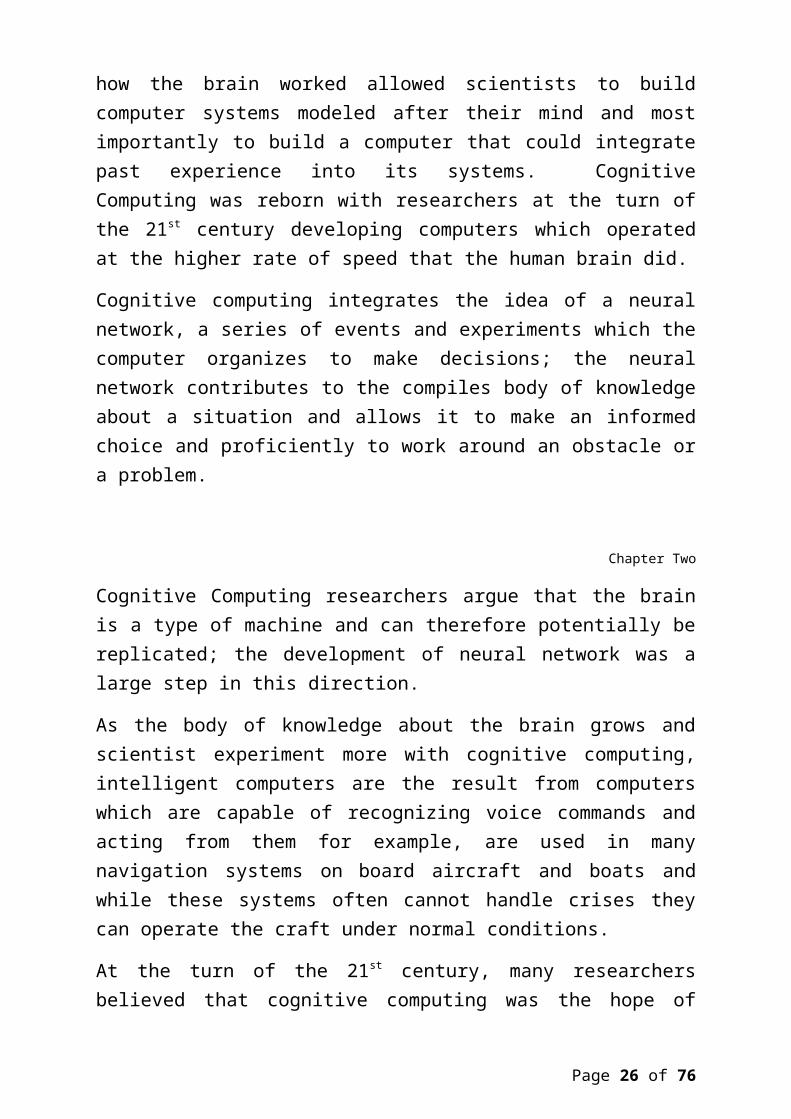
Cognitive computing integrates the idea of a neuralnetwork, a series of events and experiments which thecomputer organizes to make decisions; the neuralnetwork contributes to the compiles body of knowledgeabout a situation and allows it to make an informedchoice and proficiently to work around an obstacle ora problem.
Chapter Two
Cognitive Computing researchers argue that the brainis a type of machine and can therefore potentially bereplicated; the development of neural network was alarge step in this direction.
As the body of knowledge about the brain grows andscientist experiment more with cognitive computing,intelligent computers are the result from computerswhich are capable of recognizing voice commands andacting from them for example, are used in manynavigation systems on board aircraft and boats andwhile these systems often cannot handle crises theycan operate the craft under normal conditions.
At the turn of the 21st century, many researchersbelieved that cognitive computing was the hope of
Page 26 of 76

near future. By replicating the human brain incomputer form, researchers hope to improve conditionsfor the human as well as gaining a deeperunderstanding of the biological reactions that powerthe brain. Computers capable of reason were begin toemerge in the late 1990s with hopes for consciousnessfollowing.
Hear and See with the aid of camera but computersshould be able to interpret images more intuitivelyfrom telling whether a picture is on a beech or in asend box to whether a mole should be examined by adoctor. It’s also whether will let our cars androbots operate safely.
Sound Chatting on line and dictation. But bylistening closely and adding context to sounds in theenvironment a computer may be able to tell youwhether your baby’s crying means distress, hunger orjust a need of attention. And later some patternscould be detected and shared among a network ofcomputers to highly predict disasters and weatherpatterns
Touch:- means more that a touch screen. Your devicecan feel your finger but what do you feel? A glassor plastic screen. Researchers are working oncreating tailored vibration that could let you feeltextures instead, from clothing materials to someoneelse skin.
Smell:- Subtle chemical signals that we take forgranted – smoke (locomotive engine), perfume, wetdog are powerful clues to what is happening in oursurroundings. We all have simple smell sensors,
Page 27 of 76
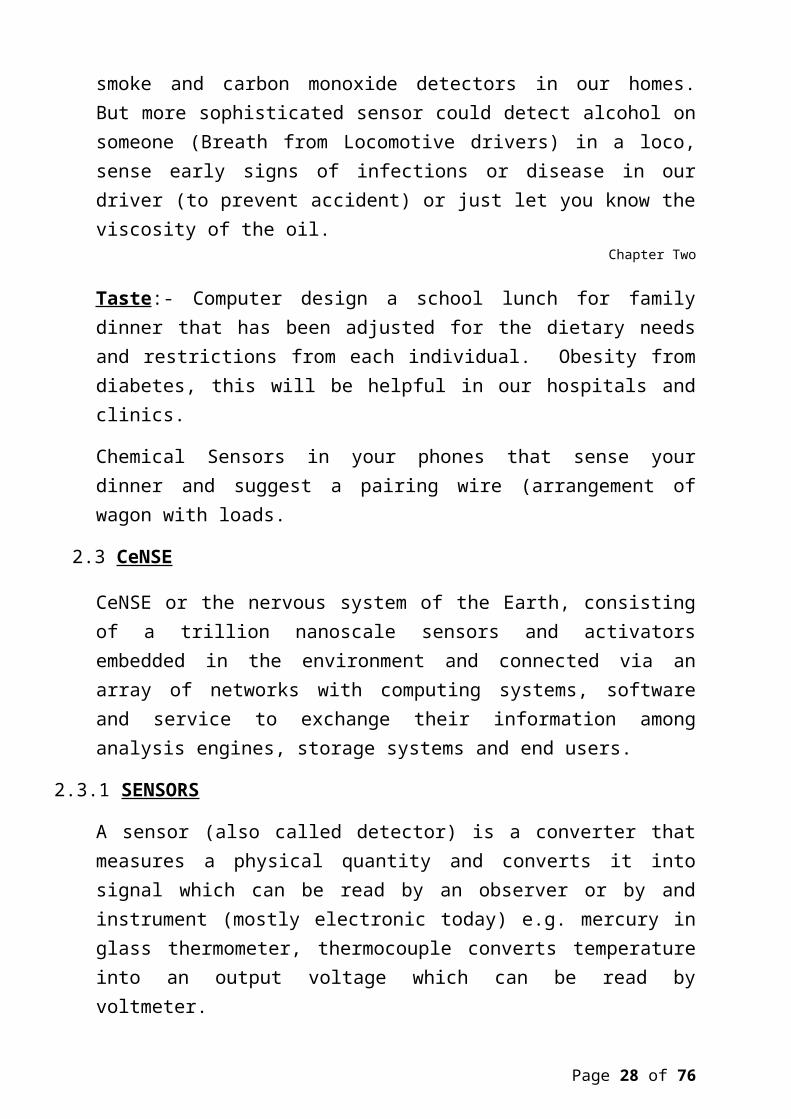
smoke and carbon monoxide detectors in our homes.But more sophisticated sensor could detect alcohol onsomeone (Breath from Locomotive drivers) in a loco,sense early signs of infections or disease in ourdriver (to prevent accident) or just let you know theviscosity of the oil.
Chapter Two
Taste:- Computer design a school lunch for familydinner that has been adjusted for the dietary needsand restrictions from each individual. Obesity fromdiabetes, this will be helpful in our hospitals andclinics.
Chemical Sensors in your phones that sense yourdinner and suggest a pairing wire (arrangement ofwagon with loads.
2.3 CeNSE
CeNSE or the nervous system of the Earth, consistingof a trillion nanoscale sensors and activatorsembedded in the environment and connected via anarray of networks with computing systems, softwareand service to exchange their information amonganalysis engines, storage systems and end users.
2.3.1 SENSORS
A sensor (also called detector) is a converter thatmeasures a physical quantity and converts it intosignal which can be read by an observer or by andinstrument (mostly electronic today) e.g. mercury inglass thermometer, thermocouple converts temperatureinto an output voltage which can be read byvoltmeter.
Page 28 of 76
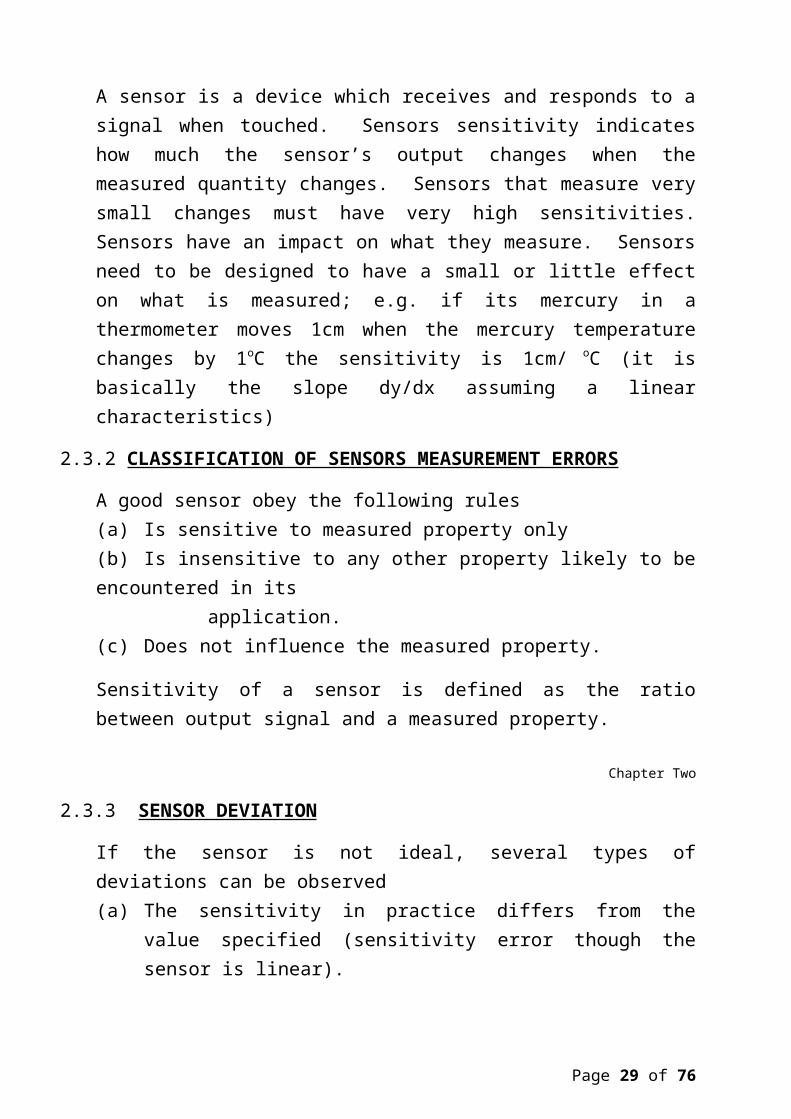
A sensor is a device which receives and responds to asignal when touched. Sensors sensitivity indicateshow much the sensor’s output changes when themeasured quantity changes. Sensors that measure verysmall changes must have very high sensitivities.Sensors have an impact on what they measure. Sensorsneed to be designed to have a small or little effecton what is measured; e.g. if its mercury in athermometer moves 1cm when the mercury temperaturechanges by 1oC the sensitivity is 1cm/ oC (it isbasically the slope dy/dx assuming a linearcharacteristics)
2.3.2 CLASSIFICATION OF SENSORS MEASUREMENT ERRORS
A good sensor obey the following rules(a) Is sensitive to measured property only(b) Is insensitive to any other property likely to beencountered in its application.(c) Does not influence the measured property.
Sensitivity of a sensor is defined as the ratiobetween output signal and a measured property.
Chapter Two
2.3.3 SENSOR DEVIATION
If the sensor is not ideal, several types ofdeviations can be observed(a) The sensitivity in practice differs from the
value specified (sensitivity error though thesensor is linear).
Page 29 of 76
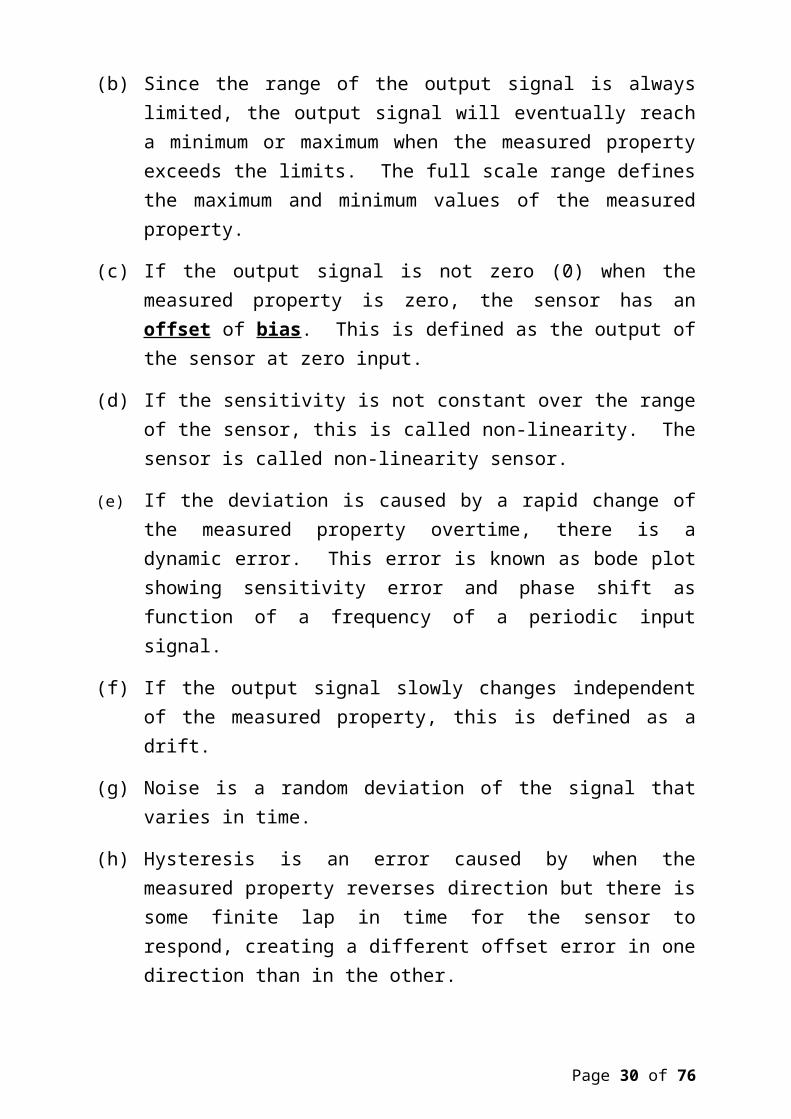
(b) Since the range of the output signal is alwayslimited, the output signal will eventually reacha minimum or maximum when the measured propertyexceeds the limits. The full scale range definesthe maximum and minimum values of the measuredproperty.
(c) If the output signal is not zero (0) when themeasured property is zero, the sensor has anoffset of bias. This is defined as the output ofthe sensor at zero input.
(d) If the sensitivity is not constant over the rangeof the sensor, this is called non-linearity. Thesensor is called non-linearity sensor.
(e) If the deviation is caused by a rapid change ofthe measured property overtime, there is adynamic error. This error is known as bode plotshowing sensitivity error and phase shift asfunction of a frequency of a periodic inputsignal.
(f) If the output signal slowly changes independentof the measured property, this is defined as adrift.
(g) Noise is a random deviation of the signal thatvaries in time.
(h) Hysteresis is an error caused by when themeasured property reverses direction but there issome finite lap in time for the sensor torespond, creating a different offset error in onedirection than in the other.
Page 30 of 76
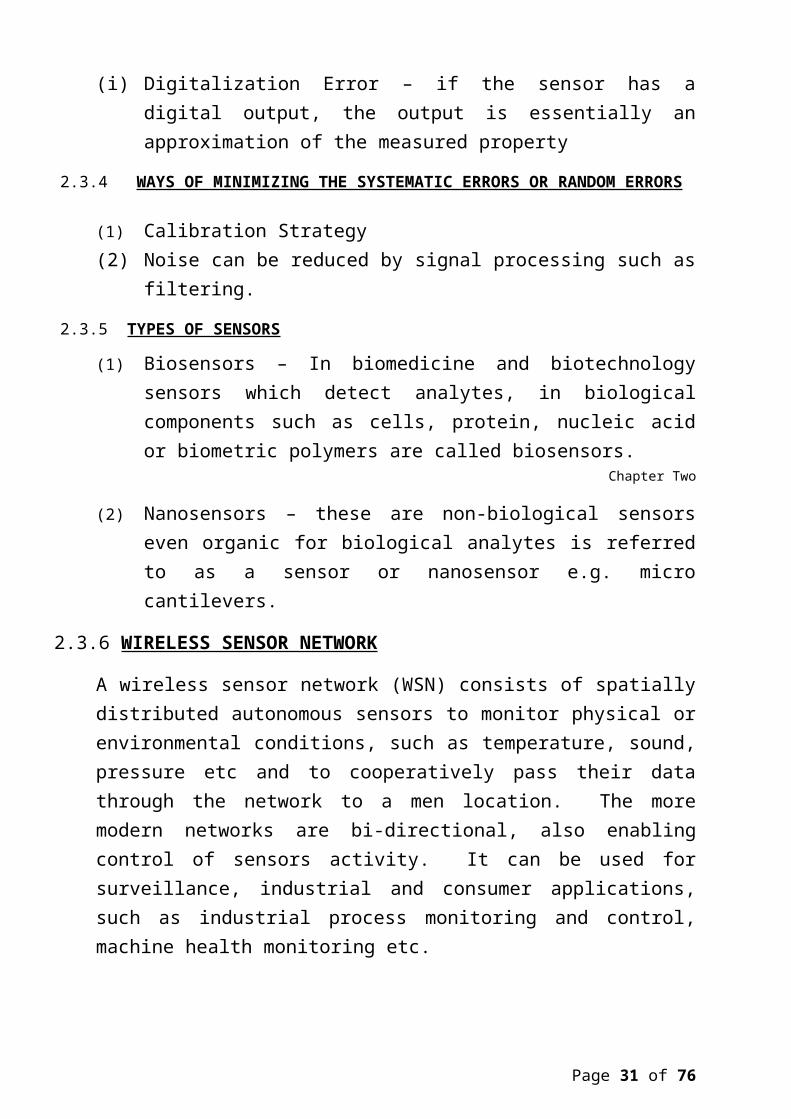
(i) Digitalization Error – if the sensor has adigital output, the output is essentially anapproximation of the measured property
2.3.4 WAYS OF MINIMIZING THE SYSTEMATIC ERRORS OR RANDOM ERRORS
(1) Calibration Strategy(2) Noise can be reduced by signal processing such as
filtering.
2.3.5 TYPES OF SENSORS
(1) Biosensors – In biomedicine and biotechnologysensors which detect analytes, in biologicalcomponents such as cells, protein, nucleic acidor biometric polymers are called biosensors.
Chapter Two
(2) Nanosensors – these are non-biological sensorseven organic for biological analytes is referredto as a sensor or nanosensor e.g. microcantilevers.
2.3.6 WIRELESS SENSOR NETWORK
A wireless sensor network (WSN) consists of spatiallydistributed autonomous sensors to monitor physical orenvironmental conditions, such as temperature, sound,pressure etc and to cooperatively pass their datathrough the network to a men location. The moremodern networks are bi-directional, also enablingcontrol of sensors activity. It can be used forsurveillance, industrial and consumer applications,such as industrial process monitoring and control,machine health monitoring etc.
Page 31 of 76

The Wireless Sensor Network is build of nodes whichcan be few hundreds, thousands where each node isconnected to one or sometimes several sensors. Eachsensor network has typically several parts.
(1) Radio transceiver with an internal antenna orexternal antenna.(2) Microcontroller, an electronic circuit forinterfacing with sensors.(3) Energy source, usually a battery or an embeddedform of energy harvesting. (4) Typology of the Wireless Sensor Network vary from
a simple star network to an advanced multi-hopwireless mesh network.
(5) The propagation technique between the hops of thenetwork can be routing or flooding.
2.3.7 APPLICATION
(1) Area monitoring – In area monitoring, theWireless Sensor Network is deployed over a regionwhere some phenomenon is to be monitored e.g.geo-fencing of gas or oil pipeline.
(2) Environmental/Earth monitoring(i) Sensing Volcanoes (Wash out) etc(ii)Oceans, glaciers, forests etc
(3) Air quality monitoring (Loco), Printing press. The degree of pollution in the air has to bemeasured frequently in order to safeguard peopleand the environment from any kind of damages dueto pollution e.g Gas
(4) Interior Exterior Monitoring
Page 32 of 76
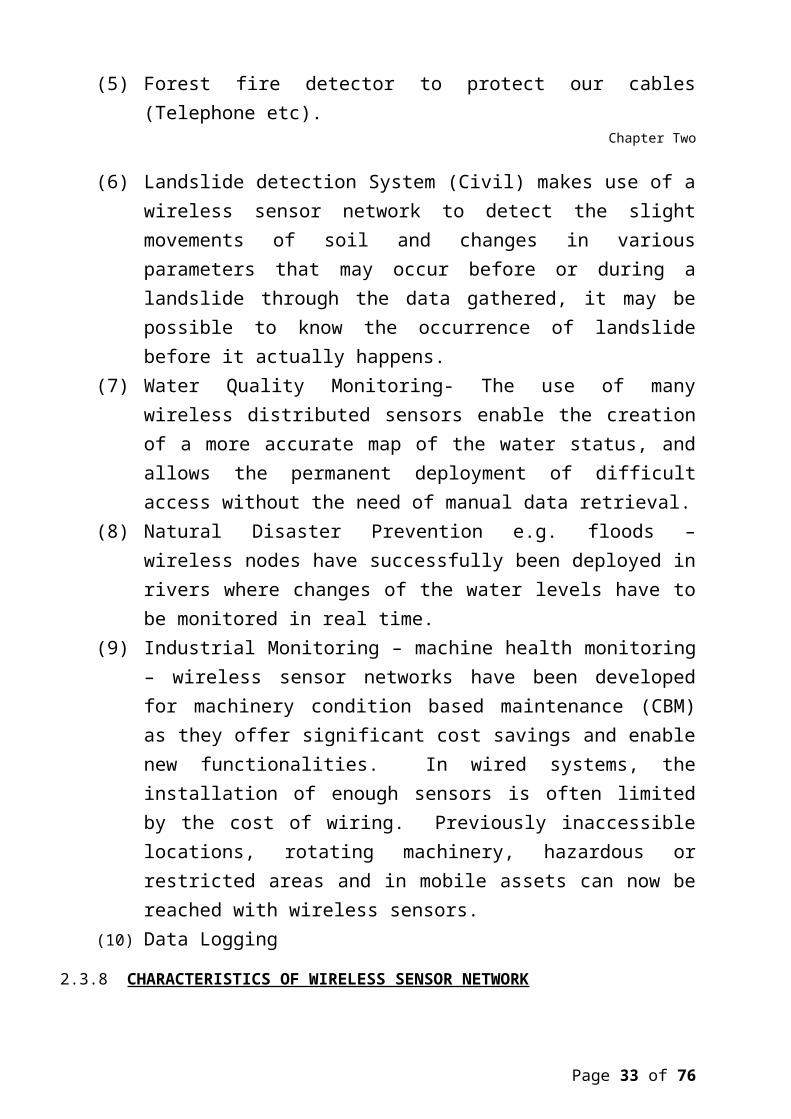
(5) Forest fire detector to protect our cables(Telephone etc).
Chapter Two
(6) Landslide detection System (Civil) makes use of awireless sensor network to detect the slightmovements of soil and changes in variousparameters that may occur before or during alandslide through the data gathered, it may bepossible to know the occurrence of landslidebefore it actually happens.
(7) Water Quality Monitoring- The use of manywireless distributed sensors enable the creationof a more accurate map of the water status, andallows the permanent deployment of difficultaccess without the need of manual data retrieval.
(8) Natural Disaster Prevention e.g. floods –wireless nodes have successfully been deployed inrivers where changes of the water levels have tobe monitored in real time.
(9) Industrial Monitoring – machine health monitoring– wireless sensor networks have been developedfor machinery condition based maintenance (CBM)as they offer significant cost savings and enablenew functionalities. In wired systems, theinstallation of enough sensors is often limitedby the cost of wiring. Previously inaccessiblelocations, rotating machinery, hazardous orrestricted areas and in mobile assets can now bereached with wireless sensors.
(10) Data Logging
2.3.8 CHARACTERISTICS OF WIRELESS SENSOR NETWORK
Page 33 of 76
(1) Power consumption constraints for nodes usingbatteries or energy harvesting
(2) Ability to cope with node failures(3) Mobility of nodes(4) Communication failures(5) Heterogeneity of nodes(6) Scalability to large scale of deployment(7) Stability to withstand harsh environmental
conditions.(8) Ease of use.
2.4 DATA ACQUISITION
Data acquisition is the process of sampling signalsthat measures world physical conditions andconverting the resulting samples into digital numericvalues that can be manipulated by a computer.
Chapter Two
It converts the analog waveforms into digital valuesfor processing components of DAQ or DAS are:(1) Sensors(2) Signal conditioning circuitry to convert sensors
signals into a form that can be converted todigital values.
(3) Analog to digital converters, which convertconditioned sensor signals to digital values.
(4) Software programs using java, LISP, Pascal etc.(5) DAQ Hardware – interfaces between the signal and
a PC. It could be inform of a modular that canbe connected to the computer’s port (parallel,
Page 34 of 76
serial, USB etc or cards connected to slots(MCS).
INPUT DEVICES
- Analog to digital converter- Time to digital converter
HARDWARES
CAMAC – Computer Automated Measurement and Control- Industrial Control- Industrial USB- LAN extensions for Instrumentations- NIM- Power Lab- PC1 extensions for Instrumentation
Graphical programming environments include ladder,logic, visual CH, Visual Basic and Lab view.
2.5 HUMAN FACTOR
2.5.1 GENERAL PROBLEM IN COMMUNICATION
While there are many forms of communication that takeplace within a railway system the work reviewed hereis limited to communication between drivers,signalers and trackside workers. Potential problemsand misunderstandings in communication can arise whentwo people who are separated by location(driver/signaler) are trying to talk to each other.The problem generally revolves around amisunderstanding of the intend meaning of thecommunication.
Chapter Two
Page 35 of 76
Gibson [1] reviewed the literature on communicationin general although incorrectly assumed there was noprevious work directly relevant to the rail industry(see report by Arthur D. Little Ltd. [2]. However,there is a general need to investigate a wide varietyof communication processes within the rail industry.Gibson identified three sources of communicationfailure, associated with the sender, language used,and hardware. Only the first two of these lie clearlywithin the Human Factor domain, and are relevantwithin a number of situations where railway personnelhave to communicate with each other over the radio ortelephone. These include driver-signalercommunication and signaler – PICOP (person in Chargeof Possession) or more recently signaler-COSS(Controller of Site Safety).
2.5.2 DRIVER-SIGNALLER COMMUNICATION
Arthur D. Little Ltd. [2] was commissioned toinvestigate communication risk between drivers andsignalers. Unlike the drivers and signalers onlycommunicate with each other when the driver has beenbrought to a halt at a signal failed at danger, or inan emergency. Three generic errors were identified inthe scenario where a train has been stopped at asignal at danger, all encompassed by Gibson’sframework: the driver mistakenly believes they havebeen authorized to pass a signal at danger; thesignaler correctly authorizes the wrong train; thesignaler incorrectly authorizes the correct train.
The impact of the first and the third of these errorsis potentially catastrophic. While the report by
Page 36 of 76
Arthur D. Little concluded that the currentprocedures were sufficient to ensure safe operationat minimal risk, the potential for error (and hencepotential catastrophe) still exists. It is necessaryto gain a better understanding of the mechanism ofcommunication between drivers and signalers, wherepotential for error lies and the possible causes ofdeviation from correct procedure (e.g., fatigue,distraction). New technology (e.g., in-cab displays)will inevitably impinge upon the driver-signalersdynamic and attempt to assess how best to integratethis technology into the rail network from a HumanFactor perspective.
2.5.3 SIGNALLER – PICOPs/COSS
PICOPs, or more recently COSS, take possession of ablock of track when maintenance work required. Thisrequires coordination between the signaler and COSSin order to ensure the safety of the tracksideworkers. Halliday explained the procedures to ensuresafety, this information needs to be structured and
Chapter Two
involve the use of correct radio discipline (such asusing the phonetic alphabetic) in order to minimizepotential errors in communication such as thoseformulated by Gibson [1]. One of the aims of theproposed work is to gain a deeper understanding ofhow different functions within the rail systeminteract and how these interactions are influenced bythe organizational context within which they takeplace. Improvement in communication between Signallerand COSS (and hence the safety of trackside workers)
Page 37 of 76
may require alternative interventions that go beyondsimply adhering to radio discipline.
As mentioned above, Roth et al. [3] highlighted theadvantages of shared or “open” radio communicationchannels where all rail personnel can listen in andselectively attend to relevant information. In railnetwork, VHF radio use “open channels” to allowmonitoring of background information keepingpersonnel up to dare with what is happening acrossthe system. Hence they can quickly and appropriatelyattend to any emergencies.
2.5.4 IMPACT OF FATIGUE ON DRIVER PERFORMANCE AND SAFETY
2.5.4.1 DETECTING FATIGUE STATES IN DRIVERS
Research on fatigue, within the railways aselsewhere, fails to distinguish the generalbehavioural outcome (tiredness) and the possiblecauses of the state. In particular, fatigue is oftenascribed to sleepiness brought about by sleepdeprivation or poor management of shift cycles, andthe problem for performance typically identified withthe increased risk of eye closure or actual sleep. Itis important to recognize that mental fatigue canresult entirely from overwork, in the form sustainedcognitive operations, even with normal sleep andwell-adjusted shift cycles. Hockey & Meijman [4] haveidentified at least three different forms of fatigue-mental, sleep-based and physical, which have quitedifferent origins requiring different managementsolutions and countermeasures. In this paper, some ofthe issues relating to sleep loss and shift working,
Page 38 of 76
both of which can cause dramatic losses of attention,but largely ignored the problem of fatigue fromsustained demanding cognitive work. These othereffects are more subtle, and their effects thereforemore insidious. They affect information processingstrategies by reducing the operator’s commitment tohigh effort attention states. Within rail systemsresearch, the notion of the train driver as aninformation processor (rather than someone engagingin heavy physical work) was introduced over 30yearsago [5]. Grant’s
Chapter Two
suggestions for research on mental fatigue includesimultaneous capture of behavioural observations andphysiological measures.
This is the approach taken in major recent programmesaimed at identifying markers of strain as a basis forpredicting performance breakdown in aviation, andrecognizes that risk is related to a progressiveeffect of the onset of fatigue. However, over theintervening period since Grant’s report, little or nowork has been conducted using this methodology.Instead the main emphasis has been on inferringcasual patterns from accident data and shift workpatterns. This is still a viable approach, but ananalysis of fatigue requires much better predictorsthan can be gained from overt performance measurealone. The use of failsafe devices (such as ATP ofRPWS for SPADs) is an extreme technical response tofailure of the driver’s concentration, bringing thesystem to a halt and necessitating considerable
Page 39 of 76
disruption, as well as reducing confidence in thedriver.
2.5.4.2 IMPACT OF SHIFT WORK ON FATIGUE
Shift work is identified as a major contributoryfactor to fatigue as the internal body clock fails toadjust to shift work and leads to an accumulation ofsleep loss due to working shifts. A number of themajor findings from examining shift work patterns andtheir subsequent impact on fatigue are reported byFolkard & Sutton [6].
During nightshifts one of the major findings is ofreduced alertness and performance due to the internalbody clock gearing up for sleep rather than work. Inorder to recover from the effects of shifts work themain consensus of opinion is that the recovery periodshould allow sufficient time to recover fromaccumulation of fatigue. However, while the review byFolkard and Sutton is extensive it is in contrastwith the findings of Wharf [7] who found that whilethe consensus is that there is a decrement inperformance during the night shift.
In conclusion, information within such a rail systemwill be distributed widely across signalers,controllers, drivers and trackside workers as well aspotential in-cab information systems and trainoperating companies (TOCs). Information regarding thestate of the network will flow between all theseagents in the systems and will be represented notonly externally (in the form of signals, informationdisplays etc) but also internally (in terms of the
Page 40 of 76
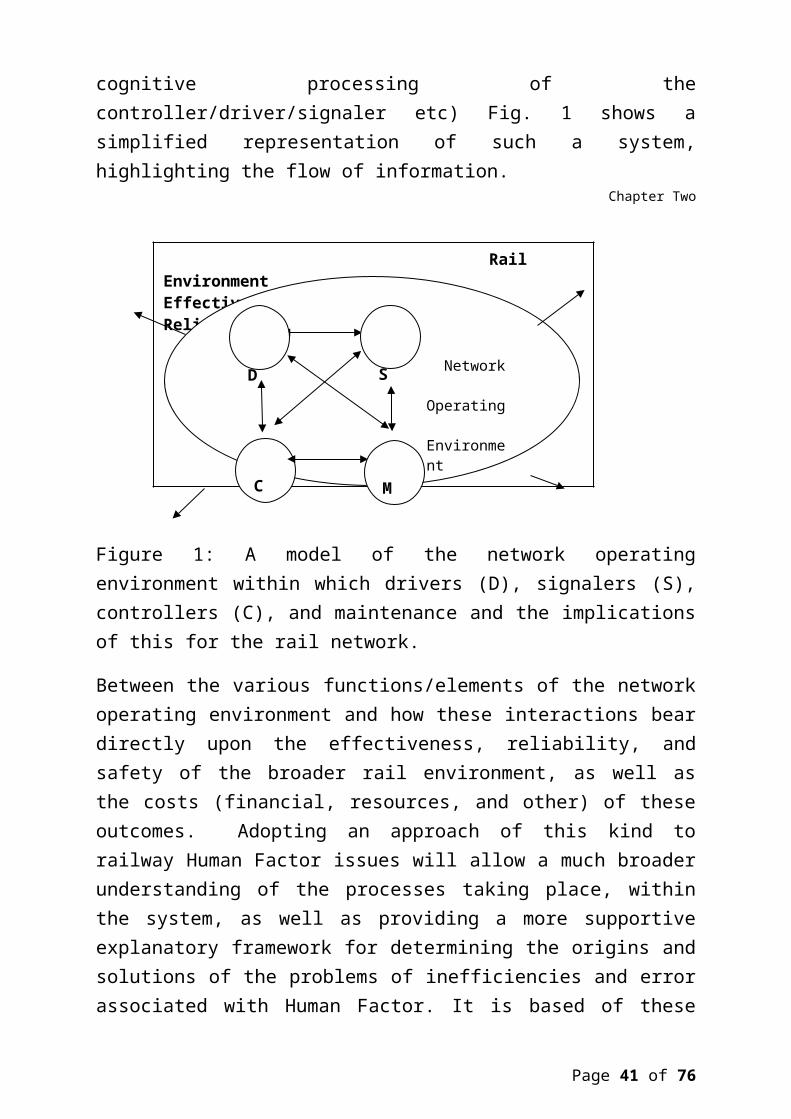
cognitive processing of thecontroller/driver/signaler etc) Fig. 1 shows asimplified representation of such a system,highlighting the flow of information.
Chapter Two
Figure 1: A model of the network operatingenvironment within which drivers (D), signalers (S),controllers (C), and maintenance and the implicationsof this for the rail network.
Between the various functions/elements of the networkoperating environment and how these interactions beardirectly upon the effectiveness, reliability, andsafety of the broader rail environment, as well asthe costs (financial, resources, and other) of theseoutcomes. Adopting an approach of this kind torailway Human Factor issues will allow a much broaderunderstanding of the processes taking place, withinthe system, as well as providing a more supportiveexplanatory framework for determining the origins andsolutions of the problems of inefficiencies and errorassociated with Human Factor. It is based of these
Page 41 of 76
Rail EnvironmentEffectiveness Reliability
Network Operating Environment
C
D
M
S

inefficiencies error the intelligence infrastructureis vital to minimize or reduce human factor.
2.6 PHOTONICS
The science of photonics includes the generation,emission, transmission, modulation, signalprocessing, switching, application, as detectionsensing of light. Photonic have both wave andparticle nature.Optical and photonic computing is intertwined to usephotonics or light particles produced by lasers ordiodes in place of electrons. Compared to electrons,photonics have a higher bandwidth. Most researchprojects focus on replacing current computercomponents with optical equivalents resulting in anoptical digital computer system process binary data.The fundamental before building block of modernelectronic computer is the transistor. To replace theelectronics components with “optical transistor” isrequired. This is achieved using materials with anon-linear refractive index. In particle, materialsexist where
Chapter Two
the intensity of incoming light, the intensity oflight transmitted through one material in a singlemanner to the voltage response of an electronictransistor. Such an “optical transistor can be usedto create optical logic gates which in turn areassembled into the higher level components of thecomputer Central Processing Unit (CPU)
Page 42 of 76

Photonic logic is the use of photons (light) on logicgates (NOT, AND, OR, NAND, NOR XOR, YNOR). Switchingis obtained using non linear optical effects when twoor more signal is combined.
2.7 NON VOLATILE MEMORY
F-RAM products combine the non –volatile data storagecapability or ROM with the benefits of RAM, whichinclude a high number of read and write cycles, highspeed read and write cycles, and low powerconsumption. FRAM, product line features variousinterfaces and densities which include industrystandard serial and parallel interface, industrystandard package types, as 4kilobites, 16kilobites,64kilobites, 25kilobites, 1megabite, 2megabites and4megabit densities.
F-RAM performs read and write operation of the samespeed, there are no delays as before in non-volatile.Floating gate memories have long write delay of 5seconds. FRAM writes in nano seconds essential inapplication like auto safety system.FRAM offers virtually unlimited write endurance,which means it does not wear out like othernonvolatile memory devices floating gate devicesexperience a hard failure and stop writing in aslittle as IE5 cycles, making them unsuitable forhigh-endurance applications.FRAM operates without a change pump, enabling lowpower consumption of floating gate devices, demandhigh voltage during write operations. FRAM writes atthe native voltage of the manufacturing process; 5Vor even less or more advanced process.
Page 43 of 76
2.8 SCALABILITY STORAGE
Scalability storage is the ability of a system,network or process to handle a growing amount of workin a capable manners or its ability to be enlarged toaccommodate that growth. A system whose performanceimproves after adding hardware, proportionality tothe capacity added, is said to a scalable system.
Chapter Three
3.0 DATA ANALYSIS
Data analysis is a process of inspecting, cleaning,transforming and modeling data with the goal ofhighlighting useful information, suggestingconclusions and supporting decisions making.Data analysis can also be defined as the process offinding the right data to answer questions,understanding the processes underlying the data,discovering the important patterns in the data andthen communicating the results to have the biggestpossible impact.In this paper l will focus on how the differentcadres of employees in an organizations that isjunior staff, middle level managers, senior managers,chief executive officers/managing directors, boardmembers and chairman of companies/organizations canmake use of data in taking decisions, consequentlythe section of this paper will focus on ManagementInformation System.
3.1 WHAT IS MANAGEMENT INFORMATION SYSTEM?
Page 44 of 76
A Management Information System (MIS) is a computerbased system that provides the information necessaryto manage an organization effectively. ManagementInformation System (MIS) is designed to enhancecommunication among employees, provide an objectivesystem for recording information and support theorganization’s strategic goals and direction.The system entails three primary resources.Information, Technology and people.
3.2 OBJECTIVE OF MANAGEMENT INFORMATION SYSTEM
The objective of a Management Information System(MIS) system is to provide useful information, dataand analysis remains consistent but the features anduses are customizable to suit the preferences andneeds of every business, individual or government forexample, a government, without a profits focus, caninstall a Management Information System (MIS) systemthat personally tracks “customer” (auto licenses) asrelates to their budgets.
Chapter Three
3.3 FUNCTION
Page 45 of 76
The function of Management Information System (MIS)is to identify, manage, and manipulate data (orgroups of data) in a fashion that enables gooddecision making.In the first half of the 20th century, businessmanages information on paper, with detailed filingsystems and calculated reports. CotemporaryManagement Information System (MIS) involve one ormore computers, working in concrete, to achieve thestated goals of an organization. The function isalways the same, but the desired results fluctuatewith the specific goals and needs of individualorganizations. Since the universal language ofcommerce is numbers, using the incredible speed ofcomputers, Management Information System (MIS)achieve their function amazingly well.
3.4 TYPES
There are many types (and sub types) of managementinformation systems as there are business functions.Some of the most popular types of ManagementInformation System (MIS) are as follows:
Customer relationship management Marketing, particularly target marketing efforts,
directed of specific groups of potentialcustomers or selling niche products financialmanagements.
Financial management Strategic plan development Inventory management systems Optimal investing strategy creation
Page 46 of 76
Projected sales volume Projected operating expenses and cost control.
Other types of Management Information System (MIS)calculate project tax revenue for governments’statistical evaluations of all types for business,researchers and universities scientific purposes inall discipline; and cost/benefit relationship fordecision-making purpose.
Chapter Three
3.5 BENEFITS
The benefits of Management Information System (MIS)to businesses governments, scientists, universities,students, non-profits and all other entities arediversified. Some examples of the most often realizedbenefits include the following:
Implementation of Management by objectives (MB) techniques: Management Information System (MIS)allows all participants both management andstaff, to view, analyze, and interpret usefuldata to set goals and objectives.
Generates competitive advantage : Businesssucceeds or fail based on how they handledcompetitive challenges. Management InformationSystem (MIS) if implemented properly provided awealth of information to allow management toconstruct effective plans to meet, and beat,their competitors.
Fast reaction to market changes: The victoryoften goes to the quick, not necessarily the
Page 47 of 76
best; Management Information System (MIS) candeliver facts, dash friends to businesses withlighting speed. Having this information allowscompanies to react quickly to market changes,regardless of the type (positive or negative ofvolatility.
3.6 CLASSIFICATTION OF MANAGEMENT INFORMATION SYSTEM(MIS)
3.6.1 TRANSACTION PROCESSING SYSTEMS
Transaction processing systems are designated tohandle a large volume of routine, recurringtransactions. Banks use them to record deposits andpayments into accounts. Supermarkets use them torecord sales and track inventory. Managers often usethese systems to code with such tasks as payroll,customer to suppliers.
3.6.2 OPERATIONS INFORMATION SYSTEM Operations information systems were introduced aftertransaction processing system. An operationinformation system gathers comprehensive data,organizes it and summarizes in a form that is usefulfor managers. These types of systems access data fromtransaction processing system and organize it into ausable form. Managers use operations informationsystem to obtain sales, inventory, accounting andother performance related information.
Chapter Three
3.6.3 DECISION SUPPORT SYSTEM (DSS)
Page 48 of 76
A decision support system (DSS) is an interactivecomputer system. They can be used by managers withouthelp from computer specialists. A DSS providesmanagers with the necessary information to makeinformed decisions. A DSS has three fundamentalcomponents:Database management system (DBMS), which stores largeamounts of data relevant to problems the DSS has beendesigned to tackle, model based management system(NBMS), which transforms data from the DBMS intoinformation that is useful in decision making anddialog generation as management system (DGMS), whichprovides a user friendly interface between system asthe managers who do not have extensive computertraining.
3.6.4 EXPERT SYSTEMS AND ARTIFICIAL INTELLIGENCE
Expert systems and artificial Intelligence use humanknowledge captures in a computer to solve problemsthat ordinarily need human expertise mimicking humexpertise and intelligence requires the computer todo the following: recognize, and learn fromexperience. These systems explain the logic of theiradire to the user; hence, in addition to solvingproblems they also can serve as a teacher. They useflexible thinking processes and can accommodate newknowledge.
Page 49 of 76
Chapter Four
4.0 INTEL L I G ENT I NFRA ST R UC T U R E S Y STE M S IN RAIL INDUSTRYRailway development projects were put in place torespond to the shortage in infrastructural resources,in order to meet growing demand for capacity (Dft,2010). Crainic et al., (2009) have pointed outthat building new infrastructure to fulfill thesedemands is no longer an option. A more optimalapproach to infrastructure maintenance is thereforenecessary and that is to move from breakdownmaintenance (fixing after failure) and time-basedpreventive maintenance (fixing following aperiodical inspection) to predictive maintenance(fixing before failure).
Reliable sensors, sophisticated algorithms andadvanced surveillance systems have enabled livemonitoring of the infrastructure in complex workenvironments. This architecture has different namesin various industries, such as Condition MonitoringSystems in power plants (Hameed et al., 2009):
Page 50 of 76
Condition Based Maintenance in mechanical systems(Jardine et al.,2006), Structural HealthMonitoring in aviation (Buderath & Neumair,2007)Pervasive Healthcare in medical systems (Drew &Westenskow,2006).
Integrated information systems to support maintenanceand monitoring have long been used in differentindustries and domains. Some examples include:manufacturing (Lau, 2002; Jardine et al., 2006),undersea and petro-chemical (Strasunskas, 2006),space exploration (Park et al.,2006), civilinfrastructure (Aktan et al., 1998; Aktan et al.,2000), water and sewage (Adriaens, et al., 2003),defence (Jones et al., 1998) and transportation(King, 2006; Lyons and Urry , 2006; Ollier, 2006;Khan, 2007; Blythe and Bryan, 2008).
Intelligent infrastructure is mainly considered as ameans of centralizing and integrating the supportthat is currently provided to infrastructuremaintenance by monitoring the condition of assetsremotely. Potential failure or unnecessary fixed-termreplacements will then be prevented by providingrelevant information to the maintenance function.Another main use of intelligent infrastructure in therailway is to facilitate optimal asset maintenance.Currently, maintaining assets is performed throughfixed schedules. This is time consuming, costly andrisky approach can be replaced by analyzing real-timeasset information and attending to track-sideequipment only when necessary. Therefore, intelligentinfrastructure in rail was introduced to move the
Page 51 of 76
railway, and especially its maintenance andengineering activities, from a
Chapter Four
‘find and fix’ mentality to ‘predict and prevent’,and potentially to ‘design and prevent’ (Bint, 2008).
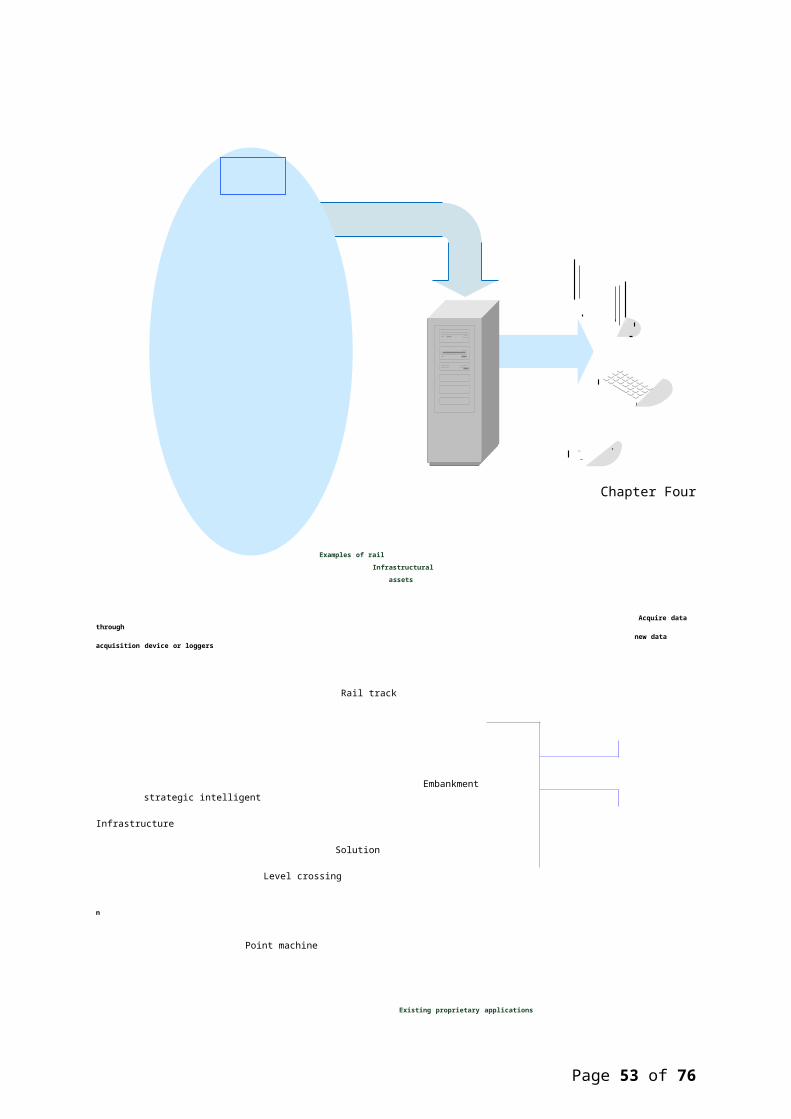
Figure 4.1 below shows a visualization of intelligentinfrastructure on the rail network. This is asimplified version of the model that NR applied toguide the implementation of a pilot intelligentinfrastructure system (Network Rail, 2009). The ovalon the left hand side of the figure shows some of theinfrastructural assets (e.g. embankment, point,signal, level crossing, and track) that canpotentially benefit from a more optimal maintenanceregime. Loggers or other data acquisition devicescollect information regarding these assets (i.e.remote condition measuring). Data presented incurrent systems, such as RCM systems, are presentedin an integrated database. A strategic infrastructuresolution is then required to extract the optimuminformation and present it to the appropriateoperator
Page 52 of 76
Chapter Four
Examples of rail Infrastructural assets
Acquire data through new data acquisition device or loggers
Rail track
Embankment strategic intelligent
Infrastructure
Solution
Level crossing n
Point machine
Existing proprietary applications
Page 53 of 76

Signal
FIGURE 4. 1: SIMPLIFIED HIGH LEVEL MODELLING OF INTELLIGENT
INFRASTRUCTURE IN NETWORK RAIL
Page 54 of 76
Chapter Four
Capturing data and attributes from domaincomponents; attributes can refer to theenvironment in which the component islocated, its age, type, etc.
Jardine et al., (2006) pointed out that, in the firststage (data acquisition), two types of data should beconsidered: event data and condition monitoring data. Theevent data looks into what happened (e.g. breakdown,overhaul) and the condition monitoring data measures thehealth status of the infrastructure. However, theysuggest that, despite the importance of collecting eventdata, it is often neglected by developers who wronglyassume that the recording of only condition monitoringdata will suffice.
Patterns of component behaviour areproduced. This can be achieved throughstudying historical data or experimentalfindings.
This stage includes data cleaning, to ensure that thedata is relevant and error free, along with dataanalysis. The data analysis is usually conducted throughalgorithms and mainly includes signal processing, imageanalysis, time-domain analysis and frequency domainanalysis (Jardine et al., 2006).
Generate system diagnostics and prognostics,followed by the analysis of recognizedpatterns.
Page 55 of 76
In this stage, sophisticated algorithms are used toassist operators in diagnosing faults and suggestrectifying procedures. Although much has been done indeveloping and analyzing diagnostics information (Hameedet al., 2009), it is more difficult to develop rectifyingprocedures and present operators with a number ofoptions. This can be related to the difficulty inunderstanding the behaviour of assets and, inparticular, lack of appropriate understanding of thesituational information associated with the failure.
Transfer diagnostics and prognostics to relevantoperatorIn order to ensure effective implementation of anintelligent infrastructure system, data obtained from theinfrastructure must be transformed into usefulinformation, as well as being exploited in the optimalway (Crainic, 2009). Failure to define the correctpurpose for the data may result in the system presentingtoo little information or overloading the operator withinappropriate information. Hence, it
Chapter Four
is important to realize what level of detail is required.For instance, does the operator require a simple binary(working / failed) assessment of the status of an asset,or a sufficiently detailed measurement? Moreover, theoperator should know the effect of the measured conditionon the overall run of the service in order to predictpotential failures and behaviours of the asset in thefuture.
Page 56 of 76
Update the pattern log with new conditions.This is the stage where information and knowledgecaptured in earlier stages are now fed back to the system(e.g. using artificial intelligence, artificial neuralnetworks, or simply operator’s feedback). However,eliciting knowledge from real-world maintenance practiceis not very straightforward and it is not easy todocument it digitally for future use (Jardine et al.,2006). One solution to facilitate and support thisfeature is to develop a robust understanding of problemsolving and fault finding practice as well as operators’knowledge and information requirements.
Aktan et al., (1998) conducted exploratory research toinvestigate the issues associated with remote sensing ofthe asset conditions during live operations whiledeveloping highway bridges. They confirm that, in doingso, a wide knowledge of advanced sensors, communicationand information technology, state parameters,environment, deterioration mechanism and performancemeasures is required. Such intelligent infrastructuresystems should be able to:
Sense the definitive features on the piece ofinfrastructure
Assess the condition by analyzing theinformation captured and performancecriteria
Communicate the findings through appropriateinterfaces
Learn from infrastructure condition patterns Decide the optimum course of action
Page 57 of 76
From this, they suggested three main factors to beconsidered in order to develop an effective intelligentinfrastructure system:
1. The knowledge required for diagnosing problems
2. The technology necessary for transmitting theknowledge
3. The people who will work with the technology.
Chapter Four
From the three factors identified by Adriaens, et al., (2003), technology is the least problematic one especially with the advent of highly sophisticated algorithms, artificial intelligence application and neural network algorithms, etc (Adeli & Jiang, 2009). The other two factors (i.e. knowledge and people) are the most problematic.
Therefore, one of the most important challenges facingthe success of an intelligent infrastructure system isthe management of information within the system.As mentioned in the previous sections, railway controlsystems have enabled the control of large areas withcomplex intertwined components and have revolutionisedthe look and functionality of control systems. It seemsthat intelligent infrastructure aims to improve thisfunctionality by managing and integrating the existingtechnologies, thereby assisting operators to make moreinformed decisions. However, the review of the potentialdomains of intelligent infrastructure suggests a numberof challenges that will be potentially even more
Page 58 of 76
problematic with the introduction of intelligentinfrastructure systems. These include:
Information overload
Multi-agent control
Alarm handling
4.2 IN F OR M A T I ON O V ER L OAD
One of the recurring questions in designing dynamiccontrol environments such as a railway control is whethermore information is better. Process and transport controlsystems collect data remotely from complex environments,enabling operators to monitor and intervene if necessary(Sheridan, 1992).
Within railways, advanced technologies, such as theswitch from manual control to automation, theintroduction of highly reliable sensors and theapplication of sophisticated algorithms, have increasedthe volume of data available to operators in theirdecision making. While this creates opportunities formore efficient control, it also places an increasingcognitive demand on the operator.
Similar research in complex environments has shown thatoperators are disadvantaged by the provision of multiplesources of information as well as multiple opportunitiesfor actions (Omodei et al., 2005; Seagull et al.,
Chapter Four
2001). Therefore, there should be a balance between thenumber of tasks for which operators are responsible and
Page 59 of 76
the amount of information made available to them.
Cummings and Mitchell (2007) noted that there are limitsto how much information operators can keep track ofbefore they demonstrate degraded performance.
4.3. M U L T I - A GENT CONT R OL
Control environments are moving more and more towardsintegration and centralization. Therefore, theinformation generated in one control room will be
used in another. For example, in railway maintenance, theinformation presented to the maintenance operator in thenational control centre will be used by track workers.Moreover, different operators are responsible fordifferent aspects of a decision making task. Thecooperation between personnel with different roles withinthe control environment is a key aspect of the success ofthese control processes.
Two aspects of the work that should be analyzed in orderto understand and inform these multi agent controlsystems are:
1. What are the roles involved with these systems?2. What are the goals and objectives of each of thoseroles?For example, in railway intelligent infrastructure, if weassume that asset failure prevention is the ultimategoal, the information provided by the system will be useddifferently by different people (from the track worker ona railway site to the operator in a control room andultimately by the policy maker).
Page 60 of 76
Hoc (2001) looked into the concept of cooperationbetween different agents in the dynamic environment (e.g.interface, operators, etc.). He has recommended that oneway of developing an understanding of levels ofcoordination is to decompose one goal (i.e. solving aproblem) into its sub-goals and look into the activitiesof different agents during each sub-goal. It is alsoimportant to understand the boundaries between thedifferent roles of intelligent infrastructure and tosupport each role accordingly.Information presented to operators should be in acohesive way that matches their mental model andcognitive processing that is necessary for effectivedecision making.
Chapter Four
4.4 AL AR M H ANDLING
Technical advances in designing complex control settingsallow huge amounts of data to be collected from variousremote sensors. Presenting all of these data
seems to be both impossible and unreasonable. Alarms arethen introduced to assist human operators in managingthese numerous sources of data.
When designing alarms, the following factors need to beconsidered in relation to auditory displays include:appropriate level of sensitivity, contrast between theaudible siren and background noise, perceived urgencyof the task and the alarm respectively as well asmultiple alarms (Robinson et al., 2006). These factors,
Page 61 of 76

in their wider sense, refer to the two perspectivesintroduced by Woods (1995): how informative the alarm isand alarm perception.
Chapter Five
5.0 IN F OR M A T I ON PR O C ES S I N G PARAD I G M
The information processing paradigm is the outcome ofPage 62 of 76
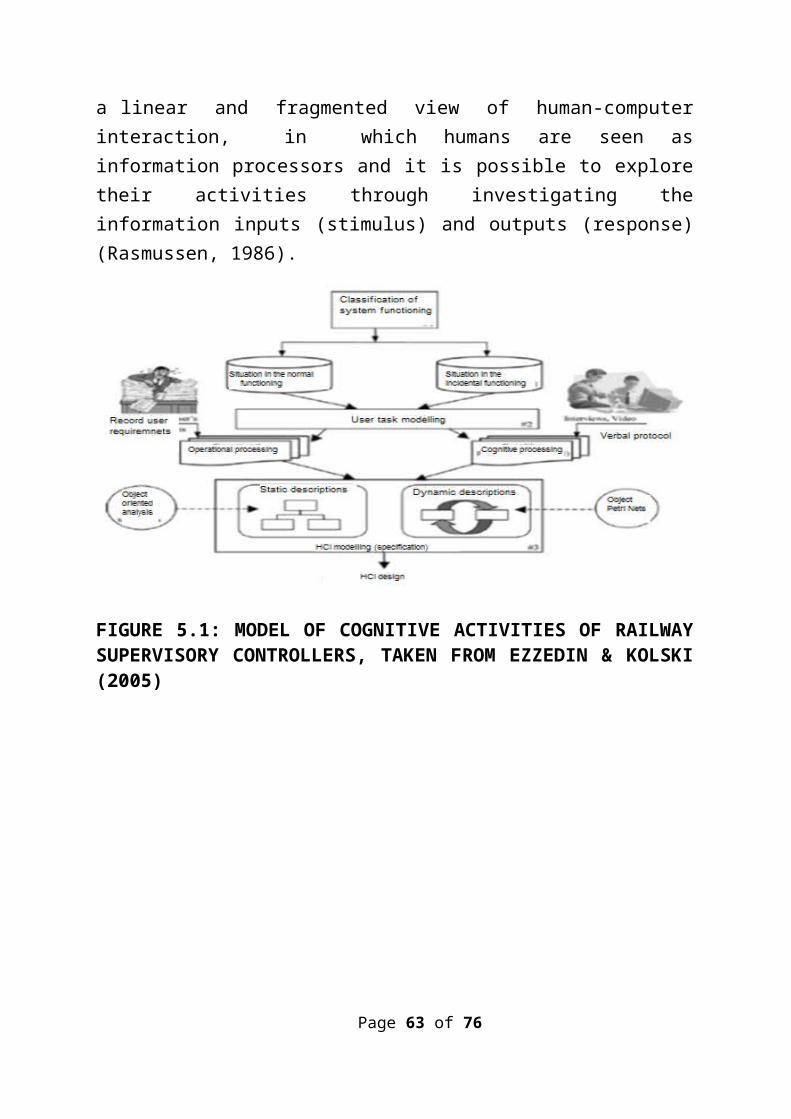
a linear and fragmented view of human-computerinteraction, in which humans are seen asinformation processors and it is possible to exploretheir activities through investigating theinformation inputs (stimulus) and outputs (response)(Rasmussen, 1986).
FIGURE 5.1: MODEL OF COGNITIVE ACTIVITIES OF RAILWAYSUPERVISORY CONTROLLERS, TAKEN FROM EZZEDIN & KOLSKI(2005)
Page 63 of 76
Chapter Five
Information processing paradigms have been widelyused to facilitate studies associated with decisionmaking, problem solving, as well as alarm handling.Models of alarm handling were introduced to guidethe exploration of the various stages conducted byoperators when handling alarms; very early onesinclude that of Lees (1983), which has three stages:detection, diagnosis and correction. A modelsuggested by Rouse (1983) also has three stages:detection, diagnosis and compensation. Althoughother models are available, as noted by Stanton(2006), there is little evidence that these modelsreflect a real life alarm handling environment. Toovercome this uncertainty, Stanton et al (1998)identified a sequence of activities that areinitiated by the generation of an alarm (Figure3.7)
This model includes two sets of events: routine andcritical. When an alarm is generated, operatorsobserve the reported warning and accept if it isgenuine. Based on their understanding of afailure, operators might analyze, correct, monitor,or reset the alarm. If the cause of the failure isunknown, then the operator will conduct a seriesof investigations to diagnose the problem. Finally,they monitor the situation to ensure that theabnormality is dealt with (Stanton, 2006).
Page 64 of 76
CONDITION MONITORING AND DIAGNOSTICS OF MACHINES DATAPROCESSING, COMMUNICATION AND PRESENTATION.
PART 1
GENERAL GUIDELINES
1. SCOPE
This part of ISO 13374 establishes general guidelines forsoftware specification related to data processing,communication, and presentation of machine conditionmonitoring and diagnostic information.
NOTE: Later parts of ISO 13374 (under preparation) willaddress specific software specification requirements fordata processing, communication, and presentation.
2. DATA PROCESSING
2.1 OVERVIEW
Chapter Five
Relevant data processing and analysis procedures arerequired to interpret the data received from conditionmonitoring activities. A synergistic combination oftechnologies should establish the cause and severity ofpossible faults and provide the justification foroperations and maintenance actions in a pro-active manner.
A data processing and information flow of the type shownin figure1 is recommended either on a manual or automaticbasis, in order to implement condition monitoringsuccessfully. The data flow begins at the top, wheremonitoring configuration data are specified for the
Page 65 of 76
various sensors monitoring the equipment, and finallyresults in actions to be taken by maintenance andoperations personnel. As the information flow progressesfrom the data acquisition to advisory generation, datafrom the earlier processing blocks need to be transferredto the next processing block and additional informationacquired from or sent external systems.Similarly, as the data evolve into information, bothstandard technical displays and simpler graphicalpresentation formats are needed. The flow progresses fromdata acquisition to complex prognostic tasks, ending inthe issuance of advisories and recommended actions (one ofwhich may be modification of the monitoring processitself.
5.2 DATA-PROCESSING BLOCKS
5 .2.1. MACHINE CONDITION ASSESSMENT PROCESSING BLOCKS
Machines condition assessment can be broken into sixdistinct, layered processing blocks. The first threeblocks are technology-specific, requiring signalprocessing and data analysis functions targeted to aparticular technology. The following are some of the mostcommonly used technologies in condition monitoring anddiagnostics of machines:
Shaft displacement monitoring; Bearing vibration monitoring; Tribology-based monitoring; Infrared thermograhic monitoring; Performance monitoring; Acoustical monitoring; Motor current monitoring;
Page 66 of 76
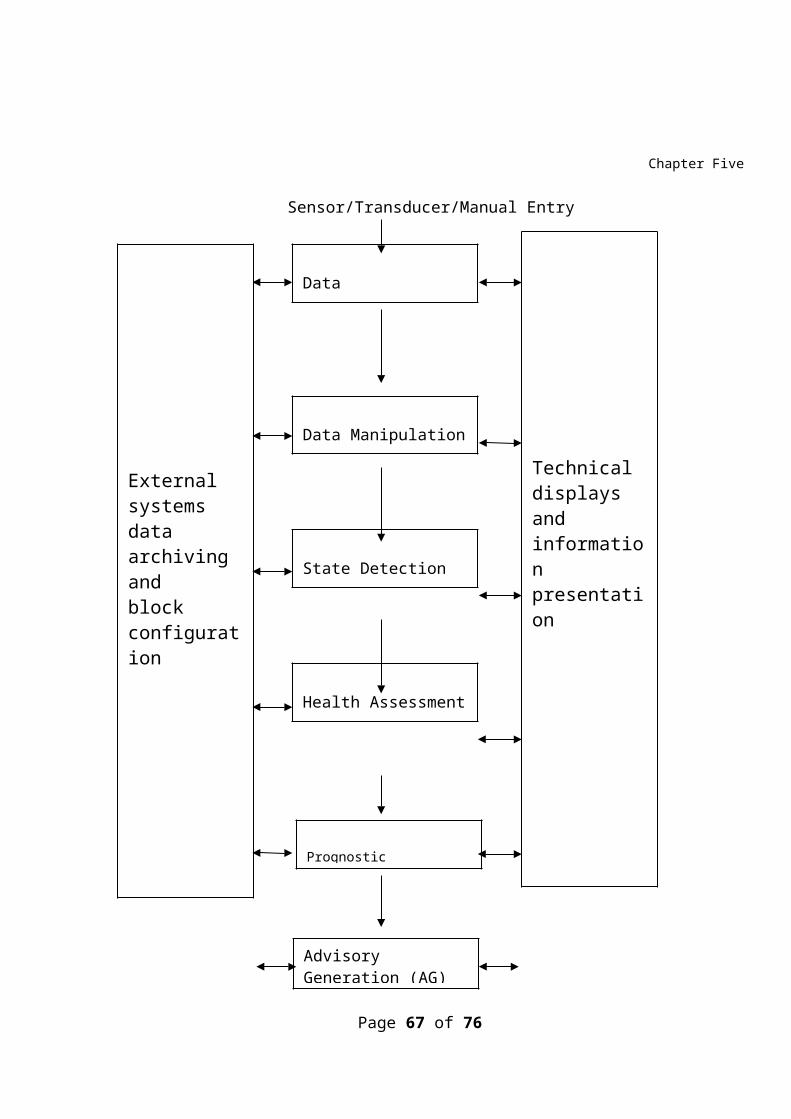
Chapter Five
Sensor/Transducer/Manual Entry
Page 67 of 76
External systemsdata archiving andblock configuration
Technical displays and information presentation
Data Acquisition
Data Manipulation(DM)
State Detection (SD)
Health Assessment(HA)
Prognostic
Advisory Generation (AG)
Figure1- Data-Processing and Information-flow blocks
The technology-specific blocks and the functions theyshould provide are as follows.
a)Data Acquisition (DA) Block: Converts an outputfrom the transducer to a digital parameterrepresenting a physical quantity and relatedinformation (such as the time, calibration, dataquality collector utilized, sensorconfiguration).
Chapter Five
b)Data Manipulation (DM Block): performs signalanalysis, computes meaningful descriptors, andderives virtual sensor readings from the rawmeasurements.
c)State Detection (SD Block); facilitates thecreation and maintenance of normal baseline“profile” searches for abnormalities whenevernew data are acquired, and determines in whichabnormality zone, if any, data belong (e.g.).“alert” of alarm).
The final three blocks normally attempt to combinemonitoring technologies in order to assess the currenthealth of the machine, predict future failures, andprovide recommended action steps to operations andmaintenance personnel. These three blocks and thefunctions they should support are as follows.
d)Health Assessment (HA) Block: Diagnoses anyfaults and rates the current health of the
Page 68 of 76
equipment or process, considering all stateinformation.
e)Prognostic Assessment (PA) Block: Determinesfuture health states and failure modes based onthe current health assessment and projectedusage loads on the equipment and/or process, aswell as remaining useful life predictions.
f)Advisory Generation (AG) Block: providesactionable information regarding maintenance oroperational changes required to optimize thelife of the process and/or equipment.
2.2.2 TECHNICAL DISPLAYSTo facilitate analysis by qualified personnel, relevanttechnical displays showing data such as trends as well asassociated abnormality zones are necessary. These displaysshould provide the analyst with the data required toidentify, confirm or understand an abnormal state.
2.2.3 INFORMATION PRESENTATIONIt is important that the data be converted to a form thatclearly represents the information necessary to makecorrective-action decisions. This may be done in a writtenformat, numerically in order to demonstrate magnitudes,graphically in order to show trends, or a combination ofall three.
Chapter Five
The information should include pertinent data describingthe equipment or its components, the failure type orfault, an estimate of the severity, a projection of
Page 69 of 76
condition and, finally, recommended action. Cost and riskfactors may also be displayed.
2.2.4 EXTERNAL SYSTEMS
Retrieval of previous work histories from the maintenancesystem and precious operational data (state/stop/loads)from a process-data historian is important in theassessment of machinery health. After a health assessmentis made, the maintenance action to be taken may range fromincreasing the frequency of inspection to repair orreplacement of the damaged machinery or component. Theeffect on operations may be an adjustment of operatingprocedures or a request to shutdown the equipmentimmediately. This need for rapid communication to themaintenance and operational system requires softwareinterfaces to maintenance management system andoperational control systems. These interfaces are usefulin order to communicate recommended actions in the form ofmaintenance work requests and operational change requests.
Page 70 of 76
ReferencesAktan, A. E., Helmicki, A. J., & Hunt, V. J. (1998). Issues in health monitoring in
intelligent infrastructure. IOP electronic journal
Adriaens, P., Goovaerts, P., Skerlos, S., Edwards, E., & Egli, T. (2003). Intelligent infrastructure for sustainable potable water: a roundtable for
emerging transnational research and technology development needs.Biotechnology Advances, 22(1-2), 119-134.
Adeli, H., & Jiang, X. (2009). Intelligent Infrastructure, Neural Networks,Wavelets, and chaos theory for intelligent transportation systems andsmart structures. Taylor & Francis Group, LLC.
Aktan, A. E., Helmicki, A. J., & Hunt, V. J. (1998). Issues in health monitoring inintelligent infrastructure. IOP electronic journal.
Aktan, A. E., Catbas, F.N., Grimmelsman,K.A., & Tsikos, C.J., (2000). Issues in infrastructure health monitoring for management. Journal of Engineering Mechanics, 711-724.
Andreas Tolk. (2006). What Comes After the Semantic Web-PADS Implicationsfor the Dynamic Web. 20th Workshop on Principles of Advanced andDistributed Simulation (PADS’06). IEEE Computer Society, Washington,DC, USA.
Amazon’s early efforts at cloud computing partly accidental” IT KnowledgeExchange. Tech Target. (2010).
Baburajan, Rajani. “The Rising Cloud Storage Market Opportunity StrengthensVendor, Info. TECH. (2011).
Buderath, M.; Neumair, M. (2007) Operational Risk Assessment for UnmannedAircraft Vehicles by Using Structural Health and Event Management. InUAV Design Processes / Design Criteria for Structures MeetingProceedings RTO-MP-AVT-145,
Blythe, P. T., & Bryan, H. R. (2008). Future intelligent infrastructure. RoadPage 71 of 76
Transport Information and Control - RTIC and ITS United KingdomMembers Conference.
Bint, M. D. (2008). The role of remote condition monitoring in a modernrailway. 4th IET International Conference on Railway ConditionMonitoring (RCM 2008).
B Rochwerger, J. Caceres, R.S. Montero. D. Breitgand, E.Elmroth, A Galis, ELevy, IM Llorente, K. Nagin, Y Wolfsthal, E. Elmroth, J Caceres, M Ben-Yehuda, W. Emmerich, F. Galan. “THE RESERVIOR Model and Architecturefor Open Federated Cloud Computing”, IBM Journal of Research andDevelopment, Vol. 53, No.4. (2009)
Corbato, Fernando J. “An Experimental Time-sharing System”. SJCCProceedings: MIT. (2012).
Cumming, M.L., & Mitchell, P.J. (2007). Operator scheduling strategies insupervisory control of multiple UAVs. Aerospace Science and Technology,11 (4), 339-348.
Crainic, T. G., Gendreau, M., & Potvin, J.-Y. (2009). Intelligent freight-transportation Hameed, Z., Hong, Y., Cho, Y., Ahn, S., Song, C., 2009,Condition monitoring and fault detection of wind turbines and relatedalgorithms: A review. Renewable and Sustainable Energy Reviews, vol.13, 1–39art C: Emerging Technologies, 17(6), 541-557. ElsevierLtdsystems: Assessment and the contribution of operations research.Transportation Research P
Dreyfus, H., Dreyfus,S., (1986). Mind over machine: the power of humanintuition and expertise in an era of the computer. Free Press, New York.
D Kyriazis, A. Menychtas, G. Kousiouris, K Oberle, T Voith, M Boniface, EOliveros, T Cucinotta, S Berger, “A real-time Service OrientedInfrastructure”, International Conference on Real-Time and EmbeddedSystems (RTES 2010), Singapore, November 2010.
Danielson. Krissi (2008-03-26). “Distinguishing Cloud Computing from UtilityComputing”. Ebizq.net.
Gartner Says Cloud Computing Will Be As Influential As E-business”.Page 72 of 76
http://www.gartner.com/it/page.jsp?id=707508. Retrieved 2010-08-22.
Gruman, Galen (2008-04-07). ”What cloud computing really means”.InfoWorld. http://www.Infowworld.com/d/cloud-computing-really-means-031. Retrieved 2009-06-02.
Gartner says Worldwide IT Spending On Pace to Surpass Trillions in 2008,Gartner, 2008-08-18 Retrieved 2009-09-11.
Hameed, Z., Hong, Y., Cho, Y., Ahn, S., Song, C., 2009, Condition monitoringand fault detection of wind turbines and related algorithms: A review.Renewable and Sustainable Energy Reviews, vol. 13, 1–39art C: EmergingTechnologies, 17(6), 541-557. Elsevier Ltd.
Hoc, J. M. (2001). Towards a cognitive approach to human-machinecooperation in dynamic situations. International Journal of Human-Computer Studies, 54, 509–540.
Hameed, Z., Hong, Y., Cho, Y., Ahn, S., Song, C., 2009, Condition monitoringand fault detection of wind turbines and related algorithms: A review.Renewable and Sustainable Energy Reviews, vol. 13, 1–39.
Jeff Bezos’Risky Bet”. http://www.businessweek.com/magazine/content /0646/b4009001.htm.
Jardine, A.K.S.; D. Lin; and D. Banjevic (2006). “A review on machinerydiagnostics and prognostics implementing condition-basedmaintenance.” Mechanical Systems and Signal Processing (v20,n7),1483-1510.
Jones, P. M., Hayes, C. C., Wilkins, D. C., Bargar, R., Sniezek, J., Asaro, P., et al.(1998). CoRAVEN: Modelling and design of a multimedia intelligentinfrastructure for collaborative intelligence Analysis for United StatesArmy Intelligence and Security Command. Intelligence.
Jardine, A.K.S.; D. Lin; and D. Banjevic (2006). “A review on machinerydiagnostics and prognostics implementing condition-basedmaintenance.” Mechanical Systems and Signal Processing (v20, n7)1483-1510.
Lau, Henry, Ip, R., & Chan, F. (2002). An intelligent information
Page 73 of 76

infrastructure to support knowledge discovery. Expert systems withApplications, (22), 1-10.
Lynda Stadtmueller, Program Manager, Cloud Computer Services Stratecast (a Division of Frost & Sullivan) [email protected]
King, D. (2006). FORESIGHT, Intelligent Infrastructure Futures, Project Overview. (H. of O. of S. and Technology, Ed.).
Khan, A. M. (2007). Intelligent infrastructure-based queue-end warning systemfor avoiding rear impacts. IET International Transport Systems,2, 138-143.
Lau, Henry, Ip, R., & Chan, F. (2002). An intelligent information infrastructureto support knowledge discovery. Expert systems with Applications, (22),1-10.
Lyons, J., & Urry, G. (2006). Foresight: the place of social science in examiningthe future of transport. London: Evidence-Based Policies and IndicatorSystems.
Lees, F.P. (1983). Process computer alarm and disturbance analysis, Review ofthe state of the art. Computers and Chemical Engineering,7,669-694.
Network Rail. (2009). Network Rail Intelligent Infrastructure Strategy NetworkRail.
Nothingham Theses, (2012), Effective Railway Intelligent Infrastructure Systemand have also enhanced human factor.etheses.nothinggham.ac.uk/3157/1/PhD_thesis2012
Oestreich, Ken. “Converged Infrastructure.”CTO Forum, November 15,2010”.Theectoforum.com. 2010-11-15.
Omodei, M. M., McLennan, J., Elliott, G. C., Wearing, A. J., & Clancy, J. M. (2005).“More is Better”: A Bias Toward Overuse of Resources in NaturalisticDecision Making Settings. In H. Montgomery, R. Lipshtiz, & B. Brehmer(Eds.), How Professionals Make Decisions? (29-41).
Ollier, B. D. (2006). Intelligent Infrastructure the business challenge. International Conference on Railway Condition Monitoring, The
Page 74 of 76
Institution of Engineering and Technology.
Park, H., Barrett, A., Baumann, E., Grage, M., & Narasimhan, S. (2006). Modular architecture for hybrid diagnostic reasoners. Second IEEE
International Conference on Space Mission Challenges for InformationTechnology, SMC-IT 2006.
Ryan; Falvey; Merchant (October 2011). “Regulation of the Cloud in India”.Journal of Internet Law 15 (4). http://ssrn.com/abstract=1941494.
Robinson, G. S., Lee, S. E., & Casali, J. G. (2006). Auditory Warnings andDisplays: Issues Relating to Design and Selection. In W. Karwowski (Ed.),International encyclopaedia of ergonomics and human factors (2nd ed.,1379-1382). Taylor & Francis Group, LLC.
Rasmussen, J. (1986). Information processing and human-machineinteraction. United States: Elsevier Science Pub. Co. Inc.,New York, NY.
Rouse, W.B.,(1983). Models of human problem solving: detection, diagnosis,and compensation for system failures. Automatica, 19, 613-626.
Strachey, Christopher (June 1959). “Time Sharing in Large Fast Computer”.Proceedings of the International Conference on Information processing,UNESCO. Paper B.2.19: 336-341.
Sundstrom, G., & Salvador, A. (1995). Integrating field work in system design:a methodology and two case studies. IEEE Transactions on Systems, Manand Cybernetics, 25.
Sheridan, Thomas B. (1992). Telerobotics, automation, and human supervisorycontrol (p. 393). MIT Press.
Seagull, F. J., Wickens, Christopher D, & Loeb, R. G. (2001). When is less more?Attention and Workload in auditory, visual, and redundant patient-monitoring conditions.
Stanton, N.A. (2006). Alarm Initiated Activities. In W. Karwowski (Ed.), International encyclopaedia of ergonomics and human factors (2nd ed., 1008-1011). Taylor & Francis Group, LLC.
Page 75 of 76
Stanton, N. A. (2006). Human Alarm Handling Response Times. In W. Karwowski (Ed.), International encyclopaedia of ergonomics and human
factors (397-399).
Stanton, N., & Baber, C. (2006). The ergonomics of command and control. Ergonomics, 49, 1131-1138.
Stanton, N.A.& Stammers, R.B. (1998). Alarm initiated activities: Matchingformats to tasks. International Journal of Cognitive Ergonomics, (4),
331-348.
Woods, David D. (1995). The alarm problem and directed attention in dynamicfault management. Ergonomics, 38(11), 2371-2393.
Page 76 of 76


