Embed Size (px)
Citation preview
How to Establish and Manage a Systematic Community Feedback Mechanism
Special focus on migration programmes
© International Federation of Red Cross and Red Crescent Societies, Geneva, 2018
Any part of this publication may be cited, copied, translated into other languages or adapted to meet local needs without prior permission from the International Federation of Red Cross and Red Crescent Societies, provided that the source is clearly stated. Requests for commercial reproduction should be directed to the IFRC at [email protected]
The International Federation of Red Cross and Red Crescent Societies (IFRC) is the world’s largest volunteer-based humanitarian network. With our 190 member National Red Cross and Red Crescent Societies worldwide, we are in every community reaching 160.7 million people annually through long-term services and development programmes, as well as 110 million people through disaster response and early recovery programmes. We act before, during and after disasters and health emergencies to meet the needs and improve the lives of vulnerable people. We do so with impartiality as to nationality, race, gender, religious beliefs, class and political opinions.
Guided by Strategy 2020 – our collective plan of action to tackle the major humanitarian and development challenges of this decade – we are committed to saving lives and changing minds.
Our strength lies in our volunteer network, our community-based expertise and our independence and neutrality. We work to improve humanitarian standards, as partners in development, and in response to disasters. We persuade decision-makers to act at all times in the interests of vulnerable people. The result: we enable healthy and safe communities, reduce vulnerabilities, strengthen resilience and foster a culture of peace around the world.
International Federation of Red Cross and Red Crescent Societies
How to Establish and Manage a Systematic Community Feedback Mechanism
3
How to Establish and Manage a Systematic Community Feedback Mechanism
Special focus on migration programmes
4
International Federation of Red Cross and Red Crescent Societies
How to Establish and Manage a Systematic Community Feedback Mechanism
© M
irva
Hel
eniu
s /
IFR
C
International Federation of Red Cross and Red Crescent Societies
How to Establish and Manage a Systematic Community Feedback Mechanism
5
Acronyms ICRC : International Committee of the Red CrossIFRC : International Federation of Red Cross and Red Crescent SocietiesODK : Open Data KitRFL : restoring family linksSPSS : Statistical Package for the Social Sciences
Contents
Introduction 07What is this guide about? 07Why regular feedback from and dialogue with communities is important 08The Constituent Voice™ methodology and the Red Cross and Red Crescent feedback approach 08
Steps to Set up and Manage a Systematic Feedback System 13Before setting it up 13Setting up and managing a feedback system 14Step 1: Design 15Step 2: Data collection 23Step 3: Data preparation 27Step 4: Dialogue 32 Step 5: Action 37
Annexes 41Annex 1: Design workshop – facilitator’s quick guide 41Annex 2: Quick guide to test survey questions in a focus group 46Annex 3: Checklist – survey design 46Annex 4: Menu of survey questions relevant in a migration context 48Annex 5: Examples of selection and response bias 49Annex 6: Data collection options 50Annex 7: Tools for data collection and analysis 52Annex 8: Quick guide for data collectors 54Annex 9: Automated excel spreadsheet for analysis and visualization Annex 10: Feedback summary report template Annex 11: Data visualization templates Annex 12: Conducting dialogue on feedback results Annex 13: Comparison of data collection and analysis tools Annex 14: Questionnaire – Red Cross reception centres in italy Annex 15: Questionnaire – Red Cross safe point in italy Annex 16: Questionnaire – restoring family links programme in austria
Annex 9 to 16 are only available online together with the other annexes and can be downloaded here

6
International Federation of Red Cross and Red Crescent Societies
How to Establish and Manage a Systematic Community Feedback Mechanism
© I
FRC
7
International Federation of Red Cross and Red Crescent Societies
Introduction
7
What is this guide about?This step-by-step guide aims at supporting Red Cross and Red Crescent staff and volunteers to establish and manage a systematic community feedback mechanism using the Ground Truth Solutions’ Constituent Voice™ method-ology. It focuses on migration programmes but can be adapted and used in other contexts.
The guidance provided here complements the Red Cross Red Crescent Guide to Community Engagement and Accountability1 and the Monitoring and Evaluation Guide and describes how to use community feedback to improve Red Cross and Red Crescent work.
The guide provides an overview of the approach together with guidance and tools for designing and implementing feedback cycles that bring continuous and real-time data flows into day-to-day decision-making. This contributes to better and more accountable programming and helps establish struc-tures where people’s opinions are listened to and acted on, especially when making decisions that directly affect them.
The content of this guide will be reviewed on a regular basis and adjusted accordingly.
This guide is intended as a reference tool for Red Cross and Red Crescent staff and volunteers, as well as partners who support them.
Introduction
1 For further information on community engagement and accountability visit: www.ifrc.org/CEA
Community engagement is not just an afterthought
Community engagement means ensuring that the most appropriate systems and communication approaches are used to listen to communities’ needs, feedback and com-plaints so that they can actively participate and guide Red Cross and Red Crescent service delivery.
Listening to and acting on people’s needs and opin-ions provides huma nitarian organizations with deeper insights on the priorities of affected communities, making programmes sus-tainable. At the same time, this valuable information can be used as an early warning system to ad-dress unforeseen issues. In doing so, humanitarian organizations recognize communities as experts and active partners in their own development, relief and recovery. Community engagement leads to increased accountability, safer access and acceptance, sustainable and commu-nity-driven programmes and ultimately more empowered and resilient communities.
The Red Cross Red Crescent Guide to Community Engagement and Accountability, along with the extensive online toolkit, provides further insight on ways to engage communities in Red Cross and Red Crescent work.
Intr
oduc
tion
8
International Federation of Red Cross and Red Crescent Societies
How to Establish and Manage a Systematic Community Feedback Mechanism
Why regular feedback from and dialogue with communities is important1. It leads to better programme performance and ultimately to better results
for communities. The goal of systematic feedback mechanisms is to support better performance and results for communities by grounding Red Cross and Red Crescent response in the needs, priorities and expectations of the people.
2. It improves the relationship and builds trust between communities and the Red Cross and Red Crescent. Regularly seeking out and responding to feedback from communities helps improve the relationship and trust between communities and the Red Cross and Red Crescent. Engaging in a dialogue and joint analysis with people about the feedback they provide is essential in not only identifying solutions together, but also in managing their expectations in relation to what programme adjustment or other action (e.g. advocacy or information sharing) they can expect from the Red Cross and Red Crescent.
3. It empowers communities. Giving people ways to communicate their needs and concerns and space to have a say in the decisions that affect them, can enable people to act independently and make their own choices.
The Constituent Voice™ methodology and the Red Cross and Red Crescent feedback approach
SnapshotThe Constituent Voice methodology from Ground Truth Solutions’ consists of systematically collecting the views of affected people on key aspects of a hu-manitarian programme, analysing what they say, making sense of the data together with affected communities and communicating the resulting insights back to them. The objective is to provide real-time, actionable information from people at the receiving end of aid that can be translated into programme im-provements, while empowering people to express their views.
The methodology draws on participatory development approaches and em-braces techniques borrowed from the customer satisfaction industry. Data col-lection is light-touch, with few questions that are asked frequently. Respondents score their answers on a scale, which thus become a measure that can be tracked over time. Data is presented in ways to foster deeper dialogue among staff and with affected people, and to encourage follow-up action.
Introduction
9
International Federation of Red Cross and Red Crescent Societies
Introduction
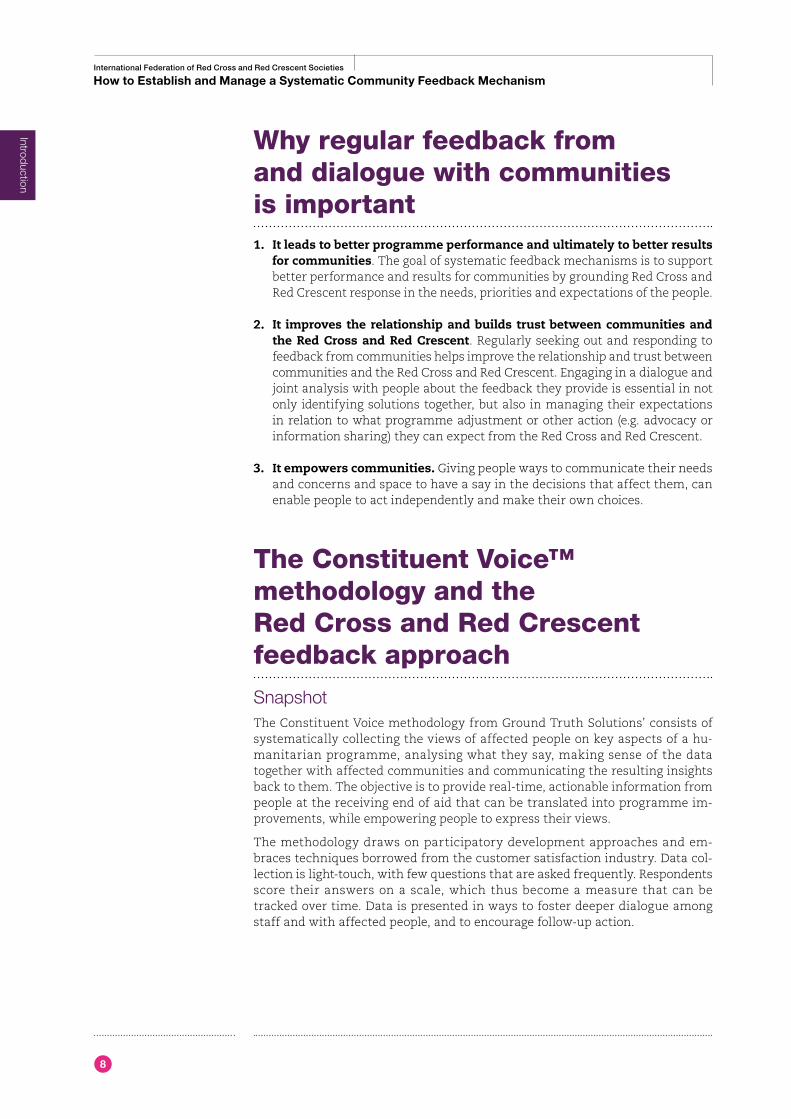
Figure 1. The feedback cycle
This cycle has been adapted from the feedback cycle that is at the core of the Community Voice Approach.
Data Collection
Design
Data Preparation
Dialogue
Action
Intr
oduc
tionThe feedback cycle
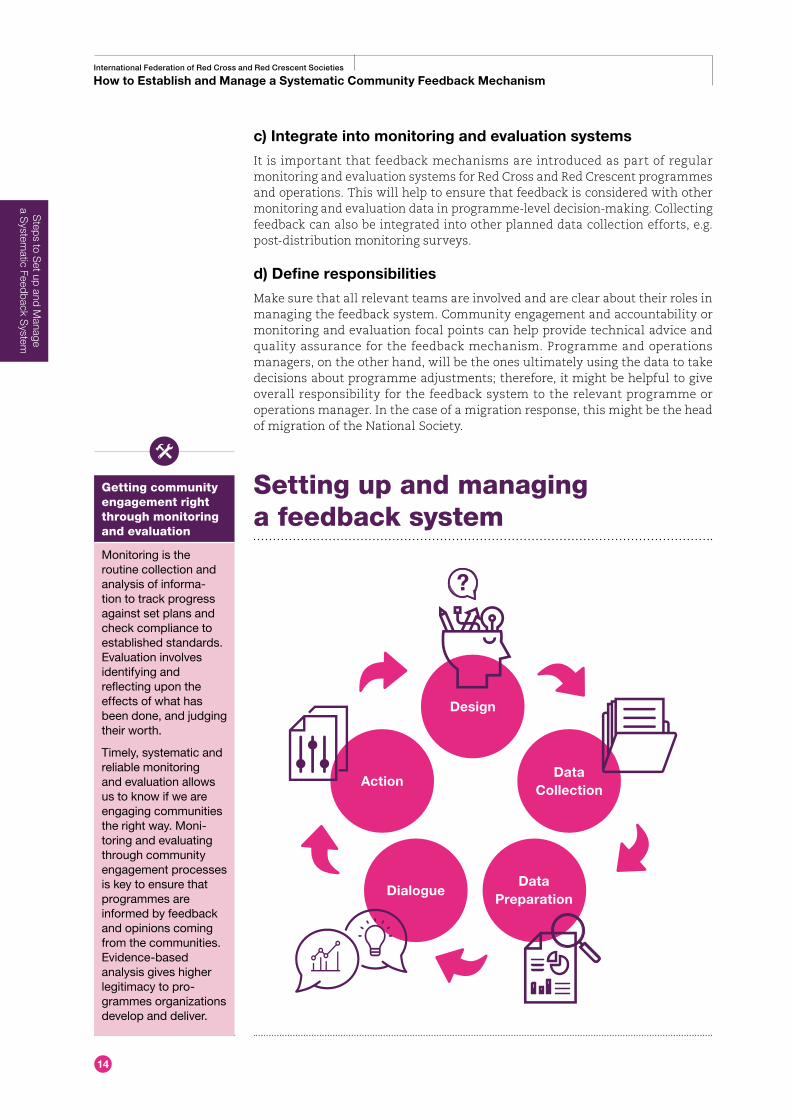
The feedback cycle lies at the core of the approach. It consists of five iterative steps: design, data collection, data preparation, participatory analysis, and action.
10
International Federation of Red Cross and Red Crescent Societies
How to Establish and Manage a Systematic Community Feedback Mechanism
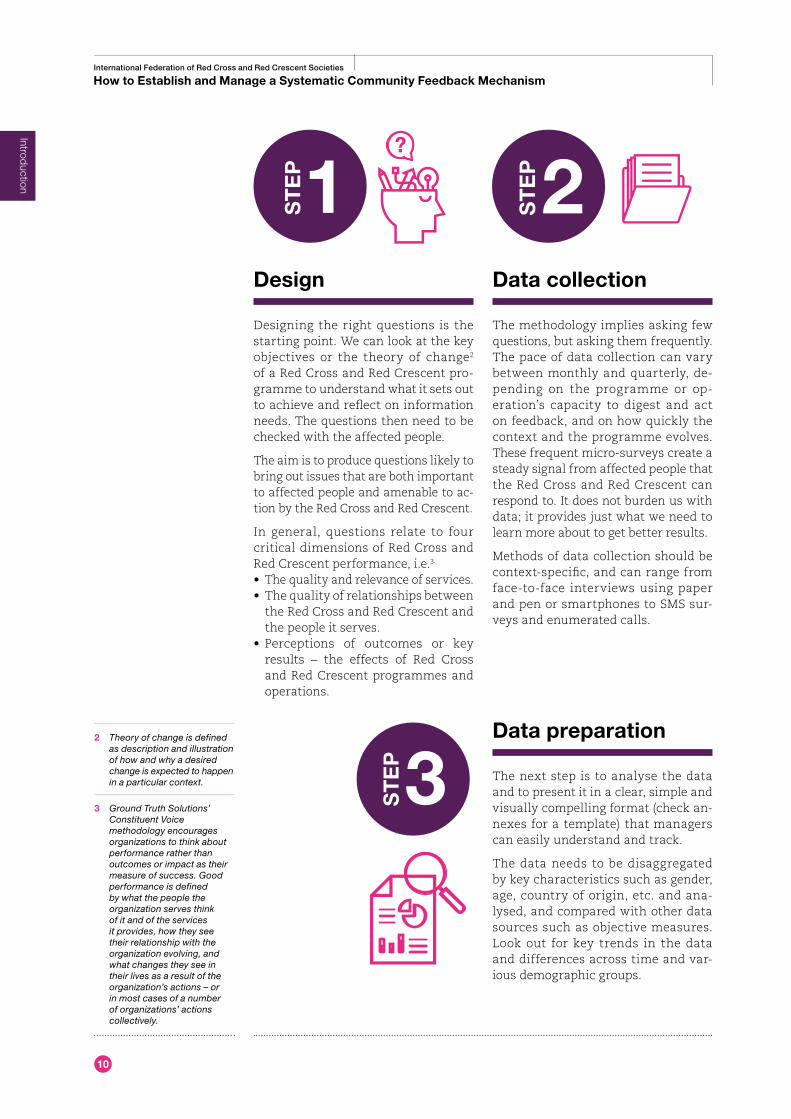
Design
Designing the right questions is the starting point. We can look at the key objectives or the theory of change2 of a Red Cross and Red Crescent pro-gramme to understand what it sets out to achieve and reflect on information needs. The questions then need to be checked with the affected people.
The aim is to produce questions likely to bring out issues that are both important to affected people and amenable to ac-tion by the Red Cross and Red Crescent.
In general, questions relate to four critical dimensions of Red Cross and Red Crescent performance, i.e.3 • The quality and relevance of services. • The quality of relationships between
the Red Cross and Red Crescent and the people it serves.
• Perceptions of outcomes or key results – the effects of Red Cross and Red Crescent programmes and operations.
1Data collection
The methodology implies asking few questions, but asking them frequently. The pace of data collection can vary between monthly and quarterly, de-pending on the programme or op-eration’s capacity to digest and act on feedback, and on how quickly the context and the programme evolves. These frequent micro-surveys create a steady signal from affected people that the Red Cross and Red Crescent can respond to. It does not burden us with data; it provides just what we need to learn more about to get better results.
Methods of data collection should be context-specific, and can range from face-to-face interviews using paper and pen or smartphones to SMS sur-veys and enumerated calls.
ST
EP 2STEP
2 Theory of change is defined as description and illustration of how and why a desired change is expected to happen in a particular context.
3 Ground Truth Solutions’ Constituent Voice methodology encourages organizations to think about performance rather than outcomes or impact as their measure of success. Good performance is defined by what the people the organization serves think of it and of the services it provides, how they see their relationship with the organization evolving, and what changes they see in their lives as a result of the organization’s actions – or in most cases of a number of organizations’ actions collectively.
Data preparation
The next step is to analyse the data and to present it in a clear, simple and visually compelling format (check an-nexes for a template) that managers can easily understand and track.
The data needs to be disaggregated by key characteristics such as gender, age, country of origin, etc. and ana-lysed, and compared with other data sources such as objective measures. Look out for key trends in the data and differences across time and var-ious demographic groups.
3STEP
Introduction
11
International Federation of Red Cross and Red Crescent Societies
Introduction
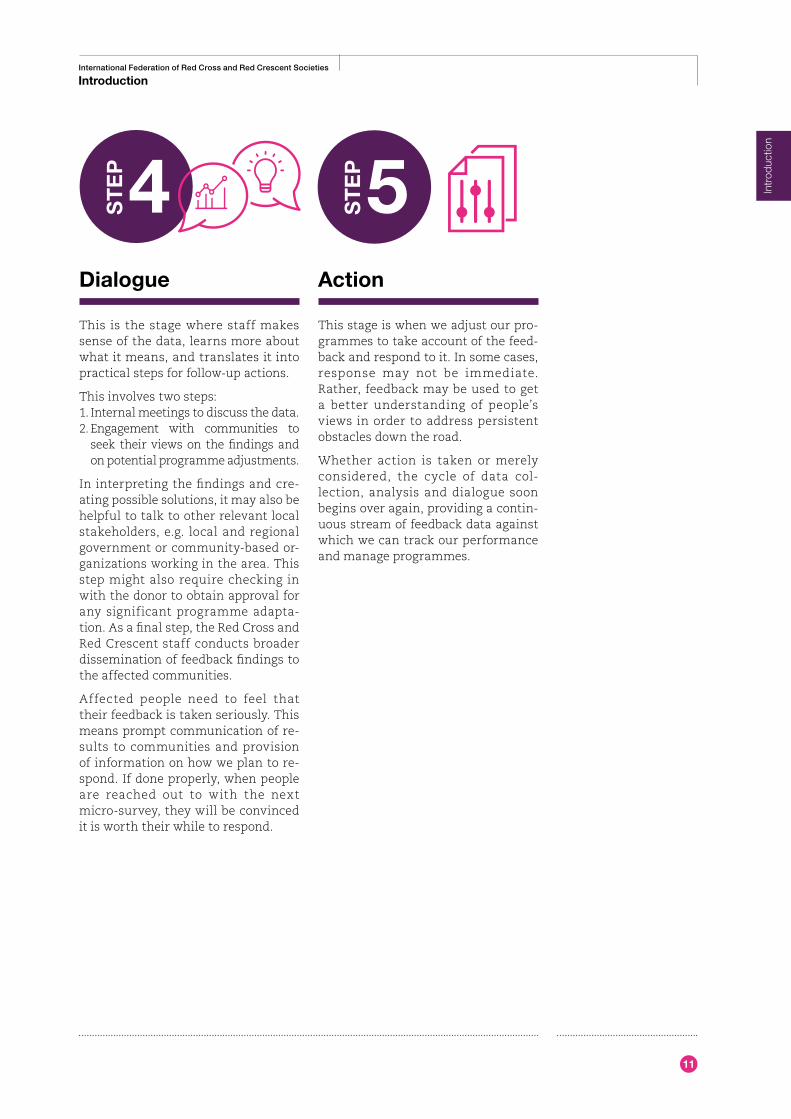
Dialogue
This is the stage where staff makes sense of the data, learns more about what it means, and translates it into practical steps for follow-up actions.
This involves two steps: 1. Internal meetings to discuss the data. 2. Engagement with communities to
seek their views on the findings and on potential programme adjustments.
In interpreting the findings and cre-ating possible solutions, it may also be helpful to talk to other relevant local stakeholders, e.g. local and regional government or community-based or-ganizations working in the area. This step might also require checking in with the donor to obtain approval for any significant programme adapta-tion. As a final step, the Red Cross and Red Crescent staff conducts broader dissemination of feedback findings to the affected communities.
Affected people need to feel that their feedback is taken seriously. This means prompt communication of re-sults to communities and provision of information on how we plan to re-spond. If done properly, when people are reached out to with the next micro-survey, they will be convinced it is worth their while to respond.
4STEP
Action
This stage is when we adjust our pro-grammes to take account of the feed-back and respond to it. In some cases, response may not be immediate. Rather, feedback may be used to get a better understanding of people’s views in order to address persistent obstacles down the road.
Whether action is taken or merely considered, the cycle of data col-lection, analysis and dialogue soon begins over again, providing a contin-uous stream of feedback data against which we can track our performance and manage programmes.
5STEP Intr
oduc
tion
12
International Federation of Red Cross and Red Crescent Societies
Road map to community resilience Operationalizing the Framework for Community Resilience
Intr
oduc
tion
© M
arco
Pan
zett
i
13
International Federation of Red Cross and Red Crescent Societies
Steps to Set up and Manage a Systematic Feedback System
13
Before setting up the feedback system
PlanThis section outlines practical tips for the planning stage of introducing a sys-tematic feedback mechanism in programmes and operations.
a) Get buy-in from management and staff
A feedback system will require both financial and human resources, to collect data and to follow up on the findings through further participatory analysis with communities. It is important, therefore, that staff and management are on board and are ready to allocate time and adapt programmes based on the feedback that the affected people provide. It is also important that community members and representatives are on board and that their participation is main-tained over time.
b) Plan for it in your budget, work plan and staff job descriptions
The cost of activities linked to data collection, analysis and communication with communities need to be considered when introducing feedback systems. It is helpful to plan for it from the outset when programme and operational budgets are prepared. The overall costs will depend on a number of factors that are dis-cussed in the following sections. These include the frequency of data collection, the sample size (i.e. how much data is collected), whether data is collected face-to-face or remotely (e.g. by phone, SMS or online) and whether data collection is done by staff and volunteers or through an independent third party. Besides the ongoing costs of data collection, analysis and communication with communi-ties, it is helpful to budget for training staff and volunteers on the methodology, including trainings on data collection and analysis. Planned activities also need to be included in work plans and considered in staff job descriptions.
Steps to set up and manage a systematic feedback system
Refer to Tool 15 of the community engage-ment and account-ability toolkit for more information on setting up and managing feed-back and complaints mechanisms. See more here: www.ifrc.org/CEA
Ste
ps to
Set
up
and
Man
age
a
Sys
tem
atic
Fee
dbac
k S
yste
m
14
International Federation of Red Cross and Red Crescent Societies
How to Establish and Manage a Systematic Community Feedback Mechanism
c) Integrate into monitoring and evaluation systems
It is important that feedback mechanisms are introduced as part of regular monitoring and evaluation systems for Red Cross and Red Crescent programmes and operations. This will help to ensure that feedback is considered with other monitoring and evaluation data in programme-level decision-making. Collecting feedback can also be integrated into other planned data collection efforts, e.g. post-distribution monitoring surveys.
d) Define responsibilities
Make sure that all relevant teams are involved and are clear about their roles in managing the feedback system. Community engagement and accountability or monitoring and evaluation focal points can help provide technical advice and quality assurance for the feedback mechanism. Programme and operations managers, on the other hand, will be the ones ultimately using the data to take decisions about programme adjustments; therefore, it might be helpful to give overall responsibility for the feedback system to the relevant programme or operations manager. In the case of a migration response, this might be the head of migration of the National Society.
Setting up and managing a feedback system
Getting community engagement right through monitoring and evaluation
Monitoring is the routine collection and analysis of informa-tion to track progress against set plans and check compliance to established standards. Evaluation involves identifying and reflecting upon the effects of what has been done, and judging their worth.
Timely, systematic and reliable monitoring and evaluation allows us to know if we are engaging communities the right way. Moni-toring and evaluating through community engagement processes is key to ensure that programmes are informed by feedback and opinions coming from the communities. Evidence-based analysis gives higher legitimacy to pro-grammes organizations develop and deliver.
Data Collection
Design
Data Preparation
Dialogue
Action
Steps to S
et up and Manage
a System
atic Feedback System
International Federation of Red Cross and Red Crescent Societies
Steps to Set up and Manage a Systematic Feedback System
15
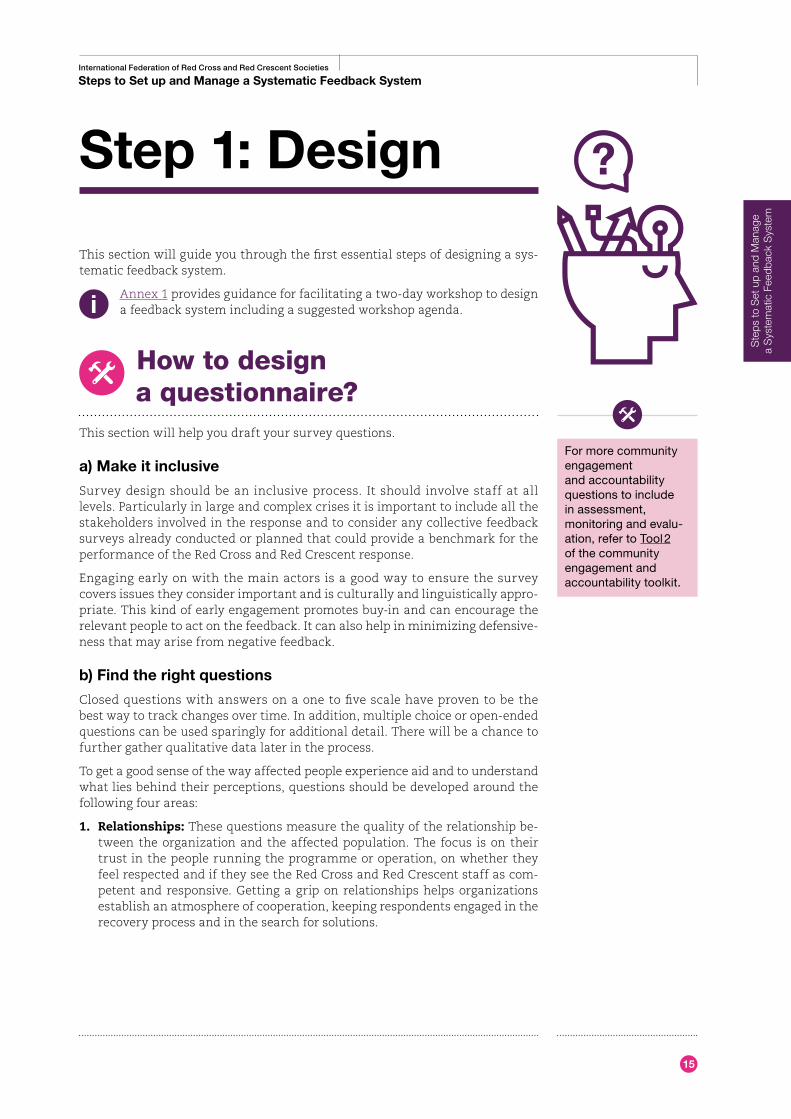
Step 1: Design
This section will guide you through the first essential steps of designing a sys-tematic feedback system.
Annex 1 provides guidance for facilitating a two-day workshop to design a feedback system including a suggested workshop agenda.
How to design a questionnaire?
This section will help you draft your survey questions.
a) Make it inclusive
Survey design should be an inclusive process. It should involve staff at all levels. Particularly in large and complex crises it is important to include all the stakeholders involved in the response and to consider any collective feedback surveys already conducted or planned that could provide a benchmark for the performance of the Red Cross and Red Crescent response.
Engaging early on with the main actors is a good way to ensure the survey covers issues they consider important and is culturally and linguistically appro-priate. This kind of early engagement promotes buy-in and can encourage the relevant people to act on the feedback. It can also help in minimizing defensive-ness that may arise from negative feedback.
b) Find the right questions
Closed questions with answers on a one to five scale have proven to be the best way to track changes over time. In addition, multiple choice or open-ended questions can be used sparingly for additional detail. There will be a chance to further gather qualitative data later in the process.
To get a good sense of the way affected people experience aid and to understand what lies behind their perceptions, questions should be developed around the following four areas:
1. Relationships: These questions measure the quality of the relationship be-tween the organization and the affected population. The focus is on their trust in the people running the programme or operation, on whether they feel respected and if they see the Red Cross and Red Crescent staff as com-petent and responsive. Getting a grip on relationships helps organizations establish an atmosphere of cooperation, keeping respondents engaged in the recovery process and in the search for solutions.
For more community engagementand accountability questions to include in assessment, monitoring and evalu-ation, refer to Tool 2 of the community engagement and accountability toolkit.
Ste
ps to
Set
up
and
Man
age
a
Sys
tem
atic
Fee
dbac
k S
yste
m
16
International Federation of Red Cross and Red Crescent Societies
How to Establish and Manage a Systematic Community Feedback Mechanism
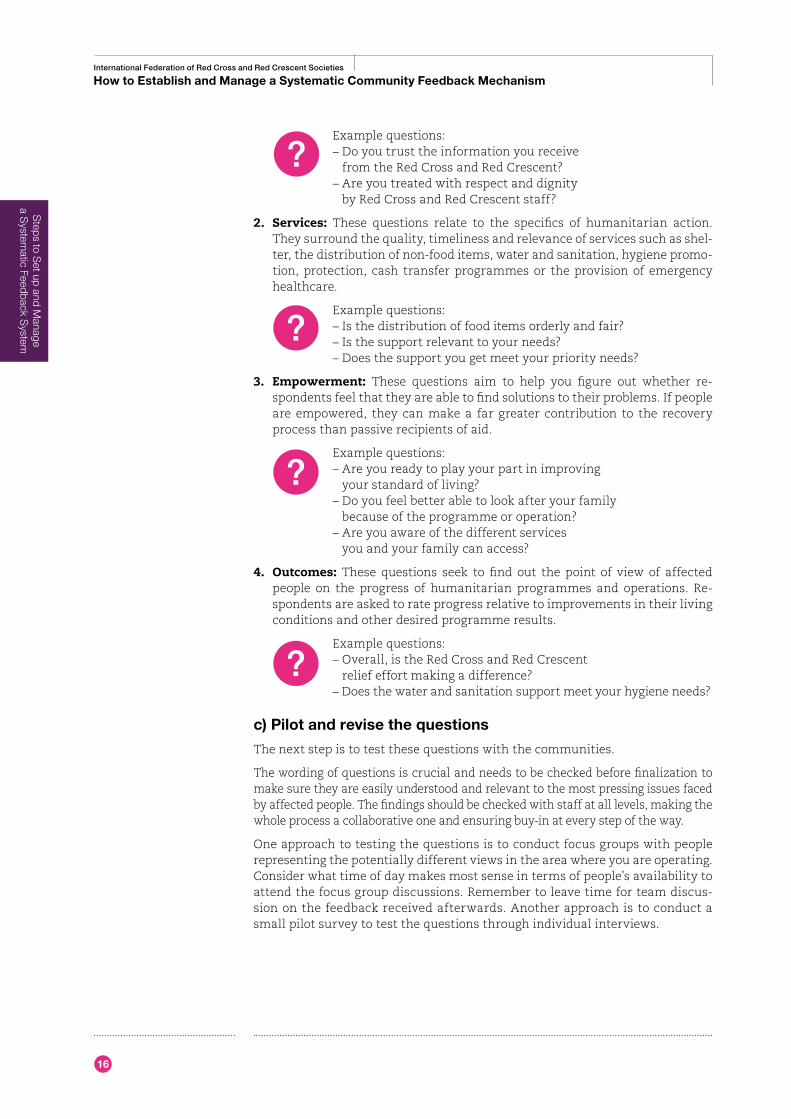
Example questions: – Do you trust the information you receive
from the Red Cross and Red Crescent? – Are you treated with respect and dignity
by Red Cross and Red Crescent staff?
2. Services: These questions relate to the specifics of humanitarian action. They surround the quality, timeliness and relevance of services such as shel-ter, the distribution of non-food items, water and sanitation, hygiene promo-tion, protection, cash transfer programmes or the provision of emergency healthcare.
Example questions: – Is the distribution of food items orderly and fair? – Is the support relevant to your needs? – Does the support you get meet your priority needs?
3. Empowerment: These questions aim to help you figure out whether re-spondents feel that they are able to find solutions to their problems. If people are empowered, they can make a far greater contribution to the recovery process than passive recipients of aid.
Example questions: – Are you ready to play your part in improving
your standard of living? – Do you feel better able to look after your family
because of the programme or operation? – Are you aware of the different services
you and your family can access?
4. Outcomes: These questions seek to find out the point of view of affected people on the progress of humanitarian programmes and operations. Re-spondents are asked to rate progress relative to improvements in their living conditions and other desired programme results.
Example questions: – Overall, is the Red Cross and Red Crescent
relief effort making a difference? – Does the water and sanitation support meet your hygiene needs?
c) Pilot and revise the questions
The next step is to test these questions with the communities.
The wording of questions is crucial and needs to be checked before finalization to make sure they are easily understood and relevant to the most pressing issues faced by affected people. The findings should be checked with staff at all levels, making the whole process a collaborative one and ensuring buy-in at every step of the way.
One approach to testing the questions is to conduct focus groups with people representing the potentially different views in the area where you are operating. Consider what time of day makes most sense in terms of people’s availability to attend the focus group discussions. Remember to leave time for team discus-sion on the feedback received afterwards. Another approach is to conduct a small pilot survey to test the questions through individual interviews.
?
?
?
?
Steps to S
et up and Manage
a System
atic Feedback System
International Federation of Red Cross and Red Crescent Societies
Steps to Set up and Manage a Systematic Feedback System
17
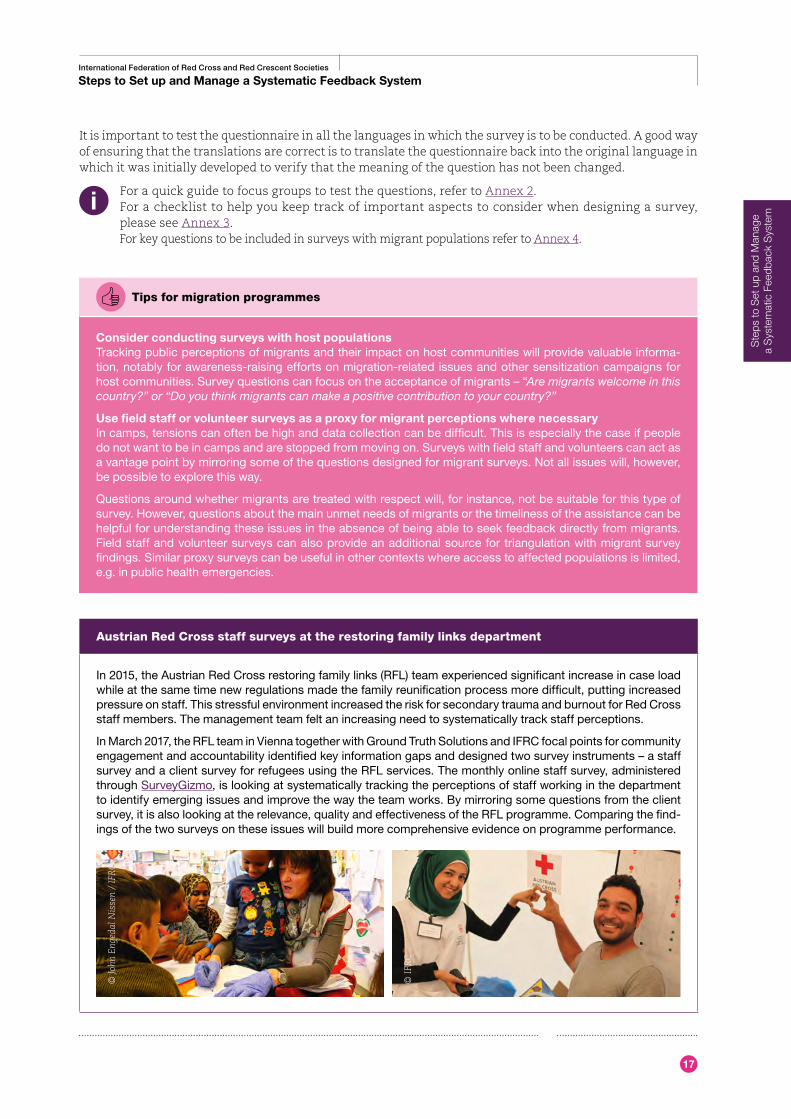
Austrian Red Cross staff surveys at the restoring family links department
In 2015, the Austrian Red Cross restoring family links (RFL) team experienced significant increase in case load while at the same time new regulations made the family reunification process more difficult, putting increased pressure on staff. This stressful environment increased the risk for secondary trauma and burnout for Red Cross staff members. The management team felt an increasing need to systematically track staff perceptions.
In March 2017, the RFL team in Vienna together with Ground Truth Solutions and IFRC focal points for community engagement and accountability identified key information gaps and designed two survey instruments – a staff survey and a client survey for refugees using the RFL services. The monthly online staff survey, administered through SurveyGizmo, is looking at systematically tracking the perceptions of staff working in the department to identify emerging issues and improve the way the team works. By mirroring some questions from the client survey, it is also looking at the relevance, quality and effectiveness of the RFL programme. Comparing the find-ings of the two surveys on these issues will build more comprehensive evidence on programme performance.
It is important to test the questionnaire in all the languages in which the survey is to be conducted. A good way of ensuring that the translations are correct is to translate the questionnaire back into the original language in which it was initially developed to verify that the meaning of the question has not been changed.
For a quick guide to focus groups to test the questions, refer to Annex 2. For a checklist to help you keep track of important aspects to consider when designing a survey, please see Annex 3. For key questions to be included in surveys with migrant populations refer to Annex 4.
Tips for migration programmes
Consider conducting surveys with host populationsTracking public perceptions of migrants and their impact on host communities will provide valuable informa-tion, notably for awareness-raising efforts on migration-related issues and other sensitization campaigns for host communities. Survey questions can focus on the acceptance of migrants – “Are migrants welcome in this country?” or “Do you think migrants can make a positive contribution to your country?”
Use field staff or volunteer surveys as a proxy for migrant perceptions where necessaryIn camps, tensions can often be high and data collection can be difficult. This is especially the case if people do not want to be in camps and are stopped from moving on. Surveys with field staff and volunteers can act as a vantage point by mirroring some of the questions designed for migrant surveys. Not all issues will, however, be possible to explore this way.
Questions around whether migrants are treated with respect will, for instance, not be suitable for this type of survey. However, questions about the main unmet needs of migrants or the timeliness of the assistance can be helpful for understanding these issues in the absence of being able to seek feedback directly from migrants. Field staff and volunteer surveys can also provide an additional source for triangulation with migrant survey findings. Similar proxy surveys can be useful in other contexts where access to affected populations is limited, e.g. in public health emergencies.
Ste
ps to
Set
up
and
Man
age
a
Sys
tem
atic
Fee
dbac
k S
yste
m
© Jo
hn E
nged
al N
isse
n /
IFR
C
© I
FRC
18
International Federation of Red Cross and Red Crescent Societies
How to Establish and Manage a Systematic Community Feedback Mechanism
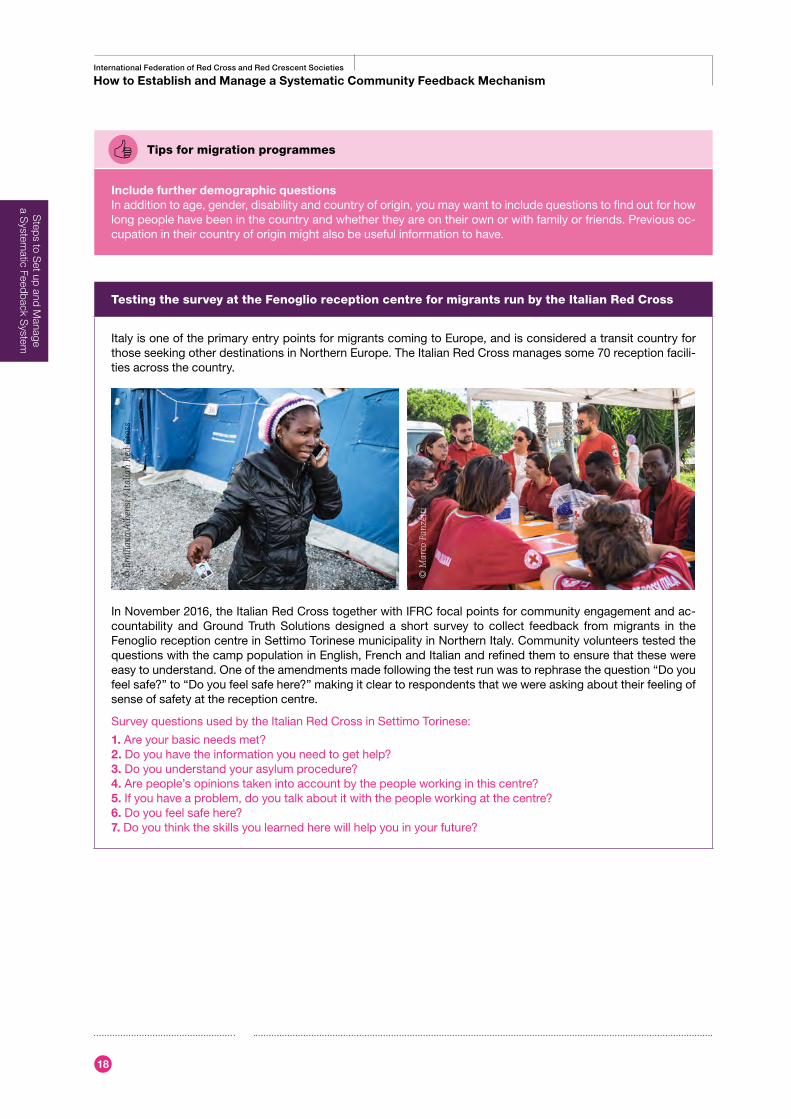
Testing the survey at the Fenoglio reception centre for migrants run by the Italian Red Cross
Italy is one of the primary entry points for migrants coming to Europe, and is considered a transit country for those seeking other destinations in Northern Europe. The Italian Red Cross manages some 70 reception facili-ties across the country.
In November 2016, the Italian Red Cross together with IFRC focal points for community engagement and ac-countability and Ground Truth Solutions designed a short survey to collect feedback from migrants in the Fenoglio reception centre in Settimo Torinese municipality in Northern Italy. Community volunteers tested the questions with the camp population in English, French and Italian and refined them to ensure that these were easy to understand. One of the amendments made following the test run was to rephrase the question “Do you feel safe?” to “Do you feel safe here?” making it clear to respondents that we were asking about their feeling of sense of safety at the reception centre.
Survey questions used by the Italian Red Cross in Settimo Torinese:
1. Are your basic needs met?2. Do you have the information you need to get help?3. Do you understand your asylum procedure?4. Are people’s opinions taken into account by the people working in this centre?5. If you have a problem, do you talk about it with the people working at the centre?6. Do you feel safe here?7. Do you think the skills you learned here will help you in your future?
Tips for migration programmes
Include further demographic questionsIn addition to age, gender, disability and country of origin, you may want to include questions to find out for how long people have been in the country and whether they are on their own or with family or friends. Previous oc-cupation in their country of origin might also be useful information to have.
Steps to S
et up and Manage
a System
atic Feedback System
© E
mili
ano
Alb
ensi
/ I
talia
n R
ed C
ross
© M
arco
Pan
zett
i
International Federation of Red Cross and Red Crescent Societies
Steps to Set up and Manage a Systematic Feedback System
19
How to design a sample?This section will guide you through the major considerations for determining the sample size and strategy for your survey. It will not go into detail about the variety of sampling designs that exist for social research. Rather, it will recom-mend the design that is best suited for the methodology described in this guide.
A sampling strategy should answer two questions:1. How much data should be collected?2. How should the data be collected?
How much data is needed depends on how confident we want to be that the sample values correspond to the full population values. We can also reverse the process to get a sense of how accurate our estimate is, based on the number of respondents we can reach. A random sampling method4 is recommended to be able to make reliable generalizations about the full population. Non-random sampling, often based on convenience or some other factor, will be a more suitable method for the participa-tory analysis stage of the feedback cycle that focuses on understanding particular issues in more depth instead of drawing conclusions for the larger population.
The second question, how the data should be collected, will be explored in depth in the next section on tool selection. It will also be considered briefly here, in the context of how data collection might bias the data.
Sample size: Precision
The sample size you need for your surveys depends primarily on two factors: 1. How precise you want your estimate to be? 2. How confident you want to be that your estimate is accurate?
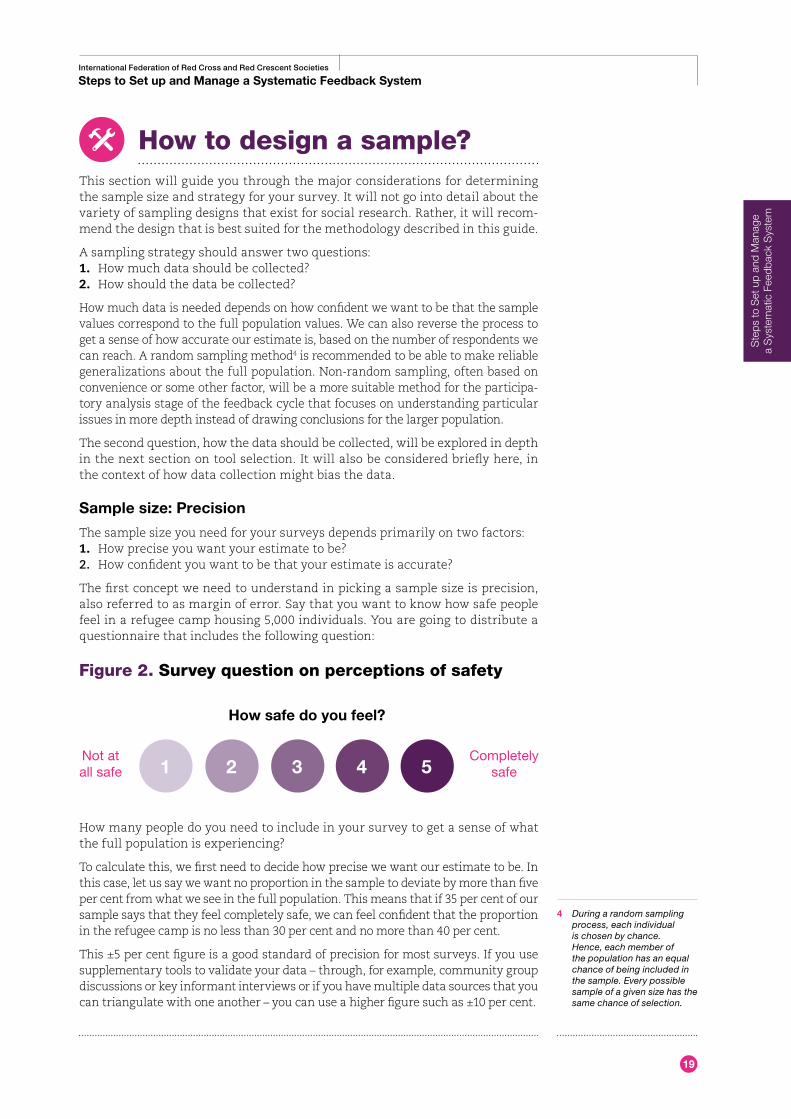
The first concept we need to understand in picking a sample size is precision, also referred to as margin of error. Say that you want to know how safe people feel in a refugee camp housing 5,000 individuals. You are going to distribute a questionnaire that includes the following question:
Figure 2. Survey question on perceptions of safety
How many people do you need to include in your survey to get a sense of what the full population is experiencing?
To calculate this, we first need to decide how precise we want our estimate to be. In this case, let us say we want no proportion in the sample to deviate by more than five per cent from what we see in the full population. This means that if 35 per cent of our sample says that they feel completely safe, we can feel confident that the proportion in the refugee camp is no less than 30 per cent and no more than 40 per cent.
This ±5 per cent figure is a good standard of precision for most surveys. If you use supplementary tools to validate your data – through, for example, community group discussions or key informant interviews or if you have multiple data sources that you can triangulate with one another – you can use a higher figure such as ±10 per cent.
Not at all safe
Completely safe
How safe do you feel?
1 2 3 4 5
4 During a random sampling process, each individual is chosen by chance. Hence, each member of the population has an equal chance of being included in the sample. Every possible sample of a given size has the same chance of selection.
Ste
ps to
Set
up
and
Man
age
a
Sys
tem
atic
Fee
dbac
k S
yste
m
20
International Federation of Red Cross and Red Crescent Societies
How to Establish and Manage a Systematic Community Feedback Mechanism
Sample size: Reliability
Reliability refers to confidence levels. Once you have decided on the level of pre-cision, you have to determine how reliable it should be. Reliability tells us how confident we can be that the population value falls inside our precision estimate (±5 per cent in this example).
The easiest way to think about reliability is to imagine repeating the survey 100 times, picking the same number of random people from the population. In this case, a reliability of 95 per cent would mean that in 95 of our 100 surveys each response category would have proportions similar to the full population propor-tions (within our ±5 per cent range). However, in five cases, at least one category would fall outside these proportions.
Statistical convention uses 95 per cent as the most common threshold for reli-ability, but that is just a convention. You could pick a reliability of 99 per cent or 90 per cent or any other value. The lower the value, the more careful you have to be in interpreting your results.
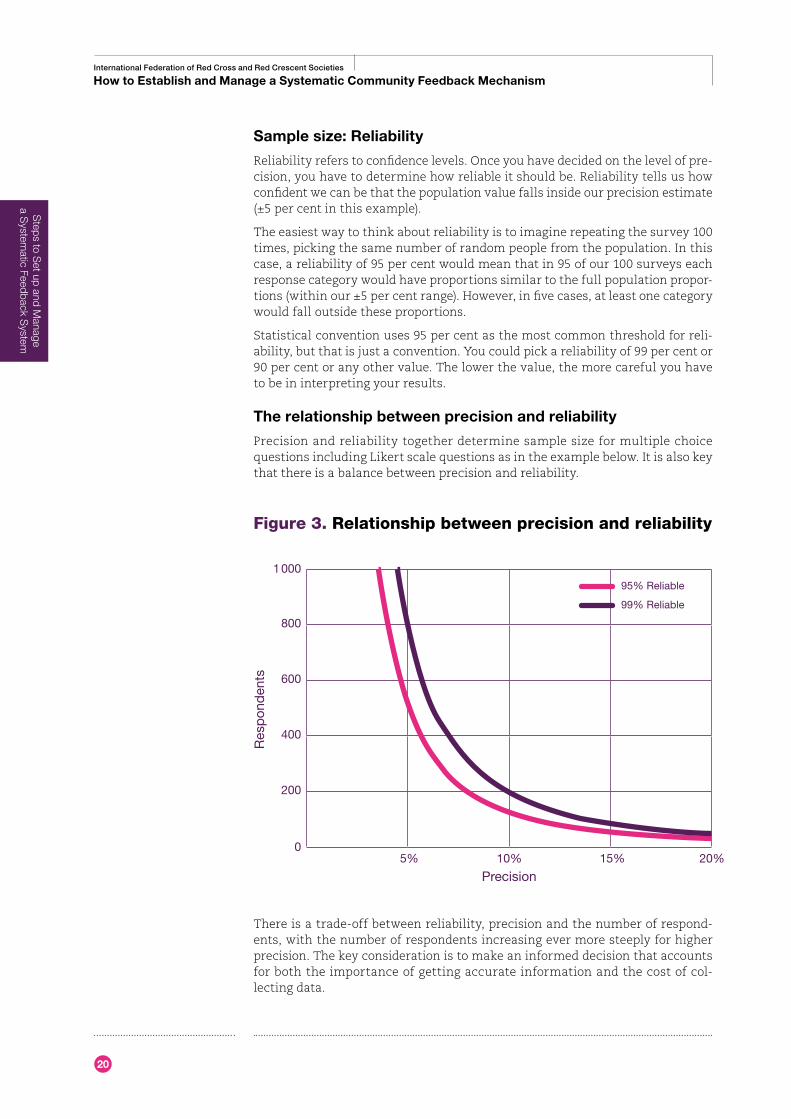
The relationship between precision and reliability
Precision and reliability together determine sample size for multiple choice questions including Likert scale questions as in the example below. It is also key that there is a balance between precision and reliability.
Figure 3. Relationship between precision and reliability
There is a trade-off between reliability, precision and the number of respond-ents, with the number of respondents increasing ever more steeply for higher precision. The key consideration is to make an informed decision that accounts for both the importance of getting accurate information and the cost of col-lecting data.
1 000
800
600
400
200
05% 10% 15% 20%
Precision
Res
pon
den
ts
95% Reliable
99% Reliable
Steps to S
et up and Manage
a System
atic Feedback System
International Federation of Red Cross and Red Crescent Societies
Steps to Set up and Manage a Systematic Feedback System
21
Given most settings, a sample of 400–500 is sufficient to be able to draw conclu-sions about an entire population. If your target population is small (e.g. below 10,000), a lower number of respondents will also be sufficient.
There are online sample-size calculators such as the one by Select Statistical Services (https://select-statistics.co.uk/calculators/) that can help determine the sample size for your survey based on the desired precision and reliability of the conclusions and the size of the target population. However, most of these online calculators are designed for yes–no questions. As such, they tend to un-derestimate the sample size necessary for a given level of precision with Likert scale questions.
Bias: Overview
If you are not careful when you plan the study, the conclusions might be biased either due to selection or response.
Your data is biased when the responses in the sample systematically differ from the attitudes of the overall population. There are two ways poorly designed sampling strategies can bias the data: either every person in the population is not equally likely to get selected for the sample, or the data collection method compels people to respond in a specific way.
Selection bias is when some people are more likely to get selected than others. For example, if a survey is only carried out at people’s homes during working hours it will not be representative of the entire population intended to be ana-lysed. To guarantee that the sample includes opinions of all sub-groups of in-terest, you need to divide the population based on gender, country of origin or other attributes, and select respondents from each group in a proportionate manner. This approach will lead to selecting a balanced representative sample for the survey.
Response bias is when people feel compelled to respond differently from what they actually believe. When people tend to respond in a way that pleases the interviewer, we are talking of courtesy bias. Recipients of humanitarian aid might be inclined to answer politely – but less candidly – so as not to offend or risk backlash or consequences of providing negative feedback.
Using independent third-party data collectors or anonymous survey tools can be a good way to reduce response bias. Regularly discussing the data with com-munities is another approach to get beyond courtesy bias. See the participatory analysis and take action sections for more information.
For further examples of selection and response bias, refer to Annex 5.
Sample design across multiple rounds of data collection
In the methodology described in this guide, subsequent rounds of data collection do not have to include the same respondents, but will each draw a sample from the target population, e.g. migrants at a given reception centre or visiting the same help desk, allowing for time-series analysis. For each round, the sample has to be large enough to give a reliable estimate at the larger population level. Otherwise it would be hard to say if responses have changed due to change in attitudes between rounds or since we happened to sample different people.
Ste
ps to
Set
up
and
Man
age
a
Sys
tem
atic
Fee
dbac
k S
yste
m
22
International Federation of Red Cross and Red Crescent Societies
How to Establish and Manage a Systematic Community Feedback Mechanism
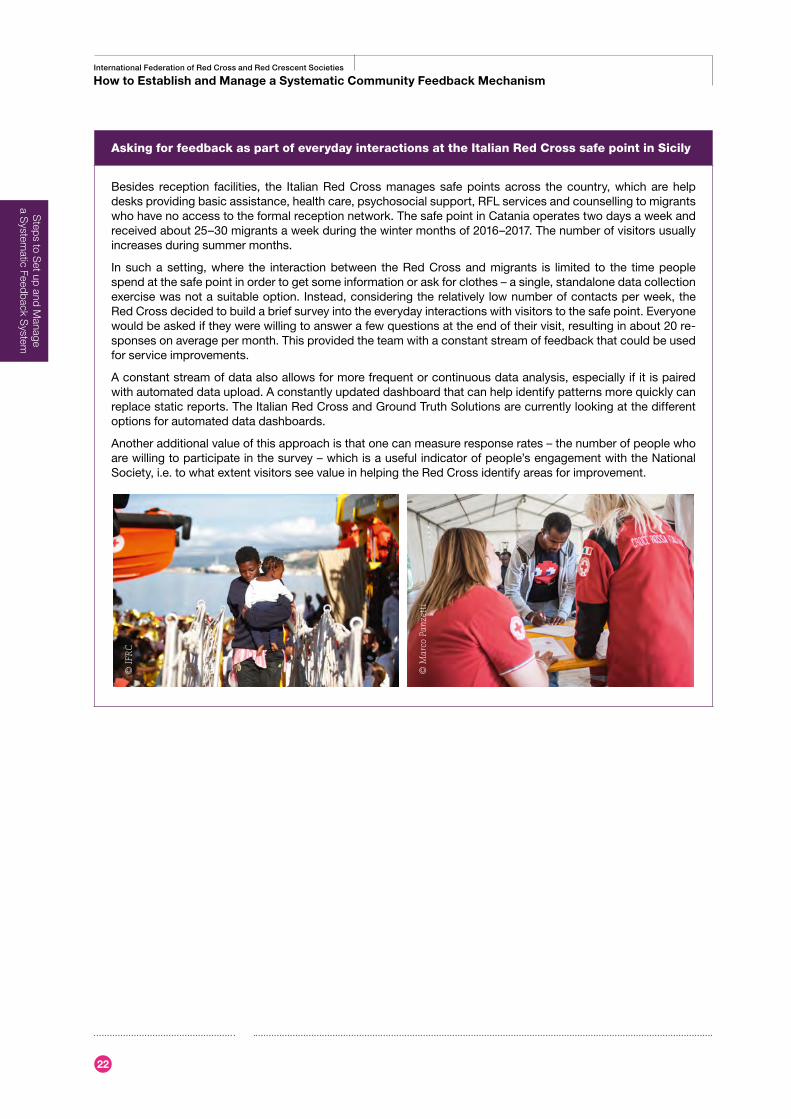
Asking for feedback as part of everyday interactions at the Italian Red Cross safe point in Sicily
Besides reception facilities, the Italian Red Cross manages safe points across the country, which are help desks providing basic assistance, health care, psychosocial support, RFL services and counselling to migrants who have no access to the formal reception network. The safe point in Catania operates two days a week and received about 25–30 migrants a week during the winter months of 2016–2017. The number of visitors usually increases during summer months.
In such a setting, where the interaction between the Red Cross and migrants is limited to the time people spend at the safe point in order to get some information or ask for clothes – a single, standalone data collection exercise was not a suitable option. Instead, considering the relatively low number of contacts per week, the Red Cross decided to build a brief survey into the everyday interactions with visitors to the safe point. Everyone would be asked if they were willing to answer a few questions at the end of their visit, resulting in about 20 re-sponses on average per month. This provided the team with a constant stream of feedback that could be used for service improvements.
A constant stream of data also allows for more frequent or continuous data analysis, especially if it is paired with automated data upload. A constantly updated dashboard that can help identify patterns more quickly can replace static reports. The Italian Red Cross and Ground Truth Solutions are currently looking at the different options for automated data dashboards.
Another additional value of this approach is that one can measure response rates – the number of people who are willing to participate in the survey – which is a useful indicator of people’s engagement with the National Society, i.e. to what extent visitors see value in helping the Red Cross identify areas for improvement.
Steps to S
et up and Manage
a System
atic Feedback System
© I
FRC
© M
arco
Pan
zett
i
International Federation of Red Cross and Red Crescent Societies
Steps to Set up and Manage a Systematic Feedback System
23
Step 2: Data collection
This section will guide you through the various considerations for deciding how to collect feedback data and help you select the most appropriate collection option. It will not go into general principles and considerations for the data col-lection process itself.
Determining how best to collect data in a cost-effective manner is crucial. The starting point is to think through the constraints and opportunities for data col-lection posed by the operational environment while taking into account the re-sources at your disposal. The complexity of the survey questionnaire and level of details you require is also important. Analysing these factors will help you choose the most appropriate approach to data collection. For a detailed guide to data collection options, refer to Annex 6.
Assess the operational environment and the level of details your survey requires
The operational context can enable or limit the use of certain data collection options.
Access: Do you have easy in-person access to respondents?
Face-to-face data collection is often the preferred option, but collecting data this way is complicated in remote locations and where there are security and safety issues. These factors may mean remote data collection (i.e. phone calls or SMS surveys) is the only option.
Connectivity: How widespread are mobile phones? Do people have internet access?
The spread of the internet and mobile phones opens up the possibility of using online and phone survey tools that are described in Annex 7.
When considering these options, think about whether vulnerable groups, such as women or older people, have access to the internet (for online surveys) or mobile phones (for phone calls or SMS surveys), and whether choosing these collection options might limit their ability to provide feedback.
Ste
ps to
Set
up
and
Man
age
a
Sys
tem
atic
Fee
dbac
k S
yste
m
24
International Federation of Red Cross and Red Crescent Societies
How to Establish and Manage a Systematic Community Feedback Mechanism
Literacy: How literate are respondents?
High levels of literacy mean that respondents can fill out a questionnaire themselves – either online, via SMS or through a survey kiosk – a stationary computer or a tablet attached to the wall of a distribution, health or counselling centre. Low levels of literacy, meanwhile, require enumerators to read the questions out loud, perhaps explain them (if respondents do not understand them), and fill out the survey form.
Details: How important is it to have the kind of qualitative information that open questions can provide?
Depending on the purpose of the data being collected, you might need to ask optional follow-up questions or open-ended questions to capture specific de-tails. If that is the case, options such as SMS surveys or automated phone sur-veys might not be the best fit for your data collection exercise.
Analyse the available resources
Taking stock of the resources available can help determine the most feasible data collection option for you.
Technical equipment: Do you have smartphones or tablets at your disposal?
The availability of technical equipment such as smartphones or tablets allows you to use KoBoToolbox that is based on Open Data Kit (ODK) or other sim-ilar software like SurveyGizmo or Magpi – to collect and aggregate responses, without the need for internet connection in the field. These tools are inexpen-sive and easy to use, speeding up data entry and processing.
Availability of skilled employees: Do staff or volunteers have experience in conducting surveys and are they familiar with relevant data collection software?
Conducting surveys either face-to-face or over the phone requires interviewing skills. If smartphones or tablets are used, data collectors need experience in using software tools to record responses. Lack of experienced individuals means that training is necessary. Some data collection options, such as face-to-face surveys, require a significant amount of staff or volunteer time. If staff or vol-unteers are already stretched, but financial resources allow it, hiring external data collectors may be the best option.
Refer to Annex 8 for useful tips for training enumerators.
Financial resources: What financial resources are available for data collection?
Financial resources are an important consideration when planning data collec-tion. Available resources will determine whether it is possible to invest in technical equipment, hire additional staff or recruit an independent company to gather data.
You can also take the following online test on https://humanitarian-nomad.org/ to see which tool would be recommended for you.
Steps to S
et up and Manage
a System
atic Feedback System
International Federation of Red Cross and Red Crescent Societies
Steps to Set up and Manage a Systematic Feedback System
25
Decide between self-collection versus independent data collection
Data can be self-collected by Red Cross and Red Crescent staff and volunteers or independently collected by a third party. An experienced, independent data col-lection group is more likely to reduce response biases and provide high quality data. From the National Society’s point of view, collecting data by itself may be less costly. Internal data collection requires training of staff and setting aside resources. In addition to assigning staff or volunteers as data collectors and training them, supervisors are necessary to ensure quality control. Internal data collection has to be well planned and managed.
Self-collected data is prone to courtesy bias. To reduce courtesy bias, staff can take precautionary measures. These include informing responders that candid answers are more likely to influence programme delivery, using technology tools that can provide for anonymity (e.g. email survey) or in the case of face-to-face data collection, using volunteers from other programmes who are not known by the respondents to collect data. One can also consider making an agreement with a local university or another organization to carry out the in-terviews on behalf of the Red Cross and Red Crescent.
For tips on internal data collection, refer to Annex 8.
Data collection through a third party usually requires less management over-sight than internally collected data. That said, briefing enumerators is impor-tant in ensuring a successful data collection process. External enumerators need to be aware of the sensitivities and codes of conduct of the International Red Cross and Red Crescent Movement regarding data protection.
As with any data collection, it is important that respondents give their informed consent before the interview and that surveys are conducted in an ethical manner, keeping in mind cultural sensitivities. For a list of key standards and practices for ethical data collection, refer to IFRC’s Project/Programme Monitoring and Evaluation Guide (page 20).
Ste
ps to
Set
up
and
Man
age
a
Sys
tem
atic
Fee
dbac
k S
yste
m
26
International Federation of Red Cross and Red Crescent Societies
How to Establish and Manage a Systematic Community Feedback Mechanism
Data collection through SurveyGizmo at the Austrian Red Cross
Reviewing different options for feedback collection, the Austrian Red Cross RFL team decided to test Survey-Gizmo as a data collection and analysis tool for its staff and client surveys.
The team set up the staff survey in both English and German and sent out the link via email to all staff members with the invitation to participate. The survey was estimated to take 3–4 minutes to fill in. The RFL team was then able to produce a real-time SurveyGizmo report with key findings in PDF format with the click of a button. For a more detailed analysis, the data can be downloaded and copied into an excel file.
Online data collection was not seen as an appropriate collection option for the client survey with refugees due to internet access constraints and varying degrees of computer literacy. To reduce courtesy bias, the team decided that each client should be interviewed by a Red Cross staff member who was not affiliated to the client (e.g. not the client’s counsellor) either face-to-face or by telephone. The RFL team, in this scenario, used SurveyGizmo for data aggregation. Data was collected either with pen and paper and then transferred into SurveyGizmo or directly entered into the platform using a mobile device while conducting the survey. It is possible to use SurveyGizmo on a laptop, tablet or smartphone in offline or online mode. The results were then available in a PDF format or as an excel file.
The role of cultural mediators
Cultural mediators are playing a crucial role in the response to the recent increase in the number of migrants and refugees in many European countries. They act as interpreters, inform migrants about their rights and the services available in their country of arrival and generally act as bridges between migrants and local authorities. They also act as bridges between humanitarian organizations and migrants and therefore have an important role to play in feedback mechanisms.
For the Italian Red Cross, cultural mediators have been vital in both, translating questionnaires into local dialects (note that it might not be possible to ensure that the questionnaire is translated into all dialects in advance), and in building a relationship with migrants. The relationship has established a sense of trust that in turn has made migrants feel safe and comfortable to give potentially critical and honest feedback. The presence of this trust can be instrumental at key points in the feedback cycle when:
• Collecting data, i.e. acting as first point of contact to receive feedback.
• Making sense of the data together, i.e. engaging migrants in validating the feedback and identifying insights around potential solutions.
• Reporting back to migrants about the actions the Red Cross is planning to take in response to the feedback received.
Tips for migration programmes
Tailor the data collection method to your audience Face-to-face data collection may be best for migrants in camps and at reception centres, whereas SMS surveys and enumerated calls might work well with host communities.
Tips for migration programmes
Plan the survey in multiple languages to cover the main nationalities of migrants To obtain candid results, it is important that survey respondents can answer the questions in the language they are most comfortable with. For ease of data collection and consistency, translate the questionnaire into all key languages before the planned survey. If it is not possible to find data collectors that speak the necessary languages, an interpreter can help to conduct the interviews and translate answers to open-ended questions.
©Ba
rt V
erw
eij/
IFR
C
Steps to S
et up and Manage
a System
atic Feedback System
27
International Federation of Red Cross and Red Crescent Societies
Steps to Set up and Manage a Systematic Feedback System
©Ba
rt V
erw
eij/
IFR
C
Step 3: Data preparation
This section will outline some useful tips for data analysis and describe how to best visualize different kinds of analyses.
Understanding the responses in your sample
The most obvious thing to look at after conducting a survey is the basic distri-bution of responses. Here is a list of questions to consider when looking at the distribution:
• Have people responded as you thought they would?• Does a specific question stand out in some way?• Did different groups in your sample respond to the same question differently?
For example, did men respond differently from women or did young people respond differently to older people?
• If you collected data from more than one location, are responses different from one place to another?
• If you have collected more than one round of data, do responses change over time?
It might also be interesting to see to what extent items correlate with one an-other. Do people who respond with high values on one question also respond with high values on another question?
Refer to Annex 9 for the automated spreadsheet in excel to easily create overview tables, means and graphs for your data.
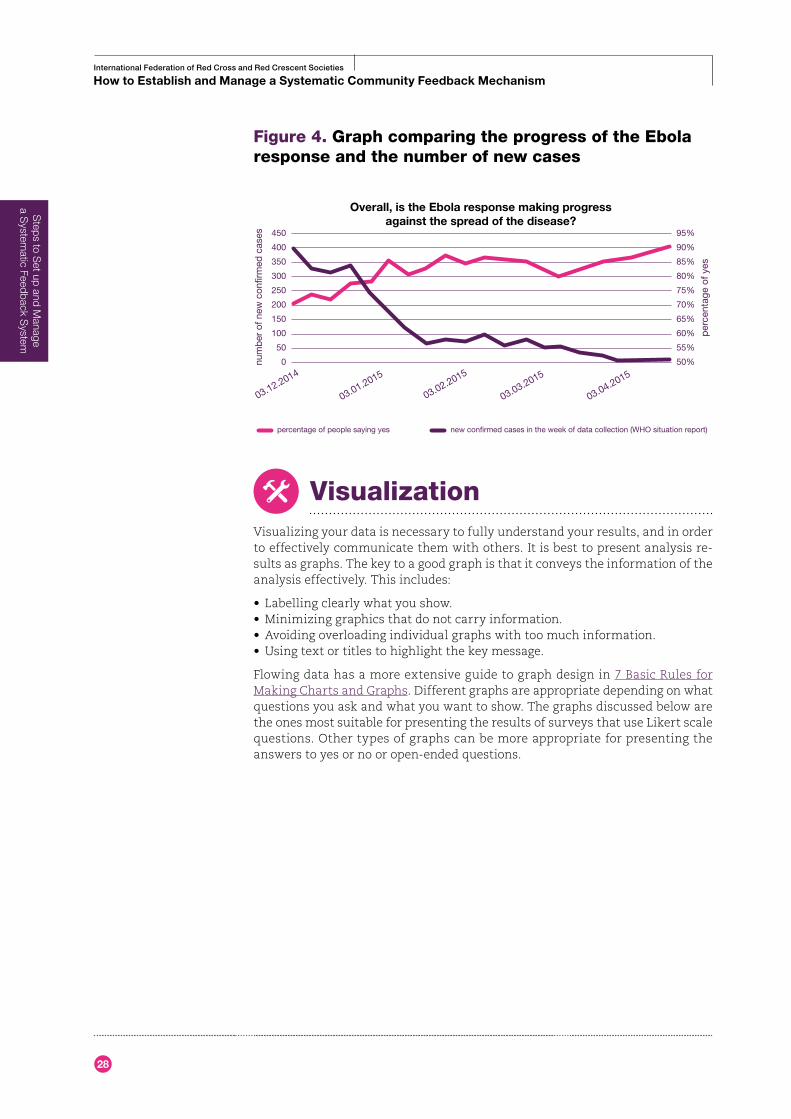
TriangulationWhile perception-based surveys bring a unique perspective when evaluating humanitarian action, they can also favourably be combined with other sources of information. The process of comparing an attitude marker against some objective criterion, or in more general terms to combine several methods to cast light upon a topic, is called triangulation. For example, the graph below compares the percentages of respondents who thought the Ebola response was making progress against the spread of the disease to the number of confirmed new cases by the World Health Organization. The two are negatively related, so people’s perceptions did match reality.
Ste
ps to
Set
up
and
Man
age
a
Sys
tem
atic
Fee
dbac
k S
yste
m
28
International Federation of Red Cross and Red Crescent Societies
How to Establish and Manage a Systematic Community Feedback Mechanism
Figure 4. Graph comparing the progress of the Ebola response and the number of new cases
VisualizationVisualizing your data is necessary to fully understand your results, and in order to effectively communicate them with others. It is best to present analysis re-sults as graphs. The key to a good graph is that it conveys the information of the analysis effectively. This includes:
• Labelling clearly what you show.• Minimizing graphics that do not carry information.• Avoiding overloading individual graphs with too much information.• Using text or titles to highlight the key message.
Flowing data has a more extensive guide to graph design in 7 Basic Rules for Making Charts and Graphs. Different graphs are appropriate depending on what questions you ask and what you want to show. The graphs discussed below are the ones most suitable for presenting the results of surveys that use Likert scale questions. Other types of graphs can be more appropriate for presenting the answers to yes or no or open-ended questions.
450
400
350
300
250
200
150
100
50
0
95%
90%
85%
80%
75%
70%
65%
60%
55%
50%
03.12.2014
03.01.2015
03.02.2015
03.03.2015
03.04.2015
num
ber
of n
ew c
onfir
med
cas
es
per
cent
age
of y
es
percentage of people saying yes new confirmed cases in the week of data collection (WHO situation report)
Overall, is the Ebola response making progress against the spread of the disease?
Steps to S
et up and Manage
a System
atic Feedback System
29
International Federation of Red Cross and Red Crescent Societies
Steps to Set up and Manage a Systematic Feedback System
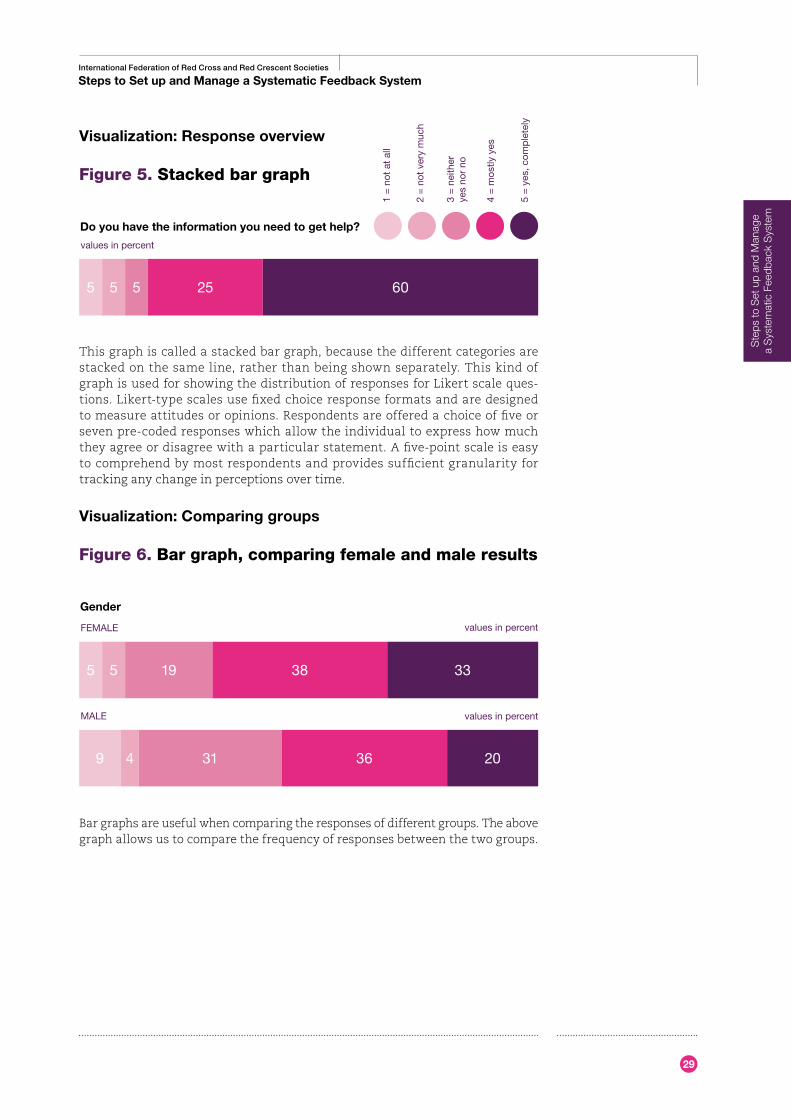
Visualization: Response overview
Figure 5. Stacked bar graph
This graph is called a stacked bar graph, because the different categories are stacked on the same line, rather than being shown separately. This kind of graph is used for showing the distribution of responses for Likert scale ques-tions. Likert-type scales use fixed choice response formats and are designed to measure attitudes or opinions. Respondents are offered a choice of five or seven pre-coded responses which allow the individual to express how much they agree or disagree with a particular statement. A five-point scale is easy to comprehend by most respondents and provides sufficient granularity for tracking any change in perceptions over time.
Visualization: Comparing groups
Figure 6. Bar graph, comparing female and male results
Bar graphs are useful when comparing the responses of different groups. The above graph allows us to compare the frequency of responses between the two groups.
5 5 25 605
Do you have the information you need to get help?
1 =
not
at
all
values in percent
2 =
not
ver
y m
uch
3 =
nei
ther
ye
s no
r no
4 =
mos
tly y
es
5 =
yes
, com
ple
tely
5
9
19
31
38
36
33
20
5
4
Gender
FEMALE
MALE
Ste
ps to
Set
up
and
Man
age
a
Sys
tem
atic
Fee
dbac
k S
yste
m
values in percent
values in percent
30
International Federation of Red Cross and Red Crescent Societies
How to Establish and Manage a Systematic Community Feedback Mechanism
Visualization: Correlations
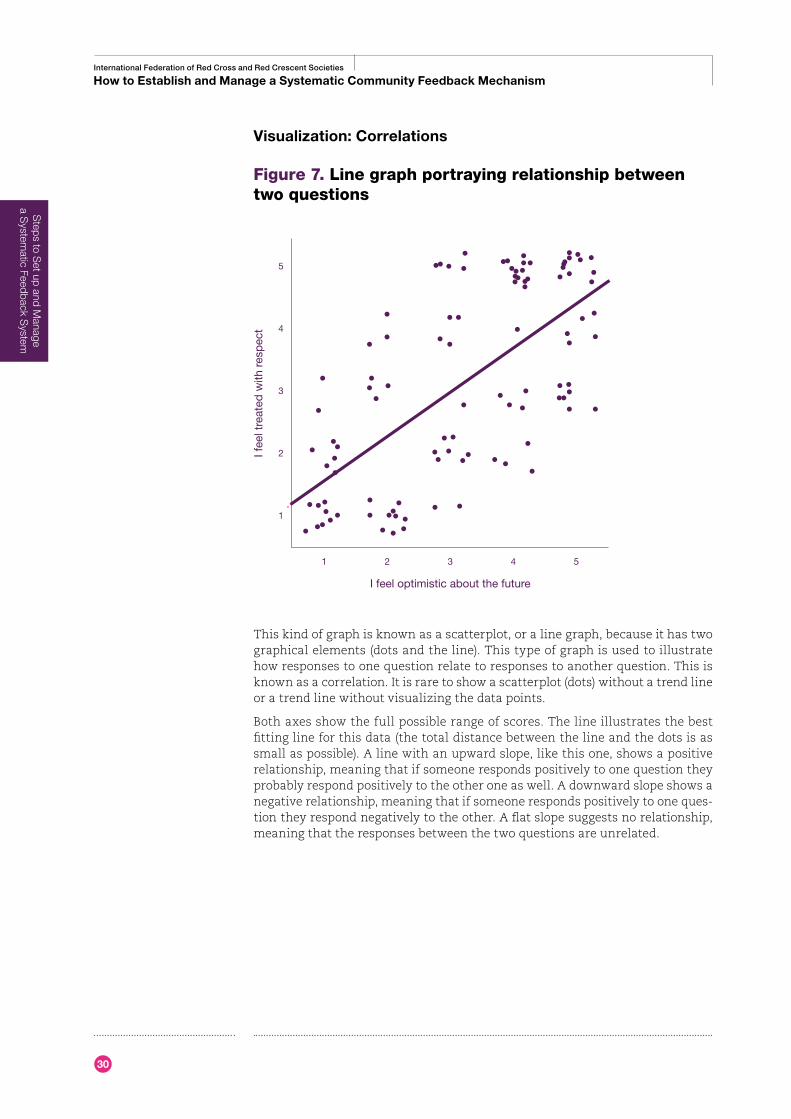
Figure 7. Line graph portraying relationship between two questions
This kind of graph is known as a scatterplot, or a line graph, because it has two graphical elements (dots and the line). This type of graph is used to illustrate how responses to one question relate to responses to another question. This is known as a correlation. It is rare to show a scatterplot (dots) without a trend line or a trend line without visualizing the data points.
Both axes show the full possible range of scores. The line illustrates the best fitting line for this data (the total distance between the line and the dots is as small as possible). A line with an upward slope, like this one, shows a positive relationship, meaning that if someone responds positively to one question they probably respond positively to the other one as well. A downward slope shows a negative relationship, meaning that if someone responds positively to one ques-tion they respond negatively to the other. A flat slope suggests no relationship, meaning that the responses between the two questions are unrelated.
I fee
l tre
ated
with
res
pec
t
I feel optimistic about the future
5
4
3
2
1
1 2 3 4 5
Steps to S
et up and Manage
a System
atic Feedback System
31
International Federation of Red Cross and Red Crescent Societies
Steps to Set up and Manage a Systematic Feedback System
Visualization: Changes over time
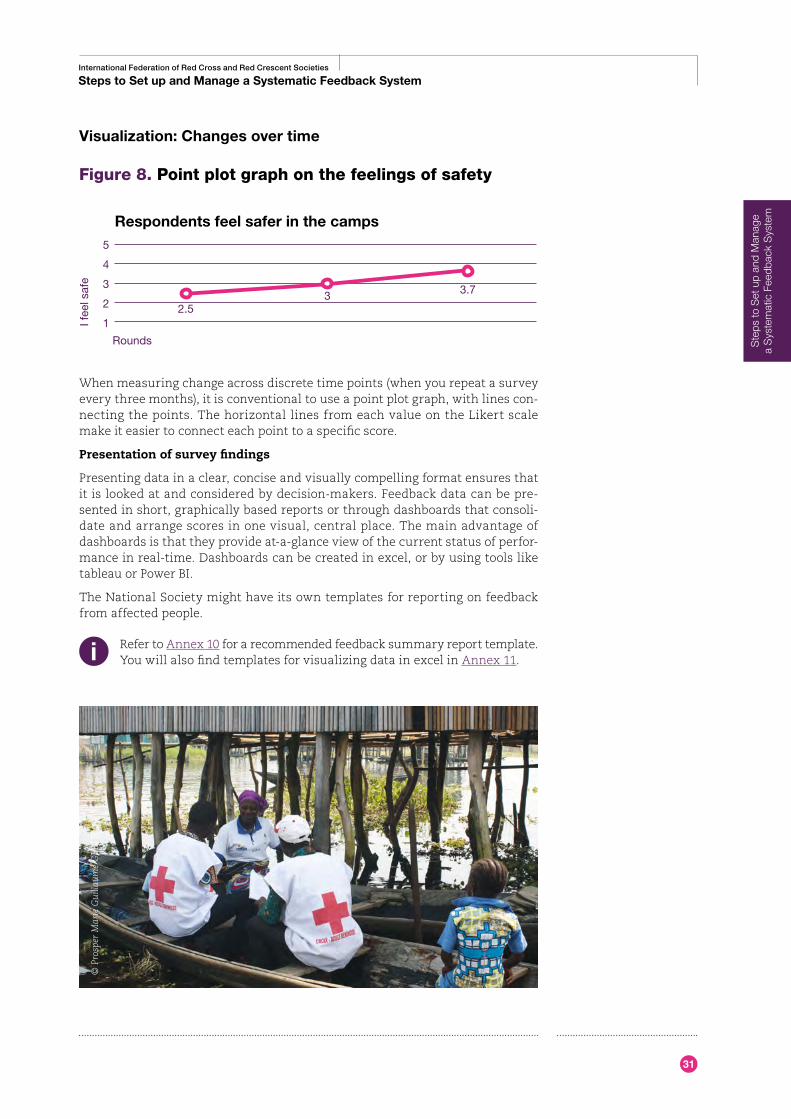
Figure 8. Point plot graph on the feelings of safety
When measuring change across discrete time points (when you repeat a survey every three months), it is conventional to use a point plot graph, with lines con-necting the points. The horizontal lines from each value on the Likert scale make it easier to connect each point to a specific score.
Presentation of survey findings
Presenting data in a clear, concise and visually compelling format ensures that it is looked at and considered by decision-makers. Feedback data can be pre-sented in short, graphically based reports or through dashboards that consoli-date and arrange scores in one visual, central place. The main advantage of dashboards is that they provide at-a-glance view of the current status of perfor-mance in real-time. Dashboards can be created in excel, or by using tools like tableau or Power BI.
The National Society might have its own templates for reporting on feedback from affected people.
Refer to Annex 10 for a recommended feedback summary report template. You will also find templates for visualizing data in excel in Annex 11.
5
4
3
2
1
Respondents feel safer in the camps
2.53 3.7
Ste
ps to
Set
up
and
Man
age
a
Sys
tem
atic
Fee
dbac
k S
yste
m
© P
rosp
er M
arie
Gui
llaum
e G
BET
IEI f
eel s
afe
Rounds
32
International Federation of Red Cross and Red Crescent Societies
How to Establish and Manage a Systematic Community Feedback Mechanism
Step 4: Dialogue
This section will guide you through the essential steps of discussing the data, together with affected people, co-creating solutions, and communicating any programme adjustments.
What is the purpose of dialogue?
Dialoguing with communities and other constituents about what the data says and what the National Society plans to do about it is an essential part of the process for two reasons.
First, like the initial dialoguing with communities about the question formula-tion, it allows you to have a reality check as to whether the analysis and inter-pretation of the data is right and resonates with communities. It also helps you deepen your understanding of the feedback and determine what adjustments make sense, based on the data.
Second, this process is important as so much of the monitoring and evaluation practice is extractive. Affected people repeatedly report that they have no idea where the information they provide goes or how it is used. Nor do they have an opportunity to provide feedback on whether organizations "got it right." Getting into a participatory analysis with them about the findings helps mitigate the one-sided nature of most types of monitoring and evaluation.
Steps to S
et up and Manage
a System
atic Feedback System
© I
FRC
33
International Federation of Red Cross and Red Crescent Societies
Steps to Set up and Manage a Systematic Feedback System
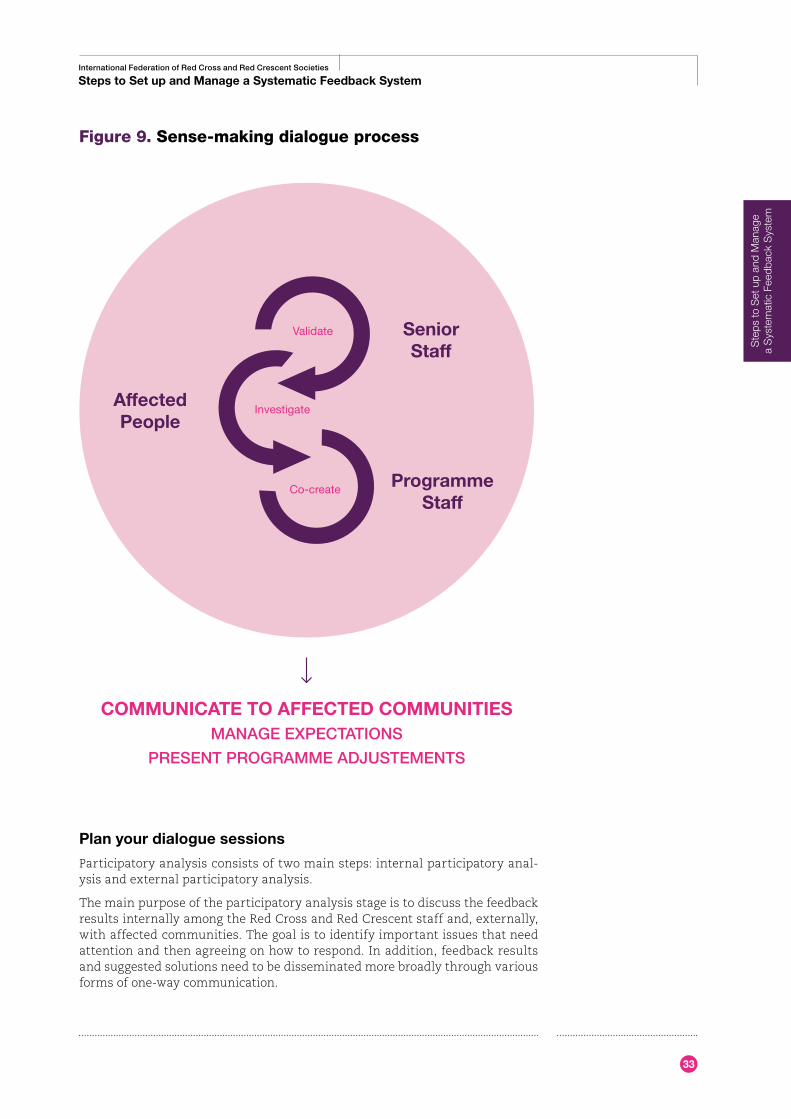
Figure 9. Sense-making dialogue process
Plan your dialogue sessions
Participatory analysis consists of two main steps: internal participatory anal-ysis and external participatory analysis.
The main purpose of the participatory analysis stage is to discuss the feedback results internally among the Red Cross and Red Crescent staff and, externally, with affected communities. The goal is to identify important issues that need attention and then agreeing on how to respond. In addition, feedback results and suggested solutions need to be disseminated more broadly through various forms of one-way communication.
Data Preparation
Data Collection
DialogueAction
Design
Validate
Investigate
Co-create
Affected People
COMMUNICATE TO AFFECTED COMMUNITIESMANAGE EXPECTATIONS
PRESENT PROGRAMME ADJUSTEMENTS
SeniorStaff
ProgrammeStaff
Ste
ps to
Set
up
and
Man
age
a
Sys
tem
atic
Fee
dbac
k S
yste
m
34
International Federation of Red Cross and Red Crescent Societies
How to Establish and Manage a Systematic Community Feedback Mechanism
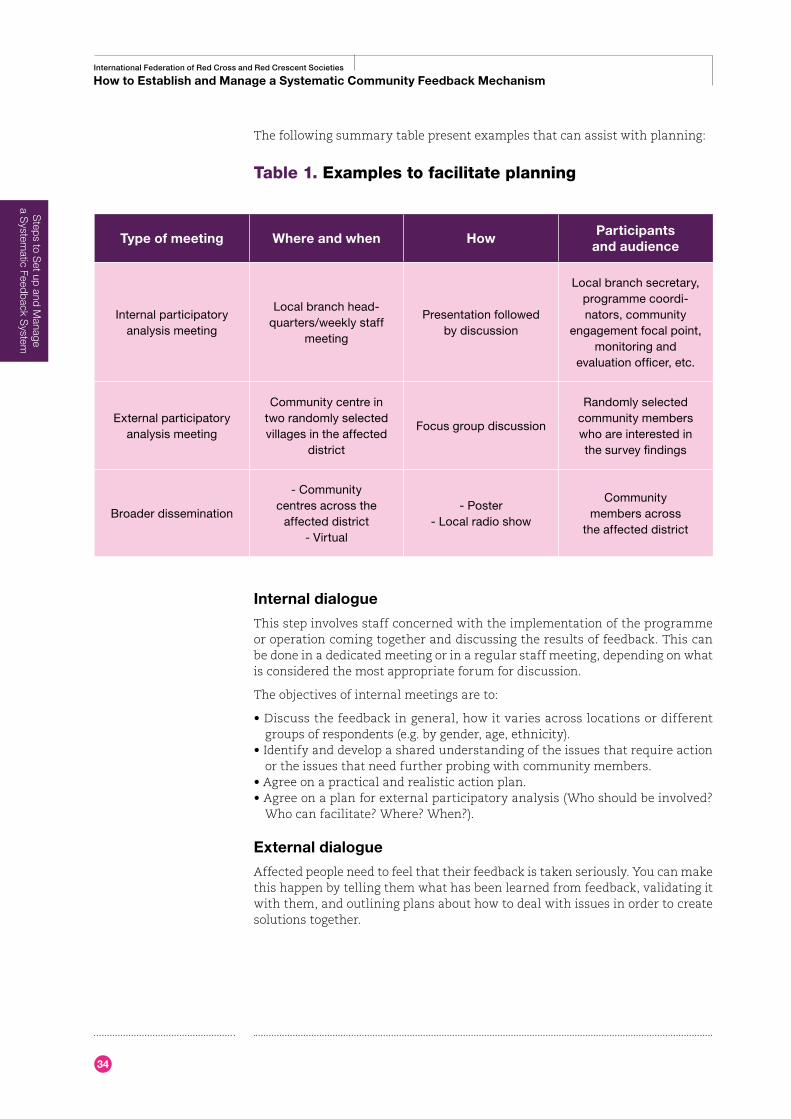
The following summary table present examples that can assist with planning:
Table 1. Examples to facilitate planning
Internal dialogue
This step involves staff concerned with the implementation of the programme or operation coming together and discussing the results of feedback. This can be done in a dedicated meeting or in a regular staff meeting, depending on what is considered the most appropriate forum for discussion.
The objectives of internal meetings are to:
• Discuss the feedback in general, how it varies across locations or different groups of respondents (e.g. by gender, age, ethnicity).
• Identify and develop a shared understanding of the issues that require action or the issues that need further probing with community members.
• Agree on a practical and realistic action plan.• Agree on a plan for external participatory analysis (Who should be involved?
Who can facilitate? Where? When?).
External dialogue
Affected people need to feel that their feedback is taken seriously. You can make this happen by telling them what has been learned from feedback, validating it with them, and outlining plans about how to deal with issues in order to create solutions together.
Type of meeting Where and when HowParticipants
and audience
Internal participatory analysis meeting
Local branch head-quarters/weekly staff
meeting
Presentation followed by discussion
Local branch secretary, programme coordi-nators, community
engagement focal point, monitoring and
evaluation officer, etc.
External participatory analysis meeting
Community centre in two randomly selected villages in the affected
district
Focus group discussion
Randomly selected community members who are interested in the survey findings
Broader dissemination
- Community centres across the
affected district- Virtual
- Poster- Local radio show
Community members across
the affected district
Steps to S
et up and Manage
a System
atic Feedback System
35
International Federation of Red Cross and Red Crescent Societies
Steps to Set up and Manage a Systematic Feedback System
The objectives of external meetings are to:
• Communicate and discuss the results of the feedback provided.• Clarify any issues that came up, and find out about any additional information
you may need (What are people’s particular concerns, and why?).• Communicate and discuss what you are planning to do in order to address
potential issues.
Remember, if no action is possible, you should tell people why this is so. Candour is central to accountability and transparency.
For a guide with helpful definitions, steps and worksheets for internal and external participatory analysis meetings, refer to Annex 12.
How to conduct external dialogue
Once you have identified the main issues you would like to explore through fur-ther participatory analysis with affected communities, it is time to look at ways you can engage with them.
Too often this stage of the feedback cycle is overlooked because of competing priorities, yet it is a crucial link in the accountability chain. It requires a good deal of attention and should be organized in a way that is manageable for pro-gramme teams and not a burden on the affected people.
Options for participatory analysis go beyond traditional discussions with com-munities. Alternative approaches to closing the feedback loop should be ex-plored, particularly in settings that imply logistical or other constraints.
Broader communication
Alongside external participatory analysis that requires a form of two-way com-munication between the National Society and communities, the feedback re-sults and corrective actions need to be communicated more broadly to affected communities.
When identifying suitable channels to disseminate feedback results to a broader audience, you can think of instances where the Red Cross and Red Crescent al-ready communicates with communities. Options could include:
• posters at centres and other relevant locations (i.e. counselling centres, youth centres)
• announcements at distribution points• dissemination of information through community committees• radio• video visuals• community meetings
When considering different options, think about how you can ensure that your communication reaches everyone in the community. Not everyone will be able to read a poster on a wall or will have access to a mobile phone to receive a SMS message. Aspects of inclusion and exclusion of vulnerable groups in public spaces, power relations and literacy are important to keep in mind when plan-ning your communication strategy.
The participatory analysis stage concludes with thinking about following-up on the feedback. This, in turn, leads to programme adjustments, the final stage of the feedback cycle.
Ste
ps to
Set
up
and
Man
age
a
Sys
tem
atic
Fee
dbac
k S
yste
m
36
International Federation of Red Cross and Red Crescent Societies
How to Establish and Manage a Systematic Community Feedback Mechanism
©IF
RC
Tips for migration programmes
Use existing instances for participatory analysis with migrantsTo discuss the results of survey findings, you can think of instances where the National Society already engages with migrants. These might include briefings, trainings or individual follow-up/case closure. Remember, you do not need to go back to the same persons that took part in the survey, but to the same areas where data collec-tion took place.
Continue the cycle with newly arrived migrants Conducting participatory analysis when people are on the move can be challenging. By the time the survey find-ings are analysed and discussed among staff, migrants might have moved on, which means that they will not have heard back about the results of the survey nor will they have benefitted from improvements. To mitigate this, keep the surveys short so that data analysis can be completed quickly and the results shared with migrants without delay, thus closing the loop.
In settings where migrants only stay for a short period of time, newcomers can still be engaged in discussing the results of a previous survey and help clarify what might be the reasons behind any positive or negative scores. In such a scenario, the National Society can emphasize that the benefits will be for the next group and that they will have benefitted from the feedback provided by previous groups. This can provide incentives for people to give feedback and engage in a participatory analysis.
Engage host communities in discussions about migrant perceptionsDisseminating findings about migrants’ perceptions to the host community and engaging the general public in a debate about migration can be a powerful tool to promote solidarity and social cohesion.
Closing the loop with migrant populations in Italy
After the second round of data collection, the Red Cross team in the Fenoglio reception centre in Northern Italy organized a dedicated meeting, together with Ground Truth Solutions, to discuss the survey findings and next steps for sharing the results with the people staying in the centre. The team identified instances where migrants regularly come together, for example, during Italian lessons held at the centre, lunchtime or at the call centre where people go to call their friends or family members. These occasions provide opportunities to report back and validate the survey findings at regular intervals without making the process too onerous for Red Cross staff and volunteers or migrants.
For the Red Cross safe point in Catania, Sicily, the concept of external participatory analysis needed some con-textualization before it could be put into practice. Engaging short-term visitors in participatory analysis about survey findings presented a challenge. It was important to think about options that did not require much time from individuals who would come to the safe point with a specific problem or question and leave shortly after they received the support or answer to their question. Rather than arranging discussions about the data, an alternative solution that was identified was to investigate any issues by phasing in and out additional questions to the four-question survey.
These follow-up questions can change over time depending on what the data suggests and they could be phased out once the underlying issues are understood. Besides probing deeper into some of the survey findings, reporting back the findings more broadly to the people visiting the centre was also important for promoting participation and avoiding survey fatigue. One way to do this is to present the results of the survey through simple posters.
Steps to S
et up and Manage
a System
atic Feedback System
37
©IF
RC
International Federation of Red Cross and Red Crescent Societies
Steps to Set up and Manage a Systematic Feedback System
Step 5: Action
This section will outline useful principles that are worth considering when im-plementing changes to Red Cross and Red Crescent actions based on feedback.
The collected data can only go so far as to identify the problems and make recommendations about how to change course.
The crucial part is to adjust the programme or operation based on the informa-tion received and analysed. Acting on the feedback received from the people you are serving not only results in better outcomes but also leads to further strengthening the relationship and increased participation from their side.
A regular stream of perceptual data is both a useful metric to check if changes are leading to more positive perceptions of affected people and also a great way to show donors the programme is making a positive difference, and moving in the right direction.
Challenges for implementing programme adjustments might include internal factors such as staff capacity or external ones such as restrictions imposed by the donors.
What actions can you take?This important last stage of the feedback cycle is sometimes easier said than done. While there are no set rules, there are a number of principles and pro-cesses that can be worth bearing in mind.
For the purpose of action, focus on the three A’s:
• address• advocate• appraise
Address
Tackle the issues raised and discussed through dialogue as soon as possible. These changes may straddle the short-, medium- and long-term. You may be able to take short-term action immediately, while medium- and longer-term actions may require policy change. It is important that you communicate the time frame for specific corrective actions to affected people in order to manage their expectations. Remember that sometimes the process is just as important as the results. If communities feel listened to, they are more likely to appreciate what you do. You must keep pushing until you get it right – while explaining the constraints you face as openly and honestly as possible.
Ste
ps to
Set
up
and
Man
age
a
Sys
tem
atic
Fee
dbac
k S
yste
m
38
International Federation of Red Cross and Red Crescent Societies
How to Establish and Manage a Systematic Community Feedback Mechanism
Advocate
You may not be able to make all possible changes. There may be constraints; either time, funding or capacity. Some of the feedback might also relate to is-sues that are beyond the mandate of the Red Cross and Red Crescent, e.g. issues related to the wider policy environment, and might not be directly actionable by the National Society. Taking action often involves using the data as an advocacy tool, to leverage change and improvements by others. When you use the data to push for change, be sure to demonstrate that it is robust and explain how you have validated it with communities. This will help ensure buy-in to the process.
Appraise and adjust the feedback system
The changes might relate to the questions asked or the way they are asked. The appraisal can also look at how the data has been used, what additional analysis would be useful and what else you might have done to respond. If any weak-nesses are linked to how the National Society uses or does not use the data, this should be discussed internally.
The following questions can help you during the redesign of the content:
• Which of the questions do you think need to be rephrased, if any? Were af-fected people interpreting it as you had intended them to?
• Are there any questions you want to remove from the survey?• Would you like to follow-up on any of the existing questions? Are there any
additional questions you would like to include?
It is important that you document what actions you plan to take, either through adjustments in the programme or through advocacy with other actors that can address the issues that are beyond your mandate or capacity.
Tips for migration programmes
Check that your questions are still relevantAs the migration context changes over time, before each round of data collection, verify that the questions still are relevant to migrant communities and amenable to action by the International Red Cross and Red Crescent Movement.
Dealing with feedback on migration policies in Austria
The first staff survey conducted by the Austrian Red Cross’ RFL department in April 2017 surfaced some perceptions about refugees’ expectations that at time exceeded what the Red Cross can do for them. While there was a general sense that the opinions of clients could mostly be taken into account, some staff members noted that clients would time and again ask if the Red Cross could expedite the family reunification process or find ways to bring family members to Austria. However, it is not possible to do so under the asylum law. These requests are beyond the mandate of the Red Cross. The survey findings illustrated the importance of clearly communicating to refugees what support they can expect from the Red Cross and opened a discussion within the RFL team about whether more could be done to improve this communication.
The RFL team is also conducting surveys with clients themselves that might provide additional insight into the expectations of refugees towards the Red Cross. Feedback from refugees might also identify impediments in the family reunification process that the Red Cross, together with other non-governmental organizations, could use for advocacy with policy-makers.
Steps to S
et up and Manage
a System
atic Feedback System
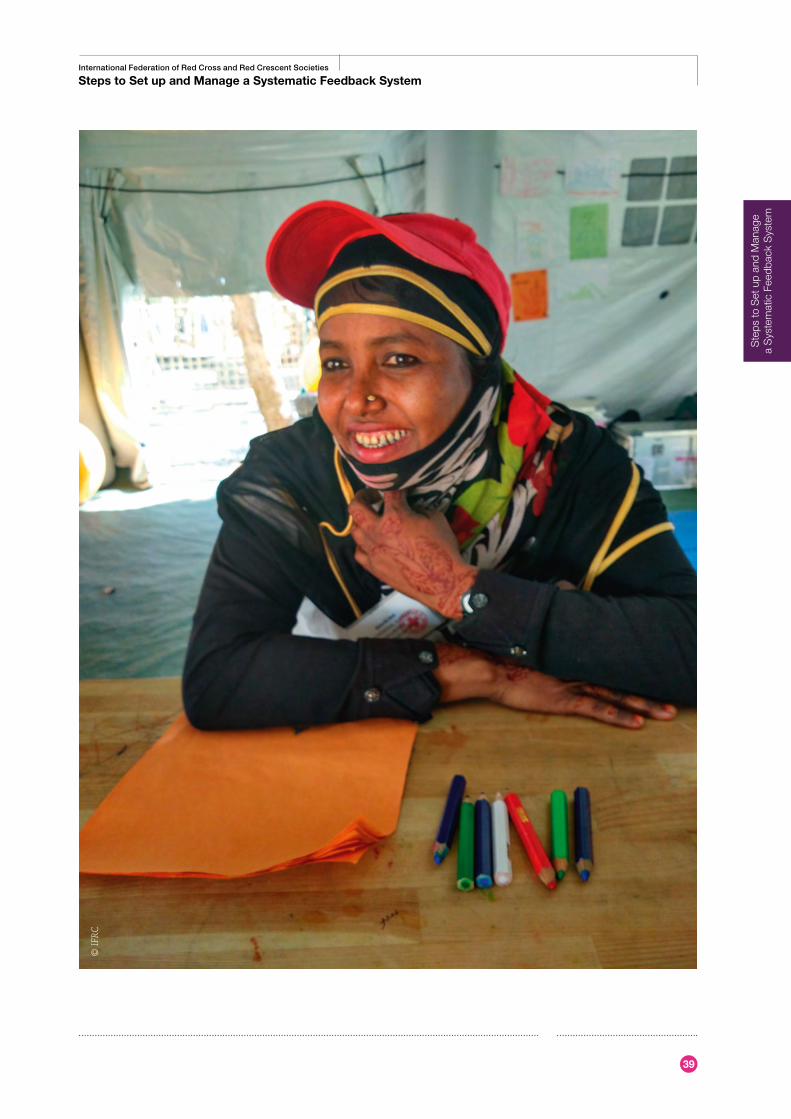
39
International Federation of Red Cross and Red Crescent Societies
Steps to Set up and Manage a Systematic Feedback System
Ste
ps to
Set
up
and
Man
age
a
Sys
tem
atic
Fee
dbac
k S
yste
m
© I
FRC
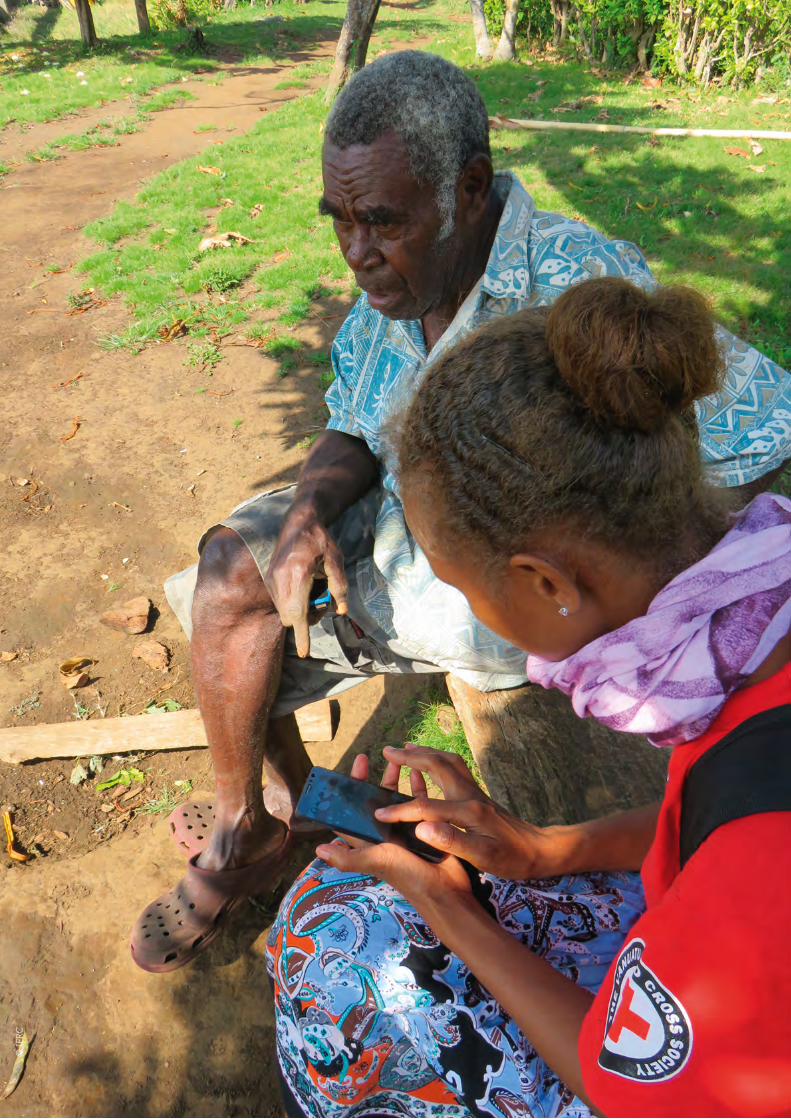
40
International Federation of Red Cross and Red Crescent Societies
Road map to community resilience Operationalizing the Framework for Community Resilience
© I
FRC
Ann
exes
International Federation of Red Cross and Red Crescent Societies
Annexes
Annex 1: Design workshop — facilitator's quick guide Two-day workshop
Objective of the workshop
The overall objective of the workshop is to design a feedback mechanism for the migration programme(s) of [X] National Society. Through this mechanism, the National Society will collect feedback from migrants (and host communities), and respond to their feedback. The goal is to increase the National Society’s knowl-edge of migrants’ perceptions of Red Cross and Red Crescent services (and host communities’ acceptance of migrants) in order to enable the National Society to better meet operational objectives.
Specific objectives include:
• Develop understanding of what information the migration programme team would like to know from migrants (and host communities)
• Develop understanding of what incentives and barriers the migration pro-gramme team considers to enable/hinder responsiveness to feedback from migrants (and host communities)
• Design and test the questions that will be asked of migrants (and host com-munity members) at regular intervals
• Identify what are appropriate, feasible and cost-effective data collection methods for collecting feedback from migrants (and host communities)
• Agree on data collection location(s)• Brief National Society volunteers on the data collection process• Discuss methods for dialogue with migrants (and host communities) to vali-
date the feedback and how it will be further communicated.
41
Annexes(All tools are available here)
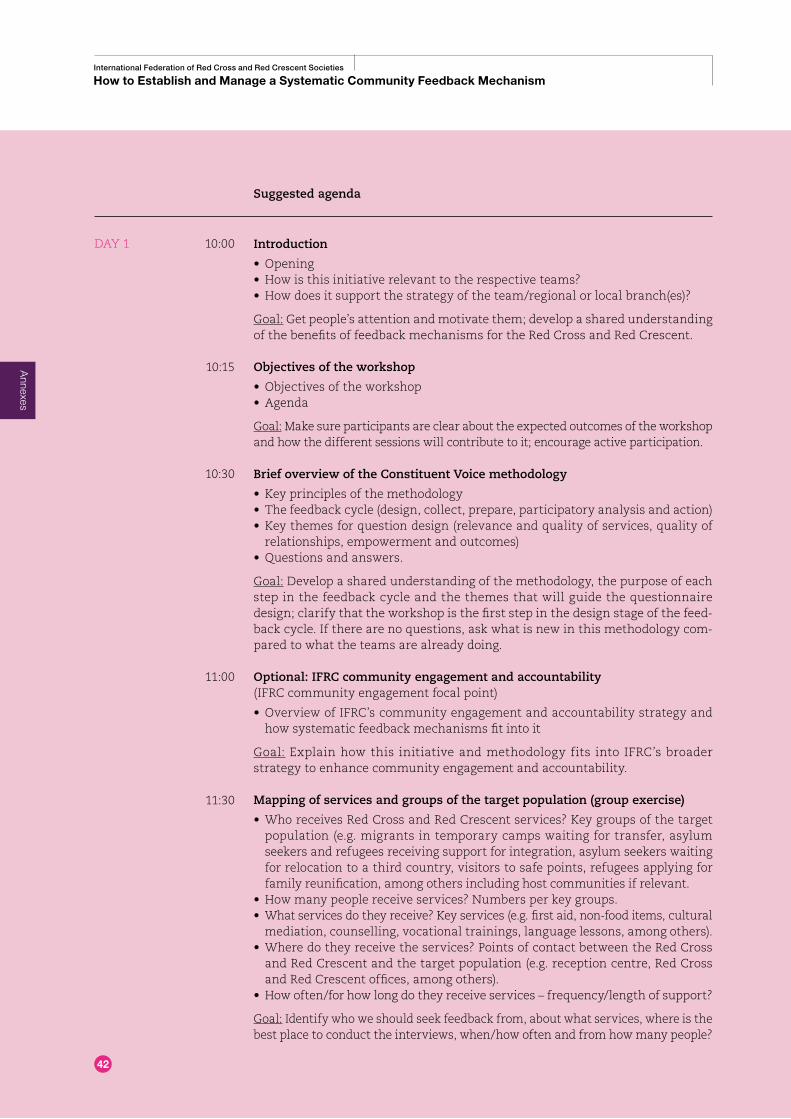
International Federation of Red Cross and Red Crescent Societies
How to Establish and Manage a Systematic Community Feedback Mechanism
Suggested agenda
Introduction
• Opening • How is this initiative relevant to the respective teams? • How does it support the strategy of the team/regional or local branch(es)?
Goal: Get people’s attention and motivate them; develop a shared understanding of the benefits of feedback mechanisms for the Red Cross and Red Crescent.
Objectives of the workshop
• Objectives of the workshop • Agenda
Goal: Make sure participants are clear about the expected outcomes of the workshop and how the different sessions will contribute to it; encourage active participation.
Brief overview of the Constituent Voice methodology
• Key principles of the methodology• The feedback cycle (design, collect, prepare, participatory analysis and action)• Key themes for question design (relevance and quality of services, quality of
relationships, empowerment and outcomes)• Questions and answers.
Goal: Develop a shared understanding of the methodology, the purpose of each step in the feedback cycle and the themes that will guide the questionnaire design; clarify that the workshop is the first step in the design stage of the feed-back cycle. If there are no questions, ask what is new in this methodology com-pared to what the teams are already doing.
Optional: IFRC community engagement and accountability (IFRC community engagement focal point)
• Overview of IFRC’s community engagement and accountability strategy and how systematic feedback mechanisms fit into it
Goal: Explain how this initiative and methodology fits into IFRC’s broader strategy to enhance community engagement and accountability.
Mapping of services and groups of the target population (group exercise)
• Who receives Red Cross and Red Crescent services? Key groups of the target population (e.g. migrants in temporary camps waiting for transfer, asylum seekers and refugees receiving support for integration, asylum seekers waiting for relocation to a third country, visitors to safe points, refugees applying for family reunification, among others including host communities if relevant.
• How many people receive services? Numbers per key groups.• What services do they receive? Key services (e.g. first aid, non-food items, cultural
mediation, counselling, vocational trainings, language lessons, among others).• Where do they receive the services? Points of contact between the Red Cross
and Red Crescent and the target population (e.g. reception centre, Red Cross and Red Crescent offices, among others).
• How often/for how long do they receive services – frequency/length of support?
Goal: Identify who we should seek feedback from, about what services, where is the best place to conduct the interviews, when/how often and from how many people?
42
DAY 1 10:00
10:15
10:30
11:00
11:30
Annexes
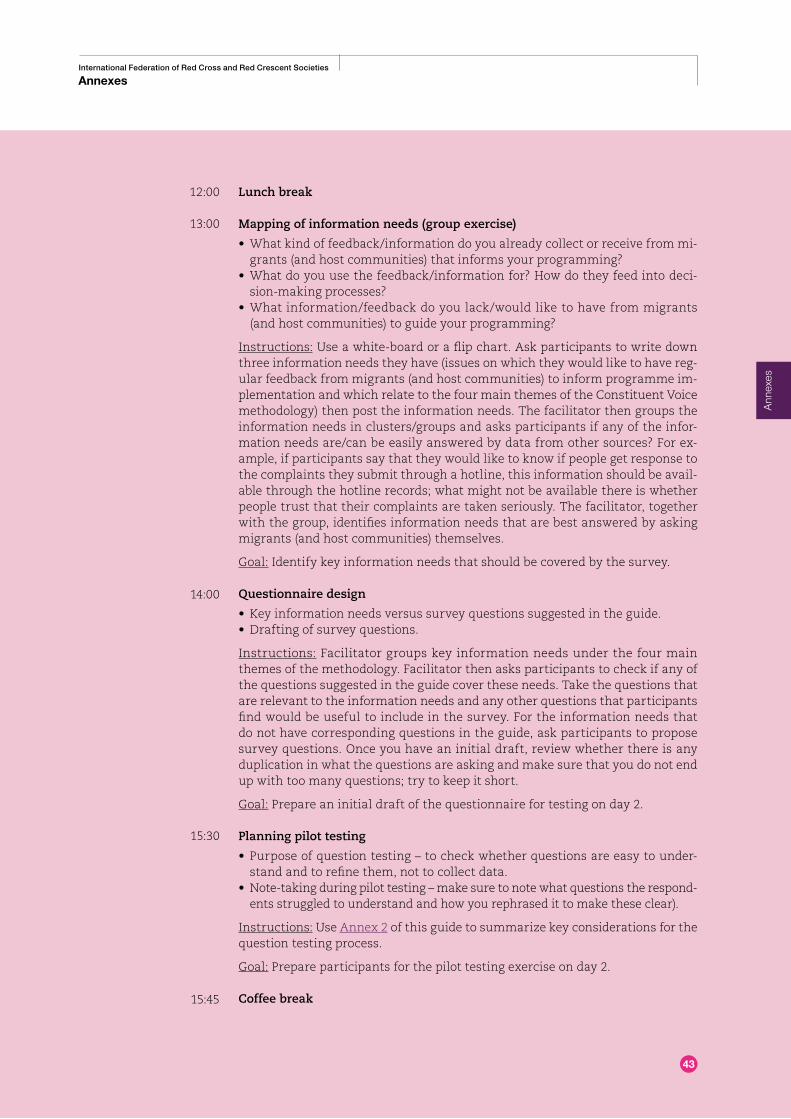
International Federation of Red Cross and Red Crescent Societies
Annexes
Lunch break
Mapping of information needs (group exercise)
• What kind of feedback/information do you already collect or receive from mi-grants (and host communities) that informs your programming?
• What do you use the feedback/information for? How do they feed into deci-sion-making processes?
• What information/feedback do you lack/would like to have from migrants (and host communities) to guide your programming?
Instructions: Use a white-board or a flip chart. Ask participants to write down three information needs they have (issues on which they would like to have reg-ular feedback from migrants (and host communities) to inform programme im-plementation and which relate to the four main themes of the Constituent Voice methodology) then post the information needs. The facilitator then groups the information needs in clusters/groups and asks participants if any of the infor-mation needs are/can be easily answered by data from other sources? For ex-ample, if participants say that they would like to know if people get response to the complaints they submit through a hotline, this information should be avail-able through the hotline records; what might not be available there is whether people trust that their complaints are taken seriously. The facilitator, together with the group, identifies information needs that are best answered by asking migrants (and host communities) themselves.
Goal: Identify key information needs that should be covered by the survey.
Questionnaire design
• Key information needs versus survey questions suggested in the guide.• Drafting of survey questions.
Instructions: Facilitator groups key information needs under the four main themes of the methodology. Facilitator then asks participants to check if any of the questions suggested in the guide cover these needs. Take the questions that are relevant to the information needs and any other questions that participants find would be useful to include in the survey. For the information needs that do not have corresponding questions in the guide, ask participants to propose survey questions. Once you have an initial draft, review whether there is any duplication in what the questions are asking and make sure that you do not end up with too many questions; try to keep it short.
Goal: Prepare an initial draft of the questionnaire for testing on day 2.
Planning pilot testing
• Purpose of question testing – to check whether questions are easy to under-stand and to refine them, not to collect data.
• Note-taking during pilot testing – make sure to note what questions the respond-ents struggled to understand and how you rephrased it to make these clear).
Instructions: Use Annex 2 of this guide to summarize key considerations for the question testing process.
Goal: Prepare participants for the pilot testing exercise on day 2.
Coffee break
43
12:00
13:00
14:00
15:30
15:45
Ann
exes
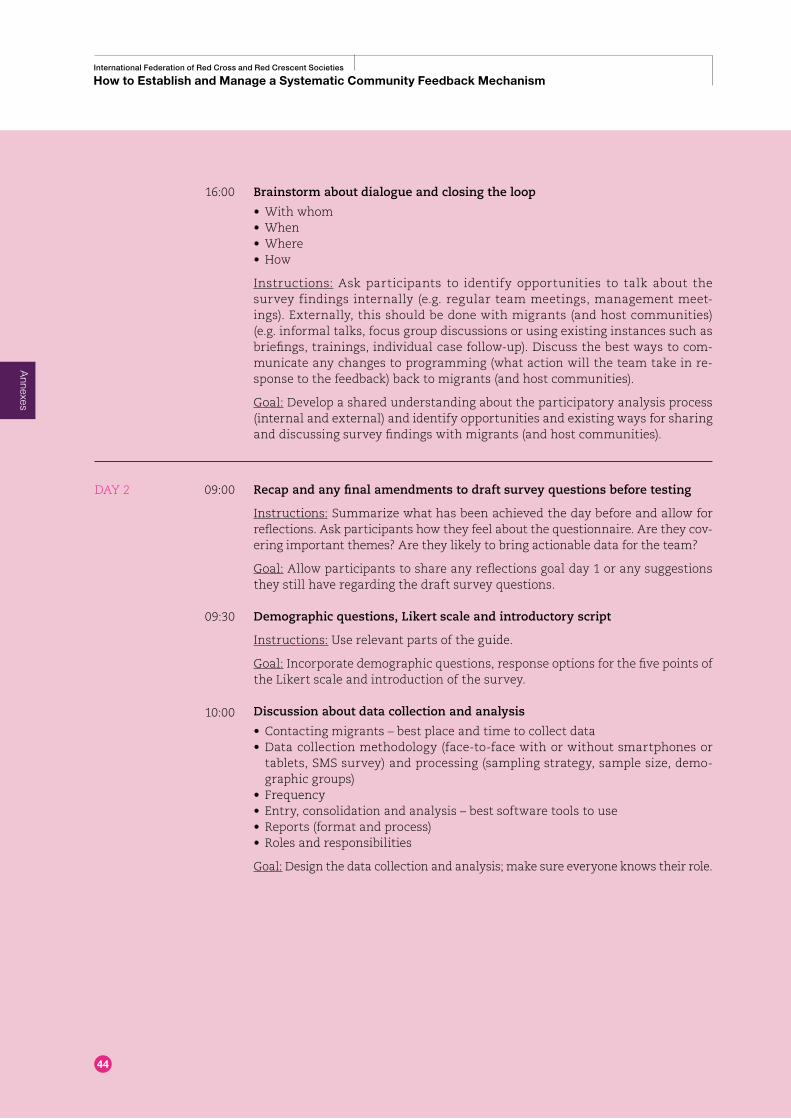
Ann
exes
International Federation of Red Cross and Red Crescent Societies
How to Establish and Manage a Systematic Community Feedback Mechanism
Brainstorm about dialogue and closing the loop
• With whom• When • Where • How
Instructions: Ask participants to identify opportunities to talk about the survey findings internally (e.g. regular team meetings, management meet-ings). Externally, this should be done with migrants (and host communities) (e.g. informal talks, focus group discussions or using existing instances such as briefings, trainings, individual case follow-up). Discuss the best ways to com-municate any changes to programming (what action will the team take in re-sponse to the feedback) back to migrants (and host communities).
Goal: Develop a shared understanding about the participatory analysis process (internal and external) and identify opportunities and existing ways for sharing and discussing survey findings with migrants (and host communities).
Recap and any final amendments to draft survey questions before testing
Instructions: Summarize what has been achieved the day before and allow for reflections. Ask participants how they feel about the questionnaire. Are they cov-ering important themes? Are they likely to bring actionable data for the team?
Goal: Allow participants to share any reflections goal day 1 or any suggestions they still have regarding the draft survey questions.
Demographic questions, Likert scale and introductory script
Instructions: Use relevant parts of the guide.
Goal: Incorporate demographic questions, response options for the five points of the Likert scale and introduction of the survey.
Discussion about data collection and analysis
• Contacting migrants – best place and time to collect data• Data collection methodology (face-to-face with or without smartphones or
tablets, SMS survey) and processing (sampling strategy, sample size, demo-graphic groups)
• Frequency• Entry, consolidation and analysis – best software tools to use• Reports (format and process)• Roles and responsibilities
Goal: Design the data collection and analysis; make sure everyone knows their role.
44
16:00
DAY 2 09:00
09:30
10:00
Annexes
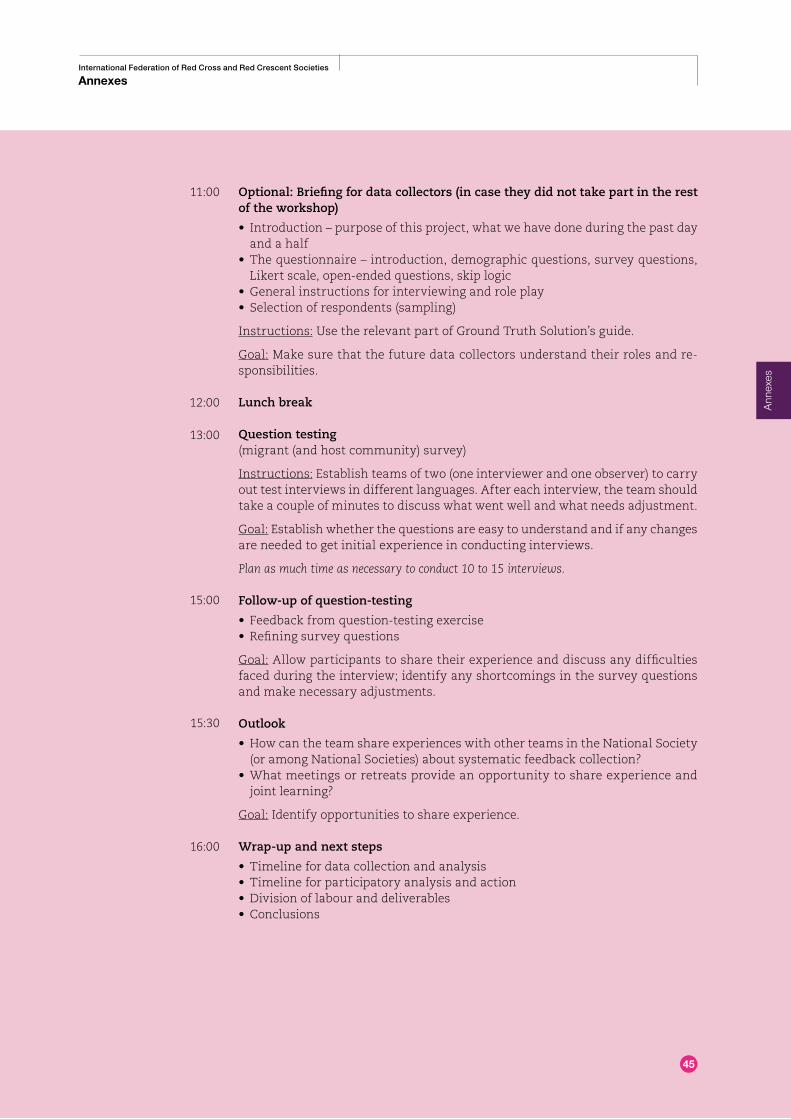
International Federation of Red Cross and Red Crescent Societies
Annexes
Optional: Briefing for data collectors (in case they did not take part in the rest of the workshop)
• Introduction – purpose of this project, what we have done during the past day and a half
• The questionnaire – introduction, demographic questions, survey questions, Likert scale, open-ended questions, skip logic
• General instructions for interviewing and role play• Selection of respondents (sampling)
Instructions: Use the relevant part of Ground Truth Solution’s guide.
Goal: Make sure that the future data collectors understand their roles and re-sponsibilities. Lunch break
Question testing (migrant (and host community) survey)
Instructions: Establish teams of two (one interviewer and one observer) to carry out test interviews in different languages. After each interview, the team should take a couple of minutes to discuss what went well and what needs adjustment.
Goal: Establish whether the questions are easy to understand and if any changes are needed to get initial experience in conducting interviews.
Plan as much time as necessary to conduct 10 to 15 interviews.
Follow-up of question-testing
• Feedback from question-testing exercise• Refining survey questions
Goal: Allow participants to share their experience and discuss any difficulties faced during the interview; identify any shortcomings in the survey questions and make necessary adjustments.
Outlook
• How can the team share experiences with other teams in the National Society (or among National Societies) about systematic feedback collection?
• What meetings or retreats provide an opportunity to share experience and joint learning?
Goal: Identify opportunities to share experience.
Wrap-up and next steps
• Timeline for data collection and analysis • Timeline for participatory analysis and action • Division of labour and deliverables• Conclusions
45
11:00
12:00
13:00
15:00
15:30
16:00
Ann
exes
International Federation of Red Cross and Red Crescent Societies
How to Establish and Manage a Systematic Community Feedback Mechanism
Annex 2: Quick guide to test survey questions in a focus group
• Introduce yourself, your organization and the purpose of the session, which is not to collect data but to reformulate questions if unclear to make sure they are easily understood and relevant to the main issues faced by affected people.
• The questions are simple. State that there are no wrong answers – answering questions is optional and opinions are valued.
• Assure everyone that all information shared remains confidential. No per-sonal data will be collected.
• Ask permission to take notes.• Things to note during the session:
- Do they understand the questions the way you intend them to?- Reactions, general behaviour (confident, shy, afraid, truthful, upset, etc.)- How long individuals take to answer, and how long answers are?- Does the question need to be repeated? How did you rephrase the question if
applicable? If a given question was not understood, did you provide the re-spondent with examples?
- Were the answer-options and scales understood? - Are clarifications centred around one word, a whole sentence, acoustics or au-
ditory difficulties, or the meaning of the question?
• Ask if there is any other information they would like to provide.• At the end of the survey, thank people for taking the time to participate in the survey.
Annex 3: Checklist — survey design This list helps you design a survey
Preparations
• Ensure the purpose of the survey is understood.• Involve all stakeholders in the design.
Question design
• Ensure to cover: relationships, services, empowerment, and outcomes.• Think about the right type for each question, i.e. 1–5 scale, single or multiple
choice, yes or no, or open-ended questions. • To ensure that the response provides you with the required information, the
question must be articulated in a simple and clear way. • Keep it short – only ask questions where you are sure you will use the data.• To avoid unnecessary data analysis, only add open-ended questions where
further insights are needed.• Ensure all questions are formulated as simply as possible.• Include all the demographic variables you want to analyse the data by.
46
Annexes
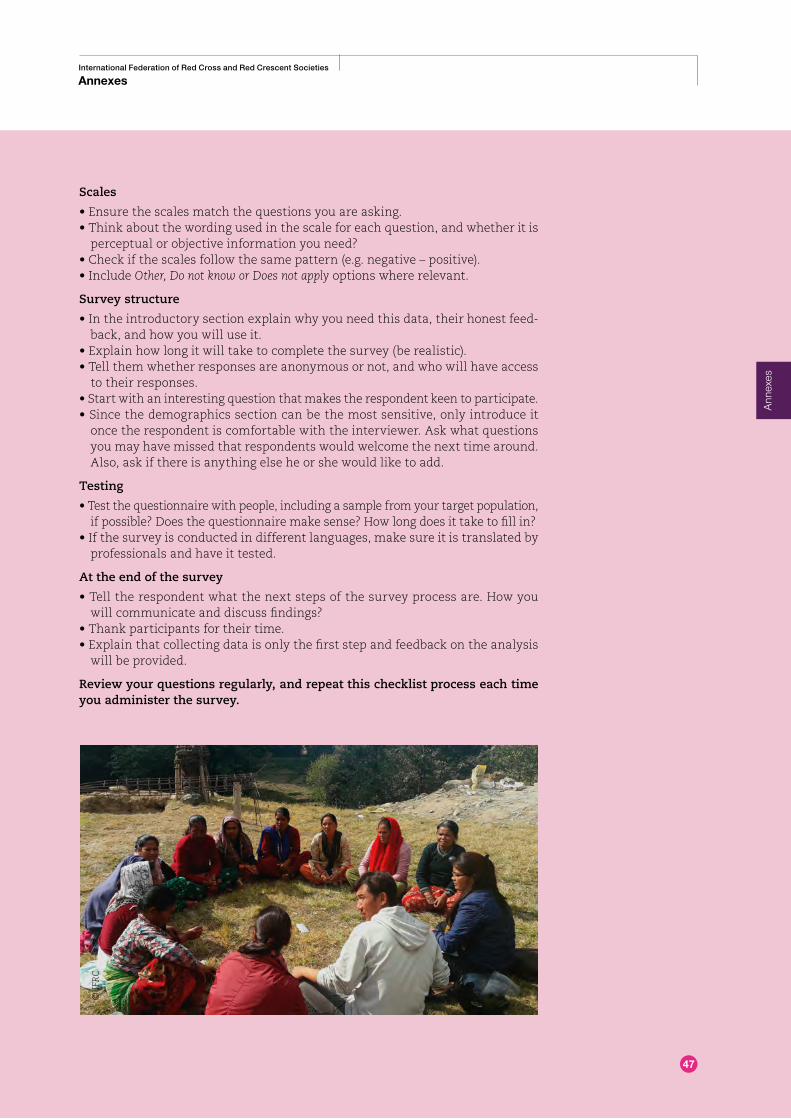
International Federation of Red Cross and Red Crescent Societies
Annexes
Scales
• Ensure the scales match the questions you are asking.• Think about the wording used in the scale for each question, and whether it is
perceptual or objective information you need?• Check if the scales follow the same pattern (e.g. negative – positive).• Include Other, Do not know or Does not apply options where relevant.
Survey structure
• In the introductory section explain why you need this data, their honest feed-back, and how you will use it.
• Explain how long it will take to complete the survey (be realistic).• Tell them whether responses are anonymous or not, and who will have access
to their responses.• Start with an interesting question that makes the respondent keen to participate.• Since the demographics section can be the most sensitive, only introduce it
once the respondent is comfortable with the interviewer. Ask what questions you may have missed that respondents would welcome the next time around. Also, ask if there is anything else he or she would like to add.
Testing
• Test the questionnaire with people, including a sample from your target population, if possible? Does the questionnaire make sense? How long does it take to fill in?
• If the survey is conducted in different languages, make sure it is translated by professionals and have it tested.
At the end of the survey
• Tell the respondent what the next steps of the survey process are. How you will communicate and discuss findings?
• Thank participants for their time.• Explain that collecting data is only the first step and feedback on the analysis
will be provided.
Review your questions regularly, and repeat this checklist process each time you administer the survey.
47
Ann
exes
© I
FRC
Ann
exes
International Federation of Red Cross and Red Crescent Societies
How to Establish and Manage a Systematic Community Feedback Mechanism
Annex 4: Menu of survey questions relevant in a migration context
The following is a suggested list of questions for Red Cross and Red Crescent staff to design their survey.
The questions are grouped under the four main themes of services, relationship, outcomes and empowerment.
Services
• Are your basic needs met in this centre or camp? • Do you have the information you need to access services and/or get help?• Are Red Cross and Red Crescent services relevant to your needs?• Do you think everybody is treated the same way by the Red Cross and Red Crescent?
Relationship
• Do you feel welcome?• Do you trust the information you are receiving?• Do you believe your family reunification counsellors do their best to help you?• Do you feel treated with respect by the Red Cross and Red Crescent staff?• Are people’s opinion taken into account by the staff and volunteers working in
this centre or camp?• Do you feel listened to by Red Cross and Red Crescent staff?• Do you know how to give feedback about the services you receive?• If you have a problem or complaint, do you talk about it with the people
working in this centre or camp?
Outcomes How migrants perceive and experience the results of humanitarian interventions
• Do you feel safe here?• Do you understand your asylum procedure?• Do you understand the procedure for your family reunification in country?
Empowerment• Do you think the support you receive, and the skills you learn here will help you in your future?• Are you able to make informed choices?
Open-ended question• Is there anything we could improve?
To see the questionnaires designed by Italian Red Cross and Austrian Red Cross together with Ground Truth Solutions for their different programmes, refer to Annexes 13, 14 and 15.
48
Annexes
International Federation of Red Cross and Red Crescent Societies
Annexes
Annex 5: Examples of selections and response bias
Selection bias
A bias is introduced by the selection of individuals or groups in a way that one given group is more likely to get selected than another. As a result, the sample obtained is not representative of the overall population intended to be analysed.
Imagine that you want to conduct a survey about a programme providing counselling about family reunification for refugees. To get a good estimation, you plan to ask at least 200 people about their opinions on the usefulness of the services. You decide to use an online survey tool and to advertise it on the Facebook page of your project. About 190 of your 200 respondents state that the counselling and support they receive is very useful.
This proportion seems very positive and to be certain, you decide to conduct a second survey, face-to-face. The sample of 200 people remains the same but this time you pick random names from the list of those supported by the programme. As you have the information on people’s addresses, you send vol-unteers from another programme of the National Society to pay them a visit between 9 am and 4 pm.
This time only 30 of your 200 respondents report that the counselling about family reunification is useful.
So which result is right?
The best conclusion is that neither survey result is likely to be accurate, because neither of the selection methods allowed you to reach the overall population supported by the programme.
Facebook is a social media platform open to anyone who is able to create an ac-count using a mobile device, so all of your sample will be literate people. While you might have gotten a good sense of the perceptions among those who can read and write and are using social media platforms, you might have reached out to those being supported by the programme at large. The second method is better, but it fails to reach those who are not at home during working hours, since people who have jobs will be absent from home.
This example illustrates that how you collect your responses influences who is likely to respond. If you only get responses from a sub-population that is sys-tematically different from the overall population, chances are that your re-sponse estimates will be different.
Response bias
When people feel compelled to respond differently than they actually believe.
Imagine that you are conducting the same survey to find out about the usefulness of family reunification counselling, but this time you ask the family reunification counsellors to conduct the interviews at the end of the counselling sessions.
49
Ann
exes
Ann
exes
International Federation of Red Cross and Red Crescent Societies
How to Establish and Manage a Systematic Community Feedback Mechanism
If you choose this sampling method it is likely that a larger proportion of your sample will report that the counselling about family reunification is useful. This is because most people tend to respond in a way that pleases the inter-viewer, especially when they perceive that providing negative feedback might have consequences for their individual situation. This is known as the courtesy bias. A related bias is the conformity bias, where people tend to respond in a way that is favoured by the social group they belong to, regardless of their own opinion. This type of bias is particularly strong if respondents feel that their responses are not anonymous.
Using independent third-party data collectors or anonymous survey tools can be a good way to reduce response bias. Regularly discussing the data with com-munities is another option to get beyond both courtesy and conformity biases.
Annex 6: Data collection options
Survey types
Face-to-face
In some operations, for example refugee or internally displaced people camps and where there is weak cell phone coverage, face-to-face surveys are often the only option. These surveys generally require a lot of resources, supervision and quality control. It is generally easier and less expensive to conduct phone inter-views if cell phone coverage is good. Both face-to-face and phone surveys allow for detailed answers and clarification of the questions if necessary.
The range of tools for face-to-face surveys spans low-tech options, like pen and paper to high-tech options using smartphones and tablets. When considering using handheld devices make sure these are allowed and safe (from a confiden-tiality point of view) to be used.
Face-to-face surveys may lead to biases. Courtesy bias is one of the most common bias’, particularly when surveys are conducted by programme or op-eration staff themselves. If Red Cross and Red Crescent staff ask respondents questions about their satisfaction with the assistance they provides, people may be inclined to answer these questions more positively than when asked by an external party.
Phone and SMS
Phone calls are good alternatives to labour intensive face-to-face interviews if cell phone coverage is good.
50
Annexes
International Federation of Red Cross and Red Crescent Societies
Annexes
Phone calls (automated/enumerated; random/targeted)Phone surveys are generally less expensive than face-to-face interviews but they only work when the target population has access to cell phones or lan-dlines. For phone surveys targeted at a specific group of people who received assistance, you will need their contact details. Without this it is hard to target a random sample of the target population. If the target group is large enough, you can make a random sample from the whole subscriber base of a particular telecommunications provider. This works where all members of a community or region are potential recipients. Phone surveys can be automated or enumer-ated. Enumerated phone surveys require more resources but allow for more detailed answers, including qualitative information from open-ended questions. Automated phone surveys require a certain level of literacy from respondents and do not allow for collecting detailed responses. That said, automated surveys – especially those using SMS – are less expensive because they do not require enumerators.
SMS survey (random/targeted)SMS surveys can be used to survey a random sample of a particular community or region. They can also be targeted at specific groups of people who received assistance. SMS surveys are best for fast collection of quantitative feedback from a large number of people. But they require a certain level of literacy, as respondents have to type in their answers. This approach lends itself well to self-collection by the National Society.
Online survey and kiosk option
Online surveys and kiosks can be easy to manage collection options with low variable costs in settings with good internet coverage and computer literacy.
Online surveyOnline surveys are easy to manage but require a high level of technological development, infrastructure and education. Online surveys offer limited space for personal biases (courtesy bias) as they are anonymous. Similar to SMS sur-veys and automated phone calls, the questions need to be easy to understand. Asking simple and easy to understand questions is key in any survey but is even more important in online surveys. Online surveys are best suited for collecting feedback from staff and volunteers.
Kiosk optionA survey kiosk can be a stationary computer or a tablet attached to the wall of a distribution, health or counselling centre and allows individuals to give imme-diate feedback after receiving goods or services or while waiting. The kiosk option predominantly targets people receiving a specific type of assistance and lacks the reach of other surveys. It also requires some respondent computer literacy. The biggest advantage of the kiosk option is that it allows individuals to provide feedback at their convenience as opposed to intentional data gathering exercises.
51
Ann
exes
International Federation of Red Cross and Red Crescent Societies
How to Establish and Manage a Systematic Community Feedback Mechanism
Annex 7: Tools for data collection and analysis
There are many different tools available that can help optimize the way you conduct your survey, depending on what method you choose for data collection. These include using an app on a mobile device, by sending out an online survey or by conducting SMS surveys.
Tools such as KoBoToolbox, Magpi, ODK and SurveyGizmo can be helpful plat-forms for both survey design and data collection. These applications can be used online and offline, facilitate data collection by smartphones or tablets, and they can generate an excel output. This output can be used for further data analysis. If data is collected by pen and paper, the results can still be up-loaded on one of the platforms to create structured .csv output files for further analysis. Tools like tableau or Power BI can be used to visually explore data and create dashboards that can be shared online.
To find the right tool, take the online test provided by Humanitarian Operations Mobile Acquisition of Data (NOM) at https://humanitarian-nomad.org/.
The table provided in Annex 13 gives you an overview of the different features of the most common tools.
Data collection
KoBoToolbox (www.kobotoolbox.org)
KoBoToolbox is a free and open software that offers unlimited use for humani-tarian organisations provided by UN OCHA and is based on the Open Data Kit (ODK) technology.
SurveyGizmo (www.surveygizmo.com)
SurveyGizmo is an online browser that helps to design survey questionnaires, to collect responses, and to explore data. The software supports multiple lan-guages. Free online offering is limited to 100 responses per survey and online data collection. Special offers might be available for non-profit organizations.
Magpi (www.magpi.com)
Magpi is a software that provides tools for mobile data collection as well as messaging and visualization. There are free and paid premium versions, the latter including SMS surveys and automated calls (interactive voice response).
The choice of software will depend on your needs, capacity and personal prefer-ences about the interface. Outputs from both platforms will require some cleaning, mostly to convert float to strings (text to numbers) to calculate mean scores.
Data analysis – quantitative data
Once you have a clean .csv output file with the results of your survey, meaning that there are no empty cells or columns and that you have deleted columns you do not need for analysis and added strings where needed, you can analyse the data using tools such as excel or JASP.
52
Annexes
International Federation of Red Cross and Red Crescent Societies
Annexes
JASP (www.jasp-stats.org)
JASP is a free software for statistical analysis, a user-friendly alternative for Statistical Package for the Social Sciences (SPSS) and R (free programming lan-guage with intuitive interface. It allows you to upload the data in .csv format, to run descriptive statistics, contingency tables for breakdowns and to calcu-late mean scores per question and breakdown. It helps you to structure your analysis and simultaneously see the results. One disadvantage is that it does not export results in excel format. You will need to copy and paste the results in an excel spreadsheet to visualize them.
Excel
You can analyse the survey results in excel using pivot tables and other standard functions. Refer to the automated excel spreadsheet for analysis in Annex 9, which can generate breakdown tables, means, correlations as well as corresponding graphs. Templates for visualizing data in excel can also be found in Annex 11.
Data analysis – qualitative data
If you have open-ended questions in your survey, the results can be analysed in excel. You will need to go through the responses one-by-one, group them under common issues that surface and visualize the results. In case you have large amounts of qualitative data, you might want to consider using an analysis soft-ware such as MAXQDA, ATLAS.ti, or NVivo.
Data visualization
Once you have frequency tables (results per question) and contingency tables (results per demographic groups), you can create graphs in excel. Templates to create graphs can be found in Annex 11. To explore data and to create dash-boards, you can use Tableau or Power BI.
Annex 8: Quick guide for data collectors
General introduction to data collection
• It is important to explain that the survey is anonymous at the outset, and that participation or refusal to participate will not effect the individual’s prospects of receiving assistance. When interviewing asylum-seekers, refugees or other migrants, it is important to emphasize that their decision whether to partici-pate or not and anything they say during the interview will not affect their asylum status.
• Explain that the purpose of the survey is to gather honest feedback to improve quality of assistance provided.
• Explain that it is perceptual data – there are no right or wrong answers. You want to know how they feel about certain things, which of course is subjective.
• It helps to explain the Likert scale and open-ended questions at the begin-ning: most questions will come with a 1 to 5 scale, and they should choose the answer that most applies to them. Sometimes you will ask follow-up or open-ended questions, where they can answer freely.
53
Ann
exes
International Federation of Red Cross and Red Crescent Societies
How to Establish and Manage a Systematic Community Feedback Mechanism
54
Avoiding bias
• Ensure a calm environment, avoiding other influences (e.g. not conducting an interview in a waiting room or busy area where others are listening).
• It is important to remain neutral and encourage honest answers (e.g. try not looking overly pleased or happy when they give positive responses).
• In case the person collecting the data is a volunteer or a staff member of the organization providing aid, and if they are wearing a logo of this organization or the interviewees know them through their work, it is particularly impor-tant to stress the anonymity of the answers given and that honest answers are what they are looking for.
General tips
• Try to create a comfortable dynamic between interviewer and respondent, es-pecially if sensitive issues are being discussed. For example, female refugees should ideally be approached by a female interviewer. If possible, also pair na-tionalities (Iranian data collector with Iranian refugee, Afghan data collector with Afghan refugee).
• Paraphrase the answers given to open questions back to the interviewee be-fore recording them to make sure you really understand what they are saying.
• If the question uses a complicated term or a term that can have multiple meanings, clarify with them what you are asking about to make sure the in-terviewer and respondent are on the same page.
• Sometimes one may want to provide examples, however, be careful not to prompt respondents’. For instance, do not ask questions like, “What are your most important needs? Like housing, money, or employment…” since these could lead the respondent to confirm, “Yes, I need a place to live, and a job so I can earn a living.” These may be the answers they would have given anyway, but it might skew the results if data collectors prompt them with examples on a perceptual and subjective question. It could be that these are needs that they have, but they may not have initially considered them their most impor-tant ones, possibly excluding or missing other needs. However, in certain cir-cumstances it is important for the data collector to clarify a question, which can include giving examples (“Do you use smartphone apps? Like WhatsApp, Facebook, Viber…”). Since the options presented are less subjective, the re-spondent will likely understand what is being asked and reply accordingly.
• If a respondent goes into great anecdotal detail, try to politely guide them back to answering the questions at hand, but do not rush them.
• Clarify vague answers. If you are not sure about their response, whether for a Likert scale question or an open-ended one, be sure to ask them for clarification.
Annexes
Humanity The International Red Cross and Red Crescent Movement, born of a desire to bring as-sistance without discrimination to the wounded on the battlefield, endeavours, in its international and national capacity, to prevent and alleviate hu-man suffering wherever it may be found. Its pur-pose is to protect life and health and to ensure respect for the human being. It promotes mutual understanding, friendship, cooperation and lasting peace amongst all peoples.
Impartiality It makes no discrimination as to na-tionality, race, religious beliefs, class or political opinions. It endeavours to relieve the suffering of individuals, being guided solely by their needs, and to give priority to the most urgent cases of distress.
Neutrality In order to enjoy the confidence of all, the Movement may not take sides in hostilities or engage at any time in controversies of a political, racial, religious or ideological nature.
Independence The Movement is independent. The National Societies, while auxiliaries in the human-itarian services of their governments and subject to the laws of their respective countries, must al-ways maintain their autonomy so that they may be able at all times to act in accordance with the principles of the Movement.
Voluntary service It is a voluntary relief move-ment not prompted in any manner by desire for gain.
Unity There can be only one Red Cross or Red Crescent Society in any one country. It must be open to all. It must carry on its humanitarian work throughout its territory.
Universality The International Red Cross and Red Crescent Movement, in which all societies have equal status and share equal responsibili-ties and duties in helping each other, is world-wide.
The Fundamental Principles of the International Red Cross and Red Crescent Movement
The International Federation of Red Cross and Red Crescent Societies (IFRC) is the world’s largest volunteer-based humanitarian network. With our 190 member National Red Cross and Red Crescent Societies worldwide, we are in every community reaching 160.7 million people annually through long-term services and development programmes, as well as 110 million people through disaster response and early recovery programmes. We act before, during and after disasters and health emergencies to meet the needs and improve the lives of vulnerable people. We do so with impartiality as to nationality, race, gender, religious beliefs, class and political opinions.
For more information, please contact us:
Ombretta BaggioIFRC Senior Community Engagement [email protected]@ombaggio #CommIsAidTel: +41 (0)22 730 4495
Ground Truth Solutions provides humanitarian teams with the tools to systematically listen and respond to the voices of people affected by humanitarian crises. The goal is to support better humanitarian performance by grounding humanitarian aid in the needs, priorities and expectations of affected people. To this end, Ground Truth Solutions works with humanitarian agencies – individually, at the sector level and response-wide – to determine whether the services they provide are relevant, if affected populations trust them, and whether they feel empowered. This feedback forms the basis for continuous listening, learning and more effective humanitarian action.
Michael SarnitzGround Truth Solutions Senior Programme Manager [email protected]@michisarnitz #CommIsAidTel: +43 660 4794764


