Embed Size (px)
Citation preview
2010; 32: 802–811
AMEE GUIDE
How to measure the quality of the OSCE:A review of metrics – AMEE guide no. 49
GODFREY PELL, RICHARD FULLER, MATTHEW HOMER & TRUDIE ROBERTS
University of Leeds, UK
Abstract
With an increasing use of criterion-based assessment techniques in both undergraduate and postgraduate healthcare programmes,
there is a consequent need to ensure the quality and rigour of these assessments. The obvious question for those responsible for
delivering assessment is how is this ‘quality’ measured, and what mechanisms might there be that allow improvements in
assessment quality over time to be demonstrated? Whilst a small base of literature exists, few papers give more than one or two
metrics as measures of quality in Objective Structured Clinical Examinations (OSCEs). In this guide, aimed at assessment
practitioners, the authors aim to review the metrics that are available for measuring quality and indicate how a rounded picture of
OSCE assessment quality may be constructed by using a variety of such measures, and also to consider which characteristics of the
OSCE are appropriately judged by which measure(s). The authors will discuss the quality issues both at the individual station level
and across the complete clinical assessment as a whole, using a series of ‘worked examples’ drawn from OSCE data sets from the
authors’ institution.
Introduction
With increasing scrutiny of the techniques used to support
high-level decision-making in academic disciplines, criterion-
based assessment (CBA) delivers a reliable and structured
methodological approach. As a competency-based methodol-
ogy, CBA allows the delivery of ‘high stakes’ summative
assessment (e.g. qualifying level or degree level examina-
tions), and the demonstration of high levels of both reliability
and validity. This assessment methodology is attractive, with a
number of key benefits over more ‘traditional’ unstructured
forms of assessment (e.g. viva voce) in that it is absolutist,
carefully standardised for all candidates, and assessments are
clearly designed and closely linked with performance objec-
tives. These objectives can be clearly mapped against curric-
ular outcomes, and where appropriate, standards laid down by
regulatory and licensing bodies that are available to students
and teachers alike. As such, CBA methodology has seen a wide
application beyond summative assessments, extending into
the delivery of a variety of work-based assessment tools across
a range of academic disciplines (Norcini & Burch 2007;
Postgraduate Medical Education and Training Board 2009).
CBA is also now being used in the UK in the recruitment of
junior doctors, using a structured interview similar to that used
for selecting admissions to higher education programmes
(Eva et al. 2004).
The Objective Structured Clinical Examination (OSCE) uses
CBA principles within a complex process that begins with
‘blueprinting’ course content against pre-defined objectives
(Newble 2004). The aim here is to ensure both that the ‘correct’
standard is assessed and that the content of the OSCE is
objectively mapped to curricular outcomes. Performance is
scored, at the station level, using an item checklist, detailing
individual (sequences of) behaviours, and by a global grade,
reliant on a less deterministic overall assessment by examiners
(Cohen et al. 1997; Regehr et al. 1998).
Central to the delivery of any successful CBA is the
assurance of sufficient quality and robust standard setting,
supported by a range of metrics that allow thoughtful consid-
eration of the performance of the assessment as a whole, rather
than just a narrow focus on candidate outcomes (Roberts et al.
2006). ‘Assessing the assessment’ is vital, as the delivery of
OSCEs are complex and resource intensive, usually involving
large numbers of examiners, candidates, simulators and
patients, and often taking place across parallel sites.
Practice points
. It is important to always evaluate the quality of a high-
stakes assessment, such as an OSCE, through the use of
a range of appropriate metrics.
. When judging the quality of an OSCE, it is very
important to employ more than one metric to gain an
all-round view of the assessment quality.
. Assessment practitioners need to develop a ‘toolkit’ for
identifying and avoiding common pitfalls.
. The key to widespread quality improvement is to focus
on station level performance and improvements, and
apply these within the wider context of the entire OSCE
assessment process.
. The routine use of metrics within OSCE quality improve-
ment allows a clear method of measuring the effects of
change.
Correspondence: G. Pell, Medical Education Unit, Leeds Institute of Medical Education, University of Leeds, Level 7, Room 7.20, Worsley Building,
Clarendon Way, Leeds LS2 9NL, UK. Tel: 44 113 23434378; fax: 44 113 23432597; email: [email protected]
802 ISSN 0142–159X print/ISSN 1466–187X online/10/100802–10 ß 2010 Informa UK Ltd.
DOI: 10.3109/0142159X.2010.507716
Med
Tea
ch D
ow
nlo
aded
fro
m i
nfo
rmah
ealt
hca
re.c
om
by U
niv
ersi
ty o
f B
arce
lona
on 0
6/0
6/1
3F
or
per
sonal
use
only
.
This complexity means CBA may be subject to difficulties with
standardisation, and is heavily reliant on assessor behaviour,
even given the controlling mechanism of item checklists. No
single metric is sufficient in itself to meaningfully judge the
quality of the assessment process, just as no single assessment
is sufficient in judging, for example, the clinical competence of
an undergraduate student. Understanding and utilising metrics
effectively are therefore central to CBA, both in measuring
quality and in directing resources to appropriate further
research and development of the assessment (Wass et al. 2001).
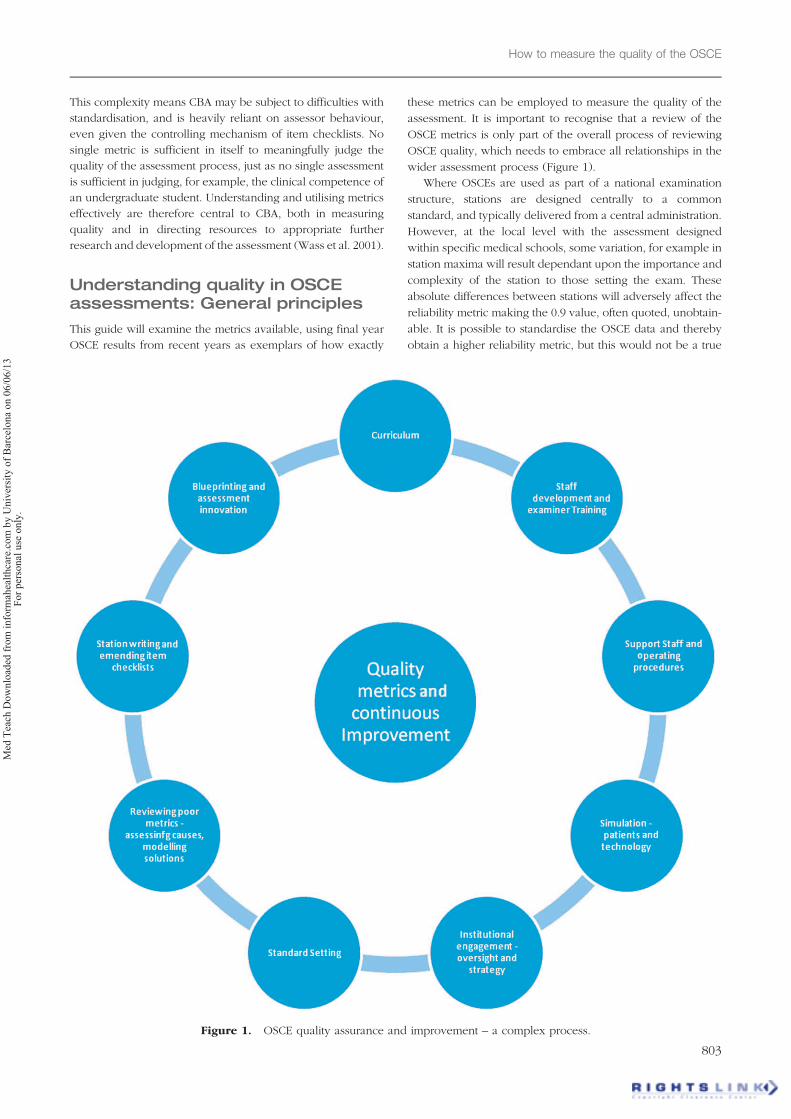
Understanding quality in OSCEassessments: General principles
This guide will examine the metrics available, using final year
OSCE results from recent years as exemplars of how exactly
these metrics can be employed to measure the quality of the
assessment. It is important to recognise that a review of the
OSCE metrics is only part of the overall process of reviewing
OSCE quality, which needs to embrace all relationships in the
wider assessment process (Figure 1).
Where OSCEs are used as part of a national examination
structure, stations are designed centrally to a common
standard, and typically delivered from a central administration.
However, at the local level with the assessment designed
within specific medical schools, some variation, for example in
station maxima will result dependant upon the importance and
complexity of the station to those setting the exam. These
absolute differences between stations will adversely affect the
reliability metric making the 0.9 value, often quoted, unobtain-
able. It is possible to standardise the OSCE data and thereby
obtain a higher reliability metric, but this would not be a true
Figure 1. OSCE quality assurance and improvement – a complex process.
How to measure the quality of the OSCE
803
Med
Tea
ch D
ow
nlo
aded
fro
m i
nfo
rmah
ealt
hca
re.c
om
by U
niv
ersi
ty o
f B
arce
lona
on 0
6/0
6/1
3F
or
per
sonal
use
only
.
representation of the assessment as set with respect to the
objectives of the assessing body. This guide is aimed primarily
at those involved with clinical assessment at the local level
within individual medical schools, where, although the
assessment may take place across multiple sights, it is a
single administration. Those involved with national clinical
assessments are likely to have a different perspective.
Which method of standard setting?
The method of standard setting will determine the metrics
available for use in assessing quality (Cizek & Bunch 2007;
Streiner & Norman 2008). Standards can be relative (e.g. norm
referenced) or absolute, based either on the test item (Ebel &
Angoff), or the performance of the candidate (borderline
methods). With the requirement for standards to be defensible,
evidenced and acceptable (Norcini 2003), absolute standards
are generally used. Whilst all methods of standard setting will
generate a number of post hoc metrics (e.g. station pass rates,
fixed effects (time of assessment and comparison across sites)
or frequency of mark distribution), it is important to choose a
method of standard setting that generates additional quality
measures. At present, a large number of institutions favour
borderline, but only the regression method will give some
indication of the relationship between global grade and
checklist score and also the level of discrimination between
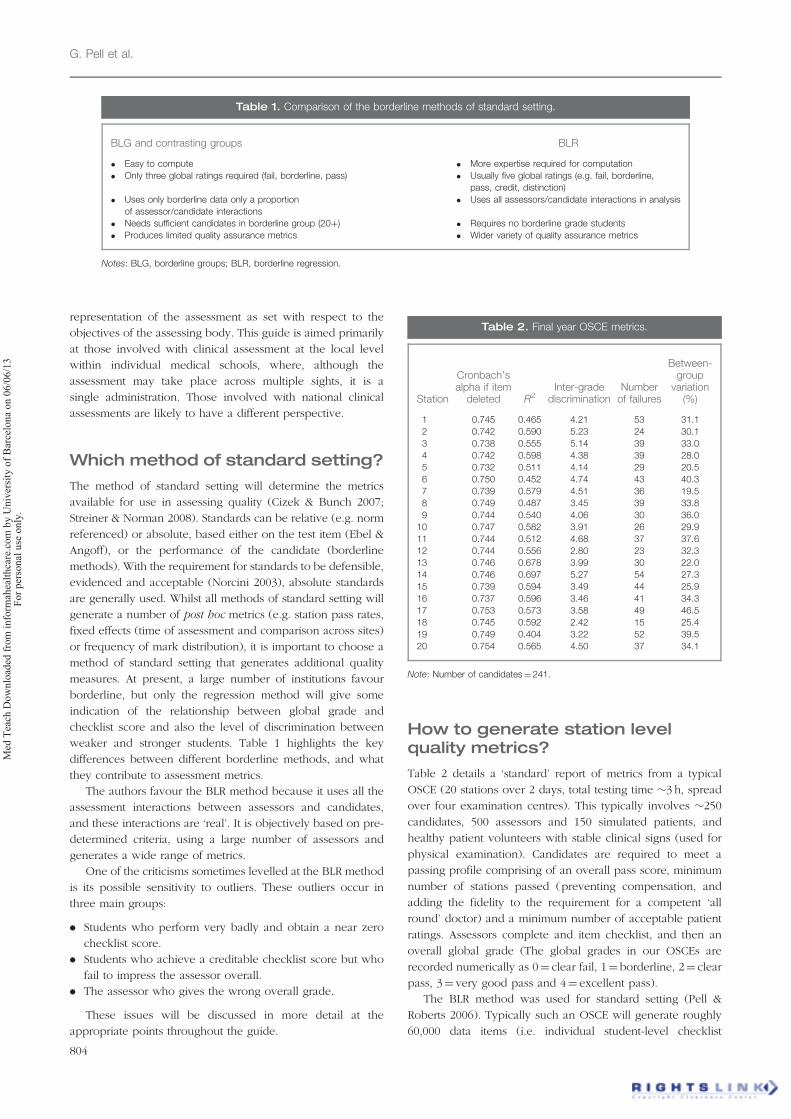
weaker and stronger students. Table 1 highlights the key
differences between different borderline methods, and what
they contribute to assessment metrics.
The authors favour the BLR method because it uses all the
assessment interactions between assessors and candidates,
and these interactions are ‘real’. It is objectively based on pre-
determined criteria, using a large number of assessors and
generates a wide range of metrics.
One of the criticisms sometimes levelled at the BLR method
is its possible sensitivity to outliers. These outliers occur in
three main groups:
. Students who perform very badly and obtain a near zero
checklist score.
. Students who achieve a creditable checklist score but who
fail to impress the assessor overall.
. The assessor who gives the wrong overall grade.
These issues will be discussed in more detail at the
appropriate points throughout the guide.
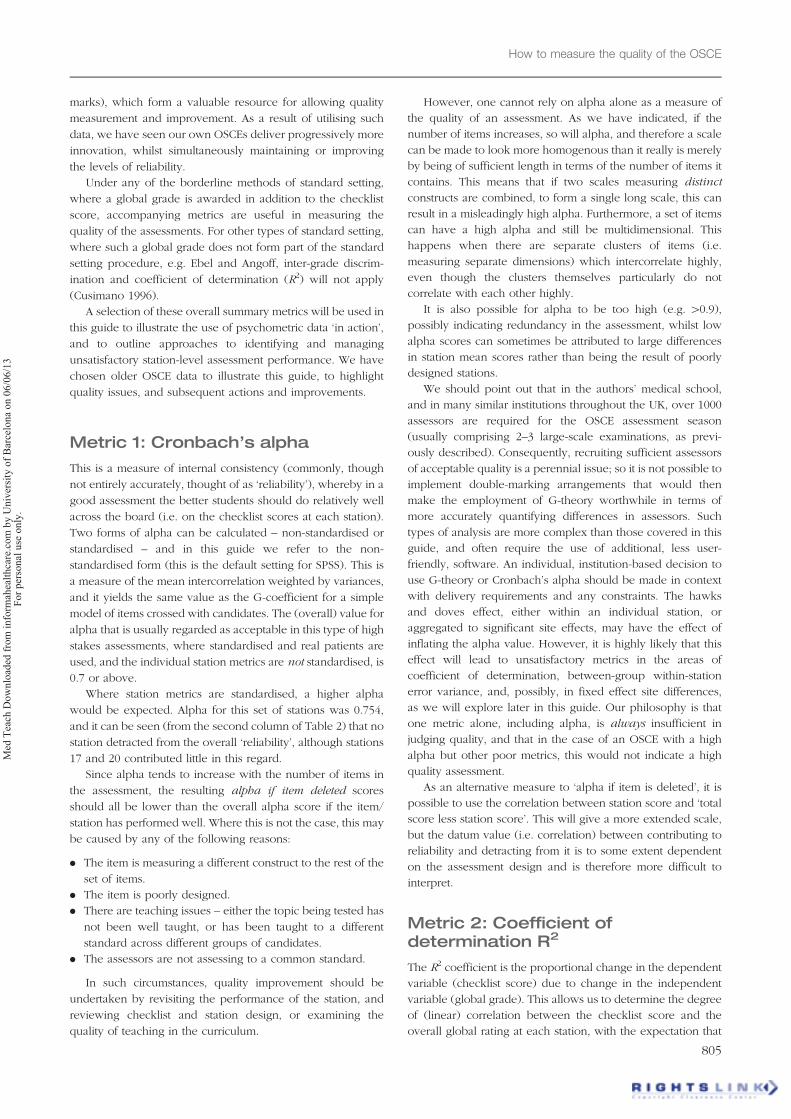
How to generate station levelquality metrics?
Table 2 details a ‘standard’ report of metrics from a typical
OSCE (20 stations over 2 days, total testing time �3 h, spread
over four examination centres). This typically involves �250
candidates, 500 assessors and 150 simulated patients, and
healthy patient volunteers with stable clinical signs (used for
physical examination). Candidates are required to meet a
passing profile comprising of an overall pass score, minimum
number of stations passed (preventing compensation, and
adding the fidelity to the requirement for a competent ‘all
round’ doctor) and a minimum number of acceptable patient
ratings. Assessors complete and item checklist, and then an
overall global grade (The global grades in our OSCEs are
recorded numerically as 0¼ clear fail, 1¼ borderline, 2¼ clear
pass, 3¼ very good pass and 4¼ excellent pass).
The BLR method was used for standard setting (Pell &
Roberts 2006). Typically such an OSCE will generate roughly
60,000 data items (i.e. individual student-level checklist
Table 2. Final year OSCE metrics.
Station
Cronbach’salpha if item
deleted R2
Inter-gradediscrimination
Numberof failures
Between-group
variation(%)
1 0.745 0.465 4.21 53 31.1
2 0.742 0.590 5.23 24 30.1
3 0.738 0.555 5.14 39 33.0
4 0.742 0.598 4.38 39 28.0
5 0.732 0.511 4.14 29 20.5
6 0.750 0.452 4.74 43 40.3
7 0.739 0.579 4.51 36 19.5
8 0.749 0.487 3.45 39 33.8
9 0.744 0.540 4.06 30 36.0
10 0.747 0.582 3.91 26 29.9
11 0.744 0.512 4.68 37 37.6
12 0.744 0.556 2.80 23 32.3
13 0.746 0.678 3.99 30 22.0
14 0.746 0.697 5.27 54 27.3
15 0.739 0.594 3.49 44 25.9
16 0.737 0.596 3.46 41 34.3
17 0.753 0.573 3.58 49 46.5
18 0.745 0.592 2.42 15 25.4
19 0.749 0.404 3.22 52 39.5
20 0.754 0.565 4.50 37 34.1
Note: Number of candidates¼241.
Table 1. Comparison of the borderline methods of standard setting.
BLG and contrasting groups BLR
� Easy to compute � More expertise required for computation
� Only three global ratings required (fail, borderline, pass) � Usually five global ratings (e.g. fail, borderline,
pass, credit, distinction)
� Uses only borderline data only a proportion
of assessor/candidate interactions
� Uses all assessors/candidate interactions in analysis
� Needs sufficient candidates in borderline group (20þ) � Requires no borderline grade students
� Produces limited quality assurance metrics � Wider variety of quality assurance metrics
Notes: BLG, borderline groups; BLR, borderline regression.
G. Pell et al.
804
Med
Tea
ch D
ow
nlo
aded
fro
m i
nfo
rmah
ealt
hca
re.c
om
by U
niv
ersi
ty o
f B
arce
lona
on 0
6/0
6/1
3F
or
per
sonal
use
only
.
marks), which form a valuable resource for allowing quality
measurement and improvement. As a result of utilising such
data, we have seen our own OSCEs deliver progressively more
innovation, whilst simultaneously maintaining or improving
the levels of reliability.
Under any of the borderline methods of standard setting,
where a global grade is awarded in addition to the checklist
score, accompanying metrics are useful in measuring the
quality of the assessments. For other types of standard setting,
where such a global grade does not form part of the standard
setting procedure, e.g. Ebel and Angoff, inter-grade discrim-
ination and coefficient of determination (R2) will not apply
(Cusimano 1996).
A selection of these overall summary metrics will be used in
this guide to illustrate the use of psychometric data ‘in action’,
and to outline approaches to identifying and managing
unsatisfactory station-level assessment performance. We have
chosen older OSCE data to illustrate this guide, to highlight
quality issues, and subsequent actions and improvements.
Metric 1: Cronbach’s alpha
This is a measure of internal consistency (commonly, though
not entirely accurately, thought of as ‘reliability’), whereby in a
good assessment the better students should do relatively well
across the board (i.e. on the checklist scores at each station).
Two forms of alpha can be calculated – non-standardised or
standardised – and in this guide we refer to the non-
standardised form (this is the default setting for SPSS). This is
a measure of the mean intercorrelation weighted by variances,
and it yields the same value as the G-coefficient for a simple
model of items crossed with candidates. The (overall) value for
alpha that is usually regarded as acceptable in this type of high
stakes assessments, where standardised and real patients are
used, and the individual station metrics are not standardised, is
0.7 or above.
Where station metrics are standardised, a higher alpha
would be expected. Alpha for this set of stations was 0.754,
and it can be seen (from the second column of Table 2) that no
station detracted from the overall ‘reliability’, although stations
17 and 20 contributed little in this regard.
Since alpha tends to increase with the number of items in
the assessment, the resulting alpha if item deleted scores
should all be lower than the overall alpha score if the item/
station has performed well. Where this is not the case, this may
be caused by any of the following reasons:
. The item is measuring a different construct to the rest of the
set of items.
. The item is poorly designed.
. There are teaching issues – either the topic being tested has
not been well taught, or has been taught to a different
standard across different groups of candidates.
. The assessors are not assessing to a common standard.
In such circumstances, quality improvement should be
undertaken by revisiting the performance of the station, and
reviewing checklist and station design, or examining the
quality of teaching in the curriculum.
However, one cannot rely on alpha alone as a measure of
the quality of an assessment. As we have indicated, if the
number of items increases, so will alpha, and therefore a scale
can be made to look more homogenous than it really is merely
by being of sufficient length in terms of the number of items it
contains. This means that if two scales measuring distinct
constructs are combined, to form a single long scale, this can
result in a misleadingly high alpha. Furthermore, a set of items
can have a high alpha and still be multidimensional. This
happens when there are separate clusters of items (i.e.
measuring separate dimensions) which intercorrelate highly,
even though the clusters themselves particularly do not
correlate with each other highly.
It is also possible for alpha to be too high (e.g. 40.9),
possibly indicating redundancy in the assessment, whilst low
alpha scores can sometimes be attributed to large differences
in station mean scores rather than being the result of poorly
designed stations.
We should point out that in the authors’ medical school,
and in many similar institutions throughout the UK, over 1000
assessors are required for the OSCE assessment season
(usually comprising 2–3 large-scale examinations, as previ-
ously described). Consequently, recruiting sufficient assessors
of acceptable quality is a perennial issue; so it is not possible to
implement double-marking arrangements that would then
make the employment of G-theory worthwhile in terms of
more accurately quantifying differences in assessors. Such
types of analysis are more complex than those covered in this
guide, and often require the use of additional, less user-
friendly, software. An individual, institution-based decision to
use G-theory or Cronbach’s alpha should be made in context
with delivery requirements and any constraints. The hawks
and doves effect, either within an individual station, or
aggregated to significant site effects, may have the effect of
inflating the alpha value. However, it is highly likely that this
effect will lead to unsatisfactory metrics in the areas of
coefficient of determination, between-group within-station
error variance, and, possibly, in fixed effect site differences,
as we will explore later in this guide. Our philosophy is that
one metric alone, including alpha, is always insufficient in
judging quality, and that in the case of an OSCE with a high
alpha but other poor metrics, this would not indicate a high
quality assessment.
As an alternative measure to ‘alpha if item is deleted’, it is
possible to use the correlation between station score and ‘total
score less station score’. This will give a more extended scale,
but the datum value (i.e. correlation) between contributing to
reliability and detracting from it is to some extent dependent
on the assessment design and is therefore more difficult to
interpret.
Metric 2: Coefficient ofdetermination R2
The R2 coefficient is the proportional change in the dependent
variable (checklist score) due to change in the independent
variable (global grade). This allows us to determine the degree
of (linear) correlation between the checklist score and the
overall global rating at each station, with the expectation that
How to measure the quality of the OSCE
805
Med
Tea
ch D
ow
nlo
aded
fro
m i
nfo
rmah
ealt
hca
re.c
om
by U
niv
ersi
ty o
f B
arce
lona
on 0
6/0
6/1
3F
or
per
sonal
use
only
.
higher overall global ratings should generally correspond with
higher checklist scores. The square root of the coefficient of
determination is the simple Pearsonian correlation coefficient.
SPSS and other statistical software packages also give the
adjusted value of R2, which takes into account the sample size
and the number of predictors in the model (one in this case);
ideally, this value should be close to the unadjusted value.
A good correlation (R240.5) will indicate a reasonable
relationship between checklist scores and global grades, but
care is needed to ensure that overly detailed global descriptors
are not simply translated automatically by assessors into a
corresponding checklist score, thereby artificially inflating R2.
In Table 2, station 14 (a practical and medico-legal skills
station) has a good R2 value of 0.697, implying that 69.7% of
variation in the students’ global ratings are accounted for by
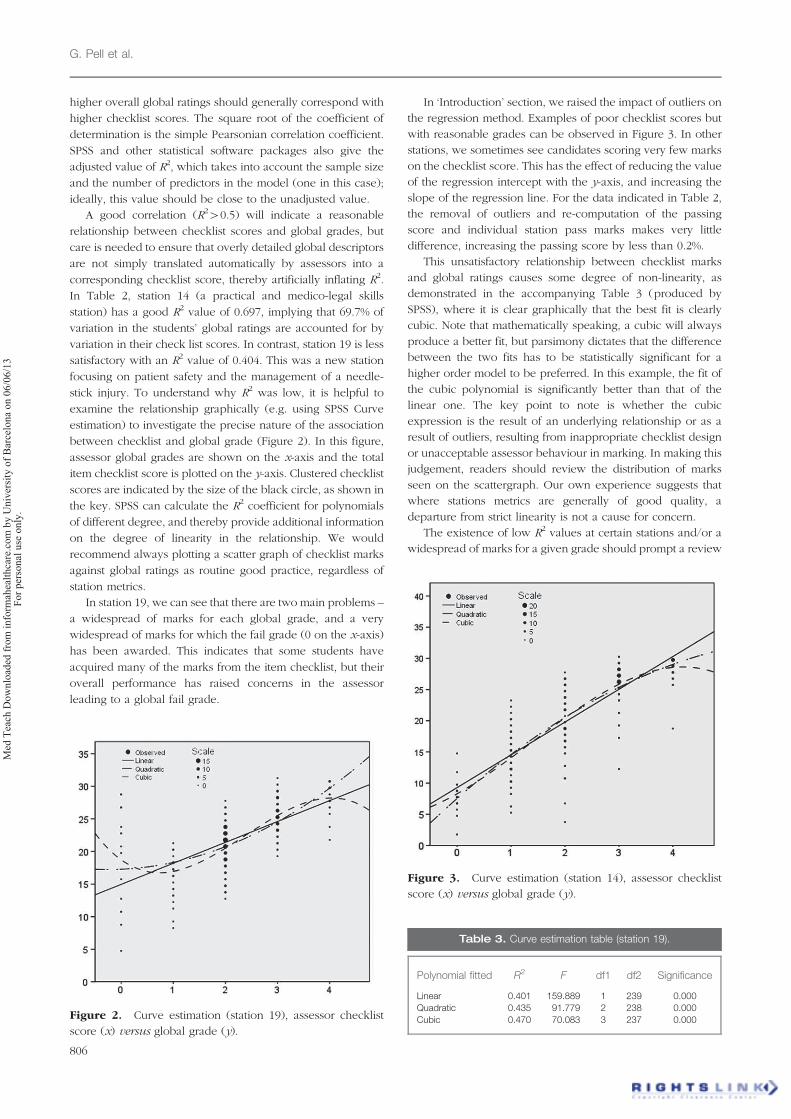
variation in their check list scores. In contrast, station 19 is less
satisfactory with an R2 value of 0.404. This was a new station
focusing on patient safety and the management of a needle-
stick injury. To understand why R2 was low, it is helpful to
examine the relationship graphically (e.g. using SPSS Curve
estimation) to investigate the precise nature of the association
between checklist and global grade (Figure 2). In this figure,
assessor global grades are shown on the x-axis and the total
item checklist score is plotted on the y-axis. Clustered checklist
scores are indicated by the size of the black circle, as shown in
the key. SPSS can calculate the R2 coefficient for polynomials
of different degree, and thereby provide additional information
on the degree of linearity in the relationship. We would
recommend always plotting a scatter graph of checklist marks
against global ratings as routine good practice, regardless of
station metrics.
In station 19, we can see that there are two main problems –
a widespread of marks for each global grade, and a very
widespread of marks for which the fail grade (0 on the x-axis)
has been awarded. This indicates that some students have
acquired many of the marks from the item checklist, but their
overall performance has raised concerns in the assessor
leading to a global fail grade.
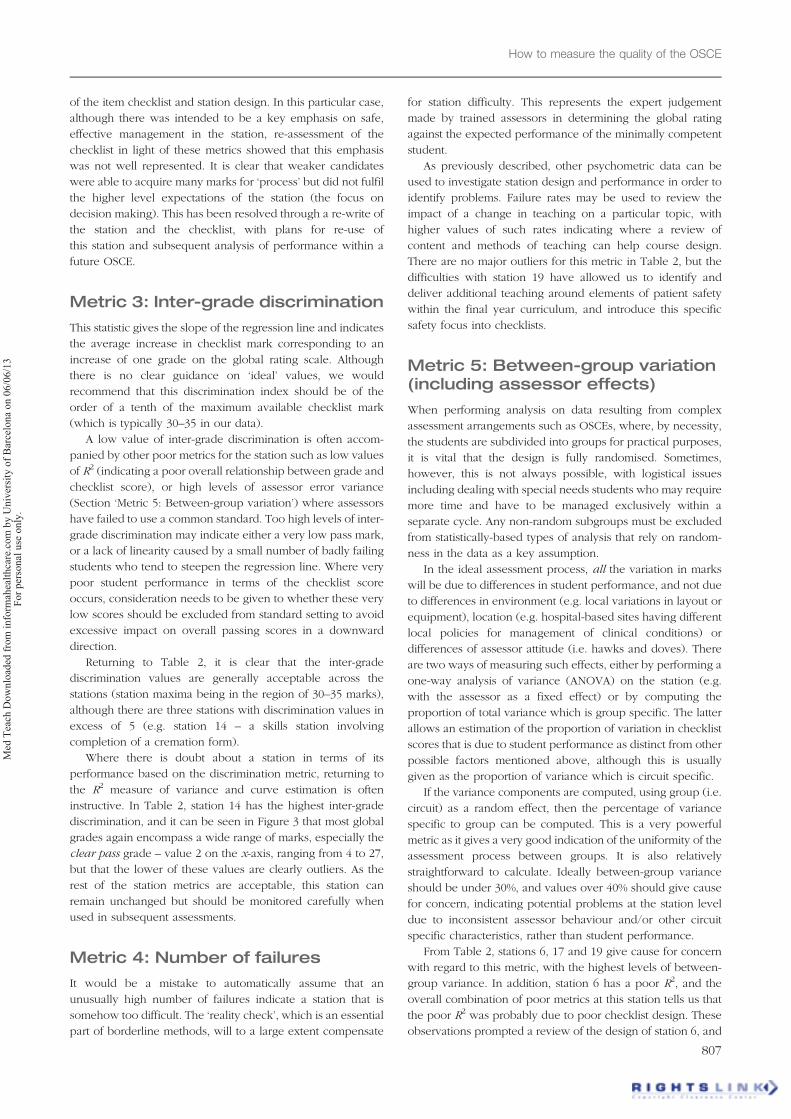
In ‘Introduction’ section, we raised the impact of outliers on
the regression method. Examples of poor checklist scores but
with reasonable grades can be observed in Figure 3. In other
stations, we sometimes see candidates scoring very few marks
on the checklist score. This has the effect of reducing the value
of the regression intercept with the y-axis, and increasing the
slope of the regression line. For the data indicated in Table 2,
the removal of outliers and re-computation of the passing
score and individual station pass marks makes very little
difference, increasing the passing score by less than 0.2%.
This unsatisfactory relationship between checklist marks
and global ratings causes some degree of non-linearity, as
demonstrated in the accompanying Table 3 (produced by
SPSS), where it is clear graphically that the best fit is clearly
cubic. Note that mathematically speaking, a cubic will always
produce a better fit, but parsimony dictates that the difference
between the two fits has to be statistically significant for a
higher order model to be preferred. In this example, the fit of
the cubic polynomial is significantly better than that of the
linear one. The key point to note is whether the cubic
expression is the result of an underlying relationship or as a
result of outliers, resulting from inappropriate checklist design
or unacceptable assessor behaviour in marking. In making this
judgement, readers should review the distribution of marks
seen on the scattergraph. Our own experience suggests that
where stations metrics are generally of good quality, a
departure from strict linearity is not a cause for concern.
The existence of low R2 values at certain stations and/or a
widespread of marks for a given grade should prompt a review
Figure 3. Curve estimation (station 14), assessor checklist
score (x) versus global grade (y).
Figure 2. Curve estimation (station 19), assessor checklist
score (x) versus global grade (y).
Table 3. Curve estimation table (station 19).
Polynomial fitted R2
F df1 df2 Significance
Linear 0.401 159.889 1 239 0.000
Quadratic 0.435 91.779 2 238 0.000
Cubic 0.470 70.083 3 237 0.000
G. Pell et al.
806
Med
Tea
ch D
ow
nlo
aded
fro
m i
nfo
rmah
ealt
hca
re.c
om
by U
niv
ersi
ty o
f B
arce
lona
on 0
6/0
6/1
3F
or
per
sonal
use
only
.
of the item checklist and station design. In this particular case,
although there was intended to be a key emphasis on safe,
effective management in the station, re-assessment of the
checklist in light of these metrics showed that this emphasis
was not well represented. It is clear that weaker candidates
were able to acquire many marks for ‘process’ but did not fulfil
the higher level expectations of the station (the focus on
decision making). This has been resolved through a re-write of
the station and the checklist, with plans for re-use of
this station and subsequent analysis of performance within a
future OSCE.
Metric 3: Inter-grade discrimination
This statistic gives the slope of the regression line and indicates
the average increase in checklist mark corresponding to an
increase of one grade on the global rating scale. Although
there is no clear guidance on ‘ideal’ values, we would
recommend that this discrimination index should be of the
order of a tenth of the maximum available checklist mark
(which is typically 30–35 in our data).
A low value of inter-grade discrimination is often accom-
panied by other poor metrics for the station such as low values
of R2 (indicating a poor overall relationship between grade and
checklist score), or high levels of assessor error variance
(Section ‘Metric 5: Between-group variation’) where assessors
have failed to use a common standard. Too high levels of inter-
grade discrimination may indicate either a very low pass mark,
or a lack of linearity caused by a small number of badly failing
students who tend to steepen the regression line. Where very
poor student performance in terms of the checklist score
occurs, consideration needs to be given to whether these very
low scores should be excluded from standard setting to avoid
excessive impact on overall passing scores in a downward
direction.
Returning to Table 2, it is clear that the inter-grade
discrimination values are generally acceptable across the
stations (station maxima being in the region of 30–35 marks),
although there are three stations with discrimination values in
excess of 5 (e.g. station 14 – a skills station involving
completion of a cremation form).
Where there is doubt about a station in terms of its
performance based on the discrimination metric, returning to
the R2 measure of variance and curve estimation is often
instructive. In Table 2, station 14 has the highest inter-grade
discrimination, and it can be seen in Figure 3 that most global
grades again encompass a wide range of marks, especially the
clear pass grade – value 2 on the x-axis, ranging from 4 to 27,
but that the lower of these values are clearly outliers. As the
rest of the station metrics are acceptable, this station can
remain unchanged but should be monitored carefully when
used in subsequent assessments.
Metric 4: Number of failures
It would be a mistake to automatically assume that an
unusually high number of failures indicate a station that is
somehow too difficult. The ‘reality check’, which is an essential
part of borderline methods, will to a large extent compensate
for station difficulty. This represents the expert judgement
made by trained assessors in determining the global rating
against the expected performance of the minimally competent
student.
As previously described, other psychometric data can be
used to investigate station design and performance in order to
identify problems. Failure rates may be used to review the
impact of a change in teaching on a particular topic, with
higher values of such rates indicating where a review of
content and methods of teaching can help course design.
There are no major outliers for this metric in Table 2, but the
difficulties with station 19 have allowed us to identify and
deliver additional teaching around elements of patient safety
within the final year curriculum, and introduce this specific
safety focus into checklists.
Metric 5: Between-group variation(including assessor effects)
When performing analysis on data resulting from complex
assessment arrangements such as OSCEs, where, by necessity,
the students are subdivided into groups for practical purposes,
it is vital that the design is fully randomised. Sometimes,
however, this is not always possible, with logistical issues
including dealing with special needs students who may require
more time and have to be managed exclusively within a
separate cycle. Any non-random subgroups must be excluded
from statistically-based types of analysis that rely on random-
ness in the data as a key assumption.
In the ideal assessment process, all the variation in marks
will be due to differences in student performance, and not due
to differences in environment (e.g. local variations in layout or
equipment), location (e.g. hospital-based sites having different
local policies for management of clinical conditions) or
differences of assessor attitude (i.e. hawks and doves). There
are two ways of measuring such effects, either by performing a
one-way analysis of variance (ANOVA) on the station (e.g.
with the assessor as a fixed effect) or by computing the
proportion of total variance which is group specific. The latter
allows an estimation of the proportion of variation in checklist
scores that is due to student performance as distinct from other
possible factors mentioned above, although this is usually
given as the proportion of variance which is circuit specific.
If the variance components are computed, using group (i.e.
circuit) as a random effect, then the percentage of variance
specific to group can be computed. This is a very powerful
metric as it gives a very good indication of the uniformity of the
assessment process between groups. It is also relatively
straightforward to calculate. Ideally between-group variance
should be under 30%, and values over 40% should give cause
for concern, indicating potential problems at the station level
due to inconsistent assessor behaviour and/or other circuit
specific characteristics, rather than student performance.
From Table 2, stations 6, 17 and 19 give cause for concern
with regard to this metric, with the highest levels of between-
group variance. In addition, station 6 has a poor R2, and the
overall combination of poor metrics at this station tells us that
the poor R2 was probably due to poor checklist design. These
observations prompted a review of the design of station 6, and
How to measure the quality of the OSCE
807
Med
Tea
ch D
ow
nlo
aded
fro
m i
nfo
rmah
ealt
hca
re.c
om
by U
niv
ersi
ty o
f B
arce
lona
on 0
6/0
6/1
3F
or
per
sonal
use
only
.
the checklist was found to consist of a large number of low-
level criteria where weaker candidates could attain high scores
through ‘process’ only. In other words, there was a likely
mismatch between the nature of the checklist, and the aims
and objectives of the station as understood by the assessors.
Hence, in redesigning the station, a number of the low-level
criteria were chunked (i.e. grouped together to form a higher
level criterion) in order to facilitate the assessment of higher
level processes as originally intended.
Station 17 tells a different story, as the good R2 coupled
with the high between-group variation indicates that assessors
are marking consistently within groups, but that there is a
distinct hawks and doves effect between groups. In such a
case, this ought to be further investigated by undertaking
a one-way ANOVA analysis to determine whether this is an
individual assessor or a site phenomenon. The amount of
variance attributable to different sites is subsumed in the
simple computation of within-station between-group variance
as describe above. However, its significance may be deter-
mined using a one-way ANOVA analysis with sites as fixed
effects.
However, care needs to be exercised in making judge-
ments based on a single metric, since, with quite large
populations, applying ANOVA to individual stations is likely
to reveal at least one significant result, as a result of a type I
error due to multiple significance tests across a large number
of groups (e.g. within our own OSCE assessments, a
population of 250 students and approximately 15 parallel
circuits across different sites). Careful post hoc analysis will
indicate any significant hawks and doves effects, and specific
groups should be tracked across other stations to determine
general levels of performance. If a completely random
assessment model of both students and assessors has been
used (mindful of the caveats about local variations in
equipment and exam set up), then many of these effects
should be largely self-cancelling; it is in the aggregate totals
that group-specific fixed effects are important and may
require remedial action.
Metric 6: Between group variance(other effects)
ANOVA analysis can also be of use when there are non-
random allocations of either assessors or students, as is the
case in some medical schools with large cohorts and associ-
ated teaching hospitals where multi-site assessment may
occur. Such complex arrangements can result in the non-
random assignment of assessors to circuits since it is often
difficult for clinical staff to leave their places of work. This may
then lead to significant differences due to ‘site effects’ which
can be identified with appropriate action taken in the analysis
of results.
Other important fixed effects can also be identified through
use of ANOVA. For example, assessor training effects, staff/
student gender effects, and associated interactions, which have
all been previously described (Pell et al. 2008), and which
underline the need for complete and enhanced assessor
training as previously highlighted (Holmboe 2004).
Metric 7: Standardised patientratings
Most centres that use simulated/standardised patients (SPs)
require them to rate candidates, and this typically follows an
intensive training programme. Within our own institution, SPs
would be asked a question such as Would you like to consult
again with this doctor? with a range of responses (strongly
agree, agree, neither agree nor disagree, disagree or strongly
disagree), the two latter responses being regarded as adverse.
Akin to Metric 4 (Number of station failures), a higher than
normal proportion of candidates (e.g.410%) receiving adverse
SP ratings may indicate problems. There is no available
literature on what constitutes an ‘acceptable’ range of SP
ratings at station level, so we have chosen an arbitrary cut off
figure of 10%. The critical issue here is that other station
metrics should be reviewed, and the impact on SP ratings
monitored in response to training or other interventions.
If this is coupled with a higher than normal failure rate, it
could be the result of inadequate teaching of the topic.
Adverse values of this metric are often accompanied by high
rates of between group variance; assessors viewing candidates
exhibiting a lower than expected level of competence often
have difficulty in achieving consistency.
The overall reliability of the assessment may be increased
by adding the SP rating to the checklist score; typically the SP
rating should contribute 10–20% of the total station score
(Homer & Pell 2009). An alternative approach, taken within
our own institution at graduating level OSCEs, is to set a
‘minimum’ requirement for SP comments as a proxy for patient
satisfaction (using rigorously trained SPs).
The 360 degree picture ofOSCE quality
As outlined, it is critical to review station quality in light of all
available station-level metrics before making assumptions
about quality, and planning improvements.
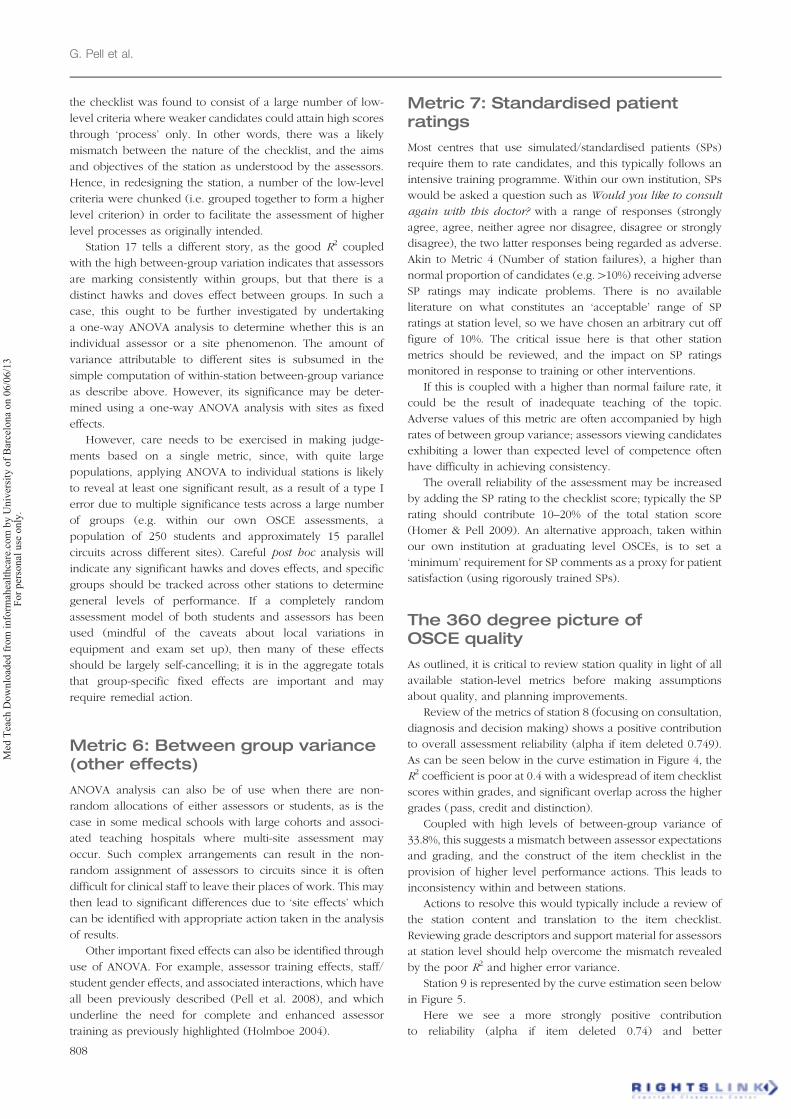
Review of the metrics of station 8 (focusing on consultation,
diagnosis and decision making) shows a positive contribution
to overall assessment reliability (alpha if item deleted 0.749).
As can be seen below in the curve estimation in Figure 4, the
R2 coefficient is poor at 0.4 with a widespread of item checklist
scores within grades, and significant overlap across the higher
grades (pass, credit and distinction).
Coupled with high levels of between-group variance of
33.8%, this suggests a mismatch between assessor expectations
and grading, and the construct of the item checklist in the
provision of higher level performance actions. This leads to
inconsistency within and between stations.
Actions to resolve this would typically include a review of
the station content and translation to the item checklist.
Reviewing grade descriptors and support material for assessors
at station level should help overcome the mismatch revealed
by the poor R2 and higher error variance.
Station 9 is represented by the curve estimation seen below
in Figure 5.
Here we see a more strongly positive contribution
to reliability (alpha if item deleted 0.74) and better
G. Pell et al.
808
Med
Tea
ch D
ow
nlo
aded
fro
m i
nfo
rmah
ealt
hca
re.c
om
by U
niv
ersi
ty o
f B
arce
lona
on 0
6/0
6/1
3F
or
per
sonal
use
only
.
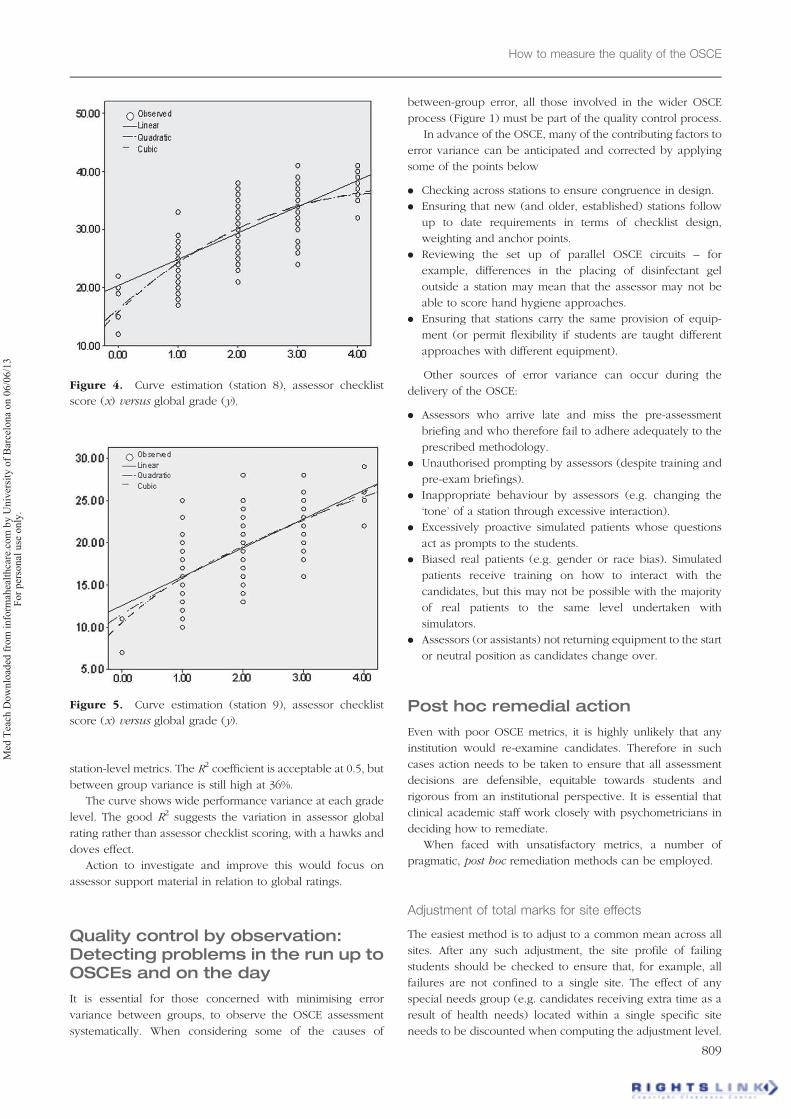
station-level metrics. The R2 coefficient is acceptable at 0.5, but
between group variance is still high at 36%.
The curve shows wide performance variance at each grade
level. The good R2 suggests the variation in assessor global
rating rather than assessor checklist scoring, with a hawks and
doves effect.
Action to investigate and improve this would focus on
assessor support material in relation to global ratings.
Quality control by observation:Detecting problems in the run up toOSCEs and on the day
It is essential for those concerned with minimising error
variance between groups, to observe the OSCE assessment
systematically. When considering some of the causes of
between-group error, all those involved in the wider OSCE
process (Figure 1) must be part of the quality control process.
In advance of the OSCE, many of the contributing factors to
error variance can be anticipated and corrected by applying
some of the points below
. Checking across stations to ensure congruence in design.
. Ensuring that new (and older, established) stations follow
up to date requirements in terms of checklist design,
weighting and anchor points.
. Reviewing the set up of parallel OSCE circuits – for
example, differences in the placing of disinfectant gel
outside a station may mean that the assessor may not be
able to score hand hygiene approaches.
. Ensuring that stations carry the same provision of equip-
ment (or permit flexibility if students are taught different
approaches with different equipment).
Other sources of error variance can occur during the
delivery of the OSCE:
. Assessors who arrive late and miss the pre-assessment
briefing and who therefore fail to adhere adequately to the
prescribed methodology.
. Unauthorised prompting by assessors (despite training and
pre-exam briefings).
. Inappropriate behaviour by assessors (e.g. changing the
‘tone’ of a station through excessive interaction).
. Excessively proactive simulated patients whose questions
act as prompts to the students.
. Biased real patients (e.g. gender or race bias). Simulated
patients receive training on how to interact with the
candidates, but this may not be possible with the majority
of real patients to the same level undertaken with
simulators.
. Assessors (or assistants) not returning equipment to the start
or neutral position as candidates change over.
Post hoc remedial action
Even with poor OSCE metrics, it is highly unlikely that any
institution would re-examine candidates. Therefore in such
cases action needs to be taken to ensure that all assessment
decisions are defensible, equitable towards students and
rigorous from an institutional perspective. It is essential that
clinical academic staff work closely with psychometricians in
deciding how to remediate.
When faced with unsatisfactory metrics, a number of
pragmatic, post hoc remediation methods can be employed.
Adjustment of total marks for site effects
The easiest method is to adjust to a common mean across all
sites. After any such adjustment, the site profile of failing
students should be checked to ensure that, for example, all
failures are not confined to a single site. The effect of any
special needs group (e.g. candidates receiving extra time as a
result of health needs) located within a single specific site
needs to be discounted when computing the adjustment level.
Figure 4. Curve estimation (station 8), assessor checklist
score (x) versus global grade (y).
Figure 5. Curve estimation (station 9), assessor checklist
score (x) versus global grade (y).
How to measure the quality of the OSCE
809
Med
Tea
ch D
ow
nlo
aded
fro
m i
nfo
rmah
ealt
hca
re.c
om
by U
niv
ersi
ty o
f B
arce
lona
on 0
6/0
6/1
3F
or
per
sonal
use
only
.
Adjustment at the station level
This is seldom necessary because any adverse effects will tend
to cancel each other out. In the rare cases where this does not
happen, a station level procedure as above can be carried out.
Removal of a station
Again, this is a rare event and the criteria for this is usually
multiple adverse metrics, the result of which would disadvan-
tage students to such an extent that the assessment decisions
are indefensible against appeal.
Conclusion
Using a series of worked examples and ‘live data’, this guide
focuses on commonly used OSCE metrics and how they can be
used to identify and manage problems, and how such an
approach helps to anticipate future issues at the school/single
institution level. This methodology therefore naturally feeds
into the wider assessment processes as described in Figure 1.
In the authors’ institution, there is a close relationship
between those who analyse the data, and those who design
and administer the clinical assessments and develop/deliver
teaching. Routine and detailed review of station level metrics
has revealed mismatches between checklists and global
ratings. This has lead to the redesign of certain OSCE stations
with a subsequent improvement of metrics. Some of these
redesigns include:
. Chunking of a number of simple criteria into fewer criteria
of higher level.
. Chunking to allow for higher level criteria commensurate
with the stage of student progression, allowing assessment
of higher level, less process-driven performance.
. The inclusion of intermediate grade descriptors on the
assessor checklists.
. Ensuring that checklist criteria have three instead of two
anchors where appropriate, thereby allowing greater dis-
crimination by assessors.
. A greater degree of uniformity between the physical
arrangements of the different circuits.
The presence of high failure rates at particular stations has
lead to a revisiting of the teaching of specific parts of the
curriculum, and was followed by changes in the way things
were taught, resulting in improved student performance as
measured in subsequent OSCEs.
Indications of poor agreement between assessors has, on
occasion, lead to a number of changes all of which have been
beneficial to the quality of assessment:
. Upgrading of assessor training methods.
. Updating (‘refreshing’) assessors who were trained some
time ago.
. The provision of more detailed support material for
assessors.
. Improved assessor briefings prior to the assessment.
. Improved SP briefings prior to the assessment.
. Dummy runs before the formal assessment for both
assessors and SPs (this is only really practicable where
students numbers are relatively small, e.g. resits, and in
dental OSCEs with smaller cohorts of students).
The need for all the above improvements would be
unlikely to have been apparent from using a single reliability
metric, such as Cronbach’s alpha or the G-Coefficient. It is
only when a family of metrics is used that a true picture of
quality can be obtained and the deficient areas identified.
Adopting this approach will be rewarded with a steady
improvement in the delivery and standard of clinical
assessment.
Declaration of interest: The authors report no conflicts of
interest. The authors alone are responsible for the content and
writing of this article.
Notes on contributors
GODFREY PELL, BEng, MSc, FRSS, C.Stat, C.Sci, is a senior statistician who
has a strong background in management. Before joining the University of
Leeds, he was with the Centre for Higher Education Practice at the Open
University. His current research includes standard setting for practical
assessment in higher education, and the value of short-term interventionist
programmes in literacy.
RICHARD FULLER, MA, MBChB, FRCP, is a consultant physician, and
director of the Leeds MB ChB undergraduate degree programme within the
Institute of Medical Education. His research interests include clinical
assessment, in particular monitoring and improving the quality of the OSCE.
MATTHEW HOMER, BSc, MSc, PhD, is a research fellow at the University
of Leeds, working in the both the Schools of Medicine and Education. He
works on a range of research projects and provides general statistical
support to colleagues. His research interests include the statistical side of
assessment, particularly related to OSCEs.
TRUDIE ROBERTS, BSc, MBChB, PhD, FRCP, is a consultant physician, a
professor of Medical Education and is the director of the Leeds Institute of
Medical Education. Her research interests include clinical assessment.
References
Cizek GJ, Bunch MB. 2007. Standard setting. 1st ed. London: Sage
Publications.
Cohen DS, Colliver JA, Robbs RS, Swartz MH. 1997. A large-scale study of
the reliabilities of checklist scores and ratings of interpersonal and
communication skills evaluated on a standardized-patient examination.
Adv Health Sci Educ 1:209–213.
Cusimano M. 1996. Standard setting in medical education. Acad Med
71(10):S112–S120.
Eva KW, Rosenfeld J, Reiter H, Norman GR. 2004. An admissions OSCE:
The multiple mini-interview. Med Educ 38:314–326.
Holmboe E. 2004. Faculty and the observation of trainees’ clinical skills:
Problems and opportunities. Acad Med 79(1):16–22.
Homer M, Pell G. 2009. The impact of the inclusion of simulated patient
ratings on the reliability of OSCE assessments under the borderline
regression method. Med Teach 31(5):420–425.
Newble D. 2004. Techniques for measuring clinical competence: Objective
structured clinical examinations. Med Educ 38:199–203.
Norcini J. 2003. Setting standards on educational tests. Med Educ
37(5):464–469.
Norcini J, Burch V. 2007. Workplace-based assessment as an educational
tool: AMEE guide No. 31. Med Teach 29(9):855–871.
Pell G, Homer M, Roberts TE. 2008. Assessor training: Its effects on citerion
based assessment in a medical context. Int J Res Method Educ
31(2):143–154.
Pell G, Roberts TE. 2006. Setting standards for student assessment. Int J Res
Method Educ 29(1):91–103.
G. Pell et al.
810
Med
Tea
ch D
ow
nlo
aded
fro
m i
nfo
rmah
ealt
hca
re.c
om
by U
niv
ersi
ty o
f B
arce
lona
on 0
6/0
6/1
3F
or
per
sonal
use
only
.
Postgraduate Medical Education Training and Education
Board 2009. Workplace based assessment. A guide for
implementation (London). [Accessed 2009 May 11]. Available from:
www.pmetb.org.uk/fileadmin/user/QA/assessment/PMETB_WPBA_
Guide_20090501.pdf
Regehr G, Macrae H, Reznick RK, Szalay D. 1998. Comparing the
psychometric properties of checklists and global rating scales for
assessing performance on an OSCE-format examination. Acad Med
73(9):993–997.
Roberts C, Newble D, Jolly B, Reed M, Hampton K. 2006. Assuring the
quality of high-stakes undergraduate assessments of clinical compe-
tence. Med Teach 28(6):535–543.
Streiner DL, Norman GR. 2008. Health measurement scales: A practical
guide to their development and use. 4th ed. Oxford: Oxford University
Press.
Wass V, Mcgibbon D, Van der Vleuten C. 2001. Composite undergraduate
clinical examinations: How should the components be combined to
maximise reliability? Med Educ 35:326–330.
How to measure the quality of the OSCE
811
Med
Tea
ch D
ow
nlo
aded
fro
m i
nfo
rmah
ealt
hca
re.c
om
by U
niv
ersi
ty o
f B
arce
lona
on 0
6/0
6/1
3F
or
per
sonal
use
only
.


