Embed Size (px)
Citation preview
How weak are the signals? International price
indices and multinational enterprises
Lorraine Eden1 andPeter Rodriguez2
1Department of Management, Texas A&M
University, College Station, USA, 2The DardenSchool, University of Virginia, Charlottesville,
USA
Correspondence:Professor L Eden, Department ofManagement, TAMU 4221, Texas A&MUniversity, College Station, TX 77843-4221,USA.Tel: þ1 979 862 4053Fax: þ1 979 845 9641E-mail: [email protected]
Received: 23 January 2001Revised: 12 October 2003Accepted: 14 October 2003Online publication date: 8 January 2004
AbstractInternational price indices (IPIs) provide the most timely and comprehensive
market information available to international business. How do multinational
enterprises (MNEs) affect the validity of IPIs? We review the earlier debate overmethods for calculating IPIs, which concluded that unit values were inferior to
specification prices, although most governments produce only unit value indexes.
We explore three ways in which MNEs can affect the validity of IPIs: determining
the ‘representative’ transfer price, excluding intrafirm transactions from the index,and choosing the ‘right’ transfer price along the transportation chain. We argue
that MNE activities strengthen the case for specification prices; although still
uncommon, they are the stronger signal of international markets. Our empiricalanalysis supports this hypothesis, finding that a 10% increase in the intrafirm
trade share of US imports widens the gap between specification price and unit
value by 1.3%, with transfer price manipulation further increasing the gap.Journal of International Business Studies (2004) 35, 61–74. doi:10.1057/palgrave.
jibs.8400069
Keywords: international price index; transfer pricing; intrafirm trade
Since they were first constructed in the late 1960s, internationalprice indices (IPIs) have provided the most timely and compre-hensive information available about international markets. Usedinitially by government statisticians to deflate the foreign tradecomponent of national income accounts, IPIs are now critical toolsfor international business, used for predicting exchange rates,calculating escalator clauses in long-term contracts, conductingstrategic market analyses, and assessing international competition.Ironically, the quality of IPIs may be falling just as this informationis becoming indispensable in an increasingly global environment.We argue that both phenomena – lower quality and greater need –stem from the growing role of multinational enterprises (MNEs) ininternational markets.
MNEs have come to dominate manufacturing industries char-acterized by R&D intensity, economies of scale, scope, and learning(Caves, 1996). In turn, these industries have claimed larger andlarger shares of world trade. In 1999, trade among units of MNEs insuch industries accounted for 47% of US merchandise imports and32% of merchandise exports, by value (US Census, 2000). However,the transfer prices that accompany intrafirm trade (IFT) often donot reflect market forces, either because external markets do notexist or are imperfect, or because transfer prices are manipulated forincome-shifting purposes (Eden, 1998). Transfer price manipula-
Journal of International Business Studies (2004) 35, 61–74& 2004 Palgrave Macmillan Ltd. All rights reserved 0047-2506 $25.00
www.jibs.net
tion (TPM) poses clear problems for IPIs because itreflects efforts to reduce income taxes, the burdensof customs duties or exchange controls, and thusmay be far removed from any reflection of marginalcosts and changes in supply and demand.
Conceptually, IPIs allow for the accurate measure-ment of private sector production and economy-widegrowth by accounting for price changes in exportsand imports (BLS, 1999, Chapter 2: 12). If transferprices are not prices in the classical sense – that is,they do not represent market-clearing forces evi-denced through the actions of unrelated parties –then the link between prices and production isbroken, and our best estimates of changes in inter-national markets are unreliable. By failing to accountfor the problems posed by MNEs, IPIs may offer atbest an incomplete signal of changing competitive-ness and opportunities in international markets.
The purpose of this paper is to answer thefollowing question: How do multinational enter-prises affect the validity of international priceindexes? We address this question in three steps.First, we briefly review the earlier debate over thechoice of IPI methodology – that is, between theunit value index (UVI) and specification price index(SPI). Second, we expound three ways in whichMNEs can affect the validity of IPIs: by determiningthe ‘representative’ transfer price, by excludingsome or all intrafirm transactions from the index,and by choosing amongst alternative ‘right’ trans-fer prices along the transportation chain. Third, weargue that IFT actually strengthens the case forusing SPIs. We estimate the impacts of IFT andtransfer pricing on the gap between US importprices and unit values, using monthly US importdata for January–June 1999. We find that a 10%increase in the share of IFT causes the logged pricegap to rise by 1.3%; government trade barriers thatprovide transfer pricing arbitrage opportunitieswiden the SPI–UVI gap. We conclude that MNEactivities strengthen the case for SPIs; although stilluncommon, they are a stronger signal of interna-tional market forces than UVIs.
The old debate: which index – SPI or UVI?There are two different approaches to constructingIPIs: unit values and specification prices. A UVIsimply divides the value of international trade(either exports or imports or both) by somemeasure of the volume of international trade. TheUVI is, by an overwhelming margin, the mostcommon approach used by national statisticalagencies (Lipsey, 1994; OECD, 1999a, b). However,
the problems with UVIs are well known (Alterman,1991; Kravis and Lipsey, 1971; Lipsey, 1994).Changes in value occur for many reasons, not justchanges in price. Changes in quantity shares,holding prices constant, can cause UVIs to over-estimate or underestimate actual prices (Feenstraand Shiells, 1997). Even if quantity is fixed, changesin quality, terms of payment, product mix, andexchange rates imply that dividing value byquantity will not yield a well-defined price. More-over, where quantity figures are unavailable, unitvalues cannot be computed, causing a high dropoutrate from the index. These problems are particularlyacute for manufactured goods where qualitychanges are frequent and the rate of new productdevelopment is high (Lipsey et al., 1991).
The main alternative to the UVI, first developedby Kravis and Lipsey (1971), is the SPI, in which thegovernment, on a monthly basis, collects indivi-dual export and import prices for a huge list ofproducts representative of the composition of acountry’s international trade flows. Prices arecollected from customs declarations, shippinginvoices and surveys of individual businesses. Theadvantages of such a detailed, hands-on approachare clear: the index takes product specifications intoaccount when price changes are measured. Bykeeping product selection constant and makingadjustments for quality changes, the SPI guaranteespure price comparisons.
Because the high cost of producing SPIs, only afew countries have developed and disseminate SPIs;all are OECD members (OECD, 2001: Table 3). TheUS Bureau of Labor Statistics (BLS) (1997: 158) hasthe most sophisticated program.1
Despite their many advantages, SPIs are notproblem free. A key decision is who and what tosample, as the reliability of an SPI depends on theselected items being representative of all tradeflows. As specification data are collected fromvoluntary surveys of firms, non-response bias isalso a problem. Moreover, the statistical agencymust decide how to handle new and obsoletegoods, whether to ignore seasonal variations, andhow to deal with rapid technological change(Diewert and Feenstra, 2001; EUROSTAT, 2001;Feenstra and Shiells, 1997; Lipsey et al., 1991). Still,after comparing the benefits and costs of UVIs vsSPIs, it seems clear that only SPIs provide reason-able measures of international market conditions.EUROSTAT (2001: 60–61) concluded as much,arguing that UVIs were inappropriate for ‘productsof a unique nature’ and were, at best, poor indexes
How do MNEs affect the validity of IPIs? Lorraine Eden and Peter Rodriguez
62
Journal of International Business Studies
for capital goods. EUROSTAT gave an A (best) ratingto SPIs and a B (acceptable) rating to UVIs forhomogeneous products, but UVIs for productswhere quality changes were frequent received a C(unacceptable) rating.
The current debate over international priceindexes, therefore, focuses less on which method touse for calculating IPIs (where SPI is the clearwinner) and more on how to improve the quality ofprice indexes. Our paper contributes to the newdebate by analyzing how MNEs affect the validity ofIPIs.
The new debate: how do MNEs affect IPIs?The growing importance of IFT challenges thecreation of international price indexes. An IPI mustinclude MNE transactions to be reasonably repre-sentative, and yet it cannot fulfill its purposes ifbiased by prices that do not reflect market condi-tions. Consequently, we confront the problem ofexcluding some or all intrafirm prices, and thusdiscarding the heavy influence of MNEs on worldtrade, or including all intrafirm prices and poten-tially biasing the IPIs in ways we do not fullyappreciate. Indeed, we know very little about howIFT and transfer pricing affect international priceindexes, either theoretically or in practice.
One insight is provided by Alterman (1997a, b),who compared the US export price index with theproducer price index for semiconductors. Transferpricing was an important factor explaining pricedifferences. Producer prices for semiconductorswere generally arm’s length (and falling) marketprices, whereas export prices were cost plus (andflat) transfer prices. A second insight is provided byFeenstra and Shiells (1997), who hypothesized thatproducts with rising (falling) import shares shoulddownward (upward) bias the US import price indexbecause import expenditure shares for the sampledfirms were held constant during the sample time-frame. The authors argued that IFT should reducethis bias because transfer prices were less likely thanarm’s length prices to reflect economic values.Their empirical work confirmed these hypotheses:the US import price index appeared to be upwardbiased by about 1.5% annually as compared with anexact price index, and the bias was smaller forindustries with below-average shares of IFT. Theproblem of rising/falling expenditure shares shouldplague UVIs even more than SPIs because move-ments in import quantities are reflected in UVIseven when prices are constant (EUROSTAT, 2001:30–31).
In this section, we explore three issues that IFTand transfer pricing pose for the validity of IPIs:
(1) What is the ‘basic’ or ‘representative’ price forintrafirm transactions? Should IPIs use reportedtransfer prices or alternative pricing methods?
(2) Should IPIs exclude IFT when transfer prices donot reflect market prices?
(3) What point along the transportation chainshould be the basic transfer price for calculatingIPIs?
What is the ‘basic’ price for intrafirm transactions?International price indexes are based on the ideathat ‘index numbers should relate directly to theoptimizing problems of the agents engaging in theactivity being measured’ (Diewert, 1993: 43).Firms are assumed to be price takers, maximizingprofits under perfect competition and constantreturns to scale (Alterman et al., 1999: 10–16).Index numbers are drawn from ‘representative’ or‘basic’ prices for arm’s length transactions incompetitive markets. The basic export price is theactual price receivable by the exporter; the basicimport price is the actual price payable bythe importer (IMF, 2001b, Chapter 10: 7). Interna-tional price indexes are therefore built on theassumption that market prices are arm’s lengthprices reflecting marginal costs in competitivemarkets. This is clearly not the case where MNEsare concerned.
Because the inherent difficulties of incorporatingtransfer prices into IPIs, no such index has beendeveloped. However, we can draw inferences fromthe microeconomic theory of transfer pricing(Diewert, 1985; Eden, 1998), which theorizes thatthe welfare-maximizing transfer price is the eco-nomically efficient (shadow) transfer price. In theabsence of an external market for the product,the efficient transfer price is the marginal cost ofthe exporting affiliate or the net marginal revenueof the importing affiliate. (These are opposite sidesof the same transaction.) When an external marketexists for this product, the market price and theefficient transfer price are one and the same(Hirshleifer, 1956).
This analysis holds, however, only in the absenceof trade barriers and interdependencies among theMNE’s affiliates. Ghemawat (2003) provides empiri-cal evidence that international product and factormarkets are semiglobalized, and argues that arbit-rage is a key strategy that MNEs use to takeadvantage of semiglobalization. Where trade
How do MNEs affect the validity of IPIs? Lorraine Eden and Peter Rodriguez
63
Journal of International Business Studies
barriers and income tax differentials exist, the MNEcan increase its after-tax global profit througharbitrage, trading the income gains from TPMagainst the resource allocation costs of movingaway from the efficient transfer price (Horst, 1971).Income shifting through TPM has been welldocumented in the literature (Eden, 1998). Inaddition, with interdependencies among affiliates,non-market-based prices may also be more efficientthan market prices. For example, Colbert and Spicer(1995) show that, when asset specificity is high,MNEs prefer cost-based transfer prices and discou-rage their affiliates from using external markets.When income-shifting incentives are high, actualtransfer prices may bear little relation either tomarket prices (if they exist) or to the ‘representa-tive’ price on which the economic approach toindex number theory is built.
How, then, should transfer prices be included inIPIs? We argue that transfer prices should not betaken at face value by statistical agencies andincluded directly in IPIs, because these prices arelikely to be distorted, particularly in markets wheretrade barriers are high. A parallel caution isevidenced in the practices of both tax and customsauthorities that require MNEs to set transfer pricesfollowing the arm’s length standard, the price thattwo unrelated parties would have negotiated for thesame product under the same circumstances (Eden,1998). Where comparable external market pricesexist, current regulations in all OECD countriesrequire MNEs to use market-based prices. Wheremarket prices are not available, transfer prices basedon manufacturing mark-ups or distribution mar-gins are normally acceptable under OECD transferpricing guidelines (OECD, 1995).
As both customs and income tax authoritiesfollow the arm’s length standard, this suggests thatthe statistical agencies responsible for calculatingIPIs should use the same approach. Where externalmarkets exist, the representative or basic transferprice should be the arm’s length price in theinternational market of a product comparable, withadjustments made if necessary to ensure compar-ability. There is some support for this in the IPIliterature. Kravis and Lipsey (1971: 79) recommendreplacing the transfer price with the price at the firstsale to an independent foreign producer for intrafirmexports from a US parent to its foreign affiliates.However, if the MNE centralized exports in atrading company that charged one arm’s lengthprice worldwide, they recommend using upstreamtransfer prices (or production costs) instead of the
arm’s length price because they better reflect trademovements (Kravis and Lipsey, 1971: 313).
Where product comparables are not available,customs and tax authorities require MNEs to usegross margin methods to value intrafirm transfers.For example, in knowledge-intensive industrieswhere organized exchanges or reference prices aretypically unavailable (Buckley and Casson, 1976;Caves, 1996; Rauch, 1999), gross margin methodssuch as arm’s length manufacturing mark-ups (costplus) or distribution margins (resale minus) drawnfrom comparable firms are used to ‘back into’ thetransfer price. This suggests that IPIs could beconstructed in a similar manner, using grossmargins, as a secondary method when interna-tional arm’s length prices do not exist.
Should ‘wrong’ transfer prices be excluded?Given the theoretical problems that TPM raises forthe optimal construction of IPIs, perhaps it wouldbe simpler to exclude IFT from the indexes. Theargument for doing this is that transfer prices arenot prices in the classical sense: they do notrepresent market-clearing forces. However, exclud-ing IFT means that arm’s length transactions mustrepresent all international transactions, even thosewithin MNEs. Excluding MNE activities from IPIswould also bias IPIs towards small, purely domesticfirms and thereby eliminate any information aboutMNE behaviors in the markets they dominate.
To appreciate the extent to which the exclusionof intrafirm trade (IFT) can limit the usefulness ofIPIs, consider the following statistics from the USCensus (2000). In 1999, related party tradeaccounted for 47% of US merchandise importsand 32% of merchandise exports, by value. Theaverage intrafirm trade share of US exports rangedfrom a high of 44% with Mexico to a low of 6%with the former USSR. The average intrafirm tradeshare of US imports was considerably higher in twolarge trading partners, Japan (74%) and Mexico(66%). IFT shares also varied enormously bycommodity and were particularly high for motorvehicles, electrical products, computers, andmachinery (US Census, 2000).
A second alternative would be to include onlytransactions where the transfer price was based onan arm’s length price. The BLS did this untilrecently. Before February 1998, the US export andimport price indexes included intrafirm transac-tions only when the transfer price trended withmarket prices; all other transfer prices wereexcluded from the indexes. These exclusions
How do MNEs affect the validity of IPIs? Lorraine Eden and Peter Rodriguez
64
Journal of International Business Studies
exerted a cost in the applicability and reliability ofthe US export and import price indexes and led tosignificant under-reporting of trade with particularcountries and in particular commodities. Simplecounts of the numbers of items in the BLS pricesurveys between January 1997 and June 2000 showthat approximately 25% of export items and 40% ofimport items were omitted because the transferprices did not trend with market prices.
What is the ‘right’ transfer price along thetransportation chain?Once we conclude that it is best to incorporate allintrafirm transactions in the calculation of IPIs,there remains the equally critical issue of the stageat which the transfer price should be measured. Thesequence of prices can be thought of as aninternational transportation chain – the chain ofprices that emerges as a product moves fromproduction in the origin country to final sales inthe destination country. Measurement at differentpoints in this chain leads to different reportedprices. We argue that the ‘right’ stage depends onthe purpose for which the IPI is to be used.Consider these alternative pricing points.
From the exporter’s perspective, we start with thefactory gate price, which offers the nearest approx-imation to producer costs. The pre-tax export priceis the private sector product price (factory gate plusinland transport, insurance, and fees), whichmeasures the economic cost to the firm of produ-cing this product for export rather than for localsale. Increased production costs raise the pre-taxexport price, but higher export taxes do not affectthis price. The post-tax or water’s edge export pricemeasures the price as the product moves offshore:that is, the price includes export taxes/subsidiesand value added taxes.
From the importer’s perspective, the pre-tariff orwater’s edge import price (CIF) is the price fordelivering a product to the importing country’spoint of entry or water’s edge, including interna-tional freight and insurance but excluding tariffsand value added taxes. Because internationaltransport costs vary with location and method oftransport, this price can move separately from thepre-tax export price. From the perspective of theexporting country, this is the price for moving theexported product to the importing country’s bor-der. The post-tariff import price is the price ofdelivering a product to the importer, inclusive ofthe customs duty. As duties vary across countries,this price provides a measure of the cost of getting
the product ‘on the ground’ (‘over the tariff wall’)in the importing country. The BLS calls this theimport-for-consumption price, and uses it to calcu-late the impact of imports on domestic inflationand short/long-term price trends. Once onshore,the product may move through several more stagesbefore it is sold to final consumers.2
The transportation chain illustrates the variety ofprices that could be tracked by an IPI program.Current UVI and SPI programs track only two, oneeach for exports and imports. The water’s edgeexport price is the export price used by OECDcountries. The BLS calls this price the general exportor free-alongside-ship (FAS) price; other governmentscall it the export price (FOB). The BLS also collectsthe same price, from the importing country’sperspective, as the general import price (FOB). TheUS is alone in this regard, however; other OECDgovernments use the water’s edge import price (CIF)to measure UVIs for imports (OECD, 1999a, b,2000).
We argue that the ‘right’ transfer price for IPIsdepends on the purpose of the index. As IPIs areused for multiple purposes, multiple transfer pricesneed to be tracked.3 However, we recognize that theadministrative cost associated with collecting andgenerating price indexes is an important constraint.SPIs are already expensive, as witnessed by thesmall numbers of countries that produce theseindexes relative to the numbers producing UVIs.Still, it is important from theoretical and policyperspectives to assess what the appropriate transferprice should be, even if few statistical agencies atpresent can afford to generate multiple indexes.
For example, if the goal is to deflate balance ofpayments statistics for international trade – theoriginal purpose of IPIs – the general export price(FAS) and general import price (FOB) are the correctones as they measure the terms of trade facing acountry in international markets. However, if thepurpose of the IPI is to assess export competitive-ness for a particular product or market, the rightprice depends on whether one takes an exportneutrality or import neutrality perspective.4 Inassessing their competitiveness, producers need tocompare the real resource costs of two alternatives –exports vs domestic sales – as the opportunity costof exports to the firm is forgone domestic sales. Thissuggests that the appropriate price is the pre-taxexport price, not the general export price. Forcompetitive assessments between exporters fromdifferent countries in terms of sales into the sameforeign market, the appropriate import neutrality
How do MNEs affect the validity of IPIs? Lorraine Eden and Peter Rodriguez
65
Journal of International Business Studies
price index should be based on the water’s edgeimport price. The water’s edge price is better for thispurpose because it is unaffected by tariffs, whichchange over time and differ by exporting country.On the other hand, for competitiveness assess-ments between exporters and domestic suppliers,the appropriate import neutrality price indexshould go even further downstream to the ‘‘dis-tributor’s price’’ or the retail sales price. Theobjective in this case is to compare likely retailprices facing consumers in the importing country.
The choice among prices has another implicationthat arises when MNEs are vertically integratedacross the transportation chain. In these instances,the MNE can manipulate transfer prices so as torealize profits at any point along the chain (Eden,1998; Horst, 1971). Thus the choice of valuationpoint can significantly affect the IPI when IFT isincluded. The same problems arise with horizon-tally integrated intrafirm transactions, particularlyin knowledge-intensive industries when arm’slength prices are not available (Buckley and Casson,1976; Caves, 1996; Rauch, 1999).
How weak are the signals?We conclude that the appropriate treatment ofintrafirm trade and transfer pricing is critical forensuring that IPIs are representative and usefulsignals of changing conditions in global markets.But, how critical? How weak are the signals? In thissection, we make a first attempt to show empiri-cally how the intrafirm transactions of MNEs canand do affect international price indexes.
The old literature comparing SPIs with UVIs,which we reviewed above, argued that the SPI–UVIprice gap depended on differences in quantities andqualities of the traded product, exchange rates,terms of payment, and the product mix (Alterman,1991; EUROSTAT, 2001; Feenstra and Shiells, 1997;Kravis and Lipsey, 1971; Lipsey, 1994; Lipsey et al.,1991). The literature also expected the price gap tobe especially pronounced for knowledge-basedintermediate and capital goods. As our interest liesin understanding how MNE activities affect the SPI–UVI gap, we control for the variables discussed inthis earlier literature.
Our variables of interest relate to MNE activities.We hypothesize that the SPI–UVI gap will beaffected by the type of trade (intrafirm vs arm’slength), the MNE’s transfer pricing method, andgovernment policies that induce income shifting.We argue that TPM should increase with thepresence of corporate income tax differentials,
bilateral tax treaties, tariffs, political risk, andforeign exchange controls – the traditional policiesthat cause income shifting. TPM, on the otherhand, should be reduced where arm’s length pricesare readily available, because in these cases govern-ment authorities will use the arm’s length standardto constrain transfer prices, and MNEs themselveswill take market prices into account when settingtheir transfer prices (Eden, 1998; Horst, 1971). Ourmodel is represented by equation (1), in which IFTis a dummy variable (0¼arm’s length trade,1¼intrafirm trade)5
PXGAP ¼ aCONTROLS þ bIFT þ yPOLICY
þ fIFT�POLICY þ e ð1Þ
Data and variables
Dependent variableOur dependent variable is the SPI–UVI gap. Becauseinternational price indexes are based on month-over-month changes in prices, we do not use thesimple difference between the specification price(PX) and unit value (UV), but rather the differencebetween percentage changes in PX and UV. That is,our dependent variable is LNPXGAP¼LN(PX/UV)¼LNPX�LXUV. We compared unit values withspecification prices for US monthly import transac-tions at the six-digit HSCODE level, for January–June 1999. Unit values were calculated as value/volume, using the US Census’s monthly CD-ROMsfor US merchandise imports (US Census, 1999).6
The specification prices come from a confidentialBLS data set of monthly US import prices based on avoluntary survey of approximately 8000 companiesengaged in US trade (Alterman et al., 1999; BLS,1997). We developed a concordance between thetwo sets at the six-digit HSCODE so our prices andunit values are HSCODE averages by country andmonth.
Control variablesOur control variables were selected from the earlierliterature on SPIs vs UVIs. First, quantity changeshave been used as a rationale for LNPXGAP asquantity changes, even with fixed prices, causemovement in UVIs. Feenstra and Shiells (1997)argued that SPIs would be less responsive tochanges in intrafirm as compared with arm’s lengthtrade. We include the natural log of importquantity (LNQ) from the US Census CD-ROMs as acontrol variable.7 If importers switch quantities to
How do MNEs affect the validity of IPIs? Lorraine Eden and Peter Rodriguez
66
Journal of International Business Studies
cheaper inputs in response to cost-cutting pres-sures, holding prices constant, UVI would fallwhereas SPI would be unchanged. We thereforeexpect LNQ to be positively correlated withLNPXGAP.
Second, perhaps the most important factorinfluencing LNPXGAP, according to the literature,is changes in quality and product features. UVIsignore these changes; however, the BLS takes theminto account through the creation of a link price tothe transaction price. Using this information in theBLS data set, we include a dummy-variable LINK(0¼no link; 1¼link) for quality changes; we expectits sign to be positively related to LNPXGAP. As asecond proxy for product characteristics, we use theABSORB routine and AREG ROBUST in STATA 6.0 toinclude dummy variables for each of the 1641HSCODEs in our sample.
Third, a key difference between UVIs and SPIs isthat UVIs include all international transactions,whereas the IPIs are derived from a volunteersurvey of a relatively small number of items, witha high non-response rate (in any given month, 30%of BLS import items do not have reported prices).To handle this problem, we first group ourobservations by HSCODE�COUNTRY�MONTH,and discard all grouped observations that do notappear in both data sets. Our final data set consistsof 19,635 observations, based on 1641 HSCODEsand imports from 103 countries.8 Second, where amonthly observation is missing, the BLS imputes aprice based on the average price movement of othertransactions in the same group. We use PXFLAG as adummy variable to take account of imputed pricesby the BLS (0¼no imput, 1¼imput) and expectPXFLAG to be positively related to LNPXGAP.
Fourth, exchange rates have been hypothesized asan explanation for differences between UVIs andSPIs. We control for this possibility using LNEX-RATE, the natural log of the US dollar equivalentexchange rate on a monthly basis; our data are fromIMF (2001a). Clausing (2001) found that move-ments in the US dollar equivalent were positivelyrelated to US export and import prices. To theextent that specification prices more accuratelyreflect exchange rate changes (pass through) com-pared with unit values, we expect LNEXRATE to bepositive.
We also control for dollar-invoiced imports.Almost 90% of imports in the BLS data set areinvoiced in US dollars, the rest almost entirely inthe exporter’s home currency. We expect dollar-invoiced imports to be less sensitive to exchange
rates and therefore predict a negative sign on thedummy-variable INVOICE (1¼invoiced in US cur-rency; 0¼all others).
Fifth, we include four control measures related tothe transportation chain. Although both US Censusand the BLS price data should be in FOB terms, inpractice the BLS takes both FOB and CIF prices.Each item in the BLS data set has a tag for the typeof price basis. We used these tags to generate adummy-variable FOBCIF (0¼FOB, 1¼CIF) to testwhether differences in the point at which prices aremeasured along the transportation chain affectLNPXGAP. To the extent that BLS prices are CIFbased, we expect a positive sign on FOBCIF becausespecification prices should be higher than unitvalues.
As an additional control for transport costs, weused Feenstra’s (1996) CD-ROM for US trade flows,which reports FOB and CIF import prices, tocalculate average insurance and freight rates as apercent of the CIF import price, by three-digit SITCand by country. LNCIF is the natural log of 1 minusthis variable as a proxy for CIF rates.9 Again, to theextent that specification prices are CIF while unitvalues are FOB, we expect higher freight andinsurance costs to be positively related to LNPXGAPso the sign on LNCIF should be negative. We alsoinclude LNDIST, the natural log of the great circledistance between capital cities, as a proxy for thelength of the transportation chain; again, expectingLNPXGAP to be positively related to this distancemeasure. For example, Parsley and Wei (2000)found that great circle distance had a positiveimpact on price differentials between paired citiesin the United States and Japan. Great circle distancedata were provided to us by John Byers. Last, weinclude dummy variables for items that wereimported from the US’s largest trading partners(Mexico, China, Japan, UK); the largest (Canada)was dropped due to multicollinearity with LNDIST(US Census, 2000). A priori, we have no expectationas to the signs on these country dummies.
Our final control variable provides a link betweentraditional explanations for LNPXGAP and ourMNE-related explanations. Quality and productcharacteristic changes should be greatest for differ-entiated products where organized exchanges and/or reference prices do not exist (Rauch, 1999). ThusLNPXGAP should be positively related to highlydifferentiated products and negatively related tocommodities traded on organized exchanges(e.g., London Metal Exchange). In addition, TPMshould be highest for differentiated products where
How do MNEs affect the validity of IPIs? Lorraine Eden and Peter Rodriguez
67
Journal of International Business Studies
arm’s length prices do not exist. To test thesehypotheses, we adopted Rauch’s (1999) five-digitSITC Revision 2 classification of product markets as0 (organized exchange), 1 (reference prices), or 2(differentiated products). We developed a concor-dance between Rauch’s scales and our six-digitHSCODE and generated the variable RAUCH, ran-ging from 0 to 2, to proxy for the increasedprobability that external market prices exist. Fromthis variable we created RAUCHOE (organizedexchange), RAUCHREF (referenced prices), andRAUCHDIF (differentiated products).10 We includeRAUCHOE and RAUCHDIF as control variables,expecting a negative sign on RAUCHOE and apositive sign on RAUCHDIF.
Independent variablesIFT is our key variable in Eq. (1), and we focus onboth its direct and indirect (through the POLICYvariables) impacts on LNPXGAP. The IFT dummyvariable is coded, by import item, in the BLS dataset.11 As SPI is a direct measure of prices whereasUVI is (at best) an indirect measure, we expect thesign on IFT to be positive. That is, as the share ofIFT rises within an HSCODE group, the logged gapbetween specification prices and unit values shouldincrease. We also include dummy variables for theMNE’s transfer pricing method. The BLS datadistinguish between three methods (price based,cost based, and other). We include dummy vari-ables for market-based transfer prices (TPCUP) andcost-based transfer prices (TPCOST). FollowingAlterman (1997a), we expect the sign on TPCOSTto be negatively related to LNPXGAP. To the extentthat arm’s length prices exist, we also expect TPCUPto be negatively related to LNPXGAP.
We include six policy variables that the literaturepredicts will induce income shifting through TPM.We do not have any a priori predictions about thedirect relationship between LNPXGAP and thesepolicy variables (with two exceptions, see below);our predictions concern their indirect relationshipsthrough IFT.
Our first three policy variables are tax related;these data were hand collected, for each country in1999, from various accounting, tax, and legalsources. LNTXMIN is the natural log of 1 minusthe minimum statutory corporate tax rate (CIT) inthe exporting country, ln(1�tx). We expect MNEs tooverinvoice US intrafirm imports from low-taxcountries in order to shift profits to the low-taxlocation. Therefore, LNPXGAP should be positivelyrelated to the interaction term IFT�LNTXMIN. Our
second tax variable, LNTXGAP, measures the degreeof ring fencing in the foreign country: that is, the gapbetween the minimum and maximum CIT rates,ln(tx
max�txmin), where the maximum rate includes
the withholding rate on repatriated dividends. Aswe treat minimum CIT as the host CIT rate, our ringfencing variable measures the likelihood that theMNE will have to pay a foreign tax rate that ishigher than the minimum rate. The greater thatlikelihood, the less should be the MNE’s incentiveto engage in TPM. We therefore expect a negativesign on the interaction IFT�LNTXGAP.
We also include a dummy variable identifyingwhether the foreign country had a double tax treatywith the United States in 1999, TREATY (1¼yes,0¼no), using the US Treasury’s website list of US taxtreaties. As tax treaties provide MNEs with ‘stability,transparency, and certainty of treatment’ (UNCTAD2000, 2002: 81), we hypothesize that TPM shouldbe more likely where a treaty is in force. Wetherefore expect a positive sign on the interactionbetween IFT and TREATY.
Our fourth policy variable is the US tariff rate.Using Feenstra’s (1996) CD-ROM, we created aver-age US tariff rates by six-digit HSCODE andcountry.12 Our LNTARIFF variable is ln(1�t), wheret is the tariff rate. Both SP and UV prices aremeasured on a pre-tariff basis; however, if the US isa price maker in world markets (which we assume itis), the incidence of the US tariff will fall at leastpartly on foreign exporters, depressing their FOBexport prices. Thus higher US tariff rates should beassociated with lower specification prices, and thedirect relationship between TARIFF and LNPXGAPshould be positive. From an IFT perspective, higherUS tariffs should encourage underinvoicing. There-fore the indirect effect of the tariff, measured by theinteraction term IFT�LNTARIFF, should also bepositive.
As a general measure of policy instability, weinclude political risk. Using the monthly compositerisk rating from the International Country RiskGuide (ICRG), we construct LNPOLRSK, the naturallog of the ICRG ratings (our data are reversed asICRG gives a high rating to a low-risk country). Weexpect underinvoicing from high-risk countries, sothe interaction term between IFT and LNPOLRSKshould be negative.
Lastly, we include a dummy-variable EXCNTRLfor countries with foreign exchange controls in1999; the data were hand collected from varioustax, accounting, and legal sources. We used a three-level format (0¼no controls, 1¼minimal controls,
How do MNEs affect the validity of IPIs? Lorraine Eden and Peter Rodriguez
68
Journal of International Business Studies
2¼high controls). To the extent that foreignexchange controls act as a tax on foreign exports,the direct impact of EXCNTRL on LNPXGAP shouldbe positive. We expect MNEs to underinvoice USintrafirm imports to avoid these controls, so theindirect effect IFT�EXCNTRL should be negative.
Empirical resultsTable 1 provides descriptive statistics for ourvariables. We include pairwise correlations withLNPX, LNUV, and LNPXGAP. In general, the signsfor LNPX and LNUV are in the same direction, withthe correlations being larger for LNUV. IFT ispositively related to both price measures. LNPXGAPis most strongly correlated with LNQ (0.31), FOBCIF(0.14), RAUCHDIF (�0.18), and LNTARIFF (0.17).
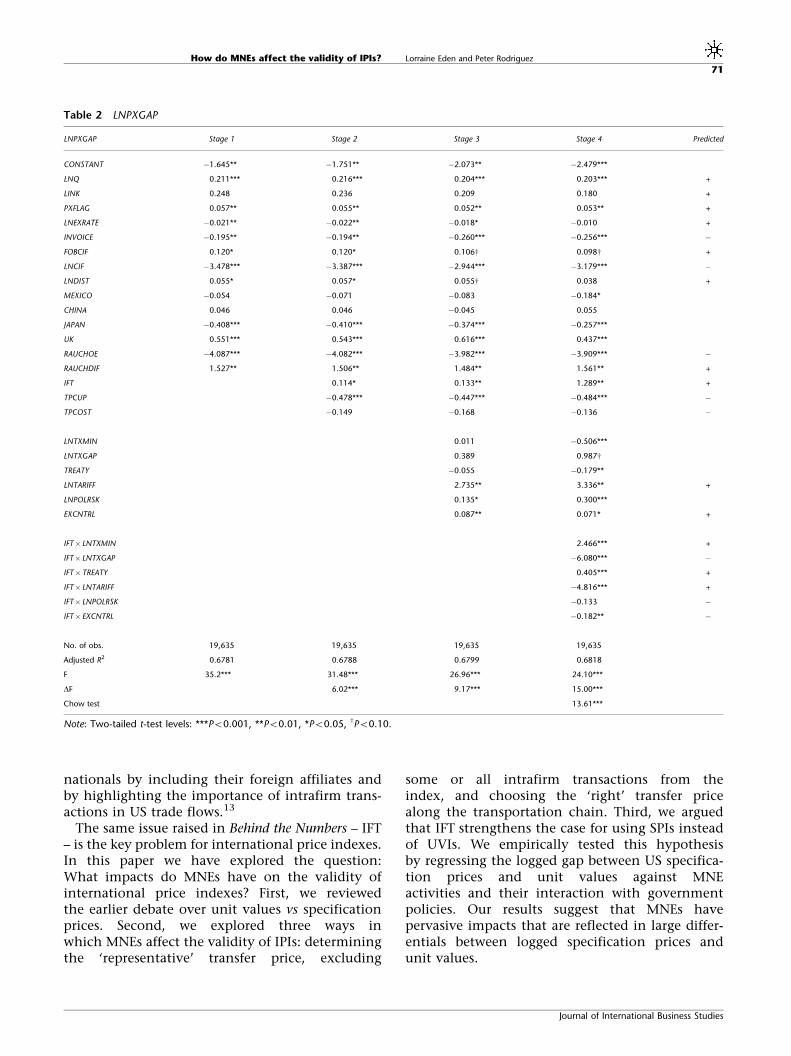
Because we have cross-section, time-series datawith a large dummy-variable set, we use the AREGROBUST regression technique with White-correctedstandard errors in STATA 6.0. All variables, otherthan dummy variables, are measured in naturallogs. Our results are reported in Table 2. Theregressions include 1641 absorbed dummy variablesfor HSCODE and five dummy variables for months2–6, which are not reported. We follow a hierarch-ical approach, first regressing the dependent vari-able LNPXGAP against the control variables (stage1), next adding the IFT variables (stage 2), thenadding the POLICY variables (stage 3), and finallyincluding interaction terms between IFT and thePOLICY variables (stage 4). We adopt the conserva-tive two-tailed t-test for significance, and report thechange in F distribution as we add new variables.Column 5 reports the predicted signs for eachvariable.
The adjusted R2 squared ranges from 0.6781 to0.6818 across the four regressions. The change in Fis significant as we move from one regression to thenext, showing that our model in Eq. (1) has goodexplanatory power. In regression 4, where interac-tion terms with IFT are included, the Chow testresult is 13.61 and also strongly significant, imply-ing that IFT is a moderator of the relationshipbetween POLICY variables and LNPXGAP.
The signs on most of the control variables are aspredicted, with the exception of LNEXRATE. Themost representative regression is Stage 3, where allthe variables are included. As hypothesized, bothRAUCH variables have the predicted signs. As ourregression is in logs, the coefficient on each variablemeasures the responsiveness of the price gap to achange in an independent variable, Ceteris paribus.Thus a 10% increase in the quantity purchased of
product at the six-digit HSCODE level causes a 2%increase in the gap between specification prices andunit values, Ceteris paribus.
The sign on the IFT variable is positive andsignificant. It suggests that a 10% increase in theshare of IFT, within a six-digit HSCODE, causesLNPXGAP to rise by 1.3%. The transfer pricingmethod, however, can offset this tendency, asmarket- and cost-based transfer prices tend toreduce the price differential (although only mar-ket-based prices are statistically significant).
The two direct effects of government policies (thetariff and foreign exchange controls) on LNPXGAPare both significant and have the expected signs.Interestingly, POLRSK is also significant and posi-tive. In stage 4, the POLICY� IFT interaction termsare significant and large, with the exception ofLNPOLRSK. IFT retains its significance, implyingthat IFT has both direct and indirect impacts onLNPXGAP. All the interaction signs have thepredicted signs with the exception of TARIFF.Although the sign on TARIFF� IFT is negative,contrary to our prediction, the direct impactincreases from 2.735 to 3.336 percentage points ashypothesized. When US imports are sourced fromlow-tax countries through IFT, LNPXGAP increasesby 2.466 percentage points. Ring fencing alsosignificantly contributes to the logged price gap,in the presence of IFT. Lastly, foreign exchangecontrols encourage MNEs to underinvoice USintrafirm imports, dampening LNPXGAP, asexpected.
Discussion and conclusionsThe National Academy of Sciences, in its reportBehind the Numbers (Kester, 1992: 16), recom-mended that US government agencies developbetter statistical measures for ‘capturing in moredetail the rapidly growing intracompany trade andtrade in intermediate inputs’. The report arguedthat US businesses were facing increasingly com-plex issues due to globalized markets, such asweighing opportunities to sell at home vs abroad,to produce for export or undertake FDI, and toimport components or source locally. At the sametime, governments needed better data in order tocoordinate macroeconomic policies, negotiateimproved access to foreign markets, and assess themacroeconomic effects of international transac-tions on the domestic economy. A key recommen-dation in Behind the Numbers was the developmentof an ownership-based balance of payments thatwould better measure the activities of US multi-
How do MNEs affect the validity of IPIs? Lorraine Eden and Peter Rodriguez
69
Journal of International Business Studies
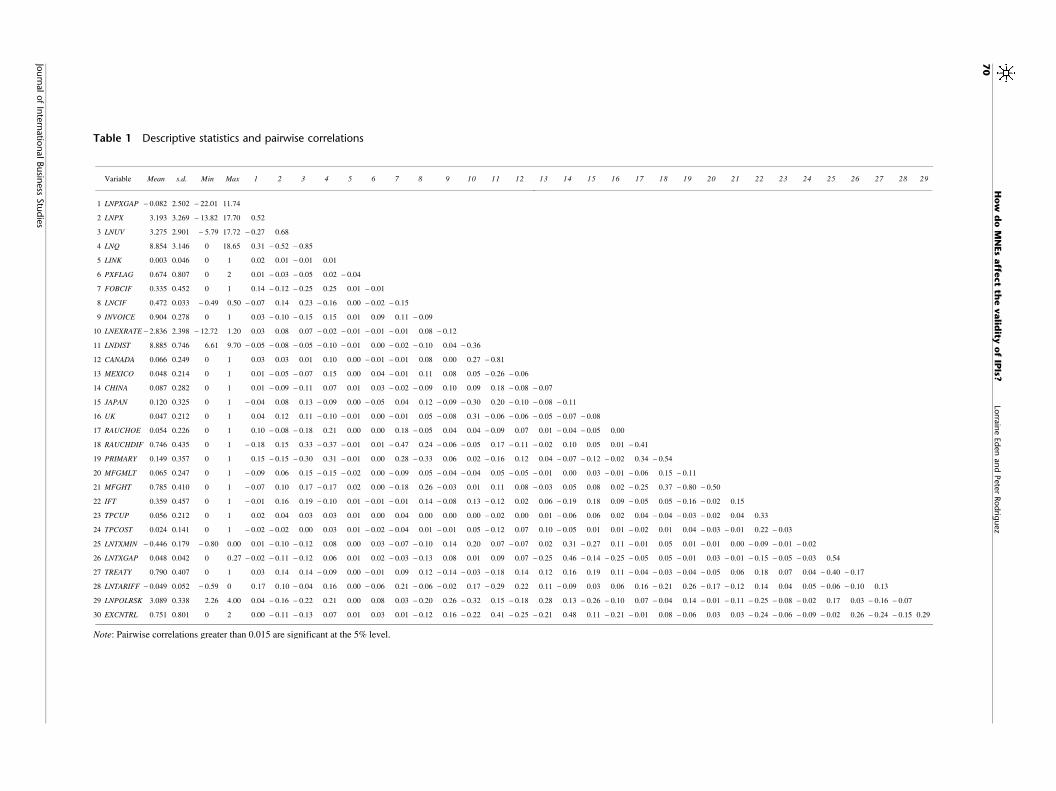
Table 1 Descriptive statistics and pairwise correlations
Variable Mean s.d. Min Max 1 2 3 4 5 6 7 8 9 10 11 12 13 14 15 16 17 18 19 20 21 22 23 24 25 26 27 28 29
1 LNPXGAP − 0.082 2.502 − 22.01 11.74
2 LNPX 3.193 3.269 − 13.82 17.70 0.52
3 LNUV 3.275 2.901 − 5.79 17.72 − 0.27 0.68
4 LNQ 8.854 3.146 0 18.65 0.31 − 0.52 − 0.85
5 LINK 0.003 0.046 0 1 0.02 0.01 − 0.01 0.01
6 PXFLAG 0.674 0.807 0 2 0.01 − 0.03 − 0.05 0.02 − 0.04
7 FOBCIF 0.335 0.452 0 1 0.14 − 0.12 − 0.25 0.25 0.01 − 0.01
8 LNCIF 0.472 0.033 − 0.49 0.50 − 0.07 0.14 0.23 − 0.16 0.00 − 0.02 − 0.15
9 INVOICE 0.904 0.278 0 1 0.03 − 0.10 − 0.15 0.15 0.01 0.09 0.11 − 0.09
10 LNEXRATE − 2.836 2.398 − 12.72 1.20 0.03 0.08 0.07 − 0.02 − 0.01 − 0.01 − 0.01 0.08 − 0.12
11 LNDIST 8.885 0.746 6.61 9.70 − 0.05 − 0.08 − 0.05 − 0.10 − 0.01 0.00 − 0.02 − 0.10 0.04 − 0.36
12 CANADA 0.066 0.249 0 1 0.03 0.03 0.01 0.10 0.00 − 0.01 − 0.01 0.08 0.00 0.27 − 0.81
13 MEXICO 0.048 0.214 0 1 0.01 − 0.05 − 0.07 0.15 0.00 0.04 − 0.01 0.11 0.08 0.05 − 0.26 − 0.06
14 CHINA 0.087 0.282 0 1 0.01 − 0.09 − 0.11 0.07 0.01 0.03 − 0.02 − 0.09 0.10 0.09 0.18 − 0.08 − 0.07
15 JAPAN 0.120 0.325 0 1 − 0.04 0.08 0.13 − 0.09 0.00 − 0.05 0.04 0.12 − 0.09 − 0.30 0.20 − 0.10 − 0.08 − 0.11
16 UK 0.047 0.212 0 1 0.04 0.12 0.11 − 0.10 − 0.01 0.00 − 0.01 0.05 − 0.08 0.31 − 0.06 − 0.06 − 0.05 − 0.07 − 0.08
17 RAUCHOE 0.054 0.226 0 1 0.10 − 0.08 − 0.18 0.21 0.00 0.00 0.18 − 0.05 0.04 0.04 − 0.09 0.07 0.01 − 0.04 − 0.05 0.00
18 RAUCHDIF 0.746 0.435 0 1 − 0.18 0.15 0.33 − 0.37 − 0.01 0.01 − 0.47 0.24 − 0.06 − 0.05 0.17 − 0.11 − 0.02 0.10 0.05 0.01 − 0.41
19 PRIMARY 0.149 0.357 0 1 0.15 − 0.15 − 0.30 0.31 − 0.01 0.00 0.28 − 0.33 0.06 0.02 − 0.16 0.12 0.04 − 0.07 − 0.12 − 0.02 0.34 − 0.54
20 MFGMLT 0.065 0.247 0 1 − 0.09 0.06 0.15 − 0.15 − 0.02 0.00 − 0.09 0.05 − 0.04 − 0.04 0.05 − 0.05 − 0.01 0.00 0.03 − 0.01 − 0.06 0.15 − 0.11
21 MFGHT 0.785 0.410 0 1 − 0.07 0.10 0.17 − 0.17 0.02 0.00 − 0.18 0.26 − 0.03 0.01 0.11 0.08 − 0.03 0.05 0.08 0.02 − 0.25 0.37 − 0.80 − 0.50
22 IFT 0.359 0.457 0 1 − 0.01 0.16 0.19 − 0.10 0.01 − 0.01 − 0.01 0.14 − 0.08 0.13 − 0.12 0.02 0.06 − 0.19 0.18 0.09 − 0.05 0.05 − 0.16 − 0.02 0.15
23 TPCUP 0.056 0.212 0 1 0.02 0.04 0.03 0.03 0.01 0.00 0.04 0.00 0.00 0.00 − 0.02 0.00 0.01 − 0.06 0.06 0.02 0.04 − 0.04 − 0.03 − 0.02 0.04 0.33
24 TPCOST 0.024 0.141 0 1 − 0.02 − 0.02 0.00 0.03 0.01 − 0.02 − 0.04 0.01 − 0.01 0.05 − 0.12 0.07 0.10 − 0.05 0.01 0.01 − 0.02 0.01 0.04 − 0.03 − 0.01 0.22 − 0.03
25 LNTXMIN − 0.446 0.179 − 0.80 0.00 0.01 − 0.10 − 0.12 0.08 0.00 0.03 − 0.07 − 0.10 0.14 0.20 0.07 − 0.07 0.02 0.31 − 0.27 0.11 − 0.01 0.05 0.01 − 0.01 0.00 − 0.09 − 0.01 − 0.02
26 LNTXGAP 0.048 0.042 0 0.27 − 0.02 − 0.11 − 0.12 0.06 0.01 0.02 − 0.03 − 0.13 0.08 0.01 0.09 0.07 − 0.25 0.46 − 0.14 − 0.25 − 0.05 0.05 − 0.01 0.03 − 0.01 − 0.15 − 0.05 − 0.03 0.54
27 TREATY 0.790 0.407 0 1 0.03 0.14 0.14 − 0.09 0.00 − 0.01 0.09 0.12 − 0.14 − 0.03 − 0.18 0.14 0.12 0.16 0.19 0.11 − 0.04 − 0.03 − 0.04 − 0.05 0.06 0.18 0.07 0.04 − 0.40 − 0.17
28 LNTARIFF − 0.049 0.052 − 0.59 0 0.17 0.10 − 0.04 0.16 0.00 − 0.06 0.21 − 0.06 − 0.02 0.17 − 0.29 0.22 0.11 − 0.09 0.03 0.06 0.16 − 0.21 0.26 − 0.17 − 0.12 0.14 0.04 0.05 − 0.06 − 0.10 0.13
29 LNPOLRSK 3.089 0.338 2.26 4.00 0.04 − 0.16 − 0.22 0.21 0.00 0.08 0.03 − 0.20 0.26 − 0.32 0.15 − 0.18 0.28 0.13 − 0.26 − 0.10 0.07 − 0.04 0.14 − 0.01 − 0.11 − 0.25 − 0.08 − 0.02 0.17 0.03 − 0.16 − 0.07
30 EXCNTRL 0.751 0.801 0 2 0.00 − 0.11 − 0.13 0.07 0.01 0.03 0.01 − 0.12 0.16 − 0.22 0.41 − 0.25 − 0.21 0.48 0.11 − 0.21 − 0.01 0.08 − 0.06 0.03 0.03 − 0.24 − 0.06 − 0.09 − 0.02 0.26 − 0.24 − 0.15 0.29
Note: Pairwise correlations greater than 0.015 are significant at the 5% level.
Ho
wd
oM
NEs
affe
ct
the
valid
ityo
fIP
Is?Lo
rrain
eEd
en
an
dPete
rRod
riguez
70
Journ
alof
Inte
rnatio
nalBusin
ess
Stu
die
s
nationals by including their foreign affiliates andby highlighting the importance of intrafirm trans-actions in US trade flows.13
The same issue raised in Behind the Numbers – IFT– is the key problem for international price indexes.In this paper we have explored the question:What impacts do MNEs have on the validity ofinternational price indexes? First, we reviewedthe earlier debate over unit values vs specificationprices. Second, we explored three ways inwhich MNEs affect the validity of IPIs: determiningthe ‘representative’ transfer price, excluding
some or all intrafirm transactions from theindex, and choosing the ‘right’ transfer pricealong the transportation chain. Third, we arguedthat IFT strengthens the case for using SPIs insteadof UVIs. We empirically tested this hypothesisby regressing the logged gap between US specifica-tion prices and unit values against MNEactivities and their interaction with governmentpolicies. Our results suggest that MNEs havepervasive impacts that are reflected in large differ-entials between logged specification prices andunit values.
Table 2 LNPXGAP
LNPXGAP Stage 1 Stage 2 Stage 3 Stage 4 Predicted
CONSTANT �1.645** �1.751** �2.073** �2.479***
LNQ 0.211*** 0.216*** 0.204*** 0.203*** +
LINK 0.248 0.236 0.209 0.180 +
PXFLAG 0.057** 0.055** 0.052** 0.053** +
LNEXRATE �0.021** �0.022** �0.018* �0.010 +
INVOICE �0.195** �0.194** �0.260*** �0.256*** �
FOBCIF 0.120* 0.120* 0.106w 0.098w +
LNCIF �3.478*** �3.387*** �2.944*** �3.179*** �
LNDIST 0.055* 0.057* 0.055w 0.038 +
MEXICO �0.054 �0.071 �0.083 �0.184*
CHINA 0.046 0.046 �0.045 0.055
JAPAN �0.408*** �0.410*** �0.374*** �0.257***
UK 0.551*** 0.543*** 0.616*** 0.437***
RAUCHOE �4.087*** �4.082*** �3.982*** �3.909*** �
RAUCHDIF 1.527** 1.506** 1.484** 1.561** +
IFT 0.114* 0.133** 1.289** +
TPCUP �0.478*** �0.447*** �0.484*** �
TPCOST �0.149 �0.168 �0.136 �
LNTXMIN 0.011 �0.506***
LNTXGAP 0.389 0.987w
TREATY �0.055 �0.179**
LNTARIFF 2.735** 3.336** +
LNPOLRSK 0.135* 0.300***
EXCNTRL 0.087** 0.071* +
IFT� LNTXMIN 2.466*** +
IFT� LNTXGAP �6.080*** �
IFT�TREATY 0.405*** +
IFT� LNTARIFF �4.816*** +
IFT� LNPOLRSK �0.133 �
IFT� EXCNTRL �0.182** �
No. of obs. 19,635 19,635 19,635 19,635
Adjusted R2 0.6781 0.6788 0.6799 0.6818
F 35.2*** 31.48*** 26.96*** 24.10***
DF 6.02*** 9.17*** 15.00***
Chow test 13.61***
Note: Two-tailed t-test levels: ***Po0.001, **Po0.01, *Po0.05, wPo0.10.
How do MNEs affect the validity of IPIs? Lorraine Eden and Peter Rodriguez
71
Journal of International Business Studies
Our conclusions support the superiority of speci-fication prices on the grounds that SPIs are betterable than UVIs to handle the activities of MNEs.UVIs, by deflating value by volume, simply ignorethe problems caused by IFT and transfer pricing. Asthe share of IFT rises, these problems are exacer-bated. Our results show that the gap betweenspecification prices and unit values widens by1.3% for every 10% increase in the share of IFT.These results are even stronger where governmentpolicies encourage TPM. Given that IFT accountsfor nearly half of US imports and three-quarters ofUS trade with Japan, it is clear that the problems ofIFT can be critical to the assessment of conditionsand changes in important markets.
To our knowledge, this paper is the first empiricalattempt to measure the factors – both traditionalexplanations and MNE activities – that can drive awedge between specification prices and unit values.Our empirical test could be extended in severalways, for example by lengthening the time periodand testing US exports in addition to US imports.Our analysis could also be tested in other countries,such as Germany and Sweden, which also produceSPIs. For smaller countries, where MNEs may bulkeven larger as a share of exports and imports, weanticipate that our results would be even moredramatic.
We conclude that the case against the UVI is farstronger than first supposed. If international priceindexes are the single most important data signal oftrade and competitiveness in international markets,the only strong signal is the still uncommon SPI.
AcknowledgementsFinancial support for this research project was pro-vided to Lorraine Eden by the US Bureau of LaborStatistics, and preliminary ideas for this paper firstappeared in a BLS Working Paper (Eden, 2001). Wethank William Alterman and Jeff Hill at the Bureau ofLabor Statistics, John Byers, Monica Boos, KennethBorghese, Tom Brewer, Kimberly Clausing, ThomasConnor, Erwin Diewert, Daniel LaHue, William Ran-dolph, Subi Rangan, Jeannette Siegel, Tieying Yu, andthree anonymous reviewers for their assistance withand/or comments on drafts of this paper.
Notes1The BLS started producing annual US export and
import price indexes in 1968 using unit values (Alter-man, 1988: 36). The first BLS specification priceindexes were published in 1973; SPIs for all US exportsand imports were available by the mid-1980s. The US
Census Bureau continued to produce UVIs until the BLSassumed full responsibility for all international priceindexes and discontinued UVIs in 1989. US export andimport price indexes are now calculated monthly,using collected prices for 20,000–25,000 goods and1500–2000 service items (BLS, 1997: 154–157),covering 90–95% of US trade (Alterman, 1991: 113).
2For example, assume a product (e.g., a computerkeyboard) moves from a Taiwanese manufacturer(e.g., Acer) to a US distributor (e.g., Wal-Mart) forUS retail sale. Acer’s price consists of standard cost($55) plus a gross profit mark-up of 20%. There are in-land transport costs (freight, insurance, fees) in eachcountry ($14 Taiwan, $10 US), along with interna-tional transport costs ($15). Assume Taiwan levies a25% export tax and the US government a 10% tariff.Assume Wal-Mart’s gross profit margin is 10% of theUS retail price. From the exporter’s perspective, thefactory gate price is $66, the pre-tax export price is$80, and the general export price (FAS) is $100. Fromthe importer’s perspective, the general import (FOB)price is $100, the pre-tariff import price (CIF) is $115,the post-tariff import price is $125, the price inclusiveof inland freight and insurance is $135, and the retailprice is $150.
3This is a variation of the well-known policyprescription that the number of policy tools must beat least as large as the number of policy goals.
4The analogy is from the international tax literature,which distinguishes between capital export neutrality(exporters of capital should earn the same after-taxreturn abroad as at home) and capital importneutrality (investments in the host country shouldearn the same after-tax return regardless of owner-ship). See Eden (1998: 73–79).
5BLS data are measured at the individual item level,whereas our dataset concordance is at the six-digitHSCODE. As a result, our IFT measure is an average foreach HSCODE classification.
6We divided general imports customs value (GEN_VAL_MO) by general imports 1st unit of quantity(GEN_QY1_MO), and dropped observations wheneither quantity or value was missing.
7As specification prices are normally in terms of aunit quantity, one can interpret LNQ asln[Q(PX)]�ln[Q(UV)]¼ln(1)�ln[Q(UV)]¼�ln[Q(UV)].We use monthly QY1, from the US Census CD-ROMs,to calculate LNQ.
8The overlap is small, about 10%. We could haveincreased the overlap, in theory, by extending thenumber of months, aggregating products (e.g., to thethree-digit HS code), or matching only by HSCO-DE�COUNTRY. Each alternative has its own costs.
How do MNEs affect the validity of IPIs? Lorraine Eden and Peter Rodriguez
72
Journal of International Business Studies
9There are holes in the data, most notably that FOBprices are often absent for former USSR countries. Formissing data, we imputed transport costs by three-digit SITC based on the nearest country. In some cases,only country averages could be calculated.
10Using a concordance from five- to three-digitcodes meant that our scales vary from 0 to 2. Productswith Rauch numbers between 0 and 0.667 wereclassified as organized exchanges, between 0.667 and1.34 as referenced markets, and over 1.34 asdifferentiated markets.
11The BLS data set is the only data set available thatcodes each international transaction as intrafirm orinterfirm trade. For example, although confidential US
Census tapes contain the IFT identifier, it iswidely recognized to be inaccurate. Publicly availabledata do not even contain this field, although someauthors (Pak and Zadanowicz, 1994) have incorrectlyused the Census data to claim transfer price manipula-tion.
12We also created monthly duty rates from the USCensus CD-ROMs, but these performed less well thanannual rates from the Feenstra CD-ROM.
13Landefeld et al. (1993) subsequently developedand compared the NAS proposal with two otherownership-based approaches. In all three proposals,the valuation of intrafirm transfers was a criticalcomponent in measuring MNE activities.
ReferencesAlterman, W (1988) ‘BLS to produce monthly indexes of export
and import prices’, Monthly Labor Review, 111 (12): December36–40.
Alterman, W (1997a) ‘A comparison of the export and producerprice indexes for semiconductors’, Presented at NationalBureau of Economic Research Summer Institute, July.
Alterman, W (1997b) ‘Are producer prices good proxies for exportprices?’, Monthly Labor Review, 120 (10): October 18–32.
Alterman, W (1991) ‘Price Trends in US trade: New Data, NewInsights’, in P. Hooper and J.D. Richardson (eds.) InternationalEconomic Transactions: Studies in Income and Wealth, no. 55.Chicago: Univ. of Chicago Press and NBER, 109–139.
Alterman, W, Diewert, WE and Feenstra, RC (1999) InternationalTrade Price Indexes and Seasonal Commodities, Bureau of LaborStatistics, US Department of Labor: Washington, DC.
Buckley, PJ and Casson, M (1976) The Future of the MultinationalEnterprise, Macmillan: London and Basingstoke.
Caves, RE (1996) Multinational Enterprises and Economic Analysis,2nd edn). Cambridge University Press: Cambridge.
Clausing, K (2001) ‘The Impact of Transfer Pricing on IntrafirmTrade’, in J. Hines (ed.) International Taxation and Multi-national Activity, University of Chicago Press: Chicago, pp.173–194.
Colbert, GJ and Spicer, BH (1995) ‘A multi-case investigation ofa theory of the transfer pricing process’, Accounting, Organiza-tions and Society 20(6): 423–456.
Diewert, EW (1985) ‘Transfer Pricing and Economic Efficiency’,in A.M. Rugman and L. Eden (eds.) Multinationals and TransferPricing, Croom Helm and St Martins Press: London and NewYork, pp. 47–81.
Diewert, EW (1993) ‘The early history of price index research’,in E.W. Diewert and A.O. Nakamura (eds.) Essays in IndexNumber Theory, Volume 1, Elsevier Science Publishers B.V.,33–65.
Diewert, EW and Feenstra, R (2001) Imputation and Price Indexes:Theory and Evidence from the International Price Program, USBureau of Labor Statistics: Washington, DC, BLS WorkingPaper 335.
Eden, L (1998) Taxing Multinationals: Transfer Pricing andCorporate Income Taxation in North America, University ofToronto Press: Toronto.
Eden, L (2001) Transfer Pricing, Intrafirm Trade and the BLSInternational Price Program, US Bureau of Labor Statistics:Washington, DC, BLS Working Paper 334.
EUROSTAT (2001) Handbook on Price and Volume Measures inNational Accounts, Prepared for the Seminar on Price and
Volume Measures, 14–16 March 2001. Voorburg: StatisticsNetherlands.
Feenstra, RC (1996) US Imports, 1972–1994: Data and Con-cordances, Institute of Governmental Affairs, University ofCalifornia: Davis, CA.
Feenstra, RC and Shiells, CR (1997) ‘Bias in US Import Prices andDemand’, in: T.F. Bresnahan and R.J. Gordon (eds.) TheEconomics of New Goods, University of Chicago Press: Chicago.249–276
Ghemawat, P (2003) ‘Semiglobalization and internationalbusiness’, Journal of International Business Studies 34(2):138–152.
Hirshleifer, J (1956) ‘On the economics of transfer pricing’,Journal of Business 29: 172–183.
Horst, T (1971) ‘Theory of the multinational firm: optimalbehavior under differing tariff and tax rates’, Journal of PoliticalEconomy 79: 1059–1072.
IMF (2001a) International Financial Statistics, CD-ROM Interna-tional Monetary Fund: Washington, DC.
IMF (2001b) PPI Manual. Electronic Discussion Group, Developinga Revised Manual for the PPI (TEG-PPI). http://www.imf.org/external/np/sta/tegppi/.
Kester, AY (ed.) (1992) Behind the Numbers: US Trade in theWorld Economy, National Academy Press: Washington, DC.
Kravis, IB and Lipsey, R (1971) Price Competitiveness in WorldTrade, National Bureau of Economic Research: New York.
Landefeld, JS, Whichard, OB and Lowe, JH (1993) ‘Alternativeframeworks for US international transactions’, Survey of CurrentBusiness, 73: December 50–61.
Lipsey, R (1994) Quality Change and Other Influences onMeasures of Export Prices of Manufactured Goods and the Termsof Trade between Primary Products and Manufacturers, NationalBureau of Economic Research: Cambridge, MA, NBER WorkingPaper Series No. 4671.
Lipsey, RE, Molinari, L and Kravis, IB (1991) ‘Measures of Pricesand Price Competitiveness in International Trade in Manufac-tured Goods’, in: P. Hooper and J.D. Richardson (eds.)International Economic Transactions: Issues in Measurementand Research, National Bureau of Economic Research: Cam-bridge, MA. 144–195.
OECD (1995) Transfer Pricing Guidelines for MultinationalEnterprises and Tax Administrations, OECD: Paris.
OECD (1999a) Country Reports on Current Status, RecentDevelopments and Plans for International Trade Statistics,Presented at the 1st International Trade Statistics MeetingOECD Statistics Directorate: Paris.
How do MNEs affect the validity of IPIs? Lorraine Eden and Peter Rodriguez
73
Journal of International Business Studies
OECD (1999b) Statistical Issues, Presented at the First Interna-tional Trade Statistics Meeting OECD Statistics Directorate:Paris.
OECD (2000) Calculation of Unit Value Indices Based on ExternalTrade Data (Trend Application), Presented at the Second OECDTrade Statistics Meeting OECD Statistics Directorate: Paris.
OECD (2001) Monthly International Trade Aggregates, OECDStatistics Directorate: Paris.
Pak, S and Zadanowicz, J (1994) ‘A statistical analysis of the USmerchandise trade data base and its uses in transfer pricingcompliance and enforcement’, Tax Management TransferPricing, 11 May 50–57.
Parsley, DC and Wei, SJ (2000) Explaining the Border Effect: TheRole of Exchange Rate Variability, Shipping Costs, and Geogra-phy, National Bureau of Economic Research: Cambridge, MA,NBER Working Papers 7836.
Rauch, JE (1999) ‘Networks versus markets in internationaltrade’, Journal of International Economics 48: 7–35.
UNCTAD (2000) Taxation, UNCTAD Series on Issues in Interna-tional Investment Agreements, United Nations: Geneva.
UNCTAD (2002) Trade and Development Report, United Nations:Geneva.
US Bureau of Labor Statistics (BLS) (1997) ‘International PriceIndexes’, BLS Handbook of Methods, Chapter 15 http://www.bls.gov/opub/hom/pdf/homch15.pdf.
US Census (1999) US Imports of Merchandise, Statistical Month,US Census Bureau: Washington, DC, Monthly CD-ROMs.
US Census (2000) US Goods Trade: Imports and Exports by RelatedParties, 1999, US Census Bureau: Washington, DC.
About the authorsPeter Rodriguez is an Associate Professor of Busi-ness Administration at the Darden Graduate Schoolof Business at the University of Virginia where heteaches classes on Business and the Political
Economy. He is an economist and specializes inthe study of international business, trade, anddevelopment, with an emphasis on corruption.Peter’s research publications range from theoreticalexplorations of international trade policies andfirm behavior to empirical- and practice-basedstudies of issues in international business. He hasreceived numerous awards for teaching excellencein classes ranging from traditional internationalmacroeconomics to business–government rela-tions. Peter holds a Ph.D. in economics fromPrinceton University.
Lorraine Eden is Professor of Management andUniversity Faculty Fellow at Texas A&M Universityin College Station, Texas, where she teaches courseson multinational enterprises (MNEs) and interna-tional business. Her research focuses on the poli-tical economy of MNEs, specializing in transferpricing, international taxation, and regional inte-gration. She has more than 90 scholarly publica-tions, including six books, in print. She is adepartmental editor for the Journal of InternationalBusiness Studies, and has been Vice-President andProgram Chair of the Academy of InternationalBusiness.
Accepted by Tom Brewer; outgoing Editor, 14 October 2003. This paper has been with the author for three revisions.
How do MNEs affect the validity of IPIs? Lorraine Eden and Peter Rodriguez
74
Journal of International Business Studies

![Imperfect international competition, multinational enterprises and manufactured exports from developing countries [microform]](https://img.pdfslide.net/doc/110x75/6355ef61328574b6730c331a/imperfect-international-competition-multinational-enterprises-and-manufactured.jpg)