Embed Size (px)
Citation preview

Exports in the Strategy of Multinational Enterprises
Peter J. Buckley, University of Bradford Management Centre
Robert D . Pearce, University of Reading
Using dota from a sample of 329 multinational firms, this paper analyses the impact of increases in foreign production on exports from the parent firm. The relationship between internal exports andforeign production is positive at allfeasible levels offoreign production, although the impact on extra-group exports may be negative. These effects may be swamped by changes in relative international competitiveness between firms of the same nationality and industry group. The importance of these findings for mulnma- tional firms is that anticipation of these effects can reduce costs of reallocation of resources for the parent, firm and the results illustrate the wide remaining scope for further internationalization even among the world’s largest firms. The impact offoreign production on home country employment is likely to remain positive so long as the firm’s international competiveness can be improved.
This paper is an investigation of the relationship between the extent of a firm’s foreign production and its home country exporting performance. The methodology is based on cross-sectional analysis at the firm level. It enables us to establish a number of statistical relationships but does not allow us to establish conclusively the effects of foreign production on parent firm export performance. To assess the effects fully we would need to know the level of export performance at some other level of foreign production. Received hypotheses on these issues suggest that foreign production might substitute for exports of final products from the parent, but be complementary with increased exports of intermediate goods (parts and components) from the parent. In addition, the foreign production subsidiary may act as a sales subsidiary for goods produced by the parent [3, 151. In fact, a study of U.S. firms in 1%5 showed that 49% of total intra-firm exports were “goods for resale without further manufacture, ’ ’ another 7% were “exports sold for parents’ account on a commission basis, ’ ’ making the total share of finished goods for resale 56%. Goods “for further processing and assembly” represented another 36%, capital equipment 5%, with 3% unallocated [2, 111.
Address correspondence to Peter J. Buckley, Professor of Managerial Economics, University of Bradford ‘Management Centre, Emm Lane, Bradford, West Yorkshire, BD9 4JL, U.K.
Journal of Business Research l&209-225 (1984)
@ Ekevier Science Publishiog Co., Inc. 1984
52 Vanderbilt Ave., New York, NY 10017
209
0148-2%3/84/$3.00

210 P. J. Buckley and R. D. Pearce
A number of earlier studies of the relationship between foreign prod- uction and parent firm exporting performance, using U.S. data, have established valuable evidence on the predominantly positive relationship between exporting and foreign production [8, 11, 131. These studies were not able to subdivide exporting between internal (i.e. to affiliates of the same company) and external forms. This subdivision was ac- complished in the study reported here. I Data from a wide range of nationalities of firms are used. “Industry effects” are separated [cf. 161.
The aim is to analyse the relationship between three dependent variables representing the export performance of multinationals from the home country and a range of independent variables, including a “foreign production ratio. ’ ’ The foreign production ratio, M, is defined as the sales of foreign affiliates and associated companies, excluding goods imported from the parent for resale, divided by the firm’s worldwide sales.
1
2.
3.
The three dependent variables are defined as follows:
Commitment to Internal Exports (CIE),2 which is defined as the parent firm’s exports to foreign affiliates and associates divided by total parent firm production. 3 CIE is therefore the proportion of parent firm production that is exported internally to foreign units of the firm. Commitment to External Exports (CEE) is defined as parent firm exports to independent customers divided by total parent firm prod- uction, i . e . , the proportion of total parent firm production exported to customers other than its own affiliates. Parent’s Export Ratio (PER) is defined as the parent’s total exports divided by total parent firm production.
1 The distinction between “internal” and “external” exports is important because internal exports are subject to transfer prices [ 11, 12, 141 and may have implications for the international allocation of investment funds [IO].
* We have to forego the use of the less cumbersome “internal export ratio” and “external export ratio” because we have previously used that form, defined differently,
in previous studies. [See 5,6, 71. 3 Throughout the paper, “parent firm” is used to refer to all productive activity of
the multinational enterprise in the group’s home country.

Multinational Enterprises 211
Hypotheses
The hypotheses relate each of the dependent variables in turn to the multinational firm’s foreign production ratio, after accounting for the influences arising from industry and nationality effects.
The first hypothesis is that, as the foreign production ratio rises, the commitment to internal exports will rise also, i.e., foreign production is complementary to intra-group exports. This relationship is not expected to be linear; rather, the hypothesis is that it will become less strong as the foreign production ratio rises, with the possibility of it becoming nega- tive at a high level of foreign production. When a firm has just embarked on foreign production activity with the consequent low foreign produc- tion ratio and probably a small number of foreign affiliates, intra-group transactions will consist of a series of bilateral routes between the parent and each foreign subsidiary. Under these circumstances, rises in M will likely induce increases in the parent’s intra-group exports in a roughly comparable proportion. However, when foreign production is estab- lished (i.e., when M has achieved a much higher level), the search for optimal input sourcing will lead to the development of a fully integrated network, and inputs will be transferred directly between subsidiaries rather than only bilaterally between parent and subsidiary. In a sense, then, the parent is “competing” with its subsidiaries in an internalized sourcing network. Thus, after a threshold value is passed, it can be expected that a rise in M will lead to diminishing increases in CIE.
In the analysis of Commitment to External Reports (CEE) it is our basic hypothesis that foreign production is likely to substitute for exports of final products to independent customers. However, as our analysis takes a cross-sectional form this might be complicated by differences in international competitiveness even within industries and among firms of the same nationality. In other words, some firms may be so highly competitive that high values of M for these firms are associated with high CEE. The choice of different methods of market servicing (exporting from the parent versus production abroad for final market needs) implies a negative association between M and CEE, but large differences in international competitiveness between firms within groups may result in a positive association when cross-sectional analysis is used. A positive association, however, would not disaprove the basic hypothesis, since for the individual firm lower levels of M may have results in an even higher CEE.
The above discussion of CIE and CEE suggests that we cannot derive a clear hypothesis on the relationship between PER and M. Below a
212 P. J. Buckley and R. D. Pearce
certain level of M, the two ratios (CEE and CIE) are likely to be moving in opposite directions, and we have no firm basis on which to suggest which will dominate. Beyond this level, however, we would expect a continuing negative relationship (external exports) to dominate the weakening positive relationship (internal exports), and finally we expect both to be negative. Thus we may express our hypothesis as “the relationship between PER and M will be negative at high levels of M and may be negative for all levels of M. ”
The Data
The sample used in this paper covers 329 of the world’s largest enter- prises in 1977. It is a subsample of the 866 largest industrial enterprises in that year. The 329 firms in our sample accounted for 49% of the sales of the full 866-firm sample. The information on the four variables above (M, CIE, CEE, and PER) was obtained from a survey of the firms [7, part 61. Each firm was classified into one of 19 industries and by its nationality of ownership [7, p. lo].
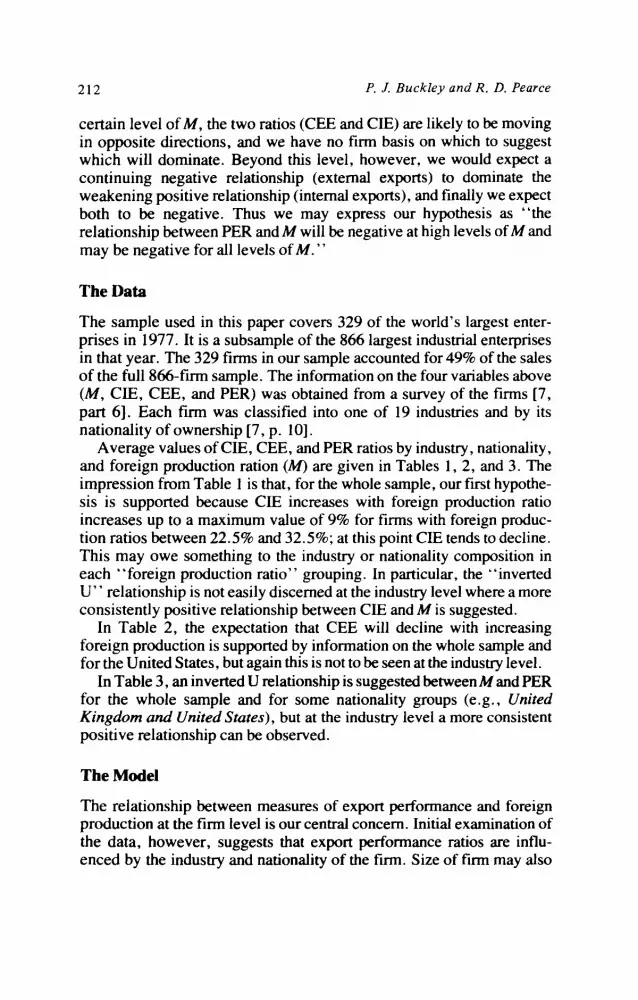
Average values of CIE, CEE, and PER ratios by industry, nationality, and foreign production ration (M) are given in Tables 1, 2, and 3. The impression from Table 1 is that, for the whole sample, our first hypothe- sis is supported because CIE increases with foreign production ratio increases up to a maximum value of 9% for firms with foreign produc- tion ratios between 22.5% and 32.5%; at this point CIE tends to decline. This may owe something to the industry or nationality composition in each “foreign production ratio” grouping. In particular, the “inverted U” relationship is not easily discerned at the industry level where a more consistently positive relationship between CIE and M is suggested.
In Table 2, the expectation that CEE will decline with increasing foreign production is supported by information on the whole sample and for the United States, but again this is not to be seen at the industry level.
In Table 3, an inverted U relationship is suggested between M and PER for the whole sample and for some nationality groups (e.g., United Kingdom and United Stute.s), but at the industry level a more consistent positive relationship can be observed.
The Model
The relationship between measures of export performance and foreign production at the firm level is our central concern. Initial examination of the data, however, suggests that export performance ratios are influ- enced by the industry and nationality of the firm. Size of firm may also

Tab
le
1. “
Com
mitm
ent
to I
nter
nal
Exp
orts
” by
Cou
ntry
, In
dust
ry,
and
Fore
ign
Prod
uctio
n R
atio
(a)
By
area
an
d co
un
try
U.S
.A.
Eu
rope
(to
tal)
E
EC
(to
tal)
Wan
Y
Fra
nce
U
.K.
Oth
er E
uro
pe (
tota
l)
Sw
eden
Ja
pan
O
ther
Cou
ntr
ies
Can
ada
TO
TA
L
@)-
BY
in
dust
v
Pet
role
um
E
lect
ron
ics
and
elec
tric
al
appl
ian
ces
Ch
emic
als
and
phar
mac
euti
cals
T
otal
Hig
h R
esea
rch
In
ten
sity
For
eign
Pro
duct
ion
R
atio
a ij
O-2
.5%
2.
5-12
.596
12
.5-2
2.54
6 22
.5-3
2.5%
32
542.
5%
42.5
-52.
5%
Ove
r 52
5%
Tot
al
5 ;i:
3 0.
0 1.
0 5.
7 2.
1 5.
9 3.
7 3.
0 3.
6 $
0.2
3.1
12.8
20
.3
13.5
5.
5 14
.4
10.0
0.
3 3.
0 11
.8
20.7
10
.8
0.7
6.2
9.4
0.1
5.1
11.6
24
.0
0.0
12.3
0.
0 0.
0 14
.6
26.2
5.
1 0.
0 10
.8
0.0
1.7
14.2
3.
8 9.
1 1.
5 1.
7 6.
0 0.
0 4.
0 21
.9
6.4
23.2
38
.5
35.1
14
.5
0.0
1.2
31.2
6.
4 33
.0
38.5
33
.3
19.2
0.
2 1.
8 17
.0
11.0
35
.2
4.0
0.1
1.1
2.1
17.9
0.
0 48
.1
1.9
0.2
1.1
2.1
17.9
0.
0 48
.1
13.4
0.
1 1.
8 7.
0 9.
4 8.
3 5.
9 7.
1 5.
5
0.0
1.7
0.0
0.0
0.0
0.0
3.4
1.8
3.2
4.2
31.1
4.
6 19
.1
31.4
9.
0
0.5
1.4
5.9
7.4
11.3
2.
1 10
.7
1.3
0.1
2.3
3.7
11.9
8.
8 5.
6 5.
1 5.
5 h
) w

214 P. J. Buckley and R. D. Pearce

Tab
le
2. “
Com
mitm
ent
to E
xter
nal
Exp
orts
” by
C
ount
ry,
Indu
stry
, an
d Fo
reig
n Pr
oduc
tion
Rat
io
(a)
By
area
an
d co
untr
y
U.S
.A.
Eur
ope
(tot
al)
EE
C
(tot
al)
Ger
man
y
Fran
ce
U.K
.
Oth
er
Eur
ope
(tot
al)
Swed
en
Japa
n
Oth
er
Cou
ntri
es
Can
ada
TO
TA
L
(b)
By
indu
stry
Petr
oleu
m
Ele
ctro
nics
an
d el
ectr
ical
appl
ianc
es
Che
mic
als
and
phar
mac
eutic
als
Tot
al
Hig
h R
esea
rch
Inte
nsity
Fore
ign
Prod
uctio
n R
atio
4 9
O-2
.5%
2.
5-12
.5%
12
.5-2
25%
22
.5-3
2.5%
32
.5-4
2.5%
42
.5-5
2.5%
O
ver
52.5
%
Tot
al
hi
2 s s 6.
9 7.
2 4.
3 3.
0 4.
3 2.
3 0.
5 4.
3 5’
29.1
25
.5
24.9
18
.7
20.8
22
.6
20.7
23
.6
27.7
24
.9
23.5
18
.1
16.4
21
.2
18.9
22
.2
22.1
24
.4
32.4
17
.9
49.1
23
.2
39.9
28
.8
14.5
14
.4
24.3
19
.0
22.6
3.0
15.7
7.
5 22
.4
15.7
20
.0
13.2
14
.1
33.1
38
.2
38.1
36
.5
36.3
31
.5
25.4
34
.0
53.9
37
.7
20.8
36
.5
22.0
31
.5
19.0
33
.9
8.7
19.6
3.
0 44
.0
11.7
19
.3
25.7
28
.6
30.4
50
.9
7.0
7.8
26.8
8.
6 24
.0
30.4
50
.9
7.0
7.8
20.7
16.7
16
.1
8.4
11.0
9.
5 8.
4 4.
6 11
.3
3.6
3.0
0.7
0.0
10.0
10
.0
0.2
1.8
18.3
16
.6
4.7
6.6
32.4
26
.4
15.7
14.4
16
.3
13.8
17
.5
6.9
12.3
18
.2
13.6
22.8
15
.2
12.5
10
.5
6.3
6.7
3.1
10.5
h)
z

Tab
le 2
. (C
ontin
ued)
Fore
ign
Prod
uctio
n R
atio
4
O-2
.5%
2.
5-12
5%
12.S
225%
22
.S32
.5%
32
.5-4
2.5%
42
.S52
.5%
O
ver
52.5
%
Tot
al
Indu
stri
al
and
farm
--
. eq
uipm
ent
10.7
3.
9 16
.7
13.0
20
.5
27.6
10
.5
Mot
or v
ehic
les
(and
co
mpo
nent
s)
3.3
8.4
3.2
10.4
16
.0
11.7
0.
0 6.
9 M
etal
man
ufac
turi
ng
and
prod
ucts
18
.2
22.1
20
.6
22.9
22
.2
11.2
20
.3
Tot
al M
ediu
m R
esea
rch
Inte
nsity
20
.4
18.6
6.
3 11
.7
17.9
15
.2
14.2
13
.3
Bui
ldin
g m
ater
ials
3.
7 2.
9 20
.4
16.3
15
.4
9.3
Food
4.
3 16
.5
1.6
2.6
3.5
3.1
5.5
Tex
tiles
5.
5 7.
9 19
.9
19.1
24
.3
7.0
22.9
12
.3
.;
Tot
al L
ow R
esea
rch
B
Inte
nsity
5.
8 12
.5
5.8
10.2
7.
6 10
.1
9.1
8.8
g
TO
TA
L
16.7
. 16
.1
8.4
11.0
9.
5 8.
4 4.
6 11
.3
g 9 so
urce
: [
71
s E
ach
fm
is c
lass
ifie
d to
one
of
the
groups
belo
w
acco
rdin
g to
its
ind
ivid
ual
fore
ign
prod
uctio
n ra
tio
k :b
‘a
2 z
Tab
le
3. “
Pare
nt
Exp
ort
Rat
io”
by
Cou
ntry
, In
dust
ry,
and
Fore
ign
Prod
uctio
n R
atio
For
eign
Pro
duct
ion
R
ati&
o-2.
5%
2.5-
12.5
%
12.5
-22.
5%
22.5
-32.
5%
3254
2.5%
42
.5-5
2.5%
O
ver
52.5
%
(a)
By
area
an
d co
un
try
U.S
.A.
Eu
rope
(to
tal)
E
EC
(to
tal)
G
erm
any
Fra
nce
U
.K.
Oth
er E
uro
pe (
tota
l)
Sw
eden
Ja
pan
O
ther
Cou
ntr
ies
Can
ada
TO
TA
L
(b)
By
indu
stry
Pet
role
um
E
lect
ron
ics
and
elec
tric
al
appl
ian
ces
Ch
emic
als
and
phar
mac
euti
cals
T
otal
Hig
h R
esea
rch
In
ten
sity
6.0
28.1
21
.9
49.1
19
.0
21.5
70
.1
70.1
47
.0
7.0
7.0
14.3
3.4
35.1
25
.1
6.9
8.2
10.0
5.
8 29
.3
28.6
37
.7
39.0
28
.0
27.9
35
.4
38.0
22
.6
29.5
44
.1
41.9
39
.9
28.8
29
.1
40.6
3.
0 17
.3
21.8
26
.3
33.1
42
.2
60.0
42
.9
53.9
45
.0
52.0
42
.9
8.9
21.4
20
.0
55.0
25
.9
29.8
32
.5
68.9
8.
7 25
.1
32.5
68
.9
16.8
17
.9
15.4
20
.4
10.2
34
.3
21.2
33
.6
31.6
35
.5
33.4
20
.1
48.5
53
.1
23.3
34
.7
34.1
16
.8
30.0
25
.4
59.5
55
.0
14.9
61
.1
52.3
56.6
56
.6
11.8
17
.9
10.0
11.2
18.2
15.1
10.0
3.
6 3.
6 3.
5 4.
8 0.
7 0.
0
51.6
57
.7
24.7
21
.6
20.9
35
.8
14.9
22.9
17.7
19
.7
24.9
15
.0
28.9
20
.9
17.5
16
.3
22.4
12
.4
8.2
16.2
N
z

Tab
le
3. (
Con
tinue
d)
For
eign
P
rodu
ctio
n R
ati@
Q-2
.5%
2.
512.
5%
12.5
22.5
%
22.5
32.5
%
32.5
-42.
5%
42.5
52.5
%
Ove
r 52
.5%
T
otal
Indu
stri
al
and
farm
eq
uipm
ent
14.0
22
.1
23.0
23
.4
23.0
62
.8
22.1
M
otor
ve
hicl
es
(and
co
mpo
nent
s)
3.4
11.7
15
.4
21.2
31
.4
47.0
60
.0
18.4
M
etal
m
anuf
actu
ring
an
d pr
oduc
ts
18.4
23
.9
24.9
26
.7
29.4
51
.1
23.3
T
otal
M
ediu
m
Res
earc
h In
tens
ity
20.6
20
.6
17.9
21
.1
28.8
37
.4
54.2
21
.1
Bui
ldin
g m
ater
ials
4.
4 3.
3 24
.0
18.7
16
.0
10.1
Fo
od
4.3
17.5
1.
6 3.
2 4.
6 5.
0 6.
1 T
extil
es
5.8
8.1
23.2
23
.5
30.0
7.
0 29
.0
14.1
T
otal
L
ow
Res
earc
h In
tens
ity
5.9
13.2
6.
0 12
.8
9.6
10.5
10
.3
9.7
TO
TA
L
16.8
17
.9
15.4
20
.4
17.9
14
.3
11.8
16
.8
Sour
ce:
[ 71
a E
ach
fiim
is
cla
ssif
ied
to
one
of
the
grou
ps
belo
w
acco
rdin
g to
its
ind
ivid
ual
fore
ign
prod
uctio
n ra
tio.

Multinational Enterprises 219
influence export performance. Our model tests the (nonlinear) impact of h4 on our three dependent variables after accounting for these influences. It is:
18 18
B=a+bS+cS2+~diI~+~f;Nj+gM+hM2+e i= 1 j= 1
where 8 is the dependent variable,
S is the size of firm as measured by the parent firm’s total sales4 Ii takes a value 1 for industry i and zero otherwise, Nj takes a value 1 for nationality j and zero otherwise, M is the foreign production ratio, a is the intercept and b, c, g, h are regression coefficients, di and fj are estimated differences from an arbitrarily chosen omitted
industry dr9 (motor vehicles) and omitted nationality f,9 (United States) respectively, and
e is the error term.
The results of the cross-sectional regression analysis of this model are reported in Table 4.
Rt!SUItS
Equation ( 1) in Table 4 has CIE as the dependent variables and the results are consistent with our hypothesis about the relationship between CIE and M. Both parts of the quadratic term in M are significant at 1% and the sign of the squared term is negative. The relationship derived is an inverted U. However, the values of the coefficient obtained suggest that the inversion does not occur until M has a value in excess of lOO?G. The operative relationship between CIE and M is that CIE rises as M in- creases, but rises less steeply at higher values of M. Several nationality groups have values of CIE significantly greater than the United States, while none have values significantly lower than the United States. This
4 The equations were aI-0 run using the worldwide sales of the firm as the proxy for size of firm. Only parent firm sales results are reported here because this proxy exhibits
a stronger relationship with the dependent variable. The choice between the two measures of size has little effect on the overall explanatory power of the model. Most important, the choice of size proxy has no influence on the size, nature, or strength of the relation- ship between export performance (in any of the three dependent variables) and the
foreign production ratio.

Tabl
e 4.
Reg
ress
ion
Ana
lysi
s of
E
xpor
t Pe
rfor
man
ce
Rat
ios
Dep
ende
nt
Var
iabl
es
s s*
Sign
ific
ant
Dum
my
Var
iabl
es
Indu
stry
N
atio
nalit
y M
M*
R*
Equ
atio
n 0.
004
Com
mitm
ent
(1.5
03)
to
Inte
rnal
E
xpor
ts
-1.0
07&
-8
Food
(-yl
; D
rink
(-)
Q
(1.4
08)
Tob
acco
(-yl
; T
extil
es
etc.
(-
)a;
Pape
r &
Woo
d Pr
oduc
ts
(-)o
; C
hem
ical
s (-
)a;
Petr
oleu
m
(-y;
B
uild
ing
Mat
eria
ls (
-p;
Met
als
(-y1
E
lect
roni
cs
and
Ele
ctri
cals
(-
y Sh
ipbu
ildin
g et
c. (
-p;
Aer
ospa
ce
(-)b
Ger
man
y (+
)n;
Net
herl
ands
0.
364a
-0
.003
n 0.
457
.%
(+p;
B
elgi
um (
+)n
; (4
.357
) (2
.676
) .%
Sw
eden
(+
)a;
Switz
erla
nd
B
(+)a
; Ja
pan
(+)b
; 2
Can
ada
(+)Q
5 d 9 %
b .Y
Equ
atio
n 2
0.00
02
-4.4
74&
-9
Tob
acco
(+
y;
Pape
r an
d W
ood
Ger
man
y (+
)a;
Fran
ce
(+)n
; 0.
299”
-0
.006
a 0.
642
‘-e
Com
mitm
ent
(0.4
41)
(0.4
34)
Prod
ucts
(+
)a;
Rub
ber
(-)n
; It
aly
(b)a
; N
ethe
rlan
ds
(2.7
58)
(3.8
84)
P
to
Ship
build
ing
etc.
(+
)a;
(+)a
; B
elgi
um (
+)a
; U
K
$

Multinational Enterprises 221

222 P. J. Buckley and R. D. Pearce
may be surprising in view of the belief that U.S. firms have pioneered and most extensively developed the practice of intra-group sourcing. However, in our variable CIE, internal exports are expressed as a proportion of parent firm production, and so the home production of U.S. firms is generally greater than firms of other nationalities because of the size of the U . S . domestic market. If internal exports are expressed as a proportion of total parent exports, than the picture changes. Internal exports account for 46% of U.S. total exports against only 30% of European firms and 33% for all 329 firms [7, Table 6.121. In a regression test of this ratio, only Canadian firms return a higher ratio than U.S. firms [5]. The large size of the U . S . market is also the explanation for the large number of positive signs in Equation 2 on CEE ratios.
Equation (2) has CEE as the dependent variable. The relationship reported is an inverted U, with the inversion occurring at A4 values of about 50%. Both parts of the quadratic terms in M are significant at the 1% level. Therefore, until M reaches 50%, increases in M are ac- companied by increases in CEE; therafter the relationship takes a nega- tive form, increases in M leading to a decline in CEE. The increasingly visible foreign presence represented by expanding foreign production may lead to a growth in an individual firm’s overall foreign market and part of ths spillover may be met directly by extra-group exports from the parent [ 151. This phenomenon alone is unhkely to account for the strength of the relationship reported in Table 4. It is likely that the assumption necessary for the basic hypothesis to operate-that firms within the same industry and nationality group are equally competitive- is violated. Therefore we have a firm-specific competiveness effect [4] such that as international competitiveness increases, there is a tendency for both M and CEE to rise, and a substitution effect by which at any given level of competitiveness, CEE is higher if M is lower. Thus, M can rise either because the ftrm becomes more internationally competitive or because foreign production substitutes for exports. Initially, the com- petitiveness effect predominates. So as competitiveness rises, M rises and CEE rises, though the increase in CEE is less than it would have been had A4 not risen (subsitution effect). The negative section of the rela- tionship occurs when the substitution effect becomes dominant, i.e., M rises now because foreign production replaces parent exports rather than because the firm’s foreign market grows.
Equation (3) shows an inverted U relationship between PER and M, with both parts of the quadratic term significant at the 1% level. The negative section of the relationship becomes operative at values of M just over 70%.
The three equations have high levels of explanatory power, explaining

Multinational Enterprises 223
respectively 46%, 6496, and 70% of the variance in the dependent variable. The size of firm variable, in common with many other export studies [ 181, is never significant, but the wide variations in industry of operation and nationality of ownership are suggestive of widely different market servicing practices among groups [5]. The strength and con- sistency of the inverted U relationship between the measures of export performance and the foreign production ratio at the firm level is a significant finding.
Conclusions and Corporate Implications
The empirical relationships found in this paper between exports and foreign production are consistent with the view that foreign production may have both complementary and substitutory relationships with parent firm exports in multinational firms. The paper shows that simple state- ments on the relationship are likely to be wrong unless carefully qualified. After’taking account of firm size, industry group, and nationality of ownership, different relationships are found between foreign production and internal exports and foreign production and external exports. The operative part of the former relationship is positive; the latter is initially positive but then inverts at high levels of foreign production. The overall relationship between parental exports and foreign production also is initially positive but inverts at very high levels of foreign production, The analysis indicates that far more work is necessary on the relationship between exporting and foreign production; more particularly, time series analysis is required to supplement this initial cross-sectional format.
There are a number of implications for the corporate strategy of multinational firms. First, the planning of such fums must take into account the likely impact of foreign production on home country activ- ity. Our results suggest that the establishment of foreign production is likely to mean that internal exports from the parent to the foreign affiliate will increase even when foreign production represents a very high share of the firm’s total output. This will mean a substantial reorientation of parent firm activity away from the final product to intermediate inputs such as subassemblies. Such a reallocation can be effected more speedily and with less cost if it is anticipated. The estabishment of a foreign affiliate will also tend to have a positive effect on the parent’s exports outside the group, but this effect will be dissipated unless the fum’s relative international competiveness also improves. Second, even in’ firms which are highly internationalized, there is a great deal of scope for increasing intra-group trade and improving extra-group export. Third, firms within the same industry and nationality classifications differ

224 P. J. Buckley and R. D. Pearce
greatly in their international competitive standing, and a gain or loss in relative competitiveness can overwhelm the effects arising from rela- tionships between exporting and foreign production.
Our analysis also sheds a little light on the effects of foreign invest- ment on source country employment [ 1,9, 171. It is clear that increasing foreign production may lead to changing levels of exports, at first positive but eventually-at high levels of foreign production-negative, unless the international competitiveness of the firm can also be im- proved. If we assume that internal exports are primarily parts and components and external exports are final goods, then increasing foreign production will lead to a changing composition of exports; so if labor intensity of these types of exports differs, the rate of change of em- ployment may differ considerably from the rate of change of export performance.
References
1.
2.
3.
4.
5.
6.
I.
8.
9.
10.
11.
Bergsten, C. F., Horst, T., Moran, T. H. American Multinationals and American Interesfs. Washington, D.C.: Brookings Institution (1978).
Bradshaw, M. T. U.S. exports to foreign affiliates of U.S. fums. Survey ofCurrenf Business (May 1969):34-51.
Buckely, P. J. The role of exporting in the market servicing policies of multina- tional manufacturing enterprises: Theoretical and empirical perspectives. In: Czinkota, M. R., Tesar, G. eds. Export Management: An International Context. New York: Praeger (1982).
Buckley, P. J., Casson, M. C. The Future of the Multinational Enterprise. New York: Macmillan, London and Holmes-Meier (1976).
Buckley, P. J., Pearce, R. D. Market servicing by multinational manufacturing fums: Exporting versus foreign production. Managerial and Decision Economics 2:229-246 (December 1981).
Buckley, P. J., Pearce, R. D. Overseas production and exporting by the world’s largest enterprises: A study in sourcing policy. Journal of International Business Studies 10:9-20 (Spring 1979).
Dunning, J. H., Pearce, R. D. The World’s Largest Industiral Enterprises. Farn- borough, U.K., Gower Press (1981).
Horst, T. American exports and foreign direct investment. Harvard Institute of Economic Research Discussion Papers, No. 362 (1974).
Hufbauer, G. C., Adler, F. N. OverseasManufacturing Investment and the Balance of Payments. Tax Policy Research Study No. 1, U.S. Treasury Department, Washington D.C. (1968).
Katrak, H. Multi-national firms’ exports and host country commercial policy. Economic Journal 91:454-65 (June 1980).
Lall, S. The pattern of intra-fnm exports by U.S. multinationals. Oxford Bulle- tin of Economics and Statistics 40:209-22 (August 1978).

Multinational Enterprises 225
12.
13.
14.
15.
16.
17.
18.
Lall, S. Transfer-pricing by multinational manufacturing firms. Oxford Bulletin of Economics and Statistics 35 :173-95 (August 1973).
Lipsey, R. E., Weiss, M. Y. Exports and Foreign Investment in Manufacturing In- dustries. National Bureau of Economic Research, Working Paper No. 131 (1976).
Murray, R. Multinationals Beyond the Market: Intra-Firm Trade and the Control of Transfer Pricing. Brighton: Harvester Press (1981).
Newbould, G. D., Buckley, P. J., Thruwell, J. Going International: The Experience of Smaller Companies Overseas. New York: Associated Business Press, London and Halsted Press (1978).
Pearce, R. D. Overseas production and exporting performance: An empirical note. University of Reading Discussion Papers in International Investment and Business Studies. No. 64 (1982).
Reddaway, W. B., et al. Effects of U.K. Direct Investment Overseas. Interim Re- port and Final Report. Cambridge: Cambridge University Press (1967 and 1968).
Reid, S. Export research in a crisis. In: Czinkota, M. ed. Export Promotion: The Public and Private Sector Interaction. New York: Praeger (1983).


![Imperfect international competition, multinational enterprises and manufactured exports from developing countries [microform]](https://img.pdfslide.net/doc/110x75/6355ef61328574b6730c331a/imperfect-international-competition-multinational-enterprises-and-manufactured.jpg)


