Embed Size (px)
Citation preview

lable at ScienceDirect
Water Research 83 (2015) 184e194
Contents lists avai
Water Research
journal homepage: www.elsevier .com/locate/watres
Hydraulic continuity and biological effects of low strength very lowfrequency electromagnetic waves: Case of microbial biofilm growth inwater treatment
Merlin G�erard a, *, Omri Noamen a, Gonze Evelyne a, Valette Eric b, Cauffet Gilles c, d,Henry Marc e
a LOCIE UMR CNRS 5271, Universit�e de Savoie, 73376, Le Bourget du Lac, Franceb Planet Horizons Technologies, Technopole 5, 3960 Sierre, Switzerlandc Univ. Grenoble Alpes, G2Elab, F-38000 Grenoble, Franced CNRS, G2Elab, F-38000 Grenoble, Francee LCMES UMR CNRS 7140 Universit�e de Stasbourg, 67000 Strasbourg, France
a r t i c l e i n f o
Article history:Received 15 September 2014Received in revised form6 June 2015Accepted 25 June 2015Available online 30 June 2015
Keywords:Water treatmentMicrobial biomassVLF electromagnetic fieldsQuantum field theoryWater coherence
* Corresponding author.E-mail address: [email protected] (M.
http://dx.doi.org/10.1016/j.watres.2015.06.0410043-1354/© 2015 Elsevier Ltd. All rights reserved.
a b s t r a c t
This study aims to elucidate the interactions between water, subjected to electromagnetic waves of verylow frequency (VLF) (kHz) with low strength electromagnetic fields (3.5 mT inside the coils), and thedevelopment of microbial biofilms in this exposed water. Experimental results demonstrate that in waterexposed to VLF electromagnetic waves, the biomass of biofilm is limited if hydraulic continuity is ach-ieved between the electromagnetic generator and the biofilm media. The measured amount of thebiofilm's biomass is approximately a factor two lower for exposed biofilm than the non-exposed biofilm.Measurements of electromagnetic fields in the air and simulations exhibit very low intensities of fields(<10 nT and 2 V/m) in the biofilm-exposed region at a distance of 1 m from the electromagneticgenerator. Exposure to electric and magnetic fields of the quoted intensities cannot explain thermal andionizing effects on the biofilm. A variable electrical potential with a magnitude close to 20 mV wasdetected in the tank in hydraulic continuity with the electromagnetic generator. The application ofquantum field theory may help to explain the observed effects in this case.
© 2015 Elsevier Ltd. All rights reserved.
1. Introduction
Although a number of studies have been conducted over manyyears, the effect of very low frequency (VLF) electric and magneticfields (EMF) on living organisms is still insufficiently understood,particularly at low intensity. Radio frequencies (RF) in the range of3 kHze30 kHz and wavelenghts from 1 to 10 km are considered tobe in the VLF regime. A decrease in biofilm has been empiricallynoted after electromagnetic treatment of limescale formation inwater supply lines of poultry farms and irrigation systems usingVLF electromagnetic commercial systems. Treatment of seawaterwith the same electromagnetic system enabled the partial removalof a mature biofilm adhering to the inner surfaces of the tubes of aheat exchanger-condenser (Trueba et al., 2014). Therefore, it is
G�erard).
interesting to investigate the effect of VLF-EMF on biofilm forma-tion in water, through a multidisciplinary approach, undercontrolled conditions.
Generally speaking, biofilms are defined as a complex commu-nity of bacteria, fungi, protozoa and macroinvertebrates withseveral trophic levels as observed for wastewater biofilms (Tsunedaet al., 2003). Biofilm development on a medium is achieved inseveral steps (O'Toole et al., 2000): initiation, adhesion, growth,maturation, and detachment. Many factors affect the various stepsand involve the physicochemical properties of the substrate, bioticfactors and/or environmental factors (Mueller, 1996). Organizationof microorganisms in biofilm enables optimal use of availablesubstrates and protects the microorganisms from adverse condi-tions and stress (Jefferson, 2004). Also, 70e90% of the dry mass ofbiofilms consists of extracellular polymeric substances (Tsunedaet al., 2003) which gives the biofilm the properties of a gel with ahighly hydrophilic porous structure containing up to 95% H2O.Although in certain cases the presence of biofilms is good (e.g.

Fig. 1. Schematic representation of one line of the experimental device (1: feedingtank; 2: peristaltic pump; 3 and 4: generator and tube Aqua-4D 60E; 5: tank 1 andglass-slides; 6: tank 2 with glass-slides; 7: outlet).
M. G�erard et al. / Water Research 83 (2015) 184e194 185
bioprocesses case), in many cases, this presence can have a negativeeffect due to clogging or health problems; and various techniquesare subsequently used to limit or eradicate the unwanted biofilm(Costerton et al., 1999).
Biological effects due to RF exposure; including VLF waves, areclassified as thermal effects and non-thermal effects in lower en-ergy fields. Non-thermal effects of electromagnetic waves are themost difficult to identify due to the low exposure energies. Inter-action of EMFs with matter can be modeled from the microscopiclevel to the macroscopic level (Baker-Jarvis and Sung, 2012). Intheory, the electromagnetic field interactions with biological mat-ter may be modeled on a microscopic scale by applying quantummechanics and by using Maxwell's equations at macroscopic level.It is challenging to model interactions in the mesoscopic scale(10�7 me10�4 m) since classical analysis begins to be modified byquantummechanics. According to the quasi-static nature of EMF atlow frequencies, such RF electric and magnetic fields act indepen-dently of one another (Habash Riadh, 2006) and bioelectric orbiomagnetic phenomena are commonly modeled as quasi-staticcases in which electric and magnetic fields can be studied sepa-rately (Zhou and Uesaka, 2006). Dielectric response of biologicalmaterials is related to membrane and cell boundaries, moleculardipoles, together with associated ionic fluids and counterions(Baker-Jarvis and Sung, 2012). At a molecular level RF-EMF interactwith moving charges, similar to electrons in cytochrome oxidase(Blank and Soo, 2001).
To the best of our knowledge excluding the work of Trueba et al.(2014), the only studies published on the effects of EMFs on bio-films concern extremely low frequency EMF. Although VLF elec-tromagnetic waves are slightly more energetic than extremely lowfrequencies (ELF) electromagnetic waves, the nature of observednon-thermal effects could be similar to ELF electromagnetic waves.For prokaryotic systems, exposure to electromagnetic fields pro-duce effects of stress, causing phenotypic and genetic perturbationsof planktonic cells (free cells) that may affect the adhesion of thesecells and their organization into a biofilm (Cellini et al., 2008; Chuaand Yea, 2005; Del re et al., 2004). Bacterial cultures of Helicobacterpylori ATCC 43629 were exposed to a low frequency magnetic field(50 Hz, 1 mT intensity) for two days (Di Campli et al., 2010). Themagnetic field acted on the bacterial population during the for-mation of the biofilm and after the maturation phase by decreasingcell viability and cell mass when compared to the control biofilm.Based on the work of Pickering et al. (Pickering et al., 2003) whenStaphylococcus epidermidis biofilms aged 5 days and incubated12 h with various concentrations of antibiotics (vancomycin orgentamicin) at 37 �C and 5% CO2, are exposed to ELF-EMF (72 Hz),the efficiency of gentamicin against biofilms increases by at least50%. It was also found that electrical fields with low intensity(1.5e20 V cm�1) and current densities ranging from 15 mA cm�2 to2.1 mA cm�2 can decrease the inherent resistance of bacterialbiofilms to biocides (Blenkinsopp et al., 1992) and antibiotics(Costerton et al., 1994). This bioelectric effect reduces by a factor 1.5to 4.0 the required concentrations of these antibacterial agents tokill the biofilm bacteria.
In this study we investigated the formation and development ofbiofilms on glass slides exposed to water subjected to VLF elec-tromagnetic waves. This study represents only part of the ongoingwork to characterize the effects of electromagnetic fields at verylow frequencies and low intensities on the growth of microorgan-isms in aqueousmedia. This work corresponds to a first approach toverify and quantify empirical observations found in situ.
Compared with previous studies done with ELF-EMF, the biofilmin our study was not exposed in the heart of the generator but at adistance of one meter, where the field strengths in the air wereextremely weak. Both the presence and lack of hydraulic continuity
was investigated to assess its role in the transmission of EMF andtheir possible effects between the generator and the biofilm on glasssupports. The assumptionwould be that the high sensitivity of liquidwater to electromagnetic waves was due to its organization incoherence domains (CD), as calculated with quantum field theory(Bonoet al., 2012). Under this assumption liquidwater is organized indomains by a stacking of coherence overlappingwith each other andholding cold vortices of quasi-free electrons (Marchettini et al., 2010),making it sensitive to electromagnetic fields on the order of a fewkHz. Intracellular water maintaining its coherence would also besensitive to electromagneticwaves of very low frequencies, resultingin a disturbance of the metabolic activities (Del Guidice et al., 2010).
2. Materials and methods
2.1. Experimental device (Fig. 1)
Glass slides were placed in glass tanks fed by a nutrient solutionthat had previously passed through an electromagnetic wavegenerator (Aqua-4D 60E Pro® from Planet Technologies Horizons,Switzerland). The use of a synthetic nutrient solution enabledcontrol of the operating conditions, particularly the applied organicload: starch 0.05 g/L; glucose 0.05 g/L; KH2PO4 1.25 mg/L;(NH4)2SO4 2.5 mg/L; CH3CO2Na 2.5 mg/L; peptones 2.5 mg/L. Thechemical oxygen demand (COD) was close to 100 mg/L, the elec-trical conductivity was 0.36 ± 0.027 mS cm�1 and the pH of thenutrient solution was 7.2. These physicochemical parameter valuescorrespond to eutrophic-hypertrophic conditions (European WaterFramework Directive, 2000) which promote the development ofbiofilms on the glass slides.
The first tank (C1) arranged downstream from the generator at adistance of one meter was in hydraulic continuity with the gener-ator; while the second tank (C2) was located downstream from C1at a distance of 0.20 m from C1 and supplied by a dropwise,ensuring hydraulic discontinuity. The biofilm media were glassslides (76� 26 mm2). Twenty slides were placed in tanks C1 and C2and positioned on supports. C1 tank was of cylindrical shape with adiameter of 0.16 m and a water height of 0.15 m. C2 tank was arectangular parallelepiped having a width of 0.10 m, a length of0.30 m and a water height of 0.10 m. Each tank had a volume of 3 Lof nutrient solution. The facility had a total storage volume of

M. G�erard et al. / Water Research 83 (2015) 184e194186
10.45 L. Hydraulic residence time (volume/influent flowrate) ofnutrient solution in a tank was 10.0 ± 1.9 h. The entire setup wasplaced in the dark in a thermostated room at 20 �C. The bench testconsisted of two identical lines arranged in parallel. For the first linethe electromagnetic device was active and for the reference line theelectromagnetic device was switched off. The electromagnetic de-vice included an electronic control box that generated signals,which were subsequently diffused by the coils inserted into a tubedesigned to prevent the occurrence of electrical continuity betweenthe coil and the water. Two VLF waves with harmonic frequencieswere each generated at a designated frequency on the order of fewkHz (confidential data protected by patent: EP2364954A1). Themagnitude of the electromagnetic fields was 3.5mT inside the coils,and 10 V/m and 8 mT close to the external surface of the generator(cf. Section 2.4.2 for measurement method). Due to the long periodrequired for these experiments, they were carried out as a firstapproach using the settings (frequencies and intensities) recom-mended by the generator's manufacturer.
Environmental magnetic fields around the experimental devicemeasured in the VLF band were on the order of 1 nT and 0.1 V/m.These values were measured in air with dedicated equipment(Narda EHP50) when the electromagnetic source was switched offaccording to the method described in Section 2.4.2.
The magnitudes of biofilm exposure to magnetic and electricfields were, respectively, close to 8 nT and 2 V/m. These values weremeasured in air with dedicated equipment (Narda EHP50) at adistance of 1 m from the electromagnetic source according to themethod described in Section 2.4.2.
2.2. Test procedure
The experiment was carried out with three independent trialsreferred to as test 1, test 2 and test 3. However, there were somedifferences between the three tests: 1) primarily with regard to theduration of the test, 2) the nature of the inoculum and 3) thenumber of parameters evaluated for biomass measurement(Table 1). All other experimental conditions were identical. Bothlines operated in an open hydraulic circuit. Feeding flow was208 mL h�1. For this verification approach of the effects of VLF-EMFs on biofilm development, it seemed desirable to test varioussources of microorganisms. For test 1 and test 2 the microbialinoculum came from diluted solutions of anaerobic sludge andactivated sludge from laboratory reactors. For test 3 the inoculumwas taken from the Leysse river (France). Inoculum was added atthe beginning of feeding in a proportion of 2 L. Every three to fourdays one glass slide was removed from each tank and the biofilmwas detached by scraping and sonication. The obtained biofilmwasquantified using different methods (cf. Section 2.3). The two lineswere crossed on the 82nd day for test 1, on the 65th day for test 2and on the 40th day for test 3: slides from the C1 VLF-EMF lineweretransferred into the C1 control line and vice versa. The same wasdone with the slides in C2. The experiment was stopped after 95days, 80 days, and 63 days for tests 1, 2, and 3, respectively.
2.3. Biofilm measurements
Five different types of measurements of biomass were carried
Table 1Differences for operational conditions between the three independent tests conducted.
Test Duration (days) Stop VLF-EMF on day
1 95 822 80 653 63 40
out to quantify the biofilm following normal methods (Merlin andCottin, 2012). Measurements were made from samples of biofilmdetachment solution. The results were expressed per unit area ofglass slide. Bacterial density was estimated by measuring the op-tical density at 600 nm against water as a blank (OD600). COD wasmeasured by the Hach ® micro-method using a Hach DR/5000spectrophotometer (Hach-Lange, France). A protein assay wasperformed by the colorimetric bicinchoninic acid method (BCAassay) using the BCA protein assay kit (Pierce, USA) and expressedas bovine serum albumin (BSA) equivalent (Olsen and Markwell,2007).
An ATP assay was measured by bioluminescence using theTCB™ Kit (TCB-50 Total Control BWWT 50, Aqua-Tools, France).Dosage of exopolysaccharides (EPS) expressed as glucose equiva-lent was performed by using colorimetry equivalents in the pres-ence of sulfuric acid and warm phenol, as described in Merlin andCottin (2012).
All measurements were made in triplicate.
2.4. Electrical and electromagnetic measurements
2.4.1. Electric potentialElectric potential measurements for water were performed in
the different tanks using a common voltmeter and expressed as awaveform table (Metrix6848, France). The reference was fixed tothe grounding circuit of the installation. Discrete representation ofthe electrical signal in the frequency domain was performed usingFast Fourier Transform (FFT) analysis on 2500 points (Equation (1)).
XðkÞ ¼ 1N$
Xn¼N2�1
n¼N2
xðnÞ$exp�� 2ip$
kN$n
�for k2½0ðN � 1Þ� (1)
where: x (n): a sample in the time domain, x (k): a sample in thefrequency domain, N: resolution of the FFT, n: time index, k: fre-quency index.
2.4.2. Electromagnetic field2.4.2.1. Measurements. Measurements of RF electric and magneticfields (1e100 kHz) were carried out with dedicated equipmentconsisting of a three-axis acquisition analyser of RF fields (NARDAEHP-50D; Narda STS, DE). The electromagnetic treatment systemwas based on two coils (coil 1 and coil 2). Each coil was controlledby a voltage generator at a dedicated frequency corresponding tothe term “harmonics”. Excitation signals enabled differences(magnitude and phase) between the two control signals to behighlighted and thus the shapes of the magnetic field excitationsignals to be visualized. This system did not act as a single coil butas a set of two coupled coils with a global field driven by coil 1 andcoil 2.
2.4.2.2. Magnetic field modeling. Electromagnetic modelling of thesystem allowed the stress, the “beats” generated by the device to befor highlighted. Associating the geometry and the excitationvoltage signals of each coil, a physical model was used to determinethe magnetic field. The calculus was defined by the Biot-Savart law(Durand, 1968):
Inoculum Biomass parameters to quantify biofilm
Anaerobic sludge COD; bacterial density; BSA; ATP; EPSActivated sludge COD; bacterial density; BSA; ATP; EPSRiver water BSA; ATP; EPS

M. G�erard et al. / Water Research 83 (2015) 184e194 187
BðrÞ ¼Z
Gðr; r0Þ∧jðr0Þdr0 (2)
Gðr; r0Þ ¼ m04p
ðr0 � rÞjr0 � rj3
(3)
where: B is the magnetic field (magnetic flux density) at the po-sition r from the axes origin, j is the current density at the position r′, m0 is the permeability of vacuum and G is the Green function.
Modeling of EMF was carried out with Flux 2D/3D (CEDRAT,France), an electromagnetic simulation software program. Fig. 2shows variations and amplitudes of the signal generated by thetwo coils system at different times.
2.5. Statistical analysis
Statistical analysis was performed using parametric (one-wayand two-way ANOVA) or non-parametric (Friedman analysis) testsand the difference between electromagnetic treatment and controlwas expressed as significant at a significance level of p < 0.05. The pvalue is the estimated probability of rejecting the null hypothesis(hypothesis of “no difference” of the test when that hypothesis istrue).
The non-parametric statistical test was carried outwhen data donot meet criteria for a parametric test (normally distributed, equalvariance). Post-hoc tests were conducted in order to decide whichgroups were significantly different from each other based on F-testfor Ryan's test (ANOVA) and based upon the mean rank differencesof the groups for Friedman test.
Statistical analyses were performed using the StatEL software(adSciences, France).
3. Biofilm determination
3.1. Experimental results
Three tests were conducted under identical conditions in termsof biofilm exposure to VLF-EMF. Figs. 3 and 4 showing bacterialdensity and ATP evolution during test 2 illustrate the evolution ofbiomass parameters of biofilm on glass slides. The evolution ofother measured parameters such as COD, protein, and EPS was
Fig. 2. Simulation of the amplitudes of electromagnetic signals gener
similar. Table 2 shows values for the five parameters measured onthe 60th day of test 2 immediately before the line inversion on the65th day.
For the different biomass quantification parameters percentagesof growth inhibition of biofilm exposed to VLF-EMF versus controlswere calculated for the three tests (Table 3). Statistical analysis wasperformed to compare the different groups of data as described insection 2.5. The results showed inhibition ranging from 42 to 70%for C1-EM tanks. For C2-EM tanks values were much more scat-tered and ranged from growth activation of 75% to a maximumgrowth inhibition of 23%.
3.2. Modeling of biofilm growth on glass slides
Two types of growth kinetics were observed according to theconditions of exposure to VLF-EMF and hydraulic continuity(Fig. 3A). The biofilm exposed to electromagnetic waves and inhydraulic continuity grew more slowly than the biofilm control.When hydraulic continuity was not present, the growth of biofilmexposed to the electromagnetic waves was similar to controls.When the biofilm in hydraulic continuity was no longer exposed toVLF-EMF growth has increased again. Based on these observations,we thought it would be possible to describe the biofilm formationon glass slides using a modified Gompertz equation (Zwieteringet al., 1990). This type of equation corresponds to growth kineticsof microorganisms regulated by a limiting substrate, such as in abiofilm according to the thickness, and a growth factor indepen-dent of biomass (Pav�e, 2012). We have assumed that any otherphenomenon (e.g. mortality) was negligible when compared to thegrowth during biofilm formation.
During the phase of biofilm development, several steps maysucceed each other (initiation, induction, growth, maturation anddetachment), resulting in a sigmoidal growth curve. The differentsteps can be modeled by Equation (4). The characteristic parame-ters of sigmoidal growth curve are latency or lag phase (l),maximum growth rate (k) during the exponential phase, andmaximum value (xmax) corresponding to the asymptotic value ofgrowth during the stationary phase.
xðtÞ ¼ x0 þ xmax$exp½b expð � k$ðt � lÞÞ�
where : b ¼ constantzln�
exmax
� (4)
ated by the two coils of the water treatment system versus time.

Fig. 3. A. Evolution of protein amount versus time for test 2. B. Fit of modified Gompertz equation. Symbols correspond to experimental data and lines correspond to modeling(Equation 4 or 5) according to phase number.
M. G�erard et al. / Water Research 83 (2015) 184e194188
This model is widely used to characterize bacterial growth ki-netics with different conditions. It has the advantage of not beingsymmetrical relative to the inflection point in contrast to a logisticequation and is thereforemore realistic; but it can overestimate themaximum growth rate at times and thus has weak sensitivity.
Biofilm growth was monitored over time by a parameter iden-tified as xt in our case. This parameter may have been bacterial
density, COD, or EPS concentration. In our case the initial value offixed biomass was zero, i.e. x0 ¼ 0, since only planktonic cellsexisted at t ¼ 0.
It is possible to distinguish the succession of different phasesduring biofilm development that produces Equation (5) (showingtwo phases), taking into account iteration with constant valuescorresponding to each phase:
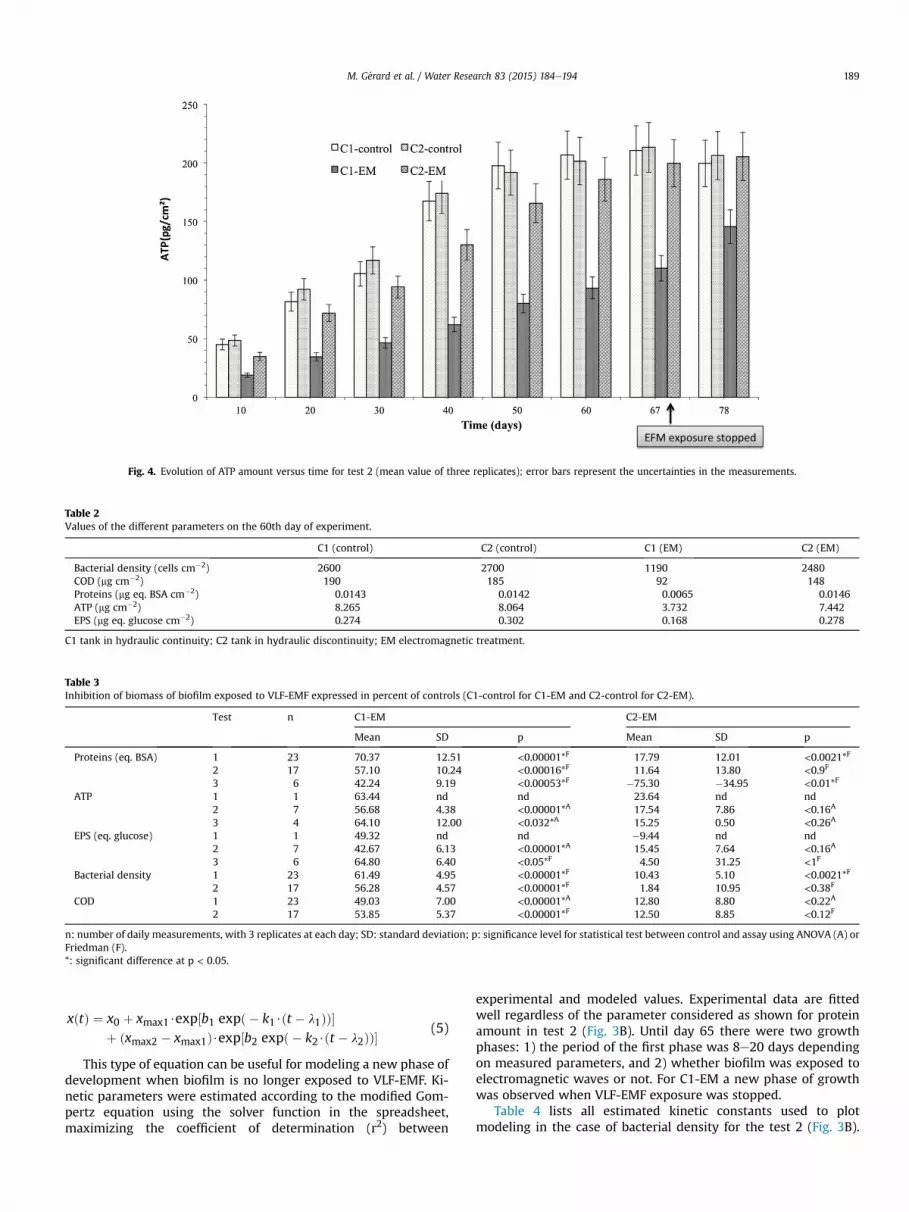
Fig. 4. Evolution of ATP amount versus time for test 2 (mean value of three replicates); error bars represent the uncertainties in the measurements.
Table 2Values of the different parameters on the 60th day of experiment.
C1 (control) C2 (control) C1 (EM) C2 (EM)
Bacterial density (cells cm�2) 2600 2700 1190 2480COD (mg cm�2) 190 185 92 148Proteins (mg eq. BSA cm�2) 0.0143 0.0142 0.0065 0.0146ATP (mg cm�2) 8.265 8.064 3.732 7.442EPS (mg eq. glucose cm�2) 0.274 0.302 0.168 0.278
C1 tank in hydraulic continuity; C2 tank in hydraulic discontinuity; EM electromagnetic treatment.
Table 3Inhibition of biomass of biofilm exposed to VLF-EMF expressed in percent of controls (C1-control for C1-EM and C2-control for C2-EM).
Test n C1-EM C2-EM
Mean SD p Mean SD p
Proteins (eq. BSA) 1 23 70.37 12.51 <0.00001*F 17.79 12.01 <0.0021*F
2 17 57.10 10.24 <0.00016*F 11.64 13.80 <0.9F
3 6 42.24 9.19 <0.00053*F �75.30 �34.95 <0.01*F
ATP 1 1 63.44 nd nd 23.64 nd nd2 7 56.68 4.38 <0.00001*A 17.54 7.86 <0.16A
3 4 64.10 12.00 <0.032*A 15.25 0.50 <0.26A
EPS (eq. glucose) 1 1 49.32 nd nd �9.44 nd nd2 7 42.67 6.13 <0.00001*A 15.45 7.64 <0.16A
3 6 64.80 6.40 <0.05*F 4.50 31.25 <1F
Bacterial density 1 23 61.49 4.95 <0.00001*F 10.43 5.10 <0.0021*F
2 17 56.28 4.57 <0.00001*F 1.84 10.95 <0.38F
COD 1 23 49.03 7.00 <0.00001*A 12.80 8.80 <0.22A
2 17 53.85 5.37 <0.00001*F 12.50 8.85 <0.12F
n: number of daily measurements, with 3 replicates at each day; SD: standard deviation; p: significance level for statistical test between control and assay using ANOVA (A) orFriedman (F).*: significant difference at p < 0.05.
M. G�erard et al. / Water Research 83 (2015) 184e194 189
xðtÞ ¼ x0 þ xmax1$exp½b1 expð � k1$ðt � l1ÞÞ�þ ðxmax2 � xmax1Þ$exp½b2 expð � k2$ðt � l2ÞÞ�
(5)
This type of equation can be useful for modeling a new phase ofdevelopment when biofilm is no longer exposed to VLF-EMF. Ki-netic parameters were estimated according to the modified Gom-pertz equation using the solver function in the spreadsheet,maximizing the coefficient of determination (r2) between
experimental and modeled values. Experimental data are fittedwell regardless of the parameter considered as shown for proteinamount in test 2 (Fig. 3B). Until day 65 there were two growthphases: 1) the period of the first phase was 8e20 days dependingon measured parameters, and 2) whether biofilm was exposed toelectromagnetic waves or not. For C1-EM a new phase of growthwas observed when VLF-EMF exposure was stopped.
Table 4 lists all estimated kinetic constants used to plotmodeling in the case of bacterial density for the test 2 (Fig. 3B).

Table 4Kinetic parameters calculated from Equation (4) or (5), case of bacterial density for test 2.
C1 (control) C2 (control) C1 (EM) C2 (EM)
1st phase xmax1 (mg cm�2) 1000 850 450 850b1 (e) 2.7 2.7 2.7 2.7k1 (d�1) 0.15 0.16 0.16 0.16l1 (d) 0 0 0 0
2nd phase xmax2 (mg cm�2) 3950 3850 1750 3700b2 (e) 7.1 7.1 7.1 7.1k2 (d�1) 0.0645 0.061 0.061 0.061l2 (d) 19 16 19 16
3rd phase xmax3 (mg cm�2) 2500b3 (e) 7.1k3 (d�1) 0.45l3 (d) 67
C1 tank in hydraulic continuity; C2 tank in hydraulic discontinuity; EM electromagnetic treatment.Kinetic parameters: latency (l); maximum growth rate (k); maximum value (xmax); mathematical constant (b).
M. G�erard et al. / Water Research 83 (2015) 184e194190
Parameter xmax, corresponding to the maximum density of biofilmon glass slides (mg cm�2) appeared to be the most sensitive to thebiofilm exposed and in the presence of hydraulic continuity withvalues of about half of the controls. When VLF-EMF exposure wasstopped, the parameter of maximum growth rate increased by afactor 2 relative to the exposure period and compared to controls.
3.3. Discussion
3.3.1. Effect of EMFs in the presence of hydraulic continuityAll the experimental results show that the presence of low EMF
limited the biofilm development in C1 when it was in hydrauliccontinuity with the VLF-EMF generator (Table 3). For all parametersand all tests the average inhibition of biofilm development in tankC1-EM versus C1-control was of the order of 55%: 58.7% ± 8.3% (test1); 53.3% ± 5.5% (test 2) and 57.1% ± 10.4% (test 3). OD600, COD andproteins are not the most sensitive methods to characterize andquantify cell biomass in biofilm but the results are sufficientlysignificant to show the reduction of the biofilm biomass with thepresence of VLF electromagnetic waves. A certain fraction of theprotein, OD600 and COD is extracellular and depends on exopol-ymer production and cellular lysis; but ATP is a direct andinterference-free indicator of living biomass. ATP does not accu-mulate in the biofilm matrix and depends on the growth state ofthe cell (Lazarova and Manem, 1995). This parameter showed thatthe active biomass was also reduced by VLF-EMF in the presence ofhydraulic continuity. Reduction of the amount of EPS was of thesame order of inhibition as other parameters, although EPS can besecreted by the bacteria during stress (Flemming and Wingender,2010). Uronic acids (components of EPS), acidic amino acids andphosphate-containing nucleotides as negatively charged compo-nents of exopolymeric substances can be crucial structural ele-ments of biofilms because they are expected to be involved inelectrostatic interactions with multivalent cations (e.g., Ca2þ, Mg2þ
or Fe3þ). These cations mediate the formation and/or stabilizationof the exopolymeric substances matrix network (Tsuneda et al.,2003). In water treated with electromagnetic fields Ca2þ andMg2þ concentrations decrease due to nucleation of ionic calcium ormagnesium and their precipitation into calcium or magnesiumcarbonates (Shahryari and Pakshir, 2008) could influence biofilmgrowth by acting on the exopolymeric matrix (Trueba et al., 2014).However, no conductivity change was observed between treatedand untreated lines in this experiment and ionic strength wasapproximately 6.2 mM, with 2.4 mM for Ca2þ and Mg2þ.
To determine persistence of the effect of EM waves on biofilmgrowth, glass slides were reversed when biofilm growthapproached an asymptotic value. A change in slope measured byparameter k3 was observed (0.45 d�1 against 0.061 d�1) indicating
a significant increase growth for biofilm on slides previously sub-jected to electromagnetic waves (C1-EM) and thus disappearanceof the bacteriostatic effect. However, applying the electromagneticwaves on glass slides initially positioned in line without excitation(C1-control) did not result in a significant decrease in the rate ofbiofilm formation during this period. Kinetic constants determinedin the C1-control, C2-control and C2-EM tanks had very similarvalues calculated for the three kinetic parameters, as shown forbacterial density evolution in test 2 (Table 4). The first biofilmdevelopment phase corresponds to a period of 8e20 daysdepending on whether parameters measured and biofilm wereexposed to VLF-EMF. These results based on modeling confirm theresults of the comparative statistical test (Friedman test), which didnot show significant differences between these three experimentalconditions (F3,18 ¼ 34.5; p < 0.00001). For the tank in hydrauliccontinuity with the electromagnetic wave generator (C1-EM), itwas primarily the maximum values xmax of phases 1 and 2 thatwere lowest, and they were ~50% lower than values reported forother tanks (Table 4). It was also observed that the latency of phase2 was longer, extending from two to three days, depending on theparameter measured. On the contrary, growth rates were slightlydifferent. This may correspond to an effect on initiation and in-duction of biofilm phases, which leads to a lower quantity of mi-croorganisms being able to proliferate in the biofilm. However, itmay be that the chosen numerical method for setting the modelparameters could be partially the cause of an effect only on xmax,which is the most sensitive parameter.
Overall there was a bacteriostatic effect of VLF-type electro-magnetic waves which disappeared after emission of these waveswas stopped. This was verified after stopping the generator. Thenthere was a new phase of development modeled according toEquation (5) (phase 3), where biofilm growthwas stimulatedwith ahigher maximum rate than in previous phases (Table 4). A decreasein the maximum value of biofilm formation by a factor of approx-imately 2 was consistently observed in the presence of electro-magnetic waves, but not its destruction. Moreover, whenelectromagnetic waves were stopped, the maximum value wasclose to the value observed for the controls. Thus, the application ofVLF electromagnetic waves of very low intensity has a bacterio-static, but not a biocide, effect.
3.3.2. Effect of hydraulic discontinuity (C2 tanks)Nutrient solution flowed between tanks 1 and 2 through a
dropwise so that there was no hydraulic continuity. The biofilmdevelopment was slightly affected by the presence of electromag-netic waves in the event of a hydraulic discontinuity as in test 1 and2. For all parameters, average inhibition of biofilm development intank C2-EM versus C2-control was 11.1% ± 11.2% for test 1 and

M. G�erard et al. / Water Research 83 (2015) 184e194 191
11.8%± 5.4% for test 2. Parametric or non-parametric statistical testswith post hoc analysis were conducted as described in Section 2.5to compare the effect of VLF-EMF on biomass of biofilm with andwithout hydraulic continuity between generator and tanks. Forinhibition data expressed in percentages versus controls (Table 3),the difference in test score between the hydraulic continuity con-ditions and hydraulic discontinuity conditions was found to bestatistically significant (test 1: F5,22 ¼ 98.71, p < 0.00001; test 2:F5,16 ¼ 68.53, p < 0.00001). However, for rough data, there was asignificant difference between C2-EM and C2-control for proteinsin test 1 (F3,23 ¼ 52.21, p < 0.0021) and test 3 (F2,5 ¼ 12, p < 0.01),and for bacterial density in test 1 (F3,23¼ 52.51, p < 0.0021). Despitesome uncertainty concerning the total lack of effect under hydraulicdiscontinuity conditions; the need for hydraulic continuity for theexpression of the VLF-EMF effect is demonstrated by the growth ofthe biofilm after stopping EMF exposure (Figs. 3A,B and 4). Indeed,the growth rates in tank C2-EM and in the line of tanks withoutVLF-EMF were very similar. Therefore, it appears that the signalresponsible for a bacteriostatic effect was transmitted by water. Adistance of approximately 1 m between the tube containing coilsand the generator does not explain that the intensity of VLF-EMFsgave rise to the observed effects of ionizing radiation or thermalmechanisms. Electric andmagnetic field intensities measured in airwere, respectively, lower than 2 V/m and 10 nT at a 1-m distancefrom the coils (Fig. 5).
The effective isotropically radiated power of the system wasonly 133 mW; resulting in a root mean square value of 2 V/m asmeasured in air for the electric field at a distance of one meter.
Taking into account the intensity of this electric field, the spe-cific absorption rate (SAR) in W/kg for exposed biofilm can beestablished as
SAR ¼ s$E2
2$r(6)
where: s: the electrical conductivity (0.5 S for cellular fluid; Roth,2000); E: the electric field (V/m); r: the biological material den-sity (z1000 kg/m3).
Fig. 5. Intensities of electromagnetic fields measured in the air
With an electric field of 2 V/m the SAR is only 1.10�9 W/mg forexposed biofilms. This low value can conventionally explain thelack of an observed effect, or at most a very weak effect, on growthof biofilm exposed without hydraulic continuity. Therefore, “whythe need for hydraulic continuity to observe an inhibitory effect?”
3.3.3. Detection of electrical signals and water sensitivity toelectromagnetic waves
Within the pilot line, with an active electromagnetic system, avariable electrical potential with a magnitude close to 20 mV wasdetected in C1-EM placed in hydraulic continuity with the gener-ator (Fig. 6). This signal disappeared while the generator wasstopped and was not present in C2-EM in hydraulic discontinuity.Not only did the DC voltage level change during activation ofelectromagnetic system but also the harmonics of the signal. Thefrequency analysis provided an analogy with the emitted electro-magnetic wave (Fig. 7). Frequencies measured corresponded to thefundamentals (excitation frequencies) and the harmonic compo-nents of the electromagnetic system.
Therefore, with hydraulic continuity an electric field appearedto be present in tank C1 (located at a distance of approximately 1 mfrom the generator). However, according to classical laws of phys-ics, water is should be a diamagnetic substance with a very lowsensitivity to magnetic fields. Changing from classical to corpus-cular quantum physics does not alter this interpretation becausethe electromagnetic field in the first quantization is treated ac-cording to Maxwell's equations, implying continuous waves andnot as quantized photons. Previous literature (Trueba et al., 2014;Cellini et al., 2008; Chua and Yea, 2005; Del re et al., 2004) re-veals a sensitivity of living organisms to very weak electromagneticfields. One has to consider how liquid water would react to aquantized virtual electromagnetic field known to be present in thevacuum generated through H-bonding between water molecules(Bono et al., 2012; Del Guidice et al., 2010).
At the first quantization level, liquid water is adequatelydescribed as a flickering tetrahedral H-bonded network of watermolecules with a mean residence time for protons ranging from1 ps at temperature T ¼ 300 K up to 20 ps at T ¼ 250 K (Teixeira
, near the coils and at a 1-m distance from the generator.

Fig. 6. Time representations of electrical potential measured in water of tanks with and without hydraulic continuity and in water of control tanks.
Fig. 7. Frequency representations of electrical potential measured in water of tanks with and without hydraulic continuity and in water of control tanks.
M. G�erard et al. / Water Research 83 (2015) 184e194192
et al., 1985). As the proton is charged its movement should generatea time-dependent current that would generate an electromagneticfield with a frequency of approximately 1012 Hz.
It is assumed that due to the incoherent nature of Brownianmotion this internal electromagnetic field of liquid water cannot bemaintained at a macroscopic scale; this internal electromagneticfield is quickly dampened through destructive interferences over afew H-bonds by the continuous motion of water molecules. Ac-cording to Quantum Field Theory (QFT) a molecule could be excitedby virtual photons emitted from the vacuum; this process isignored in the first quantization representation. It should be notedthat if virtual particles associated with a vacuum fluctuation ofenergy DE cannot be physically detected because they are createdand destroyed during a time Dt such that DE$Dt < ħ; but they canhave measurable effects such as Lamb's shift in the electronic
ground state of atoms and Casimir's effect between two metallicplates. Existence of line fields around electrical charges and mag-nets from the non-zero vacuum impedance (R z 377 U) may alsoproduce measurable effects.
In QFT excitation of electrons in molecules could be mediated byvirtual photons borrowed from the vacuum, resulting in transientelectric currents able to generate transient electromagnetic fields.Consequently, physical properties of liquid water in QFT would becontrolled by the entire electronic excitation spectrum of watermolecules and not solely by its frontier orbitals energy gap HOMO-LUMO observed in the first quantization. Depending on the totalnumber of molecules N found in a volume V, i.e., depending onmatter density N/V, one should observe either phase incoherencebetween matter fields and virtual electromagnetic fields leading toa gaseous phase, or phase coherence implying condensation in the

M. G�erard et al. / Water Research 83 (2015) 184e194 193
form of a liquid or a solid. In QFT a liquid is thus viewed as acollection of coherence domains (CD) having a coherence lengthcontrolled by the wavelength of the excited level responsible forthe phase locking between matter and macroscopic electromag-netic fields that cannot escape from the CD (Preparata, 2002). Basedon a known electronic excitation spectrum of the watermolecule ofup to 200 eV, it has been shown that emergence of coherence inliquid water was possible through an excited energy level corre-sponding to a 5 d orbital of the oxygen atom located 12.07 eV abovethe electronic ground state, creating local electronic currentsoscillating with a frequency of fr z 4$1013 Hz (or 1330 cm�1, cor-responding to IR radiations) (Bono et al., 2012; Preparata, 2002). Aselectrons spend approximately 10% of their time in a diffuse 5 dstate localized on oxygen atoms coherent water molecules wouldhave a slightly larger radius (1.5 Å) than incoherent ones (1.1 Å) andare no longer spherical, having two electronic protuberances on theoxygen atom defining a tetrahedron with the two covalent OeHbonds.
The advantage of introducing QFT principles is that the tetra-hedral structure of liquid water is thus fittingly explained from firstprinciples. Moreover using this coherent second quantization rep-resentation, it was possible to show that at T z 300 K, liquid watershould be viewed as a close packing of CD having a radiusRCD ¼ 28.5 nm separated by an incoherent liquid of higher densityhaving a thickness 2d ¼ 18 nm, corresponding to a coherent/inco-herent ratio of 40/60 (Arani et al., 1995). In addition, because theionization potential of the water molecule is IP ¼ 12.6 eV, it followsthat the energy gap for full ionization is only:DE ¼ 12.6 � 12.07 ¼ 0.53 eV when the electron spends 10% of itstime in an energy level located 12.07 eV above the ground. This isassociated with a distance Dr z 0.5 Å for jumping over anotherwater molecule, with a quantum tunneling probability p of 0.91(Arani et al., 1995). This would mean that approximately 0.10electrons per water molecule could be in a highly delocalized stateand would produce supercurrents owing to their well-definedphase patterns. The large separation of 2d z 18 nm between thesuper-conducting CD obviously prevents liquid water from being agood macroscopic conductor at T ¼ 300 K. However, these freelymoving electrons would behave as a charged fluid performing rigidrotations with an angular momentum controlled by the moment ofinertia of each CD. This would result in a magnetic momentm ¼ (e$L/2me) for each CD, which is a QFT explanation of thesensitivity of liquid water to infrared (CD creation) and radio (self-ionization within CD) electromagnetic fields. In fact, loss of coher-ence in liquid water (only 40% coherence at room temperature)comes from thermal agitation and any decrease in temperature(100% coherence at T ¼ 250 K) or adsorption on any interface in-creases water coherence. Accordingly, it may be shown that a 70%(weight) of water (or 99 mol%) in a living cell translates to amaximum of 4 layers of water molecules around each biopolymer.Similarly, biofilms are known to be gelified structures made ofextracellular polymers having an average molecular weight of180 kDa (Ras et al., 2011) with a density of approximately1300 kg m�3 (Melo, 2005), and holding approximately 80%(weight) of water. Modeling these polymers of volume V¼ 230 nm3
as rods of radius R and length L, results in L ¼ 73 nm for R ¼ 1 nm.Adding N water layers having a 0.3-nm thickness results in a hy-drated volume Vn ¼ 229 (1 þ 0.3 N)2 nm3 (i.e., to a water weightpercentage of %H2O ¼ 100(Vn � V)/[230$1.3 þ (Vn � V)]). For N ¼ 5water layers, Vn ¼ 1433 nm3, i.e., %H2O z 79%. This shows thatextracellular water structured by linear polymers as in biofilmsshould have the same coherence as intracellular water structuredby globular polymers. Consequently, 100% coherence for biologicalinterfacial water at T ¼ 310 K can be assumed, for either extracel-lular (biofilms) or intracellular (cells), with full sensitivity to IR or
RF waves at a QFT level of modeling (microscopic scale).At macroscopic to mesoscopic scales the permittivity, perme-
ability, refractive index and impedance are used to model theresponse of materials to applied fields through an averaging pro-cedure that works very well when the wavelength is much largerthan the size of molecules (Baker-Jarvis and Sung, 2012) and thequasi-static nature of RF-EMF (Habash Riadh, 2006). Assuming anelectrical conductivity (s) of cellular fluid of 0.5 S m�1 (Roth, 2000),the magnetic diffusivity (h) defined as (mo.s)�1 is equal to 2.22108 m�2 s�1, with mo, vacuum permeability (4p 10�7 H/m). Themagnetic field (B) associatedwith a changing potential difference of20 mV is approximately 12.5 nT (¼U/h), corresponding to aninduced electric current of 9 mA (¼B/mo). Dividing by q (1.60310�19 C), this electromagnetic strength corresponds to the move-ment of 6.2 � 1016 charges or 1.02 10�7 M of Hþ (divided by Avo-gadro's Number). Next, it is possible to consider the disturbancesinduced in the biological mechanisms of charge transfer or dielec-tric responses of biologicalmaterials in biofilm exposed to VLF-EMF.
4. Conclusions
Experimental results demonstrate that in water exposed to VLFelectromagnetic waves, the formation of biofilm is limited if hy-draulic continuity is established between the electromagneticgenerator and the biofilm media. The amount of the biofilmbiomass measured is approximately two times lower than thecontrol. To optimize the efficiency of this electromagnetic devicewith VLF at low intensity further studies are currently being con-ducted to determine the viability of the exposed attached andunattached bacteria (European project, Eurostars “Application ofelectromagnetic field to biofilm prevention in water distributionsystems”). A more complete and complex model should be devel-oped to better quantify the influence of the VLF-EMF on the for-mation of biofilm exposed.
This process is highly energy-efficient, and physical applicationsrelating to biological phenomena can be numerous. It might berelevant to combine the electromagnetic treatment with an anti-microbial agent to enhance the effects in case of water treatmentapplication.
Many questions remain to explain the observed effect and tounderstand relationships with the presence of a modulated elec-tromagnetic field in water exposed to VLF electromagnetic waves.Experiments with different frequencies and intensity of VLF wavescould also be interesting to investigate in the future to understandtheir influence.
The application of QFT provides an explanation for the genera-tion of this field in the presence of water. The biofilm is a gelified-type structure containing bound water on its interface with liquidwater, making it sensitive to VLF electromagnetic waves. Applica-tion of QFT could be used in a future approach to understand theaction of waves of VLF on living structures and especially onmetabolic mechanisms involving electron transfer and protons butalso those involving “hydrophobic interaction,” including adhesionmechanisms. Experiments with bioelectrochemical systems (withelectroactive biofilms) are currently being used in our laboratory toinvestigate the role of VLF-EMF in charge transfers in biofilms.
Acknowledgments
This work has benefited from financial support of the Rhone-Alpes Region (France).
References
Arani, R., Bono, I., del Giudice, E., Preparata, G., 1995. QED coherence and the

M. G�erard et al. / Water Research 83 (2015) 184e194194
thermodynamics of water. Int. J. Mod. Phys. B 9, 1813e1841.Baker-Jarvis, J., Sung, K., 2012. The interaction of radio-frequency fields with
dielectric materials at macroscopic to mesoscopic scales. J. Res. Natl. Inst. Stand.Technol. 117. http://dx.doi.org/10.6028/jres.117.001.
Blank, M., Soo, L., 2001. Electromagnetic acceleration of electron transfer reactions.J. Cell. Biochem. 81, 278e283.
Blenkinsopp, S.A., Khoury, A.E., Costerton, W., 1992. Electrical enhancement ofbiocide efficacy against pseudomonas aeruginosa biofilms. Appl. Env. Microbiol.58, 3770e3773.
Bono, E., Del Giudice, L., Gamberale, L., Henry, M., 2012. Emergence of the coherentstructure of liquid water. Water 4, 510e532.
Cellini, L., Grande, R., Di Campli, E., Di Bartolomeo, S., Di Giulio, M., Robuffo, I.,Trubiani, O., Mariggi�o, M.A., 2008. Bacterial response to the exposure of 50 Hzelectromagnetic fields. Bioelectromagnetics 29, 302e311.
Chua, L.Y., Yeo, S.H., 2005. Surface bio-magnetism on bacterial cells adhesion andsurface proteins secretion. Coll. Surf. B. Biointer. 40, 45e49.
Costerton, J.W., Ellis, B., Lam, K., Johnson, F., Khoury, A.E., 1994. Mechanism ofelectrical enhancement of efficacy of antibiotics in killing biofilm bacteria.Antimicrob. Agents Chemother. 38, 2803e2810.
Costerton, J.W., Stewart, P.S., Greenberg, E.P., 1999. Bacterial biofilms: a commoncause of persistent infections. Science 284, 1318e1327.
Del Guidice, E., Spinetti, P.R., Tedeschi, A., 2010. Water dynamics at the root ofmetamorphosis in living organisms. Water 2, 566e586.
Del Re, B., Bersani, F., Agostini, C., Mesirea, P., Giogi, G., 2004. Various effects ontransposition activity and survival of Escherichia Coli cells due to different ELF-MF signals. Radiat. Environ. Biophys. 43, 167e193.
Di Campli, E., Di Bartolomeo, S., Grande, R., Di Giulo, M., Cellini, L., 2010. Effects ofextremely low-frequency electromagnetic fields on Helicobacter pylori biofilm.Curr. Microbiol. 60, 412e418.
Durand, E., 1968. Tome Magn�etostatique, Edition MASSON. France, Paris.European Communities (EC), 22 December 2000. Directive 2000/60/EC of the Eu-
ropean Parliament and of the Council of the 23 October 2000 establishing aframework for community action in the field of water policy. Off. J. Eur. Com-mun. Off. J. L 327, 22/12/2000 P. 0001-0073. http://eur-lex.europa.eu/LexUriServ/LexUriServ.do?uri¼OJ: L:2000:327:0001:0072:.
Flemming, H.C., Wingender, J., 2010. The biofilm matrix. Nat. Rev. Microbiol. 8,623e633.
Habash Riadh, W.Y., 2006. Biological effects of electromagnetic fields. In:Bansal, Rajeev (Ed.), Engineering Electromagnetics Applications. CRC Taylor andFrancis, Boca Raton, FL, pp. 189e210.
Jefferson, K.K., 2004. What drives bacteria to produce a biofilm. Fems Microbiol.Lett. 236, 163e173.
Lazarova, V., Manem, J., 1995. Biofilm characterization and activity analysis in waterand wastewater treatment. Water Res. 29, 2225e2247.
Marchettini, N., Del Giudice, E., Voeikov, V., Tiezzi, E., 2010. Water: a mediumwheredissipative structures are produced by a coherent dynamics. J. Theor. Biol. 265,511e516.
Melo, L.F., 2005. Biofilm physical structure, internal diffusivity and tortuosity. WaterSci. Technol. 52, 77e84.
Merlin, G., Cottin, N., 2012. Lab-scale performance evaluation of vertical flow reedbeds for the treatment of chlorobenzene contaminated groundwater. J. Environ.Prot. 3, 847e855.
Mueller, R.F., 1996. Bacterial transport and colonization in low nutrient environ-ments. Water Res. 30, 2681e2690.
O'Toole, G., Kaplan, H.B., Kolter, R., 2000. Biofilm formation as microbial develop-ment. Annu. Rev. Microbiol. 54, 49e79.
Olsen, B.J., Markwell, J., 2007. Assays for the determination of protein concentration.Curr. Protoc. Protein Sci. 4e17.
Pav�e, A., 2012. Chapter 3 Growth Models e Population Dynamics and Genetics, inModeling Living Systems: from Cell to Ecosystem. John Wiley & Sons, Inc,Hoboken, NJ, USA.
Pickering, S.A.W., Bayston, R., Scammell, B.E., 2003. Electromagnetic augmentationof antibiotic efficacy in infection of orthopaedic implants. Bone Jt. Surg. 85B,588e593.
Preparata, G., 2002. An Introduction to Realistic Quantum Physics. World Scientific,New Jersey.
Ras, M., Lefebvre, D., Derlon, N., Paul, E., Girbal-Neuhauser, E., 2011. Extracellularpolymeric substances diversity of biofilms grown under contrasted environ-mental conditions. Water Res. 45, 1529e1538.
Roth, B.J., 2000. In: Bronzino, Joseph D. (Ed.), The Electrical Conductivity of Tissues.The Biomedical Engineering Handbook, second ed. CRC Press LLC, , Boca Raton.
Shahryari, A., Pakshir, M., 2008. Influence of a modulated electromagnetic field onfouling in a double-pipe heat exchanger. J. Mater. Process Technol. 203,389e395.
Teixeira, J., Bellissent-Funel, M.C., Chen, S.H., Dianoux, A.J., 1985. Experimentaldetermination of the nature of diffusive motions of water molecules at lowtemperatures. Phys. Rev. A 31, 1913e1917.
Trueba, A., Garcia, S., Otero, F.M., 2014. Mitigation of biofouling using electromag-netic fields in tubular heat exchangers-condensers cooled by seawater.Biofouling 30, 95e103.
Tsuneda, S., Aikawa, H., Hayashi, H., Yuasa, A., Hirata, A., 2003. Extracellular poly-meric substances responsible for bacterial adhesion onto solid surface. FEMSMicrobiol. Lett. 223, 287e292.
Zhou, S.A., Uesaka, M., 2006. Bioelectrodynamics in living organisms. Int. J. Eng. Sci.44, 67e92.
Zwietering, M.H., Jongerburger, I., Rombouts, F.M., Van’t Riet, K., 1990. Modeling ofthe bacterial growth curve. Appl. Env. Microbiol. 56, 1875e1881.


