Embed Size (px)
Citation preview
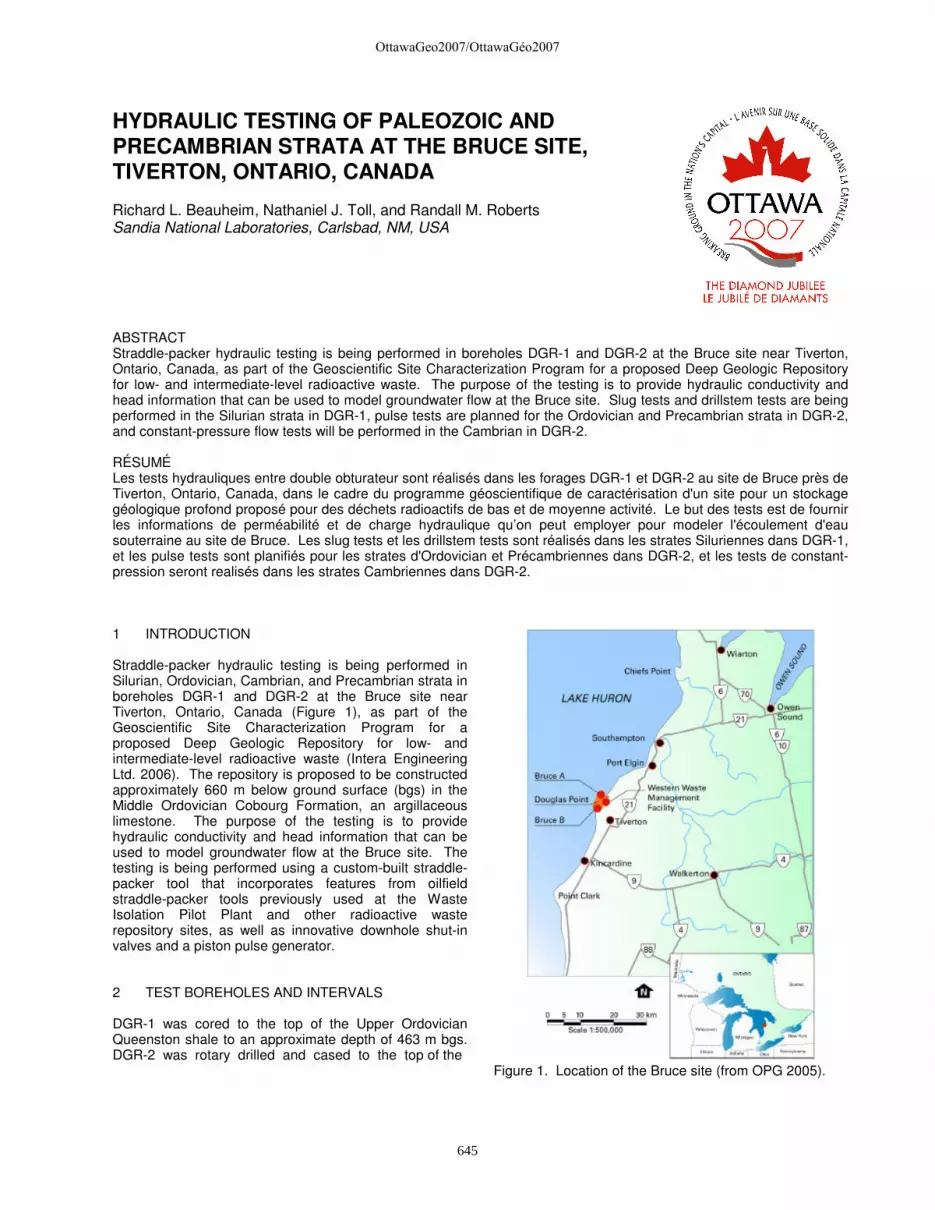
HYDRAULIC TESTING OF PALEOZOIC AND PRECAMBRIAN STRATA AT THE BRUCE SITE, TIVERTON, ONTARIO, CANADA Richard L. Beauheim, Nathaniel J. Toll, and Randall M. Roberts Sandia National Laboratories, Carlsbad, NM, USA ABSTRACT Straddle-packer hydraulic testing is being performed in boreholes DGR-1 and DGR-2 at the Bruce site near Tiverton, Ontario, Canada, as part of the Geoscientific Site Characterization Program for a proposed Deep Geologic Repository for low- and intermediate-level radioactive waste. The purpose of the testing is to provide hydraulic conductivity and head information that can be used to model groundwater flow at the Bruce site. Slug tests and drillstem tests are being performed in the Silurian strata in DGR-1, pulse tests are planned for the Ordovician and Precambrian strata in DGR-2, and constant-pressure flow tests will be performed in the Cambrian in DGR-2. RÉSUMÉ Les tests hydrauliques entre double obturateur sont réalisés dans les forages DGR-1 et DGR-2 au site de Bruce près de Tiverton, Ontario, Canada, dans le cadre du programme géoscientifique de caractérisation d'un site pour un stockage géologique profond proposé pour des déchets radioactifs de bas et de moyenne activité. Le but des tests est de fournir les informations de perméabilité et de charge hydraulique qu’on peut employer pour modeler l'écoulement d'eau souterraine au site de Bruce. Les slug tests et les drillstem tests sont réalisés dans les strates Siluriennes dans DGR-1, et les pulse tests sont planifiés pour les strates d'Ordovician et Précambriennes dans DGR-2, et les tests de constant-pression seront realisés dans les strates Cambriennes dans DGR-2. 1 INTRODUCTION Straddle-packer hydraulic testing is being performed in Silurian, Ordovician, Cambrian, and Precambrian strata in boreholes DGR-1 and DGR-2 at the Bruce site near Tiverton, Ontario, Canada (Figure 1), as part of the Geoscientific Site Characterization Program for a proposed Deep Geologic Repository for low- and intermediate-level radioactive waste (Intera Engineering Ltd. 2006). The repository is proposed to be constructed approximately 660 m below ground surface (bgs) in the Middle Ordovician Cobourg Formation, an argillaceous limestone. The purpose of the testing is to provide hydraulic conductivity and head information that can be used to model groundwater flow at the Bruce site. The testing is being performed using a custom-built straddle-packer tool that incorporates features from oilfield straddle-packer tools previously used at the Waste Isolation Pilot Plant and other radioactive waste repository sites, as well as innovative downhole shut-in valves and a piston pulse generator. 2 TEST BOREHOLES AND INTERVALS DGR-1 was cored to the top of the Upper Ordovician Queenston shale to an approximate depth of 463 m bgs. DGR-2 was rotary drilled and cased to the top of the
Figure 1. Location of the Bruce site (from OPG 2005).
OttawaGeo2007/OttawaGéo2007
645
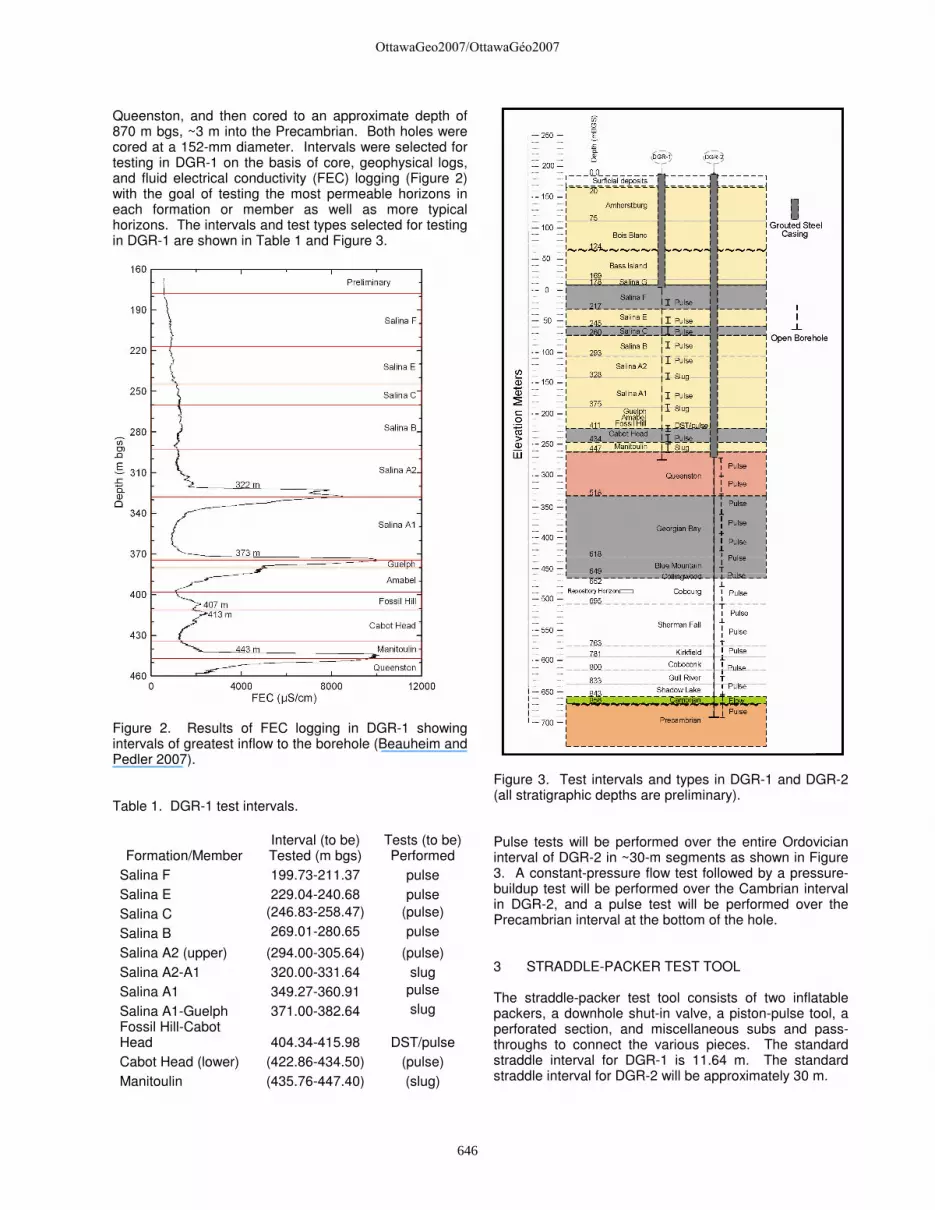
Queenston, and then cored to an approximate depth of 870 m bgs, ~3 m into the Precambrian. Both holes were cored at a 152-mm diameter. Intervals were selected for testing in DGR-1 on the basis of core, geophysical logs, and fluid electrical conductivity (FEC) logging (Figure 2) with the goal of testing the most permeable horizons in each formation or member as well as more typical horizons. The intervals and test types selected for testing in DGR-1 are shown in Table 1 and Figure 3.
Figure 2. Results of FEC logging in DGR-1 showing intervals of greatest inflow to the borehole (Beauheim and Pedler 2007). Table 1. DGR-1 test intervals.
Formation/Member Interval (to be) Tested (m bgs)
Tests (to be) Performed
Salina F 199.73-211.37 pulse Salina E 229.04-240.68 pulse Salina C (246.83-258.47) (pulse)
Salina B 269.01-280.65 pulse
Salina A2 (upper) (294.00-305.64) (pulse) Salina A2-A1 320.00-331.64 slug Salina A1 349.27-360.91 pulse
Salina A1-Guelph 371.00-382.64 slug Fossil Hill-Cabot Head 404.34-415.98 DST/pulse Cabot Head (lower) (422.86-434.50) (pulse) Manitoulin (435.76-447.40) (slug)
Figure 3. Test intervals and types in DGR-1 and DGR-2 (all stratigraphic depths are preliminary). Pulse tests will be performed over the entire Ordovician interval of DGR-2 in ~30-m segments as shown in Figure 3. A constant-pressure flow test followed by a pressure-buildup test will be performed over the Cambrian interval in DGR-2, and a pulse test will be performed over the Precambrian interval at the bottom of the hole. 3 STRADDLE-PACKER TEST TOOL The straddle-packer test tool consists of two inflatable packers, a downhole shut-in valve, a piston-pulse tool, a perforated section, and miscellaneous subs and pass-throughs to connect the various pieces. The standard straddle interval for DGR-1 is 11.64 m. The standard straddle interval for DGR-2 will be approximately 30 m.
OttawaGeo2007/OttawaGéo2007
646
3.1 Packers TAM International external-inflate sliding-end packers are used in the straddle tool. The packers have an un-inflated diameter of 10.8 cm and an element length of 1.83 m, providing a seal length of approximately 1.68 m in a 152-mm-diameter hole. They are capable of withstanding differential pressures of up to 20.7 MPa. The packers are filled with water and are inflated in unison through a single 6.35-mm stainless steel line to between 3.5 and 7.0 MPa above the hydrostatic pressure at the depth of the tool. The packers are oriented so that their fixed ends are up and their sliding ends are down to avoid putting their inflation lines in tension. 3.2 Shut-In Tools A downhole shut-in tool is used to control the connection between the interior of the tubing string above the straddle tool and the test zone between the inflatable packers. The downhole shut-in tool uses a piston-actuated ball valve with a 1.27-cm-diameter opening to open and close the tool. The valve is set up in a normally open position and hydraulic pressure is applied to push an annular piston down, rotating the ball 90° and closing the valve. A spring pushes the piston up, opening the valve, when the hydraulic pressure is relieved. 3.3 Piston Pulse Generators For pulse-testing applications, a pressure pulse is created by displacing a known volume of the test zone using a hydraulically actuated piston. Two versions of the pulse generator are available with displacements of approximately 97 and 163 cm3. In a typical 11.64-m straddle interval, these displacements cause pressure pulses between approximately 500 and 1500 kPa, depending on the compressibility of the materials in the straddled interval. 3.4 Perforated Section One section of the tool string between the straddle packers must allow flow from the straddled test zone into the tool string. A perforated 1.22-m-long pup joint of 2.375-inch tubing is used for this purpose. The pup joint has a total of 36 6.35-mm perforations arranged in four lines down the length of the joint. 4 DATA ACQUISITION 4.1 Data-Acquisition System The Sixnet data-acquisition system (DAS) used for the straddle-packer hydraulic testing was developed by Sandia National Laboratories (SNL) for use at the Waste Isolation Pilot Plant (WIPP). The DAS is contained in SNL’s Mobile Integrated Aquifer Testing and Analysis (MIATA) trailer which is being used for the testing at the Bruce site. The DAS human-machine interface (HMI) software displays the status of all parameters including the shut-in valve state, zone pressures, packer pressures,
polling frequency, test start time, and test duration. The HMI also provides real-time plotting of any parameter being measured. 4.2 Pressure Transducers Paroscientific Series 8CB High Pressure Intelligent Depth Sensors are being used to monitor pressures in all zones isolated during hydraulic tests. These transducers have a 0-1400 metres of water range of operation, which corresponds to approximately 0-14000 kPa. They have an accuracy of 0.01% of full scale (approximately 1.4 kPa). The transducers are housed in sensor carriers positioned above the top packer in the tool string. One transducer is ported to the interval below the bottom straddle packer (P1), one transducer is ported to the test zone between the packers (P2), one transducer is ported to the tubing above the shut-in valve (P3), and the fourth transducer is ported to the annulus between the tubing and borehole wall above the upper packer (P4). These pressure transducers are monitored with the DAS. The conversion from a frequency response at the gauge sensor to an engineering unit is done within the gauge. Packer pressure is monitored with a separate pressure transducer to verify that the packers have inflated and are maintaining their pressures. Barometric pressure is monitored at 15-minute intervals during all activities with an independent barometer on the test site. 4.3 Temperature Loggers The Paroscientific transducers described in Section 4.2 also measure temperature, which can be monitored and recorded by the DAS. However, these transducers are positioned above the upper packer and do not, therefore, measure the actual temperature in the test zone or below the bottom packer. HOBO U12 Stainless Temperature Loggers are placed in the test zone and below the bottom packer to monitor temperatures in those intervals. The HOBO loggers are not connected to the DAS, but store all data internally and are downloaded whenever the test tool is brought to the surface. 5 TESTING PROCEDURES The type of test performed in each interval in DGR-1 was dynamically tailored to the hydraulic conductivity of the interval in real time. Slug testing (Cooper et al. 1967; Ramey et al. 1975) was performed in the Silurian strata in DGR-1 with hydraulic conductivities greater than ~10-8 m/s, drillstem tests (DSTs) (Ramey et al. 1975) were performed in the strata with hydraulic conductivities between ~10-10 and 10-8 m/s, and pulse tests (Bredehoeft and Papadopulos 1980; Neuzil 1982) were performed in the strata with lower hydraulic conductivities. Pulse tests will be performed in the Ordovician and Precambrian strata in DGR-2 and a constant-pressure flow test followed by a pressure-buildup test will be performed in the Cambrian strata, which exhibit flowing artesian conditions.
OttawaGeo2007/OttawaGéo2007
647
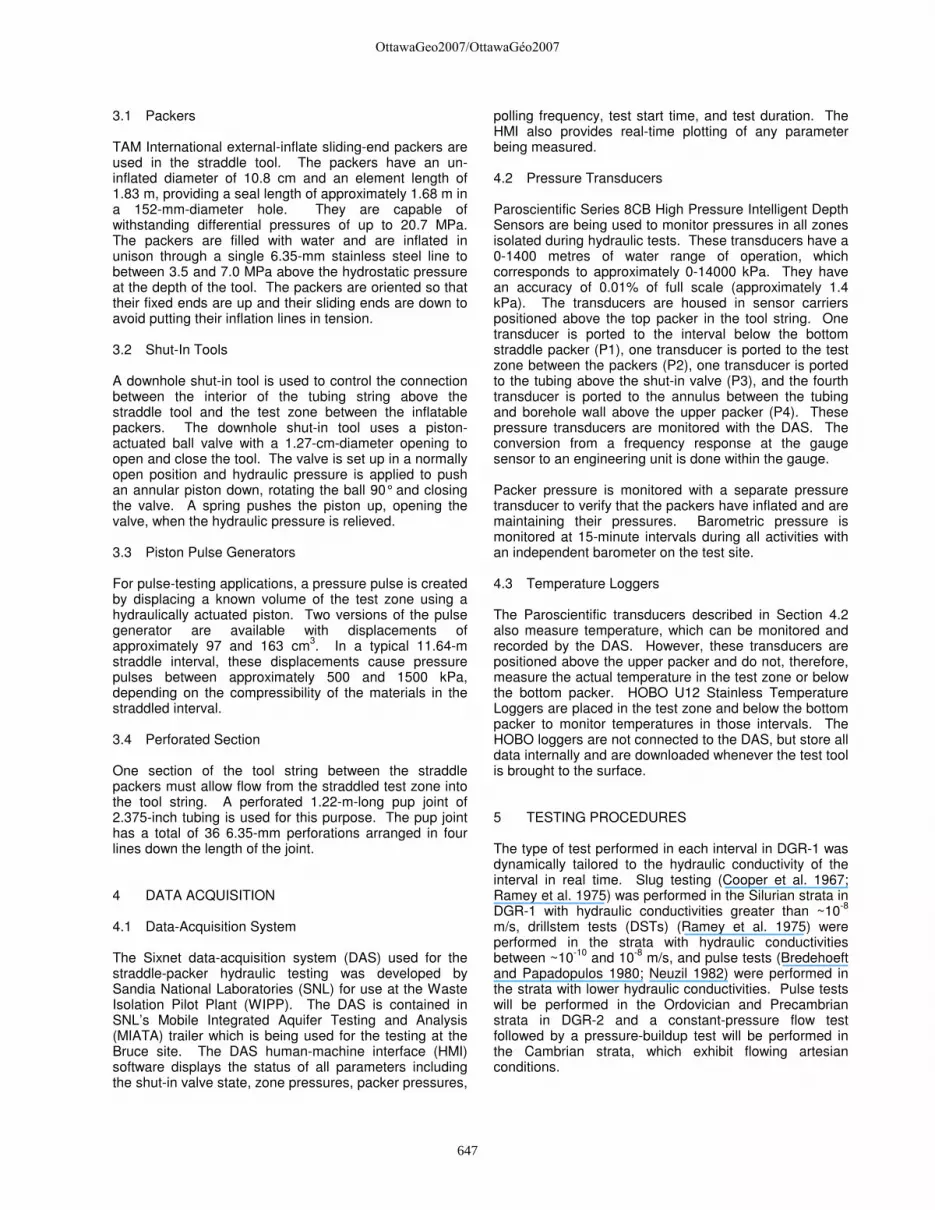
To test an interval, the straddle-packer tool is lowered to the desired depth, all transducers are connected to the DAS, and data acquisition is initiated. The shut-in valve is maintained in an open position while the packers are inflated. The packers are inflated to a pressure between 3.5 and 7.0 MPa above the hydrostatic pressure at the depth of the tool. After the packers have been inflated, the shut-in valve is closed. If closing the shut-in valve causes some volume displacement in the test zone, the test-zone pressure (P2) may increase instantaneously (Figure 4). The test-zone pressure (P2) then typically begins to change relative to the annulus pressure (P4, which might change slowly if some portion of the hole above the tool is producing or accepting water), and the tubing pressure (P3, which should be constant when the shut-in valve is closed) as the test-zone pressure equilibrates with the pressure of the interval to be tested. The bottomhole pressure (P1) typically shows a pressure increase during packer inflation, and then either increases or decreases depending on the natural formation pressure of the bottomhole zone. The test-zone (and possibly bottomhole) pressure(s) may also change (typically rise and then fall) in response to thermal equilibration between the materials (fluid, metal, rubber) in the hole and the surrounding rock mass, as shown in Figure 4.
Figure 4. Example of pre-test pressure trends (A1 Member of Salina Formation in borehole DGR-1). If a slug test or DST is anticipated, enough water is swabbed from the tubing to leave the tubing pressure (P3) ~700 kPa lower than the estimated test-zone pressure. The system is then allowed to stabilize (ideally overnight). Following the pre-test equilibration period, testing is initiated by either opening the shut-in valve for a slug test or DST or extending the pulse piston for a pulse-injection test. If a slug test or DST is being performed, the test leader evaluates the pressure data from the test zone in real time to determine if the test should be continued as a slug test or converted to a DST. Subject to the discretion of the test leader, the following guidelines are used to determine if a slug test will be converted to a DST:
• If 30% of the initial slug has dissipated after 1 hr,
the test remains a slug test.
• If 30% of the initial slug has not dissipated after 1 hr, the shut-in valve is closed and the test is converted to a DST. The time during which the shut-in valve was open constitutes the DST flow period and the time after shut-in constitutes the DST buildup period.
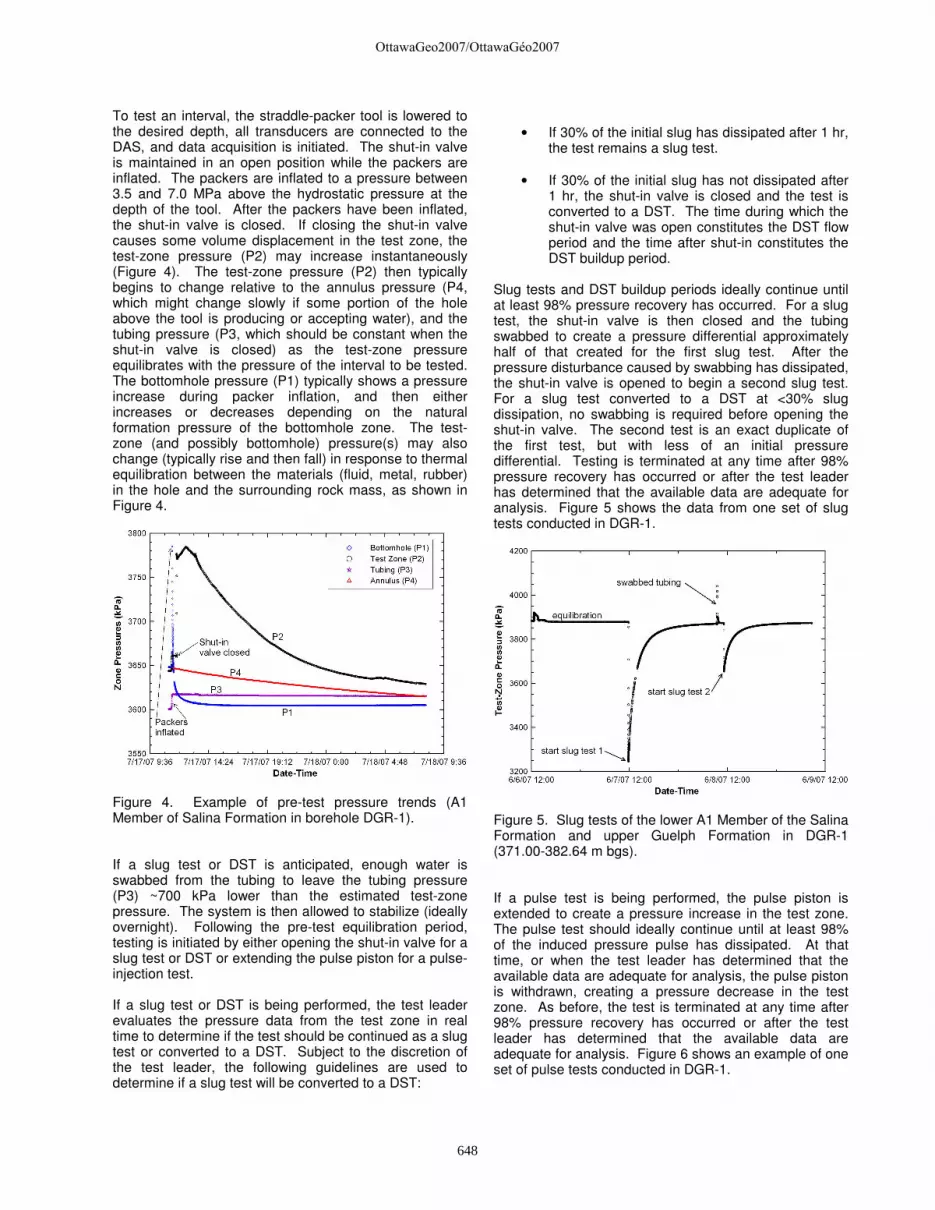
Slug tests and DST buildup periods ideally continue until at least 98% pressure recovery has occurred. For a slug test, the shut-in valve is then closed and the tubing swabbed to create a pressure differential approximately half of that created for the first slug test. After the pressure disturbance caused by swabbing has dissipated, the shut-in valve is opened to begin a second slug test. For a slug test converted to a DST at <30% slug dissipation, no swabbing is required before opening the shut-in valve. The second test is an exact duplicate of the first test, but with less of an initial pressure differential. Testing is terminated at any time after 98% pressure recovery has occurred or after the test leader has determined that the available data are adequate for analysis. Figure 5 shows the data from one set of slug tests conducted in DGR-1.
Figure 5. Slug tests of the lower A1 Member of the Salina Formation and upper Guelph Formation in DGR-1 (371.00-382.64 m bgs). If a pulse test is being performed, the pulse piston is extended to create a pressure increase in the test zone. The pulse test should ideally continue until at least 98% of the induced pressure pulse has dissipated. At that time, or when the test leader has determined that the available data are adequate for analysis, the pulse piston is withdrawn, creating a pressure decrease in the test zone. As before, the test is terminated at any time after 98% pressure recovery has occurred or after the test leader has determined that the available data are adequate for analysis. Figure 6 shows an example of one set of pulse tests conducted in DGR-1.
OttawaGeo2007/OttawaGéo2007
648

Figure 6. Pulse tests of the B Member of the Salina Formation in DGR-1 (269.01-280.65 m bgs). The formations to be tested in DGR-2, with the exception of the Cambrian sandstone, are expected to have hydraulic conductivities less than 1 x 10-11 m/s (Golder Associates Ltd. 2003). Consequently, only pulse tests are likely to be performed in the Ordovician and Precambrian strata. Flowing artesian conditions were encountered when DGR-2 penetrated the Cambrian sandstones. Accordingly, a constant-pressure flow test followed by a pressure-buildup test will be performed across the Cambrian strata. 6 TEST ANALYSIS The test data are being analyzed using the nSIGHTS (n-dimensional Statistical Inverse Graphical Hydraulic Test Simulator) code, which is capable of including pressure transients caused by pre-test activities in test analysis and provides an estimation of uncertainty for each inferred parameter. nSIGHTS was developed for use on hydraulic tests performed at the Waste Isolation Pilot Plant (WIPP), the United States Department of Energy (DOE) deep geologic repository for transuranic and mixed wastes. It has also been used in the Canadian, French, Swedish, Swiss, Japanese, and Taiwanese radioactive waste disposal programs. nSIGHTS can simulate any kind or combination of well test(s) in a single-phase system, confined or unconfined, bounded or infinite, single- or double-porosity, in fully or partially penetrating wells. Non-test events or periods can be included in the simulation by specifying pressures and/or rates. Temperature-induced changes in pressure are included by specifying the temperature measured in the borehole at each time step. nSIGHTS is unique among well-test-analysis codes in its ability to allow for any dimensionality of flow without being limited to integer dimensions (i.e., linear, radial, spherical). It performs Jacobian analyses of parameter sensitivities and calculates correlation matrices for all parameters. In
addition, it includes a full suite of visualization tools to display the many factors it can calculate. Unlike well-test codes that perform a single optimization to fit the data and provide single values of hydraulic parameters, nSIGHTS can perform perturbation analyses to differentiate between global and local minima and provide estimates of parameter uncertainty. In this mode, the optimization starts from as many different sets of parameter estimates as desired (typically 500 to 1000) and searches for a minimum. The sum of squared errors (SSE) is then calculated for each minimum to define the global minimum. The perturbation results can then be used to calculate 95% confidence intervals for all of the estimated parameters. 7 TEST RESULTS The pulse-test intervals in the A1, B, E, and F Members of the Salina Formation have average hydraulic conductivities ranging from only 2 x 10-12 to 4 x 10-12 m/s (Table 2). The nSIGHTS analysis of the data from the B Member is typical of this group. Figure 7 shows the SSE values for 436 hydraulic conductivity estimates from nSIGHTS fits to the pulse-test data from the B Member. Figure 8 shows a comparison of the 178 simulations with the lowest SSE values to the observed data. Figure 9 shows the hydraulic conductivity and static formation pressure estimates associated with these 178 fits. Hydraulic conductivity estimates fall in a narrow range from approximately 2.3 to 2.5 x 10⁻¹² m/s, while static formation pressure estimates range from only 2698 to 2701 kPa (uncorrected for gauge elevation). Figure 10 shows the fits to the pulse-injection test plotted in the standard “Ramey B” log-log format (Ramey et al. 1975). Table 2. Preliminary estimates of average hydraulic conductivity (K) from testing in DGR-1.
Strata Interval (m bgs) K (m/s)
Salina F 199.73-211.37 4E-12 Salina E 229.04-240.68 4E-12 Salina B 269.01-280.65 2E-12
Salina A2-A1 320.00-331.64 2E-7 Salina A1 349.27-360.91 2E-12
Salina A1-Guelph 371.00-382.64 1E-8
Fossil Hill-Cabot Head 404.34-415.98 2E-11 Slug tests were performed of the lower A2 and upper A1 Members of the Salina Formation and of the lower A1 Member and Guelph Formation because of the pronounced inflow signatures obtained for these intervals from FEC logging (Figure 2). Examination of core from these intervals revealed visible primary and/or secondary porosity lacking in the core from the pulse-tested intervals. The slug tests indicated much higher hydraulic conductivities than the pulse tests of the other Salina members (Table 2).
OttawaGeo2007/OttawaGéo2007
649

Figure 7. SSE versus hydraulic conductivity for 436 nSIGHTS simulations of pulse tests of the B Member of the Salina Formation (269.01-280.65 m bgs) in DGR-1.
Figure 8. Best (lowest SSE) 178 nSIGHTS simulations of pulse tests of the B Member of the Salina Formation (269.01-280.65 m bgs) in DGR-1.
Figure 9. Estimates of hydraulic conductivity and static formation pressure from the 178 best nSIGHTS simulations of pulse tests of the B Member of the Salina Formation (269.01-280.65 m bgs) in DGR-1.
Figure 10. Ramey B plot of 178 nSIGHTS simulations of pulse tests of the B Member of the Salina Formation (269.01-280.65 m bgs) in DGR-1. The nSIGHTS analysis of the data from the A1 Member and the Guelph Formation is typical of the slug-test group. Figure 11 shows the SSE values for 494 hydraulic conductivity estimates from nSIGHTS fits to the slug-test data from the A1 Member and Guelph Formation, with a clearly defined minimum. Figure 12 shows a comparison of the 380 simulations with the lowest SSE values to the observed data. Figure 13 shows the hydraulic conductivity and static formation pressure estimates associated with these 380 fits. Hydraulic conductivity estimates fall in a narrow range from approximately 1.34 to 1.45 x 10⁻⁸ m/s, while static formation pressure estimates range from only 3882.25 to 3883.50 kPa (uncorrected for gauge elevation). Figure 14 shows the fits to the first slug test plotted in “Ramey B” log-log format. Because of the narrow ranges of parameter variation, the fits are virtually indistinguishable.
Figure 11. SSE versus hydraulic conductivity for 494 nSIGHTS simulations of slug tests of the lower A1 Member of the Salina Formation and Guelph Formation (371.00-382.64 m bgs) in DGR-1.
OttawaGeo2007/OttawaGéo2007
650

Figure 12. 380 nSIGHTS simulations of slug tests of the lower A1 Member of the Salina Formation and Guelph Formation (371.00-382.64 m bgs) in DGR-1.
Figure 13. Estimates of hydraulic conductivity and static formation pressure from the 380 best nSIGHTS simulations of slug tests of the lower A1 Member of the Salina Formation and Guelph Formation (371.00-382.64 m bgs) in DGR-1.
Figure 14. Ramey B plot of 380 nSIGHTS simulations of slug test 1 of the lower A1 Member of the Salina Formation and Guelph Formation (371.00-382.64 m bgs) in DGR-1.
8 SUMMARY AND CONCLUSIONS Straddle-packer hydraulic testing is being performed in boreholes DGR-1 and DGR-2 at the Bruce site near Tiverton, Ontario, Canada, as part of the Geoscientific Site Characterization Program for a proposed Deep Geologic Repository for low- and intermediate-level radioactive waste. The purpose of the testing is to provide hydraulic conductivity and head information that can be used to model groundwater flow at the Bruce site. The type of test performed in each interval is dynamically tailored to the hydraulic conductivity of the interval in real time. Slug testing was performed in the Silurian strata in DGR-1 with average hydraulic conductivities greater than ~10-8 m/s, drillstem tests (DSTs) were performed in the strata with hydraulic conductivities between 10-10 and 10-8 m/s, and pulse tests were performed in the strata with hydraulic conductivities <10-10 m/s. Pulse tests will be performed in the Ordovician and Precambrian strata in DGR-2, and a constant-pressure flow test followed by a pressure-buildup test will be performed in the Cambrian sandstone in DGR-2 which exhibits flowing artesian conditions. The testing is being performed using a custom-built straddle-packer tool that incorporates features from oilfield straddle-packer tools previously used at the Waste Isolation Pilot Plant and other radioactive waste repository sites, as well as innovative downhole shut-in valves and a piston pulse generator. The standard straddle interval for DGR-1 is approximately 11.6 m, while a straddle interval of approximately 30 m is planned for DGR-2. Intervals were selected for testing in DGR-1 on the basis of core, geophysical logs, and fluid electrical conductivity logging with the goal of testing the most permeable horizons in each formation or member as well as more typical horizons. The test data are being analyzed using the nSIGHTS code, which is capable of including pressure and temperature transients caused by pre-test activities in test analysis and provides an estimation of uncertainty for each inferred parameter. The pulse tests of the A1, B, E, and F Members of the Salina Formation in DGR-1 showed average hydraulic conductivities ranging from only 2 x 10-12 to 4 x 10-12 m/s, while the three intervals tested to date showing clear signatures in FEC logging have average hydraulic conductivities ranging from 2 x 10-11 to 2 x 10⁻⁷ m/s. The hydraulic testing in DGR-1 is scheduled to be completed in August 2007. Testing in DGR-2 will be performed between August and September 2007. ACKNOWLEDGEMENTS Sandia is a multiprogram laboratory operated by Sandia Corporation, a Lockheed Martin Company, for the United States Department of Energy’s National Nuclear Security Administration under Contract DE-AC04-AL85000. This work was performed on behalf of Ontario Power Generation under a subcontract with Intera Engineering Ltd.
OttawaGeo2007/OttawaGéo2007
651

REFERENCES Beauheim, R.L. and Pedler, W.H. 2007. Fluid electrical
conductivity logging in borehole DGR-1 at the Bruce site, Tiverton, Ontario, Canada, 60
th Canadian
Geotechnical Conference & 8th
Joint CGS/IAH-CNC Groundwater Conference, Ottawa, Ontario, Canada, this volume.
Bredehoeft, J.D. and Papadopulos, S.S. 1980. A method for determining the hydraulic properties of tight formations, Water Resources Research, 16(1): 233-238.
Cooper, H.H., Jr., Bredehoeft, J.D. and Papadopulos, I.S. 1967. Response of a finite-diameter well to an instantaneous charge of water, Water Resources Research, 3(1): 263-269.
Golder Associates Ltd. 2003. LLW geotechnical feasibility study, Western Waste Management Facility, Bruce Site, Tiverton, Ontario. Report to Municipality of Kincardine and Ontario Power Generation.
Intera Engineering Ltd. 2006. Geoscientific site characterization plan, OPG’s deep geologic repository for low & intermediate level waste, Report INTERA 05-220-1, OPG 00216-REP-03902-00002-R00, Ottawa, Canada.
Neuzil, C.E. 1982. On conducting the modified ‘slug’ test in tight formations, Water Resources Research, 18(2): 439-41.
OPG (Ontario Power Generation). 2005. Deep geologic repository for low and intermediate level radioactive wastes, project description. Report 00216-REP-07722.07-00001, Toronto, Canada.
Ramey, H.J., Jr., Agarwal, R.G. and Martin, I. 1975. Analysis of ‘slug test’ or DST flow period data, Journal of Canadian Petroleum Technology, 14(3): 37-47.
OttawaGeo2007/OttawaGéo2007
652