Embed Size (px)
Citation preview
ORIGINAL ARTICLE
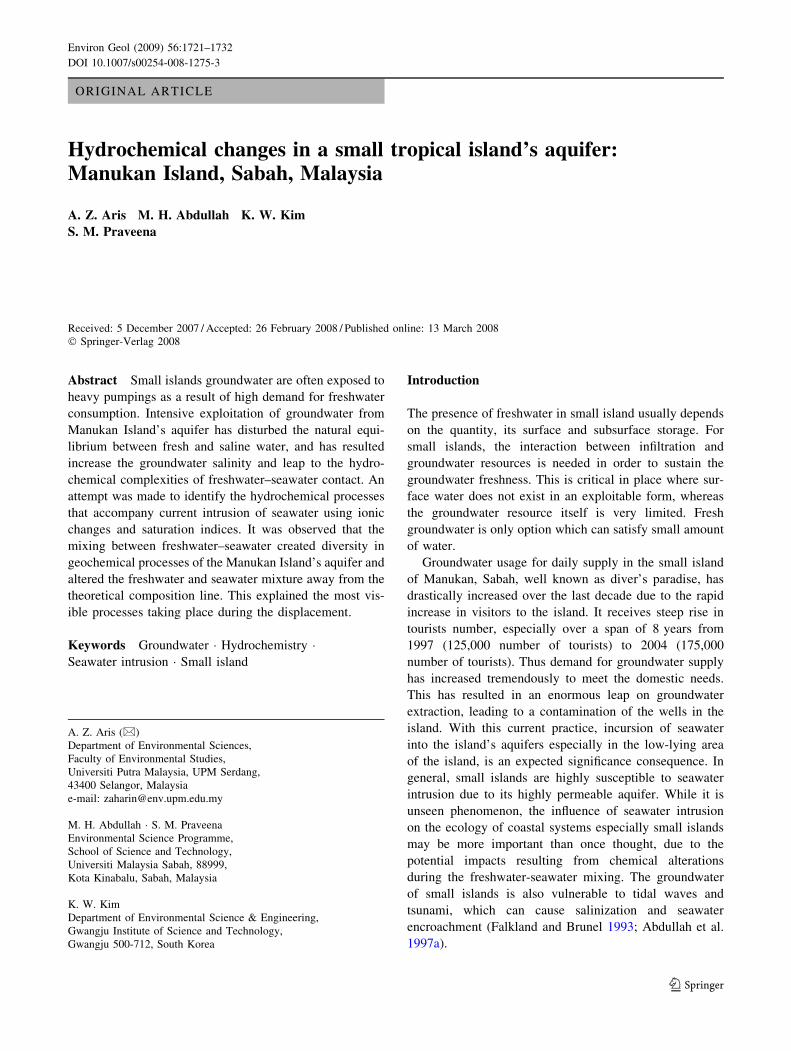
Hydrochemical changes in a small tropical island’s aquifer:Manukan Island, Sabah, Malaysia
A. Z. Aris Æ M. H. Abdullah Æ K. W. Kim ÆS. M. Praveena
Received: 5 December 2007 / Accepted: 26 February 2008 / Published online: 13 March 2008
� Springer-Verlag 2008
Abstract Small islands groundwater are often exposed to
heavy pumpings as a result of high demand for freshwater
consumption. Intensive exploitation of groundwater from
Manukan Island’s aquifer has disturbed the natural equi-
librium between fresh and saline water, and has resulted
increase the groundwater salinity and leap to the hydro-
chemical complexities of freshwater–seawater contact. An
attempt was made to identify the hydrochemical processes
that accompany current intrusion of seawater using ionic
changes and saturation indices. It was observed that the
mixing between freshwater–seawater created diversity in
geochemical processes of the Manukan Island’s aquifer and
altered the freshwater and seawater mixture away from the
theoretical composition line. This explained the most vis-
ible processes taking place during the displacement.
Keywords Groundwater � Hydrochemistry �Seawater intrusion � Small island
Introduction
The presence of freshwater in small island usually depends
on the quantity, its surface and subsurface storage. For
small islands, the interaction between infiltration and
groundwater resources is needed in order to sustain the
groundwater freshness. This is critical in place where sur-
face water does not exist in an exploitable form, whereas
the groundwater resource itself is very limited. Fresh
groundwater is only option which can satisfy small amount
of water.
Groundwater usage for daily supply in the small island
of Manukan, Sabah, well known as diver’s paradise, has
drastically increased over the last decade due to the rapid
increase in visitors to the island. It receives steep rise in
tourists number, especially over a span of 8 years from
1997 (125,000 number of tourists) to 2004 (175,000
number of tourists). Thus demand for groundwater supply
has increased tremendously to meet the domestic needs.
This has resulted in an enormous leap on groundwater
extraction, leading to a contamination of the wells in the
island. With this current practice, incursion of seawater
into the island’s aquifers especially in the low-lying area
of the island, is an expected significance consequence. In
general, small islands are highly susceptible to seawater
intrusion due to its highly permeable aquifer. While it is
unseen phenomenon, the influence of seawater intrusion
on the ecology of coastal systems especially small islands
may be more important than once thought, due to the
potential impacts resulting from chemical alterations
during the freshwater-seawater mixing. The groundwater
of small islands is also vulnerable to tidal waves and
tsunami, which can cause salinization and seawater
encroachment (Falkland and Brunel 1993; Abdullah et al.
1997a).
A. Z. Aris (&)
Department of Environmental Sciences,
Faculty of Environmental Studies,
Universiti Putra Malaysia, UPM Serdang,
43400 Selangor, Malaysia
e-mail: [email protected]
M. H. Abdullah � S. M. Praveena
Environmental Science Programme,
School of Science and Technology,
Universiti Malaysia Sabah, 88999,
Kota Kinabalu, Sabah, Malaysia
K. W. Kim
Department of Environmental Science & Engineering,
Gwangju Institute of Science and Technology,
Gwangju 500-712, South Korea
123
Environ Geol (2009) 56:1721–1732
DOI 10.1007/s00254-008-1275-3
Any environmental hazard such as water quality dec-
lination cannot be avoided or controlled altogether, but
can be mitigated by taking appropriate measures like
proper water use planning, management and development.
Many of the previous studies on small islands have
focused on groundwater flow in the subsurface system,
but did not indicate the fate of its geochemical processes.
These include studies done by Abdullah et al. (1997b),
Singh and Gupta (1999) and Babu et al. (2002). Some of
the recent related studies pertaining to groundwater
chemistry in small islands have been encountered in lit-
eratures by Cruz and Amaral (2004) and Xie et al. (2005).
Despite these examples, relatively little is known about
seawater intrusion and hydrochemistry status of fresh
groundwater affected with saline water in small tropical
islands. Hence, an attempt is made to characterize the
sources of salinity and mechanisms of their mobility into
the groundwaters in the investigated area. The study
focused on the determination of the principal determinant
of groundwater salinization due to seawater intrusion
by taking into consideration the hydrochemical processes
that modify the theoretical freshwater–seawater mixture.
Increased knowledge of geochemical processes that con-
trol groundwater chemical composition in tropic region
especially in small islands environment could lead to
improved understanding of hydrochemical systems in such
an area. Such an effort contributes to effective manage-
ment and utilization of the groundwater resource by
clarifying relations among the associated parameters.
Therefore, to protect island ecological balance, the
mixing mechanisms of saline water and fresh groundwater
attributed by seawater intrusion needs to be identified and
investigated so that the states of the reserves are not
compromised.
Geography and climate
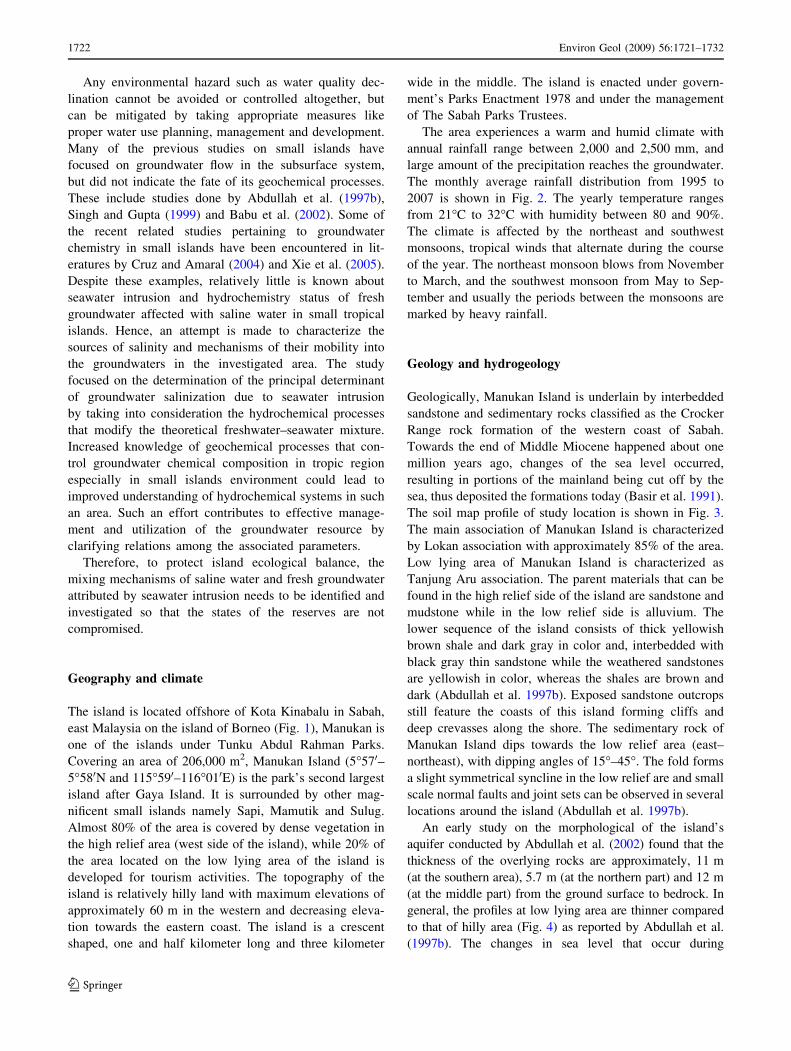
The island is located offshore of Kota Kinabalu in Sabah,
east Malaysia on the island of Borneo (Fig. 1), Manukan is
one of the islands under Tunku Abdul Rahman Parks.
Covering an area of 206,000 m2, Manukan Island (5�570–5�580N and 115�590–116�010E) is the park’s second largest
island after Gaya Island. It is surrounded by other mag-
nificent small islands namely Sapi, Mamutik and Sulug.
Almost 80% of the area is covered by dense vegetation in
the high relief area (west side of the island), while 20% of
the area located on the low lying area of the island is
developed for tourism activities. The topography of the
island is relatively hilly land with maximum elevations of
approximately 60 m in the western and decreasing eleva-
tion towards the eastern coast. The island is a crescent
shaped, one and half kilometer long and three kilometer
wide in the middle. The island is enacted under govern-
ment’s Parks Enactment 1978 and under the management
of The Sabah Parks Trustees.
The area experiences a warm and humid climate with
annual rainfall range between 2,000 and 2,500 mm, and
large amount of the precipitation reaches the groundwater.
The monthly average rainfall distribution from 1995 to
2007 is shown in Fig. 2. The yearly temperature ranges
from 21�C to 32�C with humidity between 80 and 90%.
The climate is affected by the northeast and southwest
monsoons, tropical winds that alternate during the course
of the year. The northeast monsoon blows from November
to March, and the southwest monsoon from May to Sep-
tember and usually the periods between the monsoons are
marked by heavy rainfall.
Geology and hydrogeology
Geologically, Manukan Island is underlain by interbedded
sandstone and sedimentary rocks classified as the Crocker
Range rock formation of the western coast of Sabah.
Towards the end of Middle Miocene happened about one
million years ago, changes of the sea level occurred,
resulting in portions of the mainland being cut off by the
sea, thus deposited the formations today (Basir et al. 1991).
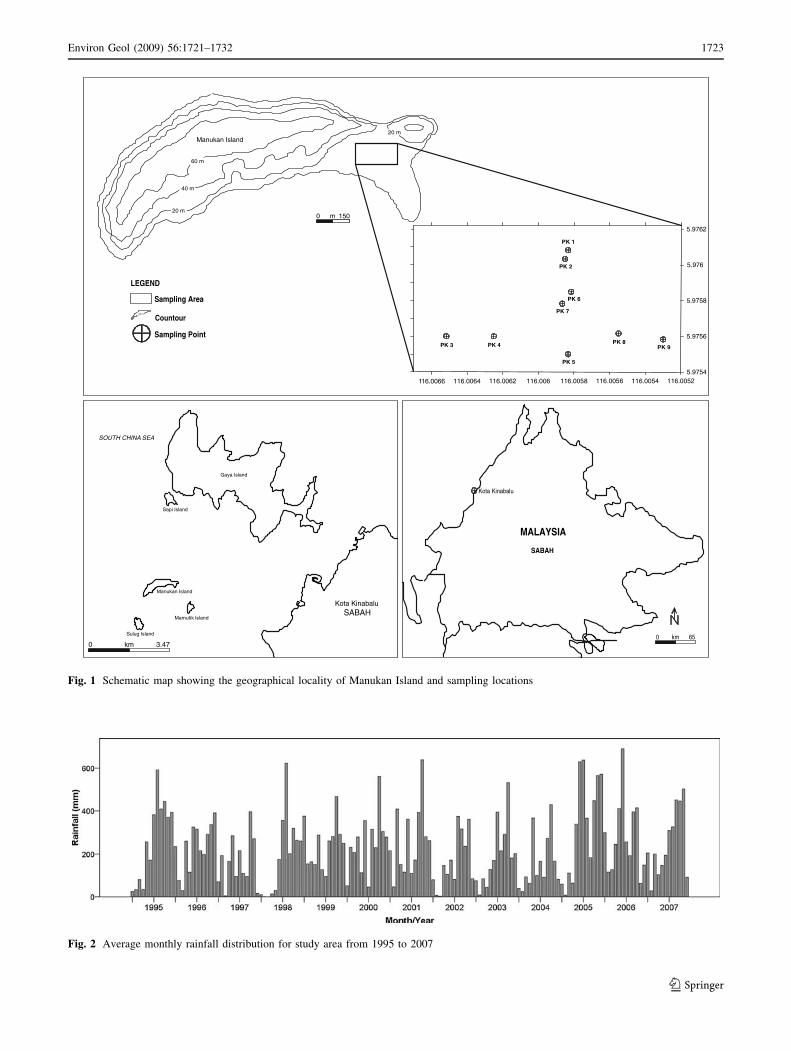
The soil map profile of study location is shown in Fig. 3.
The main association of Manukan Island is characterized
by Lokan association with approximately 85% of the area.
Low lying area of Manukan Island is characterized as
Tanjung Aru association. The parent materials that can be
found in the high relief side of the island are sandstone and
mudstone while in the low relief side is alluvium. The
lower sequence of the island consists of thick yellowish
brown shale and dark gray in color and, interbedded with
black gray thin sandstone while the weathered sandstones
are yellowish in color, whereas the shales are brown and
dark (Abdullah et al. 1997b). Exposed sandstone outcrops
still feature the coasts of this island forming cliffs and
deep crevasses along the shore. The sedimentary rock of
Manukan Island dips towards the low relief area (east–
northeast), with dipping angles of 15�–45�. The fold forms
a slight symmetrical syncline in the low relief are and small
scale normal faults and joint sets can be observed in several
locations around the island (Abdullah et al. 1997b).
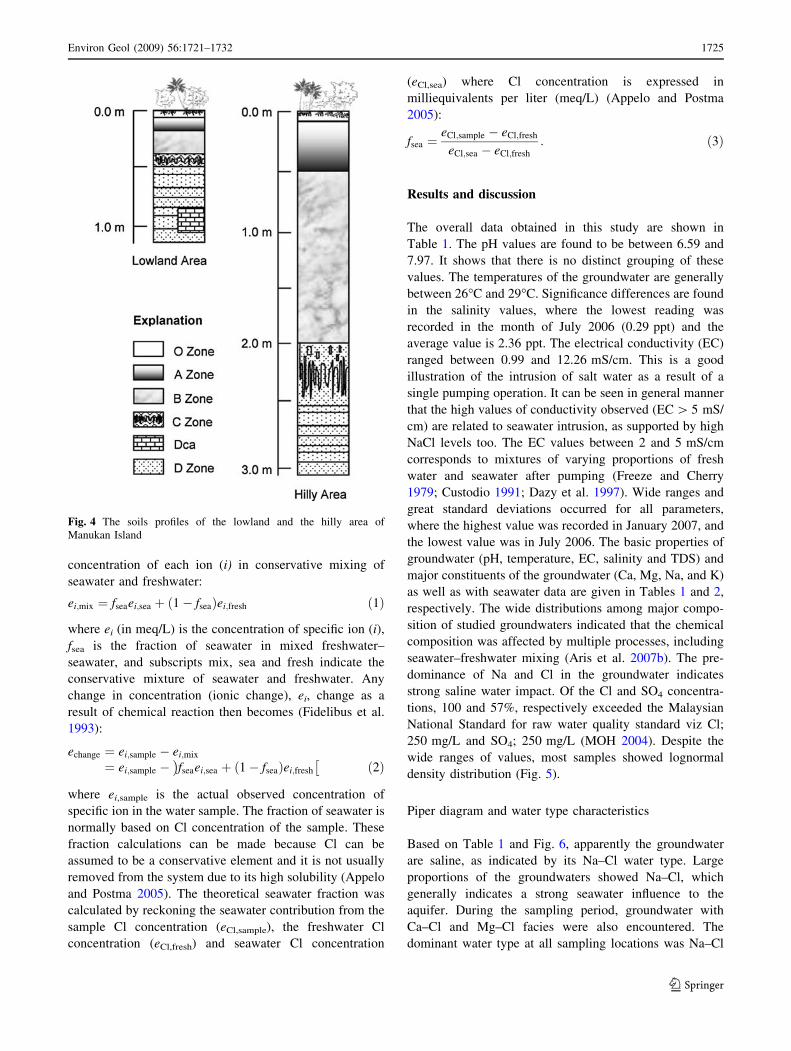
An early study on the morphological of the island’s
aquifer conducted by Abdullah et al. (2002) found that the
thickness of the overlying rocks are approximately, 11 m
(at the southern area), 5.7 m (at the northern part) and 12 m
(at the middle part) from the ground surface to bedrock. In
general, the profiles at low lying area are thinner compared
to that of hilly area (Fig. 4) as reported by Abdullah et al.
(1997b). The changes in sea level that occur during
1722 Environ Geol (2009) 56:1721–1732
123
20 m
40 m
60 m
20 m
m 1500
Manukan Island
3.47
Gaya Island
Sapi Island
Manukan Island
Mamutik Island
Sulug Island
Kota KinabaluSABAH
SOUTH CHINA SEA
0 km
MALAYSIA
SABAH
Kota Kinabalu
0 65km
5.9754
5.9756
5.9758
5.976
5.9762
116.0052116.0054116.0056116.0058116.006116.0062116.006411 6.0066
PK 1
PK 2
PK 9PK 8
PK 5
PK 7
PK PK 4 3
PK 6Sampling Area
60 m
Countour
Sampling Point
LEGEND
Fig. 1 Schematic map showing the geographical locality of Manukan Island and sampling locations
Fig. 2 Average monthly rainfall distribution for study area from 1995 to 2007
Environ Geol (2009) 56:1721–1732 1723
123
Quaternary, caused the formation of limestone terraces in
coastal areas where Manukan Island is formed of carbonate
rocks which originated from coral deposits and overlain by
Quarternary alluvium (Basir et al. 1991). The alluviums are
loose, not cemented and act as sufficient water storage
which entirely depends on its thickness. A study by Ab-
dullah et al. (2002) indicates that the medium of the aquifer
consist of fine to coarse sand mixed with some fine gravel.
On the lowland, the sandstone has about the same thickness,
with shale and carbonate deposits. Small aquifers may occur
in the sandstone alluvium regions that often occur at sites
near the coast. Small areas and low elevations of Manukan
Island lead to very limited water storage (Aris et al. 2007a).
Presently, Manukan Island depends on shallow aquifer
for its groundwater supply. Dug wells are used for
extracting groundwater from its sandy aquifer. The wells
have a diameter of 150 cm and heights between 55 and
78 cm from ground surface level. The groundwater level of
the study area fluctuates between 0.03 and 0.79 m above
mean sea level (a.m.s.l.) (Abdullah 2001).
Sampling and analyses
A total of 162 groundwater samples were obtained from
nine existing wells located on the low lying area of the
island. Samplings were done from March 2006 to January
2007. Polyethylene bottles that soaked with 1:10 HNO3
acid wash and pre rinsed with distilled water were used to
store groundwater samples based on the methods described
in APHA (1995).
The analysis of water samples were carried out to assess
pH, temperature, electrical conductivity (EC), salinity and
total dissolved solids (TDS) and ions, namely sodium (Na),
potassium (K), calcium (Ca), magnesium (Mg), bicarbon-
ates (HCO3), chloride (Cl) and sulphate (SO4). An average
fresh groundwater composition, published by Abdullah
et al. (1996) was used as the threshold value for fresh
groundwater of the study area. That data indicated that the
water was characterized as Ca–HCO3 water type and has
no significant impact of seawater chemistry.
Saturation indices for selected minerals and ionic con-
centration changes were calculated in order to better
understand the hydrochemical processes that take place in
the aquifer during the freshwater–seawater mixing. The
hydrochemical processes during freshwater–seawater dis-
placement can be evaluated based on calculation of the
expected composition based on conservative mixing of
seawater and freshwater, and then comparing the result
with actual compositions found in the studied groundwater
samples (Appelo and Postma 2005). The seawater
contribution was used for calculating the theoretical
Fig. 3 Soil map of Kota Kinabalu and surrounding area
1724 Environ Geol (2009) 56:1721–1732
123
concentration of each ion (i) in conservative mixing of
seawater and freshwater:
ei;mix ¼ fseaei;sea þ 1� fseað Þei;fresh ð1Þ
where ei (in meq/L) is the concentration of specific ion (i),
fsea is the fraction of seawater in mixed freshwater–
seawater, and subscripts mix, sea and fresh indicate the
conservative mixture of seawater and freshwater. Any
change in concentration (ionic change), ei, change as a
result of chemical reaction then becomes (Fidelibus et al.
1993):
echange ¼ ei;sample � ei;mix
¼ ei;sample � fseaei;sea þ 1� fseað Þei;fresh
� �ð2Þ
where ei,sample is the actual observed concentration of
specific ion in the water sample. The fraction of seawater is
normally based on Cl concentration of the sample. These
fraction calculations can be made because Cl can be
assumed to be a conservative element and it is not usually
removed from the system due to its high solubility (Appelo
and Postma 2005). The theoretical seawater fraction was
calculated by reckoning the seawater contribution from the
sample Cl concentration (eCl,sample), the freshwater Cl
concentration (eCl,fresh) and seawater Cl concentration
(eCl,sea) where Cl concentration is expressed in
milliequivalents per liter (meq/L) (Appelo and Postma
2005):
fsea ¼eCl;sample � eCl;fresh
eCl;sea � eCl;fresh
: ð3Þ
Results and discussion
The overall data obtained in this study are shown in
Table 1. The pH values are found to be between 6.59 and
7.97. It shows that there is no distinct grouping of these
values. The temperatures of the groundwater are generally
between 26�C and 29�C. Significance differences are found
in the salinity values, where the lowest reading was
recorded in the month of July 2006 (0.29 ppt) and the
average value is 2.36 ppt. The electrical conductivity (EC)
ranged between 0.99 and 12.26 mS/cm. This is a good
illustration of the intrusion of salt water as a result of a
single pumping operation. It can be seen in general manner
that the high values of conductivity observed (EC [ 5 mS/
cm) are related to seawater intrusion, as supported by high
NaCl levels too. The EC values between 2 and 5 mS/cm
corresponds to mixtures of varying proportions of fresh
water and seawater after pumping (Freeze and Cherry
1979; Custodio 1991; Dazy et al. 1997). Wide ranges and
great standard deviations occurred for all parameters,
where the highest value was recorded in January 2007, and
the lowest value was in July 2006. The basic properties of
groundwater (pH, temperature, EC, salinity and TDS) and
major constituents of the groundwater (Ca, Mg, Na, and K)
as well as with seawater data are given in Tables 1 and 2,
respectively. The wide distributions among major compo-
sition of studied groundwaters indicated that the chemical
composition was affected by multiple processes, including
seawater–freshwater mixing (Aris et al. 2007b). The pre-
dominance of Na and Cl in the groundwater indicates
strong saline water impact. Of the Cl and SO4 concentra-
tions, 100 and 57%, respectively exceeded the Malaysian
National Standard for raw water quality standard viz Cl;
250 mg/L and SO4; 250 mg/L (MOH 2004). Despite the
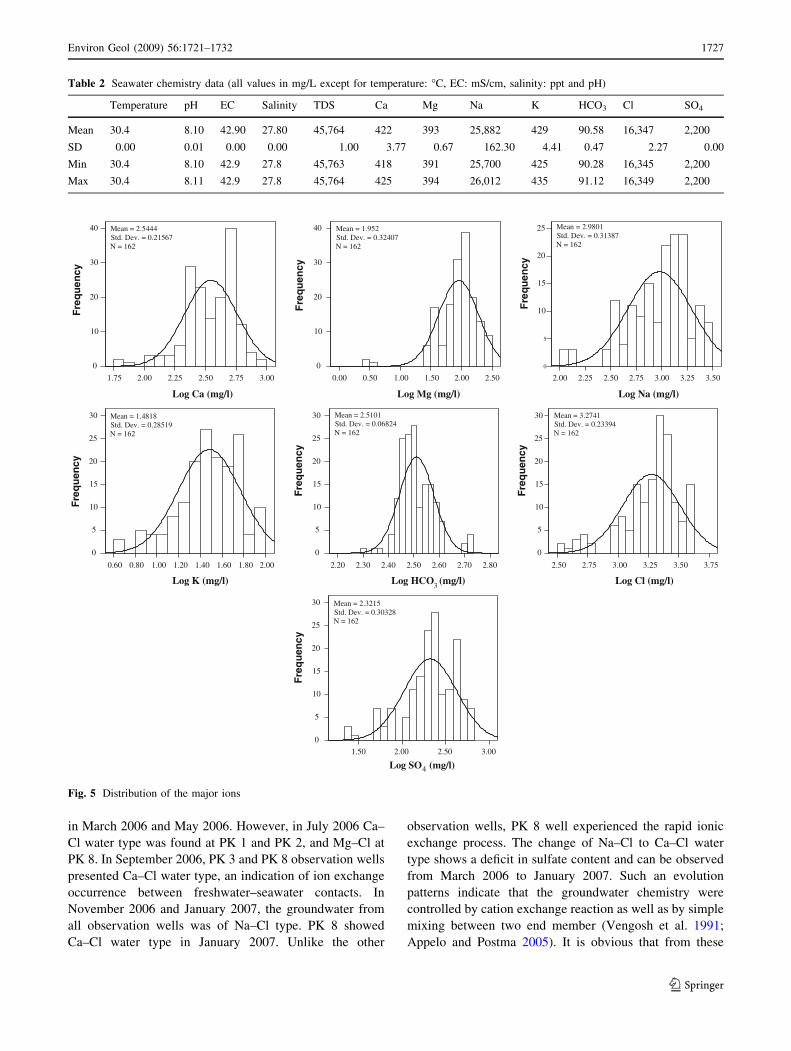
wide ranges of values, most samples showed lognormal
density distribution (Fig. 5).
Piper diagram and water type characteristics
Based on Table 1 and Fig. 6, apparently the groundwater
are saline, as indicated by its Na–Cl water type. Large
proportions of the groundwaters showed Na–Cl, which
generally indicates a strong seawater influence to the
aquifer. During the sampling period, groundwater with
Ca–Cl and Mg–Cl facies were also encountered. The
dominant water type at all sampling locations was Na–Cl
Fig. 4 The soils profiles of the lowland and the hilly area of
Manukan Island
Environ Geol (2009) 56:1721–1732 1725
123
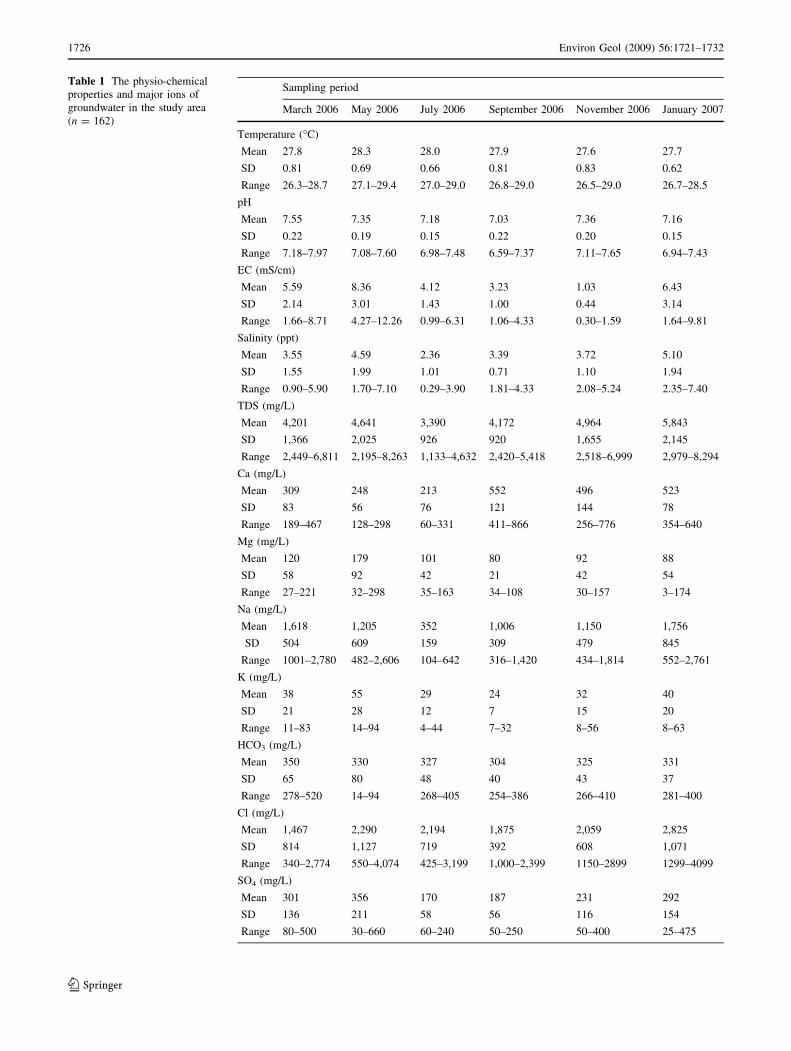
Table 1 The physio-chemical
properties and major ions of
groundwater in the study area
(n = 162)
Sampling period
March 2006 May 2006 July 2006 September 2006 November 2006 January 2007
Temperature (�C)
Mean 27.8 28.3 28.0 27.9 27.6 27.7
SD 0.81 0.69 0.66 0.81 0.83 0.62
Range 26.3–28.7 27.1–29.4 27.0–29.0 26.8–29.0 26.5–29.0 26.7–28.5
pH
Mean 7.55 7.35 7.18 7.03 7.36 7.16
SD 0.22 0.19 0.15 0.22 0.20 0.15
Range 7.18–7.97 7.08–7.60 6.98–7.48 6.59–7.37 7.11–7.65 6.94–7.43
EC (mS/cm)
Mean 5.59 8.36 4.12 3.23 1.03 6.43
SD 2.14 3.01 1.43 1.00 0.44 3.14
Range 1.66–8.71 4.27–12.26 0.99–6.31 1.06–4.33 0.30–1.59 1.64–9.81
Salinity (ppt)
Mean 3.55 4.59 2.36 3.39 3.72 5.10
SD 1.55 1.99 1.01 0.71 1.10 1.94
Range 0.90–5.90 1.70–7.10 0.29–3.90 1.81–4.33 2.08–5.24 2.35–7.40
TDS (mg/L)
Mean 4,201 4,641 3,390 4,172 4,964 5,843
SD 1,366 2,025 926 920 1,655 2,145
Range 2,449–6,811 2,195–8,263 1,133–4,632 2,420–5,418 2,518–6,999 2,979–8,294
Ca (mg/L)
Mean 309 248 213 552 496 523
SD 83 56 76 121 144 78
Range 189–467 128–298 60–331 411–866 256–776 354–640
Mg (mg/L)
Mean 120 179 101 80 92 88
SD 58 92 42 21 42 54
Range 27–221 32–298 35–163 34–108 30–157 3–174
Na (mg/L)
Mean 1,618 1,205 352 1,006 1,150 1,756
SD 504 609 159 309 479 845
Range 1001–2,780 482–2,606 104–642 316–1,420 434–1,814 552–2,761
K (mg/L)
Mean 38 55 29 24 32 40
SD 21 28 12 7 15 20
Range 11–83 14–94 4–44 7–32 8–56 8–63
HCO3 (mg/L)
Mean 350 330 327 304 325 331
SD 65 80 48 40 43 37
Range 278–520 14–94 268–405 254–386 266–410 281–400
Cl (mg/L)
Mean 1,467 2,290 2,194 1,875 2,059 2,825
SD 814 1,127 719 392 608 1,071
Range 340–2,774 550–4,074 425–3,199 1,000–2,399 1150–2899 1299–4099
SO4 (mg/L)
Mean 301 356 170 187 231 292
SD 136 211 58 56 116 154
Range 80–500 30–660 60–240 50–250 50–400 25–475
1726 Environ Geol (2009) 56:1721–1732
123
in March 2006 and May 2006. However, in July 2006 Ca–
Cl water type was found at PK 1 and PK 2, and Mg–Cl at
PK 8. In September 2006, PK 3 and PK 8 observation wells
presented Ca–Cl water type, an indication of ion exchange
occurrence between freshwater–seawater contacts. In
November 2006 and January 2007, the groundwater from
all observation wells was of Na–Cl type. PK 8 showed
Ca–Cl water type in January 2007. Unlike the other
observation wells, PK 8 well experienced the rapid ionic
exchange process. The change of Na–Cl to Ca–Cl water
type shows a deficit in sulfate content and can be observed
from March 2006 to January 2007. Such an evolution
patterns indicate that the groundwater chemistry were
controlled by cation exchange reaction as well as by simple
mixing between two end member (Vengosh et al. 1991;
Appelo and Postma 2005). It is obvious that from these
Table 2 Seawater chemistry data (all values in mg/L except for temperature: �C, EC: mS/cm, salinity: ppt and pH)
Temperature pH EC Salinity TDS Ca Mg Na K HCO3 Cl SO4
Mean 30.4 8.10 42.90 27.80 45,764 422 393 25,882 429 90.58 16,347 2,200
SD 0.00 0.01 0.00 0.00 1.00 3.77 0.67 162.30 4.41 0.47 2.27 0.00
Min 30.4 8.10 42.9 27.8 45,763 418 391 25,700 425 90.28 16,345 2,200
Max 30.4 8.11 42.9 27.8 45,764 425 394 26,012 435 91.12 16,349 2,200
3.002.752.502.252.001.75
Log Ca (mg/l)
40
30
20
10
0
Fre
qu
ency
Mean = 2.5444Std. Dev. = 0.21567N = 162
2.502.001.501.000.500.00
Log Mg (mg/l)
40
30
20
10
0
Fre
qu
ency
Mean = 1.952Std. Dev. = 0.32407N = 162
3.503.253.002.752.502.252.00
Log Na (mg/l)
25
20
15
10
5
0
Fre
qu
ency
Mean = 2.9801Std. Dev. = 0.31387N = 162
2.001.801.601.401.201.000.800.60
Log K (mg/l)
30
25
20
15
10
5
0
Fre
qu
ency
Mean = 1.4818Std. Dev. = 0.28519N = 162
2.802.702.602.502.402.302.20
Log HCO (mg/l)
30
25
20
15
10
5
0
Fre
qu
ency
Mean = 2.5101Std. Dev. = 0.06824N = 162
3
3.753.503.253.002.752.50
Log Cl (mg/l)
30
25
20
15
10
5
0
Fre
qu
ency
Mean = 3.2741Std. Dev. = 0.23394N = 162
3.002.502.001.50
Log SO (mg/l)
30
25
20
15
10
5
0
Fre
qu
ency
Mean = 2.3215Std. Dev. = 0.30328N = 162
4
Fig. 5 Distribution of the major ions
Environ Geol (2009) 56:1721–1732 1727
123
data and comparison with previous record (Abdullah et al.
1996), the island’s aquifer has suffered significant seawater
intrusion.
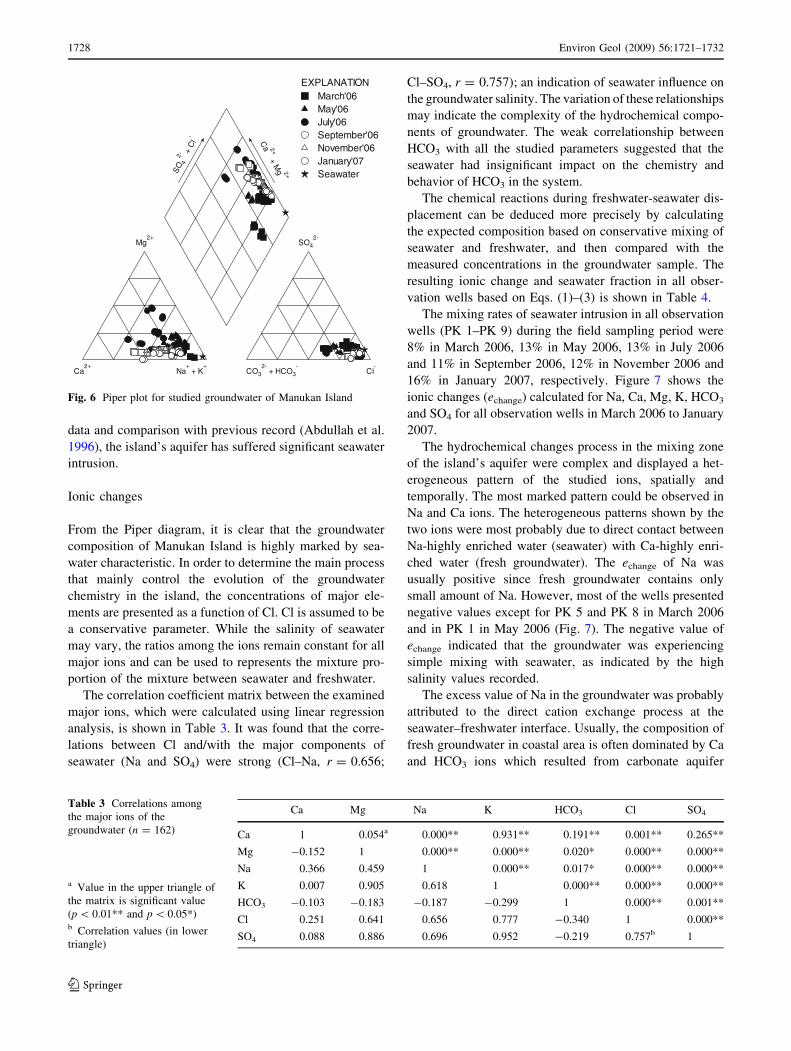
Ionic changes
From the Piper diagram, it is clear that the groundwater
composition of Manukan Island is highly marked by sea-
water characteristic. In order to determine the main process
that mainly control the evolution of the groundwater
chemistry in the island, the concentrations of major ele-
ments are presented as a function of Cl. Cl is assumed to be
a conservative parameter. While the salinity of seawater
may vary, the ratios among the ions remain constant for all
major ions and can be used to represents the mixture pro-
portion of the mixture between seawater and freshwater.
The correlation coefficient matrix between the examined
major ions, which were calculated using linear regression
analysis, is shown in Table 3. It was found that the corre-
lations between Cl and/with the major components of
seawater (Na and SO4) were strong (Cl–Na, r = 0.656;
Cl–SO4, r = 0.757); an indication of seawater influence on
the groundwater salinity. The variation of these relationships
may indicate the complexity of the hydrochemical compo-
nents of groundwater. The weak correlationship between
HCO3 with all the studied parameters suggested that the
seawater had insignificant impact on the chemistry and
behavior of HCO3 in the system.
The chemical reactions during freshwater-seawater dis-
placement can be deduced more precisely by calculating
the expected composition based on conservative mixing of
seawater and freshwater, and then compared with the
measured concentrations in the groundwater sample. The
resulting ionic change and seawater fraction in all obser-
vation wells based on Eqs. (1)–(3) is shown in Table 4.
The mixing rates of seawater intrusion in all observation
wells (PK 1–PK 9) during the field sampling period were
8% in March 2006, 13% in May 2006, 13% in July 2006
and 11% in September 2006, 12% in November 2006 and
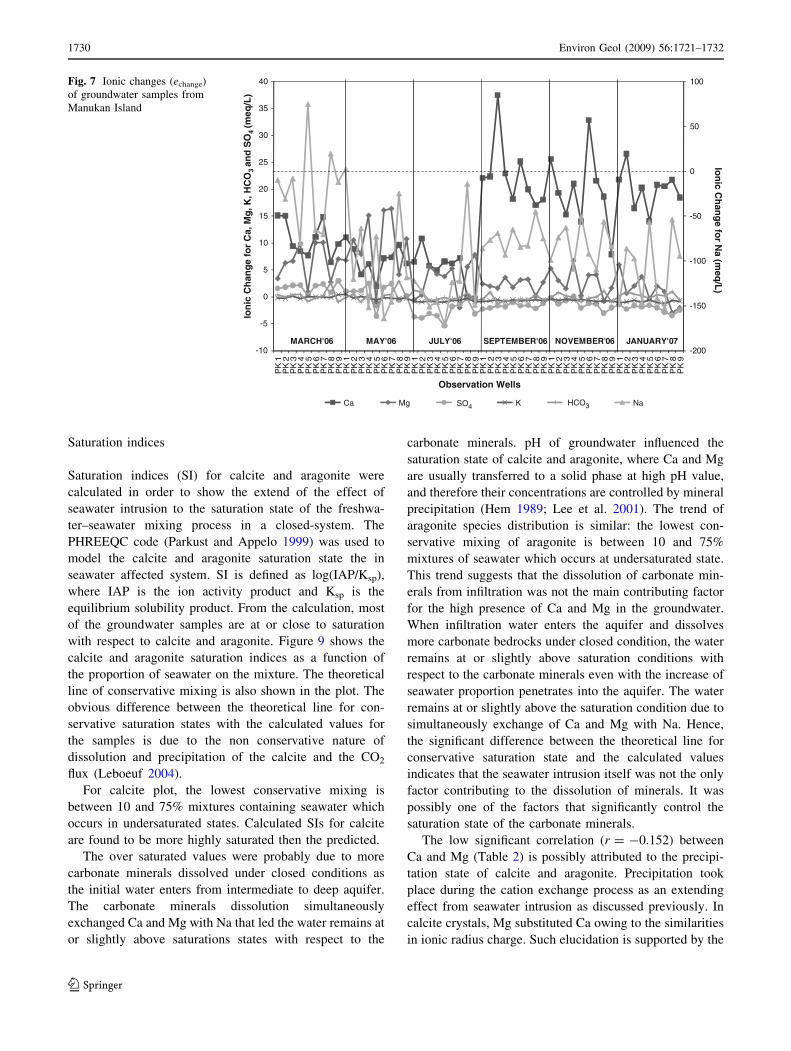
16% in January 2007, respectively. Figure 7 shows the
ionic changes (echange) calculated for Na, Ca, Mg, K, HCO3
and SO4 for all observation wells in March 2006 to January
2007.
The hydrochemical changes process in the mixing zone
of the island’s aquifer were complex and displayed a het-
erogeneous pattern of the studied ions, spatially and
temporally. The most marked pattern could be observed in
Na and Ca ions. The heterogeneous patterns shown by the
two ions were most probably due to direct contact between
Na-highly enriched water (seawater) with Ca-highly enri-
ched water (fresh groundwater). The echange of Na was
usually positive since fresh groundwater contains only
small amount of Na. However, most of the wells presented
negative values except for PK 5 and PK 8 in March 2006
and in PK 1 in May 2006 (Fig. 7). The negative value of
echange indicated that the groundwater was experiencing
simple mixing with seawater, as indicated by the high
salinity values recorded.
The excess value of Na in the groundwater was probably
attributed to the direct cation exchange process at the
seawater–freshwater interface. Usually, the composition of
fresh groundwater in coastal area is often dominated by Ca
and HCO3 ions which resulted from carbonate aquifer
Ca2+
Mg2+
Na+
+ K+
CO32-
+ HCO3-
SO42-
Cl-
SO 4
2-+
Cl
-
Ca 2+
+M
g 2+
EXPLANATIONMarch'06May'06July'06September'06November'06January'07Seawater
Fig. 6 Piper plot for studied groundwater of Manukan Island
Table 3 Correlations among
the major ions of the
groundwater (n = 162)
a Value in the upper triangle of
the matrix is significant value
(p \ 0.01** and p \ 0.05*)b Correlation values (in lower
triangle)
Ca Mg Na K HCO3 Cl SO4
Ca 1 0.054a 0.000** 0.931** 0.191** 0.001** 0.265**
Mg -0.152 1 0.000** 0.000** 0.020* 0.000** 0.000**
Na 0.366 0.459 1 0.000** 0.017* 0.000** 0.000**
K 0.007 0.905 0.618 1 0.000** 0.000** 0.000**
HCO3 -0.103 -0.183 -0.187 -0.299 1 0.000** 0.001**
Cl 0.251 0.641 0.656 0.777 -0.340 1 0.000**
SO4 0.088 0.886 0.696 0.952 -0.219 0.757b 1
1728 Environ Geol (2009) 56:1721–1732
123
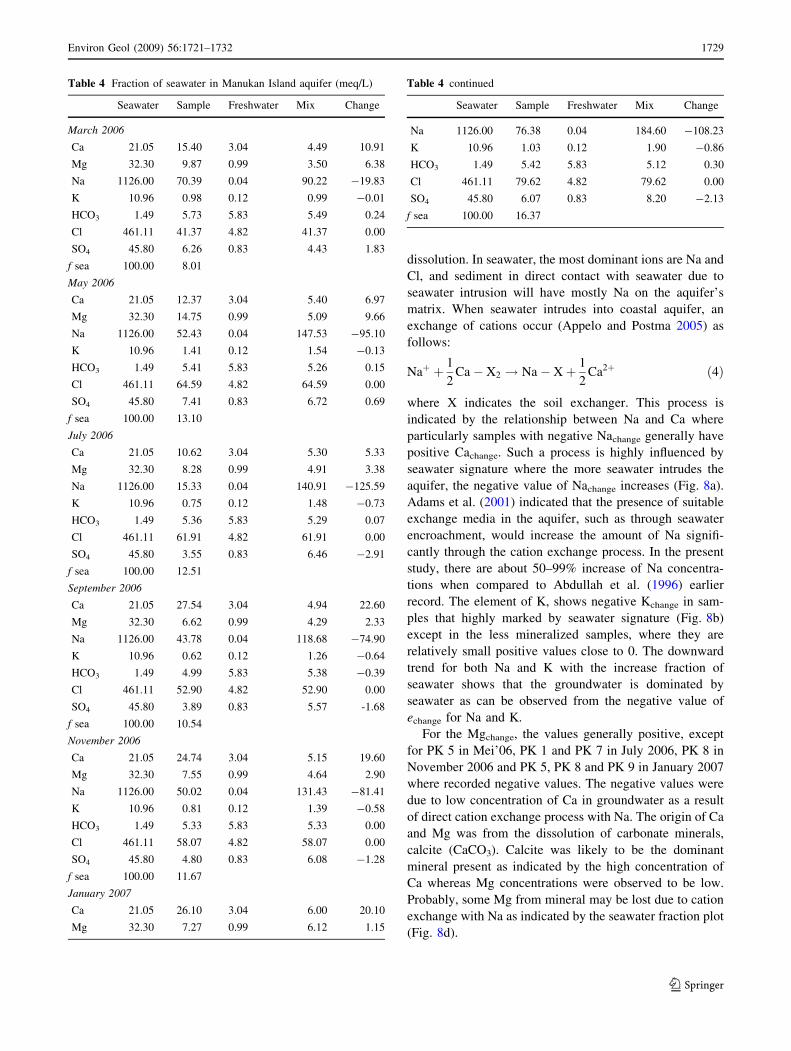
dissolution. In seawater, the most dominant ions are Na and
Cl, and sediment in direct contact with seawater due to
seawater intrusion will have mostly Na on the aquifer’s
matrix. When seawater intrudes into coastal aquifer, an
exchange of cations occur (Appelo and Postma 2005) as
follows:
Naþ þ 1
2Ca� X2 ! Na� Xþ 1
2Ca2þ ð4Þ
where X indicates the soil exchanger. This process is
indicated by the relationship between Na and Ca where
particularly samples with negative Nachange generally have
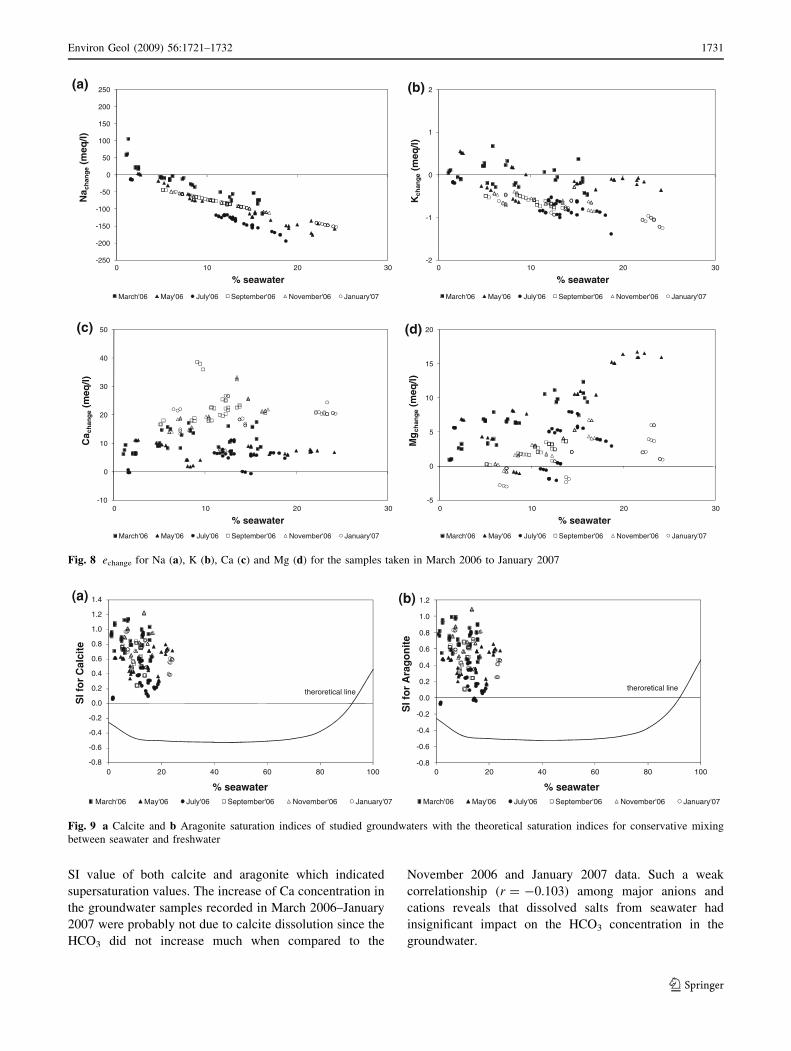
positive Cachange. Such a process is highly influenced by
seawater signature where the more seawater intrudes the
aquifer, the negative value of Nachange increases (Fig. 8a).
Adams et al. (2001) indicated that the presence of suitable
exchange media in the aquifer, such as through seawater
encroachment, would increase the amount of Na signifi-
cantly through the cation exchange process. In the present
study, there are about 50–99% increase of Na concentra-
tions when compared to Abdullah et al. (1996) earlier
record. The element of K, shows negative Kchange in sam-
ples that highly marked by seawater signature (Fig. 8b)
except in the less mineralized samples, where they are
relatively small positive values close to 0. The downward
trend for both Na and K with the increase fraction of
seawater shows that the groundwater is dominated by
seawater as can be observed from the negative value of
echange for Na and K.
For the Mgchange, the values generally positive, except
for PK 5 in Mei’06, PK 1 and PK 7 in July 2006, PK 8 in
November 2006 and PK 5, PK 8 and PK 9 in January 2007
where recorded negative values. The negative values were
due to low concentration of Ca in groundwater as a result
of direct cation exchange process with Na. The origin of Ca
and Mg was from the dissolution of carbonate minerals,
calcite (CaCO3). Calcite was likely to be the dominant
mineral present as indicated by the high concentration of
Ca whereas Mg concentrations were observed to be low.
Probably, some Mg from mineral may be lost due to cation
exchange with Na as indicated by the seawater fraction plot
(Fig. 8d).
Table 4 Fraction of seawater in Manukan Island aquifer (meq/L)
Seawater Sample Freshwater Mix Change
March 2006
Ca 21.05 15.40 3.04 4.49 10.91
Mg 32.30 9.87 0.99 3.50 6.38
Na 1126.00 70.39 0.04 90.22 -19.83
K 10.96 0.98 0.12 0.99 -0.01
HCO3 1.49 5.73 5.83 5.49 0.24
Cl 461.11 41.37 4.82 41.37 0.00
SO4 45.80 6.26 0.83 4.43 1.83
f sea 100.00 8.01
May 2006
Ca 21.05 12.37 3.04 5.40 6.97
Mg 32.30 14.75 0.99 5.09 9.66
Na 1126.00 52.43 0.04 147.53 -95.10
K 10.96 1.41 0.12 1.54 -0.13
HCO3 1.49 5.41 5.83 5.26 0.15
Cl 461.11 64.59 4.82 64.59 0.00
SO4 45.80 7.41 0.83 6.72 0.69
f sea 100.00 13.10
July 2006
Ca 21.05 10.62 3.04 5.30 5.33
Mg 32.30 8.28 0.99 4.91 3.38
Na 1126.00 15.33 0.04 140.91 -125.59
K 10.96 0.75 0.12 1.48 -0.73
HCO3 1.49 5.36 5.83 5.29 0.07
Cl 461.11 61.91 4.82 61.91 0.00
SO4 45.80 3.55 0.83 6.46 -2.91
f sea 100.00 12.51
September 2006
Ca 21.05 27.54 3.04 4.94 22.60
Mg 32.30 6.62 0.99 4.29 2.33
Na 1126.00 43.78 0.04 118.68 -74.90
K 10.96 0.62 0.12 1.26 -0.64
HCO3 1.49 4.99 5.83 5.38 -0.39
Cl 461.11 52.90 4.82 52.90 0.00
SO4 45.80 3.89 0.83 5.57 -1.68
f sea 100.00 10.54
November 2006
Ca 21.05 24.74 3.04 5.15 19.60
Mg 32.30 7.55 0.99 4.64 2.90
Na 1126.00 50.02 0.04 131.43 -81.41
K 10.96 0.81 0.12 1.39 -0.58
HCO3 1.49 5.33 5.83 5.33 0.00
Cl 461.11 58.07 4.82 58.07 0.00
SO4 45.80 4.80 0.83 6.08 -1.28
f sea 100.00 11.67
January 2007
Ca 21.05 26.10 3.04 6.00 20.10
Mg 32.30 7.27 0.99 6.12 1.15
Table 4 continued
Seawater Sample Freshwater Mix Change
Na 1126.00 76.38 0.04 184.60 -108.23
K 10.96 1.03 0.12 1.90 -0.86
HCO3 1.49 5.42 5.83 5.12 0.30
Cl 461.11 79.62 4.82 79.62 0.00
SO4 45.80 6.07 0.83 8.20 -2.13
f sea 100.00 16.37
Environ Geol (2009) 56:1721–1732 1729
123
Saturation indices
Saturation indices (SI) for calcite and aragonite were
calculated in order to show the extend of the effect of
seawater intrusion to the saturation state of the freshwa-
ter–seawater mixing process in a closed-system. The
PHREEQC code (Parkust and Appelo 1999) was used to
model the calcite and aragonite saturation state the in
seawater affected system. SI is defined as log(IAP/Ksp),
where IAP is the ion activity product and Ksp is the
equilibrium solubility product. From the calculation, most
of the groundwater samples are at or close to saturation
with respect to calcite and aragonite. Figure 9 shows the
calcite and aragonite saturation indices as a function of
the proportion of seawater on the mixture. The theoretical
line of conservative mixing is also shown in the plot. The
obvious difference between the theoretical line for con-
servative saturation states with the calculated values for
the samples is due to the non conservative nature of
dissolution and precipitation of the calcite and the CO2
flux (Leboeuf 2004).
For calcite plot, the lowest conservative mixing is
between 10 and 75% mixtures containing seawater which
occurs in undersaturated states. Calculated SIs for calcite
are found to be more highly saturated then the predicted.
The over saturated values were probably due to more
carbonate minerals dissolved under closed conditions as
the initial water enters from intermediate to deep aquifer.
The carbonate minerals dissolution simultaneously
exchanged Ca and Mg with Na that led the water remains at
or slightly above saturations states with respect to the
carbonate minerals. pH of groundwater influenced the
saturation state of calcite and aragonite, where Ca and Mg
are usually transferred to a solid phase at high pH value,
and therefore their concentrations are controlled by mineral
precipitation (Hem 1989; Lee et al. 2001). The trend of
aragonite species distribution is similar: the lowest con-
servative mixing of aragonite is between 10 and 75%
mixtures of seawater which occurs at undersaturated state.
This trend suggests that the dissolution of carbonate min-
erals from infiltration was not the main contributing factor
for the high presence of Ca and Mg in the groundwater.
When infiltration water enters the aquifer and dissolves
more carbonate bedrocks under closed condition, the water
remains at or slightly above saturation conditions with
respect to the carbonate minerals even with the increase of
seawater proportion penetrates into the aquifer. The water
remains at or slightly above the saturation condition due to
simultaneously exchange of Ca and Mg with Na. Hence,
the significant difference between the theoretical line for
conservative saturation state and the calculated values
indicates that the seawater intrusion itself was not the only
factor contributing to the dissolution of minerals. It was
possibly one of the factors that significantly control the
saturation state of the carbonate minerals.
The low significant correlation (r = -0.152) between
Ca and Mg (Table 2) is possibly attributed to the precipi-
tation state of calcite and aragonite. Precipitation took
place during the cation exchange process as an extending
effect from seawater intrusion as discussed previously. In
calcite crystals, Mg substituted Ca owing to the similarities
in ionic radius charge. Such elucidation is supported by the
-200
-150
-100
-50
0
50
100
-10
-5
0
5
10
15
20
25
30
35
40
PK
1P
K 2
PK
3P
K 4
PK
5P
K 6
PK
7P
K 8
PK
9P
K 1
PK
2P
K 3
PK
4P
K 5
PK
6P
K 7
PK
8P
K 9
PK
1P
K 2
PK
3P
K 4
PK
5P
K 6
PK
7P
K 8
PK
9P
K 1
PK
2P
K 3
PK
4P
K 5
PK
6P
K 7
PK
8P
K 9
PK
1P
K 2
PK
3P
K 4
PK
5P
K 6
PK
7P
K 8
PK
9P
K 1
PK
2P
K 3
PK
4P
K 5
PK
6P
K 7
PK
8P
K 9
Ion
ic C
han
ge
for
Ca,
Mg
, K, H
CO
3 an
d S
O4
(meq
/L)
Observation Wells
Ca Mg K Na
MARCH'06 MAY'06 JULY'06 SEPTEMBER'06 NOVEMBER'06 JANUARY'07
SO4 HCO3
Ion
ic Ch
ang
e for N
a (meq
/L)
Fig. 7 Ionic changes (echange)
of groundwater samples from
Manukan Island
1730 Environ Geol (2009) 56:1721–1732
123
SI value of both calcite and aragonite which indicated
supersaturation values. The increase of Ca concentration in
the groundwater samples recorded in March 2006–January
2007 were probably not due to calcite dissolution since the
HCO3 did not increase much when compared to the
November 2006 and January 2007 data. Such a weak
correlationship (r = -0.103) among major anions and
cations reveals that dissolved salts from seawater had
insignificant impact on the HCO3 concentration in the
groundwater.
-250
-200
-150
-100
-50
0
50
100
150
200
250
0302010
Na c
han
ge
(meq
/l)
% seawater
March'06 May'06 July'06 September'06 November'06 January'07
(a)
-2
-1
0
1
2
0302010
Kch
ang
e(m
eq/l)
% seawater
March'06 May'06 July'06 September'06 November'06 January'07
(b)
-10
0
10
20
30
40
50
0302010
Ca c
han
ge
(meq
/l)
% seawater
March'06 May'06 July'06 September'06 November'06 January'07
(c)
-5
0
5
10
15
20
0302010
Mg
chan
ge
(meq
/l)
% seawater
March'06 May'06 July'06 September'06 November'06 January'07
(d)
Fig. 8 echange for Na (a), K (b), Ca (c) and Mg (d) for the samples taken in March 2006 to January 2007
-0.8
-0.6
-0.4
-0.2
0.0
0.2
0.4
0.6
0.8
1.0
1.2
1.4
0 20 40 60 80 100
SI f
or
Cal
cite
% seawaterMarch'06 May'06 July'06 September'06 November'06 January'07
(a)
theroretical line
-0.8
-0.6
-0.4
-0.2
0.0
0.2
0.4
0.6
0.8
1.0
1.2
0 20 40 60 80 100
SI f
or
Ara
go
nit
e
% seawaterMarch'06 May'06 July'06 September'06 November'06 January'07
(b)
theroretical line
Fig. 9 a Calcite and b Aragonite saturation indices of studied groundwaters with the theoretical saturation indices for conservative mixing
between seawater and freshwater
Environ Geol (2009) 56:1721–1732 1731
123
Conclusions
The groundwater of Manukan Island experienced miner-
alization, an indication of marine water intrusion into the
island’s aquifer and marked by the presence of Na–Cl
water type. The mixing of freshwater–seawater creates a
diversity of geochemical processes that has alter the theo-
retical composition of the freshwater and seawater mixture
in the Manukan island’s aquifer.
The processes involved were complex and varies, spa-
tially and temporally. However, the most dominant process
that took place within the freshwater-seawater mixing was
the cation exchange which occurred mainly as direct
exchange between Na with Ca and Mg.
The obvious difference between the theoretical compo-
sitions for conservative saturation states with the calculated
values indicates that seawater intrusion itself was not the
sole factor that contributed to the dissolution of minerals.
Thus, seawater intrusion process was found to be one of the
factors that control the saturation states of the carbonate
minerals. The effect of flushing process could be one that
significantly attributed to the minerals dissolution process
in the aquifer’s system.
Saturation indices of calcite and aragonite were in
positive values and near to the equilibrium states with
increasing proportion of seawater, indicating the supersat-
uration of studied water by these minerals. This is an
extend effect of direct cation exchange process between the
seawater and carbonate minerals found in the aquifer.
Acknowledgments This research was financially supported by the
Ministry of Higher Education (MOHE), Malaysia through funda-
mental research grant of FRG0050-ST-1/2006. Permission from the
Sabah Parks Trustees for the study site exploration is highly
acknowledged. A special thanks to Mr Ahmad Fairudz Jamaludin and
Mrs Maimunah Mohamad from Climatological and Hydrological
Division, Malaysian Meteorological Department for the rainfall data.
The authors also thank anonymous reviewers for the helpful
comments.
References
Abdullah MH (2001) Phreatic water extraction from shallow aquifer
of a small island. PhD Thesis, Universiti Teknologi Malaysia [in
Malay]
Abdullah MH, Musta B, Ramli MZ (1996) Groundwater quality as
freshwater resource in Manukan island––a preliminary finding.
In: Proceedings of geology and environmental seminar, pp 33–
37. Bangi, Selangor [in Malay]
Abdullah MH, Mokhtar MB, Tahir S, Awaluddin A (1997a) Do tides
affect water quality in the upper phreatic zone of a small oceanic
island, Sipadan Island, Malaysia?. Environ Geol 29:112–117
Abdullah MH, Musta B, Tan MM (1997b) A preliminary geochemical
study on Manukan Island, Sabah. Borneo Sci 3:43–51
Abdullah MH, Kassim MA, Hanapi MN (2002) Saltwater encroach-
ment into the sandy aquifer of Manukan Island, Sabah. Borneo
Sci 12:1–22
Adams S, Titus R, Pietersen K, Tredoux G, Harris C (2001)
Hydrochemical characteristics of aquifers near Sutherland in the
Western Karoo, South Africa. J Hydrol 241:93–103
APHA (1995) Standard methods for the examination of water and
wastewater, 19th edn. American Water Works Association,
Water Environment Federation, Washington
Appelo CAJ, Postma D (2005) Geochemistry, groundwater and
pollution, 2nd edn. Balkema, Rotterdam
Aris AZ, Abdullah MH, Kim KW (2007a) Hydrogeochemistry of
groundwater in Manukan Island, Sabah. Malays J Anal Sci
11(2): 407–413
Aris AZ, Abdullah MH, Ahmed A, Woong KK (2007b) Controlling
factors of groundwater hydrochemistry in a small island’s
aquifer. Int J Environ Sci Tech 4(4):441–450
Babu DSS, Hindi EC, da Rosa Filho EF, Bittencourt AVL (2002)
Characteristics of Valdares Island aquifer, Paranagua coastal
plain, Brazil. Environ Geol 41:954–959
Basir J, Sanudin T, Tating FF (1991) Late Eocene planktonic
foraminifera from the Crocker Formation, Pun Batu, Sabah.
Warta Geol 14(4):1–15
Cruz JV, Amaral CS (2004) Major ion chemistry of groundwater from
perched-water bodies of the Azores (Portugal) volcanic archi-
pelago. Appl Geochem 19:445–459
Custodio E (1991) Conditions for freshwater occurrence in Small
Islands. In: Falkland A (ed) Hydrology and water resources of
small islands: a practical guide. UNESCO contribution to the
International Hydrological Programme
Dazy J, Drogue C, Charmanidis Ph, Darlet Ch (1997) The influence of
marine inflows on the chemical composition of groundwater in
small islands: the example of the Cyclades (Greece). Environ
Geol 31(3/4):133–141
Falkland AC, Brunel JP (1993) Review of hydrology and water
resources of the humid tropical islands. In: Bonell M, Hufsch-
midt MM, Gladwell JS (eds) Hydrology and water management
in the humid tropics. Cambridge University Press, England
Fidelibus MD, Gimenez E, Morell I, Tulipano L (1993) Salinization
processes in the Castellon Plain aquifer (Spain). In: Custodio E,
Galofre A (ed) Study and modelling of saltwater intrusion into
aquifers. Centro Internacional de Metodos Numericos en Ingen-
ierıa, Barcelona
Freeze RA, Cherry JA (1979) Groundwater. Prentice-Hall, New Jersey
Hem JD (1989) Study and interpretation of the chemical character-
istics of natural water, 3rd edn. US Geol. Surv. Water Supply
Pap. 2254, 363
Leboeuf PP (2004) Seawater intrusion and associated processes in a
small coastal complex aquifer (Castell de Ferro, Spain). Appl
Geochem 19:1517–1527
Lee CH, Lee HK, Lee JC (2001) Hydrochemistry of mine, surface and
groundwaters from the Sanggok mine creek in the upper Chungju
Lake, Republic of Korea. Environ Geol 40(4–5):482–494
MOH (2004) Malaysian National Standard for Drinking Water
Quality. Ministry of Health Malaysia. Kuala Lumpur
Parkhurst DL, Appelo CAJ (1999) User’s Guide to PHREEQC
(Version 2)––a computer program for speciation, batch-reaction,
one-dimensional transport, and inverse geochemical calcula-
tions. U.S. Geol. Survey
Singh VS, Gupta CP (1999) Groundwater in a coral island. Environ
Geol 37(1–2):72–77
Vengosh A, Starinsky A, Melloul A, Fink M, Erlich S (1991)
Salinization of the coastal aquifer water by Ca-chloride solutions
at the interface zone, along the Coastal Plain of Israel. Report
20/1991. Hydrological Service of Israel
Xie Z, Sun L, Phengfei Z, Sanping Z, Xuebin Y, Xiadong L, Bangbo
C (2005) Preliminary geochemical evidence of groundwater
contamination in coral islands of Xi-Sha, South China Sea. Appl
Geochem 20(10):1848–1856
1732 Environ Geol (2009) 56:1721–1732
123