Embed Size (px)
Citation preview
Educational Research and Reviews Vol. 7(11), pp. 270-281, 19 March, 2012 Available online at http://www.academicjournals.org/ERR DOI: 10.5897/ERR10.018 ISSN 1990-3839 ©2012 Academic Journals
Full Length Research Paper
Hydrodynamics of a multistage wet scrubber incineration conditions
M. M. Said, S. V. Manyele* and M. L. Raphael
Department of Chemical and Mining Engineering, College of Engineering and Technology, University of Dar es Salaam, P. O. Box 35131, Dar es Salaam, Tanzania.
Accepted 8 September, 2011
The objective of the study was to determine the hydrodynamics of the two stage counter-current cascade wet scrubbers used during incineration of medical waste. The dependence of the hydrodynamics on two main variables was studied: Inlet air flow rate and inlet liquid flow rate. This study introduces a new wet scrubber operating features, which are liquid accumulation, together with a detailed analysis of liquid-to-gas ratio and pressure drops. Liquid accumulation at the base of each scrubber helps to prevent the gas from short circuiting to the scrubber solution feed tanks. It was observed that liquid accumulation increases linearly with inlet scrubbing liquid flow rate beyond 0.2 L/s in the absence of flue gas flow. When flue gas is flowing into multistage wet scrubber the accumulation level increases abruptly starting from inlet scrubbing liquid of 0.45 L/s and stabilizes at accumulation level of 0.1 m beyond 0.75 L/s. Increasing the flue gas flow rate increases the minimum inlet scrubbing liquid flow rate at which initial accumulation was observed. The outlet scrubbing solution flow rate and liquid accumulation in the bottom of the scrubber increase as the inlet liquid flow rate increases. Beyond inlet liquid flow rate of 0.75 L/s, the outlet liquid flow rate does not increase any more, the wet scrubber enters flooding range, whereby, the volume of accumulated liquid increases faster with inlet scrubbing liquid flow rate. The maximum liquid-to-gas ratio was observed to be 1.9 L/m
3 and the
minimum liquid-to-gas ratio was 0.1 L/m3. Based on liquid accumulation and minimum flooding
conditions, the operating liquid-to-gas ratio was recommended to be 0.6 to 1.9 L/m3, while the allowable
inlet liquid flow rate ranged between 0.45 and 0.75 L/s, giving a constant accumulation of scrubbing liquid in the wet scrubber. The pressure drop across the wet scrubber remained constant at lower flow rate and increased linearly beyond Ug = 5 m/s. The maximum pressure drop of the multistage wet scrubber was 75 kPa. Key words: Wet scrubber, liquid accumulation, flooding, liquid-to-gas ratio, incineration, pressure drop.
INTRODUCTION Absorption is a process that refers to the transfer of a gas from a gas phase to liquid phase. In air pollution control, absorption involves the removal of objectionable gaseous contaminants from a process gaseous stream by dissolving them in a liquid (Lee and Lin, 2000; Kaewischan et al., 2001; Rubin et al., 2004; Manyele, 2008). Theoretically, absorption of a pollutant in gas phase contacted with a liquid phase occurs when the liquid contains less than the equilibrium concentration of
*Corresponding author. E-mail: [email protected].
the pollutant (Pery and Green, 1995; Mukherjee et al., 2007). In other words, the pollutant in the gas phase must have some solubility in the liquid phase. For absorption in the liquid phase to occur the maximum concentration of the same pollutant in liquid phase must be avoided initially. This is because the concentration gradient across the phase boundary is the driving force for absorption to occur between the two phases (Pevy and Tchobanoglows, 1985; Lawrance et al., 2004). The design of an absorber used to reduce pollutants (toxic gas and particulate matter) from the process exhausts involves many factors including the collection efficiency, solubility of pollutants in the absorption liquid, liquid to
gas ratio, exhaust flow rate, pressure drop and construction details (Calvert et al., 1972; Zenz, 1972; Bhatia, 1977; Diab and Maddox, 1982; Joseph and Beachler, 1998; Horikawa et al., 2004; Manyele, 2008). In this study, the hydrodynamics of the multistage wet scrubber under incineration conditions was extensively analyzed. Although many parameters of wet scrubber hydrodynamics have already been determined (Semrau, 1977; Richards, 1995; Joseph and Beachler, 1998; Takaoka et al., 2002; Rubin, 2004; Manyele, 2008), the accumulation of the scrubbing liquid within the wet scrubber has not yet been studied.
Wet scrubber removes particles by capturing them in liquid droplets, and they remove gases by dissolving or absorbing them into the liquid (Peytavy et al., 1990; Manyele, 2008). The scrubbing liquid and gas flow counter-currently; the scrubbing liquid flows from the top while the gas flows from the bottom. There is a chance of the liquid forcing the flue gas to the scrubbing collection tank if there is no accumulation of scrubbing liquid at the bottom of the scrubber. The industrial liquids commonly used as scrubbing solvents include water, mineral oils, non-volatile hydrocarbon oils, Fe/EDTA (Horikawa et al., 2004), aqueous solutions (Huttenhuis et al., 2007; Mukherjee et al., 2007), methyl-ethanolamine (MEA), methylethanolamine (MDEA) (Kaewschan et al., 2001). In this study, tap water and lime solution (6 mg/L) were used to establish the hydrodynamics of the wet scrubber.
To promote maximum gas-liquid surface area and residence time, a number of wet scrubber designs have been used in industries, including spray towers, venturis, plate towers, and mobile packed beds. Counter-current packed towers are infrequently used because they have a tendency to become plugged by collected particles or to scale when lime or limestone scrubbing slurries are used. Because of scale buildup, plugging, or erosion, which affects scrubber dependability and absorber efficiency. In this study, a simple scrubber such as spray towers instead of more complicated types was used. The configuration of the tower may be vertical or horizontal, and flue gas can flow concurrently, countercurrently, or crosscurrently with respect to the liquid. The chief drawback of spray towers is that they require a higher liquid-to-gas ratio for equivalent pollutant removal than other absorber designs (Richards, 1995; Manyele, 2008).
A spray tower is the simplest type of scrubber. It consists of a tower with spray nozzles, which generate the droplets for surface contact. Spray towers are typically used when circulating the slurry (Rubin et al., 2004; Manyele, 2008). The high speed of a venturi would cause erosion problems, while a packed tower would plug up if the slurry is circulated (Richards, 1995). Spray towers are low-energy scrubbers with low contacting power. The pressure drop across such systems is generally less than 2.5 cm of water (Rubin et al., 2004; Chatterjee and Joshi, 2008). The collection efficiency for small particles is correspondingly lower than in more energy-intensive devices. They are adequate for the
Said et al. 271 collection of coarse particles larger than 10 to 25 μm in diameter, although with increased liquid inlet nozzle pressures, particles with diameters of 2.0 μm can be collected. Smaller droplets can be formed by higher liquid pressures at the nozzle (Joseph and Beachler, 1998). The highest collection efficiencies are achieved when small droplets are produced and the difference between the velocity of the droplet and the velocity of the upward-moving particles is high. Small droplets, however, have small settling velocities, so there is an optimum range of droplet sizes for scrubbers that work by this mechanism. Semrau (1977) found this range of droplet sizes to be between 500 to 1000 μm for gravity-spray (counter current) towers.
The injection of water at very high pressures, 2070 to 3100 kPa, creates a fog of very fine droplets inside the wet scrubber. Higher particle-collection efficiencies can be achieved in such cases since collection mechanisms other than inertial impaction occur (Joseph and Beachler, 1998; Takaoka et al., 2002). However, these spray nozzles may use more power to form droplets than would a venturi operating at the same collection efficiency. Scrubbing systems must be able to operate effectively at both the normal day-to-day conditions (obtained by setting constant flow rates of liquids) as well as to accommodate any maximum ranges resulting from maximum unexpected gas flow rates caused by combustion problems in the chamber (Manyele, 2008).
Liquid to gas ratio It is common in wet scrubber terminology to express the liquid flow rate as a function of the gas flow rate that is being treated. It should be noted that in most process industries the gas flow rate is normally constant while the liquid flow rate is free to change. This is commonly called the liquid-to-gas ratio and uses the units of liters of liquid per cubic meter of gas (Coulson and Richardson, 1991; Joseph and Beachler, 1998; Horikawa et al., 2004; Manyele, 2008). Expressing the amount of liquid used as a ratio enables systems of different sizes to be readily compared. For particulate removal, the liquid-to-gas ratio is a function of the mechanical design of the system; while for gas absorption the liquid-to-gas ratio gives an indication of the difficulty of removing a pollutant. Most wet scrubbers in use operate with liquid-to-gas ratios in the range of 0.6 to 3.2 L
3 per cubic m (Richards, 1995;
Joseph and Beachler, 1998, Horikawa et al., 2004). Depending on scrubber design, a minimum volume of liquid is required to "wet" the scrubber internals and create sufficient collection targets. Manyele (2008) indicated that after a certain optimum point, adding excess liquid to a wet scrubber does not increase its efficiency and in fact, could be counterproductive by causing excessive pressure loss and flooding.
Liquid-to-gas ratio depends on the type of scrubbing liquid and the rate at which the liquid is supplied to the
272 Educ. Res. Rev.
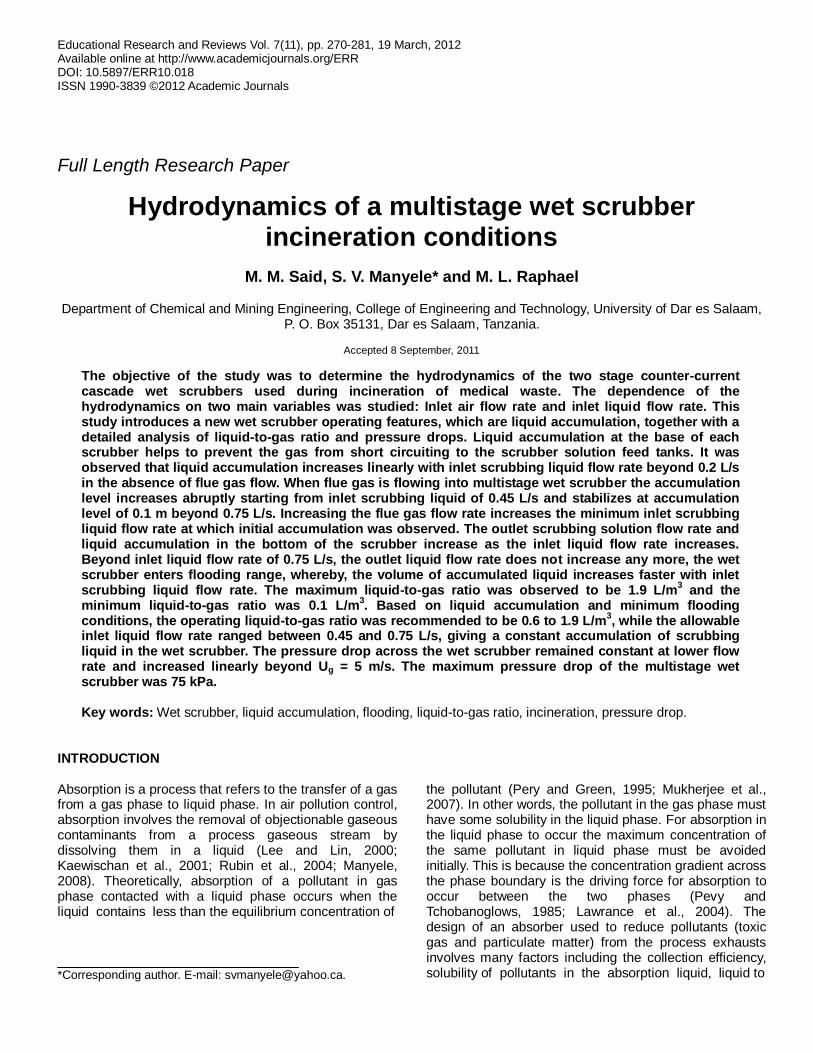
Figure 1. The experimental set up.
absorber. This study focused on a countercurrent gas-liquid flow pattern. This is the most common flow pattern used to achieve high-efficiency gas absorption. Engineering design work is usually done on a solute-free basis (X, Y) which means it ignores the amount of pollutant being transferred from the gas to the liquid. This makes the material balance calculations easier because we do not have to continually account for the change in mass of the flue gas as it is losing pollutant, or of the liquid as it is gaining pollutant, but concentrates on inlet and exit conditions.
Let Y1 represent the mole ratio of solute in the flue gas entering the scrubber bottom at a molar flow rate G1, and leaving the scrubber top at conditions (Y2, G2). If the scrubbing liquid enters the scrubber top at a molar flow rate Q2, and solute or pollutant concentration X2, and leaves the scrubber bottom with conditions (X1, Q1), then material balances for the solute using solute free basis leads to Equation (1):
(1)
Equation 1 represents a straight line. When this line is plotted on an equilibrium diagram, it is referred to as an operating line (Richardson and Coulson, 1991; Richards, 1995; Joseph and Beachler, 1998; Manyele, 2008). This line defines operating conditions within the absorber:
what is going in and what is coming out. The slope of the operating line is the liquid mass flow rate divided by the gas mass flow rate, which is the liquid-to-gas ratio, or Q/G. The liquid-to-gas ratio is used extensively when describing or comparing different absorption systems.
In the determination of liquid requirements for the most of the absorption columns, the quantity of exhaust gas to be treated (G) and the inlet solute (pollutant) concentration (Y1) are set by process conditions before the scrubber (Manyele, 2008). Minimum acceptable environmental standards specify the outlet pollutant concentration (Y2). The composition of the liquid flowing into the absorber (X2) is also generally known or can be assumed to be zero if it is not recycled (Richardson and Coulson, 1991; Joseph and Beachler, 1998; Manyele, 2008). Generally, liquid flow rates are specified at 25 to 100% greater than the required minimum. Typical absorber operation would be 50% greater than the minimum liquid flow rate (that is, 1.5 times the minimum liquid-to-gas ratio). Setting the liquid rate in this way assumes that the gas flow rate set by the process does not change appreciably (Joseph and Beachler, 1998; Manyele, 2008).
This study provides the operating range for liquid-to-gas ratio and liquid flow rates for use in absorption process using a wet scrubber connected to medical waste incineration facility. METHODOLOGY
Process description The process consisted primarily of preparing feed waste for
combustion and scrubbing solution, adjusting gas and liquid flow rates, and operating the sampling and analytical equipment to record data. Scrubbing liquid water and/or aqueous lime solution was prepared in the liquid feed tank. Reagent lime was mixed with water to make up the feed solution to the wet scrubber. The scrubbing liquid, initially at a pH of 11-12, measured by using a pH meter, was fed to the scrubber using a centrifugal pump. The cooling water was also circulated into the heat exchanger by pumping while adjusting the valves until the desired flow rates were reached. Gas flow was started by switch on the blower and adjusting the gas flow rate using the opening flap.
The test series consisted of runs with gas flow rates ranging from 4 to 16 m/s and liquid flow rates ranging from 0.15 to 0.9 L/s. Different combinations of gas and liquid flow rates (Q/G) were used. Experiments were designed to measure pressure drop variation across wet scrubber and accumulation of liquid into the scrubber Stage 1.
The flue gas from the combustion chamber exits the riser and passes through a series of cyclones for removing solid particles, heat exchanger for reducing temperature and finally passes through the multistage wet scrubbers. Figure 1 shows the experimental setup, incorporating a circulating fluidized bed incineration facility with multistage wet scrubbers used in this study.
Calculation of the liquid-to-gas ratios
The liquid to gas ratio was calculated by dividing the liquid flow rate
(L/s) by the flow rate of the gas in the wet scrubber (m
3/s) giving
Q/G in liters of liquid per m3 of gas (L/m
3), as shown in Equation (2):
(2)
Each velocity of the gas applied was multiplied by the cross-sectional area of the duct of the blower to get volumetric flow rate of gas in m
3/s.
Determination of liquid accumulation in the wet scrubber
A known flow rate of scrubbing liquid was introduced into the scrubber in the form of a spray directed downwards. As the liquid was drained, it created curtains of scrubbing liquid. Dust laden gas entered the scrubber tangentially and collided with the curtains of liquid initiating particle agglomeration. The fine particles produced from the combustion chamber and un-captured by cyclones were washed down to the bottom of the scrubber, leaving the system as slurry outlet (Qo). A restriction disc located in the scrubber
accelerates the gas cleaning process. This action combined with the flood of atomized liquid from the spray causes the formation of fine liquid droplets which encapsulates the fine particulates, again enhancing agglomeration. The flooding existed when the outlet flow rate was lower compared to inlet flow rate of scrubbing liquid, causing some liquid to remain within the scrubber. The optimum operation of the wet scrubber was measured by using the scrubbing liquid level that remains within the scrubber. If the liquid level was too high, there is a possibility of the liquid to flow back to the heat exchanger, through the gas duct, and finally to the cyclones and combustion chamber. This shows the importance of studying the water level within the scrubber. The liquid accumulation was determined using Equation (3):
Rate of accumulation = dQ = Qin – Qo (3)
Rate of accumulation data were collected at different gas flow velocities and when there was no gas flowing into the system. The level of scrubbing liquid within the scrubber was known by reading the level of liquid in the scaled glass tube which is outside the scrubber acting as a level indicator. First the experiment was done by varying the inlet liquid flow rate from 0.15 to 0.96 L/s, while there was no air flow within the system. Secondly, the experiment was done by varying liquid flow at different gas flow. There are three terms used for accumulation, these are: Accumulation rate (dQ) is the amount of scrubbing liquid retained in the wet scrubber per unit time, Accumulation level (Ha) is the height occupied by scrubbing liquid retained in the wet scrubber and effective height (He) is the total height of wet scrubber used for scrubbing processes. The ratio of (Ha/He) gives the height by which the wet scrubber is covered by scrubbing liquid in terms of a ratio. Thus, accumulation reduces the available space for mass transfer in the scrubber.
Pressure drop measurements
The pressure drop along the multistage wet scrubber was measured by using manometers. Pressure measurement positions are shown in Figure 1, P6 was the position at the inlet to the wet scrubber Stage 1, P7 was the outlet from wet scrubber Stage 1 and inlet to Stage 2 and P8 was the outlet from the Stage 2. Measurements were performed for each gas velocity and liquid flow rate. The apparatus used to measure total pressure was a
manometer. The pressure drop was obtained by subtracting the inlet pressure with outlet pressure of the gas, as per Equations (4) to (6):
Said et al. 273
(4)
and
(5)
and
(6)
Where: = pressure drop across the wet scrubber Stage 1
= pressure drop across the wet scrubber Stage 2.
= pressure drop across the multistage wet scrubber
system.
RESULTS AND DISCUSSION
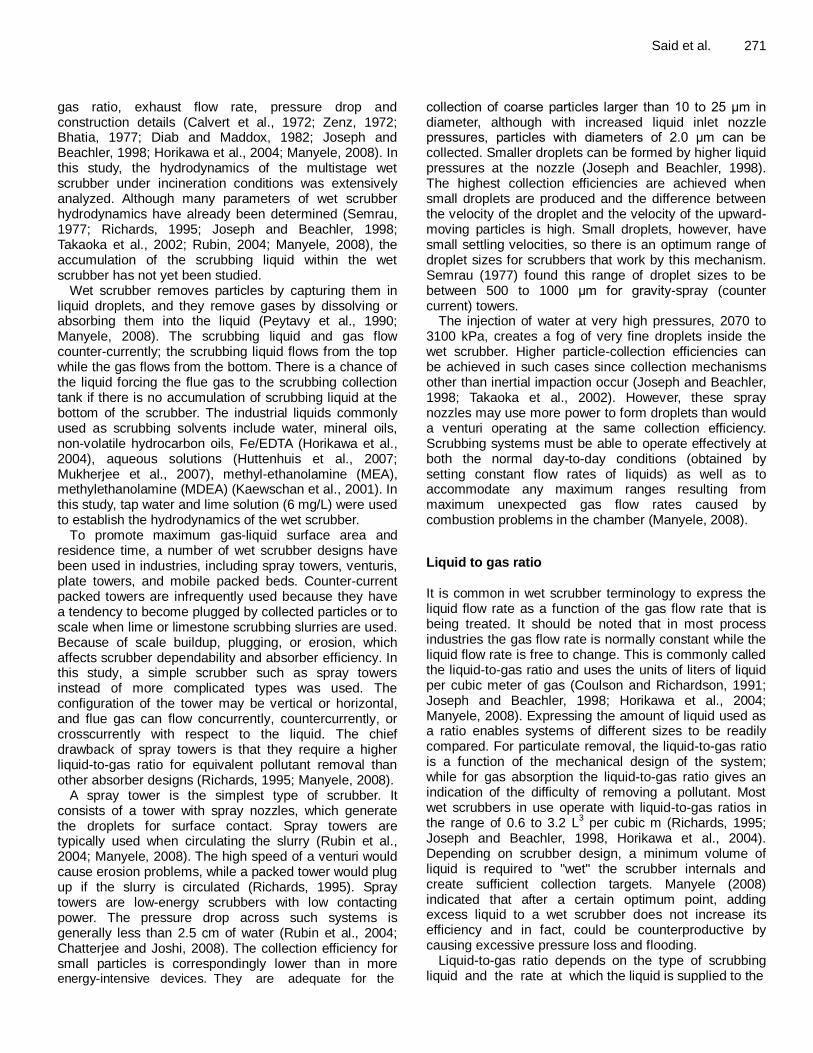
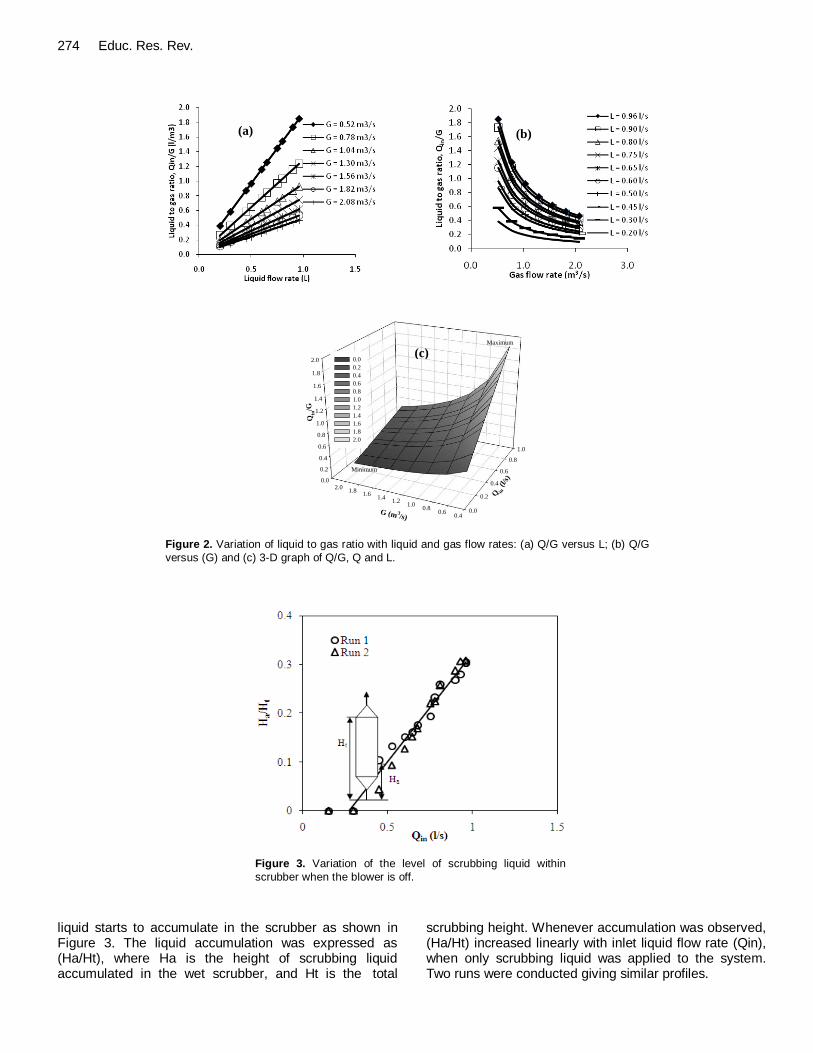
Variation of liquid-to-gas ratio with inlet liquid and gas flow rates The relationship between scrubbing liquid to flue gas (Q/G) ratio, flue gas flow rate, and scrubbing liquid flow rate was studied in details. The scrubbing liquid to flue gas ratio increased linearly with inlet scrubbing liquid flow rate (Qin) as shown in Figure 2a. The vertical axis represents the scrubbing liquid to flue gas ratio (Qin/G), where Qin is the inlet scrubbing liquid flow rate (L/s) and G is the flue gas flow rate (m
3/s). The horizontal axis
represents the inlet scrubbing liquid flow rate (L/s).The data was collected at different flue gas flow rate, that is, between 0.52 and 2.08 m
3/s.
The highest scrubbing liquid to flue gas ratio was observed when flue gas flow rate was minimum (that is, 0.52 m
3/s) and scrubbing liquid flow rate was the highest
(that is, 0.96 L/s) while the lowest Qin/G ratio was obtained, when the flue gas flow rate was 2.08 m
3/s and
the scrubbing liquid flow rate was 0.3 L/s. The scrubbing liquid to flue gas ratio is inversely proportional to the flue gas flow rate as shown in Figure 2b. The vertical axis represents the scrubbing liquid to flue gas ratio (Qin/G) and horizontal axis represents flue gas flow rate, the data was collected at different scrubbing liquid flow rates, that is, between 0.2 and 1 L/s. Since the operation range required is 0.6 to 3.2 L/m
3 (Joseph and Beachler, 1998),
in this study, the minimum operation is 0.6 and maximum operation is 1.9 L/m
3, which are within the acceptable
range. The combination of the two Figure 2a and 2b leads to Figure 2c which is a 3-D plot using scrubbing liquid flow rate, flue gas flow rate and scrubbing liquid to flue gas ratio. The scrubbing liquid to flue gas ratio increased as the flue gas flow rate decreased.
Liquid accumulation in the wet scrubber
Accumulation level without gas flow
When inlet flow rate reaches about 0.2 L/s, the scrubbing
274 Educ. Res. Rev.
0.0
0.2
0.4
0.6
0.8
1.0
1.2
1.4
1.6
1.8
2.0
0.0
0.2
0.4
0.6
0.8
1.0
0.40.6
0.81.0
1.21.4
1.61.8
2.0
Qin
/G
Q in (l/s
)G (m 3
/s)
0.0
0.2
0.4
0.6
0.8
1.0
1.2
1.4
1.6
1.8
2.0
Minimum
Maximum
(a) (b)
(c)
Figure 2. Variation of liquid to gas ratio with liquid and gas flow rates: (a) Q/G versus L; (b) Q/G
versus (G) and (c) 3-D graph of Q/G, Q and L.
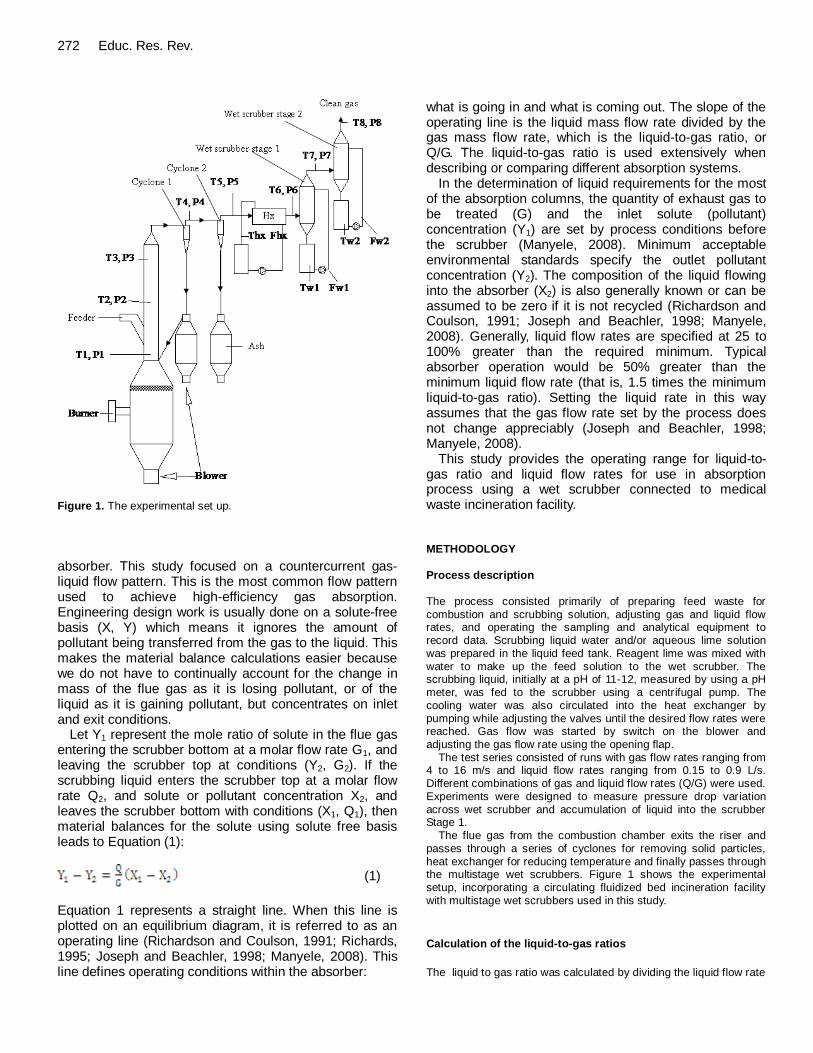
Figure 3. Variation of the level of scrubbing liquid within
scrubber when the blower is off.
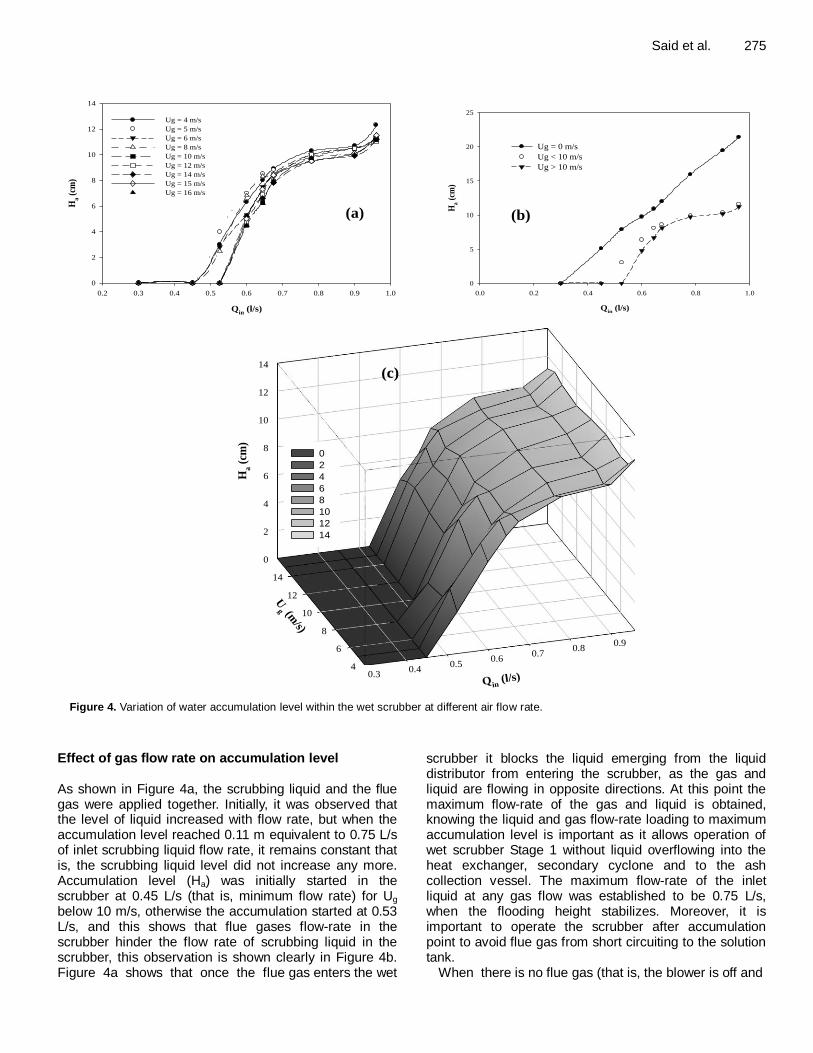
liquid starts to accumulate in the scrubber as shown in Figure 3. The liquid accumulation was expressed as (Ha/Ht), where Ha is the height of scrubbing liquid accumulated in the wet scrubber, and Ht is the total
scrubbing height. Whenever accumulation was observed, (Ha/Ht) increased linearly with inlet liquid flow rate (Qin), when only scrubbing liquid was applied to the system. Two runs were conducted giving similar profiles.
Said et al. 275
Qin
(l/s)
0.2 0.3 0.4 0.5 0.6 0.7 0.8 0.9 1.0
Ha (
cm)
0
2
4
6
8
10
12
14
Ug = 4 m/s
Ug = 5 m/s
Ug = 6 m/s
Ug = 8 m/s
Ug = 10 m/s
Ug = 12 m/s
Ug = 14 m/s
Ug = 15 m/s
Ug = 16 m/s
Qin
(l/s)
0.0 0.2 0.4 0.6 0.8 1.0
Ha (
cm)
0
5
10
15
20
25
Ug = 0 m/s
Ug < 10 m/s
Ug > 10 m/s
0
2
4
6
8
10
12
14
0.30.4
0.50.6
0.70.8
0.9
4
6
8
10
12
14
Ha (
cm)
Qin (l/s)
Ug (m
/s)
0
2
4
6
8
10
12
14
(a) (b)
(c)
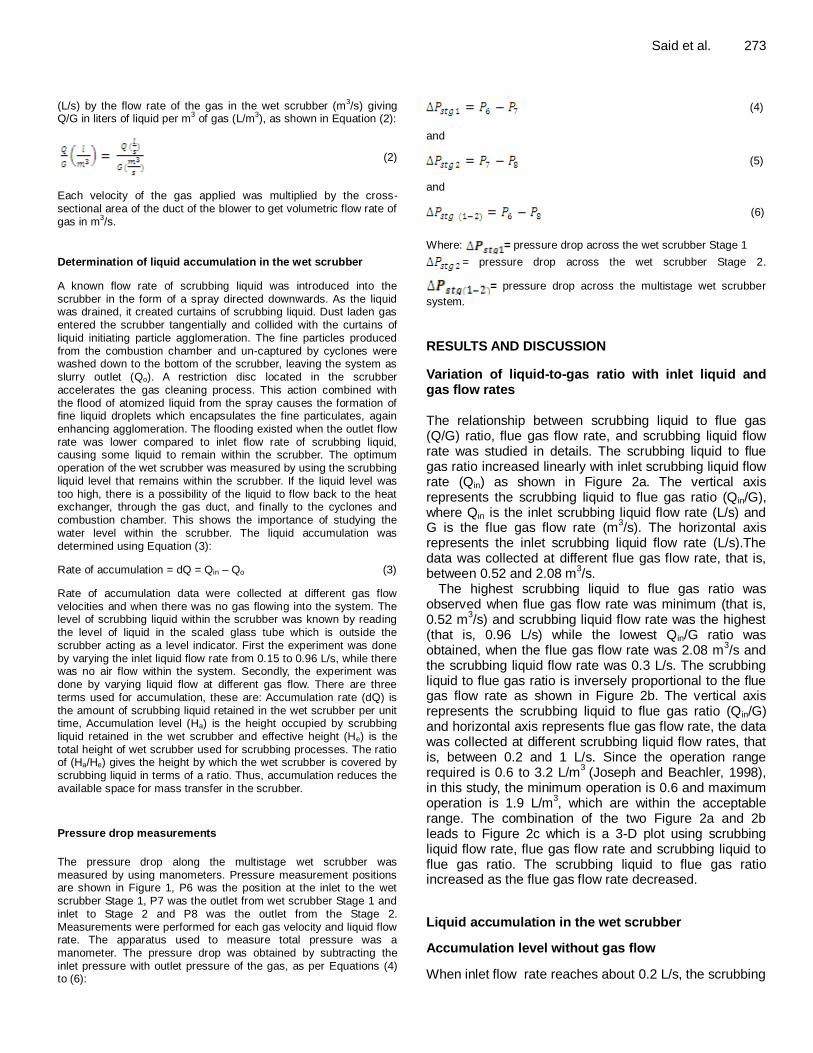
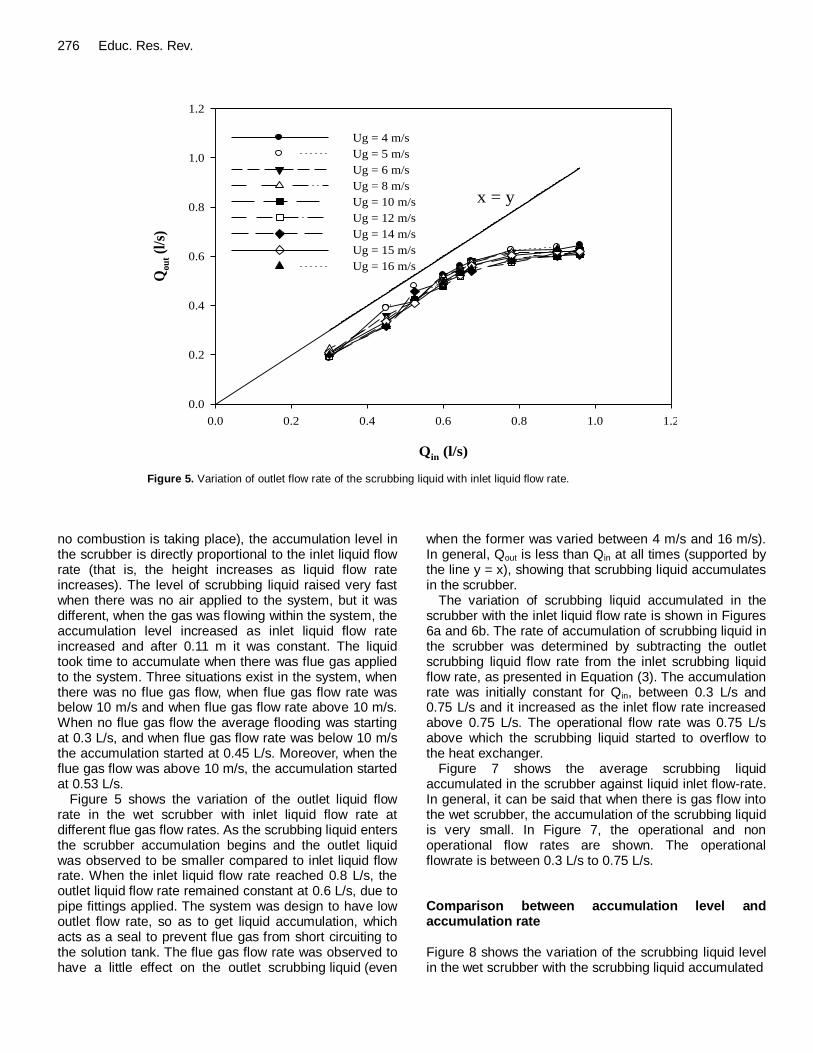
Figure 4. Variation of water accumulation level within the wet scrubber at different air flow rate.
Effect of gas flow rate on accumulation level As shown in Figure 4a, the scrubbing liquid and the flue gas were applied together. Initially, it was observed that the level of liquid increased with flow rate, but when the accumulation level reached 0.11 m equivalent to 0.75 L/s of inlet scrubbing liquid flow rate, it remains constant that is, the scrubbing liquid level did not increase any more. Accumulation level (Ha) was initially started in the scrubber at 0.45 L/s (that is, minimum flow rate) for Ug below 10 m/s, otherwise the accumulation started at 0.53 L/s, and this shows that flue gases flow-rate in the scrubber hinder the flow rate of scrubbing liquid in the scrubber, this observation is shown clearly in Figure 4b. Figure 4a shows that once the flue gas enters the wet
scrubber it blocks the liquid emerging from the liquid distributor from entering the scrubber, as the gas and liquid are flowing in opposite directions. At this point the maximum flow-rate of the gas and liquid is obtained, knowing the liquid and gas flow-rate loading to maximum accumulation level is important as it allows operation of wet scrubber Stage 1 without liquid overflowing into the heat exchanger, secondary cyclone and to the ash collection vessel. The maximum flow-rate of the inlet liquid at any gas flow was established to be 0.75 L/s, when the flooding height stabilizes. Moreover, it is important to operate the scrubber after accumulation point to avoid flue gas from short circuiting to the solution tank.
When there is no flue gas (that is, the blower is off and
276 Educ. Res. Rev.
Qin (l/s)
0.0 0.2 0.4 0.6 0.8 1.0 1.2
Qo
ut (
l/s)
0.0
0.2
0.4
0.6
0.8
1.0
1.2
Ug = 4 m/s
Ug = 5 m/s
Ug = 6 m/s
Ug = 8 m/s
Ug = 10 m/s
Ug = 12 m/s
Ug = 14 m/s
Ug = 15 m/s
Ug = 16 m/s
x = y
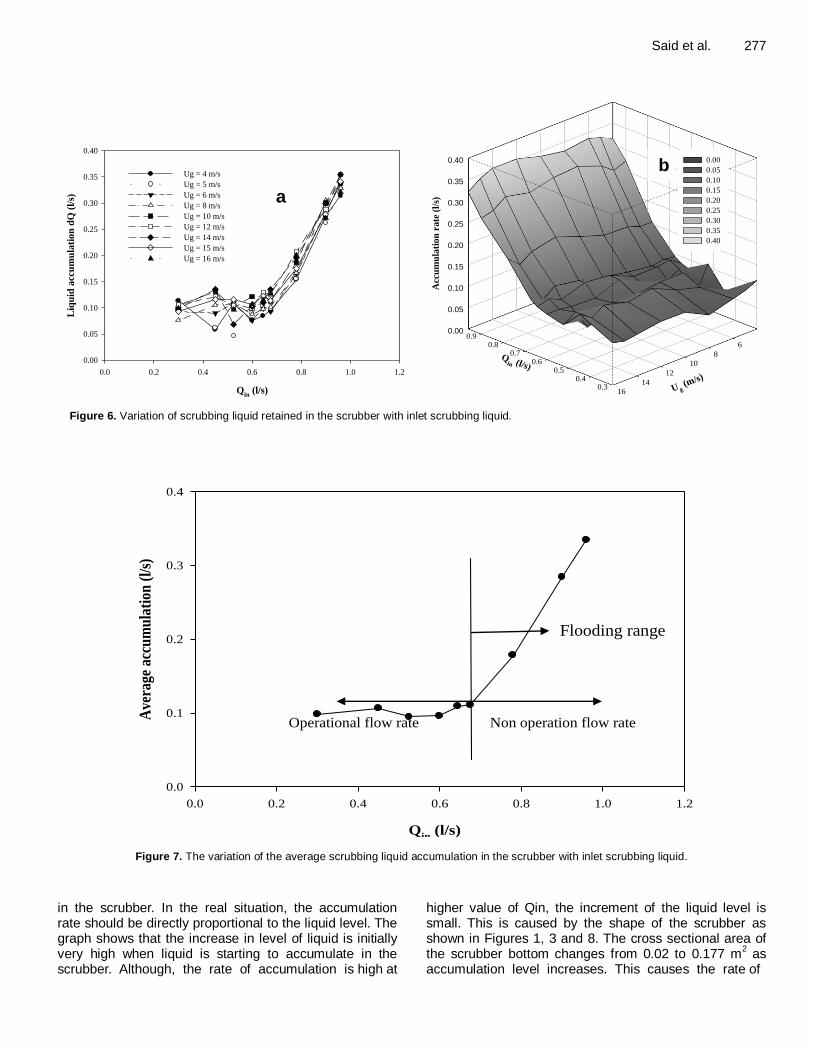
Figure 5. Variation of outlet flow rate of the scrubbing liquid with inlet liquid flow rate.
no combustion is taking place), the accumulation level in the scrubber is directly proportional to the inlet liquid flow rate (that is, the height increases as liquid flow rate increases). The level of scrubbing liquid raised very fast when there was no air applied to the system, but it was different, when the gas was flowing within the system, the accumulation level increased as inlet liquid flow rate increased and after 0.11 m it was constant. The liquid took time to accumulate when there was flue gas applied to the system. Three situations exist in the system, when there was no flue gas flow, when flue gas flow rate was below 10 m/s and when flue gas flow rate above 10 m/s. When no flue gas flow the average flooding was starting at 0.3 L/s, and when flue gas flow rate was below 10 m/s the accumulation started at 0.45 L/s. Moreover, when the flue gas flow was above 10 m/s, the accumulation started at 0.53 L/s.
Figure 5 shows the variation of the outlet liquid flow rate in the wet scrubber with inlet liquid flow rate at different flue gas flow rates. As the scrubbing liquid enters the scrubber accumulation begins and the outlet liquid was observed to be smaller compared to inlet liquid flow rate. When the inlet liquid flow rate reached 0.8 L/s, the outlet liquid flow rate remained constant at 0.6 L/s, due to pipe fittings applied. The system was design to have low outlet flow rate, so as to get liquid accumulation, which acts as a seal to prevent flue gas from short circuiting to the solution tank. The flue gas flow rate was observed to have a little effect on the outlet scrubbing liquid (even
when the former was varied between 4 m/s and 16 m/s). In general, Qout is less than Qin at all times (supported by the line y = x), showing that scrubbing liquid accumulates in the scrubber.
The variation of scrubbing liquid accumulated in the scrubber with the inlet liquid flow rate is shown in Figures 6a and 6b. The rate of accumulation of scrubbing liquid in the scrubber was determined by subtracting the outlet scrubbing liquid flow rate from the inlet scrubbing liquid flow rate, as presented in Equation (3). The accumulation rate was initially constant for Qin, between 0.3 L/s and 0.75 L/s and it increased as the inlet flow rate increased above 0.75 L/s. The operational flow rate was 0.75 L/s above which the scrubbing liquid started to overflow to the heat exchanger.
Figure 7 shows the average scrubbing liquid accumulated in the scrubber against liquid inlet flow-rate. In general, it can be said that when there is gas flow into the wet scrubber, the accumulation of the scrubbing liquid is very small. In Figure 7, the operational and non operational flow rates are shown. The operational flowrate is between 0.3 L/s to 0.75 L/s. Comparison between accumulation level and accumulation rate Figure 8 shows the variation of the scrubbing liquid level in the wet scrubber with the scrubbing liquid accumulated
Said et al. 277
Qin
(l/s)
0.0 0.2 0.4 0.6 0.8 1.0 1.2
Liq
uid
acc
um
ula
tio
n d
Q (
l/s)
0.00
0.05
0.10
0.15
0.20
0.25
0.30
0.35
0.40
Ug = 4 m/s
Ug = 5 m/s
Ug = 6 m/s
Ug = 8 m/s
Ug = 10 m/s
Ug = 12 m/s
Ug = 14 m/s
Ug = 15 m/s
Ug = 16 m/s
0.00
0.05
0.10
0.15
0.20
0.25
0.30
0.35
0.40
0.30.4
0.50.6
0.70.8
0.9 4
6
8
10
12
14
16
Acc
um
ula
tion
ra
te (
l/s)
Qin (l/s)
U g (m
/s)
0.00
0.05
0.10
0.15
0.20
0.25
0.30
0.35
0.40
a
b
Figure 6. Variation of scrubbing liquid retained in the scrubber with inlet scrubbing liquid.
Qin
(l/s)
0.0 0.2 0.4 0.6 0.8 1.0 1.2
Ave
rage
acc
um
ula
tion
(l/
s)
0.0
0.1
0.2
0.3
0.4
Operational flow rate Non operation flow rate
Flooding range
Figure 7. The variation of the average scrubbing liquid accumulation in the scrubber with inlet scrubbing liquid.
in the scrubber. In the real situation, the accumulation rate should be directly proportional to the liquid level. The graph shows that the increase in level of liquid is initially very high when liquid is starting to accumulate in the scrubber. Although, the rate of accumulation is high at
higher value of Qin, the increment of the liquid level is small. This is caused by the shape of the scrubber as shown in Figures 1, 3 and 8. The cross sectional area of the scrubber bottom changes from 0.02 to 0.177 m
2 as
accumulation level increases. This causes the rate of
278 Educ. Res. Rev.
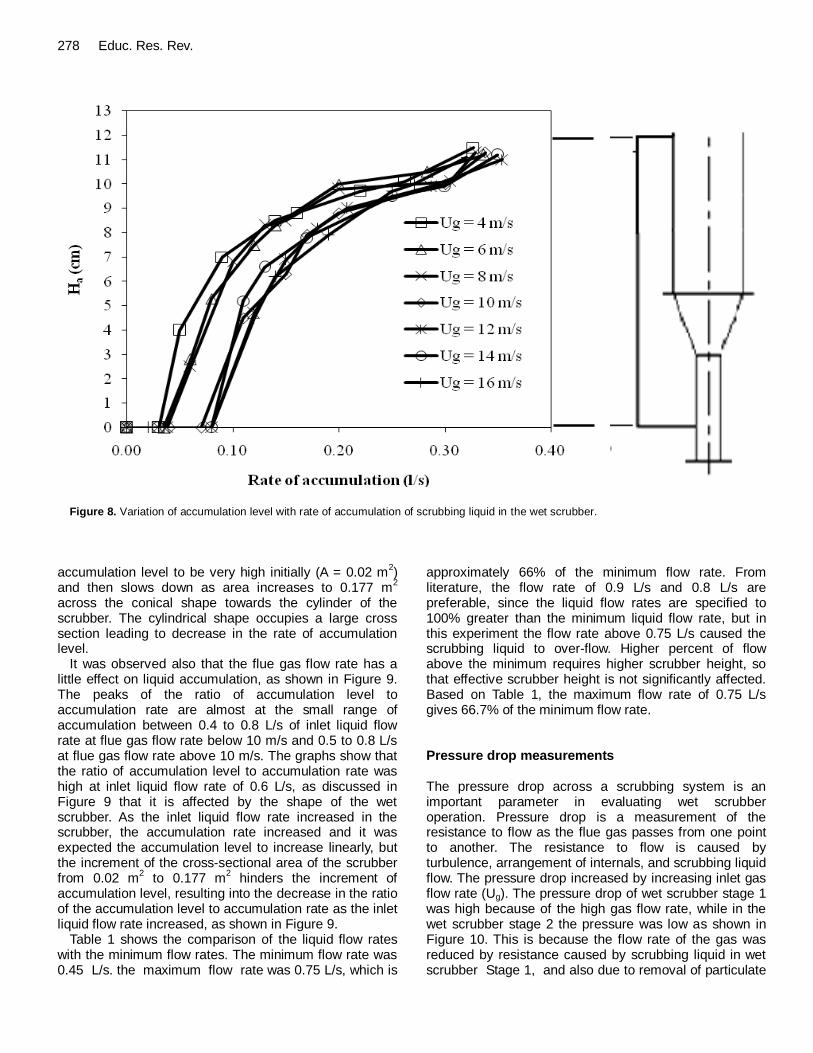
Figure 8. Variation of accumulation level with rate of accumulation of scrubbing liquid in the wet scrubber.
accumulation level to be very high initially (A = 0.02 m
2)
and then slows down as area increases to 0.177 m2
across the conical shape towards the cylinder of the scrubber. The cylindrical shape occupies a large cross section leading to decrease in the rate of accumulation level.
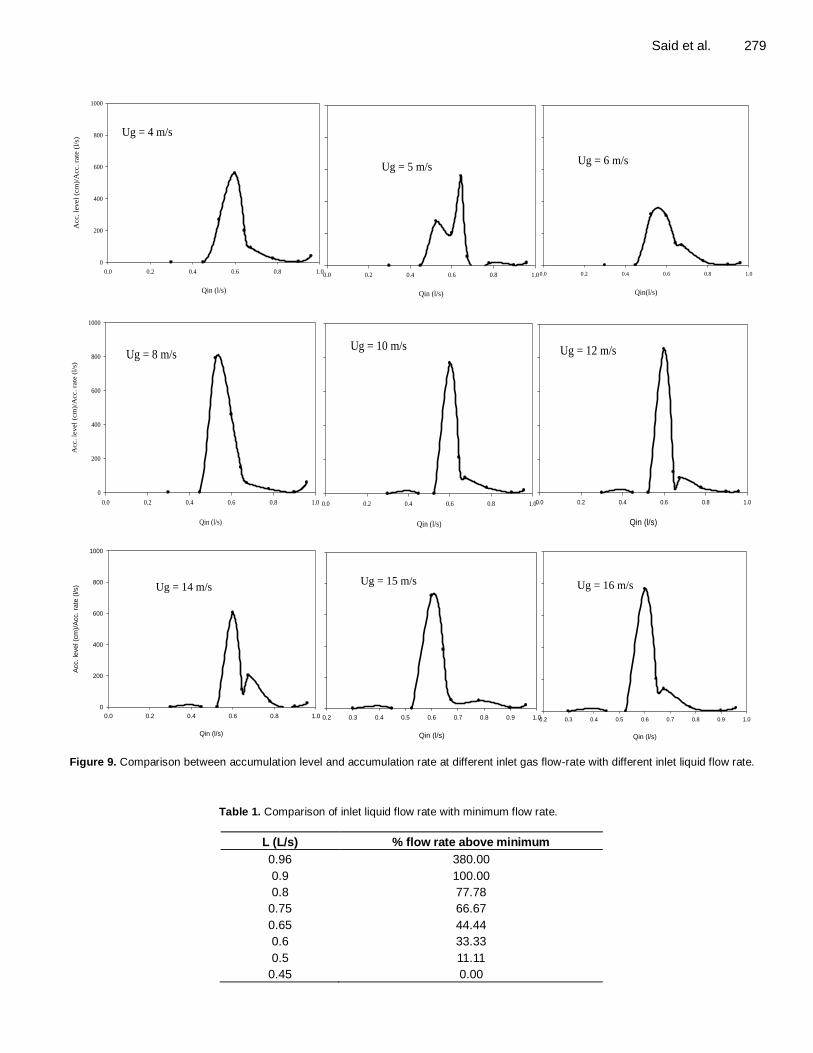
It was observed also that the flue gas flow rate has a little effect on liquid accumulation, as shown in Figure 9. The peaks of the ratio of accumulation level to accumulation rate are almost at the small range of accumulation between 0.4 to 0.8 L/s of inlet liquid flow rate at flue gas flow rate below 10 m/s and 0.5 to 0.8 L/s at flue gas flow rate above 10 m/s. The graphs show that the ratio of accumulation level to accumulation rate was high at inlet liquid flow rate of 0.6 L/s, as discussed in Figure 9 that it is affected by the shape of the wet scrubber. As the inlet liquid flow rate increased in the scrubber, the accumulation rate increased and it was expected the accumulation level to increase linearly, but the increment of the cross-sectional area of the scrubber from 0.02 m
2 to 0.177 m
2 hinders the increment of
accumulation level, resulting into the decrease in the ratio of the accumulation level to accumulation rate as the inlet liquid flow rate increased, as shown in Figure 9.
Table 1 shows the comparison of the liquid flow rates with the minimum flow rates. The minimum flow rate was 0.45 L/s. the maximum flow rate was 0.75 L/s, which is
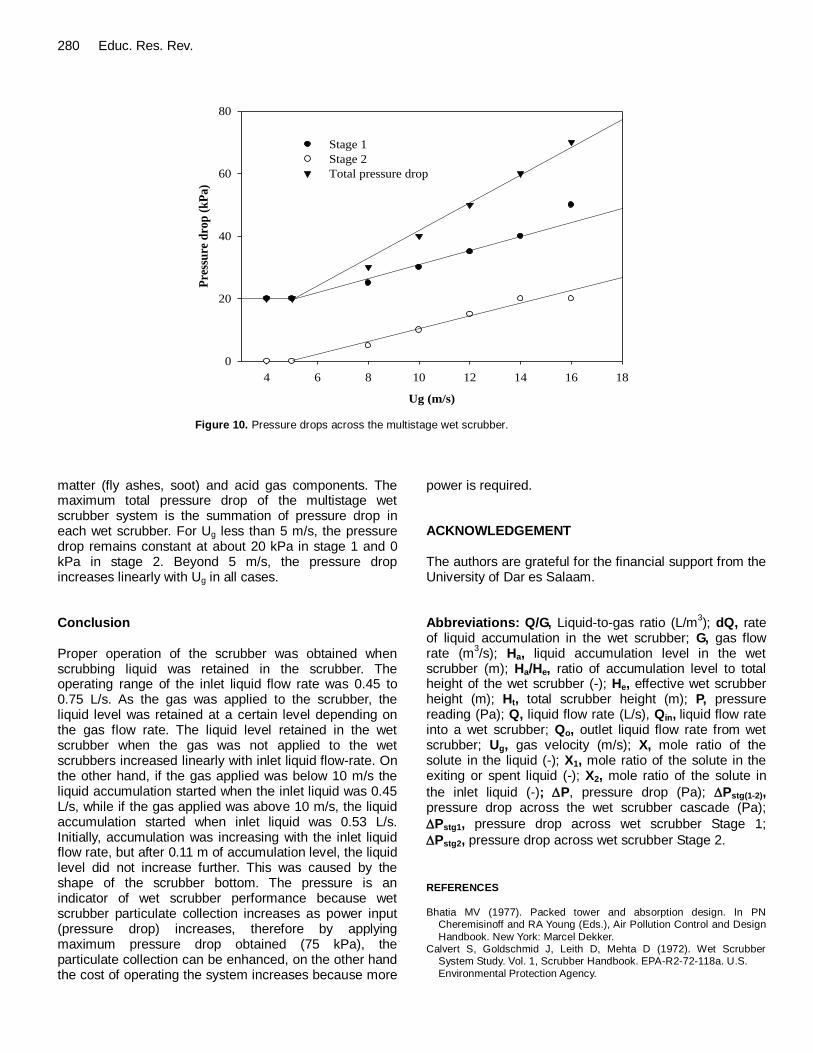
approximately 66% of the minimum flow rate. From literature, the flow rate of 0.9 L/s and 0.8 L/s are preferable, since the liquid flow rates are specified to 100% greater than the minimum liquid flow rate, but in this experiment the flow rate above 0.75 L/s caused the scrubbing liquid to over-flow. Higher percent of flow above the minimum requires higher scrubber height, so that effective scrubber height is not significantly affected. Based on Table 1, the maximum flow rate of 0.75 L/s gives 66.7% of the minimum flow rate. Pressure drop measurements The pressure drop across a scrubbing system is an important parameter in evaluating wet scrubber operation. Pressure drop is a measurement of the resistance to flow as the flue gas passes from one point to another. The resistance to flow is caused by turbulence, arrangement of internals, and scrubbing liquid flow. The pressure drop increased by increasing inlet gas flow rate (Ug). The pressure drop of wet scrubber stage 1 was high because of the high gas flow rate, while in the wet scrubber stage 2 the pressure was low as shown in Figure 10. This is because the flow rate of the gas was reduced by resistance caused by scrubbing liquid in wet scrubber Stage 1, and also due to removal of particulate
Said et al. 279
Qin(l/s)
0.0 0.2 0.4 0.6 0.8 1.0
Qin (l/s)
0.0 0.2 0.4 0.6 0.8 1.0
Qin (l/s)
0.0 0.2 0.4 0.6 0.8 1.0
Acc.
level
(cm
)/A
cc.
rate
(l/
s)
0
200
400
600
800
1000
Ug = 4 m/s
Ug = 5 m/sUg = 6 m/s
Qin (l/s)
0.0 0.2 0.4 0.6 0.8 1.0
Acc. le
vel
(cm
)/A
cc. ra
te (
l/s)
0
200
400
600
800
1000
Ug = 8 m/s
Qin (l/s)
0.0 0.2 0.4 0.6 0.8 1.0
Ug = 10 m/s
Qin (l/s)
0.0 0.2 0.4 0.6 0.8 1.0
Ug = 12 m/s
Qin (l/s)
0.0 0.2 0.4 0.6 0.8 1.0
Acc. le
vel (c
m)/
Acc. ra
te (
l/s)
0
200
400
600
800
1000
Ug = 14 m/s
Qin (l/s)
0.2 0.3 0.4 0.5 0.6 0.7 0.8 0.9 1.0
Ug = 15 m/s
Qin (l/s)
0.2 0.3 0.4 0.5 0.6 0.7 0.8 0.9 1.0
Ug = 16 m/s
Qin(l/s)
0.0 0.2 0.4 0.6 0.8 1.0
Qin (l/s)
0.0 0.2 0.4 0.6 0.8 1.0
Qin (l/s)
0.0 0.2 0.4 0.6 0.8 1.0
Acc.
level
(cm
)/A
cc.
rate
(l/
s)
0
200
400
600
800
1000
Ug = 4 m/s
Ug = 5 m/sUg = 6 m/s
Qin (l/s)
0.0 0.2 0.4 0.6 0.8 1.0
Acc.
level
(cm
)/A
cc.
rate
(l/
s)
0
200
400
600
800
1000
Ug = 8 m/s
Qin (l/s)
0.0 0.2 0.4 0.6 0.8 1.0
Ug = 10 m/s
Qin (l/s)
0.0 0.2 0.4 0.6 0.8 1.0
Ug = 12 m/s
Qin (l/s)
0.0 0.2 0.4 0.6 0.8 1.0
Acc. le
vel (c
m)/
Acc. ra
te (
l/s)
0
200
400
600
800
1000
Ug = 14 m/s
Qin (l/s)
0.2 0.3 0.4 0.5 0.6 0.7 0.8 0.9 1.0
Ug = 15 m/s
Qin (l/s)
0.2 0.3 0.4 0.5 0.6 0.7 0.8 0.9 1.0
Ug = 16 m/s
Qin(l/s)
0.0 0.2 0.4 0.6 0.8 1.0
Qin (l/s)
0.0 0.2 0.4 0.6 0.8 1.0
Qin (l/s)
0.0 0.2 0.4 0.6 0.8 1.0
Acc
. le
vel
(cm
)/A
cc.
rate
(l/
s)
0
200
400
600
800
1000
Ug = 4 m/s
Ug = 5 m/sUg = 6 m/s
Qin (l/s)
0.0 0.2 0.4 0.6 0.8 1.0
Acc
. le
vel
(cm
)/A
cc.
rate
(l/
s)
0
200
400
600
800
1000
Ug = 8 m/s
Qin (l/s)
0.0 0.2 0.4 0.6 0.8 1.0
Ug = 10 m/s
Qin (l/s)
0.0 0.2 0.4 0.6 0.8 1.0
Ug = 12 m/s
Qin (l/s)
0.0 0.2 0.4 0.6 0.8 1.0
Acc. le
vel (c
m)/
Acc. ra
te (
l/s)
0
200
400
600
800
1000
Ug = 14 m/s
Qin (l/s)
0.2 0.3 0.4 0.5 0.6 0.7 0.8 0.9 1.0
Ug = 15 m/s
Qin (l/s)
0.2 0.3 0.4 0.5 0.6 0.7 0.8 0.9 1.0
Ug = 16 m/s
Figure 9. Comparison between accumulation level and accumulation rate at different inlet gas flow-rate with different inlet liquid flow rate.
Table 1. Comparison of inlet liquid flow rate with minimum flow rate.
L (L/s) % flow rate above minimum
0.96 380.00
0.9 100.00
0.8 77.78
0.75 66.67
0.65 44.44
0.6 33.33
0.5 11.11
0.45 0.00
280 Educ. Res. Rev.
Ug (m/s)
4 6 8 10 12 14 16 18
Pre
ssu
re d
rop
(k
Pa
)
0
20
40
60
80
Stage 1
Stage 2
Total pressure drop
Figure 10. Pressure drops across the multistage wet scrubber.
matter (fly ashes, soot) and acid gas components. The maximum total pressure drop of the multistage wet scrubber system is the summation of pressure drop in each wet scrubber. For Ug less than 5 m/s, the pressure drop remains constant at about 20 kPa in stage 1 and 0 kPa in stage 2. Beyond 5 m/s, the pressure drop increases linearly with Ug in all cases. Conclusion Proper operation of the scrubber was obtained when scrubbing liquid was retained in the scrubber. The operating range of the inlet liquid flow rate was 0.45 to 0.75 L/s. As the gas was applied to the scrubber, the liquid level was retained at a certain level depending on the gas flow rate. The liquid level retained in the wet scrubber when the gas was not applied to the wet scrubbers increased linearly with inlet liquid flow-rate. On the other hand, if the gas applied was below 10 m/s the liquid accumulation started when the inlet liquid was 0.45 L/s, while if the gas applied was above 10 m/s, the liquid accumulation started when inlet liquid was 0.53 L/s. Initially, accumulation was increasing with the inlet liquid flow rate, but after 0.11 m of accumulation level, the liquid level did not increase further. This was caused by the shape of the scrubber bottom. The pressure is an indicator of wet scrubber performance because wet scrubber particulate collection increases as power input (pressure drop) increases, therefore by applying maximum pressure drop obtained (75 kPa), the particulate collection can be enhanced, on the other hand the cost of operating the system increases because more
power is required. ACKNOWLEDGEMENT The authors are grateful for the financial support from the University of Dar es Salaam. Abbreviations: Q/G, Liquid-to-gas ratio (L/m
3); dQ, rate
of liquid accumulation in the wet scrubber; G, gas flow rate (m
3/s); Ha, liquid accumulation level in the wet
scrubber (m); Ha/He, ratio of accumulation level to total height of the wet scrubber (-); He, effective wet scrubber height (m); Ht, total scrubber height (m); P, pressure reading (Pa); Q, liquid flow rate (L/s), Qin, liquid flow rate into a wet scrubber; Qo, outlet liquid flow rate from wet scrubber; Ug, gas velocity (m/s); X, mole ratio of the solute in the liquid (-); X1, mole ratio of the solute in the exiting or spent liquid (-); X2, mole ratio of the solute in
the inlet liquid (-); P, pressure drop (Pa); Pstg(1-2), pressure drop across the wet scrubber cascade (Pa);
Pstg1, pressure drop across wet scrubber Stage 1;
Pstg2, pressure drop across wet scrubber Stage 2.
REFERENCES
Bhatia MV (1977). Packed tower and absorption design. In PN
Cheremisinoff and RA Young (Eds.), Air Pollution Control and Design
Handbook. New York: Marcel Dekker. Calvert S, Goldschmid J, Leith D, Mehta D (1972). Wet Scrubber
System Study. Vol. 1, Scrubber Handbook. EPA-R2-72-118a. U.S.
Environmental Protection Agency.
Chatterjee IB, Joshi JB (2008). Modeling, Simulation and Optimization:
Mono Pressure Nitric Acid Process. Chem. Eng. J., 138(1-3): 556- 577.
Diab YS, Maddox RN (1982). Absorption. Chem. Eng., 89: 38-56. Horikawa MS, Rossi F, Gimenes ML Costa CMM da Silva MGC (2004).
Chemical Absorption of H2S for Biogas Purification. Br. J. Chem.
Eng., 21(3): 415-422. Huttenhuis PJG, Agrawal NJ, Hogendoorn JA, Versteeg GF (2007). Gas
Solubility of H2S and CO2 in Aqueous Solutions of N-
Methyldiethanolamine. J. Petrol. Sci. Eng., 55(1-2): 122-134. Joseph G, Beachler D (1998). Scrubber Systems Operation Review.
North Carolina State University, USA.
Kaewischan L, Al-Bofewrsen O, Yesavage VF, Selim MS (2001). Prediction of the Solubility of acid Gases in Monoethanolamine (MEA) and Methyldiethanolamine (DMEA) Solutions. Fluid Phase
Equilibria, 183/184: 159-171. Lee C, Lin S (2000). Hand Book of Environmental Engineering
Calculations. Macgraw Hill, New York.
Manyele SV (2008). Toxic Acid Gas Absorber Design Considerations for Air Pollution Control in Process Industries. Educ. Res. Rev., 3(4): 137-147.
Mukherjee S, Das SK, Biswas MN (2007). Absorption of Carbon Disulphide in Alkaline Solution in Spray and Ejector Columns. Chem. Eng. Process., 46(3): 175.
Perry R, Green D (1995). Chemical Engineering Handbook. New York, Mcgraw Hill.
Pevy S, Rowe D, Tchobanoglous G (1985). Environmental Engineering.
Macgraw – Hill, New York.
Said et al. 281 Peytavy JL, Huor MH, Bugarel R, Laurent A (1990). Interfacial area and
gas-side mass transfer coefficient of a gas—liquid absorption column: pilot-scale comparison of various tray types. Chem. Eng. Process.,
27(3): 155-163. Richards JR (1995). Control of Particulate Emissions. (APTI Course 413
and 415). U.S. Environmental Protection Agency.
Rubin ES, Yeh S, Hounsell DA, Taylor MR (2004). Experience curves for power plant emission control technologies. Int. J. Energy Techno. Policy, 2(1/2): 52-59.
Semrau K (1977). Practical Process design of Particulate Scrubber. Chem. Eng. New York, pp. 84-91.
Takaoka M, Takeda N, Takeshi Fujiwara T, Kurata M, Kimura T (2002).
Control of mercury emissions from a municipal solid waste incinerator in Japan. J. Air Waste Manage. Assoc., (Technical Paper), August, 2002, http://www.entrepreneur.com/
tradejournals/article/90749833_3.html. Zenz FA (1972). Designing gas absorption towers. Chem. Eng., 79:
120-138.


