Embed Size (px)
Citation preview

ORGANISATIONAL SETUP OF CGWB: The Central Ground Water Board is headed by theChairman and has four main wings namely ,1)Exploratory Drilling & Material Management 2) Sustainable Management & Liaison 3) Survey, Assessment & Monitoring and 4) Training and Technology Transfer. Each wing is headed by aMember. The administrative & financial matters of the Board are beingdealt with by the Director (Administration) and Finance &Accounts Officer (FAO) respectively.The Exploratory Drilling & Materials Management wing isresponsible for the drilling and construction of Exploratoryand other type of boreholes required for ground waterexploration including monitoring of stores, consumption andinventory for efficient and economic machine utilization,purchase action in respect of drilling equipment, vehicles,instruments etc. The Sustainable Management and Liaison winglooks after sustainable management of ground water relatedpolicies, issues etc., augmentation of ground water resourcesincluding artificial recharge and monitoring of artificialrecharge studies, urban ground water management, storage andretrieval etc. The Survey, Assessment & Monitoring Wing ofCentral Ground Water Board is vested with the responsibilitiesfor undertaking Ground Water Management Studies, work relatedto monitoring ofground water regime and development, conjunctive use ofsurface and ground water, Aquifer mapping and assessment ofaquifer characteristics based on exploration and surveys,Hydro chemical analyses and studies, pollution studies, shortterm water supply investigations, drought management, datacollection, special studies, preparation of various Hydrogeological maps, Atlases, Master plans, State reports,District reports, etc. The Training and Technology TransferWing is vested with the responsibility of imparting trainingat different levels to entrepreneurs, professionals andadministrators concerned with ground water development andmanagement. The wing is also responsible for formulation ofoverall training policy, assessment of training needs,conceptualization of the training modules and the programme
implementation strategy etc for the organization .Forundertaking the activities in field, 18 Regional Offices, eachheaded by a Regional Director, have been established in thecountry. 11 State Unit Offices have also been established inthose states having large geographical area for bettermanagement of field activities. 17 Divisional offices handlethe exploratory drilling and related activities, each headedby an Executive Engineer. Both the State Unit offices andDivisional Offices work under the overall administrativecontrol of the respective Regional offices. The Board hasabout 500 Scientists, 200 Engineers; and about 3500 technical&administrative/ministerial supporting staff. The Board has afleet of 88 drilling rigs (34Direct Rotary,41 Down the Holeand 13 Percussion Combination types) for taking up drillingoperations.
Central Ground Water BoardCentral Ground Water Board (CGWB), a subordinate office of theMinistry of Water Resources, Government of India, is theNational Apex Agency entrusted with the responsibilities ofproviding scientific inputs for management, exploration,monitoring, assessment, augmentation and regulation of groundwater resources of the country. Central Ground Water Board wasestablished in 1970 by renaming the Exploratory Tube wellsOrganization under the Ministry of Agriculture, Government ofIndia. It was merged with the Ground Water Wing of theGeological Survey of India during 1972.Central Ground WaterBoard is a multi-disciplinary scientific organizationconsisting of Hydro geologists, Geophysicists, Chemists,Hydrologists, Hydro meteorologists and Engineers and has itsheadquarters at BHUJAL BHAWAN, NH 4, Faridabad, Haryana. It isheaded by the Chairman and has four main wings, namely (i)Sustainable Management & Liaison (SML), (ii)Survey, Assessment& Monitoring (SAM), (iii) Exploratory Drilling & MaterialsManagement (ED&MM) and (iv) Water Quality & Training andTechnology Transfer (WQ&TT). Each wing is headed by a Member.The administrative & financial matters of the Board are beingdealt with by the Director (Administration) and Finance &Accounts Officer (FAO) respectively. The Board has 18 Regionaloffices, each headed by a Regional Director, supported by 17Engineering Divisions and 11 State Unit Offices forundertaking various field activities. The Rajiv GandhiNational Ground Water Training & Research Institute
(RGNGT&RI), which coordinates the capacity building activitiesof the Board functions from the C GWB, Raipur. Variousactivities related to regulation of ground water developmentin the country are being looked after by the Central GroundWater Authority (C GWA), constituted under the Environmental(Protection) Act, 1986.Major activities being taken up byCentral Ground Water Board include macro/micro-level groundwater management studies, exploratory drilling programme,monitoring of ground water levels and water quality through anetwork of ground water observation wells comprising bothlarge diameter open wells and purpose-built bore/tube wells(piezometers), implementation of demonstrative schemes forartificial recharge and rainwater harvesting for rechargeaugmentation. Periodic assessment of replenishable groundwater resources of the country is carried out by the Boardjointly with the concerned State Government agencies.Geophysical studies, remote sensing & GIS studies and groundwater modeling studies are taken up to supplement theseactivities. The Board also takes up special studies on variousaspects of ground water sector such as ground water depletion,seawater ingress, ground water contamination, conjunctiveuse of surface & ground water, water balance etc. It alsoorganizes various capacity building activities for personnelof its own as well as Central/State Government organizationsengaged in various activities in ground water sector as wellas mass awareness campaigns on the importance of waterconservation and judicious ground water management. The datagenerated from various studies taken up by C GWB provide ascientific base for water resource planning by stakeholders.Besides advising states and other user agencies on planningand management of ground water resources, Central Ground WaterBoard also provides technical know-how for scientific groundwater exploration, development and management to variousstakeholders. The Board regularly publishes scientific reportsbased on the data generated through various investigations fordissemination to the stakeholders. These include State andDistrict hydro geological reports, ground water year books andAtlases, ground water user maps and guides/manuals/pamphletson various aspects of ground water management. Central GroundWater Authority (C GWA) was constituted under sub-section (3)of Section 3 of the Environment (Protection) Act, 1986 for thepurposes of regulation and control of ground water development
and management in the country. The Authority is engaged invarious activities related to regulation of ground waterdevelopment to ensure its long-term sustainability.
INTRODUCTION Ground water is one of the primaryresources to meet the water requirements of our country. It isof vital importance for sustaining life, health & agriculture.However the distribution of availability of ground waterresources across the country is uneven. Tamil Nadu, the sixthmost populous state in India is a water stressed state. Thetotal population of the state as per 2011 Census is 7, 21,38,958, of which 62 percent of the people are engaged inagriculture. Tamil Nadu state, the southernmost state in theIndian Union, lies between N Latitudes 08°00’ and 13°30’ andE. Longitudes 76°14’ and 80°18’. The state is bounded by Bayof Bengal in the east, the Indian Ocean in the south and thestates of Kerala, Karnataka and Andhra Pradesh in the west,north west and north respectively with a geographical extentof 1,30,060 sq.km. It has a shoreline of about 1000 km. Foradministrative purposes, Tamil Nadu state is divided into 32districts. These districts are divided into 220 taluks, whichare further divided into 386 developmental blocks. These aresubdivided into Panchayats representing the constituentRevenue villages and hamlets.The Tamil Nadu state is underlainby diverse hydrogeological formations, nearly 73% of the stateis occupied by hard rocks, the semi consolidated andconsolidated formations are mainly confined in the easternpart which is the coastal tract. In the hard rock area,groundwater is mainly developed through dug wells and dug cumbore wells tapping the weathered zone, the yield of open wells
vary from 1 – 3 lps, whereas in dug wells tapping soft rocksincluding sedimentary formations, the yield is up to 5 lps.Dynamic ground water resources have been assessed block-wiseand during the recent resources estimation (2009), the AnnualReplenishable Ground Water Resource of the state has beenestimated as 22.94 bcm and Net Annual Ground WaterAvailability is 20.65 bcm. The Annual Ground Water Draft is16.56 bcm and Stage of Ground Water Development is 80% leavinglimited scope for further development of the dynamic groundwater resources. Out of 386 assessment units (blocks), 139have been categorized as Over-exploited, 33 as Critical, 67 asSemi-critical, 136 as Safe and 11 as Saline. Larger groundwater development is noticed in the Central part of the Stateand it is brought out in the category map showingconcentration of Overexploited and Critical block in a linearpattern extending along NE-SW direction in the Central part ofthe State. There has been about 6% decrease in the estimatesof ground water draft in 2009 as compared to 2004. This isattributed to reduction in irrigation draft due tourbanization in some areas and reduction in usage of dugwellsfor domestic use. Further, recharge has enhanced in some areasbecause of increase in normal rainfall and enhanced activityof water conservation and canal irrigation. The increasingstress on the limited ground water resources calls forimmediate action for sustainable ground water resourcemanagement in the State. Groundwater resources availablewithin aquifers needs to be sustainably managed with acombination of reasonable scientific knowledge, adequatemonitoring and sustained political commitment and provisionsfor institutional arrangements. Considering the complexity ofthe ground water regime and the intrinsic variability ofground water systems and socio-economic situations, no singleapproach can fully relieve pressures on its groundwaterresources. Incremental improvements in resource management andprotection can, however, be achieved through suitable means.The added uncertainty of global environmental and climatechange reinforces the need for sound resource management andfor providing additional social and political impetus forscientific management interventions. Groundwater also needs tobe considered as part of an integrated water resourcesmanagement approach that co-ordinates land and water resourcesmanagement,recognises water quantity and quality linkages,
manages surface water and groundwater resources conjunctivelyand protects and restoresnatural systems. This integrated approach presents newchallenges for groundwater management such as the need forbetter understanding of the effects on groundwater rechargequantity and quality of various ground water systems and manyother issues.It is in this context that systematic mapping of aquifersystems assumes great relevance in a State. Aquifer mapping isa scientific process wherein a combination of geologic,geophysical, hydrologic, and chemical field and laboratoryanalyses are applied to characterize the quantity, quality,and “sustainability” of ground water in aquifers. Theobjective of aquifer mapping is to provide critically neededinformation on the State’s ground water for planning itssustainable development. The products of aquifer mappingstudies improve our understanding of the geologic framework ofaquifers, their hydrologic characteristics, water levels inthe aquifers and how they change over time, and the occurrenceof natural and anthropogenic contaminants that affect thequality of ground water. Results of aquifer mapping cansignificantly contribute to resource management tools such aslong-term aquifer monitoring networks and conceptual andquantitative regional groundwater-flow models besides helpingplanners, policy makers and other stakeholders in takingscientifically defensible decisions. The present aquifer mapping at Regional scale(1:250,000) forms the foundation for assessment of groundwateravailability. The primary issues affecting groundwateravailability vary from location to location and commonlyrequire analysis in the context of groundwater flow systems toachieve any purposeful meaning. With this principle in mind,the studies of water balance can be taken up involving all theinput and output components – rainfall, evaporation,evapotranspiration, soil moisture balance, groundwaterrecharge through rainfall, groundwater extraction,canalseepage, irrigation, water bodies and river-aquiferinteraction etc. Multiple techniques including physical,chemical/tracer and numerical modelling approach can be usedfor simulating groundwater conditions and to develop aquifermanagement plans for optimal utilization of groundwaterresources.
The aquifer mapping is of due importancein the XII five year plan. As an initiative, considering thegeological and hydrologic properties of the wide array ofgeological formations in the state, 12 principal aquifersystems have been delineated at 1:250,000 scale. This formsthe base for aquifer mapping at 1: 50,000 scale. With furtherinputs from the detailed Hydrogeological studies (aquifermapping studies) in the 12th year plan, aquifer mapping can bedone at cadastral level. Thus after a period of time, we shallhave the status on water availability both surface and groundwater and its demand at cadastral level i.e., in village wiseinformation. This will be useful in planning/tackling atvillage wise. The inputs on the groundwater pollution due tonatural and anthropogenic needs to be identified at cadastrallevel. The Atlas of aquifer mapping for the state of Tamilnaduand UT of Puducherry has enabled to have a base and toidentify the data gaps, delineate the vulnerable areas anddemarcate areas which may attract government intervention.
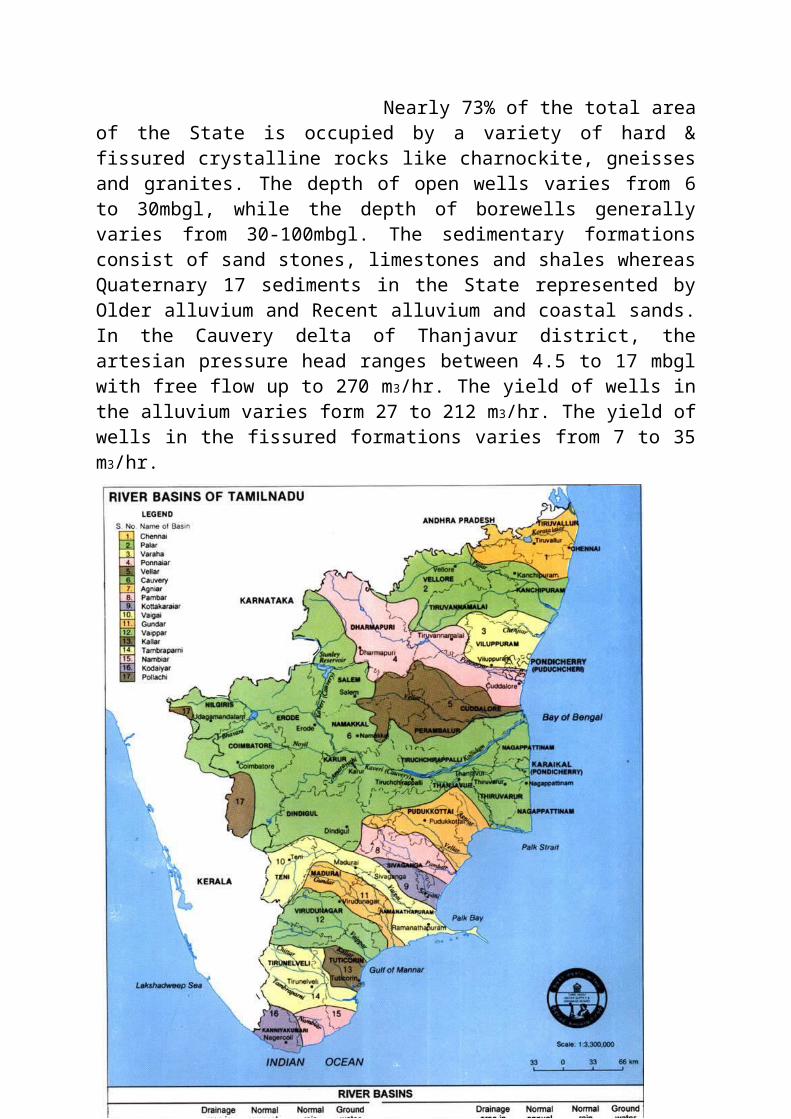
Map of Tamil Nadu:

STATE PROFILE: Tamil Nadu State is situated at theSouth-eastern extremity of the Indian peninsulabounded on the north by Karnataka and Andhra Pradesh,in the East by Bay of Bengal, in the South by IndianOcean and in the West by Kerala State. It has acoastal line of 922 km and a land boundary of 1200km. It lies between 8.5’ and 13.35’ at northernlatitude and 76.15’ and 80.20’ of eastern longitudewith an area of 1,30,069 sq.km. (50,154.7 sq. miles).
Districts 31 Revenue Divisions 74 Taluks 208 Firkas 1120 Revenue Villages Revenue Department Statistics Department(T.R.S)
16563 17292
PHYSICAL FEATURES: The State is divided broadly into two naturaldivision ie., (a) the coastal plains and (b) thehilly western areas. It is further divided intoCoromandal plains comprising of the districts ofKancheepuram, Tiruvallur, Cuddalore, Villupuram,Vellore and Thiruvannamalai and alluvial plains ofCauvery delta extending over Thanjavur, Nagapattinam,Thiruvarur and part of Trichy and dry southern plainsin Madurai, Ramanathapuram, Sivaganga, Virudunagar,Thoothukudi and Tirunelveli districts.It also extends a little in Western Ghats inKanyakumari District. The Western Ghats averaging3000’ to 8000’ height runs along the western partwith the hill groups of Nilgiris and Anamalais oneither side of it. Palani hills, Varashanad andAndipatti ranges are the major off-shoots of Ghats.The other prominent hills comprise of Javadhu,Shervarayan, Kalrayans and Pachai Malais. These
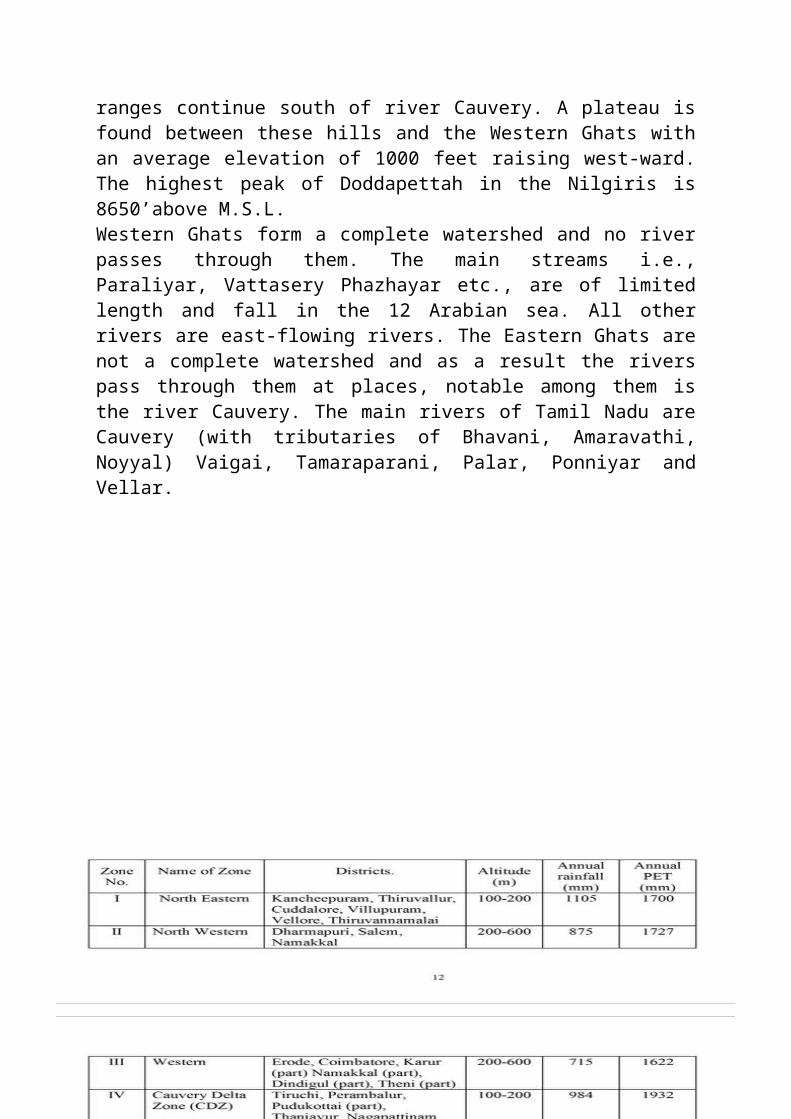
ranges continue south of river Cauvery. A plateau isfound between these hills and the Western Ghats withan average elevation of 1000 feet raising west-ward.The highest peak of Doddapettah in the Nilgiris is8650’above M.S.L.Western Ghats form a complete watershed and no riverpasses through them. The main streams i.e.,Paraliyar, Vattasery Phazhayar etc., are of limitedlength and fall in the 12 Arabian sea. All otherrivers are east-flowing rivers. The Eastern Ghats arenot a complete watershed and as a result the riverspass through them at places, notable among them isthe river Cauvery. The main rivers of Tamil Nadu areCauvery (with tributaries of Bhavani, Amaravathi,Noyyal) Vaigai, Tamaraparani, Palar, Ponniyar andVellar.
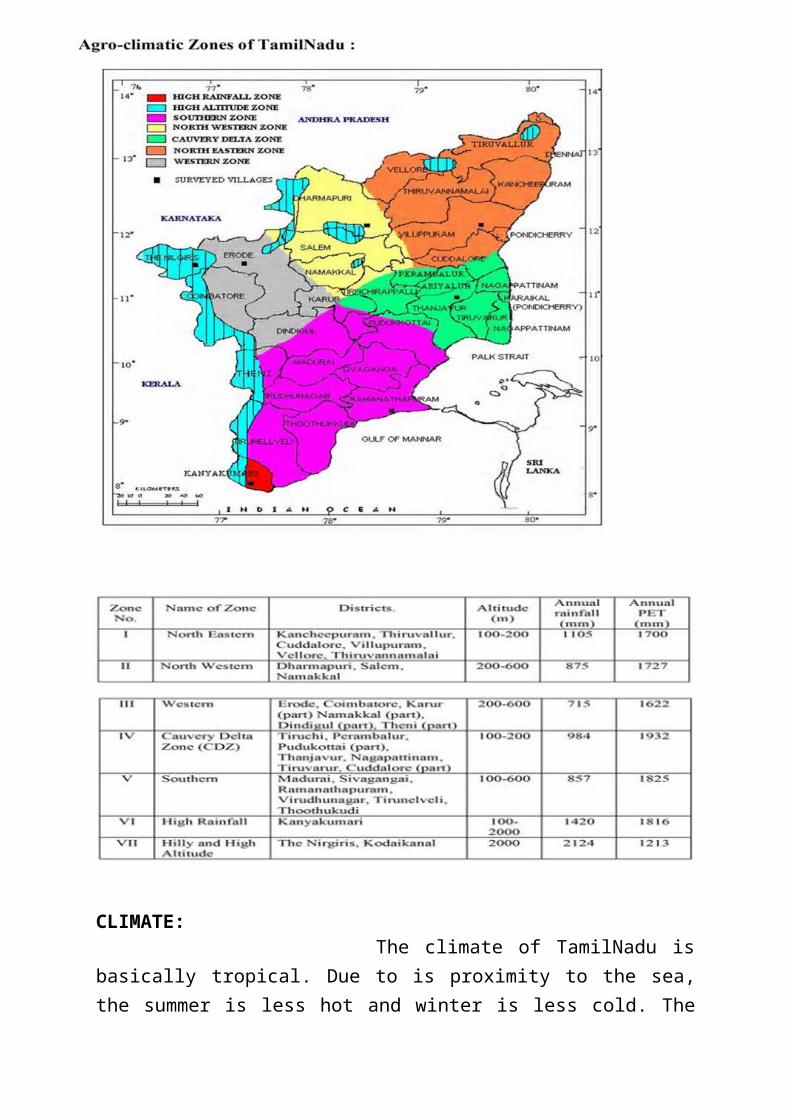
CLIMATE: The climate of TamilNadu isbasically tropical. Due to is proximity to the sea,the summer is less hot and winter is less cold. The

maximum daily temperature rarely exceeds 43’C and theminimum daily temperature seldom falls below 18’C.
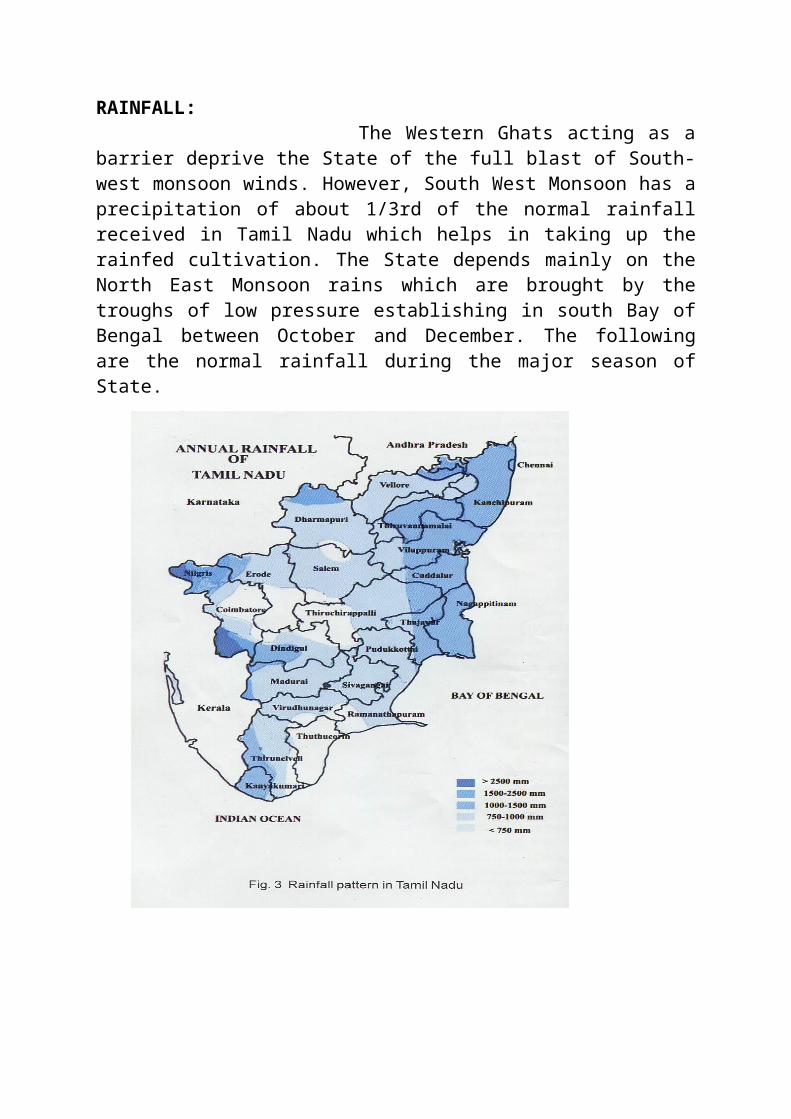
RAINFALL: The Western Ghats acting as abarrier deprive the State of the full blast of South-west monsoon winds. However, South West Monsoon has aprecipitation of about 1/3rd of the normal rainfallreceived in Tamil Nadu which helps in taking up therainfed cultivation. The State depends mainly on theNorth East Monsoon rains which are brought by thetroughs of low pressure establishing in south Bay ofBengal between October and December. The followingare the normal rainfall during the major season ofState.

Place Rainfall in mm
Population Availabilityof water / person / year in m3
Tamilnadu 911 62.5 million
800
India 1150 1.0 billion 2200 World 840 6 billion 7000
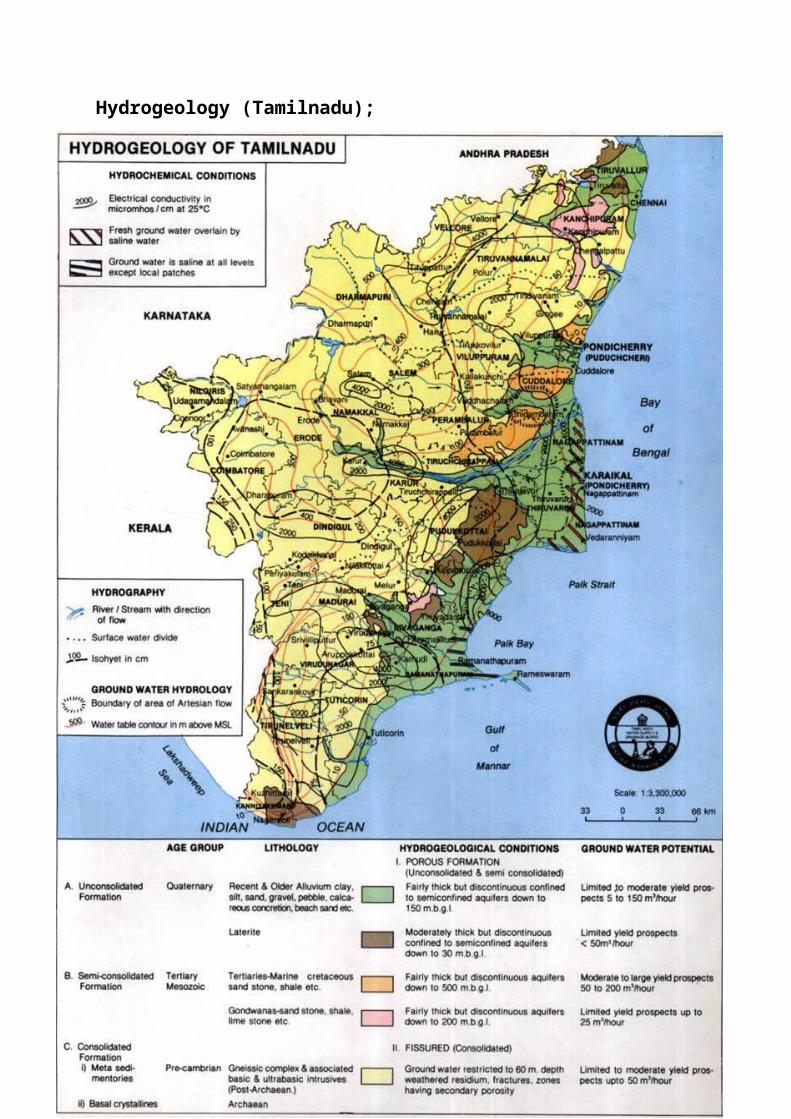
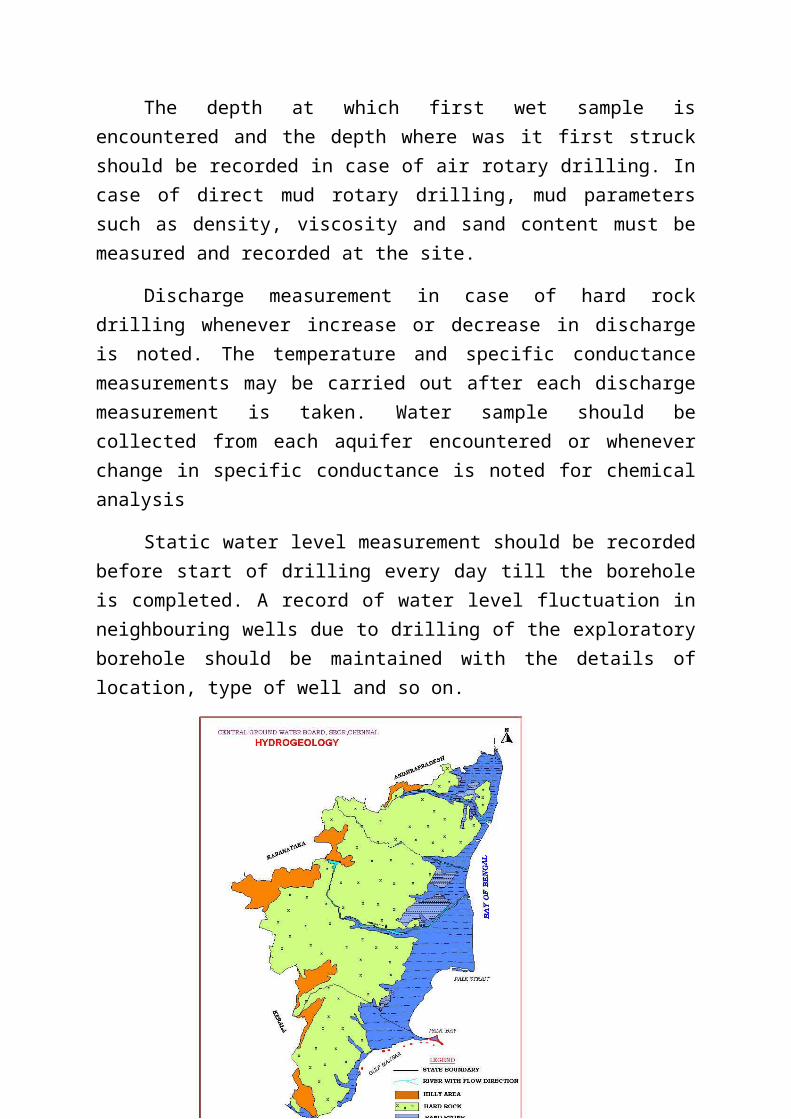
Hydrogeology (Tamilnadu);
Nearly 73% of the total areaof the State is occupied by a variety of hard &fissured crystalline rocks like charnockite, gneissesand granites. The depth of open wells varies from 6to 30mbgl, while the depth of borewells generallyvaries from 30-100mbgl. The sedimentary formationsconsist of sand stones, limestones and shales whereasQuaternary 17 sediments in the State represented byOlder alluvium and Recent alluvium and coastal sands.In the Cauvery delta of Thanjavur district, theartesian pressure head ranges between 4.5 to 17 mbglwith free flow up to 270 m3/hr. The yield of wells inthe alluvium varies form 27 to 212 m3/hr. The yield ofwells in the fissured formations varies from 7 to 35m3/hr.
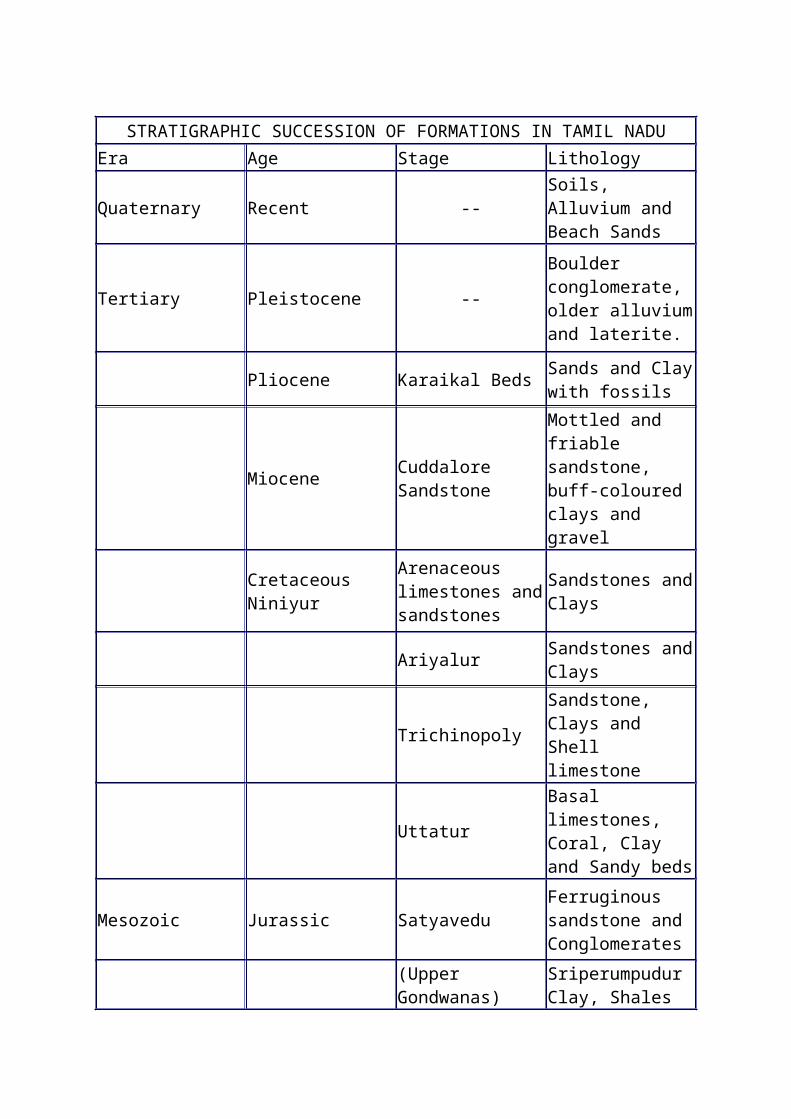
STRATIGRAPHIC SUCCESSION OF FORMATIONS IN TAMIL NADU
Era Age Stage Lithology
Quaternary Recent --Soils, Alluvium and Beach Sands
Tertiary Pleistocene --
Boulder conglomerate, older alluviumand laterite.
Pliocene Karaikal Beds Sands and Claywith fossils
Miocene Cuddalore Sandstone
Mottled and friable sandstone, buff-coloured clays and gravel
Cretaceous Niniyur
Arenaceous limestones andsandstones
Sandstones andClays
Ariyalur Sandstones andClays
Trichinopoly
Sandstone, Clays and Shell limestone
Uttatur
Basal limestones, Coral, Clay and Sandy beds
Mesozoic Jurassic SatyaveduFerruginous sandstone and Conglomerates
(Upper Gondwanas)
Sriperumpudur Clay, Shales

and Felspathicsandstones
UNCONFORMITY
Archaean Archaean
Gneissic complex, and Associated intrusives
Charnockite, Granite basic and Ultrabasic

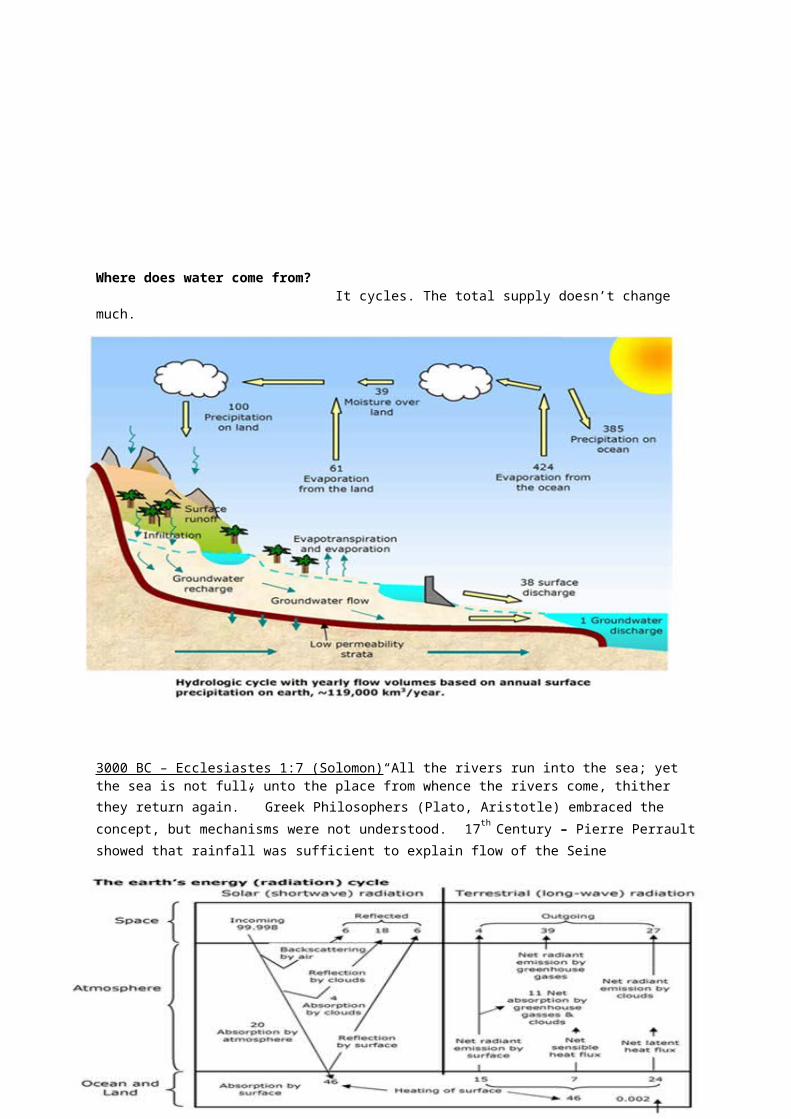
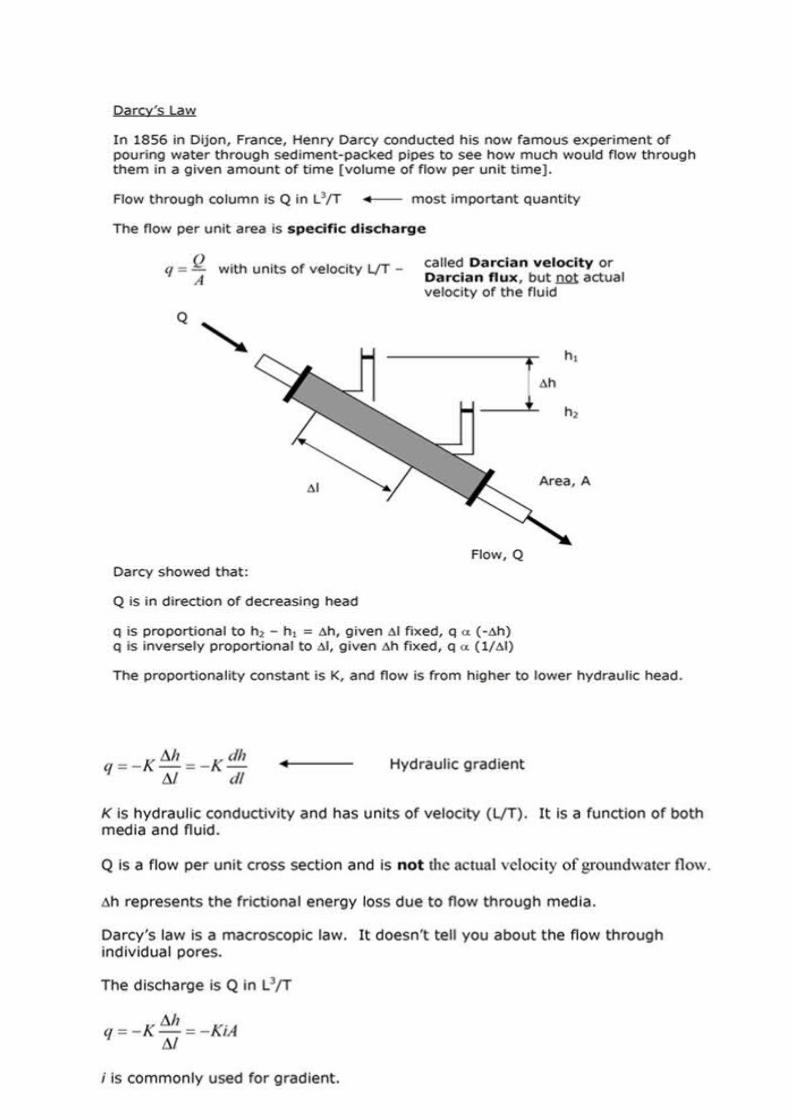
Where does water come from? It cycles. The total supply doesn’t change much.
3000 BC – Ecclesiastes 1:7 (Solomon)“All the rivers run into the sea; yet the sea is not full; unto the place from whence the rivers come, thither they return again.” Greek Philosophers (Plato, Aristotle) embraced the concept, but mechanisms were not understood. 17th Century – Pierre Perraultshowed that rainfall was sufficient to explain flow of the Seine
Hydrogeology (HG) Hydro = water Geology = the study of the Earth HG that deals with the distribution & movement of groundwater (GW) in the soil & rocks of the Earth's crust, (commonly in aquifers).
Origin of Groundwater:The origin of groundwater is primarily one of thefollowing: Groundwater derived from rainfall and infiltrationwithin the normal hydrological cycle. This kind ofwater is called meteoric water. The name impliesrecent contact with the atmosphere. Groundwater encountered at great depths insedimentary rocks as a result of water having beentrapped in marine sediments at the time of theirdeposition. This type of groundwater is referred to
as connate waters. These waters are normally saline.It is accepted that connate water is derived mainlyor entirely from entrapped sea water as original seawater has moved from its original place. Some trappedwater may be brackish. Fossil water if fresh may be originated from thefact of climate change phenomenon, i.e., some areasused to have wet weather and the aquifers of thatarea were recharged and then the weather of that areabecomes dry.
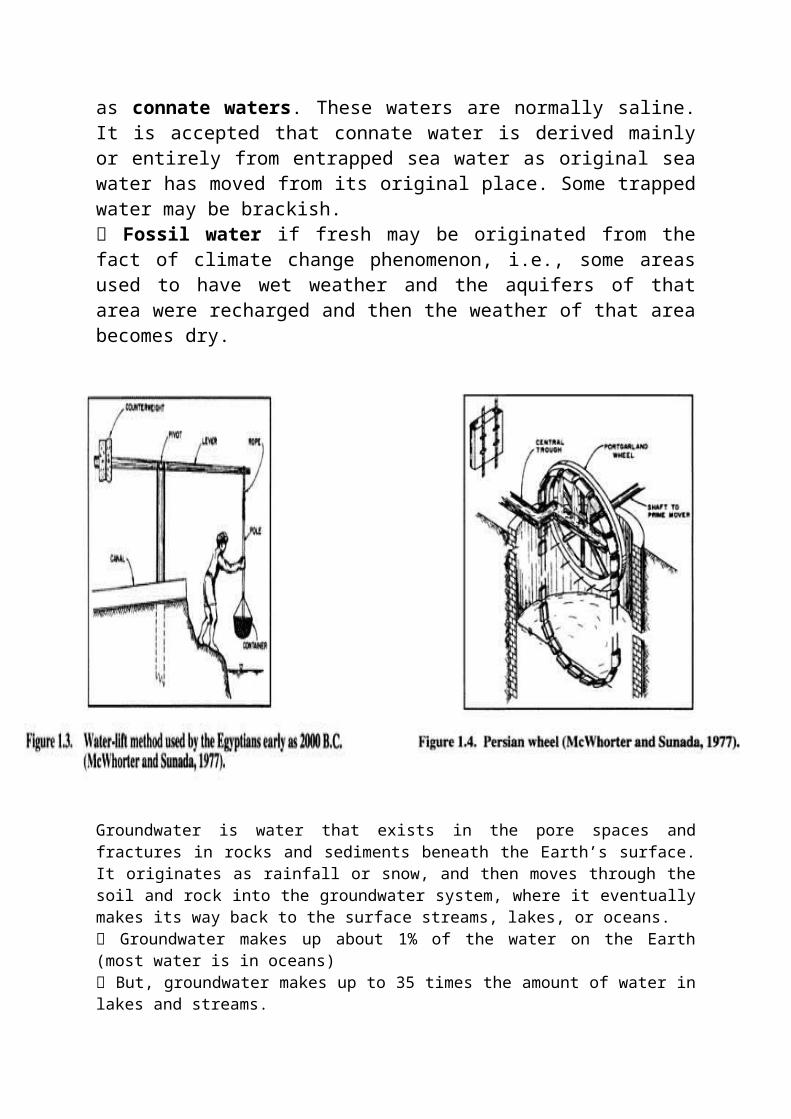
Groundwater is water that exists in the pore spaces andfractures in rocks and sediments beneath the Earth’s surface.It originates as rainfall or snow, and then moves through thesoil and rock into the groundwater system, where it eventuallymakes its way back to the surface streams, lakes, or oceans. Groundwater makes up about 1% of the water on the Earth(most water is in oceans) But, groundwater makes up to 35 times the amount of water inlakes and streams.
Groundwater occurs everywhere beneath the Earth’s surface,but is usually restricted todepth less than about 750 meters. The volume of groundwater is equivalent to a 55-meter thicklayer spread out over theentire surface of the Earth.
Sciences Involved: Hydrology is a very broad subject and it needs support
from allied sciences such as Physics, Mathematics, Geology, Geography, Meteorology, Forestry, Agriculture and Hydraulics.
Hydrology: Hydrology is the science of the waters of the earth and
its atmosphere. Deals Occurrence Circulation Distribution and Movements of these waters over the globe and their
interaction with the physical and biologicalenvironments.
Need for the Hydrologic Studies: The need of the hydrologic studies arises from the
following problems: Uncertainty of precipitation and its seasonal
occurrence Seasonal flow of rivers, and Population growth and rising standards of living
Necessary because of the Increased population and Rising standards of living have greatly increased Hydrologic studies are of utmost importance for
planning and development of water resources to meetthese demands.
General Perspective on the Hydrosphere
Major Hydrologic Projects: Engineering Hydrology provides hydrologic data
essentially required for a variety of projects, such as: Hydraulic Structures like
Dams, Bridges, Head-works, Spillways and Culverts etc.
Hydroelectric Power Generation Flood Control Projects Irrigation Projects Environmental Pollution Control, and Planning and Execution of Water Resources
Development Projects Prediction and Forecasting of:
Contamination effects on rivers and lakes Contamination propagation in groundwater Effect of drainage on flood flows Environmental impact of water resources projects Environmental impact of deforestation Environmental impact of urbanization Environmental impact of chemical leaks from tanks Environmental impact of global climate change
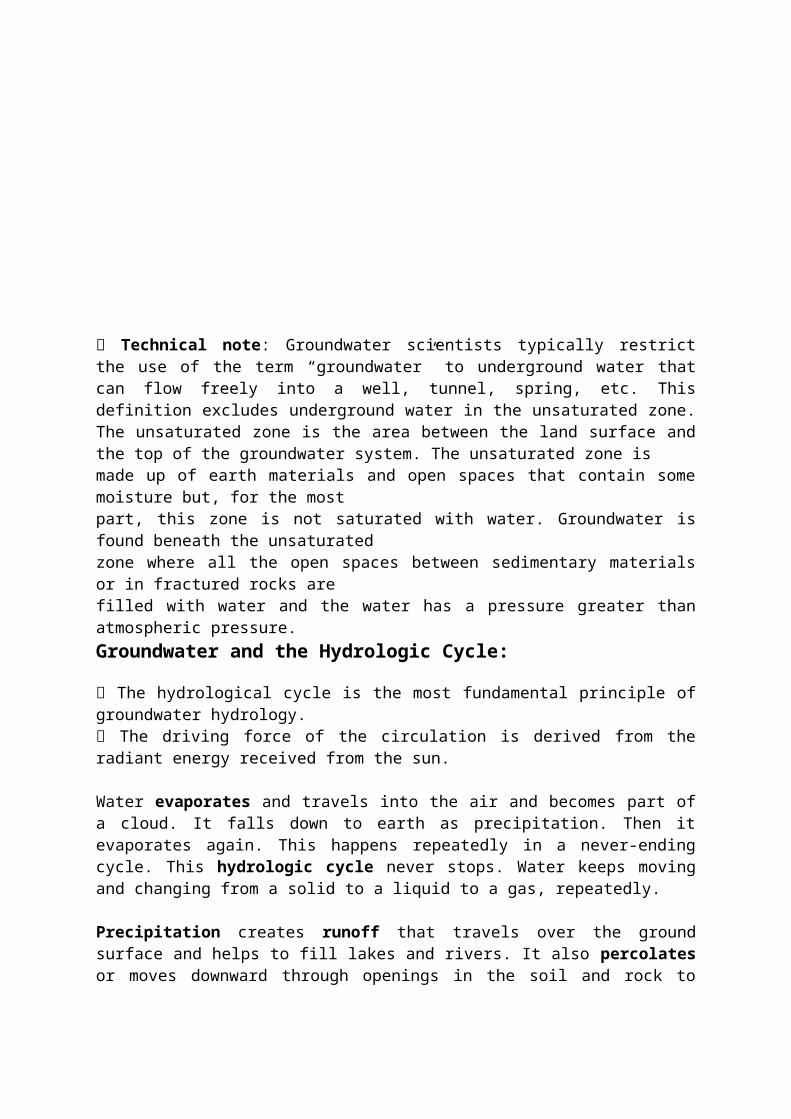
Technical note: Groundwater scientists typically restrictthe use of the term “groundwater” to underground water thatcan flow freely into a well, tunnel, spring, etc. Thisdefinition excludes underground water in the unsaturated zone.The unsaturated zone is the area between the land surface andthe top of the groundwater system. The unsaturated zone ismade up of earth materials and open spaces that contain somemoisture but, for the mostpart, this zone is not saturated with water. Groundwater isfound beneath the unsaturatedzone where all the open spaces between sedimentary materialsor in fractured rocks arefilled with water and the water has a pressure greater thanatmospheric pressure.Groundwater and the Hydrologic Cycle:
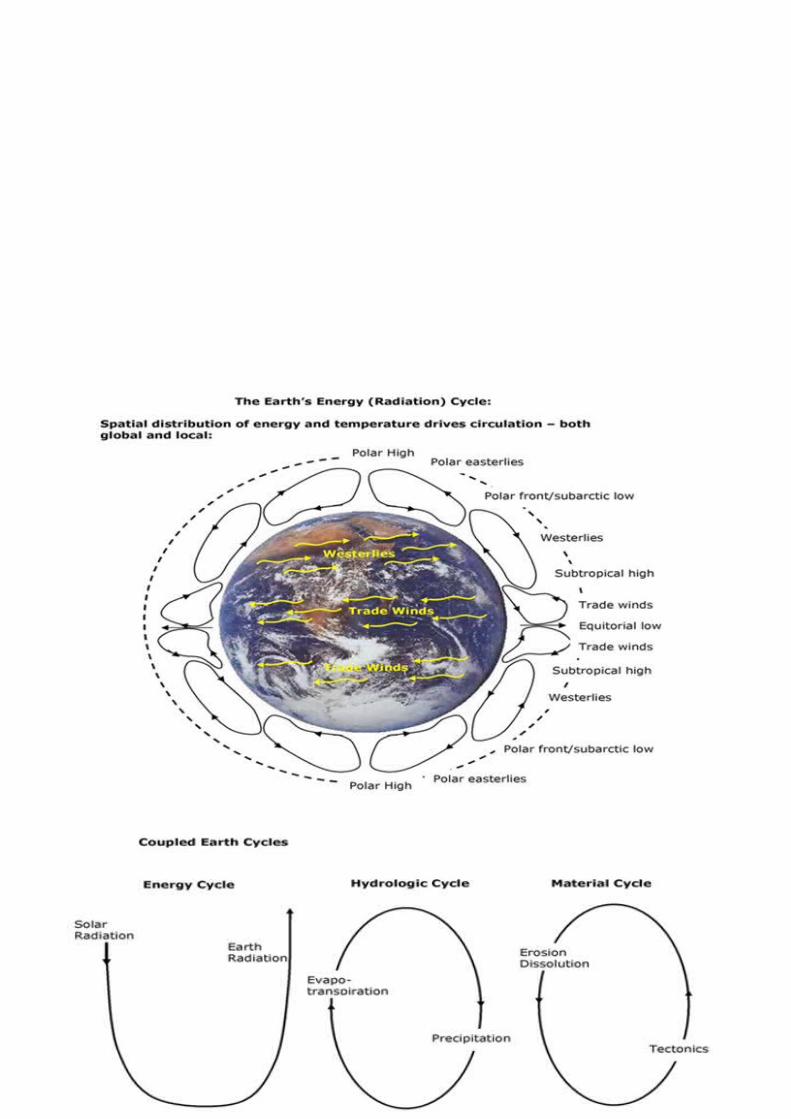
The hydrological cycle is the most fundamental principle ofgroundwater hydrology. The driving force of the circulation is derived from theradiant energy received from the sun.
Water evaporates and travels into the air and becomes part ofa cloud. It falls down to earth as precipitation. Then itevaporates again. This happens repeatedly in a never-endingcycle. This hydrologic cycle never stops. Water keeps movingand changing from a solid to a liquid to a gas, repeatedly.
Precipitation creates runoff that travels over the groundsurface and helps to fill lakes and rivers. It also percolatesor moves downward through openings in the soil and rock to
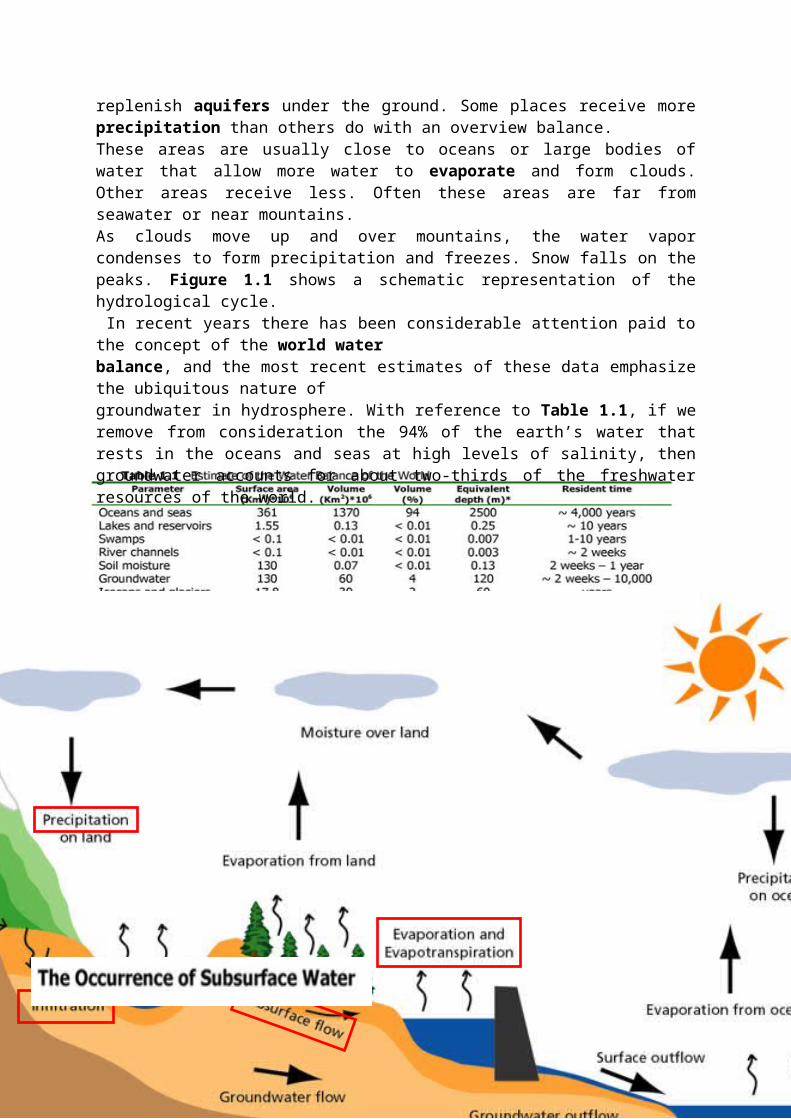
replenish aquifers under the ground. Some places receive moreprecipitation than others do with an overview balance.These areas are usually close to oceans or large bodies ofwater that allow more water to evaporate and form clouds.Other areas receive less. Often these areas are far fromseawater or near mountains.As clouds move up and over mountains, the water vaporcondenses to form precipitation and freezes. Snow falls on thepeaks. Figure 1.1 shows a schematic representation of thehydrological cycle. In recent years there has been considerable attention paid tothe concept of the world waterbalance, and the most recent estimates of these data emphasizethe ubiquitous nature ofgroundwater in hydrosphere. With reference to Table 1.1, if weremove from consideration the 94% of the earth’s water thatrests in the oceans and seas at high levels of salinity, thengroundwater accounts for about two-thirds of the freshwaterresources of the world.
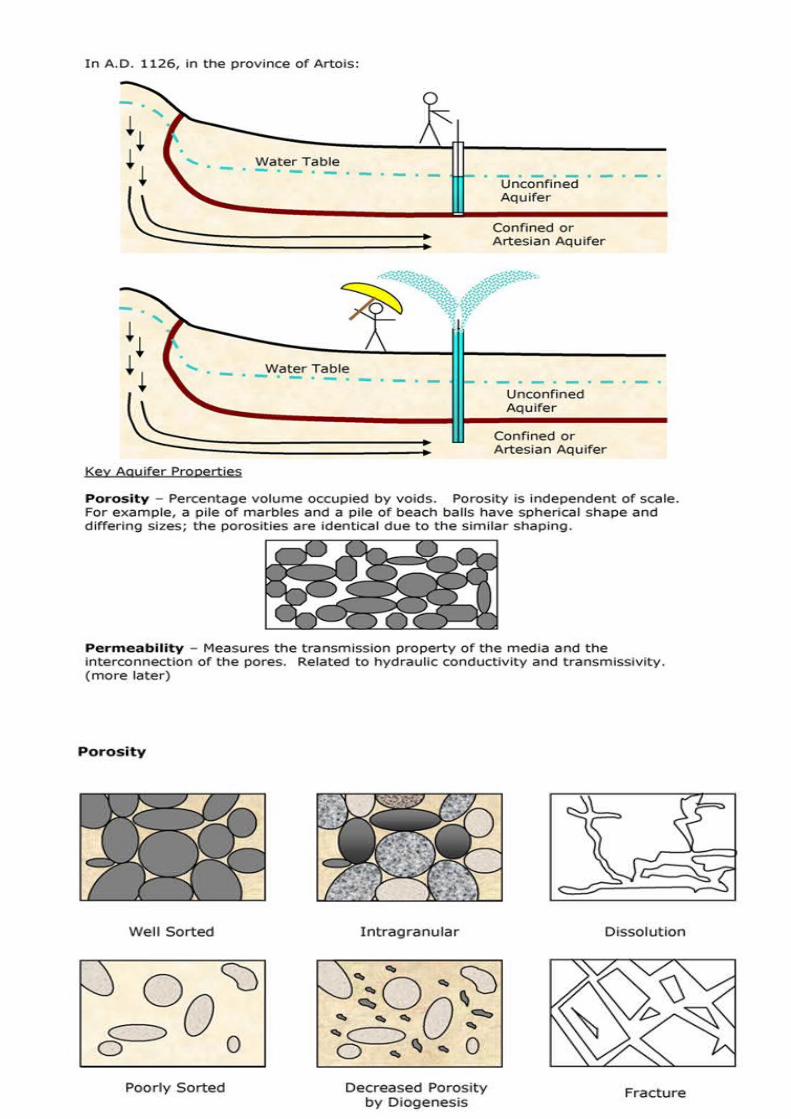
Porosity and Permeability:
• porosity: the percentage of rock or sediment that consists of voids or openings
• permeability: the capacity of a rock to transmit a fluid such as water or petroleum through pores and fractures
• porous: a rock that holds much water
• permeable: a rock that allows water to flow easily through it
• impermeable: a rock that does not allow water to flow through it easily
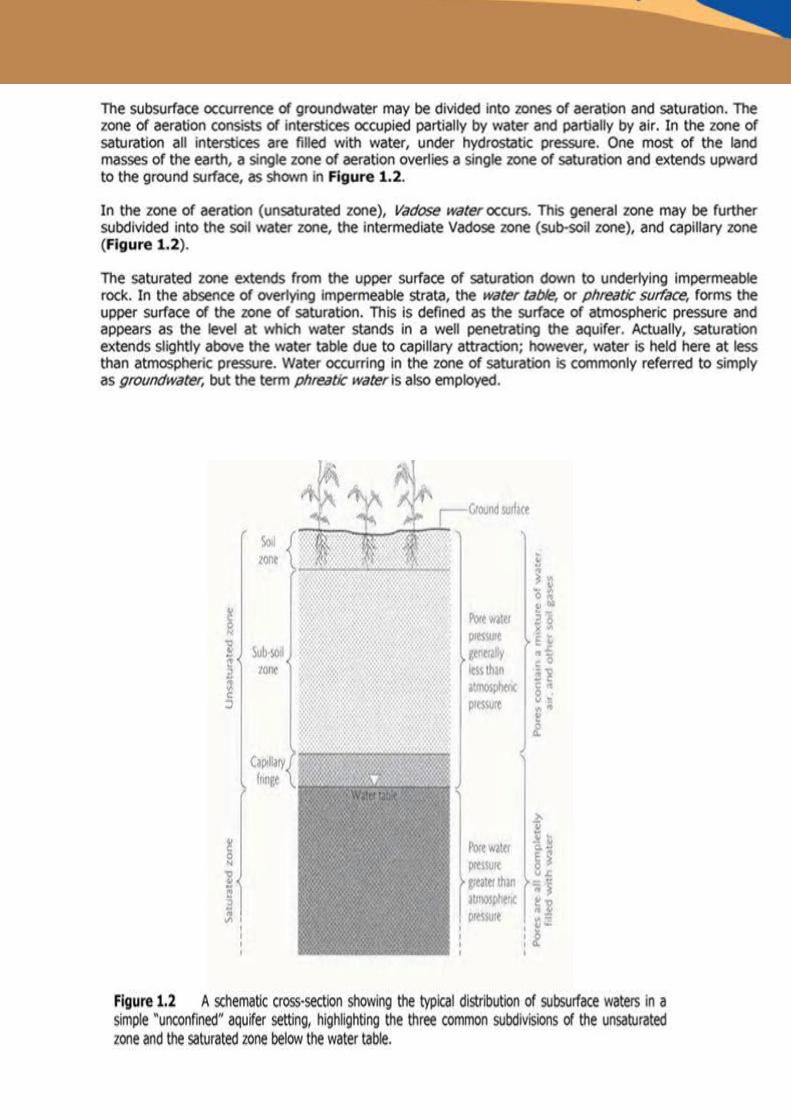
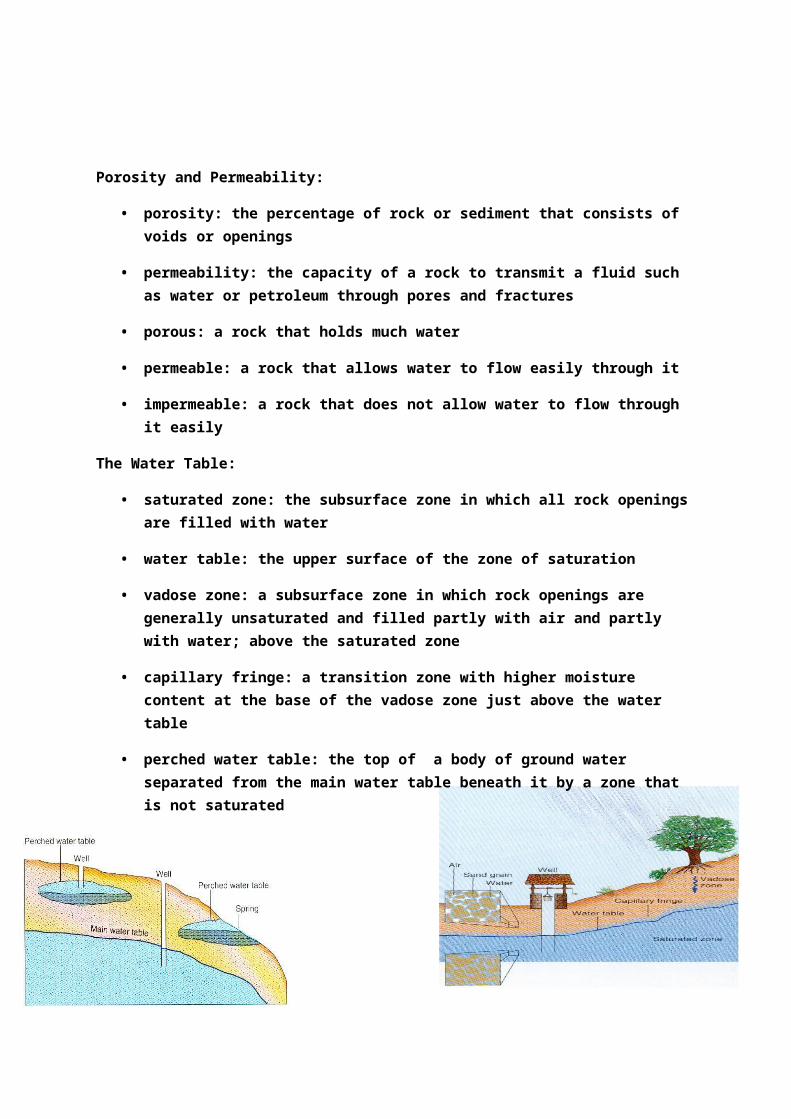
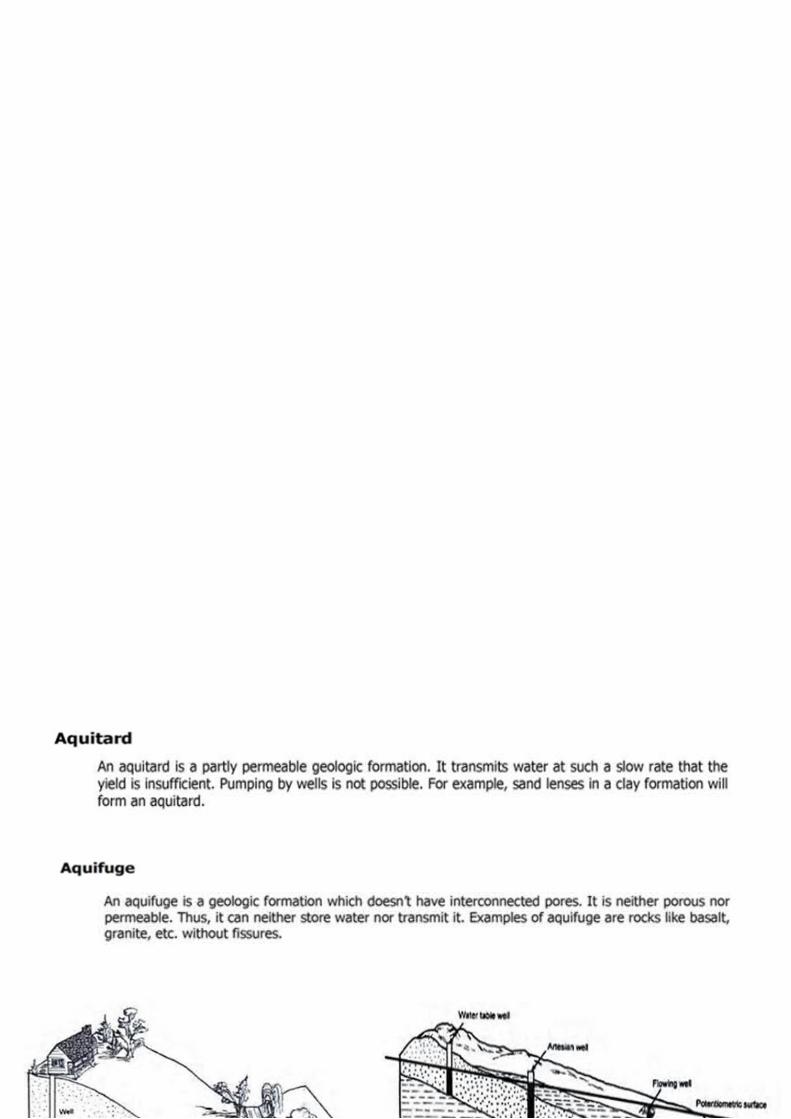
The Water Table:
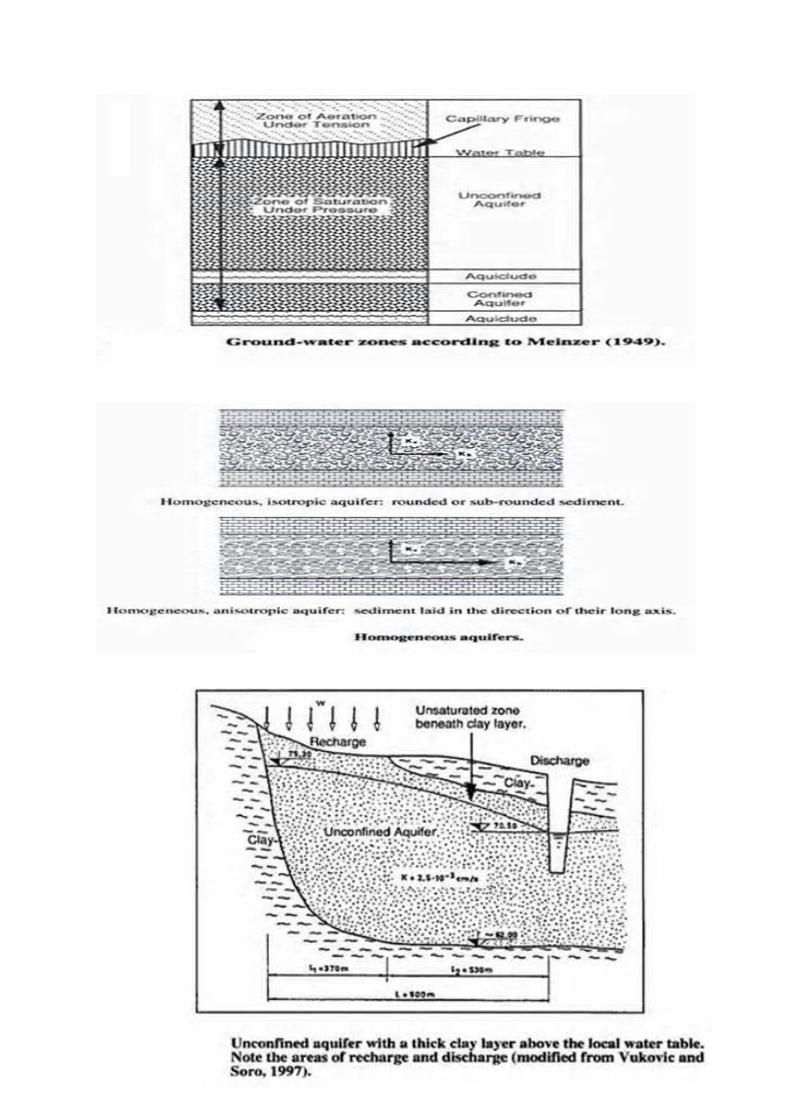
• saturated zone: the subsurface zone in which all rock openingsare filled with water
• water table: the upper surface of the zone of saturation
• vadose zone: a subsurface zone in which rock openings are generally unsaturated and filled partly with air and partly with water; above the saturated zone
• capillary fringe: a transition zone with higher moisture content at the base of the vadose zone just above the water table
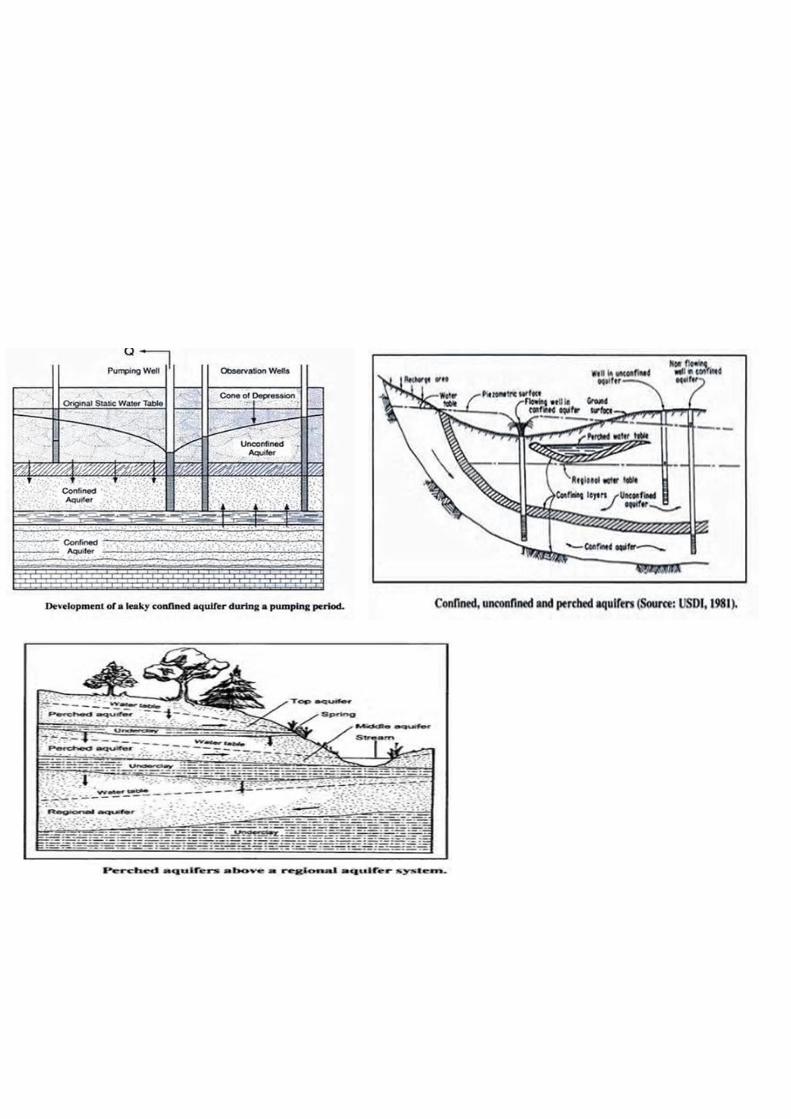
• perched water table: the top of a body of ground water separated from the main water table beneath it by a zone that is not saturated
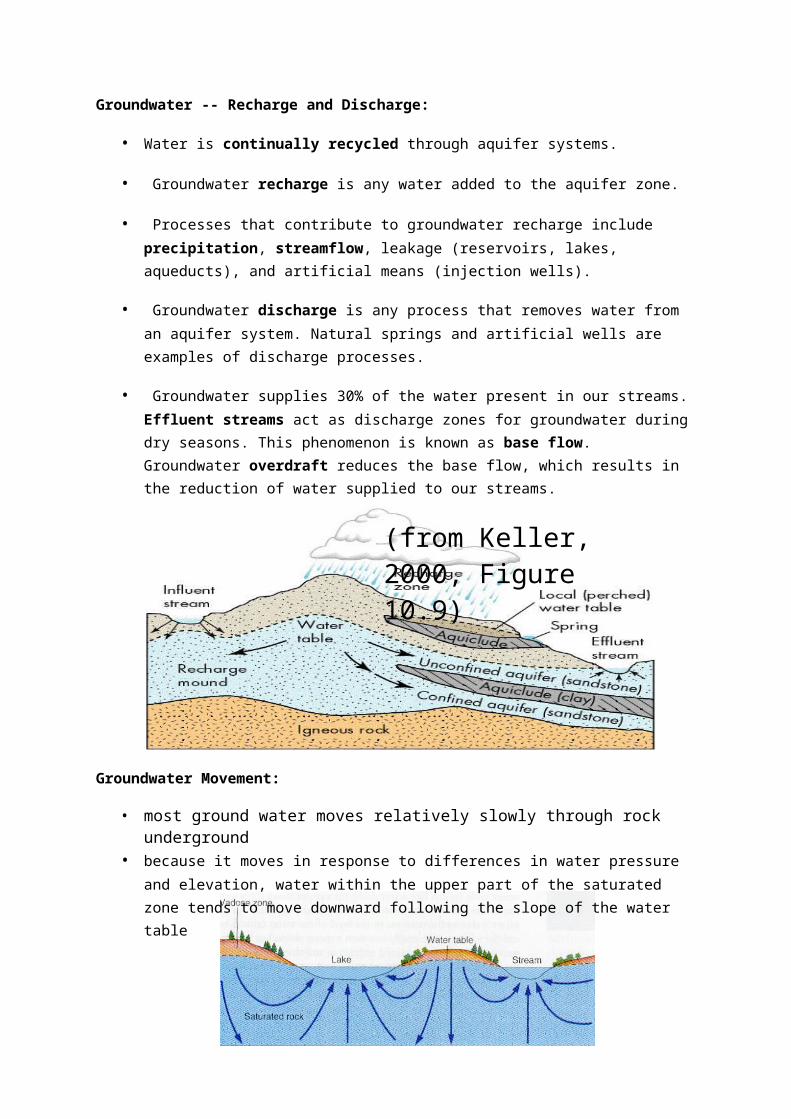
(from Keller, 2000, Figure 10.9)
Groundwater -- Recharge and Discharge:
• Water is continually recycled through aquifer systems.
• Groundwater recharge is any water added to the aquifer zone.
• Processes that contribute to groundwater recharge include precipitation, streamflow, leakage (reservoirs, lakes, aqueducts), and artificial means (injection wells).
• Groundwater discharge is any process that removes water from an aquifer system. Natural springs and artificial wells are examples of discharge processes.
• Groundwater supplies 30% of the water present in our streams.Effluent streams act as discharge zones for groundwater duringdry seasons. This phenomenon is known as base flow. Groundwater overdraft reduces the base flow, which results in the reduction of water supplied to our streams.
Groundwater Movement:
• most ground water moves relatively slowly through rock underground
• because it moves in response to differences in water pressure and elevation, water within the upper part of the saturated zone tends to move downward following the slope of the water table
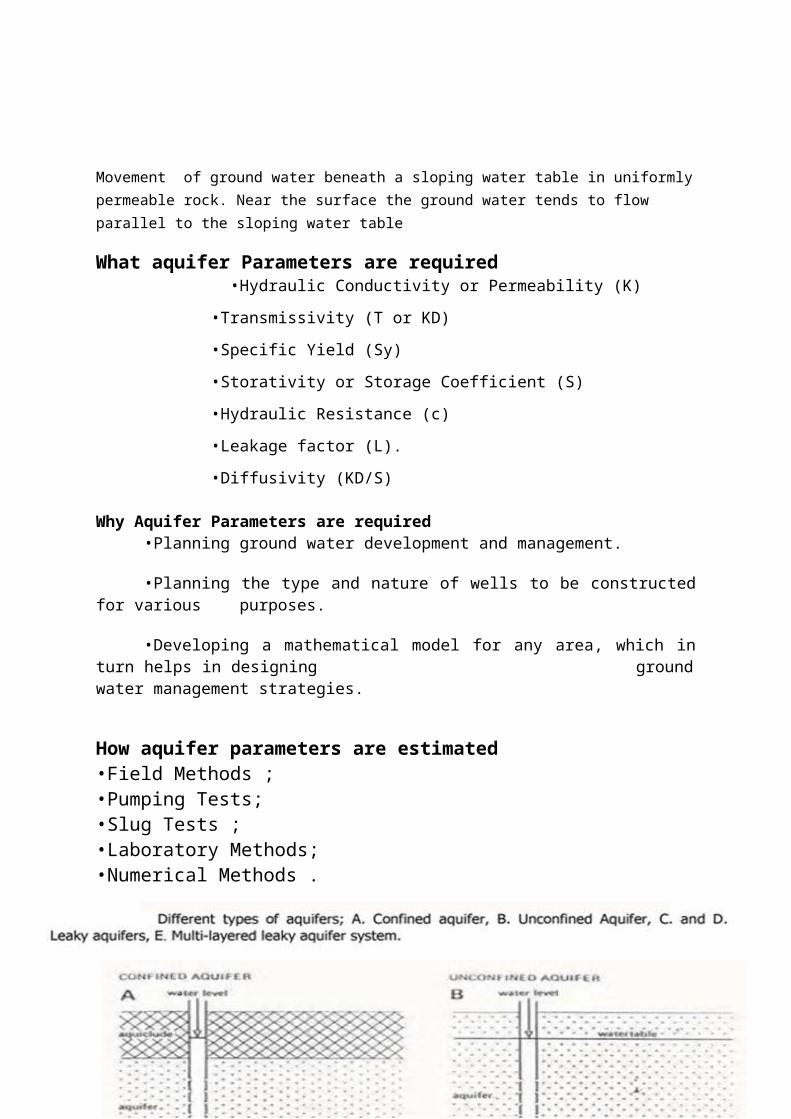
Movement of ground water beneath a sloping water table in uniformlypermeable rock. Near the surface the ground water tends to flow parallel to the sloping water table
What aquifer Parameters are required •Hydraulic Conductivity or Permeability (K) •Transmissivity (T or KD) •Specific Yield (Sy) •Storativity or Storage Coefficient (S) •Hydraulic Resistance (c) •Leakage factor (L). •Diffusivity (KD/S)
Why Aquifer Parameters are required •Planning ground water development and management.
•Planning the type and nature of wells to be constructedfor various purposes.
•Developing a mathematical model for any area, which inturn helps in designing groundwater management strategies.
How aquifer parameters are estimated •Field Methods ; •Pumping Tests; •Slug Tests ; •Laboratory Methods; •Numerical Methods .
Transmissivity
Transmissivity is defined as the rate at which water ofprevailing kinematic viscosity is transmitted through a unitwidth of aquifer under a unit hydraulic gradient. T = Kb = m2/day
Specific retention
Specific retention of a rock is in the ratio of thevolume of water a rock can retain against gravity drainage tothe total volume of the rock. The specific yield representsthe volume of water that a rock will yield by gravity drainagewith specific retention the reminder. The sum of the two isequal to porosity.
Storativity
Saturated aquifer or confining unit changes water willbe either stored or expelled the storage coefficient orstorativity is the volume of water that a permeable unit willabsorb or expel from storage per unit surface area per unitchange in head. It is dimensionless quantity.
Aquifer parameters are estimated by pumping test and slugtest.
Pumping test
A pumping test is a controlled field experiment in which awell is pumped at a controlled rate and water-level response(drawdown) is measured in one or more surrounding observationwells and optionally in the pumped well (control well) itself.Response data from pumping tests are used by groundwaterhydrologists to estimate the hydraulic properties of aquifers,evaluate well performance and identify aquifer boundaries.Aquifer test and aquifer performance test (APT) are alternatedesignations for a pumping test. In petroleum engineering, apumping test is referred to as a drawdown test.
The goal of a pumping test, as in any aquifer test, is toestimate hydraulic properties of an aquifer system. For thepumped aquifer, one seeks to determine transmissivity,hydraulic conductivity (horizontal and vertical) andstorativity (storage coefficient). In layered systems, onealso uses pumping tests to estimate the properties ofaquitards (vertical hydraulic conductivity and specificstorage). Pumping tests can identify and locate recharge andno-flow boundaries that may limit the lateral extent ofaquifers as well.
GROUND WATER EXPLORATION:
Objectives
The objective of ground water exploration is tolocate aquifers capable of yielding water of suitablequality and in economic quantities for drinking,irrigation, agricultureal and industrial purposes byemploying as required geological, geophysicaldrilling and other techniques. Information soughtduring the course of exploration are the depth ofaquifer, type of rock encountered, quality ofaquifer, its sustained yields, feasibility ofartificial recharge etc.
Type of exploration needed and sequence ofexploration technique to be employed are declared byeconomic status of availability of data, degree ofground water development taking place in the areabesides hydrogeological conditions.
The objective of exploration drilling is done atthe depth of 300-500 m in hard rock formation and to500 m depth in alluvial formations by CentralGroundwater Board.
Preparation of the scheme
Consultation with state government / userorganizations for ascertaining their requirementspriority and to assess the exploration requirement.Selection of area for exploratory drilling based onthe systematic / reappraisal hydrogeological Surveyundertaken.
This scheme prepared brings out objectives,justification , type of and number of rigs required,depth to be drilled, number of exploratory ,observations wells, slim hole to be drilled, size andtype of well design to be adopted with the materialspecifications, geological formations likely to beencountered types of aquifers, expected yield fromthe well etc., type of tests, zone test, aquiferparameter test to be undertaken, quality regime to bemonitored and any other related items.
Norms for density of exploratory wells
a. In hard rock area 1 EW per 200 sq.km (DTH rig)
b. Alluvial formation 1EW per 500 sq.km ( rotaryrig)
c. Bouldary formation 1EW per 300 sq.km (Percussionrig)
The above norms era as per the prevailinghydrogeological situation and objectives of groundwater exploration.
Location of site
The site selection of exploratory sites is basedon the hydrogeological reconnaissance. Exploratoryholes are drilled to identify nature of aquifermaterials and the ground water flow conditions underthe different hydrogeological environments in theproject area, such as recharge and discharge areasand transition zones type of rock formations, depthto water level, likely water level fluctuations,discharge of existing wells etc,. Interpretation ofaerial photographs are useful in both preliminaryhydrogeological reconnaissance and site selection forexploratory drilling. Collection of data from theexisting well is done.
This may include the availability ofwater source for drilling camping site,communication facilities, provision or possibilitiesof disposal of pumped water and drilling wastes.
Selection of type and capacity of rig
Central ground water board has got five types ofdrilling rigs ie. Direct Mud Rotary rig, Down the
hole hammer rig, Direct Rotary-cum-DTH rig,percussion rig, Direct rotary-cum-percussion rig.Some of the DTH rigs are provided with additionalattachments like simultaneous casing driver, OCEXsystem to tackle top loose formation in hard rockareas and in bouldary formations.
The general practices is to carry out exploratorydrilling upto the available depth capacity of rig.However due to ageing the depth capacity of many rigshas been lowered to far less than fifty percent. Suchrigs are used in areas of shallower depths.
Selection of type and capacity of rig is madejointly by the engineer and hydrogeologist from theavailable fleet of rig in the operational area.
Drilling operations
The borehole depth and bit size for differenttypes of drilling techniques varies. Telescoping ofbore holes at appropriate depths should be carriedout .
Data collection
Detailed description of the lithology of boreholecuttings throughout at every meter of drilling incase of soft rock formation and every 3 meters incase of hard rock drilling.
Details of the type of rig deployed, size andtype of bit used, nature of drilling fluid, size ofdepth of casing pipe,etc. Loss of drilling fluidwhile drilling if any should be recorded .
The depth at which first wet sample isencountered and the depth where was it first struckshould be recorded in case of air rotary drilling. Incase of direct mud rotary drilling, mud parameterssuch as density, viscosity and sand content must bemeasured and recorded at the site.
Discharge measurement in case of hard rockdrilling whenever increase or decrease in dischargeis noted. The temperature and specific conductancemeasurements may be carried out after each dischargemeasurement is taken. Water sample should becollected from each aquifer encountered or wheneverchange in specific conductance is noted for chemicalanalysis
Static water level measurement should be recordedbefore start of drilling every day till the boreholeis completed. A record of water level fluctuation inneighbouring wells due to drilling of the exploratoryborehole should be maintained with the details oflocation, type of well and so on.
Geophysical logging
A number of geophysical well logging techniques areavailable for use in ground water exploration. Theutility of borehole geophysical logging inexploratory drilling is
a.Delineation of permeable and impermeable zonesand defining the aquifer boundaries.
b.Delineation of quality of water in differenthorizons. Separation of saline aquifer with aview to seal such zones from fresh wateraquifers.
c.Running of spontaneous potential , pointresistance, natural gamma, deferentialtemperature gradient and caliper logs an theboreholes drilled into different types offormations. Based on the lithology geophysicallogging of the pilot hole drilled, aquifers aredelineated and quality of groundwater aquifersystem deciphered.
d.In case of hard rock wells boreholes can belogged after its completion.
Drill stem test
Drill stem test is conducted to decipherinformation on chemical quality of water from aparticular formation by collecting water samples fromthat zone. It is a system wherein the desired sectionof borehole is isolated by a packer and drill stem is
used as a conduit to pump formation water to thesurface by airlift pumping. Schematic diagram ofdrill stem test conducted with cone type solid packermade from 250 – 300 mm diameter pipe with 60 cm or 90cm of conical lengths is given. Its minimum diameter100 mm as the bottom to which assembly pipe isconnected. At the top is connected with drill pipeDST is conducted in the pilot hole starting from thetop most aquifer zone.
The procedure for conducting DST is,
Step 1 – the bore hole is reamed to the next largersize down to the depth of stiff clayey formationwhere the packer is set. The testing zone section ofthe borehole is then washed. The packer assemblyconsisting of 100mm diameter slotted pipe at thebottom and drill pipe at the top is lowered and setit at the predetermined depth in such a way that thescreen is against the zone meant for testing.
Step 2 – A “T” shaped discharged pipe is connected atthe tip of the drill pipe at the surface and an airline is lowered.
Step 3 – The annular space between drill pipe andreamed hole above packer is filled with mud.
Step 4 – The compressed air is then let into air pipewith the help of a compressor. Initially muddy watercomes through discharge pipe. After sometime freshformation water starts coming out of the dischargepipe. This water sample is collected for chemicalanalysis.
Step 5 - The process is repeated for testingaquifers located at deeper depths.
Well assembly recommendations:
Based on the preliminary investigations carriedout in the area, data generated from the lithology,sieve analysis of the formation material andgeophysical logging well assembly consisting ofhousing, blank casing pipe, slotted pipe and bailplug is decided by the site hydrogeologist forlowering into the bore hole. The slot size and gravelsize are to be determined from the sieve analysis ofthe lithological samples collected during pilot holedrilling.
The depth of the well should be adequate topenetrate saturated aquifer thickness completely. Thehousing size of the well should be adequate toaccommodate pump and the column pipes duringdevelopment and testing. The well assemblies may belowered after joining the pipes either by welding orby screw and socketted system.
Reaming of the borehole
The size of reamed hole depends on the size of theassembly and the thickness of artificial gravel packprovided. The reaming operations should normally benot more than in two stages.
Well construction and completion
Two stages of exploratory well completion inunconsolidated and semi consolidated formations aregenerally adopted.
Type 1 : Single length well assembly consisting of ahousing, reducer, blank and screen pipes and a bailplug. The length of housing must be sufficient enoughto enable lowering of pump upto the maximum pumpingwater level with an additional allowance of 5 meters.The diameter of housing must be sufficient toaccommodate the pump with a clearance of 5 cm to 10cm. length of bail plug 1-3 m depending on therequirements. The well intake must be designedproperly after conducting sieve analysis of theformation material in case of unconsolidatedformation.
Type 2: Two length well assembly is lowered underspecial circumstances when the conductor pipe islowered during pilot hole drilling operations isretained as housing pipe. It must be ensured thatlength and diameter of the pipe is adequate toaccommodate the pump. The well intake portion withbail plug is lowered separately with areverse socketat the top. After placing the gravel pack whichshould be appropriate well rounded quartz material,chemically inert smooth, hard and free from dust /clayey material. Seal is provided and pipe lengthabove reverse socket is unscrewed and withdrawn.
Six types of well constructions are feasible inconsolidated formations depending on the sitespecific conditions.
Type1: top overburden is cased with appropriate sizeof blank pipe grouting around annulus and rest of theborehole left uncased.
Type2: Aquifer in the top weathered zone topped withthe desired lengths of screen blank pipe and rest ofthe hole left uncased.
Type3: an assembly of appropriate size lowered in theborehole with or without pack material when the borehole walls are not stable.
Type4: intermediate unwanted zones cased with partassembly reduced and rest of the borehole leftuncased. However top overburden is cased.
Type 5: sealing of bottom undesired zones by cementgrouting and adopting any of the above type design asper site conditions.
Type 6: sealing of top undesired zones by extendingcasing depths and resorting to any type of designs.
Development of wells in consolidated formations
Well in hard rock are developed by compressoremployed for drilling operations so as to remove theplugging of fracture system.
Other techniques like chemical treatment followed byair surging and lifting can also be used ifnecessary. Improvement in the specific capacity ofthe well could be assessed after employing thesetechniques.
Hydrofracturing is another technique employed onwells drilled in hard rock areas which have pooryield.
Hydrological tests:
For determination of aquifer properties liketransmissivity , storativity, specific capacity, welllosses etc. hydrogeological tests such as preliminaryyield test (PYT), slug test, step drawdown test(SDT),Aquifer performance test(APT) are conducted onexploratory wells. Since well design and assemblylowering is not carried out in case of boreholesdrilled in hard rock formations, SDT need not beconducted. The duration of preliminary yield testshould be atleast 100 minutes.
After completion of drilling and hydrogeologicaltests all the data pertaining to borehole i.e.lithology, static water level, drill time log,discharge log, temperature log, specific conductance,transmissivity, specific yield/ storage coefficientvalues may be shown on a single sheet for easycorrelation.
Wells:
• well: a deep hole, generally cylindrical, that isdug of drilled into the ground to penetrate anaquifer within the saturated zone
• recharge: the addition of new water to thesaturated zone
Wet season: water table and rivers are high; springs and wells flow readily
Dry season: water table and rivers are low;some springs and wells dry up
• the water table in an unconfined aquifer rises inwet seasons and falls in dry seasons as waterdrains out of the saturated zone into rivers
Wells (cont.):
• cone of depression: a depression of the watertable formed around a well when water is pumpedout; it is shaped like an inverted cone
• drawdown: the lowering of the water table near apumped well
• artesian well: a well in which water rises abovethe aquifer
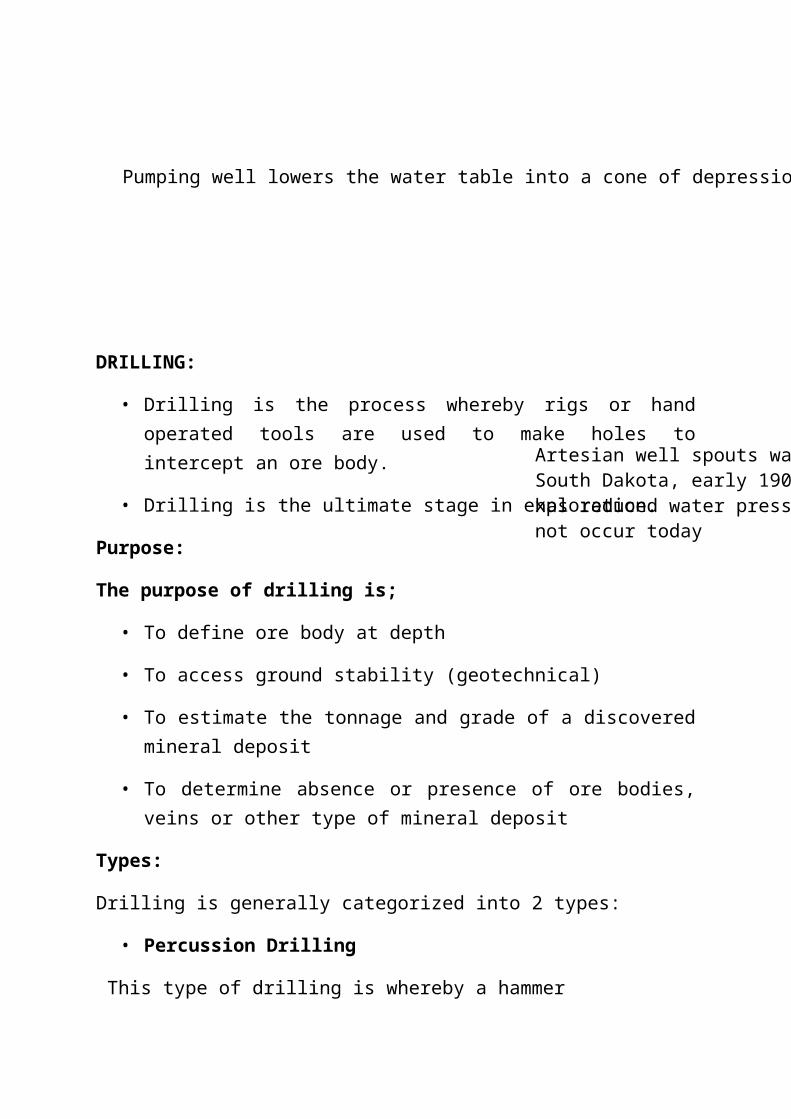
Pumping well lowers the water table into a cone of depression
Artesian well spouts water above land surface in South Dakota, early 1900s. Heave use of this aquifer has reduced water pressure so much that spouts do not occur today
DRILLING:
• Drilling is the process whereby rigs or handoperated tools are used to make holes tointercept an ore body.
• Drilling is the ultimate stage in exploration.
Purpose:
The purpose of drilling is;
• To define ore body at depth
• To access ground stability (geotechnical)
• To estimate the tonnage and grade of a discoveredmineral deposit
• To determine absence or presence of ore bodies,veins or other type of mineral deposit
Types:
Drilling is generally categorized into 2 types:
• Percussion Drilling
This type of drilling is whereby a hammer
beats the surface of the rock, breaks it into chips.
-Reverse Circulation Drilling (RC)
• Rotary Drilling
This is the type of drilling where samples arerecovered by rotation of the drill rod withoutpercussion of a hammer.
- Diamond Drilling
- Rotary Air Blast (RAB)
- Auger Drilling
Percussion Drilling
Reverse Circulation Drilling (RC)
1.This type of drilling involves the use of highpressure compressors, percussion hammers thatrecover samples even after the water table.
2.The end of the hammer is a tungsten carbide bitthat breaks the rock with both percussion androtary movement .This mostly follows a RABintercept of an ore body.
3.The air pressure of a RC rig can be increased bythe use of a booster. This allows for deeperdrilling.
4.Samples are split by special sample splitter thatis believed to pulverize the samples. This isdone to avoid metal concentrations at onlysection of the sample. Contamination is checked
by cleaning the splitter after every rod changeeither by brush or high air pressure from rig’sair hose.
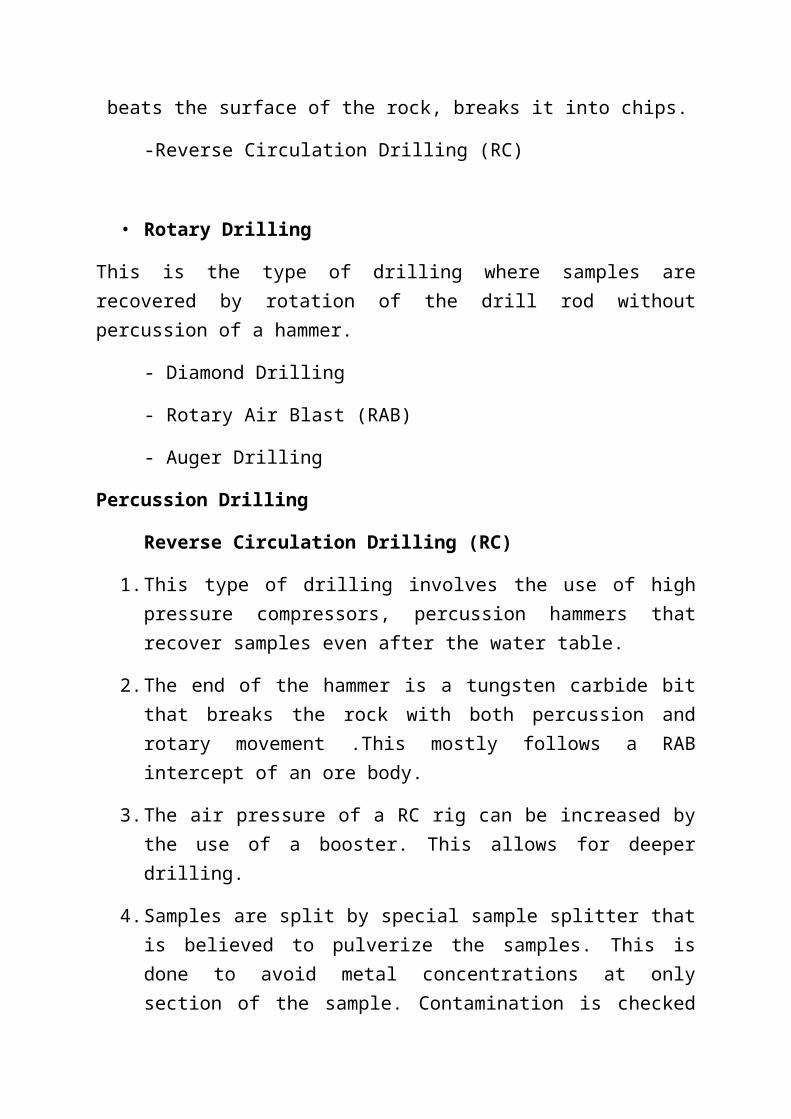
5.RC drilling is mostly followed by diamonddrilling to confirm some of the RC drilling oreintercept.
6.This type of drilling is faster and cheaper thandiamond drilling
Rotary Drilling (Cont’d)
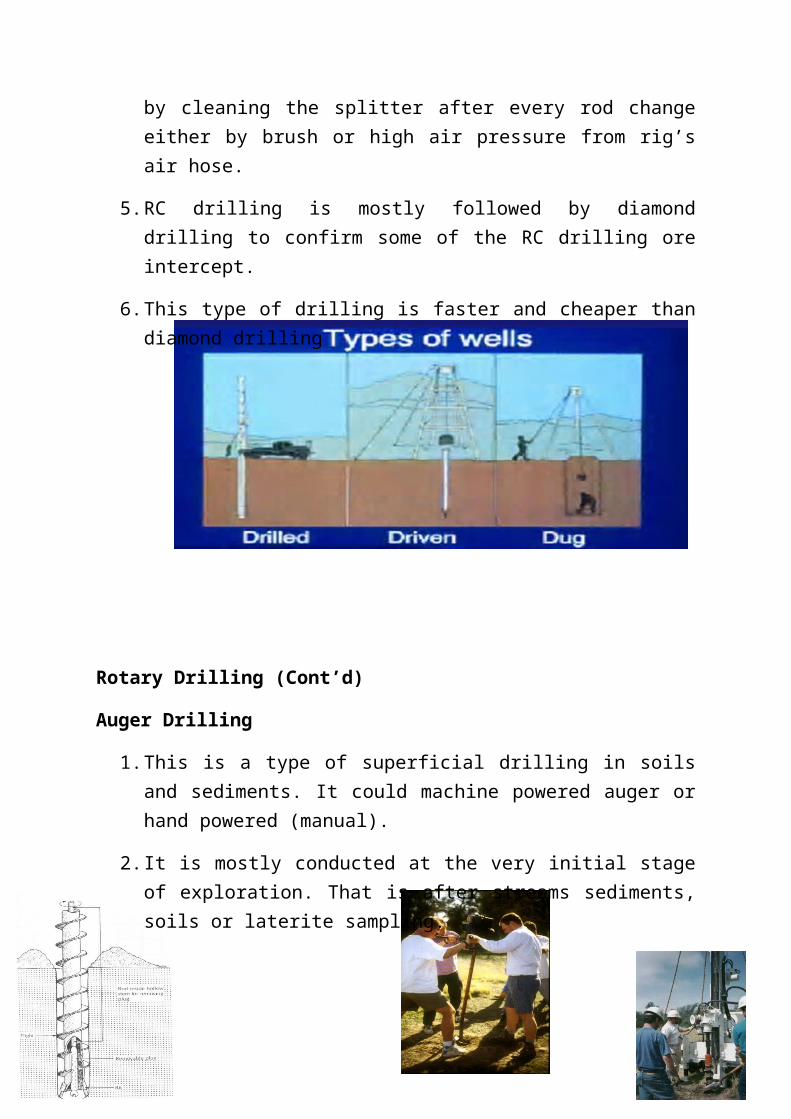
Auger Drilling
1.This is a type of superficial drilling in soilsand sediments. It could machine powered auger orhand powered (manual).
2.It is mostly conducted at the very initial stageof exploration. That is after streams sediments,soils or laterite sampling.
Hard Rock Aquifer
Groundwater is of utmost importance in the arid and semi-arid environment. The areas in such regions areforced to face a variety of problems regarding groundwater as it is the main source of water no matter for any use viz.,drinking, domestic, irrigation or industrial particularly for the rural population. The main challenges in hard rock areas inthe semi-arid region are the water conservation, management and planning of the water resources.
The main volcanic suite of rocks is represented by Deccan Traps occupying an area of more than 500,000 km2 in the western and central parts of the country. A number of basaltic flow units are identified of agevarying from Upper Cretaceous to Lower Eocene. Main source of groundwater is from the weathered, fractured and vesicular horizons. At places differentlayers of basalt form a multi-aquifer system. Parts of this area has semi-arid climate due to which recharge is limited and availability of groundwater is poor.
Most part of Peninsular India is occupied by a variety of hard and fissured formations, including Crystalline, trappean basalt and consolidated
Sedimentaries (including carbonate rocks), with patches of semi-consolidated sediments in narrow intracratonic basins. Rugged topography and compact and fissured nature of the rock formations combine togive rise to discontinuous aquifers, with limited to moderate yield potentials.
The near surface weathered mantle forms the all important groundwater reservoir, and the source for circulation of groundwater through the underlying fracture systems. In the hard rock terrain, deep weathered pediments, low-lying valleys and abandoned river channels generally contain adequate thickness of porous material, to sustain groundwater development under favourablehydrometeorological conditions. Generally, the potential water saturated fracture systems occur down to 100 m depth, and in cases yield even up to 30 litres per second (Ips).
Studies in the hard rock terrains covered with black cotton soil in basaltic terrain and red lateritic soil in granitic areas indicate that a minimal rainfall of about 246 mm and 412 mm are required for initiation of deep percolation in red and black cotton soils respectively. However all of this will not be available for utilization as part of it will be lost to base flow and effluent seepage to surface drainage system. This also does not include other sources of recharge such as return flow from irrigation.
Hard rocks widely occur in various parts of the worldand cover about 20% of the land surface. In India, over two third of the surface area totaling about 2.40 million sq. km. is occupied by hard rocks regions and nearly 50% of the replenishable resources
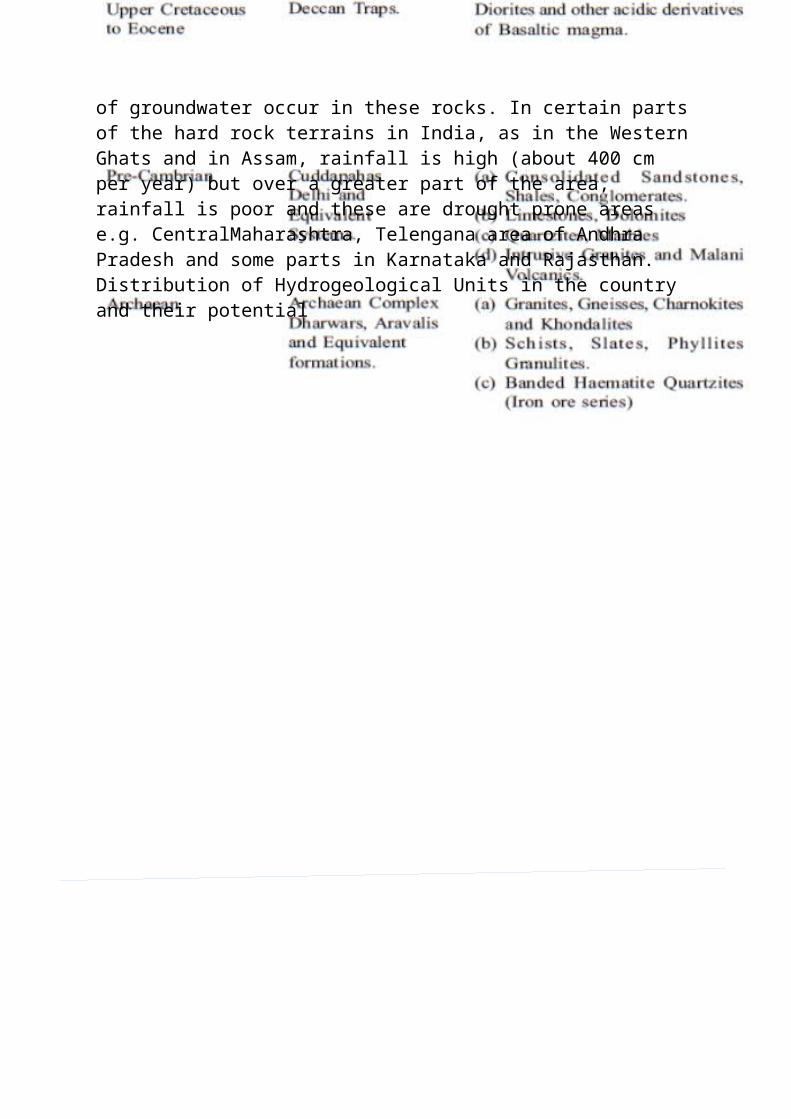
of groundwater occur in these rocks. In certain partsof the hard rock terrains in India, as in the WesternGhats and in Assam, rainfall is high (about 400 cm per year) but over a greater part of the area, rainfall is poor and these are drought prone areas e.g. CentralMaharashtra, Telengana area of Andhra Pradesh and some parts in Karnataka and Rajasthan.Distribution of Hydrogeological Units in the country and their potential
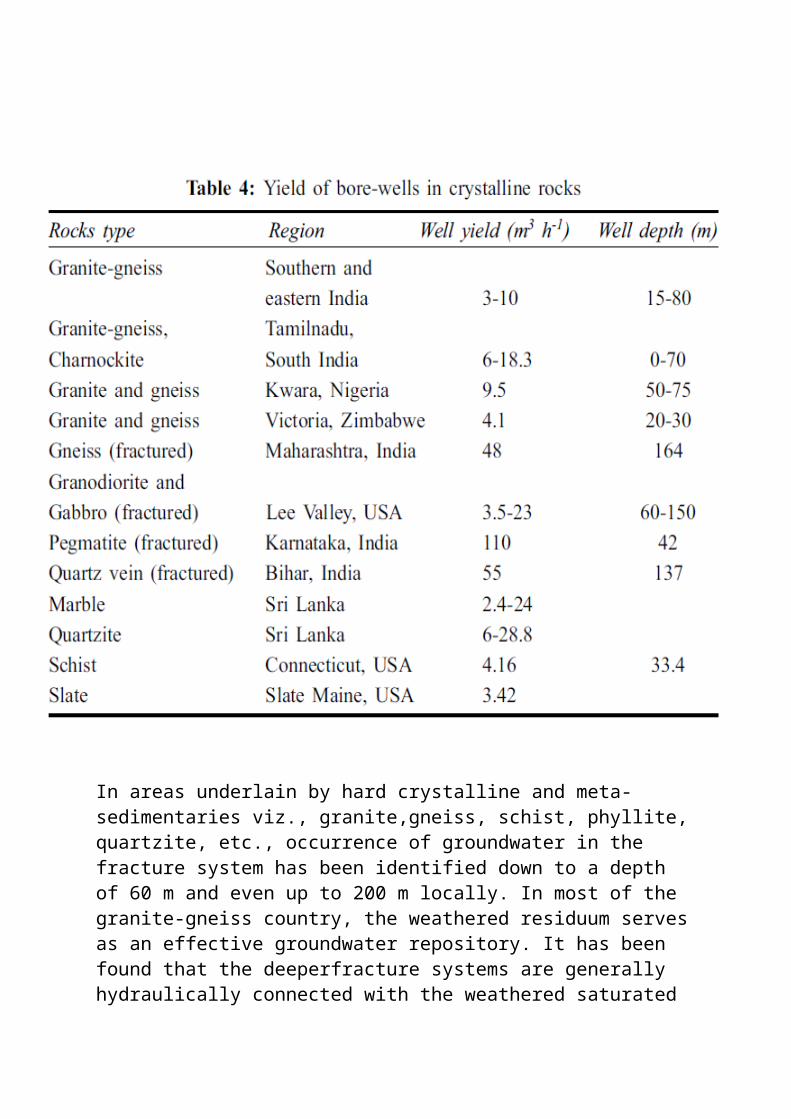
In areas underlain by hard crystalline and meta-sedimentaries viz., granite,gneiss, schist, phyllite,quartzite, etc., occurrence of groundwater in the fracture system has been identified down to a depth of 60 m and even up to 200 m locally. In most of the granite-gneiss country, the weathered residuum servesas an effective groundwater repository. It has been found that the deeperfracture systems are generally hydraulically connected with the weathered saturated
residuum. The yield potential of the crystalline and meta-sedimentary rocks shows wide variations. Through10 cm to 15 cm diameter bore-wells,the fractured system generally yields from 10 m3/hour and up to 100m3/hour in the vicinity of structurally disturbed areas (Table 4).
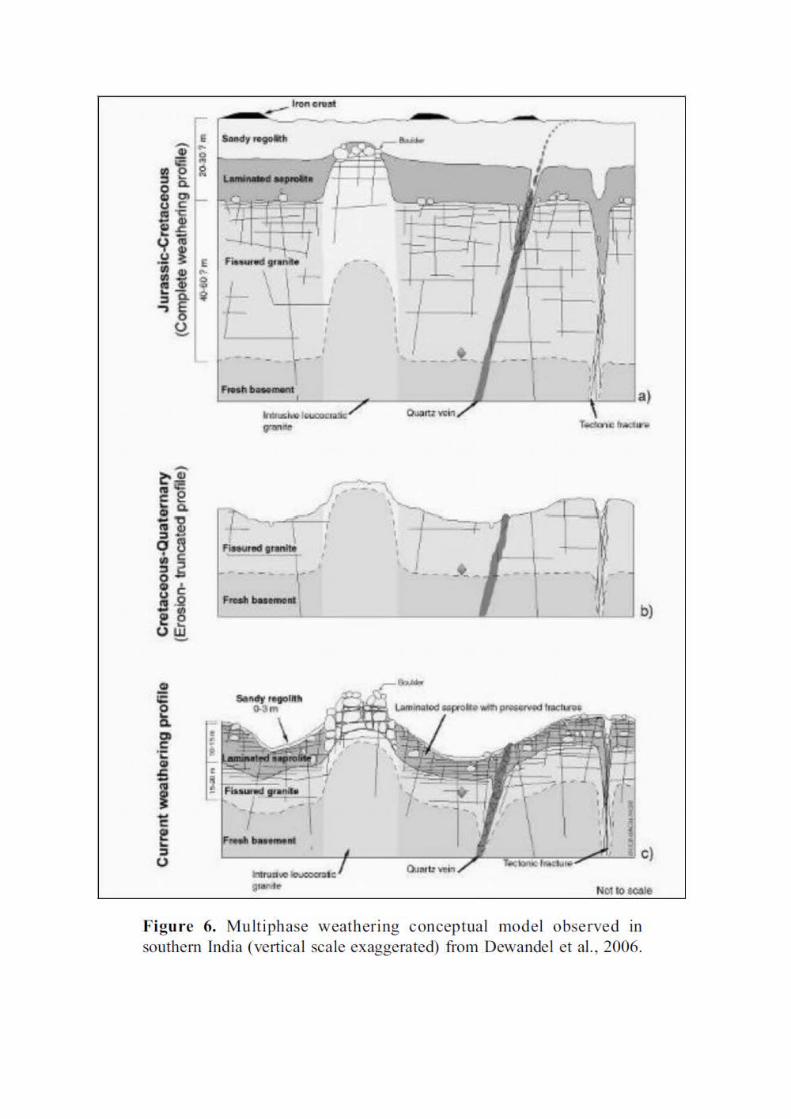
The weathered zone appears to be composed of an old, probably Mesozoic, weathering profile (Fig. 6a),
where only a part of the fissured layer has been preserved. An erosion phase, probably due to regionaluplift, thus caused the erosion of the entire saprolite layer and a part of the fissuredlayer (Fig.6b).
Then, at least one more recent weathering phase, the latestbeing probably still active, is responsible forthe saprolitisation of this truncated profile and explains the development of 1-3metres non-laminated saprolitelocally capped by an iron crust, and the lamination of a large part of the ancient fissured layer (Fig. 6c).
The profile structure is thus controlled by amultiphase weathering process that was induced by the geodynamic historyof the Indian Peninsula.
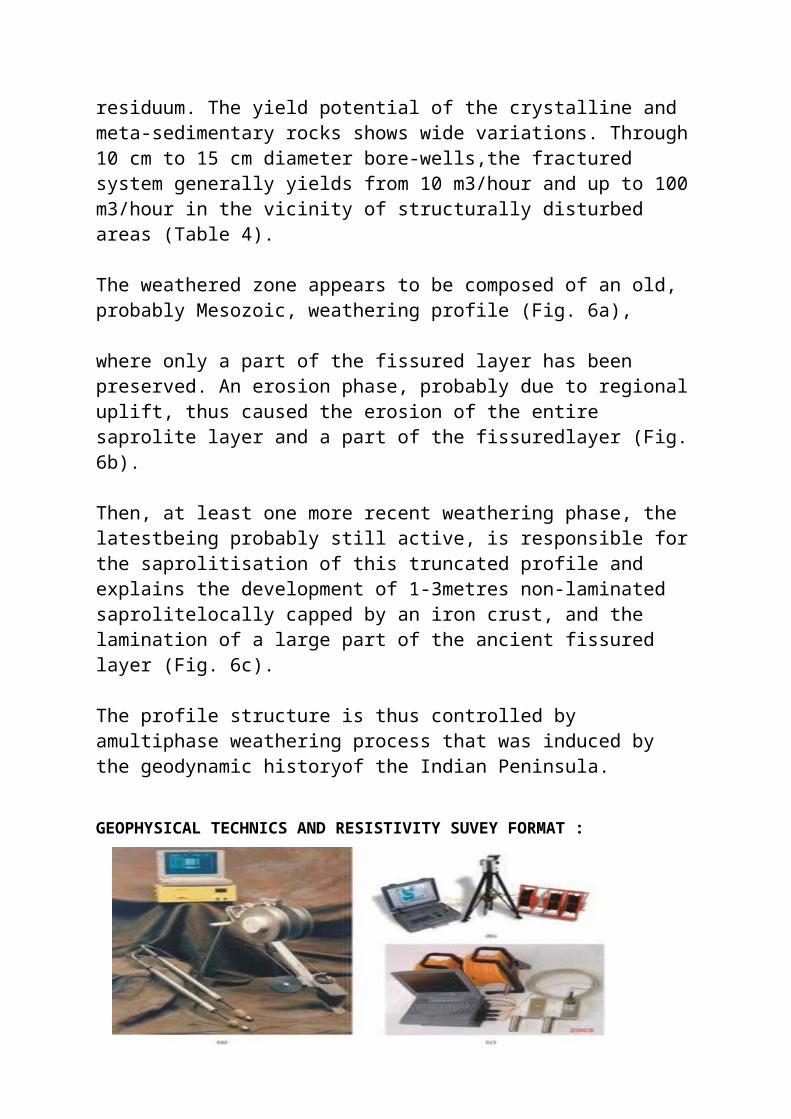
GEOPHYSICAL TECHNICS AND RESISTIVITY SUVEY FORMAT :
Geophysical survey
Geophysical survey refers to the systematic collection ofgeophysical data for spatial studies. Geophysical surveys mayuse a great variety of sensing instruments, and data may becollected from above or below the Earth's surface or fromaerial or marine platforms. Geophysical surveys have manyapplications in Earth science, archaeology, mineral and energyexploration, and engineering. Geophysical surveys are used inindustry as well as for academic research. Geophysicalinvestigations of the interior of the Earth involve takingmeasurements at or near the Earth’s surface that areinfluenced by the internal distribution of physicalproperties. In a small extent geophysical method likeElectrical resistivity methods are used in geohydrologicalsurvey as a conformation test for the data collected byanother methods.
These are the major geophysical methods:
1. Electrical methods.
2. Gravity methods.
3. Seismic methods.
4. Magnetic methods.
5. Radioactive methods.
6. Geophysical well logging.
Electrical prospecting
Electrical prospecting in the most general sense may bedefined as prospecting by electricity for mineral deposits andgeologic structures. The purpose of electrical surveys is to
determine the subsurface resistivity distribution by makingmeasurements on the ground surface. From these measurements,the true resistivity of the subsurface can be estimated. Theground resistivity is related to various geological parameterssuch as the mineral and fluid content, porosity and degree ofwater saturation in the rock. Electrical resistivity surveyshave been used for many decades in hydro geological, miningand geotechnical investigations. More recently, it has beenused for environmental surveys.
Among the resistivity prospecting methods, of which there is aconsiderable variety, we include also equipotential line,point and potential ratio measurements. The latter are notmuch used at present. All resistivity methods employ anartificial source of current which is introduced in to theground through point electrodes or long line contacts. Theprocedure then is to measure potentials at other electrodes inthe vicinity of the current flow. In most cases the current isnoted as well; it is then possible to determine an effectiveresistivity of the subsurface.
In this regard the resistivity technique is superior,theoretically at least, to all the other electrical methods,since quantitative results are obtained by using a controlledsource of specific dimensions. Practically as in the othergeophysical methods-the maximum potentialities of resistivityare not usually realized.
These are the major Electrical methods:
1. Self Potential.
2. Telluric current & Magnetotellurics.
3. Audio-Frequency Magnetic Fields.
4. Resistivity.
5. Equipotential point & line.
6. Electro Magnetic.
7. Induced Polarization.
Types of Energy sources
They are often classified by the type of energy sourceinvolved.
1. Natural.
2. Artificial.
Electrical concepts
Resistivity is a measurement of an electrical current flowthrough material.
Conductivity is a measure of an electrical current flowthrough material.
Resistance is a characteristic of certain path of anelectrical current & should not be confused with resistivity.
Resistivity and conductivity are physical properties ofmatter.
The Electrical methods may be divided in to potential andelectromagnetic methods.
The electrical exploration uses a wide range of frequencies.Low frequencies are applied in potential methods, intermediatefrequencies are in both potential and Electromagnetic methods,high frequencies are applied only in Electromagnetic methods.
There are three basic quantities potential, current andresistance involved in electrical measurements. The elementarylaw giving the relation between these three quantities is thewell-known Ohm’s law.
Ohm’s law
Early in nineteenth century George Ohm discovered that, aslong as the temperature was kept constant, the magnitude ofthe current in a metal is proportional to the applied voltage
are result now known as Ohm’s law. Ohm defined the resistance‘R’ of a conductor as the proportionality constant in thislaw, given by the voltage divided by the current.
V=IR
There are three basic quantities potential, current andresistance involved in electrical measurements.
I = Current.
V= Potential difference or electromotive force or voltage.
R= Resistance.
I is directly proportional to V.
DC & AC
Electrical prospecting may be carried out by employing directcurrent and alternating current. In a steady state D.C systema constant current is made to flow in to the ground during themeasurement. In an interrupted or pulsed D.C system, a steadycurrent is established in the ground for a short time and thenit is switched of, thus producing a pulse of current. In anA.C system, on the other hand, the current keeps on changingdirection and magnitude in a periodic manner with time,flowing in one direction during one half of a period and inthe other during the other half. The number of oscillationsper second is called the frequency.
RESISTIVITY METHOD
Resistivity
The resistivity method is based on the measurement of theresistance of various portions of the ground, after passing anelectric current in to the earth. For a metallic conductorsuch as a copper rod the resistance varies directly as thelength and inversely as the cross-section and its specificresistance or resistivity ρ is given by the formula.
R = ρ L/A
ρ = R A/L (Ohm/meter)
R is the resistance, A is the area of the cross-section, & Lis the length of the rod.
Apparent Resistivity
Apparent resistivity of a rock formation is equal to the trueresistivity of a homogeneous half space. If for a givenelectrode arrangement and input current, the voltage measuredacross that rock formation.
Two main types of procedure are employed in resistivitysurveys.
Constant separation traversing (CST), also known as ‘electricalprofiling’, is used to determine lateral variations ofresistivity. The current and potential electrodes aremaintained at a fixed separation and progressively moved alonga profile. This method is employed in mineral prospecting tolocate faults or shear zones and to detect localized bodies ofanomalous conductivity. It is also used in geotechnicalsurveys to determine variations in bedrock depth and thepresence of steep discontinuities. Results from a series ofCST traverses with a fixed electrode spacing can be employedin the production of resistivity contour maps.
Vertical electrical sounding (VES), also known as ‘electricaldrilling’ or ‘expanding probe’, is used mainly in the study ofhorizontal or near-horizontal interfaces. The current andpotential electrodes are maintained at the same relativespacing and the whole spread is progressively expanded about afixed central point. Consequently, readings are taken as thecurrent reaches progressively greater depths. The technique isextensively used in geotechnical surveys to determineoverburden thickness and also in hydrogeology to definehorizontal zones of porous strata.
Methods used in Resistivity survey
Many configurations of electrodes have been designed. Althoughseveral methods are occasionally employed in specializedsurvey, the main methods used in resistivity are following.
1. Wenner Configuration.
2. Schlumberger Configuration.
3. Dipole-Dipole Configuration.
In this methods most common methods are Wenner andSchlumberger while in Hydrological survey commonly we will useVertical electrical sounding with Schlumberger configurationof electrodes.
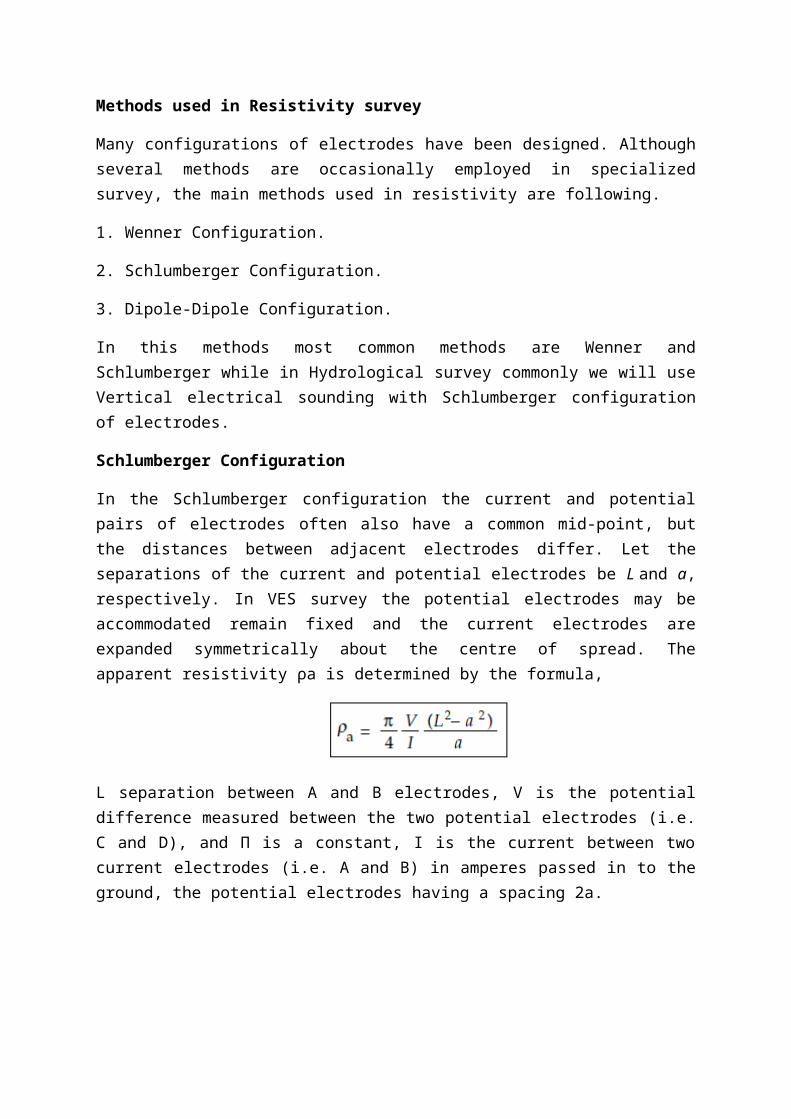
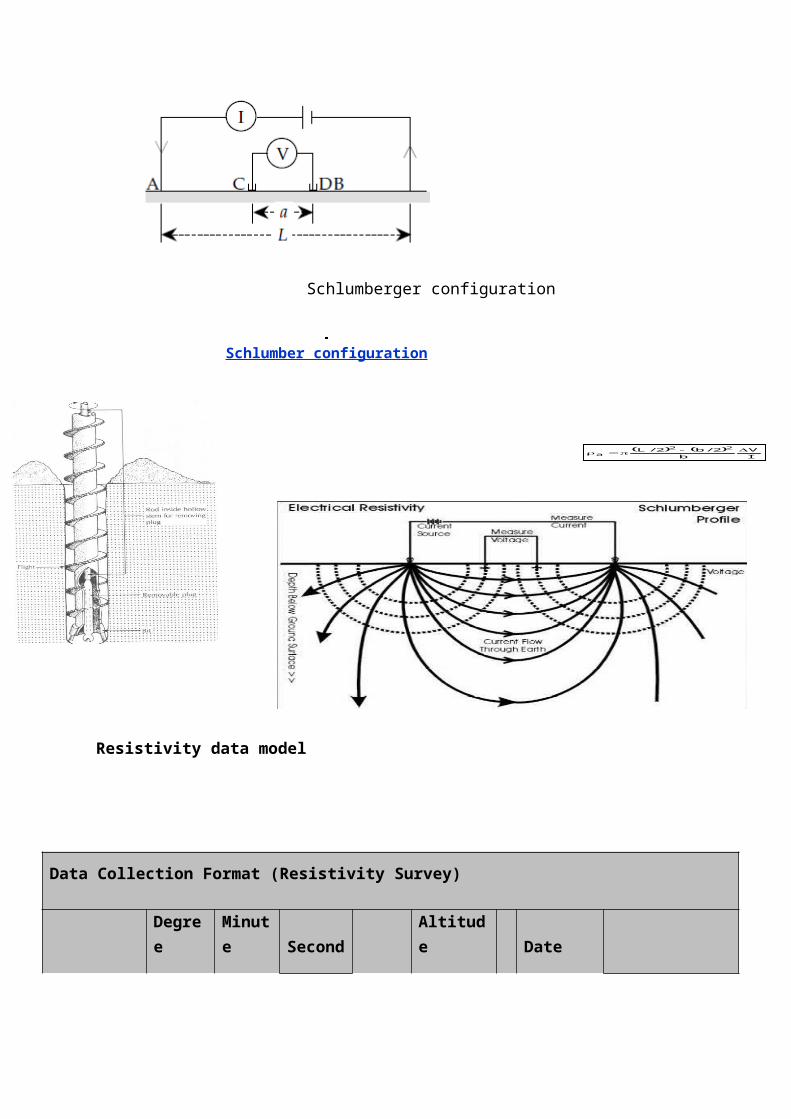
Schlumberger Configuration
In the Schlumberger configuration the current and potentialpairs of electrodes often also have a common mid-point, butthe distances between adjacent electrodes differ. Let theseparations of the current and potential electrodes be L and a,respectively. In VES survey the potential electrodes may beaccommodated remain fixed and the current electrodes areexpanded symmetrically about the centre of spread. Theapparent resistivity ρa is determined by the formula,
L separation between A and B electrodes, V is the potentialdifference measured between the two potential electrodes (i.e.C and D), and Π is a constant, I is the current between twocurrent electrodes (i.e. A and B) in amperes passed in to theground, the potential electrodes having a spacing 2a.
Schlumber configuration
IV
b2/b2/L 22
a
Schlumberger configuration
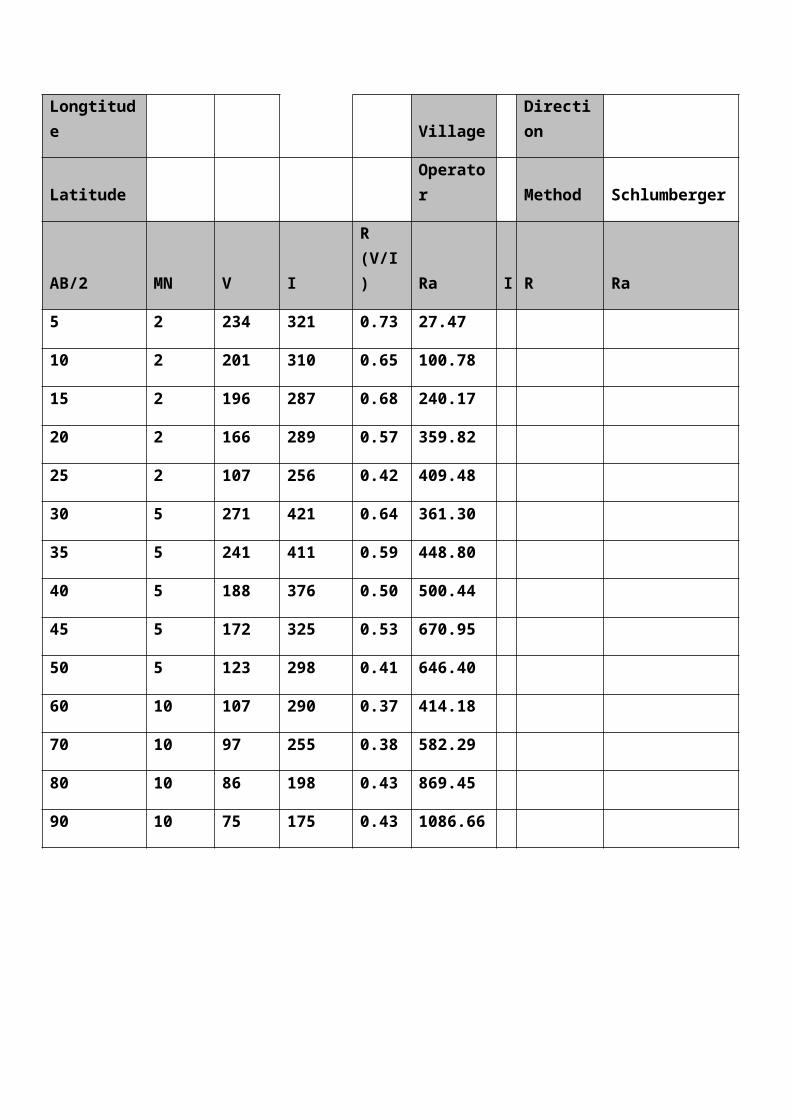
Resistivity data model
Data Collection Format (Resistivity Survey)
Degree
Minute Second
Altitude Date
Longtitude Village
Direction
Latitude Operator Method Schlumberger
AB/2 MN V I
R(V/I) Ra I R Ra
5 2 234 321 0.73 27.47
10 2 201 310 0.65 100.78
15 2 196 287 0.68 240.17
20 2 166 289 0.57 359.82
25 2 107 256 0.42 409.48
30 5 271 421 0.64 361.30
35 5 241 411 0.59 448.80
40 5 188 376 0.50 500.44
45 5 172 325 0.53 670.95
50 5 123 298 0.41 646.40
60 10 107 290 0.37 414.18
70 10 97 255 0.38 582.29
80 10 86 198 0.43 869.45
90 10 75 175 0.43 1086.66
10 100 1000 100000
10
20
30
40
50
60
70
80
90
100
DEPT
H
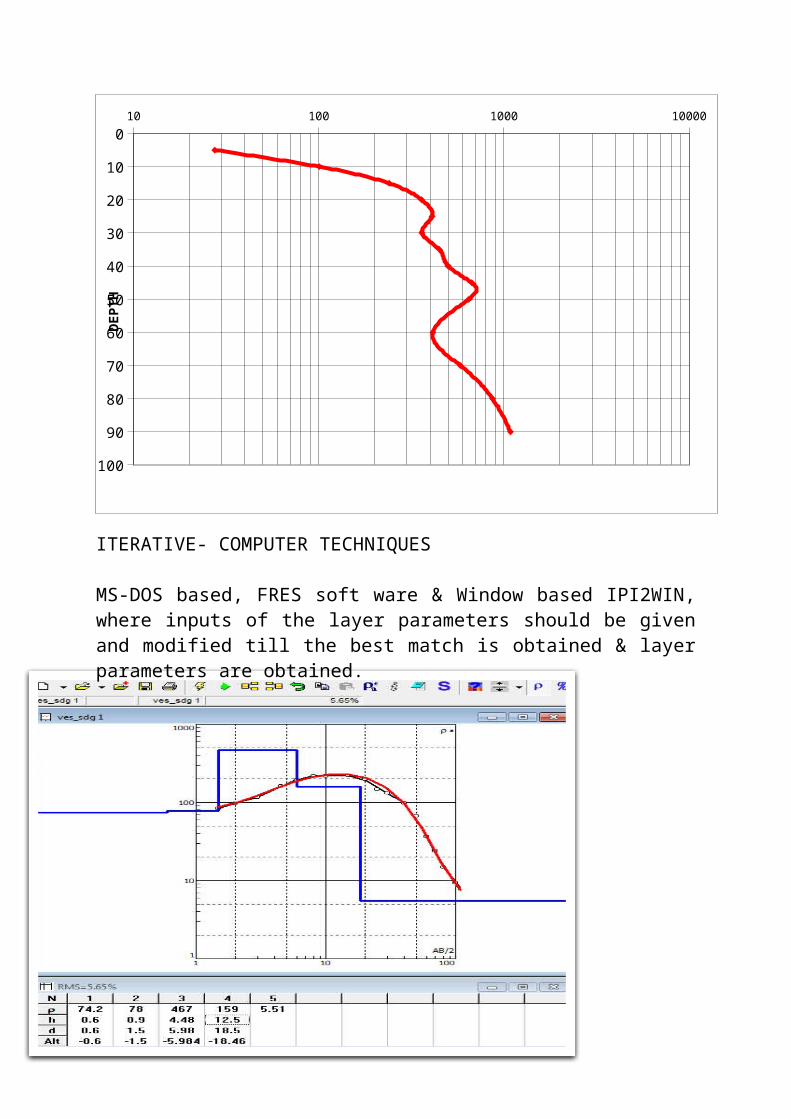
ITERATIVE- COMPUTER TECHNIQUESITERIIJFGNJFNNVMS-DOS based, FRES soft ware & Window based IPI2WIN,where inputs of the layer parameters should be givenand modified till the best match is obtained & layerparameters are obtained.
Rules and Interpretation
Igneous rocks shows very high resistivity because only minorcomponent of pore spaces and so pore fluid.
Metamorphic shows a medium level resistivity because theycontain hydrous minerals and fabrics.
Sedimentary rocks will show very low resistivity because theyhave high porosity and hence they contain pore fluids theywill conduct electricity.
Older rocks generally showing high resistivity due tocompressed rocks, which make them as less porous.
Younger rocks showing low resistivity it is because of lesscompressed rocks will show high porosity and hence high amountof pore fluid.
Normally in resistivity methods we are using some mastercurves for the interpretation of resistivity curves thatobtained from the field data. By the comparison between mastercurve and our graph we can interpret about geophysicalconditions. But Hydrogeological survey don’t need that themaster curves. The presence of water can easily identifiedfrom the graph itself. If water is present in an area thegraph will show different resistivity for different layers andwe can combine that curves. If we can join the two layers witha single line we can say that it is a single layer and itshows the presence of water. That is similar rocks have a widerange in resistivities depending up on the water content.
SUBSURFACE GEOPHYSICAL LOGGING
BOREHOLE LOGGING• Spontaneous Potential (SP)
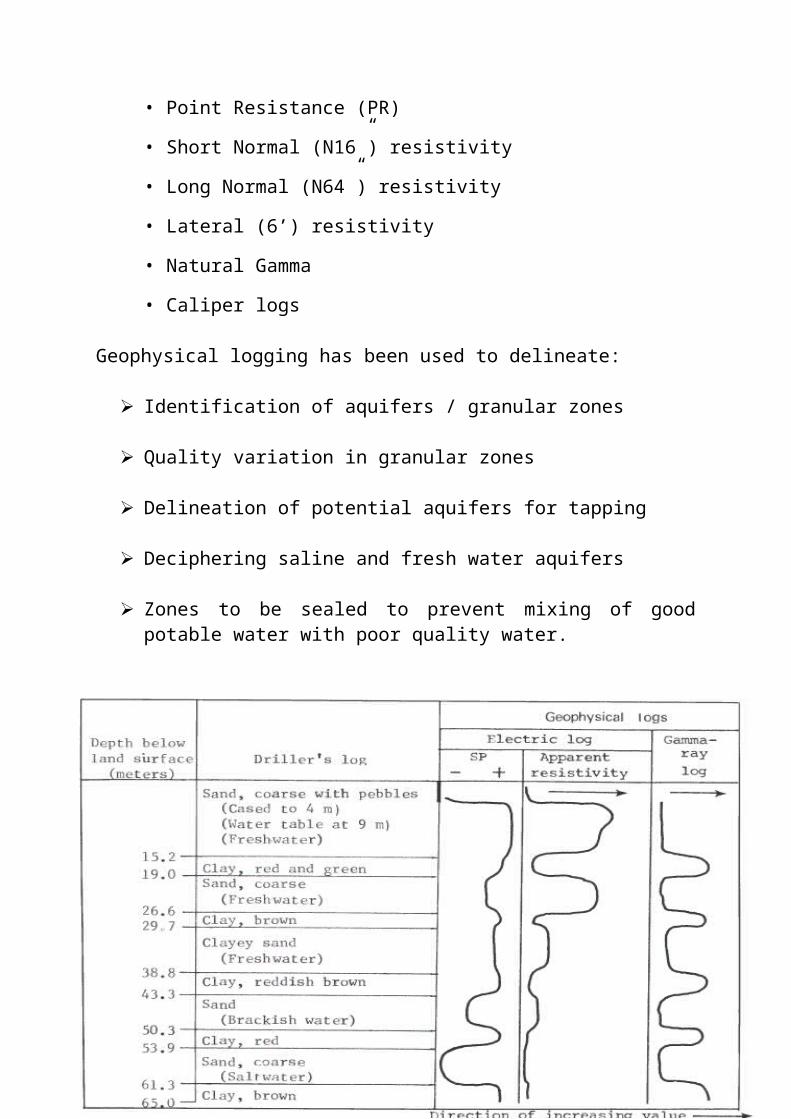
• Point Resistance (PR)
• Short Normal (N16”) resistivity
• Long Normal (N64”) resistivity
• Lateral (6’) resistivity
• Natural Gamma
• Caliper logs
Geophysical logging has been used to delineate:
Identification of aquifers / granular zones
Quality variation in granular zones
Delineation of potential aquifers for tapping
Deciphering saline and fresh water aquifers
Zones to be sealed to prevent mixing of goodpotable water with poor quality water.
CONCLUSIONS:
Geophysical well logging provides many different opportunitiesto investigate the material making up the wall of a borehole, be it regolith or crystalline rock.
A widen range of different sensors provide information which complementary in nature. Best results are obtained by running a suite of logs and analyzing their similarities and differences.
REFERENCES:
Schlumberger, 2000. Beginnings. A brief history of Schlumberger wireline and testing, www site: http://www.1.slb.com/recr/library/wireline/brochure/beginnings.html
Water Quality:
• Groundwater Quality
– Sampling Plan
– Field Measured Parameters
• pH
• Alkalinity
• Conductance
• Salinity
• Dissolved Oxygen
• Turbidity
– Chemical Equivalence
– Laboratory QA/QC
– Diagrams
• Piper
• Stiff
– Water Quality Classification
– Irrigation Water
• Sodium
• Salinity
– Arsenic
– Iron Bacteria
Basic Water Quality Parameters:
• PH
• Specific conductance (EC)
• Salinity
• Total dissolved solids (TDS)
• Turbidity
• Dissolved oxygen (DO)
• Biochemical oxygen demand (BOD)
• Temperature
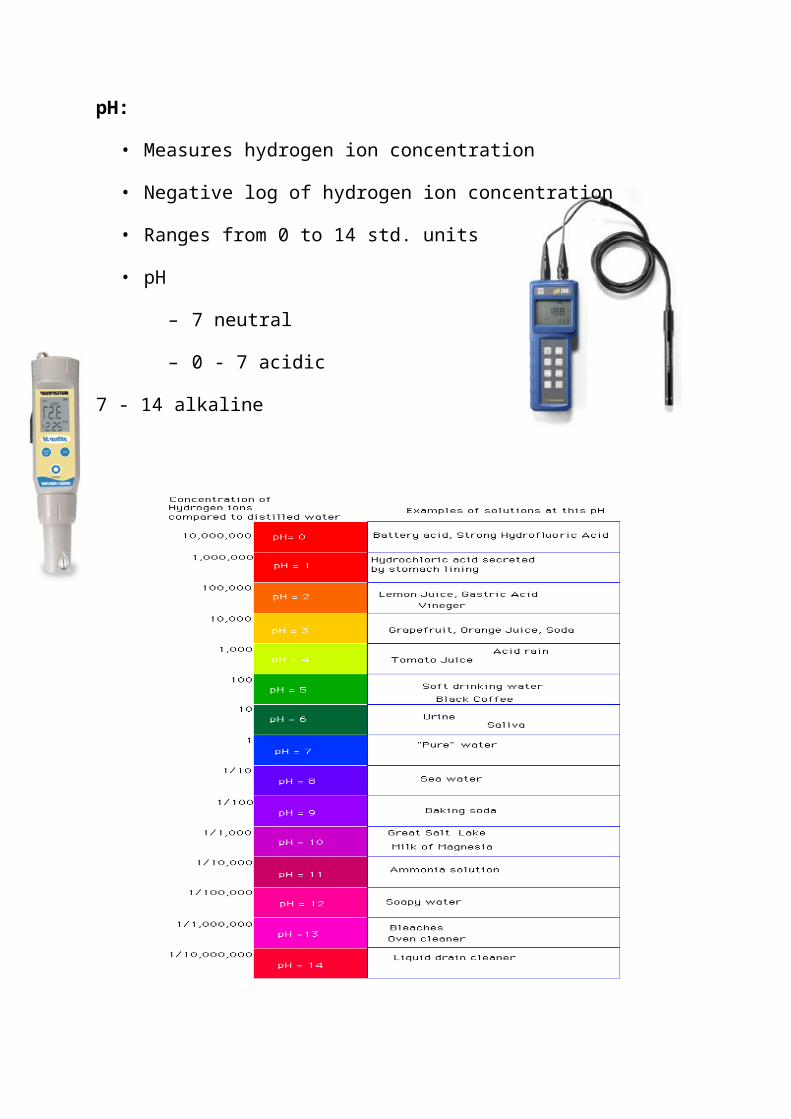
pH:
• Measures hydrogen ion concentration
• Negative log of hydrogen ion concentration
• Ranges from 0 to 14 std. units
• pH
– 7 neutral
– 0 - 7 acidic
7 - 14 alkaline
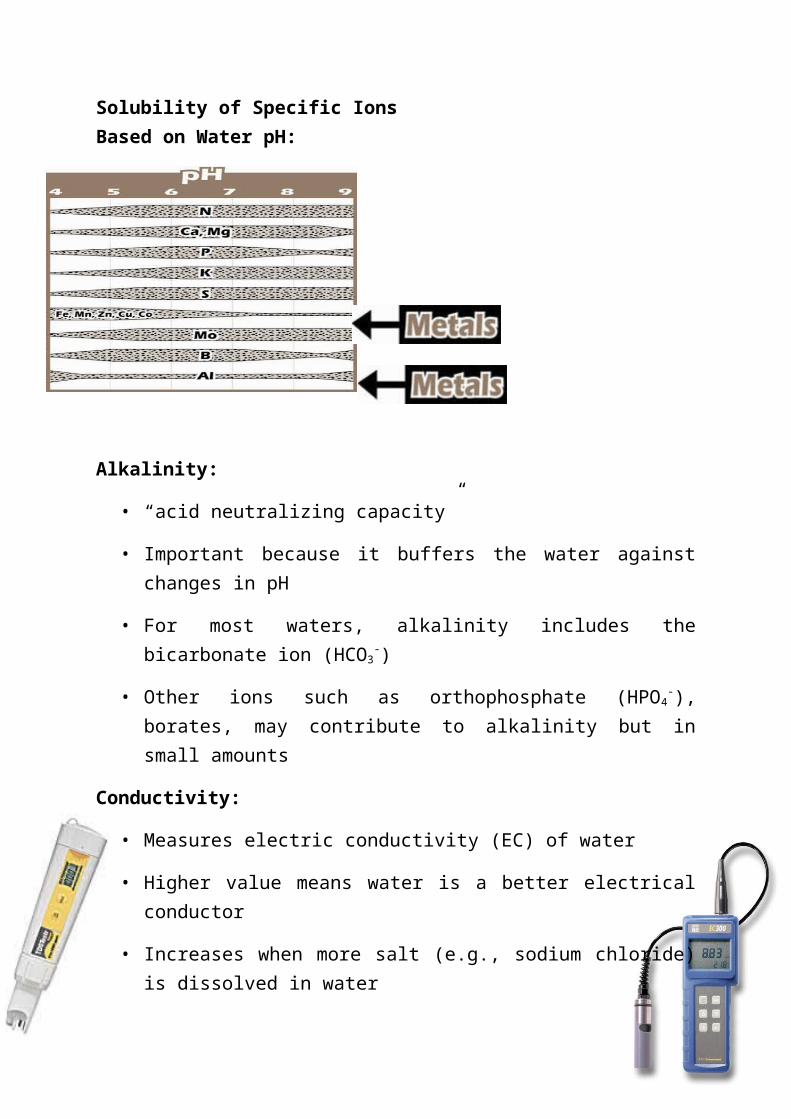
Solubility of Specific IonsBased on Water pH:
Alkalinity:
• “acid neutralizing capacity”
• Important because it buffers the water againstchanges in pH
• For most waters, alkalinity includes thebicarbonate ion (HCO3
-)
• Other ions such as orthophosphate (HPO4-),
borates, may contribute to alkalinity but insmall amounts
Conductivity:
• Measures electric conductivity (EC) of water
• Higher value means water is a better electricalconductor
• Increases when more salt (e.g., sodium chloride)is dissolved in water
• Indirect measure of salinity
• Units are μmhos/cm at 25o C or μsiemens/cm
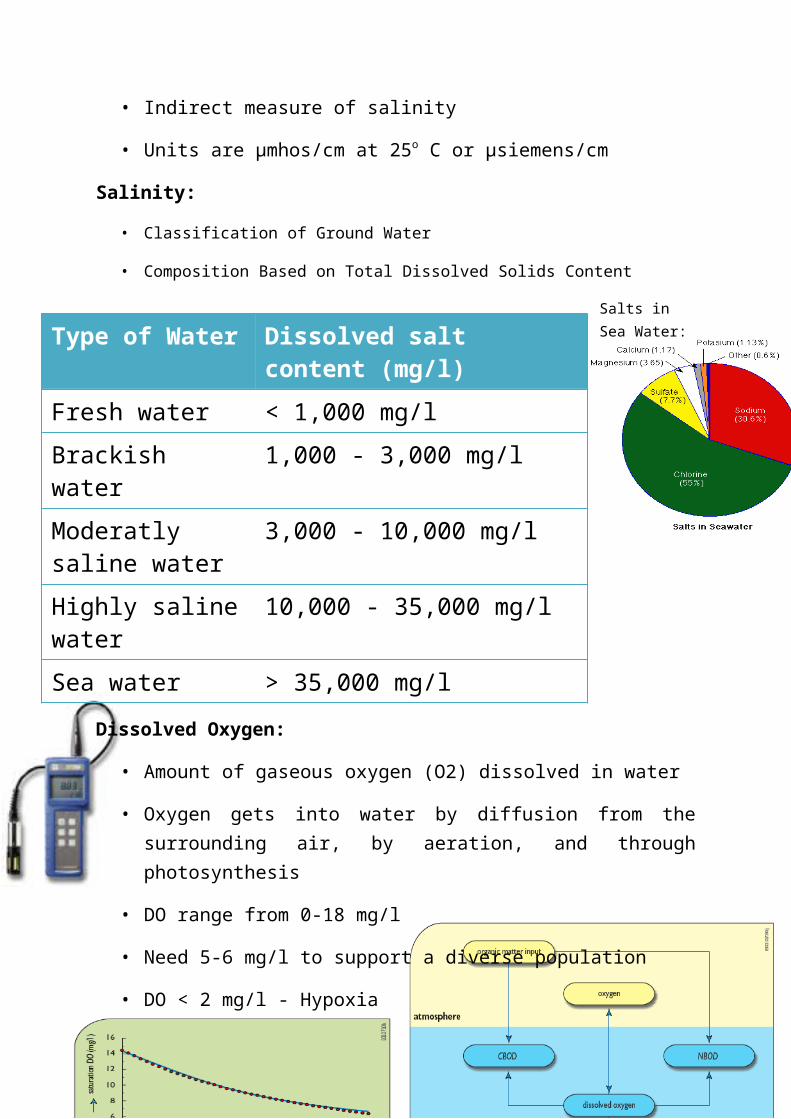
Salinity:
• Classification of Ground Water
• Composition Based on Total Dissolved Solids Content
Salts in Sea Water:
Dissolved Oxygen:
• Amount of gaseous oxygen (O2) dissolved in water
• Oxygen gets into water by diffusion from thesurrounding air, by aeration, and throughphotosynthesis
• DO range from 0-18 mg/l
• Need 5-6 mg/l to support a diverse population
• DO < 2 mg/l - Hypoxia
Type of Water Dissolved salt content (mg/l)
Fresh water < 1,000 mg/lBrackish water
1,000 - 3,000 mg/l
Moderatly saline water
3,000 - 10,000 mg/l
Highly salinewater
10,000 - 35,000 mg/l
Sea water > 35,000 mg/l
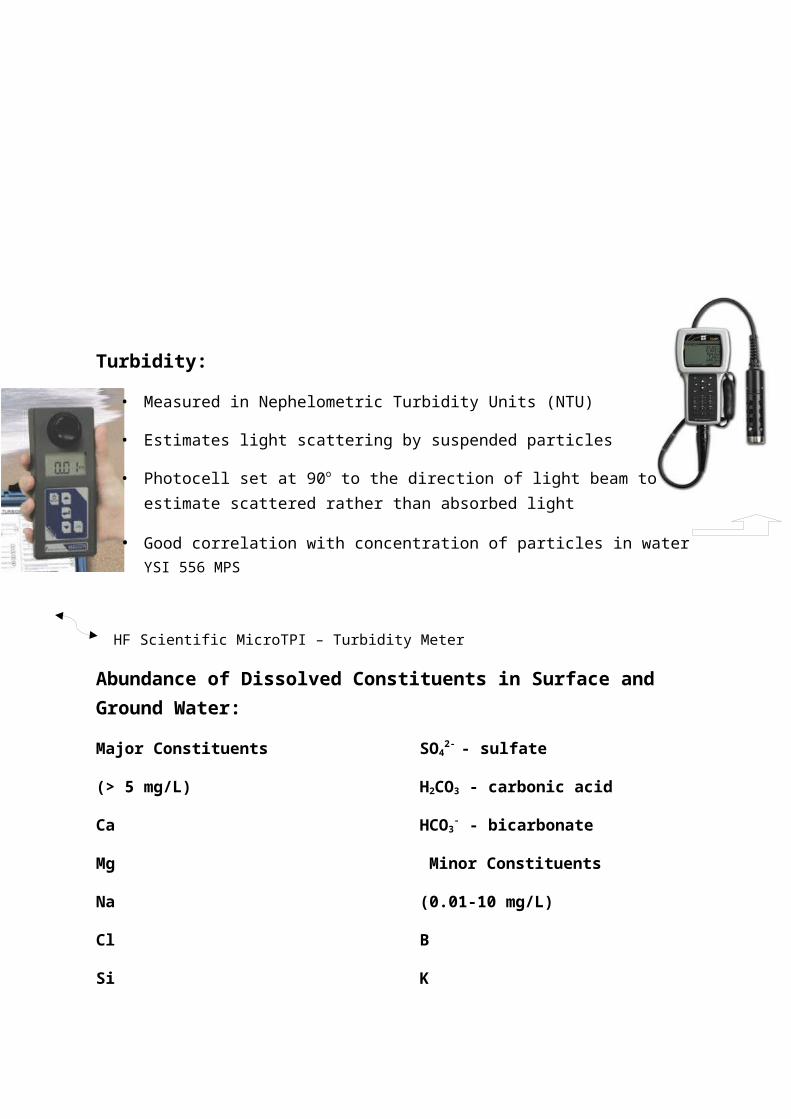
Turbidity:
• Measured in Nephelometric Turbidity Units (NTU)
• Estimates light scattering by suspended particles
• Photocell set at 90o to the direction of light beam to estimate scattered rather than absorbed light
• Good correlation with concentration of particles in waterYSI 556 MPS
HF Scientific MicroTPI – Turbidity Meter
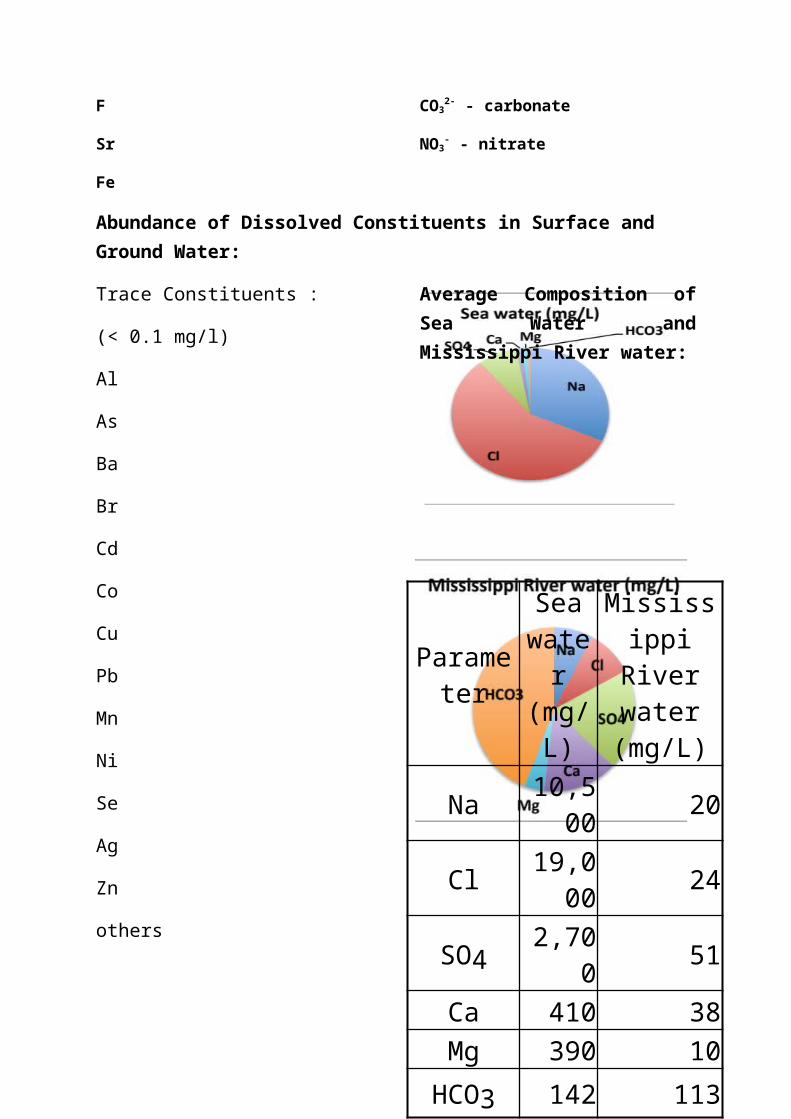
Abundance of Dissolved Constituents in Surface and Ground Water:
Major Constituents
(> 5 mg/L)
Ca
Mg
Na
Cl
Si
SO42- - sulfate
H2CO3 - carbonic acid
HCO3- - bicarbonate
Minor Constituents
(0.01-10 mg/L)
B
K
F
Sr
Fe
CO32- - carbonate
NO3- - nitrate
Abundance of Dissolved Constituents in Surface and Ground Water:
Trace Constituents :
(< 0.1 mg/l)
Al
As
Ba
Br
Cd
Co
Cu
Pb
Mn
Ni
Se
Ag
Zn
others
Average Composition ofSea Water andMississippi River water:
Parameter
Seawater
(mg/L)
MississippiRiverwater(mg/L)
Na 10,500 20
Cl 19,000 24
SO4 2,70
0 51
Ca 410 38Mg 390 10HCO3 142 113
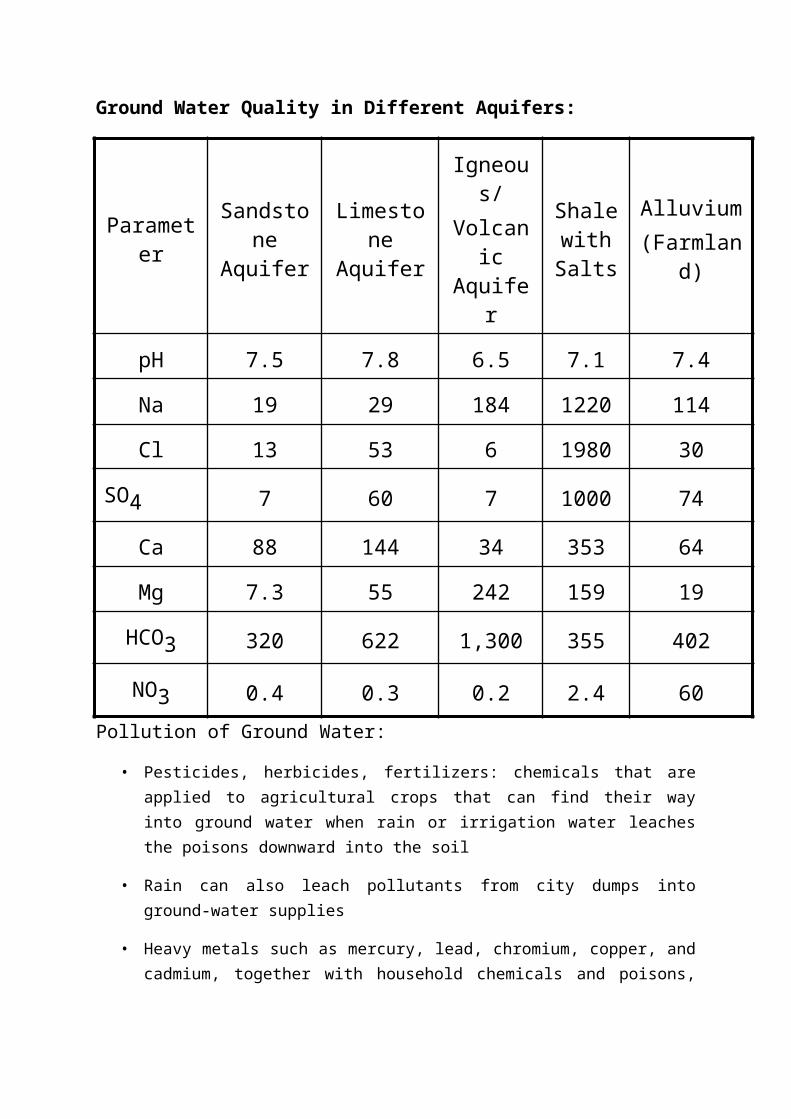
Ground Water Quality in Different Aquifers:
Parameter
Sandstone
Aquifer
Limestone
Aquifer
Igneous/
Volcanic
Aquifer
ShalewithSalts
Alluvium(Farmlan
d)
pH 7.5 7.8 6.5 7.1 7.4
Na 19 29 184 1220 114
Cl 13 53 6 1980 30
SO4 7 60 7 1000 74
Ca 88 144 34 353 64
Mg 7.3 55 242 159 19
HCO3 320 622 1,300 355 402
NO3 0.4 0.3 0.2 2.4 60Pollution of Ground Water:
• Pesticides, herbicides, fertilizers: chemicals that areapplied to agricultural crops that can find their wayinto ground water when rain or irrigation water leachesthe poisons downward into the soil
• Rain can also leach pollutants from city dumps intoground-water supplies
• Heavy metals such as mercury, lead, chromium, copper, andcadmium, together with household chemicals and poisons,
can all be concentrated in ground-water supplies beneathdumps
Pollution of Ground Water (cont.):
• liquid and solid wastes from septic tanks, sewage plants,and animal feedlots and slaughterhouses may containbacteria, viruses, and parasites that can contaminateground water
• acid mine drainage from coal and metal mines cancontaminate both surface and ground water
• radioactive waste can cause the pollution of ground waterdue to the shallow burial of low-level solid and liquidradioactive wastes from the nuclear power industry
• pumping wells can cause or aggravate ground-waterpollution
Effects of Ground-Water Action:
Water-table slope is reversed by pumping, changing direction of the ground-water flow, and polluting the well
Water moves along fractures and bedding planes in limestone, dissolving the limestone to form caves below the water table
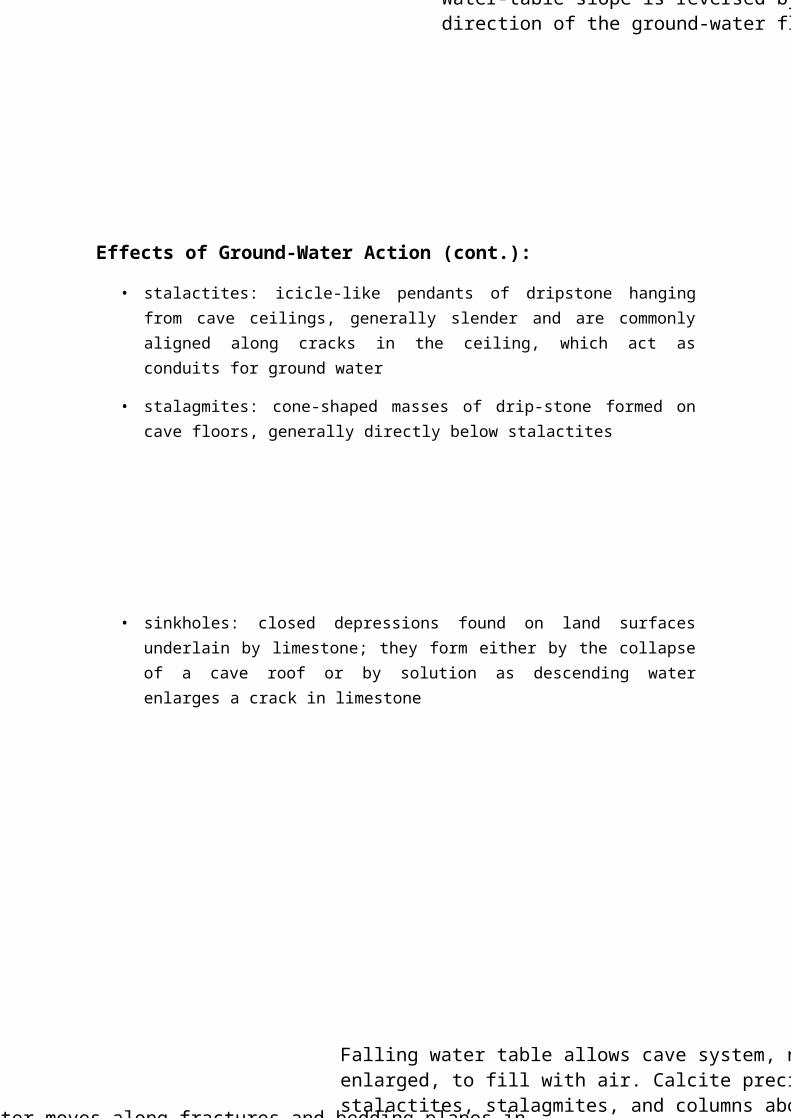
Falling water table allows cave system, now greatly enlarged, to fill with air. Calcite precipitation forms stalactites, stalagmites, and columns above the water table
Effects of Ground-Water Action (cont.):
• stalactites: icicle-like pendants of dripstone hangingfrom cave ceilings, generally slender and are commonlyaligned along cracks in the ceiling, which act asconduits for ground water
• stalagmites: cone-shaped masses of drip-stone formed oncave floors, generally directly below stalactites
• sinkholes: closed depressions found on land surfacesunderlain by limestone; they form either by the collapseof a cave roof or by solution as descending waterenlarges a crack in limestone
Water moves along fractures and bedding planes in limestone, dissolving the limestone to form caves below the water table
A collapse sinkhole that formed suddenly in Winter Park, Florida, in 1981
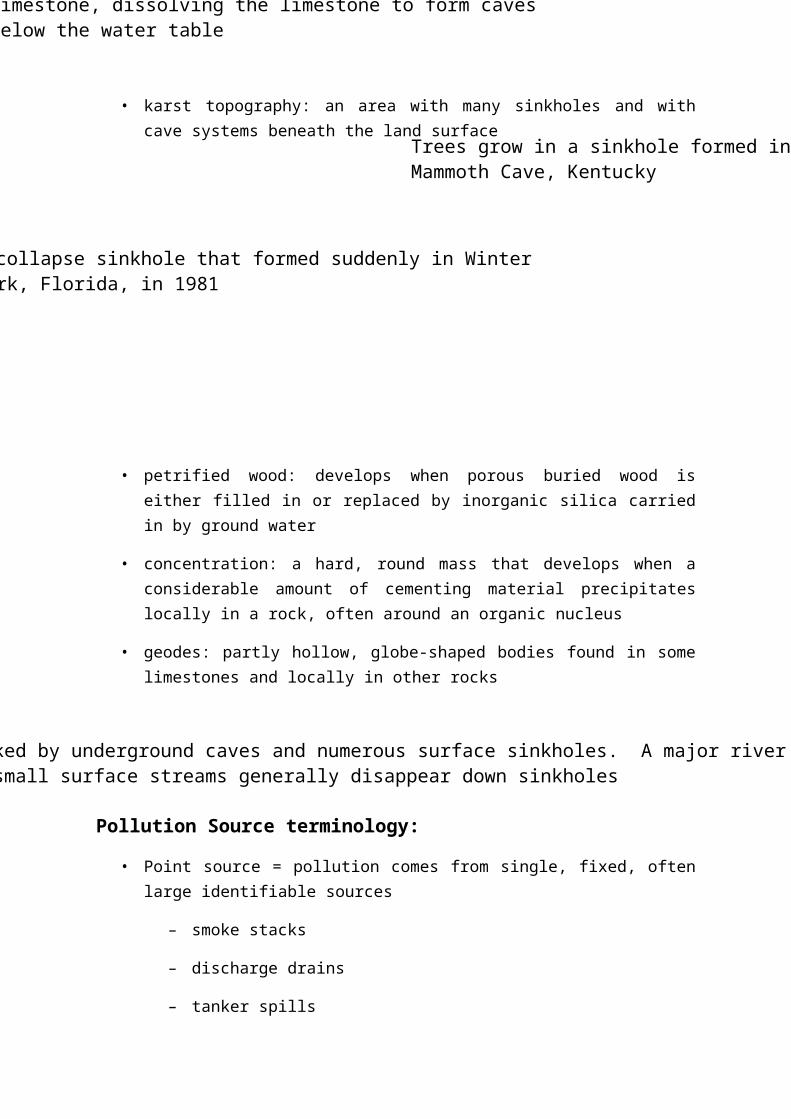
Trees grow in a sinkhole formed in limestone nearMammoth Cave, Kentucky
Karst topography is marked by underground caves and numerous surface sinkholes. A major river may cross the region, but small surface streams generally disappear down sinkholes
• karst topography: an area with many sinkholes and withcave systems beneath the land surface
• petrified wood: develops when porous buried wood iseither filled in or replaced by inorganic silica carriedin by ground water
• concentration: a hard, round mass that develops when aconsiderable amount of cementing material precipitateslocally in a rock, often around an organic nucleus
• geodes: partly hollow, globe-shaped bodies found in somelimestones and locally in other rocks
Pollution Source terminology:
• Point source = pollution comes from single, fixed, oftenlarge identifiable sources
– smoke stacks
– discharge drains
– tanker spills
• Non-point source = pollution comes from dispersed sources
– agricultural runoff
– street runoff
Types of Water Pollution:
• Sediment
– logging, roadbuilding, erosion
• Oxygen-demanding wastes
– human waste, storm sewers, runoff from agriculture,grazing and logging, many others
• Nutrient enrichment = Eutrophication
– N, P from fertilizers, detergents
– leads to increased growth in aquatic systems, ultimatelymore non-living organic matter
Types of Water Pollution (con’t):
• Disease-causing organisms
– from untreated sewage, runoff from feed lots
• Toxic chemicals
– pesticides, fertilizers, industrial chemicals
• Heavy metals
– lead, mercury
• Acids (to discuss later)
• Elevated temperatures = Thermal Pollution
– water is used for cooling purposes, then heatedwater is returned to its original source
– any increase in temperature, even a few degrees, maysignificantly alter some aquatic ecosystems.
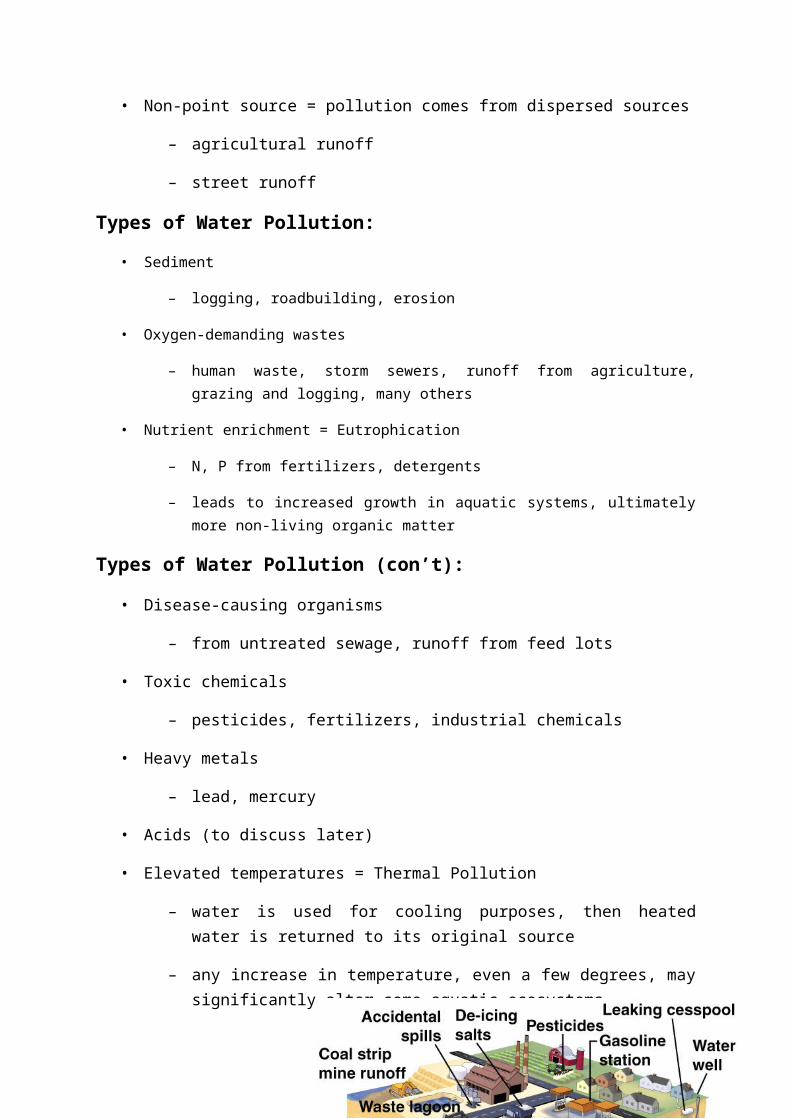
Groundwater Pollution:
• Agricultural products
• Underground storage tanks
• Landfills
• Septic tanks
• Surface
impoundments
Oil Spills:
• Exxon Valdez released 42 million liters of oil in PrinceWilliam Sound, contaminating 1500 km of Alaska coastlinein 1989
• Was the cleanup effective?
• Most marine oil pollution comes from non-point sources:
– runoff from streets
– improper disposal of used oil
– discharge of oil-contaminated ballast water fromtankers
Some Hazardous effects of pollution occurred acrossthe world:
Minamata disease (1950-1960s, Japan)- Methyl mercury poising of central nervous system due to contaminatedfish.
Trace Metal Pollution Epidemics •Jinstu river pollution (Japan)- Cadmium poising (Itai-Itai (pain-pain) disease- bone damage) due to dischargefrom zinc mine.
•Aluminium in drinking water (Camelford, England)-Excess Al2SO4 during water treatment- Neurologicaldisorders.
Other places of India listed in the Report
•Bhopal – 1984, Leakage of Methyl isocyanate gas.
•Kanpur- Chromium.
•Picnic gardens (Kolkata) – Lead in air
WATER BORNE DISEASE:
GASTROENTITIS
DIARRHOEA
TYPHOID
MALARIA
CHOLERA
HEPATITIS/JAUNDICE
FLUOROSIS
INTESTINAL WORM INFESTATIONS
“About 80% Diseases are Water Borne”.
- WHO
Content (extreme hardness) cause deposits to occurwhere blood flow the slowest.
Around the joints Arthritis
Along small Arteries Hardness ofarteries
In small veins VaricoseVeins
In inner ear Lossof Hearing
In LungsEmphysema
In lens of the eye Cataracts.
FLUORIDE CONCENTRATION AND HEALTH EFFECTS :•<0.5 mg/l Dental caries
•0.5-1.5 mg/l Promotes dental health
•1.5-4 mg/l Dental fluorosis
•>4 mg/l Dental, skeletal fluorosis
•>10 mg/l Crippling fluorosis FLUROSIS:
Permissible limit of fluoride in drinking water is1.5 ppm and highest desirable limit 1 ppm. Fluorideconcentration above 1.5 ppm in drinking water causedental fluorosis much higher concentration skeletalfluorosis. Low fluoride concentration (0.5 ppm)provide protection against dental caries. ARSENIC:
• Occur in ground water from arseniferous belt.
• Industrial waste, agricultural insecticide. • High arsenic causes 1) various type of
dermatological lesions, muscular weakness,paralysis of lower limbs, can also cause skin andlung cancer.
• Acceptable limit – 0.05 mg/l.Heavy Metals:•Present as mineral in soil and rocks of earth.
•Human activities, Battery – Lead & Nickel Textile - Copper Photography – Silver Steel production – Iron
SUITABILITY FOR AGRICULTURE:
• Excess salts and some specific elements posehazard to plant growth
• A build up of sodium in the cation exchangecomplex impairs permeability of the soil – sodiumor alkali hazard
• Evaluated by calculating Salinity hazard (EC),sodium adsorption ratio (SAR) and residual sodiumcarbonate (RSC)
• Diagrams such as USSL, Wilcox are used toevaluate irrigation suitability
SODIUM ABSORBTION SPECTROSCOPY (SAR):
SAR is calculated from
SAR= Na√Ca+Mg /2
Concentrations of Na, Ca and Mg are expressed in meL-1
Increased salinity requires roots to overcomeosmotic pressure excreted by saline waters.This results in inability to absorb part ofnutrients.
Based on conductivity and SAR the United StatesSalinity Laboratory (USSL) classifiedirrigation waters into 16 classes. i.e. C1 toC4 and S1 to S4.
ALKALI HAZARD:• Waters rich in Na exchanges for Ca2+ and Mg2+ in
the soil- reduces soil permeability • Waters rich in HCO3- + CO32- i.e. residual sodium
carbonate (RSC) may precipitate Ca, and increase% Na
• RSC >2.5 meq L-1 are not suitable RSC (meq L-1) = (HCO3- + CO32-) – (Ca2++Mg2+)
• Chemical analyses of large number of samplesyield voluminous data. Data analysis
• graphical methods – Piper, Durov, Collins bar • statistical methods - Range, SD, multivariate
techniques • Ionic ratios - HCO3 /Cl, Ca/Mg
IS:10500 – DRINKING WATER
Parameters Requirements/ Desirable Limit
pH 6.5-8.5 Total Dissolved Solids (TDS) in mg/l 500 Total Hardness (mg/l) 300 Chloride (mg/l) 250 Fluoride (mg/l) 1.0 Nitrate (mg/l) 45 Sulphate (mg/l) 200 Cyanide (mg/l) 0.05 Total Alkalinity (mg/l) 200 Arsenic (mg/l) 0.01

Mercury (mg/l) 0.001 Cadmium (mg/l) 0.01 Lead (mg/l) 0.05 Iron (mg/l) 0.3 Manganese (mg/l) 0.1 Chromium as Cr6+ (mg/l) 0.05 Copper (mg/l) 0.05
Zinc (mg/l) 5.0Pesticide absent
E. coliform Bacteria Nil / 100ml
EFFECT OF WATER POLLUTION & DISEASE:
Minamata Disease Fluorosis Calcified ligament
Mycobacterium ulcerans DISEASE(BURULI ULCER)
Toxic effect of Arsenic
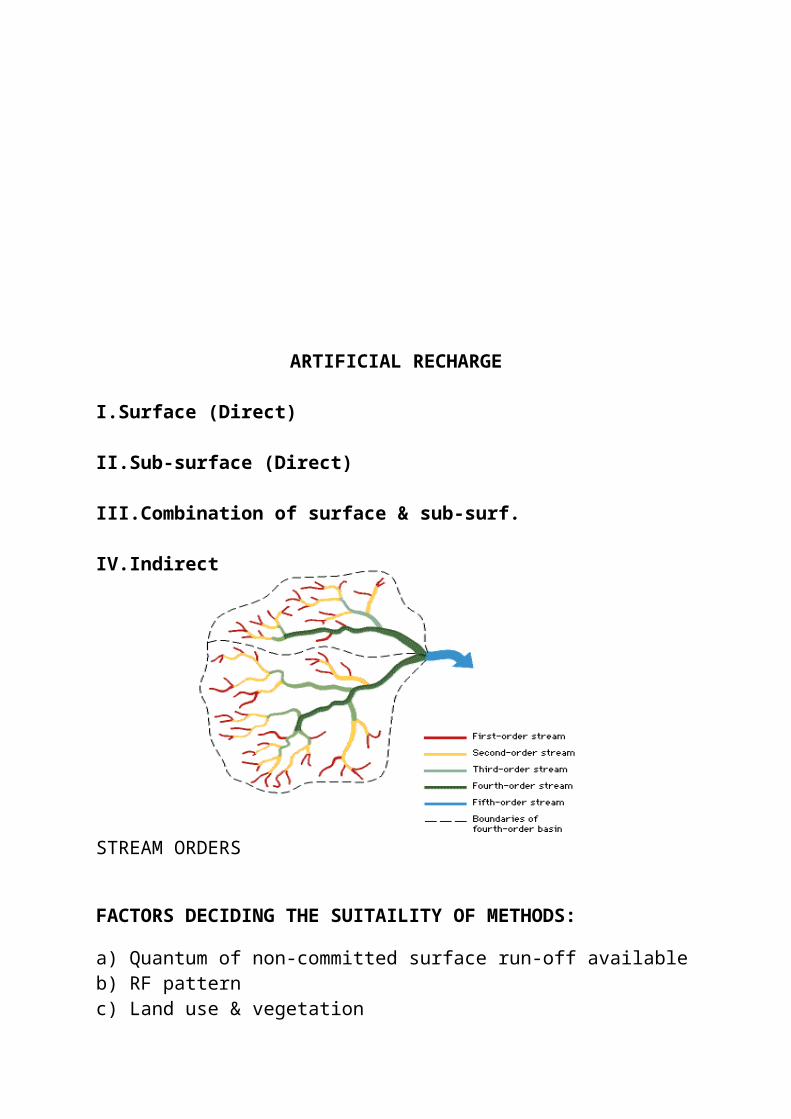
ARTIFICIAL RECHARGE
I.Surface (Direct)
II.Sub-surface (Direct)
III.Combination of surface & sub-surf.
IV.Indirect
STREAM ORDERS
FACTORS DECIDING THE SUITAILITY OF METHODS:
a) Quantum of non-committed surface run-off availableb) RF pattern c) Land use & vegetation
c) Topography & terrain profile d) Soil type & depthe) Thickness of weathered / granular zones f) Hydrological & hydrogeological characteristics g) Socio-economic conditions & infrastructuralfacilities available h) Environmental & ecological impacts of artificialrecharge schemes proposed.
I. Surface Methods
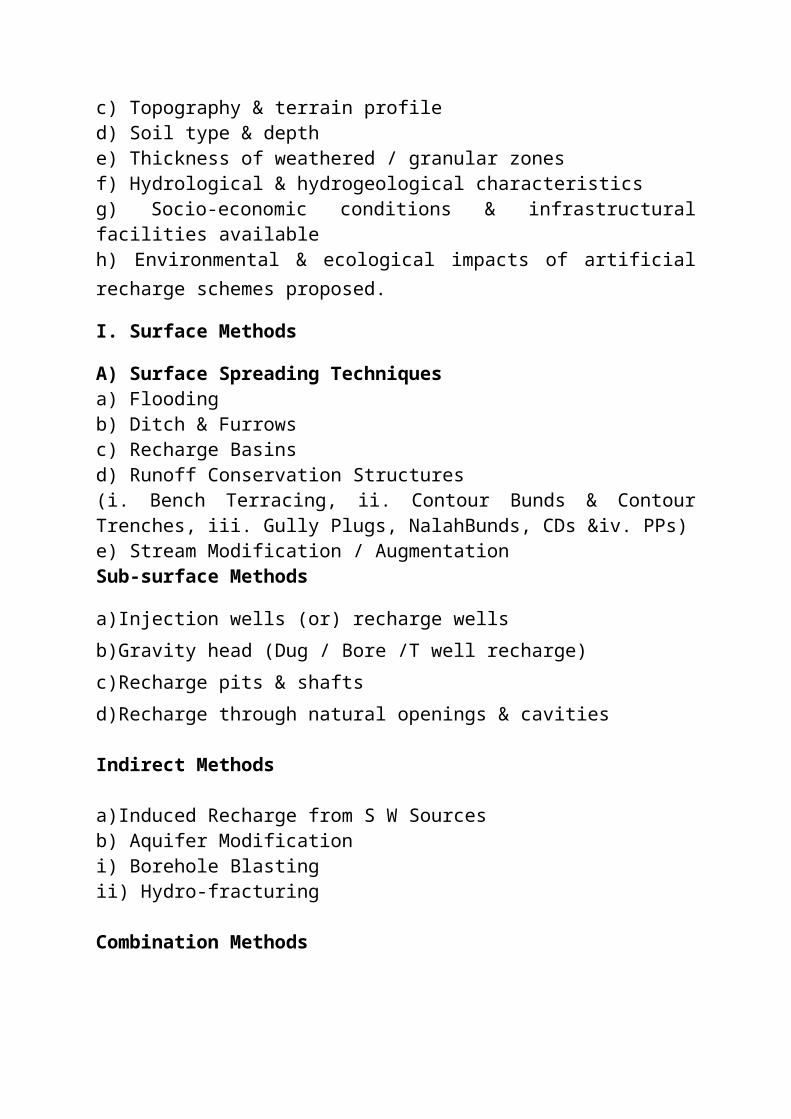
A) Surface Spreading Techniques a) Flooding b) Ditch & Furrows c) Recharge Basins d) Runoff Conservation Structures (i. Bench Terracing, ii. Contour Bunds & ContourTrenches, iii. Gully Plugs, NalahBunds, CDs &iv. PPs)e) Stream Modification / AugmentationSub-surface Methods
a)Injection wells (or) recharge wells b)Gravity head (Dug / Bore /T well recharge) c)Recharge pits & shafts d)Recharge through natural openings & cavities
Indirect Methods
a)Induced Recharge from S W Sources b) Aquifer Modification i) Borehole Blasting ii) Hydro-fracturing
Combination Methods
•Basin (or) percolation tanks with Recharge Pits /Shafts / Wells
Surface Spreading Techniques
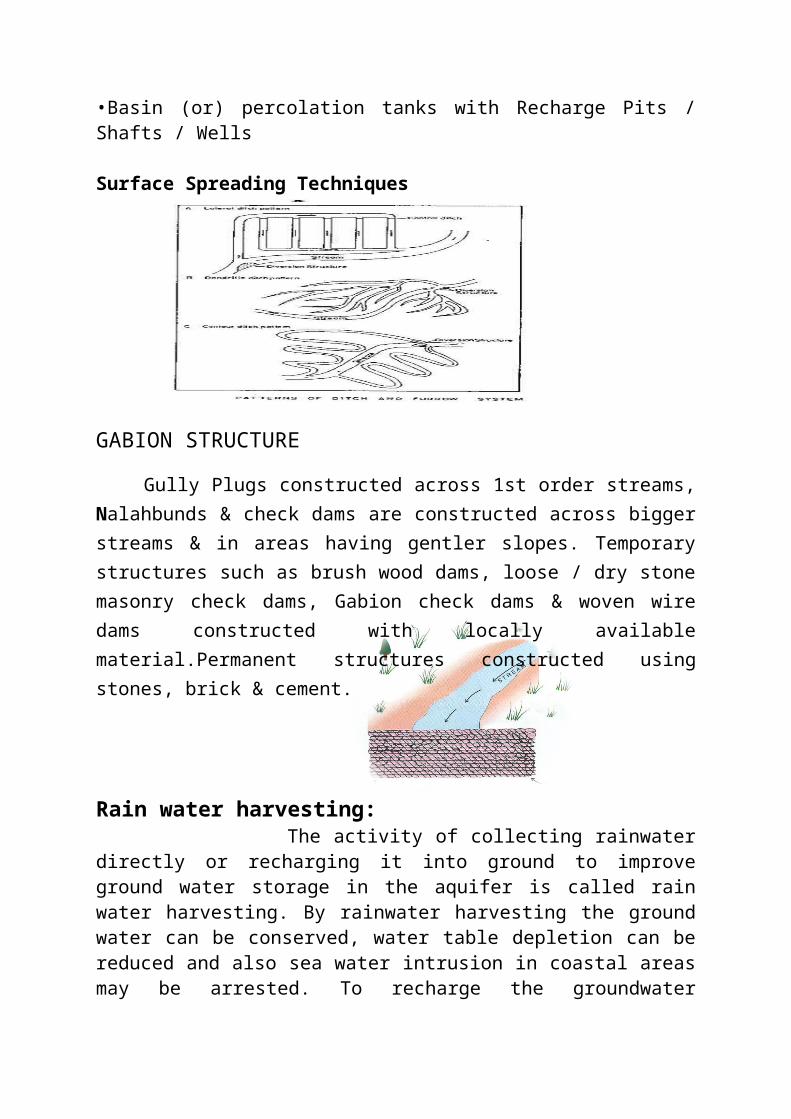
GABION STRUCTURE
Gully Plugs constructed across 1st order streams,Nalahbunds & check dams are constructed across biggerstreams & in areas having gentler slopes. Temporarystructures such as brush wood dams, loose / dry stonemasonry check dams, Gabion check dams & woven wiredams constructed with locally availablematerial.Permanent structures constructed usingstones, brick & cement.
Rain water harvesting: The activity of collecting rainwaterdirectly or recharging it into ground to improveground water storage in the aquifer is called rainwater harvesting. By rainwater harvesting the groundwater can be conserved, water table depletion can bereduced and also sea water intrusion in coastal areasmay be arrested. To recharge the groundwater
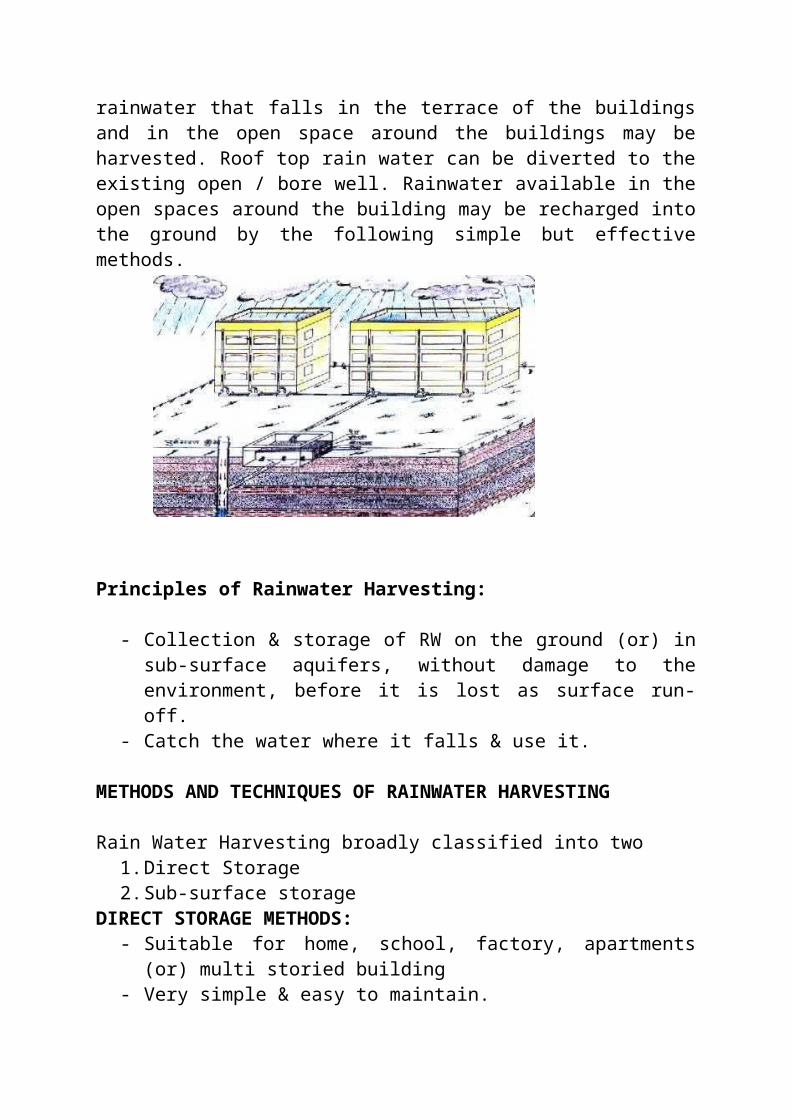
rainwater that falls in the terrace of the buildingsand in the open space around the buildings may beharvested. Roof top rain water can be diverted to theexisting open / bore well. Rainwater available in theopen spaces around the building may be recharged intothe ground by the following simple but effectivemethods.
Principles of Rainwater Harvesting:
- Collection & storage of RW on the ground (or) insub-surface aquifers, without damage to theenvironment, before it is lost as surface run-off.
- Catch the water where it falls & use it.
METHODS AND TECHNIQUES OF RAINWATER HARVESTING
Rain Water Harvesting broadly classified into two1.Direct Storage2.Sub-surface storage
DIRECT STORAGE METHODS:- Suitable for home, school, factory, apartments
(or) multi storied building- Very simple & easy to maintain.
- Most suitable for any Hydrogeological conditions
STEPS INVOLVEED:- Make provision for a clean roof as possible as a
collector of RF - Draw rainwater down through pipes & gutters as
necessary - Make provision (Bye-pass arrangement) for 1st
wash to filter the roof water - Store in a sump, tank (or) lined pond for later
use
Water stored may be used for:Non-potable purpose like gardening, flushing, washingclothes, etc.,All purpose but only afterconfirming portablequalities of harvested water.Only potable purpose after ensuring quality & wherethere is no alternative source is contaminated.SUBSURFACE STORAGE METHOD
RECHARGE PIT:Permeable formation in the surface Roof area- 100 Sq. m.One Unit/100 Sq. m.One Unit = 1 to 2 m wide 2 to 3 m deep Boulders (5-20 cm) 50%, Gravels (5-10 cm) 20% &Coarse sand (1.5 to 2 mm) 15% in graded form 15% space empty as free board Silt content that will comewith runoff will be deposited on the top of the coarse sand layer & can easily be removed.
Plastic mesh in between these materials are placed sothat they are not be mixed. Back filled portion may be kept unlined and the remaining portion may be
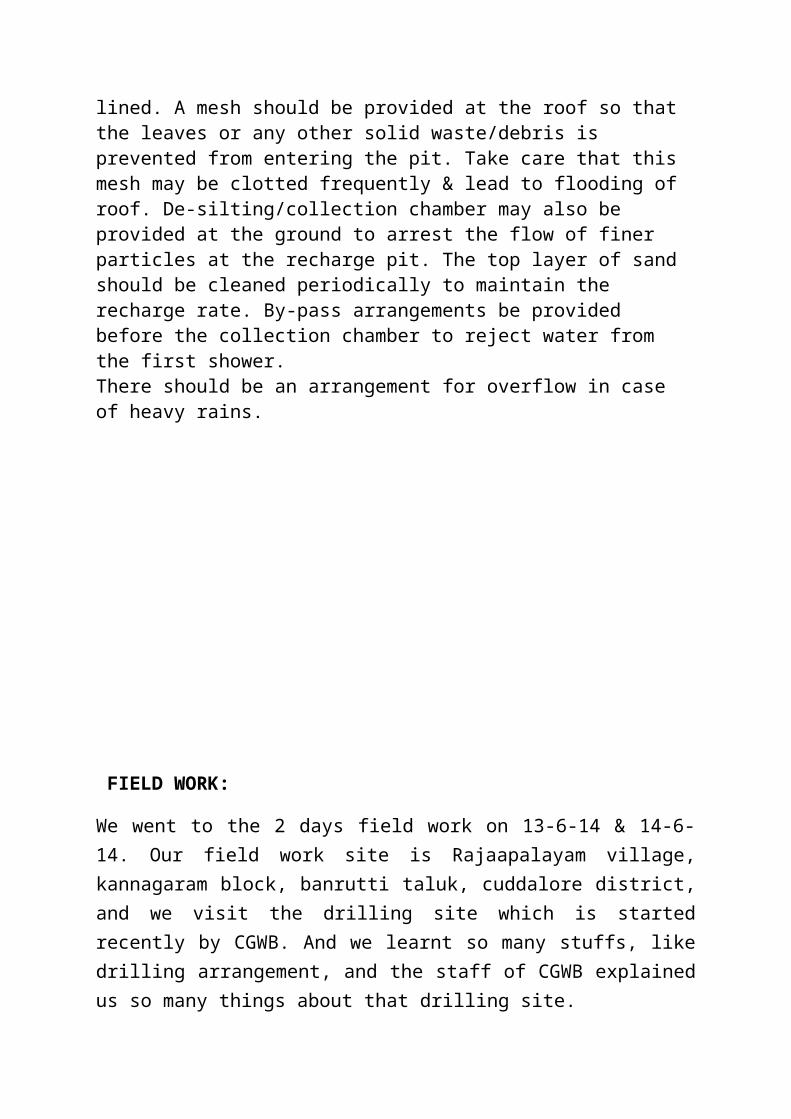
lined. A mesh should be provided at the roof so that the leaves or any other solid waste/debris is prevented from entering the pit. Take care that this mesh may be clotted frequently & lead to flooding of roof. De-silting/collection chamber may also be provided at the ground to arrest the flow of finer particles at the recharge pit. The top layer of sand should be cleaned periodically to maintain the recharge rate. By-pass arrangements be provided before the collection chamber to reject water from the first shower.There should be an arrangement for overflow in case of heavy rains.
FIELD WORK:
We went to the 2 days field work on 13-6-14 & 14-6-14. Our field work site is Rajaapalayam village,kannagaram block, banrutti taluk, cuddalore district,and we visit the drilling site which is startedrecently by CGWB. And we learnt so many stuffs, likedrilling arrangement, and the staff of CGWB explainedus so many things about that drilling site.
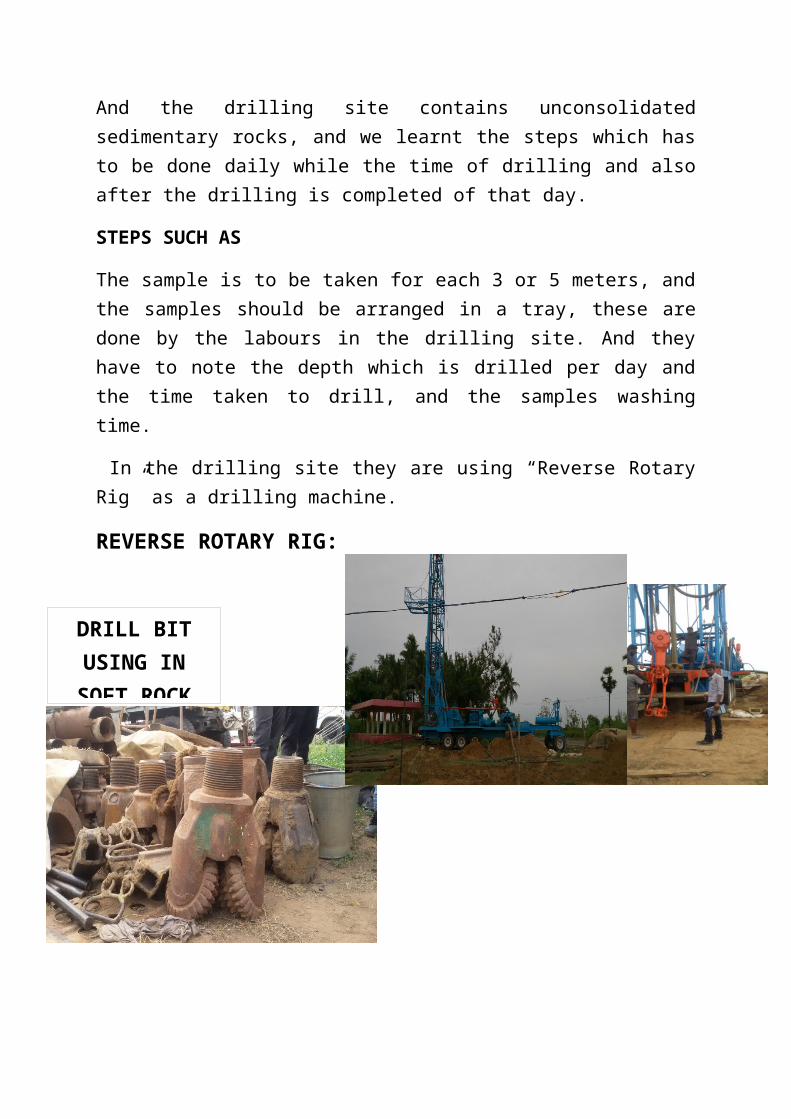
DRILL BITUSING INSOFT ROCK
And the drilling site contains unconsolidatedsedimentary rocks, and we learnt the steps which hasto be done daily while the time of drilling and alsoafter the drilling is completed of that day.
STEPS SUCH AS
The sample is to be taken for each 3 or 5 meters, andthe samples should be arranged in a tray, these aredone by the labours in the drilling site. And theyhave to note the depth which is drilled per day andthe time taken to drill, and the samples washingtime.
In the drilling site they are using “Reverse RotaryRig” as a drilling machine.
REVERSE ROTARY RIG:
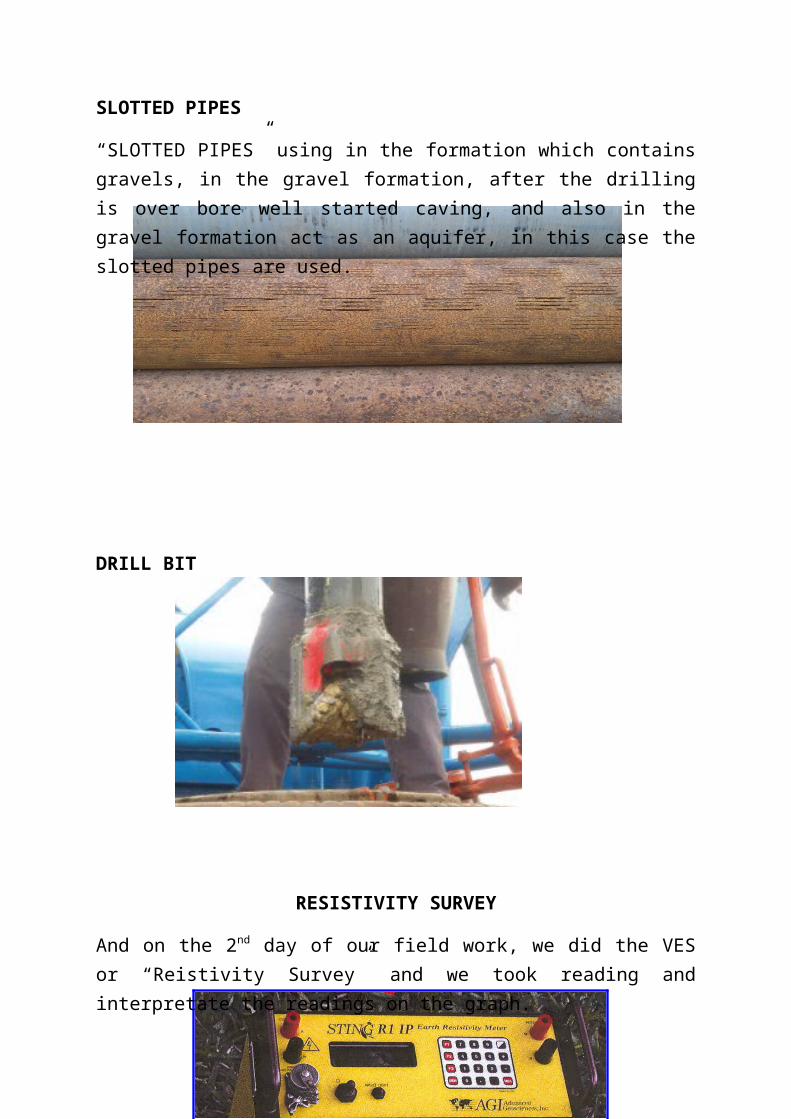
SLOTTED PIPES
“SLOTTED PIPES” using in the formation which containsgravels, in the gravel formation, after the drillingis over bore well started caving, and also in thegravel formation act as an aquifer, in this case theslotted pipes are used.
DRILL BIT
RESISTIVITY SURVEY
And on the 2nd day of our field work, we did the VESor “Reistivity Survey” and we took reading andinterpretate the readings on the graph.
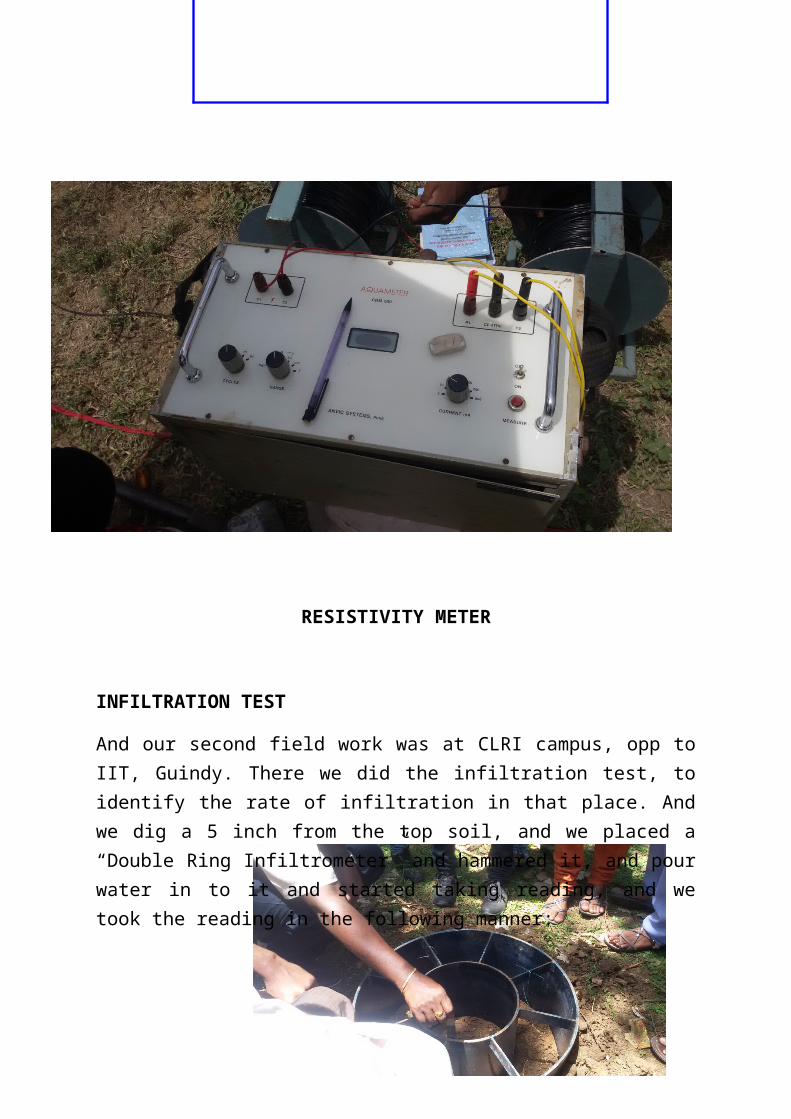
RESISTIVITY METER
INFILTRATION TEST
And our second field work was at CLRI campus, opp toIIT, Guindy. There we did the infiltration test, toidentify the rate of infiltration in that place. Andwe dig a 5 inch from the top soil, and we placed a“Double Ring Infiltrometer” and hammered it, and pourwater in to it and started taking reading, and wetook the reading in the following manner:
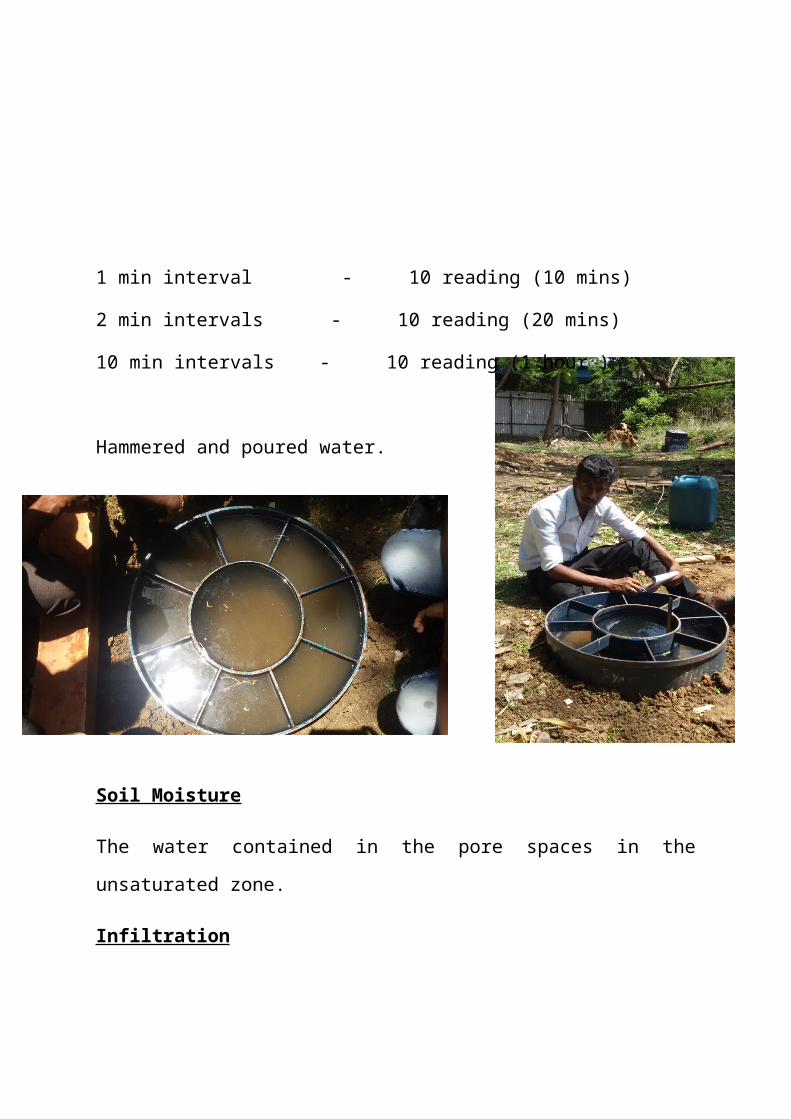
1 min interval - 10 reading (10 mins)
2 min intervals - 10 reading (20 mins)
10 min intervals - 10 reading (1 hour )
Hammered and poured water.
Soil Moisture
The water contained in the pore spaces in the
unsaturated zone.
Infiltration
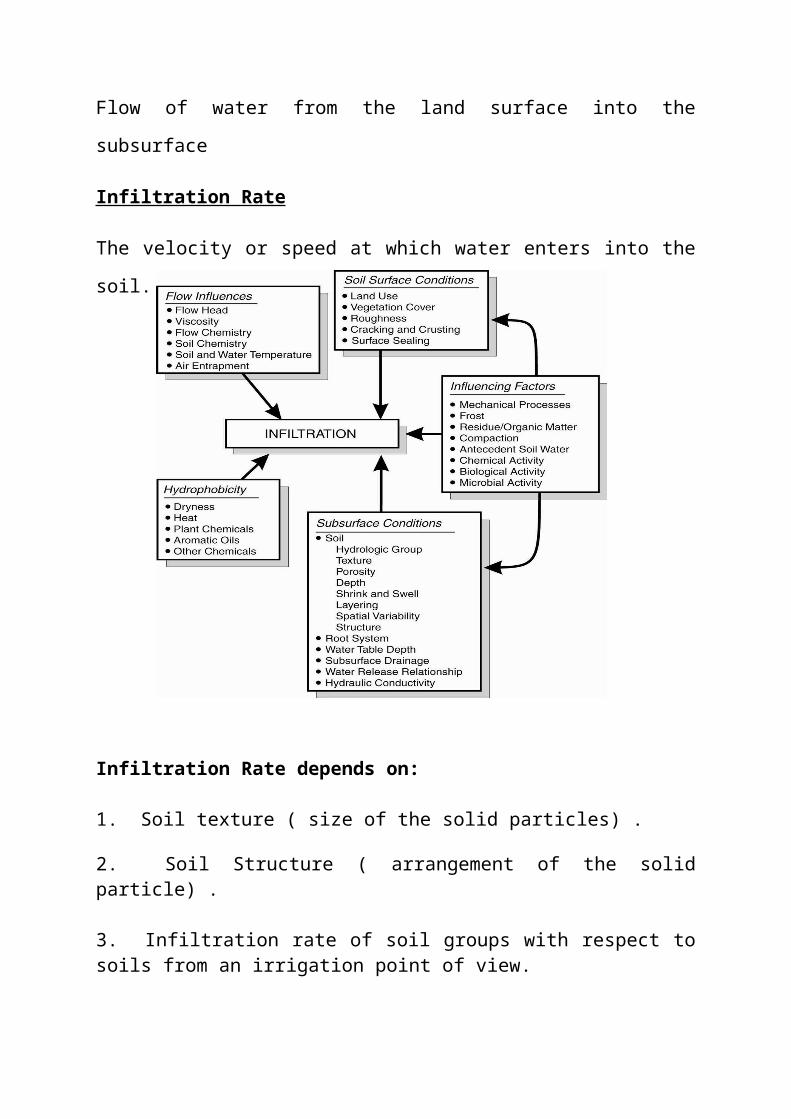
Flow of water from the land surface into the
subsurface
Infiltration Rate
The velocity or speed at which water enters into the
soil.
Infiltration Rate depends on:
1. Soil texture ( size of the solid particles) .
2. Soil Structure ( arrangement of the solidparticle) .
3. Infiltration rate of soil groups with respect tosoils from an irrigation point of view.
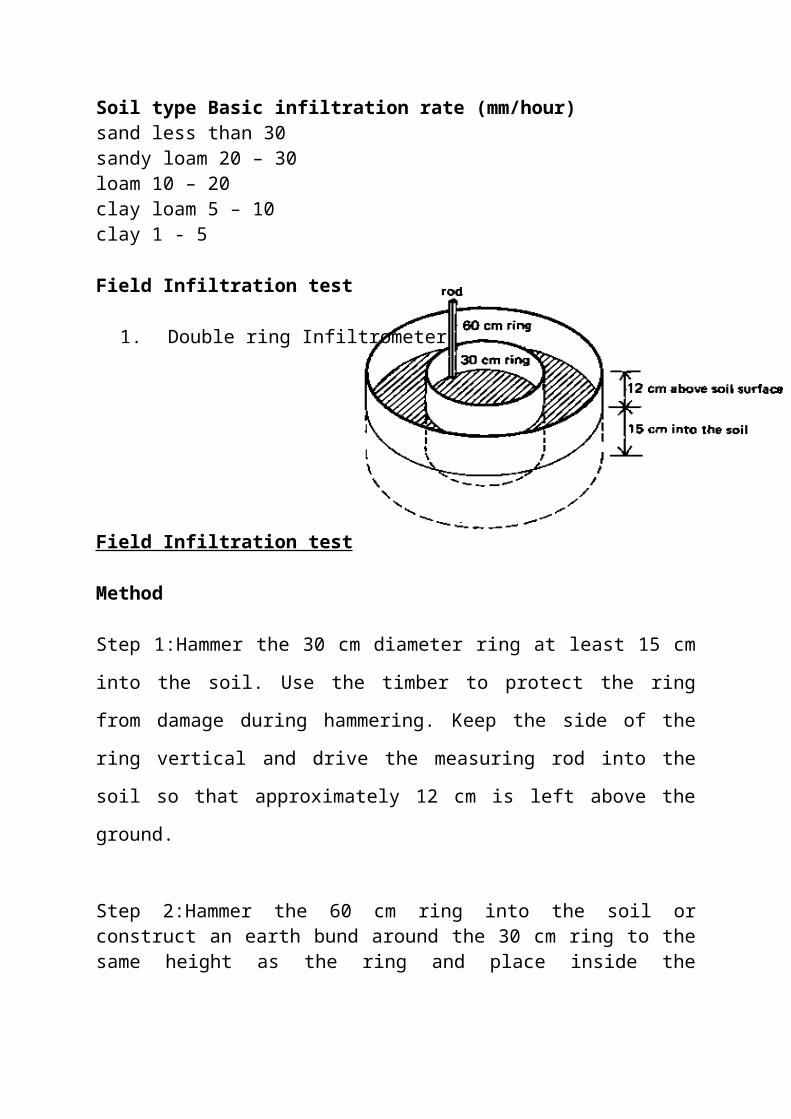
Soil type Basic infiltration rate (mm/hour) sand less than 30 sandy loam 20 – 30 loam 10 – 20 clay loam 5 – 10 clay 1 - 5
Field Infiltration test
1. Double ring Infiltrometer
Field Infiltration test
Method
Step 1:Hammer the 30 cm diameter ring at least 15 cm
into the soil. Use the timber to protect the ring
from damage during hammering. Keep the side of the
ring vertical and drive the measuring rod into the
soil so that approximately 12 cm is left above the
ground.
Step 2:Hammer the 60 cm ring into the soil orconstruct an earth bund around the 30 cm ring to thesame height as the ring and place inside the
infiltrometer to protect the soil surface whenpouring in the water
Step 3:Start the test by pouring water into the ringuntil the depth is approximately 70-100 mm. At thesame time, add water to the space between the tworings or the ring and the bund to the same depth. Dothis quickly. The water in the bund or within the tworings is to prevent a lateral spread of water fromthe infiltrometer.
Step 4:Record the clock time when the test begins andnote the water level on the measuring rod. Step 5:After 1-2 minutes, record the drop in waterlevel in the inner ring on the measuring rod and addwater to bring the level back to approximately theoriginal level at the start of the test. Record thewater level. Maintain the water level outside thering similar to that inside.
Step 6:Continue the test until the drop in waterlevel is the same over the same time interval. Takereadings frequently (e.g. every 1-2 minutes) at thebeginning of the test, but extend the intervalbetween readings as the time goes on (e.g. every 20-30 minutes). Note that at least two infiltration tests should becarried out at a site to make sure that the correctresults are obtained
8.CONCLUSION
Groundwater being an important source of purewater it’s essential to preserve and managegroundwater for a better future. It is possible onlywith sufficient knowledge of the subject. Geology cancontribute better than any other subject in thisaspect. Various geological factors that control thegroundwater availability and movement need to beanalysed well. Again the quality of water matters, asfar as human needs are concerned. Geochemical studiesprovide tools to tackle the water quality problems.Geophysical techniques play a key role in explorationof groundwater. Pump test or aquifer test will giveinformation the storage capacity of aquifers and timetaken to restore the aquifer. With the help of theseone can suggest an effective pumping interval to thefarmers. This also give information about theinfluence of pumping wells on the non pumping wells;
so that it will be possible to suggests distance inbetween a diameter of pumping and non pumping wellfor better output of water.
Exploration part is essential to any kind ofresources, and water is not exceptional.The mostwidely used methods are electrical resistivitymethods. Electrical sounding and profiling plays akey role. Wehave conducted surveys using electricalmethods to interpret and trap the potential areas ofgroundwater. We were exposed to various drillingtechniques which are commonly used at CGWB.
Finally the management and recharge ofgroundwater, the most popular and important currenttopic falls under the groundwater hydrogeology. Theincreasing demand and exploitationdo not go hand inhand with the recharge and availability ofgroundwater. So we need perfect planning andmanagement. Implementation of rain water HarvestingScheme by Tamil Nadu has Government improved thequantity level. Still more awareness and techniquesare essential to improve the situation. The variationin the distribution and pattern of monsoon all overcountry makes the situation more complex.
The training was effective in obtainingoverallknowledge ongroundwater geology and itstrends.The field experiences helped a lot to enhance ourpractical skills in various aspects of explorationand management of groundwater.

REFERENCESC.W. Fetter , Applied HydrogeologyDavid Keith Todd , Ground water HydrologyGautam Mahajan , Ground Water RechargeNevenKresic , Hydrogeology and Groundwater Modelling


