Embed Size (px)
Citation preview

J Supercond Nov Magn (2014) 27:881–890DOI 10.1007/s10948-013-2364-4
O R I G I NA L PA P E R
Hydrothermal Synthesis, Structural and Electrical Propertiesof Antimony (Sb3+) Substituted Nickel Ferrites
Erum Pervaiz · I.H. Gul · Amir Habib
Received: 21 May 2013 / Accepted: 23 August 2013 / Published online: 21 September 2013© Springer Science+Business Media New York 2013
Abstract Antimony (Sb3+) doped nickel ferrites have beensynthesized by hydrothermal route using an autoclave at160 ◦C for 12 hours. Pure spinel phase NiSbxFe2−xO4
(x = 0.0 to 0.1) with step increment of 0.035 has been pre-pared by sintering the precursor samples at 500 ◦C. Struc-tural studies have been performed using X-ray Diffrac-tion (XRD) and Fourier Transform Infrared Spectroscopy(FTIR). Lattice parameter and X-ray density found to in-crease with increase in the antimony concentration. Averagecrystallite size lies in the range of 14 to 24 nm ± 2 nm. Scan-ning Electron Microscopy (SEM) and Atomic Force Mi-croscopy (AFM) have been used to characterize the mor-phology and sizes of nanoparticles. Electrical propertieswere analyzed by measuring DC-electrical resistivity, com-plex dielectric permittivity, AC conductivity and complexelectrical modulus analysis. DC resistivity of nickel ferritesdecreases due to the substitution of antimony from 6.7×10⁸
to 3.4 × 10⁷ �-cm. Dielectric permittivity and losses werestudied in the frequency range of 20 Hz–5 MHz and foundto increase due to addition of Sb3+ in nickel nanoferritesat room temperature. High dielectric permittivity and con-ductivity made this material a compatible option for single-layered and multilayered chip inductors.
Keywords Antimony ferrite · DC resistivity · Complexdielectric permittivity · Complex electric modulus
E. Pervaiz · I.H. Gul (B) · A. HabibThermal Transport Laboratory (TTL), Department of MaterialsEngineering, School of Chemical and Materials Engineering(SCME), National University of Sciences and Technology(NUST), H-12 Islamabad, Pakistane-mail: [email protected]
E. Pervaize-mail: [email protected]
1 Introduction
Nanostructure ceramic materials have been considered im-portant in many technological applications due to enhancedproperties as compared to their behavior in bulk phase.Nanocrystalline nickel ferrite in pure and substituted withsuitable cations form has been a part of special class of ce-ramic materials which found application in high-frequencydevices (electromagnetic absorbers, circulators, isolators,switches and phase shifters) [1]. High DC electrical resistiv-ity along with low losses (dielectric, magnetic) made nickelferrites attractive for such applications. Nickel ferrite is aninverse spinel ferrite with Ni2+ ions occupied at octahedralsublattices (B-sites) and Fe3+ ions occupied at tetrahedral(A-sites) and octahedral sublattices equally [2]. Substitutingnickel ferrites with different divalent and trivalent cationsimparts different electrical and magnetic properties char-acterized by shift of ions between two sublattices. Alongwith type of substitution, synthesis route is another way ofachieving drastically different electrical and magnetic prop-erties [3]. This difference of electrical and magnetic proper-ties due to type of substitution, synthesis route and sinteringconditions is strongly characterized by microstructure (grainand grain boundaries). The smaller the grain size the smallerwill be the particle size, and controlled size distribution im-parts special features in these ferrites. Nanostructure nickelferrites have been prepared recently using co-precipitation[4], sol–gel [5], microemulsion [6], solid state reaction [7],reverse micelle [8] and solvothermal [9] techniques. Hy-drothermal route is another recently used method to pre-pare spinel type ferrites with controlled morphology, par-ticle sizes and size distribution without subsequent sinteringor low sintering temperatures required [10]. Many researcharticles are available on the synthesis and electrical proper-ties of nickel ferrites doped with different cations such as,

882 J Supercond Nov Magn (2014) 27:881–890
Ni–Zn [11], Ni–Al [12], Ni–Co [13], Ni–Cd [14], Ni–Nd[15] and Ni–Dy [16]. All these articles reported differentvalues of electrical and magnetic properties of these nickelferrites owing to different synthesis route and type of sub-stituting cation. Electrical and magnetic properties can bemodified easily by adding only small quantity of the trivalentcations of larger radii thereby substituting at octahedral sitesand shifting ions from B-sites to A-sites. High DC resistiv-ity, low permittivity and high permeability are required forapplications under high frequencies, whereas high dielectricpermittivity is required for integrated electronic chips [17].
The present work was aimed at the synthesis and studyof electrical properties of antimony-doped nickel ferrites byhydrothermal route. We investigated the influence of Sb3+on structural parameters, DC electrical resistivity and di-electric properties along with electric modulus analysis inthe frequency range of 20 Hz to 5 MHz based on the mi-crostructure of the prepared ferrites.
2 Synthesis of Samples
Antimony-doped nickel ferrites NiSbxFe2−xO4 (x =0.0–0.1) with step increment of x = 0.035 have been pre-pared by hydrothermal rout employing a Teflon lined stain-less steel autoclave. All the chemicals were of analyti-cal grade (AR) and used as-received, without any fur-ther purifications. Aqueous solutions of nickel nitrate [Ni(NO3)2·6H2O], iron nitrate [Fe (NO3)3·9H2O] and anti-mony chloride [SbCl3·4H2O] were prepared with molar ra-tio of M3+/M2+ = 2 and stirred magnetically for 30 min.A 70-ml mixed solution of salts was taken and a 10-mlof 6M sodium hydroxide (NaOH) solution was added andstirred vigorously for 10 min more. The mixed precursorsolution was subjected to sonicator at room temperature for30 min and poured into Teflon lined autoclave of 100 ml ca-pacity. Autoclave was then sealed and placed in an electricoven at 160 ◦C for 12 hours. Autoclave was then allowedto cool to room temperature and samples were filtered andwashed several times until the neutral pH was reached anddried under vacuum at 80 ◦C. Dried samples were groundedin agate mortar and pestle and subjected to sintering in a boxfurnace at 500 ◦C for 4 hours. Sintered powder was then pel-letized into discs of 10 mm diameter using a hydraulic press.
3 Characterization Techniques
Phase formation, purity and structural analysis of antimony-doped nickel ferrites were performed by powder X-raydiffraction technique at room temperature by CuKα (λ =1.5406 Å) radiation with 2-theta in the range of 20◦ to 80◦.
All the structural parameters were calculated using the stan-dard relations. Average crystallite sizes (D) have been cal-culated also using W–H plots drawn by the relation [18]:
B cos θ = Kλ/D + 4ε sin θ (1)
where β is full width at half maximum (FWHM), θ is thehalf of angle 2-theta, and λ is the wavelength of incidentradiation. The morphological study was performed usingSEM (JEOL-instrument JSM-6490A). The particle size pat-terns were recorded by AFM (JEOL-JSPM-5200) at roomtemperature. DC electrical resistivity ρ (�-cm) was mea-sured using two-probe method in the temperature range of373–573 K using sensitive Keithley Pico source meter. Pel-lets (10 mm in diameter) of samples were used for measur-ing the complex permittivity (ε′, ε′′) and dielectric loss tan-gent (tan δ) by LCR Meter Bridge (WAYN-KERR 6500-B).Real part of complex permittivity was calculated using therelation
ε′ = Cpd/ε0A (2)
where Cp is the parallel capacitance, d and A are the thick-ness and the area of pellets, respectively, and ε0 is the freespace permittivity.
An imaginary part of complex permittivity (dielectricloss) has been calculated using the relation
ε′′ = ε′∗ tan δ (3)
where tan δ was measured directly from LCR meter. ACconductivities have be calculated using the values of fre-quency and dielectric loss factor using relation
σAC = 2πf ε0ε′ tan δ (4)
Real and imaginary parts of complex impedance have beencalculated using the relations
Z′ = |Z| cos θ (5)
Z′′ = |Z| sin θ (6)
where |Z | is the absolute impedance measured from LCRmeter in the frequency range of 20 Hz to 5 MHz. The com-plex electric modulus was calculated using the relations[19]:
M∗(ω) = 1/ε∗(ω) (7)
M ′′ = ε′′/(ε′2 + ε′′2) (8)
M ′ = ε′/(ε′2 + ε′′2) (9)
4 Results and Discussion
4.1 Structural Analysis by XRD and FTIR
The XRD patterns of as-prepared NiSbxFe2−xO4 with x
ranging from 0.0 to 0.1 are presented in Fig. 1(a). It can

J Supercond Nov Magn (2014) 27:881–890 883
Fig. 1 (a) XRD patterns for NiSbxFe2−xO4 (x = 0.0–0.1) (as-prepared precursor samples by hydrothermal route). (b) Indexed XRDpatterns for NiSbxFe2−xO4 (x = 0.0–0.1) sintered at 500 ◦C. (c) Ionic
radii for tetrahedral (rA) and octahedral sites (rB) with Sb3+ composi-tion. (Inset) Jump lengths for tetrahedral (LA) and octahedral (LB) siteswith Sb3+ compositions. (d) W–H plot for NiSbxFe2−xO4 (x = 0.1)
be observed that only pure nickel ferrite (x = 0.0) can beindexed as pure spinel phase. All other samples with in-creasing concentration of antimony cannot be indexed asa spinel phase. Figure 1(b) shows the indexed XRD pat-terns of samples sintered at 500 ◦C for 4 hours. All the pat-terns can be easily indexed for pure cubic spinel phase us-ing JCPDS card nos. 77-0426 and 80-0072 with a low crys-tallinity for samples doped with antimony. The structural pa-rameters (crystallite sizes (D311), lattice constants (a) andX-ray densities (Dx )) were calculated using the standardrelations, D(311) = Kλ/β cos θ , a = dhkl(h
2 + k2 + l2)1/2
and Dx = 8M/Na3, respectively. Average crystallite sizesof sintered nanoparticles calculated by the Scherrer formula[20] lies in the range of 14 to 21 nm ± 2 nm. Lattice con-
stants (a) were calculated from the XRD data and found toincrease slightly with increase in the antimony concentra-tion due to large ionic radii of Sb3+ (0.74 Å) as compared toFe3+ (0.64 Å). The substitution of Fe3+ ions at octahedral(B-sites) by Sb3+ ions would cause the expansion of unitcell, resulting in larger lattice constants [21]. X-ray densityand measured density (Dx and Dm) also found to increasewith increase in the x from 0.0 to 0.1. This increase in the X-ray density and measured density is due to the increase in themolecular weights of the compositions with substitution ofantimony (121.6 a.m.u) in place of iron atoms (55.6 a.m.u)in the nickel ferrites. Porosities of the samples have beencalculated using the relation P = 1 − (Dm/Dx) and it is ob-served that porosity has been decreased due to addition of

884 J Supercond Nov Magn (2014) 27:881–890
Table 1 Average crystallite size(D311), average crystallite size(DW–H), lattice parameter (a),X-ray density (Dx ), measureddensity (Dm), porosity (P), highfrequency vibrational band (υ1),bond lengths tetrahedral site(A–O) and octahedral sites(B–O), site radii (rA and rB) forNiSbxFe2−xO4 (x = 0.0–0.1)
Parameter x = 0.0 x = 0.035 x = 0.065 x = 0.1
D(311) nm ± 2 nm 15 20 21 17
D(W–H) nm ± 2 nm 18 22.9 24.65 19
Lattice parameter a (Å) 8.350(1) 8.353(2) 8.361(1) 8.373(1)
Dm (gm/cm3) ± 0.02 3.01 3.22 3.35 3.39
Dx (gm/cm3) 5.35 5.36 5.36 5.37
P % 43.79 40.12 37.54 36.87
A–O (Å) 1.894 1.895 1.897 1.899
B–O (Å) 2.0374 2.0381 2.0400 2.0430
rA (Å) 0.574 0.575 0.577 0.579
rB (Å) 0.7174 0.7181 0.720 0.723
υ1 (cm−1) 647.16 615.41 607.67 595.88
antimony ions in nickel ferrites. Octahedral and tetrahedralbond lengths (A–O and B–O) and site radii (rA and rB) havebeen calculated for all the samples under study to see the in-fluence of antimony ions on structure of nickel ferrites usingthe relations
rA = (u − 1/4)a√
3 − R0 (10)
rB = (5/8 − u)a − R0 (11)
where u is the oxygen positional parameter and R0 is theionic radius of oxygen. Calculated values of bond lengthsand site radii are presented in Table 1. Tetrahedral and oc-tahedral bond lengths and site radii (rA and rB) have beenobserved to increase slightly due to substitution of Sb3+ asshown in Fig. 1(c). This confirms the substitution of largerionic radii cations at B-sites and shift of larger ionic radiiNi2+ from B-sites to A-sites with increasing the concen-tration of Sb3+ ions. Average crystallite sizes calculated byW–H plots drawn by Gaussian fit to the peak broadenings(FWHM) using Eq. (1) are presented in Table 1. Crystal-lite size and lattice strain were observed to increase dueto increase in the antimony concentration. Plots also showthe presence of tensile strain in the crystal structure as canbe observed from the positive slope of the W–H plot inFig. 1(d).
Figure 2 shows the FTIR spectra for all the samples(x = 0.0 to 0.1). FTIR analysis shows the presence of twobands intrinsic to the metal cation (A and B sites) and oxy-gen bond vibration for the spinel phase ferrites. One of themlies in the low-frequency side (∼400 cm−1) and the otherin the high-frequency side (∼600 cm−1) for octahedral andtetrahedral sublattices, respectively. All the values of fre-quency of vibrations are presented in Table 1. It can be ob-served that there is a shift of band towards high-frequencyside that shows that antimony is substituted towards B-sites.
Fig. 2 FTIR spectra of NiSbxFe2−xO4 (x = 0.0–0.1) synthesized byhydrothermal route
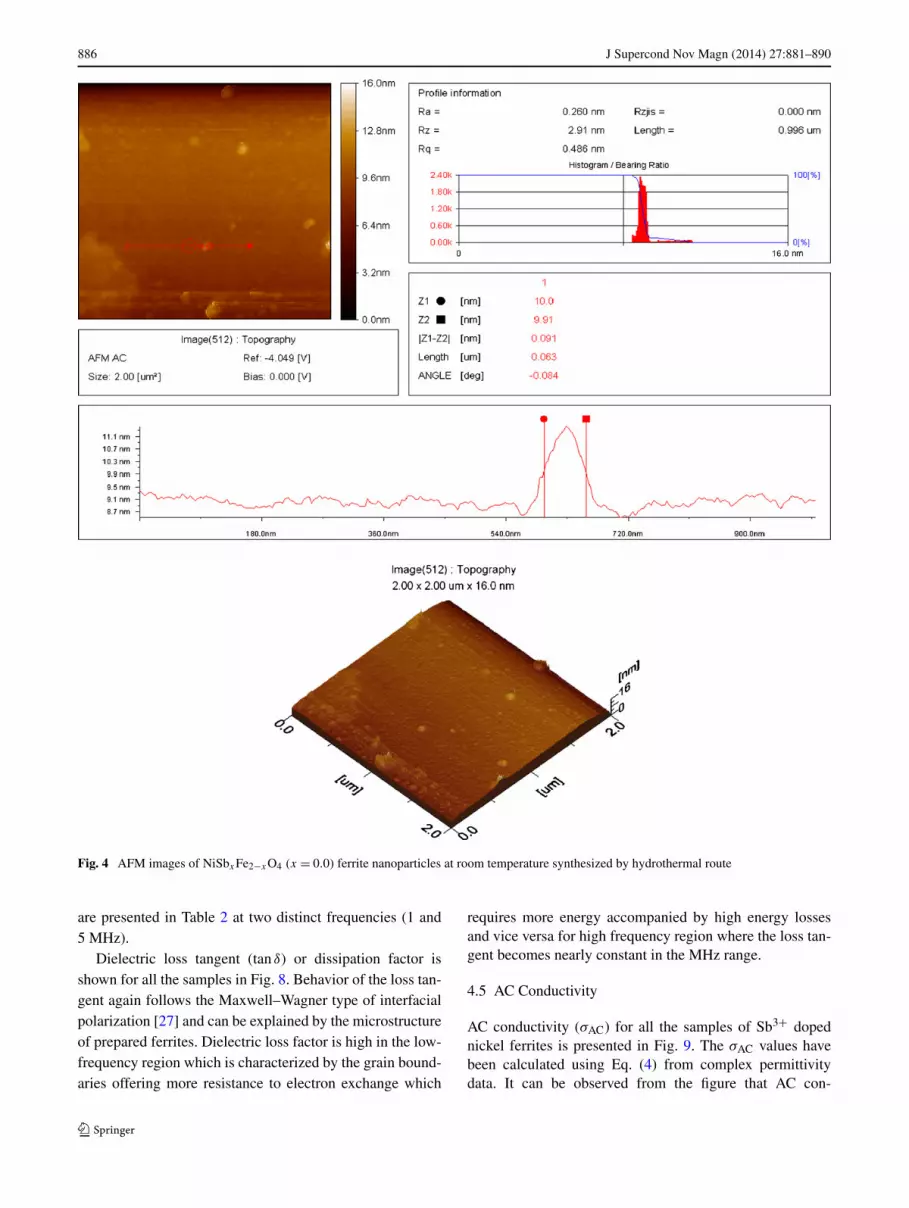
4.2 Morphology Analysis by SEM and AFM
Figure 3 shows the SEM images of prepared antimony-doped nickel ferrite nanoparticles composition with x = 0.0and 0.1. It can be observed that uniformly distributed spher-ical nanoparticles have been formed by a low-temperaturehydrothermal route. Controlled particle morphology andsizes with a narrow size distribution have been observed dueto hydrothermal synthesis of the samples. The decrease ofporosity with the increase in the density can be observedfrom the SEM images. The results of the SEM are fur-ther confirmed by AFM as shown in Fig. 4. Particle sizesobserved from SEM and AFM lie in the range of 18 to24 nm ± 2 nm. The results from SEM and AFM are in goodagreement with XRD data within experimental errors.
4.3 DC Electrical Resistivity
Resistance of the prepared samples of nickel antimony fer-rites has been measured using two-probe method from roomtemperature to 300 ◦C (295–573 K). DC electrical resistiv-ity has been calculated using the relation ρ = RA/L [22],

J Supercond Nov Magn (2014) 27:881–890 885
Fig. 3 The scanning electronmicrographs (SEM) ofNiSbxFe2−xO4 ferritenanoparticles at roomtemperature synthesized byhydrothermal route
where A is the area and L the thickness of ferrite pellets.All the values of DC electrical resistivity are tabulated inTable 2. It can be observed from Fig. 5 (inset) that DC elec-trical resistivity of the nickel ferrites increases for the low-est concentration of Sb3+ (x = 0.035) from 6.7 × 10⁸ to9.1 × 108 �-cm but decreases to the order of magnitude∼107 �-cm as the concentration (x) increases from 0.035to 0.1. This behavior of DC electrical resistivity can be ex-plained by hopping of electrons between the same atoms atdifferent oxidation states [23]. Nickel ferrite is an inversespinel, where Ni2+ ions (0.69 Å) occupy the octahedral orB-sites and iron ions occupy A-sites and B-sites equally.Substituting Sb3+ ions (0.74 Å) in place of Fe3+ (0.67 Å)shows that antimony occupies the B-sites causing a shift ofFe3+ from B-sites to A-sites. This variation in cation dis-tribution decreases the number of ion pairs (Fe3+/Fe2+)at B-sites which makes a slight increase in DC electricalresistivity for x = 0.035 due to decrease of electron hop-ping. For the concentration of Sb3+ (x > 0.035) some of thenickel ions displaced from octahedral (B) to tetrahedral (A)sites subsequently shifting some Fe3+ ions from A-sites toB-sites to make a balance of ions. This increases the hoppingof electrons between Fe2+ and Fe3+ due to increased ionpairs at B-sites that is a reason for the decrease of DC electri-cal resistivity [24]. The decrease of DC electrical resistivitydue to the shift of Ni2+ ions to A-sites can also be confirmedby increase in the site radii and bond lengths of A-sitesas shown in Table 1. Temperature-dependent DC electri-cal resistivity is presented in Fig. 5 and observed to de-crease with the increase of temperature from 295 to 573 K,showing a semiconducting nature of the prepared ferrites.DC resistivity data were fitted linearly using Arrhenius re-lation, ρ = ρ0 exp(−�E/KBT ), to obtain the activation en-ergy (�E) values for the prepared samples. Activation en-ergy obtained from the slopes of linear fit to the data de-creases with the increase in the concentration of antimonyions which shows that a lower hopping energy is required
for electrons to cross the barrier to jump between Fe2+ andFe3+.
4.4 Complex Dielectric Permittivity
Complex dielectric permittivity (ε∗(f ) = ε′ − jε′′) has beenstudied in the frequency range of 20 Hz to 5 MHz at roomtemperature. Real (ε′) and imaginary parts (ε′′) are pre-sented in Figs. 6 and 7, respectively. Two types of variationscould be observed from the figures, one being the variationof dielectric permittivity (ε′ and ε′′) with composition (x)of antimony ions and the other, with the applied frequency.It can be observed from the figures that frequency-dependentdielectric permittivity (ε′) and losses (ε′′) decrease for theconcentration of antimony (x = 0.035) but increase sharplyfor higher concentrations of Sb3+ ions from 0.065 to 0.1.This increase in both the parameters is in accordance withdecrease in the DC electrical resistivity [25]. As far as fre-quency dependence of dielectric permittivity is concerned itdecreases with the increase in the frequency very suddenlyin the low frequency regions but as the frequency increasesthis decrease in dielectric permittivity and losses becomesslow and almost constant as the frequency reaches 3 MHz.Such dielectric dispersion is expected for the ferrite struc-ture due to heterogeneous microstructure (grains and grainboundaries) present in ferrites [26]. On the application of theAC, field grain boundaries offer more resistance to flow ofcharge carriers and thereby charge carriers pile up at bound-aries and polarization of dipoles Fe3+↔ Fe2+ occurs withlarger magnitudes. Therefore in the low-frequency regionwhere grain boundary influence is larger, the values of rel-ative permittivity and losses are also larger. At higher os-cillation frequencies the charge carriers cannot reverse theirdirection according to the applied field, so the polarizationceases to respond and the magnitudes of complex permit-tivity parameters (ε′ and ε′′) become constant as can be ob-served from Figs. 6 and 7. Data for complex permittivity
886 J Supercond Nov Magn (2014) 27:881–890
Fig. 4 AFM images of NiSbxFe2−xO4 (x = 0.0) ferrite nanoparticles at room temperature synthesized by hydrothermal route
are presented in Table 2 at two distinct frequencies (1 and5 MHz).
Dielectric loss tangent (tan δ) or dissipation factor isshown for all the samples in Fig. 8. Behavior of the loss tan-gent again follows the Maxwell–Wagner type of interfacialpolarization [27] and can be explained by the microstructureof prepared ferrites. Dielectric loss factor is high in the low-frequency region which is characterized by the grain bound-aries offering more resistance to electron exchange which
requires more energy accompanied by high energy lossesand vice versa for high frequency region where the loss tan-gent becomes nearly constant in the MHz range.
4.5 AC Conductivity
AC conductivity (σAC) for all the samples of Sb3+ dopednickel ferrites is presented in Fig. 9. The σAC values havebeen calculated using Eq. (4) from complex permittivitydata. It can be observed from the figure that AC con-

J Supercond Nov Magn (2014) 27:881–890 887
Table 2 DC electricalresistivity (ρ �-cm), activationenergy (�E), dielectricpermittivity real part (ε′),dielectric permittivity imaginarypart (ε′′), dielectric loss tangent(tan δ), AC conductivity (σAC),conductivity parameter (n),jump lengths LA and LB,relaxation frequency (fr) forNiSbxFe2−xO4 (x = 0.0–0.1)
Parameters x = 0.0 x = 0.035 x = 0.065 x = 0.1
ρ (�-cm) (373 K) 6.7 × 10⁸ 9.1 × 10⁸ 6.4 × 10⁷ 3.42 × 10⁷
�E (eV) 0.73 0.76 0.54 0.41
ε′ (1 MHz) 28.3 20.3 32 36.5
ε′′ (1 MHz) 2.81 1.72 8.01 13.6
tan δ (1 MHz) 0.09939 0.0846 0.2506 0.3731
ε′ (5 MHz) 26.6 19.4 28.4 28.8
ε′′ (5 MHz) 1.36 0.0774 2.92 5.87
tan δ (5 MHz) 0.0511 0.0398 0.1028 0.2036
σAC (5 MHz) 3.78 × 10⁻⁴ 2.15 × 10⁻⁴ 8.11 × 10⁻⁴ 1.63 × 10⁻³
n 0.6621 0.6786 0.5316 0.5109
LA (Å) 3.6155 3.6168 3.6201 3.6255
LB (Å) 2.9517 2.9527 2.9556 2.9598
fr (Hz) 2.8 × 10⁴ 1.02 × 10⁴ 1.2 × 10⁵ 6.8 × 10⁵
Fig. 5 Variation of DC electrical resistivity (lnρ) with inverse tem-perature for NiSbxFe2−xO4 (x = 0.0–0.1) ferrite nanoparticles. (Inset)variation of DC electrical resistivity (ρ) with composition (x)
ductivity increases linearly with the frequency, showingsmall polarons responsible for conduction. AC conduc-tivity decreases for the sample with antimony concentra-tion x = 0.035 but increases for higher concentration ofantimony. Linear fit to AC conductivity by the relationσAC = Aωn [28] gives the conductivity parameter (n) asshown in Fig. 9 and the values of n are provided in Table 2.The increase of conductivity with the increase in concentra-tion of doping cation can be explained by the grain size andporosity. Porosity decreases with the increase in the dop-ing cation concentration showing that surface area of grains(high conductivity) increases with decrease in the number ofgrain boundaries (high resistivity) that is a sound reason forthe increase in AC conductivity for higher concentrations(x > 0.035) of antimony ferrites. Since electron exchangeis a major source of conduction in these ferrites (n-type),
Fig. 6 Variation of complex dielectric permittivity ε′ (real part) withlnf of NiSbxFe2−xO4 (x = 0.0–0.1) ferrite nanoparticles at room tem-perature
so an attempt has been made to calculate the jump lengthsof A-sites and B-sites (LA and LB) respectively using therelations
LA = a√
3/4 (12)
LB = a√
2/4 (13)
where a is the lattice constant of the sample. Calculatedjump lengths are summarized in Table 2 and found to in-crease slightly due to the increase in Sb3+ concentration aslattice parameter was also observed to increase with contentof antimony ions.
4.6 Complex Impedance/Electric Modulus Studies
Figure 10 shows the variations of complex impedance (Z∗)with frequency in the range of 20 Hz to 5 MHz at roomtemperature. Real (Z′) and imaginary (Z′′) parts of com-plex impedance have been calculated using relations (5)

888 J Supercond Nov Magn (2014) 27:881–890
Fig. 7 Variation of complex dielectric permittivity ε′′ (imaginary part)with lnf of NiSbxFe2−xO4 (x = 0.0–0.1) ferrite nanoparticles
Fig. 8 Variation of dielectric loss tangent (tan δ) with lnf ofNiSbxFe2−xO4 (x = 0.0–0.1) ferrite nanoparticles
Fig. 9 Variation of AC conductivity with lnf of NiSbxFe2−xO4(x = 0.0–0.1) ferrite nanoparticles
and (6). It can be observed from the graphs that Z′ (inset)and Z′′ of complex impedance decrease with the increasein the frequency, showing that no relaxation peak is present
Fig. 10 Variation of imaginary part Z′′ of complex impedance withlnf of NiSbxFe2−xO4 ferrite nanoparticles. (Inset) variation of realpart Z′ with lnf
Fig. 11 Cole–Cole impedance plane plots for NiSbxFe2−xO4(x = 0.0–0.1) ferrite nanoparticles
in the samples. A Cole–Cole plot of complex impedance isshown in Fig. 11. All the samples have been poorly resolvedinto one semicircle arc (not complete). This shows thatgrain boundary resistance is dominating for the antimony-doped nickel ferrites [29]. As far as the influence of x onimpedance is concerned, it increases for x = 0.035 but de-creases for higher concentrations on Sb3+. Figure 12 showsthe real (inset) and imaginary parts of complex electric mod-ulus (M∗) calculated by the relations (8) and (9). It can beobserved from the graphs that AC data are well resolved intosemicircles for M ′′ (imaginary part of electric modulus).The maxima of the semicircle are clearly present showingthat relaxation mechanism is explainable in terms of electricmodulus formalism [30]. With doping of antimony for con-centration of x = 0.035, relaxation peak is shifted to lowerfrequency side showing low relaxation losses for this com-position. But the relaxation peaks shift to higher frequenciesfor x > 0.035. A similar behavior is observed for Cole–Cole

J Supercond Nov Magn (2014) 27:881–890 889
Fig. 12 Variation of imaginary part (M ′′) of complex electric mod-ulus with lnf for NiSbxFe2−xO4 (x = 0.0–0.1) ferrite nanoparticles.(Inset) Variation of real part (M ′) with lnf
Fig. 13 Cole–Cole plots of real (M ′) and imaginary (M ′′) parts forNiSbxFe2−xO4 ferrite nanoparticles
plots of real and imaginary parts of complex modulus shownin Fig. 13. Relaxation time (τ ) and frequency (fr) have beenmeasured from the maxima of semicircles in Cole–Cole di-agrams and presented in Table 2.
5 Conclusions
All the samples of NiSbxFe2−xO4 (x = 0.0 to 0.1) havebeen successfully synthesized by hydrothermal route fol-lowed by sintering at moderate temperature of 500 ◦C. Pu-rity confirmation of the samples was done by recordingXRD patterns. Crystallite sizes and lattice constant havebeen calculated for all the samples from XRD data andfound to increase slightly with influence of increasing an-timony concentration. Structure of pure spinel was furtherconfirmed by FTIR where bands around 600 and 400 cm−1
were observed for spinel crystal structure. Morphology ofthe prepared ferrites was found to be homogeneous with
controlled particle size distribution due to hydrothermalroute. Particle size patterns by AFM further confirmed thesizes of the particles observed from SEM images. DC elec-trical resistivity has been found to decrease from order ofmagnitude 108 to 107 �-cm due to addition of antimony innickel ferrites. Dielectric permittivity and losses increasedfor composition (x = 0.1) of antimony-added nickel fer-rites from 28 to 37 and 2.81 to 13.6 at 1 MHz, respec-tively. Complex impedance and electric modulus formalismhelped to study the influence of microstructure (grains andgrain boundaries) on the dielectric dispersion and relaxationmechanisms. Low DC resistivity with high dielectric per-mittivity and losses show the suitability of NiSbxFe2−xO4
(x = 0.1) as a competitive material in chip inductors.
Acknowledgement The authors would like to acknowledge TWAS,Italy, Higher Education Commission (HEC) Islamabad Pakistan projectNo. 1326, for providing financial support for this work, and the Pak-istan Science Foundation (PSF) project No. 147.
References
1. Harris, V.G.: IEEE Trans. Magn. 48, 1075–1104 (2012)2. Muthu, K.S., Lakshminarasimhan, N.: Ceram. Int. 39, 2309–2315
(2013)3. Ping, L.C., Wei, L.M., Zhong, C., Juan-Ru, H., Yi-Ling, T., Tong,
L., Wei-Bo, M.: J. Mater. Sci. 42, 6133–6138 (2007)4. Shinde, T.J., Gadkari, A.B., Vasambekar, P.N.: Mater. Chem.
Phys. 111, 87–91 (2008)5. Barati, M.R.: J. Sol-Gel Sci. Technol. 52, 171–178 (2009)6. Uskokovi, V., Drofenik, M.: Colloids Surf. A, Physicochem. Eng.
Asp. 266, 168–174 (2005)7. Purushotham, Y., Chandel, J.S., Sud, S.P., Babbar, V.K., Reddy,
K.V., Reddy, P.V.: Mater. Sci. Eng. B 34, 67–73 (1995)8. Gubbalaa, S., Nathania, H., Koizol, K., Misra, R.D.K.: Physica B
348, 317–328 (2004)9. Wang, J., Ren, F., Yi, R., Yan, A., Qiu, G., Liu, X.: J. Alloys
Compd. 479, 791–796 (2009)10. Pervaiz, E., Gul, I.H.: J. Supercond. Nov. Magn. 26, 415–424
(2013)11. Morrison, S.A., Cahill, C.L., Carpenter, E.E., Calvin, S., Swami-
nathan, R., McHenry, M.E., Harris, V.G.: J. Appl. Phys. 95, 6392–6395 (2004)
12. Gul, I.H., Pervaiz, E.: Mater. Res. Bull. 47, 1353–1361 (2012)13. Mathe, V.L., Kamble, R.B.: Mater. Res. Bull. 43, 2160–2165
(2008)14. Ravinder, D., Alivelu, T.M.: Mater. Lett. 41, 254–260 (1999)15. Shinde, T.J., Gadkari, A.B., Vasambekar, P.N.: J. Alloys Compd.
513, 80–85 (2012)16. Kadam, A.A., Shinde, S.S., Yadav, S.P., Patil, P.S., Rajpure, K.Y.:
J. Magn. Magn. Mater. 329, 59–64 (2013)17. Ramirez, A.P., Subramanian, M.A., Gardel, M., Blumberg, G., Li,
D., Vogt, T., Shapiro, S.M.: Solid State Commun. 115, 217–220(2000)
18. Rao, K.V., Sunandana, C.S.: J. Phys. Chem. Solids 69, 87–96(2008)
19. Molak, A., Paluch, M., Pawlus, S., Klimontko, J., Ujma, Z.,Gruszka, I.: J. Phys. D: Appl. Phys. 38, 1450–1460 (2005)
20. Cullity, B.D.: Elements of X-ray Diffraction. Addison-Wisely,London (1978), p. 102
21. Cojocarius, A.M., Soroceanu, M., Hrib, L., Nica, V., Caltun, O.F.:Mater. Chem. Phys. 135, 728–732 (2012)
22. Gul, I.H., Maqsood, A.: J. Magn. Magn. Mater. 316, 13–18 (2007)

890 J Supercond Nov Magn (2014) 27:881–890
23. Khan, M.A., Islam, M.U., Ishaque, M., Rahman, I.Z.: Ceram. Int.37, 2519–2526 (2011)
24. Patange, S.M., Shirsath, S.E., Lohar, K.S., Jadhav, S.S., Kulkarni,N., Jadhav, K.M.: Physica B 406, 663–668 (2011)
25. Xiang, S., Yan-xin, W., Xiang, Y., Yong, X., Jian-feng, Z., Pei-duo,T.: Trans. Nonferr. Met. Soc. China 19, 1588–1592 (2009)
26. Abo El Ata, A.M., Attia, S.M., Meaz, T.M.: Solid State Sci. 6,61–69 (2004)
27. Mohamed, R.M., Rashad, M.M., Haraz, F.A., Sigmund, W.:J. Magn. Magn. Mater. 322, 2058–2065 (2010)
28. Batoo, K.M., Kumar, S., Lee, C.G., Alimuddin: Curr. Appl. Phys.9, 1397–1406 (2009)
29. Batto, K.M., Alimuddin: Physica B 406, 382–391 (2011)30. Liu, J., Duan, C.G., Yin, W.G., Mei, W.N., Smith, R.W., Hardy,
J.R.: J. Chem. Phys. 119, 2812–2817 (2003)