Embed Size (px)
Citation preview

A G R I C U LT U R E A N D E N V I R O N M E N TA L S E R V I C E S T E C H N I C A L A S S I S TA N C E PA P E R 0 1
DECEMBER 2013
ICT FOR DATA COLLECTION AND MONITORING & EVALUATION Opportunities and Guidance on MobileApplications for Forest and Agricultural Sectors
Pub
lic D
iscl
osur
e A
utho
rized
Pub
lic D
iscl
osur
e A
utho
rized
Pub
lic D
iscl
osur
e A
utho
rized
Pub
lic D
iscl
osur
e A
utho
rized
Pub
lic D
iscl
osur
e A
utho
rized
Pub
lic D
iscl
osur
e A
utho
rized
Pub
lic D
iscl
osur
e A
utho
rized
Pub
lic D
iscl
osur
e A
utho
rized

ICT FOR DATA COLLECTION AND MONITORING & EVALUATION:Opportunities and Guidance on Mobile Applications for Forest and Agricultural Sectors
A G R I C U LT U R E A N D E N V I R O N M E N TA L S E R V I C E S T E C H N I C A L A S S I S TA N C E PA P E R 0 1

© 2013 International Bank for Reconstruction and Development / International Development Association orThe World Bank1818 H Street NWWashington DC 20433Telephone: 202-473-1000Internet: www.worldbank.org
This work is a product of the staff of The World Bank with external contributions. The findings, interpretations, and conclusions expressed in this work do not necessarily reflect the views of The World Bank, its Board of Executive Directors, or the governments they represent.
The World Bank does not guarantee the accuracy of the data included in this work. The boundaries, colors, denominations, and other information shown on any map in this work do not imply any judgment on the part of The World Bank concerning the legal status of any territory or the endorsement or acceptance of such boundaries.
Rights and Permissions
The material in this work is subject to copyright. Because The World Bank encourages dissemination of its knowledge, this work may be reproduced, in whole or in part, for noncommercial purposes as long as full attribution to this work is given.
Any queries on rights and licenses, including subsidiary rights, should be addressed to the Office of the Publisher, The World Bank, 1818 H Street NW, Washington, DC 20433, USA; fax: 202-522-2422; e-mail: [email protected].
Cover Images: Left: © AES Department/World Bank; Right: © Flore Martinant de Préneuf/PROFOR

i i i
A G R I C U LT U R E A N D E N V I R O N M E N TA L S E R V I C E S T E C H N I C A L A S S I S TA N C E PA P E R
CO N T E N T S
CONTENTS
Glossary vii
Acknowledgments ix
Preface xi
Chapter 1: Overview 1
1.1 Scope 2
1.2. Survey Methodology 3
Chapter 2: Assessing Project Needs and Constraints 5
Chapter 3: Data Collection Implementation Models 7
3.1 Frontline Workers 7
3.2 Automated Capture 7
3.3 Crowd-Sourcing 8
3.4 Passive Capture and Data Harvesting 8
3.5 Qualitative Data Analytics 9
Chapter 4: Many Applications, Many Opportunities: Key Choices for ICT to Collect Data in Rural Areas 11
4.1 Connectivity 12
4.2 Data Input Technology 13
4.2.1 SMS vs. Form-based Digital Data Input 13
4.2.2 Basic Phones, Smartphones, and Tablets 13
4.2.3 Digital Pen 14
4.3 Budget and Costs 14
4.4 Dashboard: Analytics, Data Management, and Stakeholder Access 16
4.5 Additional Features 17
4.6 Interoperability 19
4.7 Technical Support 19
4.8 Language Capability, Security, Privacy, and Data Validation 19

CO N T E N T Si v
I C T F O R DATA CO L L E C T I O N A N D M O N I TO R I N G & E VA LUAT I O N
Chapter 5: Service Design 23
5.1 What ICT Cannot Do: Thoughtful Analysis 23
5.2 Driving Adoption 23
5.2.1 Adding Value to the End User 23
5.2.2 Properly Characterizing Users and Clients in Projects 23
5.2.3 Rewarding Excellence 24
5.2.4 Providing Non-financial Incentives 24
5.3 Managing Risks 24
5.3.1 Misplaced Focus of Training Programs 24
5.3.2 Context Matters 24
5.3.3 Efficient Cheating 25
Chapter 6: Case Studies 27
6.1 Successful Reliance on Tried and True Technology—The International Small Group and Tree Planting Program in Kenya 27
6.2 FAO’s Open Foris Initiative—Interoperable, Modular Monitoring, and Evaluation Tools for Forestry 29
6.3 The Way Ahead—The Effective Use of Satellite Imagery and Object-Based Image Analysis Software in Laos 31
6.4 Community-Managed Sustainable Agriculture—A Bottom-Up Revolution Assisted by Mobile Technology 34
6.5 Thwarting Drought—Mobile-Based Data Collection for Drought Preparedness in Uganda 37
Chapter 7: Conclusion 39
Annex 1: List of Tools Mentioned in the Report 41
Annex 2: Overview of Tool Capabilities and Considerations to Address in a Tool Selection Process 43
Annex 3: Full Life-Cycle Costs Estimation Template 45
Annex 4: Technology Features of Case Studies 47
FIGURES
Figure 1.1: Mobile Phone and internet Penetration in Selected Regions (2000–11, per 100 persons) 2
Figure 1.2: Framing the Use of iCT in Data Collection and M&E 3
Figure 3.1: Community Meeting Girl on Cellphone Aurangabad, india 7
Figure 3.2: Women of Takalafiya Lipai village Niger 8
Figure 4.1: Telecommunications Network Cambodia 12
Figure 4.2: Platform Usage Based on Companies Surveyed, in Order of Frequency 15
Figure 7.1: Macro-level Effects of iCT in Data Collection and M&E 39

v
A G R I C U LT U R E A N D E N V I R O N M E N TA L S E R V I C E S T E C H N I C A L A S S I S TA N C E PA P E R
CO N T E N T S
TABLES
Table 4.1: Product Features 12
Table 4.2: Suggested End-User Training Package Time Estimates for Specific Data Collection Applications 15
Table 4.3: Data Output Capacity and Software integration 16
Table 4.4: Spatial visualization Tools 17
BOXES
Box 2.1: Project Needs 5
Box 2.2: People Needs 5
Box 4.1: items to Consider When Selecting an M&E Tool for a Rural Development Project 11
Box 4.2: Connect Online, Connect Offline: An Open Source Tool for Tackling Poor Connectivity 13
Box 4.3: Questions to include: Thinking Through What is Needed 14
Box 4.4: Digital Green’s innovative M&E Data Reporting Model 18
Box 5.1: Boosting Non-financial incentives and Decentralized Collaboration through Social Media 25


v i i
A G R I C U LT U R E A N D E N V I R O N M E N TA L S E R V I C E S T E C H N I C A L A S S I S TA N C E PA P E R
G LO S S A R Y
GLOSSARY
Custom The solution relies on special analysis software developed or customized specifically for a given client.
Custom installation The software or system is installed to client’s premises and is expected to be serviced for maintenance physi-
cally at the client’s site or remotely (see also Remote Management).
Custom SW The software is developed or tailored specifically for customer needs and is usually made available for that
particular client only. Intellectual Property Rights (IPR) to the software in full or in part may be with the service
provider (developer) or with the client, depending on the explicit agreement between the two. Background
IPR (anything existing or developed prior to the client project) remains typically with the developer or service
provider.
eCognition Image analysis software for geospatial applications.
External GPS Mobile device or application relies on external device that is able to record geographical coordinates and
transfer these data to a mobile device via wired or wireless data transfer mechanisms.
GIS The Geographical Information System provides the ability to perform spatial analysis on the data set. This
usually requires geographical location information being part of the data set at some level (coordinates, street
addresses, etc.).
GPS Support of Global Positioning System in mobile device allows mobile application to obtain geographical loca-
tion information directly from within the mobile device.
Hosted The software or system is installed and run usually at the service provider’s premises, but the client has access
to the system via regular data communications networks such as Internet or telephony networks. The service
provider is responsible for maintenance.
ICT Information and communication technology
In-house support Client organization’s own personnel provide support. This is usually the case when open-source systems are
used.
iOS Formerly the iPhone Operating System
IT Information technology
License fee The software or system is made available for use against a fee (a copy of the system is sold to the customer).
Client modification of the software is usually not allowed. Support and maintenance are usually not included
in the license fee (inclusion or exclusion of these should be clearly stated in the licensing terms or licensing
agreement).
M&E Monitoring and evaluation
Offline use Capability to collect data when a mobile device has no active mobile data connectivity (for example, in
remote areas).

v i i i
I C T F O R DATA CO L L E C T I O N A N D M O N I TO R I N G & E VA LUAT I O N
G LO S S A R Y
Online use Capability to collect data directly into a central database by communicating the inputted data immediately
over an active data connection (usually a cellular data or Wi-Fi network). This usually involves a data connection
being available to collect data.
Open source Software licensing model in which the software is offered for use for free and can usually be modified at will;
depending on the specific terms of the open-source license, the modifications may need to be offered for free
to all other users of the software.
Outsourced support Support is provided by a specialist third-party company or organization that is not providing the software or a
service.
PDA Personal digital assistant
Remote management The software or system is usually installed at the client’s premises but the service provider can perform main-
tenance activities remotely by accessing the system via computer data network such as the Internet.
SaaS/cloud Software as a Service concept usually relies on the software or system being installed in third-party computer
hosting facilities, with both the client and the service provider accessing the system remotely. The system is
usually maintained and serviced by the service provider.
Service provider Support is given by the service provider that is the source of the software or service.
Signature Capability to input graphical signature digitally by writing with a finger or a stylus, usually on a mobile device
that has a touch screen.
SMS Data collection relies on use of mobile device’s SMS capability, either to transmit human-composed SMS mes-
sages (that may or may not be specifically encoded or formatted according to project specifications) or as an
underlying data transmission platform for a mobile application.
SPSS A statistical analysis software suite developed and marketed by IBM.
Subscriptions The software or system is available for use only when subscription is active. When the subscription ends, the
right to use the system usually ends.
Two-way sync Data can be uploaded from device to server and also downloaded from server to device.
A C k N O W L E D G M E N T S i x
A G R I C U LT U R E A N D E N V I R O N M E N TA L S E R V I C E S T E C H N I C A L A S S I S TA N C E PA P E R
ACKNOWLEDGMENTS
ICT for Data Collection and Monitoring & Evaluation: Opportunities and Guidance on Mobile Applications for Forest and Agricultural Sectors was
funded by the World Bank Agriculture and Environmental Services (AES) unit and the Program on Forests (PROFOR). PROFOR is a multi-donor
partnership managed by a core team at the World Bank. It finances forest-related analysis and processes that support efforts to improve
people’s livelihoods through better management of forests and trees, enhance forest governance and law enforcement, finance sustainable
forest management, and coordinate forest policy across sectors. In 2013, PROFOR’s donors included the European Commission, Finland,
Germany, Italy, Japan, the Netherlands, Switzerland, the United kingdom, and the World Bank. (See www.profor.info.)
This report was made possible by a number of key individuals and consultants who authored and reviewed the publication, the information
and communication technology group within AES that led and guided development of the report, and NetHope, with whom the accom-
panying cloud-based database product was developed.
The analytical study was conducted by Cory Belden and Priya Surya, who significantly contributed to the design of the study, finalization of
the analysis, study findings, and writing of the report. Analysis was further supported by Aparajita Goyal and Peeter Pruuden. Forestry case
studies were compiled by Troy Etulain. We are also very grateful to the service providers who answered surveys and provided information
on their application or software and to those who participated in the associated workshop in March 2013. The team also acknowledges the
peer reviewers of this work—Carol Bothwell, Caroline Figueres, Tim kelly, and krishna Pidatala—for their constructive critique and guidance
throughout the process.
Eija Pehu, Task Team Leader of this study from the AES Department of the World Bank, and Tuukka Castren, the co-Task Team Leader, provided
continuous guidance. The support of Alison Mills and Jim Cantrell in managing the publication of the report is appreciated.
All omissions and inaccuracies in this document are the responsibility of the authors. The views expressed do not necessarily represent those
of the institutions involved, nor do they necessarily represent official policies of PROFOR or the World Bank.


x i
A G R I C U LT U R E A N D E N V I R O N M E N TA L S E R V I C E S T E C H N I C A L A S S I S TA N C E PA P E R
P R E FA C E
PREFACE
This study was developed to assist development practitioners in assessment and selection of information and communication technology
(ICT) applications for monitoring and evaluation in rural projects, specifically in agriculture and forestry, with an emphasis on mobile
technology for data collection. Particularly in highly decentralized projects, data collection can be challenging, and the large number of
options and specific project needs makes selecting technology a challenge. This report was developed in response to an identified need
for development practitioners to be able to stay current with changing technology and identify appropriate avenues for assessing and
selecting technology to support monitoring and evaluation (M&E) as well as project outcomes.
The report proposes guidance in selecting and applying technology for data collection and monitoring and evaluation through the lens
of agriculture and forestry projects. It is designed to be a deep-dive, operational piece that tackles how governments and development
practitioners can use ICT to enhance their data collection and M&E efforts in rural development projects and programs.


1
A G R I C U LT U R E A N D E N V I R O N M E N TA L S E R V I C E S T E C H N I C A L A S S I S TA N C E PA P E R
C H A P T E R 1 — O V E R V I E w
Chapter 1: OVERVIEW
Tracking progress in sustainable agriculture and forest management is
challenging: distances are long, populations are sparse, interventions
range from policies to crop and livestock practices, and the voice
of the farmer is critical for success. Recent approaches focusing on
climate impacts and land use pressures (climate-smart agriculture
and landscape approach) add to the complexity and require efficient
data collection and analysis methods. Heightened unpredictability
and changes in weather patterns have affected the productivity and
risks associated with agriculture and forestry activities and therefore
the lives of the communities who depend on them. The urgency to
obtain reliable data and their analysis and distribution to different
stakeholders have increased substantially—given the global uncer-
tainty around food production, commodity trade, food prices, and
the effects and speed of climate change. Furthermore, sustainable
agriculture and natural resource management solutions are becom-
ing interlinked and more knowledge-intensive, requiring reliable
data for decision making.
Alongside increasing climate change concerns is a promising trend:
fast-moving, cost-effective, widespread information and com-
munication technologies (ICT)—especially mobile phones. Their
affordability and pervasiveness has made them viable tools for data
collection. with near real-time feedback from the field, technology
is facilitating the ability to oversee operations across dispersed
geographic locations, obtain complete data sets at a faster and
more efficient pace, and evaluate results more often and with a
tighter and clearer feedback loop to practitioners implementing
programs. The systemization of ICT in the monitoring and evalua-
tion (M&E) process also enables accountability—from field staff to
regional and central governments and development partners. It
also supports evidence-based decision making and the effective
allocation of resources in order to maximize social impact.
To support the growing interest among practitioners in using ICT
in agriculture and forestry sectors, the world Bank published two
reports on information technology (IT) in rural landscapes in 2011.
The ICT in Agriculture e-Sourcebook1 explores how digital tools—
mobile devices, applications, software, and geographic information
systems (GIS), among others—can be used in 14 different agriculture
subtopics ranging from productivity to risk management. The 2012
Information and Communication for Development report dives into
mobile applications across different sectors, including agriculture,
with a focus on value chains.2 In addition, the eTransform Africa
report provides data and insights for the transformational power of
ICTs with sectoral examples, including agriculture.3 within the for-
est sector, Forest Governance 2.0: A Primer on ICTs and Governance4
examines the role of technologies ranging from radio and mobile
phones to hi-tech satellite imagery in increasing public participa-
tion, enhancing economic efficiency, and improving law enforce-
ment. All of these reports aim to highlight the opportunities found
within the ICT innovation space for agriculture and forests.
Since the publication of these reports, significant progress has been
made on multiple fronts. Improvements in infrastructure have made
the mobile phone the most common and most adaptable tool used
worldwide. The leapfrog effects of ICT have increased access to
quality information, eased knowledge sharing among practitioners
and resource-constrained governments, and created opportunities
to improve accountability. The expansion of ICT has also made
1 www.ictinagriculture.org.
2 http://siteresources.worldbank.org /EXTINFORMATIONANDCOMMUNICATIONANDTECHNOLOGIES/Resources /IC4D-2012-Report.pdf.
3 http://www.infodev.org/infodev-files/resource/InfodevDocuments_1162.pdf.
4 http://www.profor.info/sites/profor.info/files/docs /Forest%20Governance_web.pdf.

2
I C T F O R DATA CO L L E C T I O N A N D M O N I TO R I N G & E VA LUAT I O N
C H A P T E R 1 — O V E R V I E w
capacities and constraints. The number of technologies applicable
to data collection and M&E is daunting; hundreds of apps, software
packages, platforms, services, features, and business models exist
and are constantly developing. Designs and implementation strat-
egies vary. Costs range from open source and free to commercial
systems and expensive. Not only does a practitioner have to learn
how to use the technology and demonstrate it to staff and partners,
he or she must also justify why a certain product was selected and
paid for in place of others and consider its long-term sustainability
and utility in generating tangible outcomes.
1.1 SCOPE
This report seeks to propose solutions to some of these questions
concerning data collection and monitoring and evaluation.
It is designed to be an operational piece that addresses how
governments and practitioners can use ICT to improve their data
collection and M&E efforts in rural development projects. Although
the report focuses on agriculture and forest activities, the principles
discussed can largely be extended to other sectors.
the work of development practitioners easier and more accurate.
In some regions there are already more mobile phone subscriptions
than people, and even Internet access has become more common.
(See figure 1.1.)
Efficient and precise data collection is an integral component of
M&E of projects and programs. The enhanced ability to monitor,
measure, and adjust to impact—through visualizing data on maps
using GPS coordinates, accessing research published in previously
inaccessible locations, providing rich information to farmers who
could otherwise not be reached quickly, or recording beneficiaries
who gain access to services—improves capacity to meet goals
aimed at reducing poverty and improving productivity and resil-
ience. This report identifies where ICT has expanded the capacity
to perform good M&E and, more importantly, it identifies where it
has not. It identifies where and how it can expand data collection
and M&E, but also why and how technology is not a replacement for
human agency and involvement in analysis and interpretation tasks.
The interest in deploying ICT for data collection and M&E has
also led to a plethora of tools and platforms with a variety of
FIGURE 1.1: Mobile Phone and Internet Penetration in Selected Regions (2000–11, per 100 persons)
Source: world Bank 2013 and world Development Indicators 2013.Note: Data includes only developing countries in the regions.
40
50
60
70
80
90
100P
er 1
00 p
eopl
e
110
02000 2001 2002 2003 2004 2005 2006 2007 2008 2009 2010 2011
10
20
30
East Asia & Pacific, mobile subscriptions
Europe & Central Asia, mobile subscriptions
Sub-Saharan Africa, mobile subscriptions
East Asia & Pacific, Internet users
Europe & Central Asia, Internet users
Sub-Saharan Africa, Internet users

3
A G R I C U LT U R E A N D E N V I R O N M E N TA L S E R V I C E S T E C H N I C A L A S S I S TA N C E PA P E R
C H A P T E R 1 — O V E R V I E w
software, training required, GIS capability, survey limits, and data
validation processes. After information was sourced from the com-
panies, a series of product and or technology considerations for
practitioners were developed. Additional sources addressing data
collection in developing countries using ICT, such as the work done
by Humanitarian Nomad,5 were also consulted.
The case studies in section 6 describe how a particular technol-
ogy was adapted for use in various rural contexts. This information
was sourced directly from practitioners involved in the projects.
Questions regarding technology selection, implementation of the
project, challenges, and impacts were explored in each case. The
cases were selected with the intention to provide practitioners with
a diverse snapshot of how different data collection models and
technologies have been employed to achieve specific project goals
in agriculture and forestry.
As stated earlier, this is a dynamic field, and thus the features
captured in this publication will evolve and change quite rapidly
over time. To address this evolution, the information on applica-
tions generated for this publication is also provided and updated
on a cloud-based public database developed by NetHope.6 This
cloud portal is intended to provide a space for agencies and
organizations to research ICT solutions, exchange information on
the quality of services provided, and share experiences. The portal
maintains a searchable product catalogue that includes the applica-
tions discussed in this publication among many others. The portal
also hosts discussion forums, user reviews, and accumulates case
studies. Practitioners can access and use this database by going to
http://cloudportal.nethope.org/supersearch/#q/keywords=&num=
10&channel=products&orderby=relevance&sort=desc&category=
37&&38&&27&inclusive_categories=yes&pagination=P0
5 http://humanitarian-nomad.org.
6 http://solutionscenter.nethope.org.
The second section of the report focuses on the most important
aspect of ICT use: articulating the needs of the project and users.
The third section provides an overview of five models currently
used to implement and integrate information technology into M&E
efforts. The crux of the report centers on choosing the right product
or set of products for the project, and it includes cross-comparative
guidance on application features such as data validation, offline
capacity, dashboards, and built-in analytics (see section 4). The
service design section deals (see section 5) with issues inherent to
the provision of public services, such as how to provide appropriate
incentives for the participation necessary to sustain the program
and why post-data collection efforts are critical to success. Along
with these practical approaches to deploying ICT, the report
describes five case studies on mobile-based data collection in the
agriculture and forest sectors (see section 6). The conclusion section
follows the case studies.
It is important to note that the logic of the sections in this report
and the process suggested in figure 1.2 is an evolving one. The
feedback loop is a critical component of any project that uses ICT,
and updating technology and the service design that supports it
is based on the trends in the sector, which are constantly shifting.
Paying attention to this feedback loop increases sustainability and
maintains cost-effectiveness.
1.2 SURVEY METHODOLOGY
The publication draws upon information sourced from over 20
companies that have developed widely used systems and apps for
ICT-enabled data collection in rural areas (see annex 1 for a list of
the tools referenced throughout this publication). The companies
surveyed are those that have deployed their application or product
in more than one challenging context and on a large scale. These
companies were surveyed on 34 application features, including
platforms used, dashboard analytics, interoperability between
FIGURE 1.2: Framing the Use of ICT in Data Collection and M&E
Needs assessment
Implementationmodel
Technology, budget and cost
Service design


5
A G R I C U LT U R E A N D E N V I R O N M E N TA L S E R V I C E S T E C H N I C A L A S S I S TA N C E PA P E R
C H A P T E R 2 — A S S E S S I N G P R O j E C T N E E D S A N D CO N S T R A I N T S
Chapter 2: ASSESSING PROJECT NEEDS AND CONSTRAINTS
• Data: what types of data are required? (for example, deep understanding through narrative stories, one-word answers on a number of different questions, or a mix of these)
with a plethora of available technologies with unique combinations
of capabilities and features, assessing the needs for any particular
project is the first step in selecting the right set of ICT tools. To de-
cide whether a particular technology—or any technology for that
matter—is useful or not requires clearly defining project goals and
sector needs. Asking the questions typical to agricultural or forest
projects are important before even considering the technology. For
example: what is the project attempting to achieve? who are the
targeted beneficiaries? what data are important to collect? what do
project leaders want to draw from the analyzed data? what is the
best way to report the data for management and stakeholders?
The extensiveness of data collection and its method should be estab-
lished before the project begins. If technology is determined to meet
project and data collection needs, additional queries can be posed.
These questions have to do with issues related to ensuring that ben-
eficiaries are effectively reached and empowered through the use
of ICT and as such are less concerned with the specifics of technol-
ogy, such as connectivity, the length of battery life, costs, and offline
capacity, and more concerned with timelines, whether the data col-
lection effort is singular or reoccurring, and the characteristics of data
users, such as literacy, technology trust, and exposure to surveying.
The questions in boxes 2.1 and 2.2 highlight key project and people
needs that warrant consideration. These questions are by no means
comprehensive but are meant to help assess project needs.
BOX 2.1: Project Needs
• Survey-based or another model: what model does the project require? (for example, crowd-sourced information, environmental or supply chain informa-tion through sensors, satellite imagery, or surveys)
• Level of reporting: To whom will reports go, and how will they be used? (for example, multimedia for beneficiaries, dashboards that allow multi-stakeholder access, auto-generated reports)
• IT resources: Are the ones needed available, and from where? (for example, in-house software development, outsourced Software as a Service (SaaS) solutions)
• Context: what constraints are inherent to conducting projects in this environment? (for example, political conflict, inhibiting weather patterns, poor infrastructure)
• Funding: Are realistic cost estimates available? Have sufficient funds been allocated for this work?
• Availability of technology literate enumerators or beneficiaries: How much training will be required to implement the data collection effort?
• Availability of technology trainers and support staff: will resources to train participants be available, and for a sustainable price and sufficient duration?
• Well-constructed team: Can the project recruit and maintain a team with the diverse skill set required? Importantly, this includes specialists with the necessary sector expertise, professionals in methodology (for example, survey techniques such as random assignment), local experts with indigenous knowledge, and analysts who can outline essential questions and then perform rigorous diagnostics once data have been gathered.
BOX 2.2: People Needs
BOX 2.1: continued


7
A G R I C U LT U R E A N D E N V I R O N M E N TA L S E R V I C E S T E C H N I C A L A S S I S TA N C E PA P E R
C H A P T E R 3 — DATA CO L L E C T I O N I M P L E M E N TAT I O N M O D E L S
Chapter 3: DATA COLLECTION IMPLEMENTATION MODELS
Upon outlining project and people needs and determining that
selected technology is a good fit, an appropriate data collection
model can be designed. Using frontline workers—either commun-
ity-based professionals or selected surveyors—to collect information
is the most common method of mobile-based data collection. In fact,
almost all providers discussed in this publication use this method.
This section outlines this method and other emergent models in
data collection, including automated capture, crowd-sourcing,
passive capture and data harvesting, and qualitative data analytics.
3.1 FRONTLINE WORKERS
Frontline workers are enumerators, surveying the local population
or target group on questions of interest. Using frontline workers
to collect digital data requires similar design efforts as traditional
methods such as random sampling. Local enumerators may have
limited experience with technology and survey methodologies,
and they may thus require training in technology basics as well as
survey administration in order to communicate questions and cap-
ture pertinent information accurately. A mobile application is one
of many among the digital tools a frontline worker can use. Among
its advantages is the ability to make changes to the forms that can
easily, and in some cases automatically, update field surveys.
However, some projects with standardized forms and a large vol-
ume of data collection may benefit from digital pen technology, in
which information is stored both digitally and on hard copy, which
allows frontline workers to focus more on the interview process
than technology. while digital and hard copy storage in this manner
may be perhaps more familiar to people, the quality of the data col-
lected can sometimes be substantially less than in mobile-phone-
based systems that may allow for error checking at the source.
Projects may benefit from testing data quality in one format versus
another—that is, testing whether the mobile phone interface helps
or hinders their particular data capture process.
3.2 AUTOMATED CAPTURE
Automated data capture through technologies like GPS, sensors,
satellites, and remote sensing has been around longer than other
models. However, only recently has it become affordable, accessible,
and tailored to development specialists and developing-country
governments (figure 3.1). Often GPS data are collected through the
same applications that frontline workers use for household data.
Records are marked by location data through a built-in or attached
device. Modern smartphones and pocket cameras feature built-in
GPS devices that allow geocoded photographs to be used as part
of the M&E process, often for evidence recording purposes. GPS
coordinates can also be used to log infrastructure points, such as
farm location and size, or irrigated areas.
Phot
o Cr
edit:
Sim
one
D. M
cCou
rtie
.
FIGURE 3.1: Community Meeting. Girl on Cellphone. Aurangabad, India.

8
I C T F O R DATA CO L L E C T I O N A N D M O N I TO R I N G & E VA LUAT I O N
C H A P T E R 3 — DATA CO L L E C T I O N I M P L E M E N TAT I O N M O D E L S
Sensors collect ecological data on soil, water, and other elements of
interest. After installation, these are programmed to record data at
certain times. This method, along with satellites, is especially useful for
measuring changes over time. Satellites are most commonly used to
monitor land use shifts such as deforestation and water patterns (for
example, desalination, sea level rise), as well as production, such as
yield output and rate of crop growth. However, raw earth observation
data require high levels of analysis before they are directly interpre-
table or actionable information. Remote sensing technologies such
as LiDAR mapping allow analysis of vegetation mapping, including
forest structure components such as crown density, crown volume,
stand height, and tree density over large areas. These data can be
used to estimate more complex vegetation characteristics, including
basal area, forest biomass, and forest volume, among others.
3.3 CROWD-SOURCING
with the advent of widespread mobile phone access, crowd-
sourcing for data collection is another emerging method for data
capture. Crowd-sourcing is accomplished by allowing, request-
ing, and empowering rural people to send in their observations,
data, or information through their mobile devices (figure 3.2). This
approach can be used for many different purposes in rural develop-
ment. One common use is during crises and natural disasters. Data
collection from the general public can also be used to help forest
and agricultural authorities identify emerging trends and phenom-
ena. Agricultural applications such as pest outbreaks are a major
area for potential use, and in the forest sector, local monitoring of
logging in forests can help reduce the prevalence of illegal logging.
Crowd-sourcing allows individuals to contribute to the data collec-
tion process, making it more democratic and transparent, and also
helps authorities to target their enforcement and prevention activi-
ties to areas of specific interest.
while it has many applications, this method of data collection
is not without significant challenges. It is often difficult to attract
participation of a large enough number of people to capture
adequate data needed for robust data collection. It may require
heavy investment in continuous marketing and compelling incen-
tives for participation. One particularly essential incentive is visible
and timely feedback to the information provided; participants need
to be confident that their contributions lead to action (see also
section 5.2 on “Driving Adoption”). The utility of crowd-sourcing
may also be limited by a lack of advanced phones that can send
complex messages (of course, short message service [SMS] can be
used when simple, short messaging is all that is required), illiteracy
that limits participation, and high levels of error involved in gather-
ing messages from uncontrolled submitters (for example, without
surveyors or frontline workers), especially when participation is low.
Crowd-sourcing is one component in wider data collection strate-
gies. It is essential that crowd-sourced observations are verified to
ensure that deliberate or accidental misinformation is identified,
particularly in rural contexts where large numbers of participants
(compared with urban areas) are not there to provide an additional
level of accuracy. Last, if law enforcement is helped by citizens’ par-
ticipation, as can be the case especially in forestry, it is essential that
participants’ personal safety is not compromised and that informa-
tion remains truly confidential. If mobile devices are to be used in
crowd-sourced data collection, it must be taken into account that
already existing legacy mobile devices need to be supported by
selected data collection system, be it SMS or form-based. (See also
the discussion on technology support in section 4.)
3.4 PASSIVE CAPTURE AND DATA HARVESTING
Data that can indirectly reflect a change in consumer habits, needs,
or economic status can be captured from mobile phone use pat-
terns. For example, by analyzing patterns in mobile top-up amounts
and usage, researchers have been able to detect shrinking incomes
Phot
o Cr
edit:
Arn
e H
oel.
FIGURE 3.2: Women of Takalafiya Lipai Village. Niger.
9
A G R I C U LT U R E A N D E N V I R O N M E N TA L S E R V I C E S T E C H N I C A L A S S I S TA N C E PA P E R
C H A P T E R 3 — DATA CO L L E C T I O N I M P L E M E N TAT I O N M O D E L S
well before the release of official statistics on this trend. Another
example can be the flood of data generated through mobile pay-
ments for subsidized and other agricultural inputs, which can allow
governments and civil society organizations to better understand
the use of these opportunities and the subsequent food produc-
tion patterns. This can lead to greater preparedness for preventing
or responding to food shortages. Data from mobile usage patterns
can also be combined with other methods to create a more robust
data collection strategy.7
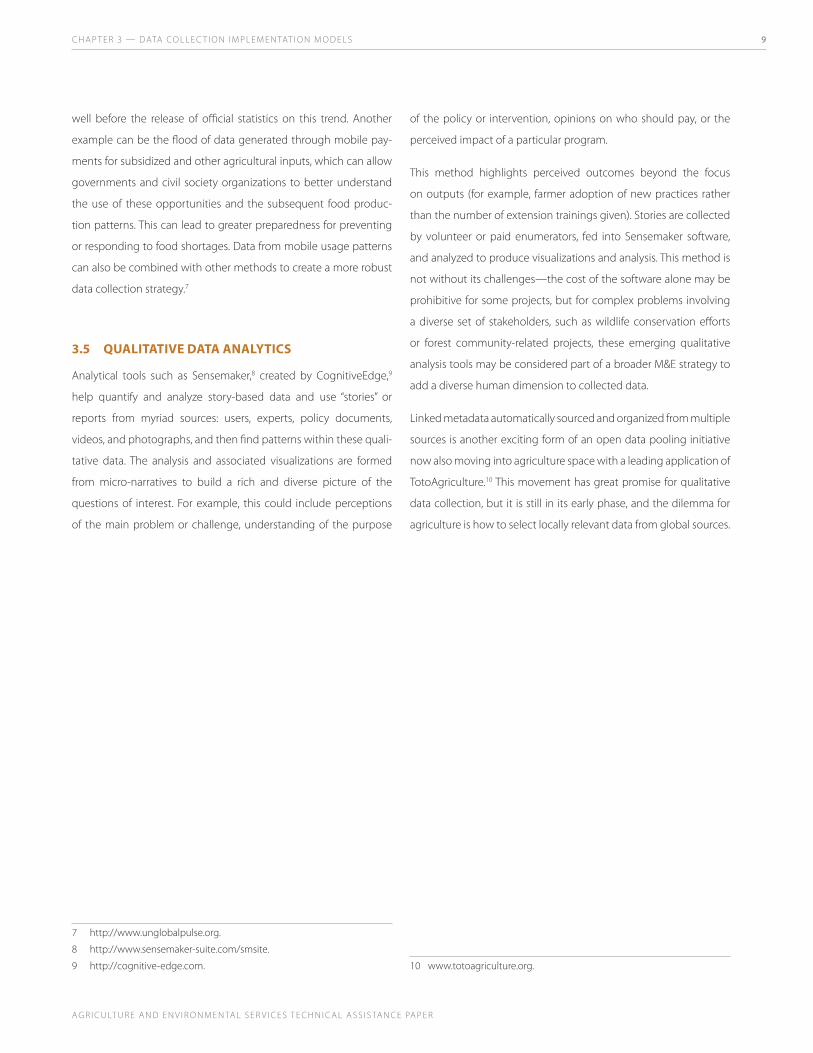
3.5 QUALITATIVE DATA ANALYTICS
Analytical tools such as Sensemaker,8 created by CognitiveEdge,9
help quantify and analyze story-based data and use “stories” or
reports from myriad sources: users, experts, policy documents,
videos, and photographs, and then find patterns within these quali-
tative data. The analysis and associated visualizations are formed
from micro-narratives to build a rich and diverse picture of the
questions of interest. For example, this could include perceptions
of the main problem or challenge, understanding of the purpose
7 http://www.unglobalpulse.org.
8 http://www.sensemaker-suite.com/smsite.
9 http://cognitive-edge.com.
of the policy or intervention, opinions on who should pay, or the
perceived impact of a particular program.
This method highlights perceived outcomes beyond the focus
on outputs (for example, farmer adoption of new practices rather
than the number of extension trainings given). Stories are collected
by volunteer or paid enumerators, fed into Sensemaker software,
and analyzed to produce visualizations and analysis. This method is
not without its challenges—the cost of the software alone may be
prohibitive for some projects, but for complex problems involving
a diverse set of stakeholders, such as wildlife conservation efforts
or forest community-related projects, these emerging qualitative
analysis tools may be considered part of a broader M&E strategy to
add a diverse human dimension to collected data.
Linked metadata automatically sourced and organized from multiple
sources is another exciting form of an open data pooling initiative
now also moving into agriculture space with a leading application of
TotoAgriculture.10 This movement has great promise for qualitative
data collection, but it is still in its early phase, and the dilemma for
agriculture is how to select locally relevant data from global sources.
10 www.totoagriculture.org.


11
A G R I C U LT U R E A N D E N V I R O N M E N TA L S E R V I C E S T E C H N I C A L A S S I S TA N C E PA P E R
C H A P T E R 4 — MA N y A P P L I C AT I O N S , MA N y O P P O R T U N I T I E S : K E y C H O I C E S F O R I C T TO CO L L E C T DATA I N R U R A L A R E A S
Chapter 4: MANY APPLICATIONS, MANY OPPORTUNITIES: KEY CHOICES FOR ICT TO COLLECT DATA IN RURAL AREAS
with needs assessed and an implementation model designed, the
team can proceed to selecting a specific technology, application,
or platform. The selection process itself takes some attention. The
digital opportunities available to practitioners working in the forest
and agriculture sectors are far-reaching. Hundreds of applications
exist, with varying connectivity capacities, hardware components,
costs, and features. The proliferation of these applications, while cer-
tainly promising for development work, has also led to hesitation
and confusion in selection, design, and implementation.
Practitioners must answer a number of questions in order to determine
whether an application suits their project’s needs. For example, are
applications truly offline capable? what are the running costs of a
data collection effort? Are dashboards secure enough to store sensi-
tive data? How much training is required for local staff? what types
of hardware offer GPS functionality? Are there applications capable
of collecting thousands of data points? Answering these questions,
among others—and before technology roll-out—are critical to the
project’s cost-effectiveness and success. Box 4.1 includes further
questions to be addressed when selecting tools for a project, building
on work of the Humanitarian Nomad Online Selection Tool.11 This also
includes taking into account existing capacity in both personnel and
technology. (See annex 2 for a more thorough overview of product
capabilities and considerations when making an ICT selection.)
Table 4.1 builds on the questions in box 4.1 and displays the mul-
tiple options available according to different product features. It is
a helpful visual in thinking through options available for platform,
capability, storage, analysis, features, and other important aspects of
the technology being selected.
11 http://humanitarian-nomad.org/online-selection-tool.
BOX 4.1: Items to Consider When Selecting an M&E Tool for a Rural Development Project
• Are there data collection technologies already being used in the target country?
• what platforms are used in the target country?
• Have the mobile devices that will be used to collect data already been procured?
• what is (are) the type of survey(s) required: one-off or continuous?
• Is there an existing reporting/analysis/visualization tool in use (such as ArcMap, Google Earth, SPSS)?
• Are there opportunities to scale out existing systems?
• How much is it possible to align with the public service provider (for instance, in the agriculture sector)?
• Is an SMS based system required?
• Do the survey data need to be stored on your own servers?
• Is real-time synchronization from the remote field or field office location needed?
• Are forms in non-western Latin character sets needed?
• Do the staff who create the forms have a basic understanding of databases and data structures?
• Is it acceptable to pay for a service solution that would host the solution and facilitate installation and development of forms?
• Is there a need to collect and display spatial data on a map?
• what are the emerging trends in technology and methodology?
The data sourced from companies revealed a number of key dis-
tinctions between the applications available for data collection
and M&E in the rural sector. It also clarified relationships between
features of a given application (for example, more-complex data

12
I C T F O R DATA CO L L E C T I O N A N D M O N I TO R I N G & E VA LUAT I O N
C H A P T E R 4 — MA N y A P P L I C AT I O N S , MA N y O P P O R T U N I T I E S : K E y C H O I C E S F O R I C T TO CO L L E C T DATA I N R U R A L A R E A S
collection needs more higher-end hardware). This section highlights
the top considerations when selecting an application for a project,
such as connectivity, data input technology, budget and costs, ana-
lytics, data management, and stakeholder access.
4.1 CONNECTIVITY
Though major strides have been made in connecting last-mile,
rural populations to telecommunications and broadband networks
(figure 4.1), there are still many areas with unreliable connections.
Practitioners and governments alike are often surprised to discover
that mobile services are not feasible due to restricted telecommu-
nications access. Innovative solutions to using ICT even in these
situations are possible, but they require careful planning. On the
opposite end, some rural areas are gaining access to broadband.
This increases the potential to use smartphones in data collection
efforts and relieves the need for offline tools and the transaction
costs resulting from travel to “connected” central locations.
The overwhelming majority of providers surveyed have “offline
capacity” (see box 4.2 for Digital Green’s method).12 This means
that the mobile devices used have the option of collecting data
and storing it, then subsequently uploading it to the central server
or dashboard once an Internet or telecommunications network is
within range. This is a good option for data collection efforts that
involve enumerators because they often have to travel to a central
location in any case. Crowd-sourcing efforts are different and are
12 http://www.digitalgreen.org.
not typically successful if telecommunications networks are weak.
Some applications offer specialized solutions. For example, iForm-
builder created the “thunderplug,” a device that synchronizes data
from multiple mobile handsets to a central location even without
networks.13
13 https://www.iformbuilder.com.
TABLE 4.1: Product Features
Device platform Android iOS Java Palm
Device type Tablet Smart Phone Basic Phone PDA
Device capability Camera GPS Signature External GPS
Storage/stakeholder access Custom installation Hosted SaaS/Cloud Remote management
Analysis GIS SPSS eCognition Custom
Implementation model Frontline workers Crowd-sourcing Passive Automated
Business model Open source Proprietary License fee Subscriptions
Support In-house Outsourced Service provider Other
Mobile features Online Offline Two-way sync SMS
Data security In-device encryption Database encryption Encrypted connectivity Access control mechanisms
Note: The table shows different options available in the market and does not imply any specific combinations of features in columns or rows.
Phot
o Cr
edit:
Chh
or.
FIGURE 4.1: Telecommunication Network. Cambodia.

13
A G R I C U LT U R E A N D E N V I R O N M E N TA L S E R V I C E S T E C H N I C A L A S S I S TA N C E PA P E R
C H A P T E R 4 — MA N y A P P L I C AT I O N S , MA N y O P P O R T U N I T I E S : K E y C H O I C E S F O R I C T TO CO L L E C T DATA I N R U R A L A R E A S
Another consideration, along with connectivity, is whether a survey
can be updated in real time. Survey uploads or changes must be
done with a network connection (currently most applications
transmit data over telecommunications networks, not broadband).
However, there are differences in the levels of management. If using
SMS to collect data, the administrator usually must send an updated
survey to the data collector. If using tablets or smartphones, survey
changes will synchronize automatically with the handsets (as in the
case of Cropster).14 There are middle grounds to these two options
as well; for example, users are given the option to update the sur-
veys. This allows them to finish data collection on one version of the
survey and then update to the second version when convenient.
Connectivity and the need for data transfer should be the first con-
siderations when designing an ICT-enabled data collection effort.
The strength of networks will significantly influence the technology,
application, hardware, and level of administrator involvement.
4.2 DATA INPUT TECHNOLOGY
4.2.1 SMS vs. Form-based Digital Data Input
Devices to be used in actual data collection are often determined
by the needs and complexity of the desired data set. One significant
factor is the physical screen size, which determines the amount
of information that can be displayed at a time. Feature phones
14 https://www.cropster.org.
typically have smaller screens only capable of displaying one or a
few questions at a time on a single screen, whereas smartphones
and tablets can accommodate a larger number of questions with
more descriptive question text. More complex answer structures,
such as selection lists and tables, typically also require either smart-
phones or tablets. Form-based tools often also include skip logic
features that allow for data from previous answers to be used to
determine which of the subsequent questions need to be displayed
and answered. Simple SMS-based approaches do not suit well if such
questionnaires need to be used. It is worth noting that a form-based
system may also internally use SMS as a data transmission channel,
but such a setup typically has disadvantages on the costing side, as
cost per character sent via SMS is typically much higher than when
General Packet Radio Service (GPRS)/3G data connection is used.
Usually an SMS-based system is assumed to use the regular SMS
inbox/outbox system available on each and every mobile device in
even the lowest price points.
4.2.2 Basic Phones, Smartphones, and Tablets
Most service providers are moving away from approaches that use
basic phones toward those that use smartphones. This is because
while basic phones have lower start-up costs, they have higher
usage costs because SMS can be very expensive. Conversely, smart-
phones might be more expensive initially, but they do not often
incur such high data transmission costs. The cost of these devices is
improving, given dramatic drops in prices, and many older hardware
products maintain compatibility with applications even after a new
version has been released. In the same vein, smartphones are often
easier to learn how to use than SMS. whereas SMS data collection
projects are forced to use code to fit information into the small text
message format, many smartphones have intuitive touch screens.
Tablets are also becoming more commonly used due to rapid price
decreases. This is especially true for Android devices.
Some applications can run on multiple platforms and others are
more restricted. Cropster can run on all platforms so long as there
is an Internet connection. Freedom Fone,15 on the other hand, can
receive calls and texts (crowd-sourcing) from any platform, but sur-
veys must be administered through Ubuntu 12.04 or Debian.
15 http://www.freedomfone.org.
BOX 4.2: Connect Online, Connect Offline: An Open Source Tool for Tackling Poor Connectivity
In areas with poor Internet connectivity, uploading extensive survey data or media-files can be a debilitating challenge at the field level. To circumvent this challenge, an India-based non-governmental organization (NGO), Digital Green, has created an open-source platform, Connect Online Connect Offline (COCO) that enables people to use the application continuously, and only requires connectivity when a user is ready to synchronize with the global data repository. This customizable framework can be used to upload baseline survey data, photos, and videos from the field without the need of IT or Engineering staff.
Free download available at www.digitalgreen.org/technology.

14
I C T F O R DATA CO L L E C T I O N A N D M O N I TO R I N G & E VA LUAT I O N
C H A P T E R 4 — MA N y A P P L I C AT I O N S , MA N y O P P O R T U N I T I E S : K E y C H O I C E S F O R I C T TO CO L L E C T DATA I N R U R A L A R E A S
An additional component to selecting hardware is whether
geographical data should or need to be collected. Most applica-
tions can be GPS-enabled. This feature is most often determined by
the capacity of the phone or tablet used and therefore influences
the cost of hardware. For example, Android, iOS devices, and other
smartphones have GPS features built-in. Simple java phones do not.
Freedom Fone and FrontlineSMS,16 which do not use smartphones,
do not have GPS capacity. If location is absolutely critical but the
phone used does not feature GPS, additional devices can be used
to attach GIS information to each survey, although this method is
time-intensive and prone to error.
4.2.3 Digital Pen17
In some cases, a mobile application can complement digital pen-
based data capture. For instance, for a survey regarding livestock
disease, surveyors may find that only 30 percent of households
are experiencing livestock disease. In that case, a mobile applica-
tion may be used to capture data on the 70 percent of zero-valued
households, and dot-printed or color-coded forms only need to be
used with households where there is an incidence of one or more
livestock suffering from a disease. This combination allows for cost
savings as well as a more descriptive feature set. Effectiveness of
processes based on digital pen technology is also often challenged
by the lack of automatic data validation capability at the source.
Such capability can be made available when using other electronic
input mechanisms (laptops, tablets, mobile phones). Also, digital
pen battery charging should be considering when using digital
pen–based solutions in remote areas.
4.3 BUDGET AND COSTS
Considering the project’s budget as well as the costs of a given
application or technology logically follows the connectivity analy-
sis, as connectivity limits options regardless of the budget size.
16 http://www.frontlinesms.com.
17 A digital pen is an input device that captures the handwriting of a user and converts handwritten analog information created using “pen and paper” into digital data, enabling the data to be digitized and uploaded to a computer and displayed on its monitor. The handwriting-capturing technology used by various vendors may be based on accelerometer, positioning assistant, camera, or trackball. Digital pens typically contain a regular writing pen so the output can be seen on paper, as with any pen. Depending on the technology used, the paper may be plain or specifically formatted using miniature spotted patterns.
Integrating ICT commonly reduces the transaction costs of data
collection, so in most cases, digitizing at least some steps of the
process increases efficiency.
A number of cost and budget factors should be considered when
choosing an application. The three most varying factors are hard-
ware and associated platform, the level of complexity (and therefore
the training and troubleshooting required), and the scope or scale
of the data collection effort. The third factor is intuitive: the larger
the scale, the higher the cost. Of course, there are a multitude of
additional cost implications. A thorough bidding and selection pro-
cess (see annex 3 for a costing template and a list of considerations)
will help to clarify accruing costs.
The applications discussed in this publication have the capacity to
collect substantially large amounts of data. Due to confidentiality
agreements and “hands-off” business models, many companies
are unable to provide specific details on the scope of certain proj-
ects. In general, however, the applications reviewed in this pub-
lication are capable of creating surveys with over 100 questions
(and some with as many as 400 questions)—see box 4.3—and
hundreds of enumerators (iFormbuilder, Magpi,18 and Open Data
Kit [ODK]19 reported projects that used over 1,000 enumerators).
Tens of thousands to millions of observations have been collected
in a single project. Clearly, the applications available are indeed
capable of implementing scaled-up data collection efforts.
Cost is related to the platform used because of the hardware
requirements and the costs associated with using them. It is important
18 https://www.magpi.com (Magpi was formerly known as Episurveyor)
19 http://opendatakit.org/
BOX 4.3: Questions to Include: Thinking Through What Is Needed
Despite the capacity of digital tools to capture lengthy surveys, questions should be kept at a minimum. The quality of data gath-ered deteriorates quickly if surveys are too long. Moreover, too much data makes analysis difficult and overwhelming; the original intent of the data collection is drowned out in efforts that attempt to tackle multiple agendas simply because the tool allows for it. Defining the scope of the project explicitly helps to narrow down the list of questions. Projects must therefore optimize for accuracy during surveys and interviews to achieve best results.

15
A G R I C U LT U R E A N D E N V I R O N M E N TA L S E R V I C E S T E C H N I C A L A S S I S TA N C E PA P E R
C H A P T E R 4 — MA N y A P P L I C AT I O N S , MA N y O P P O R T U N I T I E S : K E y C H O I C E S F O R I C T TO CO L L E C T DATA I N R U R A L A R E A S
to note, however, that sometimes costs are accounted for elsewhere (for
example, using a platform that is more intuitive for users will reduce the
costs associated with training even if that device is more expensive ini-
tially). The most widely used platforms associated with mobile devices
today are iOS, Android, and j2ME. The j2ME platform uses the cheapest
hardware and is the most simple in capacity, however it does not pro-
vide many options that smartphones do. iOS and Android platforms,
on the other hand, provide more complex functions, but they are also
more expensive than a java device. Blackberry and windows are also
platform options, but they are much less commonly used than the
others. Figure 4.2 captures the platforms that providers use.
Costs can also come from a variety of other sources. The database
host, management, training, and fees for SMS or data transmission
services range in price. whether the application comes packaged
with other services like consultation also influences the price.
Generally speaking, applications that are not SaaS will be cheaper,
but they may require additional IT support or planning time and
thus increase costs through staff hire. The important note here is
that projects that use ICT to enhance their data collection or M&E
processes still necessitate human involvement for design and
implementation; this component will increase either the cost of the
application or the costs supporting it. At the same time, integration
of ICT systems needs to be built in existing and foreseen institutional
realities to be sustainable. For example, the structure and sources of
budget funding matter. Many agencies may be cash-poor but staff-
rich, or there may be (donor) resources available for investment but
not recurrent budget. It is important to consider whether invest-
ment and recurrent budgets can substitute for each other. This has
an impact on technology choice as well; an agency may have staff
for in-house implementation and support but not for payment for
external services and licenses, or vice versa.
TABLE 4.2: Suggested End-User Training Package Time Estimates* for Specific Data Collection Applications20
LESS THAN ONE DAY ONE TO THREE DAYS FIVE TO SEVEN DAYS
DataWinners iFormbuilder Magpi
doForms FrontlineSMS TechnoBrain
Mobenzi PoiMapper Freedom Fone
Nokia Data Gathering Esoko
Open Data Kit Cropster
Text to Change Freedom Fone
EpiCollect OpenXData
mKrishi
Source: Product Survey 2012.* If users are new to the technology, the amount of time needed to train may increase.
Finally, the level of complexity of the hardware selected (along
with expectations of data collectors) will determine training needs
and capacity building, which is often the most expensive—and
most important—part of a data collection effort. Enumerators and
self-reporters (crowd-sourcing) will need less training if they are
using basic java phones or their own phones. with more-complex
devices, additional training is required. The most time-intensive
training is usually needed for participants who are asked to perform
administrative or dashboard tasks, especially if they are unfamiliar
with the technology. Table 4.2 is a simplified estimate of the amount
of time it takes to train data collectors on application or device use.
Training needs will increase if someone new to the technology is
charged with managing the administrative portal. yet it is important
that training not thwart enthusiasm for digital tools; most local par-
ticipants learn and adopt these technologies with ease.
The survey used to gather company information in this study also
attempted to estimate costs for each application. The companies
surveyed were presented with a hypothetical situation. In its most
basic form, companies were asked what it would cost to collect
8,000–10,000 observations using 50 enumerators in Kenya. yet
due to a plethora of options, presenting detailed information on
responses has limited utility. In their aggregate form, packages that
include training, hardware, and dashboards are estimated to cost
20 These and a range of other tools are profiled in the Nethope Solutions Center database: http://cloudportal.nethope.org/supersearch/#q /keywords=&num=10&channel=products&orderby=relevance&sort= desc&category=37&&38&&27&inclusive_categories=yes&pagination =P0.
FIGURE 4.2: Platform Usage Based on Companies Surveyed, in Order of Frequency
ANDROID: ************** (14)
jAVA: *********** (11)
iOS: ****** (6, with others on their way in the future)
Blackberry: ***** (4)
windows: ***** (4)

16
I C T F O R DATA CO L L E C T I O N A N D M O N I TO R I N G & E VA LUAT I O N
C H A P T E R 4 — MA N y A P P L I C AT I O N S , MA N y O P P O R T U N I T I E S : K E y C H O I C E S F O R I C T TO CO L L E C T DATA I N R U R A L A R E A S
less than $10,000 for almost all providers surveyed. An important
lesson learned here—beyond the cumulative and generalized
estimate—is that there is a multiplicity of options and customized
solutions on the market even within companies that have well
established and widely used applications. This means that articulat-
ing needs, context, and goals are indispensable tasks before con-
tracting a provider. without such articulation, costs cannot and will
not be accurately assessed during bidding processes.
4.4 DASHBOARD: ANALYTICS, DATA MANAGEMENT, AND STAKEHOLDER ACCESS
The dashboard or portal, where collected data are stored and avail-
able for analysis, is a critical component to a data collection effort.
All applications host the data somewhere, and where they host
them—along with the data manipulation features offered, the plat-
form’s organization, and data output—affects the types of analysis,
sharing, and reporting available to users. Two fundamental options
are an off-the-shelf solution that might accompany the application
selected or a customized system. Open source solutions like MySQL
and PostgreSQL, as well as solutions created by a paid developer,
are good options—depending on factors like budgets and needs.
The first and probably most important consideration regarding the
dashboard is whether it is hosted on a stationary hard drive or in the
cloud. In the past, many applications were installed and hosted on
one computer. This made it difficult for multiple users to view the data.
Most applications now offer their services in the cloud or will soon do
so (FrontlineSMS, for example, is currently developing a cloud-based
server). Some providers leave the stationary or cloud option open for
administrators to decide. If selecting the cloud option, two important
questions are how many people can access the data and how they
will get that access. Some providers have restrictions on the number
of viewers (such as Cropster, which only allows four users). Different
applications also offer a variety of “usership” options: Poimapper, for
example, allows one admin user to create others and assign them
rights (for example, to create forms, manage data, and view data).21
Data output and management are also considerations. Different
applications can export data to a variety of analysis and visualization
21 http://www.poimapper.com.
software, and some dashboards have analytical software built in.
Exporting to xls, pdf, word, and csv are some of the most common
analysis output options. Applications can also export to visualization
software (if using GPS data) such as KML, Google Earth, Bing Map,
and ArcGIS online. How the data will be used after they are collected
should be considered before selecting an application. Table 4.3
shows the options for a selection of providers, demonstrating the
many similarities in their export capacities.22 For heavy analytical
work, applications that export to STATA or SPSS may save time by
removing the need to transfer data from multiple software. However,
transferring data from one software to another is not all that difficult
with solutions like StatTransfer.23 As such, it could be argued that
data formats compatible with many others, such as csv, are the
22 These and a range of other tools are profiled in the Nethope Cloud Portal database: http://cloudportal.nethope.org.
23 http://www.stattransfer.com.
TABLE 4.3: Data Output Capacity and Software Integration
PROVIDERTEXT OR
PDF XLS CSV SPSS STATA XML
Cropster * * * *
DataWinners *
doForms * * * *
EpiCollect * *
Esoko * * *
ESRI * * *
Freedom Fone *
FrontlineSMS * *
Grameen *
iFormBuilder * * * * *
Kimetrica * * * * *
Magpi * * *
mKrishi *
Mobenzi * * * *
Nokia Data Gathering
* * *
ODK * * *
OpenXData *
Poimapper * * * * *
TechnoBrain * * *
Text to Change * *
Source: Product Survey 2012.

17
A G R I C U LT U R E A N D E N V I R O N M E N TA L S E R V I C E S T E C H N I C A L A S S I S TA N C E PA P E R
C H A P T E R 4 — MA N y A P P L I C AT I O N S , MA N y O P P O R T U N I T I E S : K E y C H O I C E S F O R I C T TO CO L L E C T DATA I N R U R A L A R E A S
ideal formats to choose during application selection. Companies do
offer customized solutions and are sometimes willing to develop
a new tool or process (such as exporting to a different software) if
requested. Thus this area of functionality is in constant evolution.
Visualization and data representation can play a major role when
using data to argue for change, which makes the use of spatial data
relevant. There are a number of spatial tools to map data through
GPS. Spatial visualization software includes KML, ArcGIS, Google
Earth, and Bing. Table 4.4 shows the providers that integrate this
type of software into their application and dashboard directly. Some
applications, like Poimapper, can export to other visualization soft-
ware if licenses are purchased.
Dashboards also have a range of additional features. Providers offer
a variety of other reporting or analytical tools within the dashboard
itself. However, because most applications allow data export to rel-
evant software like Excel, some reporting features can be considered
more or less bonuses. The Datawinners dashboard provides the user
with basic calculations (sum, average, min, max) for quantitative data,24
FrontlineSMS offers chart views for polls, and Mobenzi integrates
chart-making for reports into their system.25 These features are not
as critical as other features, such as capacity to record spatial data or
record data offline, but they could save time for projects that require
24 https://www.datawinners.com.
25 http://www.mobenzi.com.
more-rapid analytical output (for monitoring during different project
phases). A common but important application function is “search.”
Searching or organizing data in the dashboard (or setting parameters
to do so) by date, contact, and survey question, among others, reduces
the manual data manipulating often needed for analytics.
Kimetrica is a special case, as it offers end-to-end project manage-
ment especially designed for M&E needs, which makes it a versatile
platform for generating standardized national, policy, or project-
level metrics.26 The system interfaces with Google Earth, and at the
same time users can overlay country administrative maps. The sys-
tem comes with administrative maps for every country in the world
down to administrative level 3. It also allows users to upload their
own administrative and EA maps. Kimetrica also includes a large
number of routine data entry and field enumeration management
functions that make it easy to monitor survey performance and
progress in near real time.
4.5 ADDITIONAL FEATURES
There are special features of applications that may save time and
be critical to certain M&E efforts. The first is whether an application
has signature or photo capacity. Recording signatures can be useful
for a variety of projects, but it is particularly useful in data collection
efforts that may require participants to confirm or acknowledge
their involvement or the release of their personal data. Photos can
be useful in smaller data collection efforts that are designed to
record case studies or personal anecdotes. They are also useful for
projects that require identification (for example, data collection for
subsidized fertilizer to selected farmers).
Put simply, smartphones have these features and java phones do
not. However, just because the device has the capacity does not
mean the application can logically store and organize the photos or
signatures. Twelve out of 20 providers surveyed have photo-taking
capacity, but only 4 out of the 20 have signature capacity. Most pro-
viders have plans to offer both services in the future.
Interactive-voice records (IVR) are also an important feature of
digitized services in the agriculture and forest sectors, but they are
26 http://www.kimetrica.org.
TABLE 4.4: Spatial Visualization Tools
PROVIDER KML BING ARCGIS GOOGLE
Nokia Data Gathering *
DoForms *
Kimetrica * * *
Magpi *
Techno Brain * *
Poimapper * * *
Mobenzi * *
iFormBuilder *
ODK *
EpiCollect * *
ESRI * * * *
Source: Product Survey 2012.Note: Cropster plans to integrate ArcGIS in the short-term.

18
I C T F O R DATA CO L L E C T I O N A N D M O N I TO R I N G & E VA LUAT I O N
C H A P T E R 4 — MA N y A P P L I C AT I O N S , MA N y O P P O R T U N I T I E S : K E y C H O I C E S F O R I C T TO CO L L E C T DATA I N R U R A L A R E A S
not as relevant to data collection efforts. The primary purpose of
including IVR in applications is to give illiterate users access to the
same information as people who can read text messages. Users can
call a specified number and select pre-recorded options to receive
information on important farm practices, for example. Though data
collection through IVR may not be feasible due to airtime costs and
difficulties with research methods in rural locations (for example,
selecting certain geographically located households based on a rep-
resentative sample size), disseminating the results of data collection
efforts through IVR could be a practical way to get analyses back to
local stakeholders.
Some of the best M&E programs collect client or beneficiary infor-
mation at the individual level, in aggregate forming a rich, detailed
database of work completed. Digital Green has gone a step farther
to connect geographical and user data through Farmerbook—a
visual geo-mapped database to provide a connection between end
clients, service providers, partner organizations, donors, and the
general public. (See box 4.4.)
The main page of Farmerbook features the leaderboards of the farmers, community intermediaries, and partner organizations. A different metric, called adoption rate, ranks community members, facilitators, and partners based on the percentage of practices they have adopted relative to the total number of extension videos they have viewed. A more composite metric, based on attendance rates, screening frequency, and adoptions, is used to grade the villages, depending on their level of activity and per-formance. This feature is meant to stimulate some healthy com-petition among service providers and communities to improve participation and adoption.
The timeline view on a village or individual allows users to see the integrated nature of the practices that farmers are watching and
how their questions, interests, and adoptions change over time and how that relates with other members in their community. Farmerbook images of farmers and service providers also con-nect with Digital Green’s Facebook game wonder Village, which brings Digital Green’s work with rural communities to a wider international village.
In addition to this user-centric view, the organization’s analytics dashboards (http://analytics.digitalgreen.org) share aggregate statistics and visualizations of these data along time, geographic, and partner-based dimensions and “Our Videos Library” (http://videos.digitalgreen.org) shows these data from a video-centric perspective to identify videos that are most or least viewed, adopted, and queried to improve content quality and relevance.
BOX 4.4: Digital Green’s Innovative M&E Data Reporting Model

19
A G R I C U LT U R E A N D E N V I R O N M E N TA L S E R V I C E S T E C H N I C A L A S S I S TA N C E PA P E R
C H A P T E R 4 — MA N y A P P L I C AT I O N S , MA N y O P P O R T U N I T I E S : K E y C H O I C E S F O R I C T TO CO L L E C T DATA I N R U R A L A R E A S
4.6 INTEROPERABILITY
Data exchange standards allow organizations to share data within
their own bodies and with external data experts and stakeholders.
Although it is not a specified feature of a given application, the
level of desired interoperability—or the capacity to easily transfer
data and outputs to various systems and dashboards—should be
considered, as it prevents convergence complications in the future.
Complications could, for example, be derived from an attempt to
aggregate data from similar surveys conducted in different regions.
without data exchange standards and formats, governments and
agencies cannot effectively share data or add to analysis across
departments. Surveys must be “reinvented” when applications use
specialized software that is non-transferable to other types. For large
development organizations, this is highly problematic and leads to
the same inefficiencies found in simple, paper-based data collec-
tion. Not only is maintaining and requiring the same data standards
critical to the sustainability of digitized processes, it also has sub-
stantial payoffs when tools can be used or built in from other proj-
ects. All new initiatives, and even ongoing ones, should consider
the interchangeable nature of their systems—and attempt to make
them increasingly open to sharing and transferability.
Formhub, for example, uses the industry standard open-source
application, Open Data Kit (ODK), which uses xls forms (Excel). Using
ODK Collect through formhub allows users to build surveys through
an Excel file, upload them onto formhub, and download them
onto enumerators’ phones, where data are then transferred to an
xls-compatible server.27 This solution takes some learning, is free,
and, importantly, maintains common standards throughout the
data collection process.
Due to the increasingly recognized importance of a total ecosystem
approach and interoperation, many providers are using the Software
as a Service model. These are services that require no additional
investment in infrastructure outside of purchasing the end-user
device. Even maintenance and technical support is included in fees.
In cases where in-house IT support is limited, these models can be
great solutions. It is important to note that although costs over the
lifetime of the SaaS tool usage may seem at first higher than the
27 http://formhub.org.
up-front cost of single-provision tools (for example, an application
or a database), the latter often excludes maintenance and technical
support. However, customized solutions do also require continued
IT support after initial provisioning, and as these services are often
separately sourced at a later stage, the overall cost may also be
quite a bit different. Practitioners should therefore carefully weigh
the benefits of a bundled off-the-shelf approach against a more
customized solution.
One final note: not all projects necessitate interoperability. Many
organizations that have pioneered ICT in their projects, such as
Catholic Relief Services,28 have tried many options and are now
increasingly converging on a centralized model in order to have
comparable, standardized data across the organization.
4.7 TECHNICAL SUPPORT
Technical support is crucial to new ICT4D projects, and it can vary
widely among different service providers. Some companies include
tech support in their fees while others do not. Open-source appli-
cations do not normally maintain a strong technical support team,
and users are often left to their own devices to solve problems.
Community forums are one way users have answered questions
and resolved issues. However, forums do not always lead to timely
or sustainable solutions. IT teams that can provide regular, expert
solutions to technical problems like coding error are critical to proj-
ects that use free applications. It is important to realize that using
open-source applications does not automatically mean there is no
cost involved throughout the full life cycle of deployment of such
application software. Open Data Kit is a good example. Underlying
software is offered free to use, but the operational model may
require support from either service providers or an in-house ICT
team. This makes up the business model for the service providers.
4.8 LANGUAGE CAPABILITY, SECURITY, PRIVACY, AND DATA VALIDATION
As development specialists begin using technology in their
projects, there are always a variety of concerns raised, one of which
is language. Oftentimes, common languages like English, Spanish,
28 http://www.catholicrelief.org.

20
I C T F O R DATA CO L L E C T I O N A N D M O N I TO R I N G & E VA LUAT I O N
C H A P T E R 4 — MA N y A P P L I C AT I O N S , MA N y O P P O R T U N I T I E S : K E y C H O I C E S F O R I C T TO CO L L E C T DATA I N R U R A L A R E A S
French, and Arabic are not useful in initiatives in rural spaces.
Technology needs to support local and indigenous languages; even
if local people are not directly reading or responding to messages
(which is sometimes the case due to illiteracy), enumerators who
collect the data normally speak local languages. Fortunately, many
applications can master most languages. iOS products support 34
languages, and many applications can spend a few days to cus-
tomize systems to support specific languages. The most common
restrictions to language capacity is the platform, where data are
hosted along with the data visualization and stakeholders’ access
portal or dashboard.
Two additional common concerns are viruses and data security.
while both concerns are valid, the virus-related threats appear
limited, according to service providers. None of the companies
queried report that they have had problems with viruses. Viruses are
more common in situations when computers or laptops are con-
nected to the Internet. If users download items from the Internet or
their e-mail, a virus can be included. These threats should be consid-
ered and prevented through the use of firewalls and other means if
using these types of tools.
Data security is another problem, one that most service providers
have overcome by providing hosted services. If data are hosted at a
client’s own data center or sometimes even stand-alone servers, the
security of the whole hardware may become a concern. Encryption,
login passwords, and backups are all used to protect sensitive
information. However, in some circumstances the computer systems
may be compromised and data can be unlawfully decrypted with
adequate computing resources in a certain amount of time. Use of
non-common passwords at all levels is usually a good measure to
help make this type of attack less successful. Thus the information is
still only as safe as the hardware and the physical environment it is
stored in. Another aspect related to data security is data safety, the
overall end-to-end system reliance against data becoming acciden-
tally or deliberately destroyed. This could happen simply because
of human error or because of systems or hardware failure or even
disasters such as fire or floods. To deal with challenges related to
data security and safety, it is important that proper backup capabili-
ties and, if necessary, disaster recovery strategies and procedures are
in place and in active use. Service providers offering hosted services
usually have taken measures to offer these functions as part of their
service.
SMS is a feature most prone to security challenges. Technically the
SMS security is often compromised not at the mobile network level
that is used to transport the SMS messages, but at the end-user
device usage level. For instance, sent messages are usually stored in
the device and are accessible to anyone gaining access to it unless
the device usage itself is controlled by security measures such as
PIN codes. FrontlineSMS, a service provider that maintains that the
best protection comes from user care, recently published a guid-
ance note on data security.29
Privacy in the context of data collection can be seen from at least
two perspectives: privacy of the collector or enumerator and privacy
of the data collected. In the former, the main concerns are protect-
ing the identity of the party collecting the data, be it crowd-sourced
or a frontline worker. For instance, when data gathering is used to
provide field information about activities such as illegal logging or
unlawful land use, it must be ensured that the information cannot
freely be linked back to the person reporting it. In case of privacy
of the data, the collected data may contain sensitive information
such as personal details. Therefore proper mechanisms must be put
in place to limit or possibly prohibit access to identifiable pieces of
information in the collected data set.
Data validation—making sure that errors are caught and cor-
rected—is another issue that practitioners are concerned about.
However, service providers have discovered and used methods
that control potential problems with errors. For example, many
applications have skip conditions (for example, if a respondent is
male, and there are questions specific to females, the survey will
“skip” over the female-related questions), automatic date recordings,
specified ranges for numerical questions, and constraint validation
(which does not permit the user to go to the next question if blank
values exist). Applications also use built-in mechanisms to prevent
numbers or letters from entering certain spaces (by specifying the
29 http://www.frontlinesms.com/user-resources/user-guide-data-integrity.

21
A G R I C U LT U R E A N D E N V I R O N M E N TA L S E R V I C E S T E C H N I C A L A S S I S TA N C E PA P E R
C H A P T E R 4 — MA N y A P P L I C AT I O N S , MA N y O P P O R T U N I T I E S : K E y C H O I C E S F O R I C T TO CO L L E C T DATA I N R U R A L A R E A S
“type” of information to be entered), multivariate validation (which
prohibits implausible combinations of data), and the prevention of
double entries. Most applications will not allow users to input or
send data that falls outside of the specified criteria. Not all applica-
tions offer the same range of data validation tools. These are impor-
tant questions to ask providers, particularly when data are complex
or sensitive.
ArcGIS also provides tools to help validate user data. Users can apply
topology-based validation to make sure that features conform to
pre-determined spatial restrictions. Users can also define coded val-
ues, domains, or subtypes to restrict attribute data to specific choices,
helping you maintain data accuracy. Additionally, you can create
and use feature templates to streamline data creation by defining
required attribute fields, default attribute data, and default symbols.


23
A G R I C U LT U R E A N D E N V I R O N M E N TA L S E R V I C E S T E C H N I C A L A S S I S TA N C E PA P E R
C H A P T E R 5 — S E R V I C E D E S I G N
Chapter 5: SERVICE DESIGN
data and analytics back to relevant stakeholders. Communication
experts are useful in tasks that involve the provision of feedback.
5.2 DRIVING ADOPTION
As in any landscape project or program aimed at improving liveli-
hoods, long-term adoption by users and by those urging uptake of
new technologies (for example, community extension workers) is
both critical and often challenging. The use of ICT does not auto-
matically overcome these inherent challenges. However, there are
solutions to adoption barriers. Many of them that are centered on
the structure of incentives are similar to those used in projects that
do not use ICT. These strategies to increase sustainable adoption
most closely apply to frontline workers who implement the survey,
but their application can also be extended to other users, such as
those involved in crowd-sourcing efforts.
5.2.1 Adding Value to the End User
In projects where extension officers and community professionals
carry out trainings, mobile-based data collection applications can
help isolated service providers to structure their work and to obtain
fact-based feedback regarding their performance. By giving them
targets and making them feel part of a larger effort with achievable
benchmarks, features that send analysis back to service providers
could provide a better context and connectedness, especially in
rural projects. This value can also support and sustain continuous
use of data entry systems. Moreover, training that focuses on “why it
matters” and how the data are used is crucial to motivate field staff
to strive for the most accurate results.
5.2.2 Properly Characterizing Users and Clients in Projects
Many agricultural applications deal directly with farmers and other
end-users of information and services. In forestry—and in forest
It is widely acknowledged that technology is not a stand-alone
solution in most development settings. The most successful appli-
cation approaches develop and design integrated systems—mak-
ing the mobile application, hardware, backend software, dashboard,
and sharing mechanism, as well as the collection methodology, and
field worker incentives, all key aspects of the overarching data initia-
tive. In addition to the technology infrastructure, a strong service
design is needed to ensure that the technology will be adopted
widely, add maximum value, and be sustainable beyond the initial
stages. This section addresses three of the most important com-
ponents in effective service design: thoughtful analysis, ensuring
adoption, and managing risks. just like in the design and imple-
mentation of development programs that do not use ICT, these
components—the human components—remain critical.
5.1 WHAT ICT CANNOT DO: THOUGHTFUL ANALYSIS
Technology is not a stand-alone solution for M&E. Even after select-
ing, building, and deploying the technology, successful projects
require human capital to translate the data into meaningful infer-
ences and to decipher development implications. Statisticians and
methodologists, who are trained to accurately derive conclusions
about causality and outcomes, cannot be replaced by technology.
Moreover, it is dangerous for organizations working in this space to
believe that technology can be used for deeper analysis of the data.
Local M&E expertise—or capacity to correctly obtain conclusions from
data—may be difficult to find and retain. Practitioners should there-
fore include the hire of analysts within their project plans and budget.
Skilled analysts are not just required when data have been collected.
As in projects without ICT, they should also be included during survey
design, sampling methodologies, and other advanced evaluation
processes. Similar thinking should accompany processes to report

24
I C T F O R DATA CO L L E C T I O N A N D M O N I TO R I N G & E VA LUAT I O N
C H A P T E R 5 — S E R V I C E D E S I G N
governance and resource assessments in particular—the situation
is often different. Often forest sector development interventions
aim at influencing the performance of the forest institutions and
agencies as well as the forest users directly. Therefore public sector
information management is the focus, and forest users are indirect
clients of development investments. Consequently the data collec-
tion methods and incentives are different. In essence, action often
happens at the “wholesale” rather than “retail” level.
This has two specific implications in forest sector data management
and M&E: First, it is essential that data and information flow in two
directions; information dissemination on forest resources and agen-
cies activities is just as important as information collection from
the public. Second, in public administration and service delivery,
the assessment of sustainability differs from private transactions.
Assessing sustainability from the perspective of a private transac-
tion and financial revenue capture is not enough. Public services
cannot be assumed to be entirely self-financing.
One final comment on characterizing the users and clients involved
pertains to participation. Participatory design—that is, piloting, and
user-testing software with actual users—creates a product more
likely to be adopted by taking into account uniquely local con-
straints and perspectives.
5.2.3 Rewarding Excellence
Projects have various incentive structures for frontline workers,
hired exclusively as enumerators to collect survey data or as service
providers who also collect data on program participants. These
structures may include a lump-sum payment or a fee per day of
data submitted. Some projects, such as the Sustainable Agriculture
project of the Society for Elimination of Rural Poverty (SERP) take a
different approach. SERP’s project provides a base salary plus a sub-
stantial performance bonus (30–50 percent of the monthly salary)
for sending in complete, accurate data sets 90–95 percent of the
time. This strategy is highly effective in aligning incentives between
the organization and the frontline staff in improving data quality
and building capacity.
5.2.4 Providing Non-financial Incentives
Training and improving employability for future opportunities by
obtaining experience is often a big incentive, especially for younger
enumerators. (See box 5.1.) Targeting women and minorities in the
selection process also provides opportunities for those traditionally
excluded from gainful employment to gain marketable skills and
experience. For community professionals, incentives such as vis-
ibility and prestige, as well as the motivation to work on hardwired
challenges in their communities, can be a major driver, especially on
community-driven development projects.
5.3 MANAGING RISKS
A final component of service design is the management of risks.
Mobile-based data collection has a great number of benefits that
makes information transfer automated and efficient, as well as rich
with the use of location data and photo capabilities. But data collec-
tion technology is only as good as the information that is collected
and the abilities of those who collect it. Therefore, accounting for
risks is imperative during both service design and implementation
stages.
5.3.1 Misplaced Focus of Training Programs
Even paper-based data collection requires rigorous training of
enumerators in eliciting information from target individuals and
households. with a mobile interface that could potentially distract
from the data collection process, this training becomes even more
essential. As projects turn to mobile and digital technology, training
must focus on not only the technology itself but, more importantly,
on helping enumerators understand the context of the project and
how the information they collect will be used in order to enable
them to focus on accurate results.
5.3.2 Context Matters
In switching from manual to mobile-based data collection, it
becomes easier to coordinate and track field staff—such as exten-
sion workers. when these data begin to be used to judge perfor-
mance of field staff without offering added value in the front end,
location capabilities can remove autonomy and the project can
subsequently suffer from lack of adoption.
One example of this is when mobile applications capture informa-
tion regarding attendance at agricultural trainings. The attendance
could also be a factor that the frontline worker does not necessarily

25
A G R I C U LT U R E A N D E N V I R O N M E N TA L S E R V I C E S T E C H N I C A L A S S I S TA N C E PA P E R
C H A P T E R 5 — S E R V I C E D E S I G N
control. with real-time feedback, if this information were to judge
the service provider’s performance in a vacuum without taking
into account the relevance and usefulness of the program and the
local context, it could become a disincentive for workers to con-
tinue to send in information. The section on improving adoption
addresses how adding value that empowers frontline workers with
feedback and information, coupled with incentives for improving
performance, can increase adoption of mobile-based interventions,
especially at scale.
5.3.3 Efficient Cheating
In a different setting, where manual systems had previously required
signatures or thumbprints of participants and where locations are
not mapped to field sites, suboptimal usage of the capabilities of
mobile applications could make cheating more efficient and could
lower the ethical barrier for reporting fictional entries. Programs
are especially vulnerable to poor data of this kind if incentives for
adoption are misaligned. Requiring geotagged or photographic evi-
dence that is checked randomly could help with these problems to
some extent, but the problem can ultimately only be addressed by
ensuring that the application adds value to the end user, provides
resources necessary to compensate performance, and enables
rather than undercuts the autonomy of service providers. Another
method to improve accurate reporting is cross-validation methods
that double-check data for red flags and ensure system-wide qual-
ity. For instance, attendance at trainings that does not correlate with
adoption rates might be an indication of false reporting. Peculiar
data should automatically be flagged and brought to the attention
of project coordinators.
On the other hand, mobile applications can also provide additional
controls not available in traditional processes, such as automatic
location recording, time stamps, and timing of form filling pro-
cess even to the level of time taken for an individual field to be
completed. Later analysis of such data (for instance, assessing the
distribution of time taken per field over larger number of forms)
may provide additional information to help identify occurrences of
potential cheating. Tying incentive mechanisms to correct submis-
sions of data can enhance the quality of the data collected.
Aggregating buyers and producers of eco-friendly organic produce, the Association of National Ecological Producers (ANPE) in Peru has integrated youth involvement and social media tools to promote decentralized coordination and local ownership and as an added marketing platform to create effective demand for regional ecoferias.
with the financial and advisory support of the International Institute for Communication and Development, the orga-nization has embarked on a three-year pilot that currently works with 45 young facilitators and over 500 organic farmers selected from local communities to collect data from farmers regarding supply and in turn facilitate marketing and busi-ness decisions.
As the project covers only costs of traveling to the ecoferias, much of the incentive for participation is non-financial: the opportunity to learn and gain experience, a chance to expand their networks and obtain exposure to their peers and to external organizations and farmers, and recognition through programs on rural radio and through their commitment and involvement, which gives them a more active role in their associations and families. The
young facilitators, who are also organic growers, get the chance to promote their own products in the ecoferias.
In line with this strategy, the project has leveraged growing rural access to the Internet in order to use social media tools such as Facebook and you Tube in two main ways: to provide an oppor-tunity for exchange of ideas and information among youth facili-tators and opportunities for leadership and recognition and to position the “Fruits of the Earth” brand to attract new customers and improve consumer awareness of eco-conscious consumption.
The project is currently in its third year and has begun scaling up to three more districts in Peru. ANPE is striving to make the ICT initiative and youth involvement sustainable through partner-ships with both the Peruvian restaurant industry and exporters of organic products.
Additional Resources:ANPE Peru http://www.anpeperu.org/Frutos de la Tierra – Ancash https://www.facebook.com /Frutosdela TierraAncashFrutos de la Tierra – Caramoja https://www.facebook.com /FrutosDeLa TierraCajamarca
BOX 5.1: Boosting Non-financial Incentives and Decentralized Collaboration through Social Media

26
I C T F O R DATA CO L L E C T I O N A N D M O N I TO R I N G & E VA LUAT I O N
C H A P T E R 5 — S E R V I C E D E S I G N
It is important to ensure that when ICT is considered in place of a
traditional pen-and-paper system, the control mechanisms need to be
put in place equal to or better than those of traditional M&E systems. If
signatures were required according to traditional processes, geotagged
data or digital signatures would need to be required in an ICT-based
approach as well. If cheating was of concern, tools that provide relevant
detection mechanisms should be used. Similarly, the acceptance of
data may require a gatekeeper role with authentication (signatures),
and so on. All such aspects would need to be designed into the model
properly when considering use of ICT in place of traditional M&E tools.

27
A G R I C U LT U R E A N D E N V I R O N M E N TA L S E R V I C E S T E C H N I C A L A S S I S TA N C E PA P E R
C H A P T E R 6 — C A S E S T U D I E S
Chapter 6: CASE STUDIES
The following case studies capture the experiences of
organizations—from large to small—that have developed and used
technology innovatively for data collection and M&E. They have
been selected to highlight a variety of off-the-shelf, open source,
and customized software solutions, as well as innovative service
design that highlights the best practices in implementing ICT in
agriculture and forestry. The case studies also highlight the diversity
in scale and the challenges faced by organizations in achieving sus-
tainability beyond the project period.
6.1 SUCCESSFUL RELIANCE ON TRIED AND TRUE TECHNOLOGY—THE INTERNATIONAL SMALL GROUP AND TREE PLANTING PROGRAM (TIST) IN KENYA30
Properties of Featured Technology: Palm, PDA, external GPS,
custom installation, frontline workers, proprietary, in-House, online,
two-way sync (see also annex 4).
Context
For more than a decade, Ben Henneke has been helping people
in Kenya plant trees to support both the environment and farm-
ers’ incomes. His organization—The International Small Group and
Tree Planting Program (TIST)—developed technology specifically
designed to verify the progress made in planting and tree growth
in TIST project areas. Henneke knows that tree planting can provide
economic as well as environmental benefits only when measured
correctly and that his organization’s work can make a considerable
difference to the livelihoods of small farmers.
As in many countries, Kenya has experienced rapid deforestation
over the past several decades. The Kenya Forestry working Group
30 http://www.tist.org.
attributes deforestation to the energy, tourism, agriculture, and tea
industries. The country’s forest problems were brought to light in
2004 when wangari Maathai, founder of the Green Belt Movement,
won the Nobel Peace Prize largely in recognition of her work sup-
porting peace and stability through tree planting.
TIST focuses on teaching farmers tree planting techniques that, by
design, propagate from person to person, and it uses well-worn
data collection technology to measure and monitor the progress
of the incremental growth, root mass, and health of the trees these
farmers plant.
Project
In addition to training on irrigation and beekeeping, TIST trainings
cover planting and caring for indigenous tree species as well as fruit
and nut trees that could help diversify residents’ income. Henneke
said that the TIST technical approach is entirely based on organiz-
ing local groups whose communal interactions help ideas travel
by word of mouth. The demonstrably useful techniques, shared by
one neighbor to the next, have successfully led to the planting of a
diverse range of economically and environmentally important trees.
As an example, in the Meru District TIST has predominantly sup-
ported the planting of eucalyptus, grevillia, cypress, mango, acacia,
avocado, mukwego, cordia africana, macadamia, and orange trees.
According to TIST, so far approximately 4.5 million of these trees
have been planted and 1.7 million seedlings have been raised.
The community reforestation activities provide residents the benefits
of generating income from the carbon credits earned from the trees
they have planted. Approximately 100 TIST field monitors (called
“quantifiers”) follow the UN Framework Convention on Climate
Change standards for Monitoring Afforestation/Reforestation by
Small Groups or Individuals to measure the carbon sequestered

28
I C T F O R DATA CO L L E C T I O N A N D M O N I TO R I N G & E VA LUAT I O N
C H A P T E R 6 — C A S E S T U D I E S
In Kenya alone TIST is tracking 39,000 individual tree groves. The
organization states “present models show that the trees planted …
should achieve between 500,000 tons and 3,000,000 tons of CO2
sequestration.”
In order to meet its data collection demands, TIST developed its
own phone-based forms in C++ as well as software for receiving
and sorting data. Information sent in from the Palm devices is auto-
matically sorted into searchable databases. Henneke said that over
the years TIST has mined these data very successfully to identify
trends and needs for further interventions.
Perhaps surprisingly, power rather than software has presented
a more significant challenge because quantifiers are often in the
field away from mains electricity for days at a time. More than once
TIST has demonstrated an ability to “hack” power systems—using
the old, positive meaning of the word. Some computer equip-
ment that TIST formerly used would lose all its data when it lost
power. To keep the Palm devices working longer in the field, TIST
quantifiers use “pigtails,” which are four rechargeable AA batteries
wired into one circuit, then taped together and plugged into the
devices.
Solution
The beauty of TIST’s customized, even if dated system, is that it has
continued to work reliably well beyond the expected expiration
date. The mobile data collection devices have kept functioning
for several years, and the custom software has required minimal
updates. Henneke said they have studied other, open-source data
collection platforms, particularly those that operate on the Android
operating system. yet they found the alternatives lacking in the spe-
cific functionalities TIST needs in the field.
Although they are not using enterprise-level data collection tools,
they present a counter-narrative to free and open-source pro-
tagonists: If we build in only the functionalities we need, to our
specifications, we save time and money over the long run. Typically,
customized, proprietary software is associated with high cost and
unsustainability. Open-source tools, on the other hand, are extolled
for the ability of a community of volunteer users to refine and
advance a tool that anyone can use.
by the farmers’ trees. Carbon values are verified according to the
standards of both the Verified Carbon Standard (VCS) and the Clean
Development Mechanism (CDM), allowing the Kenyan farmers to
receive annual payments for the certified emission reduction credits
they have earned. TIST, which operates similar programs in Uganda,
Tanzania, and India, expects its programs cumulatively to sequester
5 million tons of carbon by 2020.
Challenges
TIST faces the challenge of making its work relevant to a large
number of small farmers who may have only planted a limited
number of trees. Holdings of “0.04 hectares are the reason we set out
to do this in the first place,” Henneke explained. Still, their numbers
are massive. There are approximately 45,000 individual plots that are
owned or managed by TIST members in Meru and Nanyuki near Mt.
Kenya, the two areas where TIST operates.
The extensive field monitoring and amount of data involved,
together with the stakes involved for subsistence farmers, have
raised the incentive for TIST to efficiently and accurately collect data.
The supplemental earnings from accurately tallied carbon credits
provide the farmers with a cushion against the vagaries of weather
or price fluctuation.
In order to map the location of specific trees and specific tree spe-
cies, and to capture tree volumes for carbon credits, TIST has long
used stand-alone GPS devices in combination with older Palm
Centro 680 and 650 and the Zire 71 mobile devices for data collec-
tion. The Palms are no longer for sale via the usual channels (TIST
finds them on secondary markets at a discount), but they continue
to function well and with low operating costs. “we can outfit some-
one for 150 bucks,” Henneke explained.
The data on trees and tree groves are collected in person using
the Palm devices, with trained enumerators filling out set forms
with details of tree type, health, and measurements. Diameter is
measured at breast height (1.3 meters/4.27 feet). The quantifiers use
formulae to calculate the biomass of large stands of trees. Three-
quarters of the enumerators are men, most who come from the
provinces where TIST works. They are trained repeatedly, and their
field calculations are audited.

29
A G R I C U LT U R E A N D E N V I R O N M E N TA L S E R V I C E S T E C H N I C A L A S S I S TA N C E PA P E R
C H A P T E R 6 — C A S E S T U D I E S
6.2 FAO’S OPEN FORIS INITIATIVE—INTEROPERABLE, MODULAR MONITORING, AND EVALUATION TOOLS FOR FORESTRY31
Properties of Featured Technology: Android, smartphone, GPS,
external GPS, frontline workers, open source, online, offline, two-way
sync (see also annex 4).
Context
Inspired by the idea of harnessing ICTs to dramatically enhance
forest management globally, in 2013 the Food and Agriculture
Organization (FAO) is concluding the first phase of its Open Foris
Initiative, an effort to empower national and subnational forest
agencies to collect, process, analyze, and share forest resource and
related socioeconomic and governance data.
According to FAO, 80 percent of countries face difficulties acquiring
data and reporting on the state of their own forests due to a lack of
organizational capacity, particularly with ICT tools. These countries
are particularly vulnerable to illegal logging, environmental degra-
dation, and threats to wildlife. To address this issue, FAO has com-
mitted to supporting 30 countries, and Open Foris tools are already
being used in Ecuador, Indonesia, Paraguay, Peru, Tanzania, Vietnam,
and Zambia. Soon they will start working with forest management
bodies in Bhutan, Mongolia, and Papua New Guinea.
Vietnam’s long history of comparatively sophisticated nationwide
forest management and technically capable personnel has made
it particularly suitable for Open Foris. Vietnam has maintained a
nationwide forest management system since 1990, when it first
collected satellite imagery. A National Forest Inventory is mandated
by law every five years, and each cycle has included a complete
re-taking of high-resolution satellite imagery of the country’s for-
est cover—currently 323,000 square kilometers, or 39 percent of
the country’s total size. This forest cover is divided into three clas-
sifications: protection, which allows for limited harvesting that does
not impair any major forest asset such as a river; production, which
includes state forest enterprises, the country’s 44 land concessions,
and private plantations; and special use, which includes national
parks, nature reserves, and species and habitat conservation areas.
31 http://www.openforis.org/OFwiki/index.php/Main_Page.
yet even paying for a staff person who would be a part of a particular
open-source community for the sake of TIST exceeded the long-
term sustainability plans of TIST. Rather than demonstrating the
most modern technological gadgets work in the field of forestry,
TIST demonstrates how forest projects can be successful when they
are “scoped” according to local financial capability realities rather
than built upon large but temporary international organization
budgets. TIST eschews what Henneke considers to be typical devel-
opment project expenditures, emphasizing project spending levels
that will be sustainable after his project funds end.
Eventually the organization developed its own site that was opti-
mized for mobile phone screens, allowing quantifiers to query the
database from the field. As of summer 2012, TIST’s custom platform
began providing information on tree grove names and location
in relation to a quantifier’s physical location. This information has
proved especially interesting to the farmers with whom the quanti-
fiers interact.
TIST uses the data primarily for two purposes, both of which are
related to carbon credits. First, the organization wants to use the
aggregate numbers to demonstrate and promote the cumulative
effect of its tree planting work. Second, TIST wants to help individual
farmers receive remuneration from global carbon credit schemes,
no matter how few trees they have planted. For both aims, TIST
adheres to VCS and CDM.
yet as their devices wear out, TIST faces an inevitable challenge
of updating the hardware and software of its operations. Ben
Henneke said that TIST is now changing its data collection forms
often enough that they have initiated a migration to HTML5. This
will eventually mean updating devices, re-training quantifiers, and
heavily modifying their database platform.
Henneke downplays his organization’s role, emphasizing that
“the trees do all the work.” And rather than looking to buy the lat-
est devices, he continues to find that developing the capacity of
farmers—“human technology,” as he calls it—is the best possible
investment TIST could make.
Source:Ben Henneke, Director, The International Small Group and Tree Planting
Program, interview on 8 February 2013.
30
I C T F O R DATA CO L L E C T I O N A N D M O N I TO R I N G & E VA LUAT I O N
C H A P T E R 6 — C A S E S T U D I E S
According to Dr. Pham Manh Cuong, Deputy Director of the
Department of Science, Technology and International Cooperation
at VN Forest, a huge amount of data are generated by the more than
11,000 forest rangers in Vietnam, almost all of whom have mobile
phones and near 100 percent nationwide signal coverage, from for-
est protection stations outfitted with e-mail, fax, and at least one
GPS device, and from the e-mail capability of more than 600 district
offices and nine Vietnam Forest Industry and Planning Institute
(FAO’s partner in Vietnam) sub-centers throughout the country.
Information from all of these locations is sent to Hanoi via e-mail or
fax on a regular basis. All of this makes for a large amount of data
that must be sorted and made useful for national-level forest man-
agers as well as policy makers.
Dr. Pham believes the system’s large amount of information flow
requires carefully calibrated allocation of resources for data man-
agement and analysis activities. “we need to define what level of
information is necessary,” he said, explaining that the type of and
amount of data shared with VN Forest in Hanoi must be “cost-effec-
tive” and must involve quality control of field reporting.
Project
“It is our mission to enable countries to work with their own data to
produce information essential for decision making and reporting,”
said FAO’s Gino Miceli, one of the founders of the Initiative, explain-
ing that his team simply wants to improve the management of
national forest agency data so that the countries can get knowledge
and information from the data. Open Foris tools, Miceli explained,
aim to support all phases of the inventory process, from inventory
design and data collection to calculation and production of reports
and maps. Training and support is provided by FAO and partners to
ensure that national staff are able to perform these essential tasks
with little or no outside support.
The current Open Foris software components include the following,
which FAO has deliberately kept as open source in order to allow for
modifications and improvements by ICT and forest experts worldwide:
� Open Foris Collect allows you to collect site-specific data on
paper or with portable data recorders.
� Open Foris Calc can import the data and calculate volume,
biomass, and carbon levels and can be used for mapping.
� Open Foris Geospatial Toolkit allows GIS/RS experts to
prepare cloud-free field maps, and land use maps and to
perform stratification and other tasks.
FAO is also working on a mobile data collection platform for the
Android operating system in partnership with the Arbonaut com-
pany. The platform would enable the collection of tree and forest
data in the field that could be easily transferred into other Open
Foris programs for analysis and mapping.
FAO has been developing a mobile version of Open Foris Collect
for portable field data recorders. Miceli said FAO considered exist-
ing mobile data collection platforms but found they were not
flexible enough for the much more complex and varied purposes
of na tional-level forest inventory. They wanted users to have more
control of the forms and data structures. “we’re making it so easy for
the user to set up Collect that they don’t even realize that they’re
designing a relational database,” he explained.
The new Collect user interface will take a forms approach, but
the back end will have all of the metadata, invisible to the person
inputting the data. The metadata allows for greater integration
across Open Foris apps and with other systems.
FAO envisions three classes of Open Foris Calc users: people who
analyze and query data—such as a ministry official or whoever
needs actual result data; forest scientists who can create new calcu-
lation models (for example, a new height model by which foresters
could calculate a tree’s height from a position on the ground); and
people engaged in setting up the system and executing country-
specific computations.
Solution
Open Foris tools are built precisely to provide efficiency and
accuracy through flexibility and comparability, which are attri-
butes the FAO hopes VN Forest will make full use of in Vietnam.
Open Foris Collect can be configured by national staff to per-
form flexible data checking. This is accomplished by configur-
ing the platform to compare different sets or types of data. It
also provides a well-defined workflow, to help users manage
and perform data entry and data cleansing. And after data are
entered and cleaned, they are locked and may be exported to
various formats (csv and xml).

31
A G R I C U LT U R E A N D E N V I R O N M E N TA L S E R V I C E S T E C H N I C A L A S S I S TA N C E PA P E R
C H A P T E R 6 — C A S E S T U D I E S
Open Foris tools aim to be modular and flexible, allowing each tool
to be configured and customized to country needs. This has been
necessary because their systems and data needs differ greatly.
Despite the customization or data format, however, all deployments
seek to exploit the clear potential of visualized information for stron-
ger monitoring and evaluation work. Forest data that are geo-coded
can be included as one of multiple layers of data in any GIS-like
mapping program. Layering different types of data on a map can
allow the identification of facts that would otherwise likely have
been missed if the data remained in spreadsheet form. The Open
Foris suite supports biophysical, governance, and socioeconomic
data, allowing for layering that provides important insights into the
socioeconomic ramifications of national forest policies.
New tools such as those offered by Open Foris introduce new
efficiencies for national forest management and analysis. yet they
also introduce new opportunities to provide useful information to
the public—information that could help the media cover the govern-
ment’s management of a country’s forest, assist conservation efforts,
and provide a way for independent scientists to conduct research.
On the other hand, while Open Foris tools give forest institutions the
means to improve data collection and analysis, their use requires a
significant commitment of human and budgetary resources. Field
data collection itself can be quite costly due to the amount of staff
hours required. These challenges highlight a potential need for
technical assistance for forest agencies—not with the technology
itself, but with the development of plans and processes for effec-
tively using that technology.
Major Takeaways
Any government planning to eventually open its forest data to the
public saves time and resources by choosing platforms, data for-
mats, and systems that are best able to facilitate internal use and
transparent external access. Open Foris tools allow for a smooth
transition once a country like Vietnam decides to adopt an open
data policy. Specifically, Open Foris Calc allows governments to
release subsets of data in a controlled way.
Despite the benefits of open data, making the entirety of a country’s
forest information public involves several different types of vulner-
abilities. If it is revealed that a particular area has less monitoring, it
may become a target for illegal logging. Similarly, if inventory data
reveal the location of high-value trees, it could make them targets
for illicit harvesting.
Acknowledging the sensitivity of locational data, FAO has designed
Open Foris with security in mind. Not only does it include certain
permission levels for various management responsibilities, Open
Foris apps have the capability of protecting specific forest plot loca-
tion information while still releasing enough information to allow
for statistically significant research. Researchers can still analyze for-
est data without creating opportunities for outsiders to exploit the
data to the detriment of the forests.
Sources:Gino Miceli, Forestry Information Systems Specialist, FAO.
Manh Cuong Pham, VN Forest, Vietnam.
6.3 THE WAY AHEAD—THE EFFECTIVE USE OF SATELLITE IMAGERY AND OBJECT-BASED IMAGE ANALYSIS SOFTWARE IN LAOS32
Properties of Featured Technology: Custom installation, GIS,
eCognition, automated, license fee, service provider (see also
annex 4).
Context
From multi-million-dollar Lidar data acquisition to GSM-enabled
remote sensors to portable bar code scanners, there are many
new costly devices that promise more-efficient and accurate
forest management processes. Many of these tools rely upon
the details and precision of high-resolution satellite imagery that
itself requires a new set of options and choices for effective use.
This ever-increasing diversity of choices makes it more difficult for
forest agencies to conduct cost-benefit analyses on potential tool
investments.
Smartphones and other mobile devices are having increas-
ingly diverse features previously found in only dedicated high-end
devices. The convergence of technologies has led to the gradual
replacement of low-end GPS devices with smartphones with
appropriate apps in recreational and non-commercial navigation
markets. In professional forest management and law enforcement,
32 http://www.jica.go.jp/project/english/laos/006.

32
I C T F O R DATA CO L L E C T I O N A N D M O N I TO R I N G & E VA LUAT I O N
C H A P T E R 6 — C A S E S T U D I E S
most of the technology applied is rugged professional-grade.
However, these are often made available by donor-funded projects.
Once usually budget-constrained agencies start procuring devices
with their resources, it is possible that consumer market-oriented
smartphones and relevant apps will gain more attraction as the
budget-friendly second-best option.
In some situations an agency’s information needs are so clear and
the potential tools are so much the right fit that it becomes easier
to set priorities for the resources that are available. One example
of this is the Forest Inventory and Planning Division (FIPD) in Laos,
which has found high-resolution satellite imagery33 and object-
based image analysis software very useful in its work monitoring
illegal logging.
Laos is a country of 230,800 square kilometers that has long suf-
fered from the scourge of trees unlawfully being cut and taken from
its forests. According to the International Union for Conservation
of Nature (IUCN), the forest cover has shrunk to 35 percent of the
country’s area from a figure of 71 percent in 1940. IUCN attributes
part of this to illegal logging.
Challenge
Illegal logging in Laos, where the lack of road infrastructure and dif-
ficult terrain make it logistically difficult to monitor forests, mainly
centers on 10–15 high-value woods such as multiple varieties of
rosewood. These can fetch $1,500 per cubic meter before export
and are sold for up to $5,000 per cubic meter online. The illegally
harvested wood is mostly cut into rough timber and exported to
Vietnam, Thailand, or China for processing into furniture that is then
exported to markets in China, Russia, North America, and Europe.
Often the loggers aim to remove only the trees of certain species
and sizes. If they cut down a tree and find its interior less than ideal,
they often will not bother removing it from the forest. Discovering
these trees is often beyond the capacity of current forest monitor-
ing approaches, which only involve irregular on-the-ground obser-
vations by forest inspection officers. They do not conduct regular
foot patrols, nor do they regularly use other technologies to assist in
33 In this case study, “high” resolution refers to imagery between 2 meters and 10 meters resolution, whereas “very high resolution” or VHR imagery is less than 2 meters.
their monitoring. They mainly rely on the network of informants that
the inspection office maintains throughout the country. The goal
therefore for FIPD has been to detect the removal of individual trees
on satellite images covering hundreds of thousands of square kilo-
meters, even though they sometimes can be very difficult for the
human eye or pixel-based image classification software to notice.
Solution
High-resolution color satellite imagery combined with object-based
image analysis software is very well suited for this type of challenge
and has proved especially useful in Laos. The japan International
Cooperation Agency–funded Forest Information Management
Project, which started in 2009, supported the creation of a nation-
wide high-quality imagery baseline for Laos through which 5m
resolution RapidEye multispectral imagery was taken of the entire
country over three months. The quality imagery enabled remote
identification of selective logging that was confirmed in situ by the
Lao PDR’s Department of Forest Inspection (DOFI) with the support
of the Sustainable Forest and Rural Development Project funded by
the world Bank and the government of Finland.
Aruna Technology Co., Ltd., a company based in Lao PDR and
Cambodia, integrated the baseline data with newly acquired
imagery and was able to identify locations of selective logging,
and it even demonstrated the ability to detect the individual tree
removal. According to Aruna owner jeffrey Himel, the ability to
detect cutting of individual trees visually enables development of
more-automated solutions that could provide real-time monitoring
of illegal logging in Laos and benchmark maps for future REDD car-
bon credit projects. In the future, these benchmarks will be used as
baselines against which new carbon credits can be allotted.
Software
with the imagery successfully gathered, FIPD procured eCognition
object-based image processing software and worked with Aruna
to quickly prepare a very detailed “segmentation” of small polygons
from the imagery that can then be classified into a forest and land
cover map to serve as the benchmark for the whole country.
The eCognition software was developed specifically to make sense
of detailed and complicated data, originally for medical imaging
technology used for scanning the human body. It was initially

33
A G R I C U LT U R E A N D E N V I R O N M E N TA L S E R V I C E S T E C H N I C A L A S S I S TA N C E PA P E R
C H A P T E R 6 — C A S E S T U D I E S
developed by a think tank founded by Gerd Binnig, who shared
the 1986 Nobel Prize for physics for his work on a specialized
microscope.
According to Himel, image analysis and classification previously
relied on pixel-based techniques. “This involved taking the digital
number values of individual pixels from the imagery and using a
range of mathematical algorithms and techniques to characterize
each pixel based on its similarity to others,” he explained, mention-
ing several challenges for imagery accuracy, including atmospheric
conditions and complexity of the landscape. “Object-based image
classification takes a completely different approach. Rather than
focus on pixels, the method groups them into regional objects
based on aspects such as color, texture, tone, shape, size or context.
By ‘segmenting’ the image into these larger objects, a more accu-
rate analysis is enabled, then the objects can be more accurately
classified.”
As noted by Trimble, a provider of location based solutions, the
technology is particularly useful when small or otherwise unob-
servable changes in the forest would otherwise remain unnoticed.
According to Trimble materials, eCognition will process and layer
a variety of forms of geographically accurate data, including raster
images, LiDAR cloud points, GIS vectors, radar data, and hyper-
spectral data. The software can also extract vertical and horizontal
features; integrate images of different scale, resolution, and spectral
bands; and enable correcting for atmospheric-induced mistakes.
Most critically, eCognition can integrate such information as acces-
sibility or proximity to human dwellings into the segmentation and
classification. “Rather than examining individual pixels in isolation,”
the company says, “it distills meaning from the objects’ connotations
and mutual relations.” On a technical level, this distillation involves
the software employing fuzzy logic to determine the probabilities of
values that are not binary. On a simple level, the advanced software
helps answer a seemingly straightforward yet guilefully complex
question: “what is happening, where?”
Policy Choices
while powerful, the software requires that forest agencies make
many strategic decisions and streamline their data processing and
information flows accordingly while maintaining a strong focus
on quality control. The institutions require a systemic vision for
data management and use; remote sensing analysis should not be
thought of as simply a purchasable product. while in most cases
the richer and more diverse the imagery and derived data are, the
more potentially insightful the information product becomes, here
achieving a quality result remains difficult and challenging. Not
surprisingly, powerful software like eCognition is not simple to use.
Currently it requires customizing image import and export rules for
each project and adjusting settings to accommodate for different
pixel sizes in the various images.
The challenge for forest agencies therefore is to have informed
expectations of what insights this type of remote sensing could
provide with available resources—a challenge with a chicken-
and-egg dynamic: In order for them to know ahead of time
whether the remote sensing is worth its cost, they essentially
need to know what the analysis will reveal before they commit to
pay for it. yet if they knew the results, they wouldn’t need to pay
for the service.
Remaining Challenges
The frequency with which a forest agency processes satellite imag-
ery through object-based image analysis software implies different
policy approaches. The more frequent it processes the information,
the more it places an evident priority on the information and the
more reactive it can be. Less frequent information processing may
come as a result of limited budgetary resources or a low prioritiza-
tion, but it nevertheless limits monitoring ability and the potential
for the information to implement any actions that could help curb
illegal activities. while the discovery of some objects intended
for long-term use, such as illegal logging roads, allows for longer
reaction periods, infrequent image collection will only provide the
un-actionable facts of what has already happened.
Himel of Aruna Technology believes most solutions will rely on a
combination of lower-resolution imagery such as RapidEye in
combination with field survey and higher resolution imagery. He
pointed out that as resolution and frequency of resolution increase,
acquisition costs can increase exponentially. The costs and logistics
of the associated activities of confirming tree felling in the field,
data processing, and the capacity for interdiction must also be
considered.

34
I C T F O R DATA CO L L E C T I O N A N D M O N I TO R I N G & E VA LUAT I O N
C H A P T E R 6 — C A S E S T U D I E S
Major Takeaways
Costly image analysis software does not make sense for all countries
or situations. Other countries may have starkly different illegal log-
ging issues than Laos, with similarly different varying potential for
technology. In those cases, instead of organized and precise target-
ing of valuable individual trees chosen for their export value, illegal
loggers usually will cut down entire stands of trees to provide local
households with firewood. These clear-cuts can be seen with lower
resolution imagery and are often discovered by the naked eye by
forest rangers on the ground.
Any forest agency considering the use of satellite imagery in com-
bination with object-based image analysis software has a tough
set of choices to face. The skill sets involved are rare enough that
they risk overburdening or losing a well-trained staff member to a
higher-paying outside employer. The software and satellite imagery
are not cheap. These factors often lead to the decision to outsource
the service, even if such consultancy services are not cheap. At least
then the cost is a “one-off” and does not present the challenge of
future recurring costs.
In Lao PDR, a middle ground has been available: local technological
expertise has provided the support and expertise to enable the FIPD
to develop its capacity step-by-step rather than depend on outside
consultants. In addition, forest agencies need to continually think
through the life cycle of data collection and utilization. In essence
they need to begin with the desired effect on forest governance
and then work backward to initial data collection. For example, if an
agency plans to collect data often, the establishment of the imagery
baseline will enable lower-cost monitoring over time and will im-
prove the accuracy of results.
Laos’ experience with the software and imagery shows both the
potential of the tools and the complex planning they require. It
could be said that technology presents a double-edged sword
because it has given the country’s forest inspectors the gift of sight
and yet has presented them with newly challenging policy ques-
tions. Hopefully for them, the way forward for this technology will
likely involve decreasing costs, increasing user-friendliness and
more-widespread and effective application.
Earth observation images and their interpretation provide only
a starting point for investigations. As in the case of Laos, the
information from these images needs to be translated into useful
geo-referenced information for enforcement. In this case, the illegal
logging sites were identified from the images and the coordinates
recorded. After that, DOFI officials verified the sites with GPS-
directed field visits.
with the increased capabilities and availability of highly capable
cellphones, these questions have to be answered in an increasing
number of cases and by an increasing number of users both inside
and outside the forest profession. The Laos case demonstrates one
way of working with professional-grade devices. It may also show
the way for later deployment of multiuse retail devices.
Sources:Interview with Jeffrey Himel, Aruna Technologies Owner, Vientiane, Lao
PDR.
6.4 COMMUNITY-MANAGED SUSTAINABLE AGRICULTURE—A BOTTOM-UP REVOLUTION ASSISTED BY MOBILE TECHNOLOGY34
Properties of Featured Technology: Java, basic phone, SaaS/
Cloud, GIS, crowd-sourcing, service provider (see also annex 4).
Context
with more than 1 million farmers in Andhra Pradesh, India, the
Community-Managed Sustainable Agriculture (CMSA) program
empowers members of rural communities with information and
training to grow natural fertilizers and use non-pesticide farm-
ing methods to dramatically improve yields and increase farmers’
incomes. CMSA deploys initiatives such as farmer field schools
(FFS) to provide hands-on demonstrations, training, and extension
services in over 11,000 villages. The program works with over 2,000
village trainers and community resource persons to provide training
and coordination.
Due to the immense scale of operations, the CMSA project faced
implementation challenges in coordinating and monitoring a large
statewide program through isolated rural community profession-
als. Low-cost java-based mobile phones provided the opportunity
to connect various field trainers and coordinators under a uniform
training and data capture program, provide them a structure to
carry out their work, monitor their operations, and collect data
34 http://65.19.149.140/pilots/cmsanew/ab_us/aboutus_modify.html.

35
A G R I C U LT U R E A N D E N V I R O N M E N TA L S E R V I C E S T E C H N I C A L A S S I S TA N C E PA P E R
C H A P T E R 6 — C A S E S T U D I E S
regarding the impact and effectiveness of interventions as well as
the major roadblocks to greater adoption of sustainable agricultural
methods.
Since the adoption of the CMSA mobile application in September
2011, some 1,300 community professionals have been trained, ben-
efiting large numbers of smallholder farmers directly. Data collected
have been analyzed to capture effectiveness of alternative methods
such as the System of Rice Intensification (SRI) and non-pesticide
management.
For nearly a decade, the Society for Elimination of Rural Poverty
(SERP)—a semi-autonomous government agency in Andhra
Pradesh—has been actively promoting mobilization of the rural
poor into self-help groups and connecting them to markets and
last-mile services. The agency currently works in 38,550 villages and
reaches 11 million households. Federated at the group level, village
level, and block and district levels, one of the main goals of the
organization is to build leadership capacity and facilitate demand-
driven efforts to improve livelihoods through effective agriculture,
livestock, dairy production, non-farm skills, financial literacy, and
health and nutritional awareness, among others.
SERP initiated CMSA in 2004 in order to address the major causes
of agriculture distress: extensive use of chemical inputs, high costs
of agriculture, displacement of local knowledge, unsustainable
agricultural practices, and lack of market access. CMSA supports
poor farmers in adopting sustainable agriculture practices, to
reduce the cost of cultivation and increase net incomes by moving
from input-centric model to a knowledge- and skill-based model.
The program is therefore focused on knowledge transfer, capacity
building, and empowering farmers and community resource pro-
fessionals in order to promote cost-saving, yield-boosting, sustain-
able agricultural practices.
Mobile Application
The goal of the CMSA mobile application is twofold. On the
front end, it seeks to help community resource professionals
organize their time and operations each day by providing a
structure for carrying out operations and an incentive to cap-
ture data regarding work completed, along with a method to
follow progress.
In the back end, the monitoring and evaluation platform helps
collate and analyze collected data to monitor operations real-time
and evaluate effectiveness and impact of interventions over time.
Information is also relayed in real-time on a public website to main-
tain transparency and accountability of field operations both within
and outside the implementing agency.35
The CMSA mobile application is designed by Bluefrog, a technology
service provider based in Andhra Pradesh. The application is built
in j2ME to accommodate basic feature phones. Data received are
hosted in the service provider’s server, through software as a service
model.
The various menus of the application are meant to capture different
initiatives in the CMSA program for which each trainer is respon-
sible. In general, trainers are responsible for running programs in
five different villages five days a week, starting farmer field schools,
inspecting non-negotiable flagship components, inspecting
botanical fertilizer shops, and attending community group meet-
ings to run extension video service—Digital Green—to promote
further awareness of methods and adoption.
The following is a description of some of the components covered
under the mobile application.
Field-based Extension Program—Farmer Field Schools: Farmer field
schools are field-based activities for groups of farmers to engage
with best practices. The FFS menu in the mobile application enables
the user to capture the attendance of the farmers, the image of the
group, and the image of the land where the meeting has been held
for different parts of the discussion. This enables the project to cap-
ture the adoption of CMSA practices in various geographic areas.
Ultra-poor36 Plot Program—36*36: Intended to address the nutri-
tional needs of the poorest of the poor households, the 36ft*36ft
model proposes a diverse range of crops—from fruits and tubers to
vegetables and pulses—to promote nutritional security and year-
round income. The mobile application allows field coordinators to
capture data from farmers experimenting with this seven-tier crop-
ping model and to track the income generated from each crop and
the expenses incurred.
35 http://65.19.149.140/pilots/cs/dashboard.aspx.
36 Ultra-poor is a term used to describe the poorest of the poor in India.

36
I C T F O R DATA CO L L E C T I O N A N D M O N I TO R I N G & E VA LUAT I O N
C H A P T E R 6 — C A S E S T U D I E S
System of Rice Intensification Methods: This revolutionary method
of rice cultivation is intended to be cost-effective and resource-
efficient for the most popular crops produced in Andhra Pradesh—
paddy. Under this method, a minimum amount of water is used
instead of continuous flooding, and seedlings are replanted with
more room for root growth, producing a greater crop yield. The
mobile application enables manual entry of the enumerator to cap-
ture the amount spent on agricultural inputs for this method, the
yield, and income from the crop. This is meant to ensure that there
is adherence to SRI methods and that the methods are effective in
producing desired effects on income. Cross-validation potential in
this system is quite limited.
Adherence to “Non-negotiables”: In order to capture the level of
adherence to sustainable practices, community enumerators record
data on the methods followed by the farmer. These include com-
munity bonfires, seed treatment, bird perches, border crops, trap
crops, yellow and white plates, intercrops, light traps, pheromone
traps, delta traps in ground nut, alleys in paddy, cutting of the tips
in paddy crops at the time of transplantation, and application of
botanical extracts as needed. This is meant to enable the project to
understand adherence to methods by individual farmers in relation
to their yields, as well as horizontal adoption to various methods
by region. while the system provides an overall picture of adoption,
individual adherence measures are not cross-validated through the
application.
Service Features
Incentives for Excellence: The service features of the CMSA mobile
application strive to obtain quality and complete information by
incentivizing frontline staff. The honorarium received by these com-
munity workers to compensate for wage loss is Rs 4,000 (~$80) per
month. For those who receive 91–99 percent performance grades
in data submission, a Rs 1,500 bonus is offered. Those who submit
complete data receive a substantial Rs 3,000 bonus on top of their
honorarium. The project also offers bi-monthly refresher training,
where staff can improve their data entry skills, and basic trouble-
shooting. Rewards for top performance, combined with continuous
technology training, rather than a daily incentive for submission,
incentivizes frontline trainers to improve their performance. So far,
approximately 200 of 1,300 staff receive the monthly bonus, with
about 10–20 receiving the 100 percent grade.
Promoting Sustainability: In addition to training thousands of
community professionals in collecting information, and using it
in turn to structure their work, the project also coordinates with
five elected members for district subcommittees to take over
coordination 10 days a month—6 days in the field, 2 days at
district-level meetings on staff activities, and 2 days in the main
office at the state level. These activities allow members within
community institutions (federated self-help groups) to begin shar-
ing in operational duties, and eventually taking ownership of the
project in the future.
The tool has effectively helped in the following:
Overseeing Operations. CMSA is a knowledge-intensive, farmer-
centric program where individuals must relearn new methods to
protect their crops from bad pests and learn to encourage ben-
eficial worms and other insects and natural process to rejuvenate
the soil. Due to its knowledge-intensive nature, much training is
required before farmers can successfully transfer to non-pesticide
farming systems. Therefore the mobile application has a strong
focus on structuring ongoing training activities with farmers
to grow natural fertilizers and adopt non-pesticide farming
practices.
Quantifying Impact. By capturing attendance and participation in
individual programs by farmers, the CMSA program is building the
ability to understand changes in yields, artificial input use, adher-
ence to different programs, and the impact on overall income and
well-being. This type of rich data on a large scale allows impact
evaluation at a randomized scale to test the effectiveness of various
interventions.
Evaluating Effectiveness of Intervention. Sustainable methods that
avoid chemical fertilizers and pesticides involve a paradigm shift
from input-centric agriculture to a knowledge-based model. This
entails considerable risk for the majority of farmers, whose crop may
be their only source of income each growing season. Observation of
crop-cutting experiments, captured through mobile phones, allows
the systematic collection of data on the impact of these sustainable
methods on farmer income (lowered costs, increased outputs), pro-
viding proof of concept for farmers and promoting broader adop-
tion of these methods.

37
A G R I C U LT U R E A N D E N V I R O N M E N TA L S E R V I C E S T E C H N I C A L A S S I S TA N C E PA P E R
C H A P T E R 6 — C A S E S T U D I E S
6.5 THWARTING DROUGHT—MOBILE-BASED DATA COLLECTION FOR DROUGHT PREPAREDNESS IN UGANDA37
Properties of Featured Technology: Java, basic phone, smart-
phone, hosted, frontline workers, open source (see also annex 4).
Context
As part of a regional initiative to reduce the risk of drought in East
Africa with Early warning Systems, community chiefs in 55 village
centers are collecting specific and tangible data in resource avail-
ability and behavior to identify indicative patterns among the rural
pastoral communities of the Karamoja region.
Located in the arid northeast of Uganda, Karamoja has the lowest
human development indicators of any region in the country.38 The
region suffers from chronic poverty, malnutrition, and food short-
ages, as well as frequent droughts, due to generally poorly distrib-
uted, unreliable, and low rainfall amounts. Unlike other regions in
Uganda, which have a bimodal rainfall pattern, Karamoja’s pattern
of rainfall allows for only one planting season, and the unpredict-
ability of this pattern further exacerbates agricultural livelihoods.
Given heavy reliance on cattle, sheep, goats, and poultry in the
pastoral and agropastoral communities as food, investment, and
safety net, tracking vulnerability to drought requires indicators
such as water availability, agriculture, and livestock conditions so
that communities may efficiently make the best of the land’s low
primary productivity.
Project
In an attempt to tackle the challenges of delays in data collection
for preparedness and relief in vulnerable drought-prone regions,
FAO and the Agency for Technical Cooperation and Development
(ACTED), in partnership with a local district government in Uganda
and inspired by the Kenyan Drought EwS, created a mobile applica-
tion that enabled early signals to be collected and collated instantly
online and fed into an early warning algorithm. The prior delay in
manually collecting, aggregating, digitizing, and analyzing data had
37 http://www.acted.org/en/uganda.
38 The administrative area in Karamoja has seven districts, which are fur-ther divided into subdistricts and then into parishes. Parish chiefs are selected by the local government and are responsible for a number of duties. Parishes have a market, where crops are sold, and kraals, where livestock are traded.
severely delayed information transmission and thereby rendered
the early warning system ineffective. The new early warning algo-
rithm was used to generate a drought bulletin used throughout the
district for drought preparation and relief efforts in the Karamoja
region of Uganda.
when the Drought Early warning System (DEwS) was first intro-
duced, parish chiefs conducted the survey by hand, noting the
information on paper, which was then delivered from the sentinel
to the subcounty chief, and then to the DEwS Focal Person. It was
entered manually into the system and then analyzed and dissemi-
nated in the form of drought bulletins, delaying the process by five
to seven business days. A year and half into the project, the impact
of the delay of paper-based data collection was evident—forecasts
and predictions were less relevant than before. with the emergence
of greater network connectivity and affordable mobile devices,
ACTED saw an opportunity to bring mobile-based data collection
to the DEwS project.
The mobile-based data collection project to inform monthly
drought bulletins is the result of a partnership between three
groups: local government partners who collect the information
monthly through their area chiefs at 55 parishes (village clusters)
and publish the monthly bulletin; ACTED, the international NGO
that was able to bring together best practices and the stakeholders
to develop the Early warning System for Karamoja; and FAO, which
was able to design and work with the technical team to develop the
mobile application using Nokia Data Gathering and which provided
operational and trouble-shooting capacity training to the project.
The Drought Early warning System used in Karamoja relies on
monthly weather forecasts from the Department of Meteorology of
the Ministry of water and Environment. The vulnerability indicators
are collected from households, kraals, and markets by the village
chiefs.
In order to obtain the information in a timely manner and to sup-
port communities and organizations in preparing for drought,
three main factors played a key role: designing the optimal data
collection parameters, a symbiotic partnership that enabled com-
munity ownership, and accessible mobile technology with network
connectivity.

38
I C T F O R DATA CO L L E C T I O N A N D M O N I TO R I N G & E VA LUAT I O N
C H A P T E R 6 — C A S E S T U D I E S
Designing the survey was a collective effort between stakeholders
to arrive at a comprehensive yet efficient set of questions that can
be administered through a basic feature phone:
� Household survey (October 2012): Collects data from the
same 10 households in each survey location every month,
including type of water source and time spent to fetch
water from each, quantity of water fetched, security, type
and source of food, crop conditions and type of crops, and
alternative livelihood indicators such as price of casual
labor.
� Kraal survey: Tracks the same five herds of cows of about
20 animals each, monitoring livestock body condition and
access to grazing areas.
� Market survey: Administered monthly, tracking type and
number of animals available in the market and market prices
for the main sources of grain, meat, and energy.
Once collected and uploaded in a location with adequate con-
nectivity, the data are processed on a Nokia server and exported
in CSV format and imported to the DEwS database through a con-
version applet. The DEwS is a web-based centralized application,
on a server hosted by the Ministry of Agriculture, Animal Industries
and Fisheries of Uganda. As the FAO involvement in the project
ends in 2013, an integrated solution between Nokia data gather-
ing technology and DEwS is currently being planned. The project
is also developing new web-based products to further information
dissemination.
The parish chiefs are selected to be enumerators based on motiva-
tion, accessibility, level of literacy, and availability of kraal and market
in their parish. Employed by the local government, they are nomi-
nated by subcounty chiefs to be DEwS data collectors, enabling the
government to run data collection sustainably beyond the funded
project period.
Despite the fact that no additional compensation was offered, enu-
merators who were nominated were eager to participate because
of the additional training, phone use, and the connections that the
project offered. working in isolated project areas, the periodic train-
ing brings together various parish chiefs to discuss challenges in
getting information and collecting data, and provides access to a
network of similar community leaders.
Prior to technology training, the FAO trainers conducted sensitiza-
tion to teach the interview process first. when enumerators are
aware of how the data will be used, and why it is important to have
accurate numbers, they are able to better establish a relationship
with an interviewee, especially when disclosing potentially sensitive
household information. Because enumerators are usually already
familiar with texting on mobile keypads, only a half-day of initial
technology training was required prior to implementation.
Main Takeaways
Empowerment of communities and local implementers: Periodic
user training and capacity building generates greater awareness of
digital tools and ownership of the process.
Symbiotic partnerships can combine resources with capabilities:
FAO brought in technical knowledge and training, and ACTED
provided implementation capacity in coordination with local com-
munities and government.
Increased timeliness of early warning: Real-time data collection and
drought bulletin production increase the timeliness of drought
warning and the preparation response put in place by communities
and partners.
Decrease in costs leads to greater likelihood of sustainability: As
transport costs for carrying questionnaires from the field to sub-
country and district offices is eliminated, data collection becomes
more efficient and more viable for government adoption.
Sources:Phillip Fong, FAO, interviews on 13 February 2013 and 20 March 2013.
Malika OGWANG, ACTED, interview and survey documents shared on 20 February 2013.
K. Gelsdorf, D. Maxwell, and D. Mazurana, “Livelihoods, Basic Services and Social Protection in Northern Uganda and Karamoja,” Working Paper 4 (London: DFID, 2012).
E. Stites, L. Fries, and D. Akabwai, “Foraging and Fighting: Community Perspectives on Natural Resources and Conflict in Southern Karamoja” (Medford, MA: Feinstein International Center, 2010).

39
A G R I C U LT U R E A N D E N V I R O N M E N TA L S E R V I C E S T E C H N I C A L A S S I S TA N C E PA P E R
C H A P T E R 7 — CO N C LU S I O N
Chapter 7: CONCLUSION
Hiring analysts who can perform quality data analysis, incentivizing
adoption, and managing risks appear to be some of the most
important tasks when deploying ICT.
Finally, with increases in the effective use of information and
comm unication technology, macro-level phenomena are being
observed. (See figure 7.1.) As more and more projects tap into
ICT for data collection and M&E, large agencies are choosing to
develop organization-wide strategies that lay out ICT policies, best
practices, and interoperable access. This has led to increased con-
vergence around the most effective technologies, mobile applica-
tions, and ecosystem strategies. The sector is reaching a plateau,
making it easier for non-technologists to grasp and use ICT in many
of their projects.
However, new frontiers will continue to emerge as convergence
inspires innovation and improved solutions to new challenges. To
prepare for these new frontiers, projects in agriculture and forests
There has been extensive expansion in the number of ICT4D
products and services available in recent years, along with
substantial digital experimentation at all stages of the monitor-
ing and evaluation process in agriculture and forest sectors. As
these experiments have matured into scaled projects, evidence
of their efficiency is being observed. Accrued knowledge on
using ICT specifically in data collection and data management
is increasing the capacity of organizations and governments to
incorporate technology into their projects and programs more
effectively.
yet despite the growth in active use of ICT in agriculture and
forest projects, the technology still remains a latent consider-
ation in many rural development projects. Confusion on how to
properly use mobile applications and other digital tools remains
fairly widespread. Like boarding a moving train, the constantly
evolving and fast-paced ICT sector appears difficult to carefully,
slowly, and thoughtfully engage in. yet this should not discour-
age practitioners’ use of ICT. Strategies to effectively think about
and incorporate these technologies are emerging. This opera-
tional report is one attempt to aid practitioners in that decision-
making process.
In summary, technology itself is not an end but a means. The spe-
cific project and people needs may or may not be a good fit for
the use of ICT. If this technology is deemed suitable to achieve data
collection and M&E goals, implementation models that maximize
efficiency—such as the use of frontline workers or automated cap-
ture—can be considered and systems designed. Only then should
specific features of technology be deliberated. And as in any other
public goods project, service design must be carefully considered.
Convergence
Innovation Scale
Org-widestrategies
FIGURE 7.1: Macro-level Effects of ICT in Data Collection and M&E

40
I C T F O R DATA CO L L E C T I O N A N D M O N I TO R I N G & E VA LUAT I O N
C H A P T E R 7 — CO N C LU S I O N
should remain nimble and use technologies that can easily transfer
data from one platform or provider to the next. Feedback loops
between operations, staff, managers, policy makers, and users
should help to clarify when it is time to “update” ICT approaches.
Most importantly, practitioners should not wait for further conver-
gence of agreement on technology before using ICT in their projects,
as the widespread and continued use of ICT is what leads to that.
Rather, practitioners should engage with ICT as often as it meets
project needs and contributes to goals associated with improving
rural livelihoods and achieving climate-smart landscapes. Using this
guiding report and other operational tools should provide ample
assistance in reaching those goals.

41
A G R I C U LT U R E A N D E N V I R O N M E N TA L S E R V I C E S T E C H N I C A L A S S I S TA N C E PA P E R
A N N E X 1 — L I S T O F TO O L S M E N T I O N E D I N T H E R E P O R T
Annex 1: LIST OF TOOLS MENTIONED IN THE REPORT
Text to Change www.texttochange.org
Grameen www.grameenfoundation.org
Sensemaker www.sensemaker-suite.com/smsite
CognitiveEdge cognitive-edge.com
TotoAgriculture www.totoagriculture.org
PROFOR www.profor.info
Connect Online Connect Offline (COCO) www.digitalgreen.org
ArcGIS www.esri.com/software/arcgis
Google Earth earth.google.com
Bing Maps www.bing.com/maps
STATA www.stata.com
SPSS www.ibm.com/software/analytics/spss/
StatTransfer www.stattransfer.com
Formhub formhub.org
OpenForis www.fao.org/forestry/fma/openforis/en/
NetHope Solutions Center http://solutionscenter.nethope.org
Humanitarian Nomad Online Selection Tool
humanitarian-nomad.org/online-selection-tool/
Cropster www.cropster.org
DataWinners www.datawinners.com
doForms www.doforms.com
EpiCollect www.epicollect.net
Magpi www.magpi.com
Esoko www.esoko.com
ESRI www.esri.com
Freedom Fone www.freedomfone.org
FrontlineSMS www.frontlinesms.com
iFormBuilder www.iformbuilder.com
Kimetrica www.kimetrica.org
mKrishi www.tcs.com/offerings/technology-products/ mKRISHI/Pages/default.aspx
Mobenzi Researcher www.mobenzi.com/researcher
Nokia Data Gathering nokiadatagathering.net
Open Data Kit opendatakit.org
OpenXData www.openxdata.org
Poimapper www.poimapper.com
TechnoBrain www.technobraingroup.com/products/techno-brain-project-monitoring-evaluation-system.aspx


43
A G R I C U LT U R E A N D E N V I R O N M E N TA L S E R V I C E S T E C H N I C A L A S S I S TA N C E PA P E R
A N N E X 2 — O V E R V I E w O F TO O L C A PA B I L I T I E S A N D CO N S I D E R AT I O N S TO A D D R E S S I N A TO O L S E L E C T I O N P R O C E S S
Annex 2: OVERVIEW OF TOOL CAPABILITIES AND CONSIDERATIONS TO ADDRESS IN A TOOL SELECTION PROCESS
In addition to general questions, a more detailed checklist is available, indicating possible variables and attributes that should be considered
when selecting or preparing tender documentation for a proper toolset for projects use.
Mobile features • offline/online capability• one-way or two-way sync (upload or also download of data)• form/survey updates
Data and user management features • user roles• user groups• hierarchy of groups• access right features• backups• restore
GIS features • coordinates• routes• areas• location hierarchies• use of map service providers• interfaces to GIS systems• map-based visualization features
Data reporting and visualization • integral part of the solution• relies on external software
Exporting and importing interfaces • MDML, Excel, Word, CSV, Tab delimited, ODBC, Text custom, SOAP, XML, API provided, Custom Interface, ESRI Shapefile, Google Fusion, HTML , JPG, KML, GeoRSS, JSON, SQL, PDF, TXT, PNG, RTF, Open Office, Google Docs, MS Access, MDML, SPSS
Security • in-device data encryption• database encryption• data transmission encryption• access control mechanisms
Costs • training• support• development• license• maintenance• subscription
Business model • open source with consulting• license fee• user-based subscriptions• transaction-based subscriptions
Language support • in device for forms (single or multilanguage switch)• in device for application• website

44
I C T F O R DATA CO L L E C T I O N A N D M O N I TO R I N G & E VA LUAT I O N
A N N E X 2 — O V E R V I E w O F TO O L C A PA B I L I T I E S A N D CO N S I D E R AT I O N S TO A D D R E S S I N A TO O L S E L E C T I O N P R O C E S S
Data content and modeling capabilities (form features)
• text, images, single/multichoice questions, conditional subquestions, static and dynamic number of subforms, static and dynamic tables, location hierarchies, GPS, image, audio, video, numeric calculations, validation lists, validation ranges, calculated ranges, logic expressions for conditional questions, dates, time, etc.
Supported platforms and hardware • supported server databases• supported operating systems• supported devices and device operating systems
Delivery options • custom installations• hosted• SaaS/cloud• remote management capabilities
Provided services • provided training, support and customization services and their geographic coverage
Performance • complexity of forms• number of forms stored in device• number of forms stored on the server• number of concurrent users• response times• performance monitoring solutions in use• load balancing solution
Reliability • formalized test and release processes• release notes• fail-over/redundancy solution

45
A G R I C U LT U R E A N D E N V I R O N M E N TA L S E R V I C E S T E C H N I C A L A S S I S TA N C E PA P E R
A N N E X 3 — F U L L L I F E - C yC L E CO S T S E S T I MAT I O N T E M P L AT E
Annex 3: FULL LIFE-CYCLE COSTS ESTIMATION TEMPLATE
For costs comparison, a more detailed structured template can be used for determining the projected full life-cycle cost of the product set
to be procured.
Hardware costs
UPFRONT RECURRING OVER PROJECT LIFE SPAN
PROCUREMENT WARRANTY HOSTING MAINTENANCE REPLACEMENT
Data collection
Storage
Analysis
Software costs
UPFRONT RECURRING OVER PROJECT LIFE SPAN
SETUP USAGE USAGE MAINTENANCE SUPPORT
Data collection
Storage
Analysis/Visualization
Other costs (mostly recurring)
Communication cost: Cellular Data/SMS
Communication cost: Field-Office
Training cost
In-House IT labor cost
Transportation and paper storage cost
Labor cost for data collection
Labor cost for data entry
Labor for data cleansing


47
A G R I C U LT U R E A N D E N V I R O N M E N TA L S E R V I C E S T E C H N I C A L A S S I S TA N C E PA P E R
A N N E X 4 — T E C H N O LO G y F E AT U R E S O F C A S E S T U D I E S
Annex 4: TECHNOLOGY FEATURES OF CASE STUDIES
Shading indicates features included in the case study.
CASE STUDY 1: TIST
Device platform Android iOS Java Palm
Device type Tablet Smart Phone Basic Phone PDA
Device capability Camera GPS Signature External GPS
Storage/stakeholder access Custom installation Hosted SaaS/Cloud Remote management
Analysis GIS SPSS eCognition Custom
Implementation model Frontline workers Crowd-sourcing Passive Automated
Business model Open source Proprietary License fee Subscriptions
Support In-house Outsourced Service provider Other
Mobile features Online Offline Two-way sync SMS
Data security In-device encryption Database encryption Encrypted connectivity Access control mechanisms
CASE STUDY 2: FAO Open Foris
Device platform Android iOS Java Palm
Device type Tablet Smart Phone Basic Phone PDA
Device capability Camera GPS Signature External GPS
Storage/stakeholder access Custom installation Hosted SaaS/Cloud Remote management
Analysis GIS SPSS eCognition Custom
Implementation model Frontline workers Crowd-sourcing Passive Automated
Business model Open source Custom SW License fee Subscriptions
Support In-house Outsourced Service provider Other
Mobile features Online Offline Two-way sync SMS
Data security In-device encryption Database encryption Encrypted connectivity Access control mechanisms
CASE STUDY 3: Satellite Imagery in Laos
Device platform Android iOS Java Palm
Device type Tablet Smart Phone Basic Phone PDA
Device capability Camera GPS Signature External GPS
Storage/stakeholder access Custom installation Hosted SaaS/Cloud Remote management
Analysis GIS SPSS eCognition Custom
Implementation model Frontline workers Crowd-sourcing Passive Automated
Business model Open source Custom SW License fee Subscriptions
Support In-house Outsourced Service provider Other
Mobile features Online Offline Two-way sync SMS
Data security In-device encryption Database encryption Encrypted connectivity Access control mechanisms

48
I C T F O R DATA CO L L E C T I O N A N D M O N I TO R I N G & E VA LUAT I O N
A N N E X 4 — T E C H N O LO G y F E AT U R E S O F C A S E S T U D I E S
CASE STUDY 4: Community-Managed Sustainable Agriculture
Device platform Android iOS Java Palm
Device type Tablet Smart Phone Basic Phone PDA
Device capability Camera GPS Signature External GPS
Storage/stakeholder access Custom installation Hosted SaaS/Cloud Remote management
Analysis GIS SPSS eCognition Custom
Implementation model Frontline workers Crowd-sourcing Passive Automated
Business model Open source Custom SW License fee Subscriptions
Support In-house Outsourced Service provider Other
Mobile features Online Offline Two-way sync SMS
Data security In-device encryption Database encryption Encrypted connectivity Access control mechanisms
CASE STUDY 5: Mobile-Based Data Collection in Uganda
Device platform Android iOS Java Palm
Device type Tablet Smart Phone Basic Phone PDA
Device capability Camera GPS Signature External GPS
Storage/stakeholder access Custom installation Hosted SaaS/Cloud Remote management
Analysis GIS SPSS eCognition Custom
Implementation model Frontline workers Crowd-sourcing Passive Automated
Business model Open source Custom SW License fee Subscriptions
Support In-house Outsourced Service provider Other
Mobile features Online Offline Two-way sync SMS
Data security In-device encryption Database encryption Encrypted connectivity Access control mechanisms

Agriculture and Environmental Services (AES)1818 H Street, NWWashington, D.C. 20433 USATelephone: 202-477-1000Internet: www.worldbank.org/ard


